public service co. of new mexico...public service co. of new mexico (pnm) • only nyse traded...
TRANSCRIPT

JUNE 25, 2019
Public Service Co. of New Mexico
Batteries & Energy Storage: Values for Electric Utilities
IEEE/PES LUNCHEON AND DISCUSSION
Santa Fe, NM June 25th, 2019

Public Service Co. of New Mexico (PNM) • Only NYSE traded company
headquartered in NM
• 1,500 employees
• Serving 525,000 customers (40 communities)
• 15,000 miles of transmission and distribution line
• 2,700 MW generation capacity
• Top quartile for affordability in the west and reliability in the nation.
• Top companies in the nation for diversity

SLIDE 3 | JUNE 25, 2019
BATTERY SERVICE ATTRIBUTES FOR ELECTRIC UTILITY APPLICATIONS
• Grid Regulation • Frequency • Voltage
• Energy Price Arbitrage • Peak load capacity contribution • Operating Reserves
• Spinning • Contingent
• Quick start • Black start • Transmission & distribution investment deferral

SLIDE 4 | JUNE 25, 2019
FACTORS COMPELLING PNM TO EXAMINE ENERGY STORAGE
• Anticipated shutdown of San Juan Generating Station; coal plant and mine in NW New Mexico
• Scheduled close June 2022;
• 1,700 MW prior to 2018; PNM owns 562 MW
• Energy Transition Act; 2019 legislation
• Dramatically increases renewable energy requirements for NM utilities
• Carbon emissions to be eliminated for NM electricity production by 2045

SLIDE 5 | JUNE 25, 2019
BATTERY PRICE CURVE FORECAST
SLIDE 6 | JUNE 25, 2019
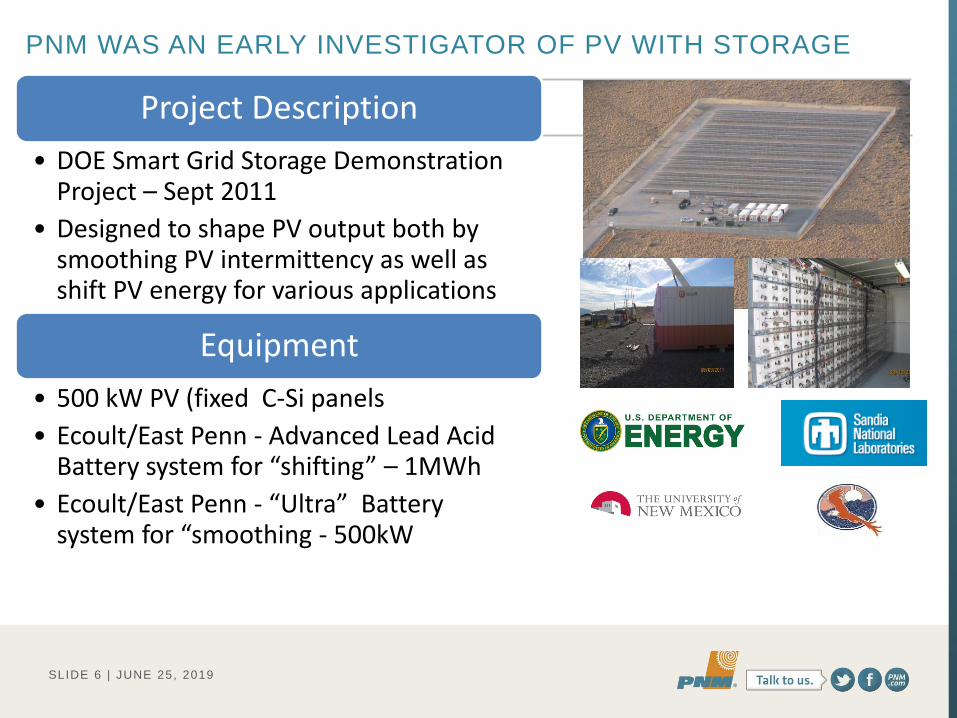
PNM WAS AN EARLY INVESTIGATOR OF PV WITH STORAGE
Project Description
• DOE Smart Grid Storage Demonstration Project – Sept 2011
• Designed to shape PV output both by smoothing PV intermittency as well as shift PV energy for various applications
Equipment
• 500 kW PV (fixed C-Si panels
• Ecoult/East Penn - Advanced Lead Acid Battery system for “shifting” – 1MWh
• Ecoult/East Penn - “Ultra” Battery system for “smoothing - 500kW

SLIDE 7 | JUNE 25, 2019
Utilizing set thresholds
System optimizes functionality based on priorities to perform:
Emergency peak shaving
Peak shaving
Arbitrage (wind and PV)
PV Firming
All while simultaneously smoothing PV and optimizing
for battery life
SCADA Data (Local)
NWS Next day Weather Forecast
% Cloud Cover
Temperature
Data points from co-located PV
Met Data
System Data
Meter Data
Market Pricing
Real time price
LMP Forecast price
OPTIMIZATION OF ALL CAPABILITIES
Other data certainly will be needed
SLIDE 8 | JUNE 25, 2019
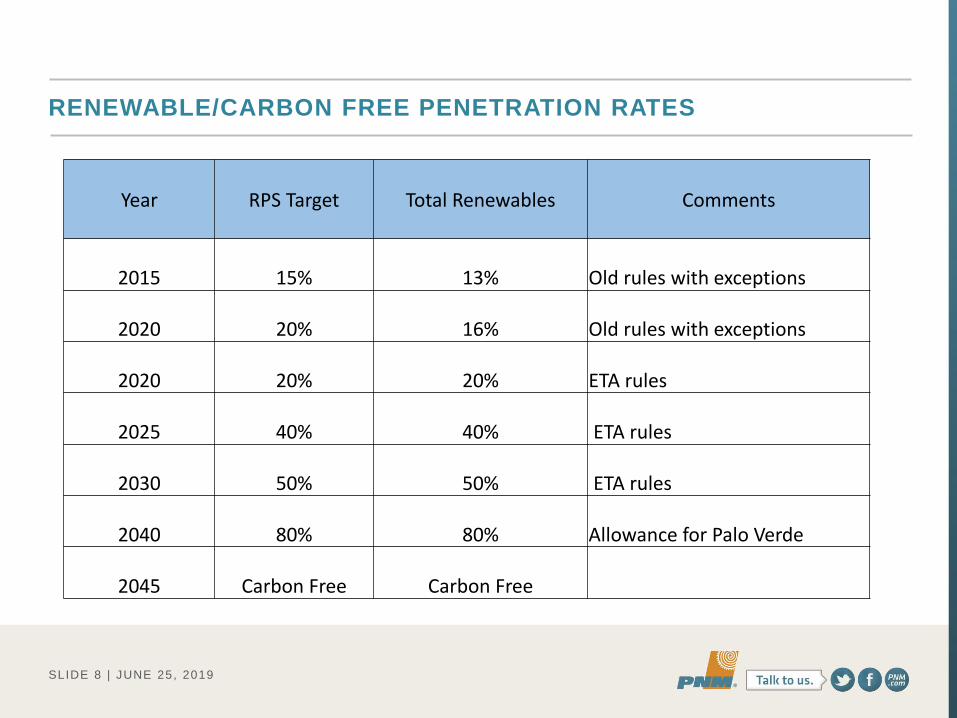
RENEWABLE/CARBON FREE PENETRATION RATES
Year RPS Target Total Renewables Comments
2015 15% 13% Old rules with exceptions
2020 20% 16% Old rules with exceptions
2020 20% 20% ETA rules
2025 40% 40% ETA rules
2030 50% 50% ETA rules
2040 80% 80% Allowance for Palo Verde
2045 Carbon Free Carbon Free
SLIDE 9 | JUNE 25, 2019
MANY FACTORS INFLUENCE PROVIDING POWER
• The utility must have adequate resources to meet the power demands of its customers
• Adequate defined by regulators based on probabilistic loads and probabilistic supply
• In stress, we can call on support from the grid, but we must also be prepared to support our neighbors
• We must meet the peak load and have a plan to meet future peak with resource additions
• We must be able to follow the swings in load; not falling short or oversupplying
SLIDE 10 | JUNE 25, 2019
DEFINING CHARACTERISTICS OF LOAD FOR PLANNING
• Annual peak demand
• Daily 24-hour (diurnal) load pattern
• Total energy demand
• Short-term variation
• Uncertainty of future demands (short term and long term)
SLIDE 11 | JUNE 25, 2019
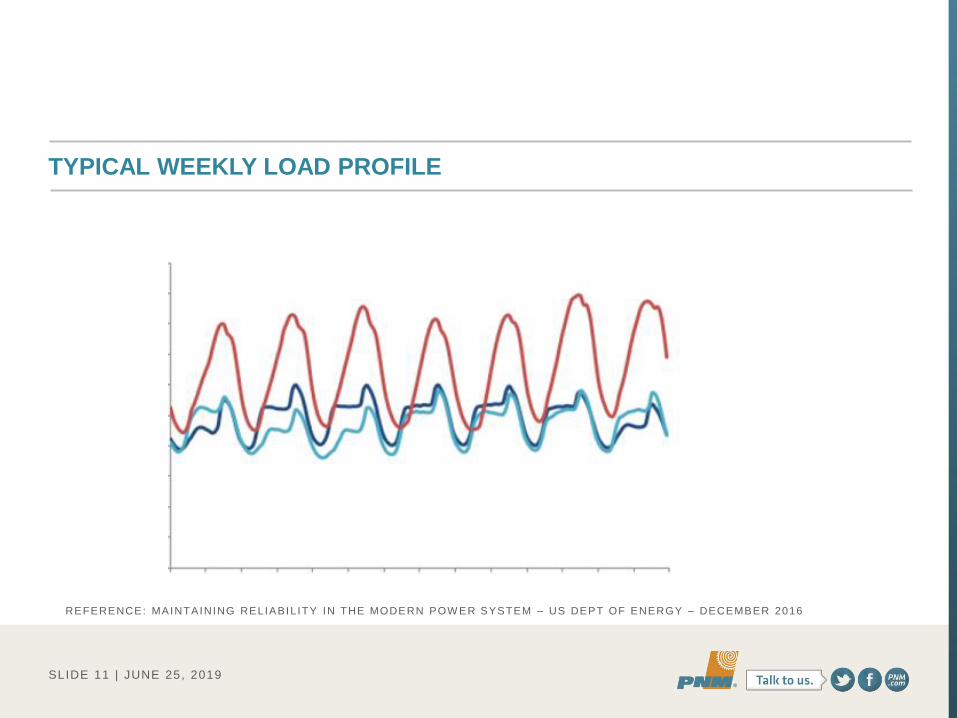
REFERENCE: MAINTAINING RELIABILITY IN THE MODERN POW ER SYSTEM – US DEPT OF ENERGY – DECEMBER 2016
TYPICAL WEEKLY LOAD PROFILE

SLIDE 12 | JUNE 25, 2019
PNM PEAK SUMMER DAY - DEMAND CURVE - 2008 VS 2018
SLIDE 13 | JUNE 25, 2019
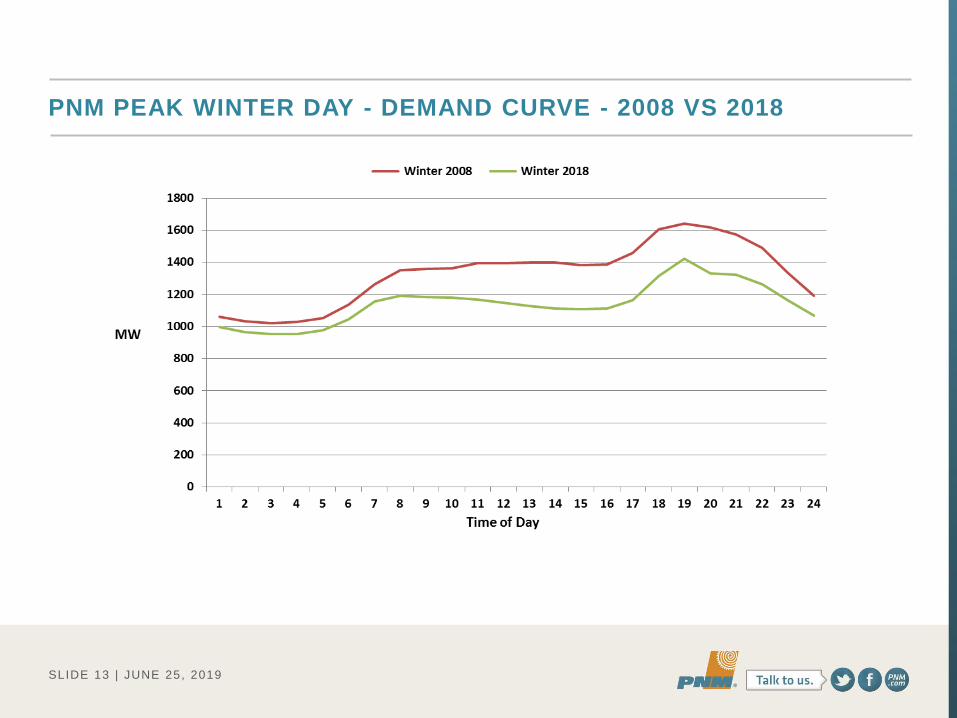
PNM PEAK WINTER DAY - DEMAND CURVE - 2008 VS 2018

SLIDE 14 | JUNE 25, 2019
WEEKLY CHARACTERISTICS OF RENEWABLE RESOURCES
0
50
100
150
200
250
300
Meg
awat
ts
Palo Verde Wind Solar
SLIDE 15 | JUNE 25, 2019
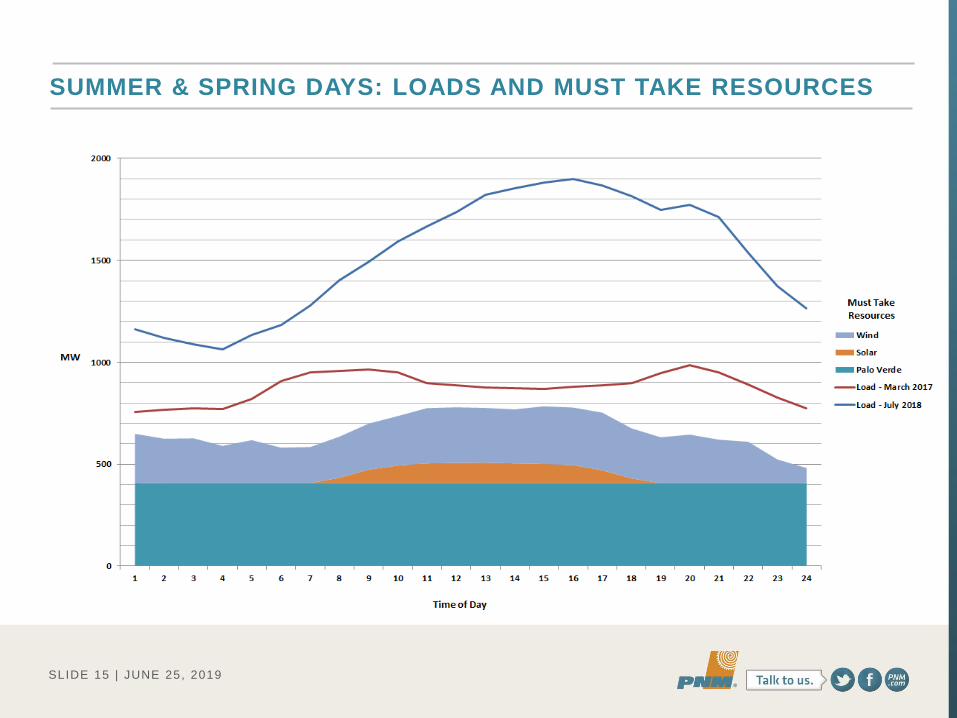
SUMMER & SPRING DAYS: LOADS AND MUST TAKE RESOURCES
SLIDE 16 | JUNE 2015
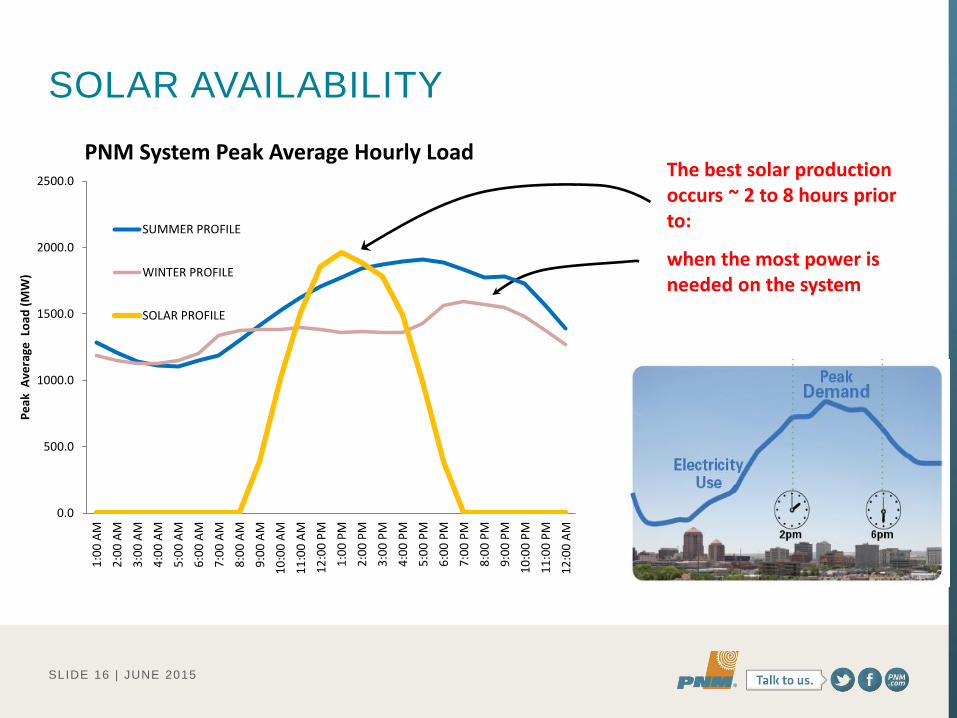
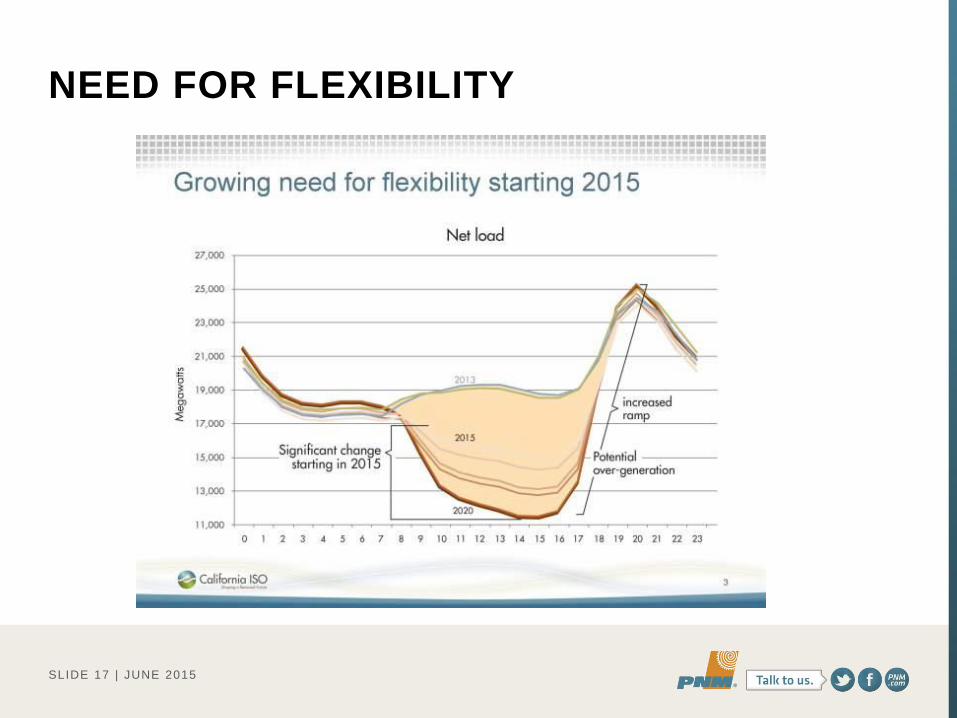
The best solar production occurs ~ 2 to 8 hours prior to:
when the most power is needed on the system
0.0
500.0
1000.0
1500.0
2000.0
2500.0
1:0
0 A
M
2:0
0 A
M
3:0
0 A
M
4:0
0 A
M
5:0
0 A
M
6:0
0 A
M
7:0
0 A
M
8:0
0 A
M
9:0
0 A
M
10
:00
AM
11
:00
AM
12
:00
PM
1:0
0 P
M
2:0
0 P
M
3:0
0 P
M
4:0
0 P
M
5:0
0 P
M
6:0
0 P
M
7:0
0 P
M
8:0
0 P
M
9:0
0 P
M
10
:00
PM
11
:00
PM
12
:00
AM
Pe
ak A
vera
ge L
oad
(M
W)
PNM System Peak Average Hourly Load
SUMMER PROFILE
WINTER PROFILE
SOLAR PROFILE
SOLAR AVAILABILITY
SLIDE 17 | JUNE 2015
NEED FOR FLEXIBILITY
SLIDE 18 | JUNE 25, 2019
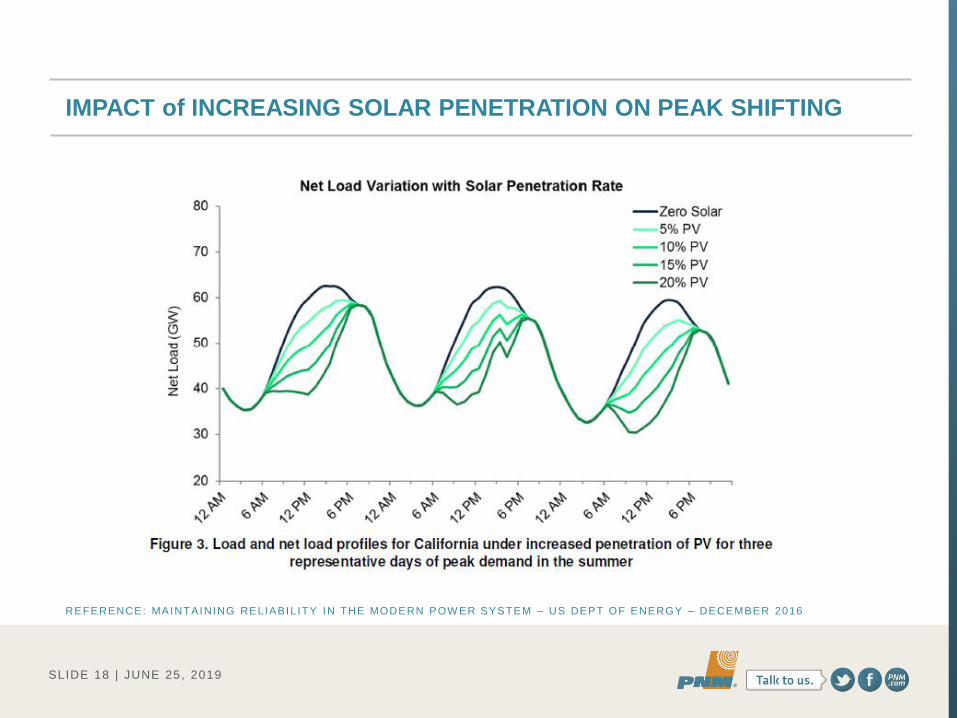
REFERENCE: MAINTAINING RELIABILITY IN THE MODERN POW ER SYSTEM – US DEPT OF ENERGY – DECEMBER 2016
IMPACT of INCREASING SOLAR PENETRATION ON PEAK SHIFTING

SLIDE 19 | JUNE 25, 2019
CHALLENGES FOR RELIANCE ON WIND ENERGY
• Seasonal energy issues
• 2018 NMWEC energy in April = 56,866 MWh
• 2018 NMWEC energy in July = 16,027 MWh
• Peak load versus wind capacity availability
• NM’s hottest days are summertime high pressure system
weather patterns
• Wind is often nearly still at those times
• Ramping of production levels
• Change in output levels can be rapid; up and down with
passing of weather fronts, local wind patterns
• Just like load following, we need to be able to follow
these changes
SLIDE 20 | JUNE 25, 2019
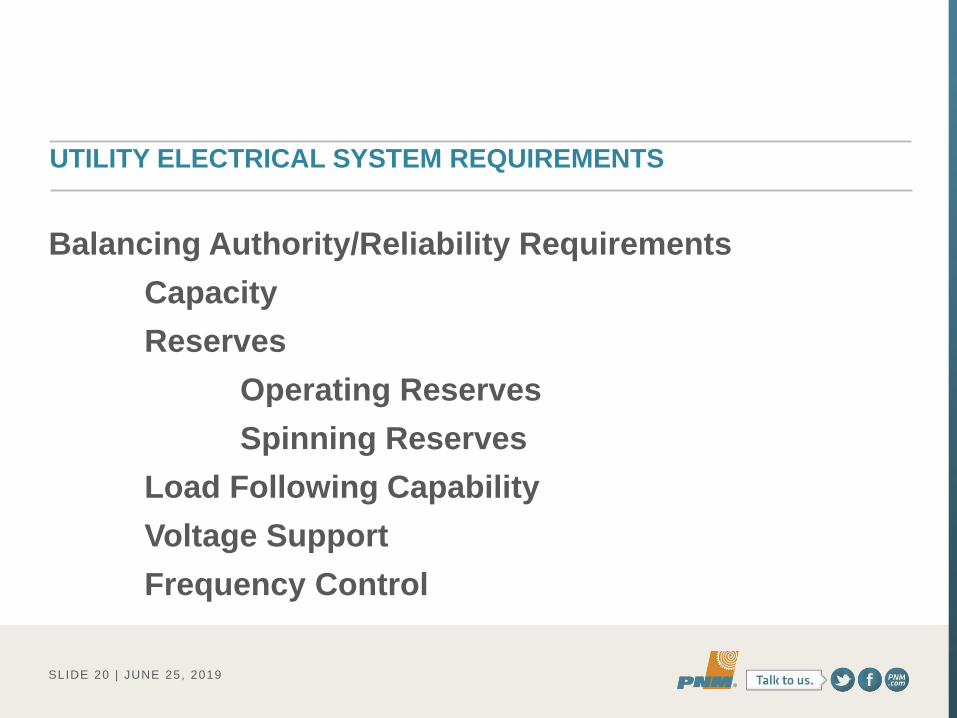
UTILITY ELECTRICAL SYSTEM REQUIREMENTS
Balancing Authority/Reliability Requirements
Capacity
Reserves
Operating Reserves
Spinning Reserves
Load Following Capability
Voltage Support
Frequency Control

SLIDE 21 | JUNE 25, 2019
DIMINISHING RETURNS
• The more batteries we have installed on our system,
the less valuable the next battery will be
• The first tier of battery capacity installed captures
most regulation opportunities
• As more battery capacity shaves our peak load,
pond size/duration raises the cost of further shaving
• Other applications face similar diminishing returns
• But also, the more inflexible generation we have, the
more valuable batteries become

SLIDE 22 | JUNE 25, 2019
SOLAR PRICE CURVE HISTORICAL

SLIDE 23 | JUNE 25, 2019
BATTERY PRICE CURVE FORECAST

SLIDE 24 | JUNE 25, 2019
NATURAL GAS COSTS DECLINE DUE TO FRACKING
SLIDE 25 | JUNE 25, 2019
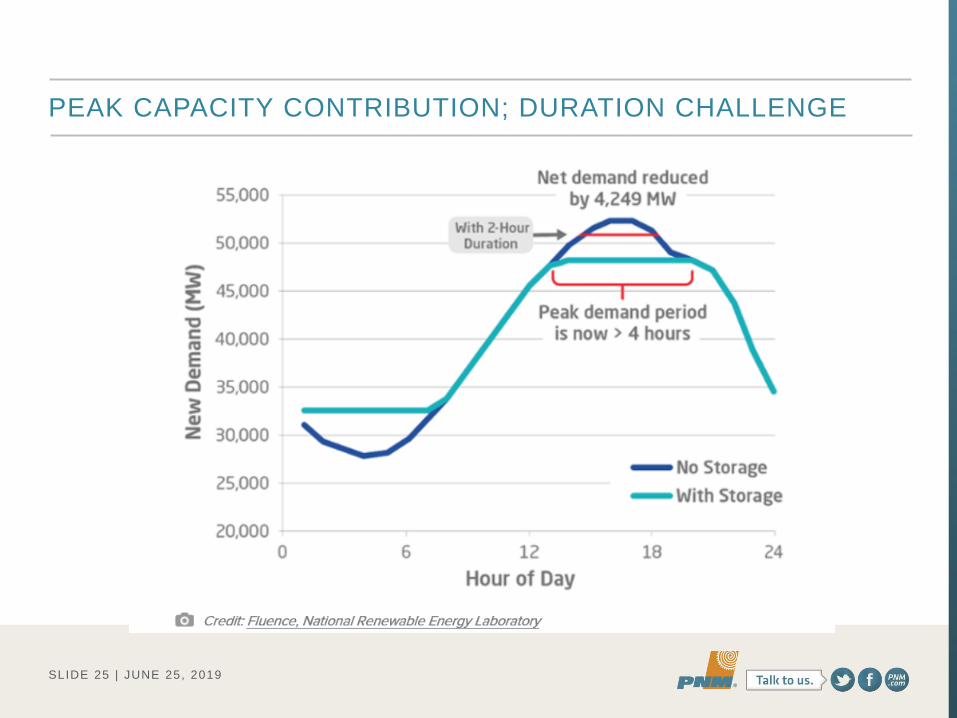
PEAK CAPACITY CONTRIBUTION; DURATION CHALLENGE
SLIDE 26 | JUNE 25, 2019
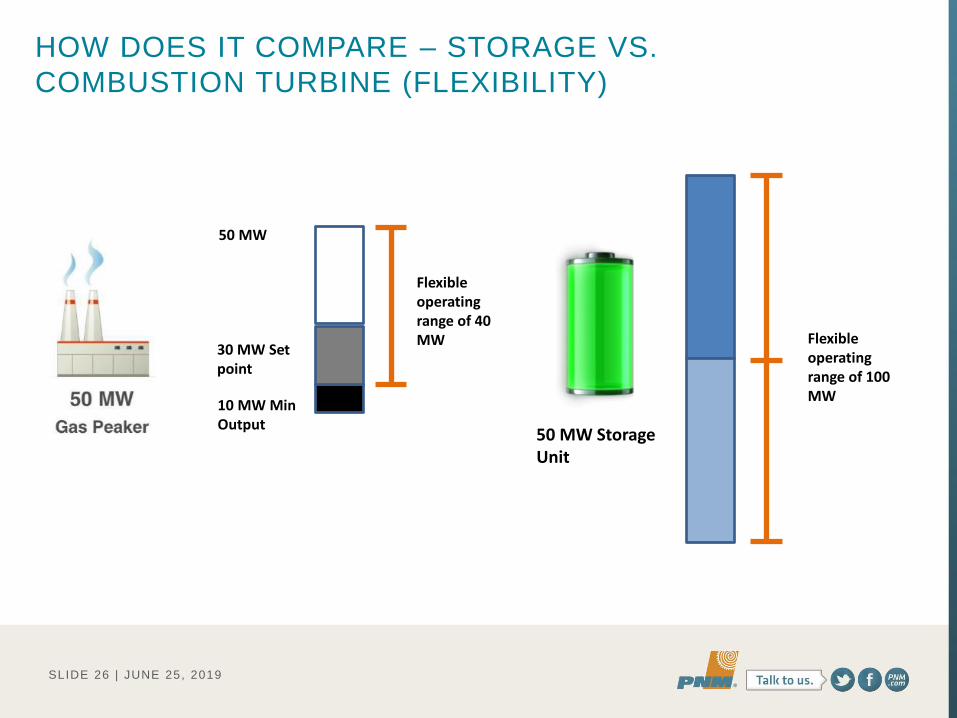
HOW DOES IT COMPARE – STORAGE VS.
COMBUSTION TURBINE (FLEXIBILITY)
50 MW Storage Unit
Flexible operating range of 100 MW
10 MW Min Output
30 MW Set point
50 MW
Flexible operating range of 40 MW
SLIDE 27 | JUNE 25, 2019
HOW DOES IT COMPARE – STORAGE VS.
COMBUSTION TURBINE
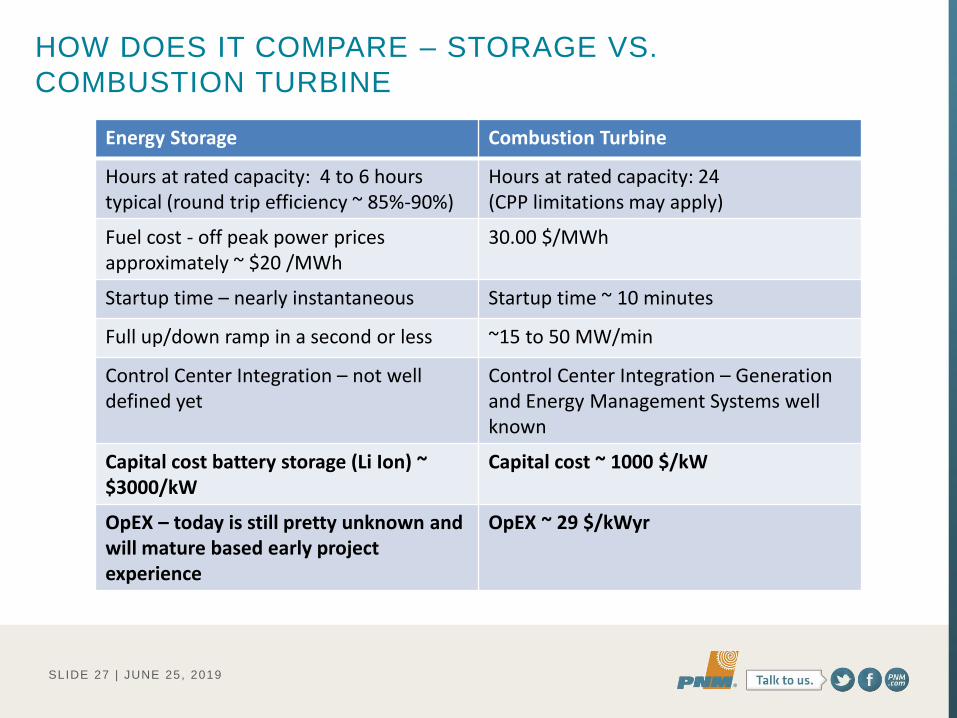
Energy Storage Combustion Turbine
Hours at rated capacity: 4 to 6 hours typical (round trip efficiency ~ 85%-90%)
Hours at rated capacity: 24 (CPP limitations may apply)
Fuel cost - off peak power prices approximately ~ $20 /MWh
30.00 $/MWh
Startup time – nearly instantaneous Startup time ~ 10 minutes
Full up/down ramp in a second or less ~15 to 50 MW/min
Control Center Integration – not well defined yet
Control Center Integration – Generation and Energy Management Systems well known
Capital cost battery storage (Li Ion) ~ $3000/kW
Capital cost ~ 1000 $/kW
OpEX – today is still pretty unknown and will mature based early project experience
OpEX ~ 29 $/kWyr
SLIDE 28 | JUNE 25, 2019
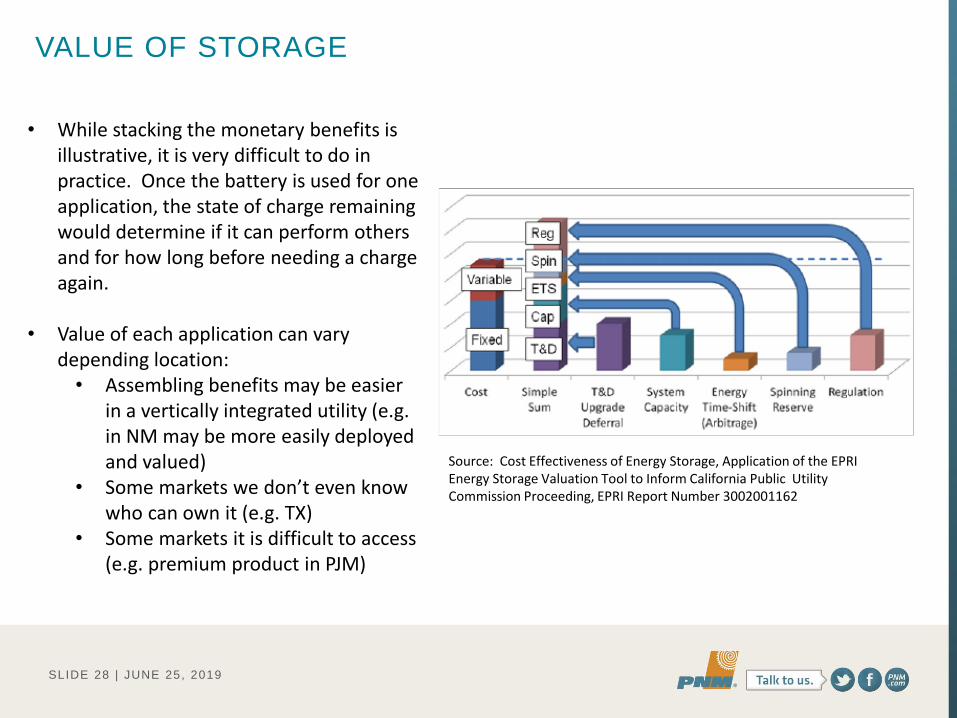
• While stacking the monetary benefits is illustrative, it is very difficult to do in practice. Once the battery is used for one application, the state of charge remaining would determine if it can perform others and for how long before needing a charge again.
• Value of each application can vary depending location: • Assembling benefits may be easier
in a vertically integrated utility (e.g. in NM may be more easily deployed and valued)
• Some markets we don’t even know who can own it (e.g. TX)
• Some markets it is difficult to access (e.g. premium product in PJM)
Source: Cost Effectiveness of Energy Storage, Application of the EPRI Energy Storage Valuation Tool to Inform California Public Utility Commission Proceeding, EPRI Report Number 3002001162
VALUE OF STORAGE