public sentiment and the price of corporate sustainability
TRANSCRIPT

Electronic copy available at: https://ssrn.com/abstract=3265502
Public Sentiment and the Price of Corporate Sustainability
George Serafeim
Working Paper 19-044

Electronic copy available at: https://ssrn.com/abstract=3265502
Working Paper 19-044
Copyright © 2018 by George Serafeim
Working papers are in draft form. This working paper is distributed for purposes of comment and discussion only. It may not be reproduced without permission of the copyright holder. Copies of working papers are available from the author.
Public Sentiment and the Price of Corporate Sustainability
George Serafeim Harvard Business School

Electronic copy available at: https://ssrn.com/abstract=3265502
1
Public Sentiment and the Price of Corporate Sustainability
George Serafeim
Harvard Business School
Abstract
Combining corporate sustainability performance scores based on environmental, social and governance
(ESG) data with big data measuring public sentiment about a company’s sustainability performance, I find
that the valuation premium paid for companies with strong sustainability performance has increased over
time and that the premium is increasing as a function of positive public sentiment momentum. An ESG
factor going long on firms with superior or increasing sustainability performance and negative sentiment
momentum and short on firms with inferior or decreasing sustainability performance and positive sentiment
momentum delivers significant positive alpha. This low sentiment ESG factor is uncorrelated with other
factors, such as value, momentum, size, profitability and investment. In contrast, the high sentiment ESG
factor delivers insignificant alpha and is strongly negatively correlated with the value factor. The evidence
suggests that public sentiment influences investor views about the value of corporate sustainability activities
and thereby both the price paid for corporate sustainability and the investment returns of portfolios that
consider ESG data.
Keywords: corporate sustainability, ESG metrics, public sentiment, corporate valuation, investment
management
George Serafeim is a Professor of Business Administration at Harvard Business School. Financial support by the
Division of Faculty and Research Development at Harvard Business School is gratefully acknowledged. James Zeitler
provided excellent research assistance. I am grateful to TruValue Labs for making available their ESG data for
research. Malcolm Baker, Casey Clark, Jim Hawley and many team members of TruValue Labs provided very useful
comments. The author sits on the advisory board of investment organizations that use ESG data. Contact email:

Electronic copy available at: https://ssrn.com/abstract=3265502
2
“In this age, in this country, public sentiment is everything.”
Abraham Lincoln
1. Introduction
News about firms’ impact on society is an everyday phenomenon. According to TruValue Labs, a data
provider that analyzes public sentiment from NGOs, think tanks, industry experts, and media sources, about
companies’ sustainability activities, in 2018 there were more than 250 thousand unique articles focusing on
environmental, social and governance (ESG) issues, across 8,000 companies globally.1 In this paper, I
analyze how public sentiment influences the market pricing of firms’ sustainability activities and thereby
the future stock returns of portfolios that integrate ESG data.
Thousands of companies are investing resources to reduce energy consumption, waste and carbon
emissions and to provide products that improve environmental and social outcomes. For example,
developments in healthy nutrition, access to wellbeing services, low carbon transportation, and green
buildings have provided billions in revenues for companies that developed products for these markets
(Generation Investment Management 2017). Similarly, companies spend significant resources to improve
employee safety and well-being and to conduct business with integrity avoiding corruption. These activities,
typically referred by companies as corporate sustainability activities, are under the supervision of a Chief
Sustainability Officer and are disclosed in sustainability reports (Miller and Serafeim 2015). The data from
sustainability reports and other sources that might also reflect controversies around human rights, pollution,
discrimination and corruption, are collected by data providers and form the basis of measures of company’s
performance on environmental, social and governance (ESG) issues.
I combine ESG performance scores from MSCI, the largest provider of ESG data to investors, with big
data from TruValue Labs that measure public sentiment momentum around ESG issues between 2009 and
2018. The latter is a measure of whether sentiment has turned negative or positive for a company, from a
1 This measure considers only English articles. The true number of articles is likely to be multiple times of that if one
considers articles in all languages. As of 2018, TruValue Labs analyzed articles only in English.

Electronic copy available at: https://ssrn.com/abstract=3265502
3
set of vetted, credible, and reputable resources (e.g. NGOs, industry analysts, think tanks, media) in the past
twelve months. I expect a lower valuation of corporate ESG performance in the presence of negative
sentiment momentum for multiple reasons. First, firms with strong ESG performance and occasional or
temporary societal controversies might be judged as weak ESG performers. Similarly, firms with weak
ESG performance that have strong marketing campaigns to advertise their ESG activities might be judged
as strong ESG performers. Moreover, negative news on a specific topic (e.g. supply chain controversies)
might affect investor views about other ESG issues (e.g. climate change strategy or human capital
development) leading them to undervalue strong ESG performance in those other issues. Second, investors
might assign a higher discount rate to a firm’s ESG performance in the presence of negative sentiment
momentum because they expect future reputational, legal, or operating costs. Third, even if investor views
about a firm’s ESG performance are unaffected by sentiment, their incentives might lead them to ignore
firms with strong ESG performance and negative sentiment momentum (or to hold firms with weak ESG
performance and positive sentiment momentum). If institutional asset owners and retail investors value
holding (avoiding) companies with positive (negative) sentiment momentum, asset managers will act to
satisfy their clients’ preferences (Amel-Zadeh and Serafeim 2018).
I estimate market valuation models, where the dependent variable is a firm’s market-to-book ratio at
the end of each month and independent variables include a firm’s ESG performance as a well as control
variables for a firm’s size, profitability, past returns and revenue growth, leverage and industry membership.
I find that the valuation of corporate ESG performance increases as a function of public sentiment. The
positive association between ESG performance and market valuation is stronger for firms with more
positive public sentiment momentum. An increase in a firm’s ESG performance has nearly two to three
times the effect on a firm’s market valuation for a firm with positive relative to a firm with negative public
sentiment momentum.
The differential pricing of sustainability activities based on public sentiment momentum raises the
question if the price paid for these activities is efficient, or the market undervalues strong ESG performance
in the presence of negative sentiment or overvalues strong ESG performance in the presence of positive

Electronic copy available at: https://ssrn.com/abstract=3265502
4
sentiment. To answer this question, I construct ESG factors following the standard approach in the literature
(Fama and French 2018), based both on the levels and/or the change in ESG performance scores.
Importantly, I separate the ESG factor to a high and low sentiment. The high sentiment ESG factor goes
long on firms with strong ESG performance and positive sentiment momentum and short on firms with
weak ESG performance and negative sentiment momentum. Therefore, the factor has a positive spread both
on ESG performance and sentiment momentum. The low sentiment ESG factor goes long on firms with
strong ESG performance and negative sentiment momentum and short on firms with weak ESG
performance and positive sentiment momentum. Therefore, the factor has a positive spread on ESG
performance and a negative spread on sentiment momentum. If the market efficiently prices sustainability
activities independent of sentiment, then both factors should exhibit an insignificant alpha. If the market
undervalues sustainability activities in the presence of negative sentiment, the low sentiment ESG factor
should exhibit a positive alpha. In contrast, if the market overvalues sustainability activities in the presence
of positive sentiment, the high sentiment ESG factor should exhibit a negative alpha.
The low sentiment ESG factor produces significant positive alpha of about 4-5% annually. It exhibits
a higher Sharpe ratio than other factors during the period of study and does not exhibit significant
correlation with any of the six factors introduced in the literature (Novy-Marx 2013; Fama-French 2016).
Moreover, the long portfolio of the ESG factor has dramatically better ESG profile than the short portfolio.
The average ESG score assigned by MSCI is close to 100% higher in the long portfolio and the average
change in ESG score for the long (short) portfolio is an increase (a decrease) of close to the sample standard
deviation of ESG score. This suggests that the ESG factor goes long on firms with significantly greater
positive social impact than the firms in the short portfolio, if MSCI ESG ratings are correlated with social
impact.
In contrast, the high sentiment ESG factor exhibits insignificant alpha. Moreover, it exhibits very strong
correlations with many other factors. Importantly, it has a strong negative correlation with the value factor
suggesting high sentiment firm portfolios with better ESG characteristics have returns that resemble those
of growth stocks. This is consistent with the market valuation results that positive sentiment momentum

Electronic copy available at: https://ssrn.com/abstract=3265502
5
accentuates the association between ESG performance and market valuation. I find some evidence of
overvaluation in more recent years, with the high sentiment ESG factor yielding negative alphas in the years
between 2015 and 2018, although the estimates are insignificant. The low sentiment ESG factor yields a
significant positive alpha in those years.
I complement the results using US data with data across 37 more countries to understand if the role of
sentiment generalizes to other markets. These results should be viewed with caution as the sentiment data
do not derive from languages other than English. The low sentiment ESG factor delivers even higher alpha,
between 2010 and 2018, in a sample of international firms traded in European and Asian-Pacific stock
exchanges. The four-factor alpha in the international sample ranges between 44 and 57 basis points monthly
(6-8% annually). As in the US, in the international sample the high sentiment ESG factor yields an
insignificant alpha. Overall, the results support the interpretation that the market undervalues sustainability
activities in the presence of negative sentiment.
The results of this paper contribute to two distinct streams of literature. First, a literature seeks to
understand the implications of corporate sustainability activities for firm performance (Deng et al. 2013;
Eccles et al. 2014; Khan et al. 2016; Ferrell et al. 2016). The evidence in this study add to this literature
showing that the price of corporate sustainability in capital markets is conditional on public sentiment about
a firm’s sustainability activities and thereby the returns to portfolios that consider ESG data are affected by
public sentiment. Second, the higher price of corporate sustainability as a function of public sentiment
represents new evidence that not only investor sentiment about the stock market (Baker and Wurgler 2006;
Tetlock 2007; Yu and Yuan 2011; Stambaugh, Yu and Yuan, 2012) but also public sentiment about firms’
sustainability activities affect the valuation of a firm.
From a practitioner perspective, with an increasing number of investors seeking to integrate ESG data
in their portfolios, the question arises how, in the spirit of value investing, to identify companies with strong
sustainability performance for a good price. The evidence presented here suggest that combining ESG
performance scores with big ESG data might be helpful in identification of stocks with superior and
undervalued ESG characteristics. Similarly, for companies, the results suggest that monitoring sentiment

Electronic copy available at: https://ssrn.com/abstract=3265502
6
shifts in the presence of new analyses by NGOs, media, industry analysts and other sources is important in
understanding if capital markets reward a company’s investments in sustainability activities.
The rest of the paper proceeds as follows. Section 2 provides the motivation and discusses the past
literature. Section 3 presents the data and the sample. Sections 4 and 5 present the results for the market
valuation and stock return analyses respectively. Section 6 expands the analysis to an international sample.
Section 7 concludes.
2. Motivation and Literature Review
2.1. Developments related to sustainability activities
The MSCI ESG data, described in more length below, measure both opportunities and risk emerging from
social and environmental issues. On the opportunity side, activities related to green buildings, health and
nutrition, and renewable energy are issues that are covered. For example, the green construction industry’s
growth rate is rapidly outpacing that of conventional construction and is expected to account for more the
3.3 million jobs in 2018; more than one-third than the entire US construction sector. From 2015 to 2018 the
industry is expected to contribute $304 billion to US Gross Domestic Product (GDP) (Booz Allen Hamilton
and USGBC 2015). On the health and nutrition front, changing consumer preferences to healthy foods and
wellness-based products are driving growth in new markets. In 2015, the global organic food market was
valued at $77 billion and expected to reach $321 billion by 2025, $110 billion coming from fruits and
vegetables (Grand View Research 2017). Similarly, the Non-GMO food and beverage market was estimated
at $550 billion in 2014 and was on pace to double by 2019 (Packaged Facts 2015). Growth in perceived
healthy food markets mirrors a drop in other food markets. From 2004 to 2017, cases of 192-ounce
carbonated soft drinks volume sold fell over 15%. At the same time, bottled water brands Aquafina and
Poland Spring increased sales 10.9% and in 2016 Americans drank more bottled water than soda.
On renewable energy, 157 gigawatts (GW) of renewable energy were commissioned in 2017, compared
to 70GW of fossil fuel generation capacity added. 2017 also saw $280 billion of renewable energy
investments, bringing cumulative investments to $2.2 trillion since 2010 and $2.9 trillion since 2004
(Frankfurt School et al. 2018). To limit global warming to within 2° Celsius (2DC) over pre-industrial

Electronic copy available at: https://ssrn.com/abstract=3265502
7
averages, estimates held that by 2030 $1 trillion of annual investment in renewable energy would be
required (Ceres 2014). In addition to making investments into renewable energy, as of 2013, 43% of Fortune
500 companies had set targets in either greenhouse gas reductions, energy efficiency, or renewable energy
(WWF et al. 2014). The transition to a low carbon economy is driving change outside the energy sector, for
example the automotive sector. In 2010, electric vehicles (EVs) were a novelty. In 2017, 1 million EVs
were sold globally, bringing the global total fleet to over 3 million vehicles. Bloomberg New Energy
Finance (BNEF), predicts annual sales will reach 11 million by 2025 and 30 million by 2030 (Bloomberg
New Energy Finance 2018). Responding to growing demand, every major auto manufacturer has announced
plans to electrify a large portion of their fleet. As of early 2018, manufacturers had cumulatively planned
to invest $90 billion in batteries and EVs. While EVs represent possible growth opportunities in the auto
manufacturing market, they represent risks to oil companies by displacing oil demand. Two million barrels
of oil per day could be displaced as early as 2028 (Carbon Tracker Initiative 2017). Oil displacement
estimates from BP equate an extra 100 million EVs to 1.4 million barrels per day displacement (BP 2017).
Further on the risk side, and specifically on issues such as business ethics and board diversity, that
constitute a significant part of the governance element of ESG data, firms are changing practices to manage
reputational, legal, and regulatory risks. For example, an increasing number of companies are appointing
women on board to avoid reputational costs associated with lack of diversity and to improve the governance
process. In 2016, women held 21.2% of S&P 500 board seats, up from 15.7% in 2010 and 13.6% in 2003
(Catalyst 2017).
Over the past few years, assets under management in ESG funds grew significantly. As of 2018,
investors with $80 trillion in assets under management had publicly committed, through the United Nations
Principles for Responsible Investing, to consider ESG data in investment analysis. This initiative did not
exist before 2006. In 2016, total global assets under management in different ESG styles, such as negative
screening, best in class, engagement etc., were $22.9 trillion, up from $13.6 trillion in 2012 (Global
Sustainable Investment Alliance 2017). The scale of the sustainable investing market differed significantly
across regions. In 2016, Europe had the highest proportion of sustainable investments, followed by

Electronic copy available at: https://ssrn.com/abstract=3265502
8
Australia and New Zealand and the United States (Bernow, Klempner and Magnin 2017). ESG products
were still rare in Japan and other Asian countries (Bernow, Klempner and Magnin 2017).
2.2. The value of sustainability activities
Past literature discusses how investors used to view sustainability activities negatively, through an agency
lens (Ioannou and Serafeim 2016). It shows that sell-side analysts were pessimistic in their
recommendations for firms with better ESG performance scores and that this pessimism disappeared over
time, as investor logic of sustainability activities changed from an agency to a value perspective. According
to the agency perspective, sustainability expenditures are a waste of company resources benefiting
corporate managers by allowing them to build reputation in society or to entrench themselves in their firms
(Benabou and Tirole 2010; Kitzmueller and Shimshack 2012). Theoretical models show how managers can
buy employee support by adopting more employee-friendly workplace practices to avoid replacement
(Cespa and Cestone 2007) or takeovers (Pagano and Volpin 2005). Similarly, these expenditures could
enhance corporate managers reputation in society with little benefit to the company (Barnea and Rubin
2010). Cheng, Hong and Shue (2013) show that after the 2003 Dividend Tax cut, firms with moderate levels
of insider ownership cut ESG investments by more than firms with low levels (where the tax cut has no
effect) and high levels (where agency is less of an issue), suggesting that ESG investments are partly due
to agency problems.
Recent research examines the relation between agency costs and ESG performance and concludes the
opposite. Ferrell, Hao and Renneboog (2016) find that well-governed firms that suffer less from agency
concerns have higher ESG performance. Porter and Kramer (2011) present a framework on creating shared
value where companies’ ESG activities are blended in corporate strategy rather than representing peripheral
activities. Khan, Serafeim and Yoon (2016) show that firms with improving performance on industry-
specific material ESG issues outperform in the future firms with declining performance on material ESG
issues. Deng, Kang and Low (2013) show that mergers by high ESG performance acquirers take less time
to complete, have larger increases in post-merger long-term operating performance, and are less likely to

Electronic copy available at: https://ssrn.com/abstract=3265502
9
fail than mergers by low ESG performance acquirers. Ghoul et al. (2011) find that firms with high ESG
performance exhibit lower cost of capital.
On the social side, studies show that firms with better employee satisfaction and stronger sense of
corporate purpose among employees have better financial performance (Edmans 2011; Gartenberg, Prat
and Serafeim 2018) providing support to human relation theories that identify employees as key
organizational assets (e.g. Maslow, 1943; Hertzberg, 1959; McGregor, 1960). On the environmental side,
numerous studies show that a worse environmental footprint is associated with lower market valuation
(Konar and Cohen 2001; Matsumura, Prakash, and Vera-Muñoz 2014).
2.3. ESG Performance and Sentiment
Prior literature provides the basis for a connection between investor sentiment and pricing of securities
(Baker and Wurgler 2006; Stambaugh, Yu and Yuan, 2012; Yu and Yuan 2011). In this literature, investor
sentiment is defined as the propensity to speculate or as optimism or pessimism for stocks generally. In this
paper, I focus on public sentiment momentum about a firm’s sustainability activities, defined as the change
in how positive or negative beliefs by a wide variety of constituents (e.g. NGOs, industry experts, analysts,
think tanks and reputable media) are about a company’s ESG performance.
Given the previous evidence that investors focus on ESG data and impound them into the valuation of
a firm, there are multiple reasons why sentiment momentum could affect the valuation and future returns
of portfolios that consider corporate ESG data. First, firms with strong ESG performance but with
occasional or temporary societal controversies might be now judged as weak ESG performers. Similarly,
firms with weak ESG performance that have strong marketing campaigns and advertise their ESG activities
might be now judged as strong ESG performers. In addition, negative sentiment in a specific ESG issue
might spread to a perception that a firm is weak across many sustainability activities. Second and related to
the previous argument, investors might assign a higher discount rate to a firm’s ESG performance in the
presence of negative sentiment because they expect future reputational, legal, or operating costs. Investors
might expect that negative sentiment will affect the value of a company’s sustainability activities thereby
raising their riskiness and the discount rate assigned to them.

Electronic copy available at: https://ssrn.com/abstract=3265502
10
Third, asset manager incentives might lead them to ignore firms with strong ESG performance and
negative sentiment momentum. Evidence in the literature suggest that management fees due to increased
flows could be a significant incentive in driving a positive ESG image for a fund manager. Białkowski and
Starks (2016) examine U.S. equity mutual funds, self-labeled as ESG funds, and conclude that inflows to
those funds have been higher than inflows to comparable funds without similar mandates. Hartzmark and
Sussman (2018) utilize the introduction of mutual fund sustainability rankings, published by Morningstar,
and find low ESG-rated funds experiencing outflows of $12 billion and increased probability of
liquidations, while high ESG-rated funds experiencing inflows greater than $22 billion. If institutional asset
owners and retail investors value holding (avoiding) companies with positive (negative) ESG sentiment
momentum, asset managers will act to satisfy their clients’ preferences. Therefore, investors will avoid
holding stocks with negative public sentiment momentum even if they have strong ESG performance. With
almost $80 trillion now committed, through the United Nations Principles for Responsible Investment, to
take ESG issues into account and evidence that for most asset managers customer preferences, rather than
integration of ESG issues in business analysis, are driving the incorporation of ESG data in investments
products (Amel-Zadeh and Serafeim 2018), it is plausible that sentiment momentum affects investor
decisions.
3. Data and Sample
3.1. ESG Performance
Data on firm ESG performance comes from MSCI ESG Ratings. There is no generally accepted definition
of what constitutes good ESG performance. As in the case of credit ratings or product ratings, such as cars
or restaurants, different ESG rating providers, use different methodologies to assign scores. Moreover,
given the multidimensionality of the ESG scores, the lack of agreement across rating providers is less
surprising. I use the MSCI ESG ratings as a proxy for the market’s view of ESG performance because they
are the most widely used by the investment community. Out of the 50 largest asset managers, ranked by
assets under management, 46 are clients of MSCI ESG ratings according to MSCI, with the total number
of clients being more than 1,200 investment firms. MSCI defines the purpose of their ratings as “to help

Electronic copy available at: https://ssrn.com/abstract=3265502
11
investors to understand ESG risks and opportunities and integrate these factors into their portfolio
construction and management process.”2 MSCI coverage universe is based on major MSCI indices (e.g.
MSCI World Index, MSCI Emerging Markets Index, MSCI country specific Investible Market Indices) that
include the world’s largest and most liquid stocks.
MSCI ESG Ratings are based off 37 Key Issues. Key Issues correspond to one of ten macro themes
MSCI identifies as of concern to investors: climate change, natural capital, pollution and waste,
environmental opportunities, human capital, product liability, stakeholder opposition, social opportunities,
corporate governance, and corporate behavior. Key Issues are annually selected for each of the 156 GICS
Sub-Industries and weighted according to MSCI’s materiality mapping framework. Each Key Issue score
consists of a risk exposure – a company’s exposure to a key issue – and risk management – the company’s
management of each material issue – component. For a given Key Issue score the required risk management
component score is conditional on the risk exposure faced by the company; a company with a greater risk
exposure would be required to have strong risk management practices in place. Conversely, a company
with minimal management strategies on a low exposure risk issue would not be penalized. For Key Issues
that measure opportunity (e.g. Opportunities in Green Building, Opportunities in Renewable Energy,
Opportunities in Nutrition and Health, Access to Health Care), exposure indicates the relevance of this
opportunity to a given company based on its current business and geographic segments.
MSCI measures the risk and opportunity exposure of each company by combining company-specific
operations data with Key Issue relevant macro-level data relating to a companies’ geographies of operations
and business segments. Company operations data are sourced from corporate reporting, such as annual
reports, investor presentations, and financial and regulatory filings, with macro-level data being sourced
from a wide variety of academic, government, and NGO databases. In a similar fashion, risk and opportunity
management related data come from corporate documents, government data, news media, relevant
organizations and professionals, and an assortment of popular, trade, and academic journals. As part of their
2 MSCI provides more information here.

Electronic copy available at: https://ssrn.com/abstract=3265502
12
data verification process, MSCI engages in direct communication with companies and invites companies
to participate in a data review process, which includes commenting on the accuracy of company data for
all MSCI ESG Research reports.3
MSCI aggregates the issue data to an overall score where each issue is weighted according to its
assessed materiality in each industry. Given that ESG issues tend to vary systematically across industries
MSCI calculates an industry-adjusted score that serves as the basis for their ratings scheme. I use this
industry-adjusted score as the measure of a company’s ESG performance (ESG level), except in the market
valuation models where I use the weighted-average ESG score before the industry adjustment and I include
industry fixed effects. The score ranges from zero to ten with zero (ten) being the worst (best) possible
performance. I calculate ESG change as the change in the ESG level of each company between two
subsequent rating events. I keep ESG change at the value of the first month of the ESG score revision for
each subsequent month until the next revision. Given that MSCI most often revises ratings every 12-18
months, I keep ESG level and ESG change at that value for up to 24 months after the rating event.
3.2. Public Sentiment about Corporate Sustainability Activities
I supplement MSCI ESG Ratings data with data from TruValue Labs that provides sentiment data on
companies’ ESG performance. Some of the largest asset managers (e.g. State Street) and asset owners (e.g.
Global Pension Investment Fund of Japan) use TruValue Labs data. TruValue Labs employs big data and
artificial intelligence to capture and analyze unstructured data. Every day, TruValue Labs uses artificial
intelligence algorithms to find ESG-relevant articles for each company categorized by ESG-specific issue.
TruValue Labs uses the Sustainability Accounting Standards Board’s (SASB) materiality taxonomy to
measure sentiment on material ESG data fields.
The TruValue Labs platform includes information from a wide variety of sources, including reports by
analysts, various media, advocacy groups, and government regulators. TruValue Labs emphasizes that its
measures focus on vetted, reputable and credible sources that are likely to generate new information and
3 In 2017, MSCI reported an approximate 40 percent response rate (MSCI ASWI Index companies).

Electronic copy available at: https://ssrn.com/abstract=3265502
13
therefore insights for investors. To increase transparency and validate the data, the TruValue Labs platform
allows a user to track the original source of the articles and events that inform the sentiment analysis for
each specific issue. The platform aggregates unstructured data from over 100,000 sources into a continuous
stream of ESG data for monitored companies. The cognitive computing system uses natural language
processing (NLP), to interpret semantic content and generate analytics scoring data points on performance
using a zero to 100 scale. A score of 50 represents a neutral impact. Scores above 50 indicate positive
sentiment, and scores below 50 reflect negative sentiment. For example, Ingersoll Land had positive
sentiment following news on the firm’s investments to improve waste and hazardous materials
management, materials sourcing and product safety. In contrast, Facebook had negative sentiment
following news on the firm’s data privacy issues, concerns about regulatory pressure and user rights.4
The sentiment analysis performed by TruValue Labs is capable of codifying not only positive versus
negative sentiment in a binary way, but also degrees of positivity or negativity. For example, the algorithms
assign a relatively more negative score to a catastrophic oil spill affecting several workers and communities
and a less negative score to a workplace incident that leads to a minor injury for one worker. The algorithms
assign such scores in a consistent manner based on the semantic content across data points, so that
hypothetically if there is an identical event such as the catastrophic oil spill and identical discussion of the
event in a textual document, the sentiment-based score for such an event would be the same.
TruValue Labs labels the daily score of their analysis Pulse. From those daily scores TruValue Labs
derives the Insight Score, a measure of a company’s longer-term ESG sentiment. Scores are derived using
an exponentially-weighted moving average of Pulse. The half-life of an event’s influence on the Insight
score is 6 months. Insight scores are less sensitive to daily events and reflect the enduring sentiment around
a company over time (ESG Sentiment). One of TruValue Labs’ key metrics is the Momentum score which
is derived from the Insight Score and measured as the logarithm of the slope of Insight over a trailing 12-
month period. The measure is normalized by the logarithm of the maximum slope over the universe at the
4 See TruValue Labs analysis for Ingersoll Rand here and for Facebook here.

Electronic copy available at: https://ssrn.com/abstract=3265502
14
same sampling point in time, and further normalized into the zero to a 100 range with below 50 indicating
negative sentiment momentum and above 50 indicating positive sentiment momentum. The momentum
score reveals the change in sentiment over time based on recent articles flow (ESG Sentiment Momentum).
3.3. Sample
MSCI employs approximately 185 analysts that rate companies. As with equity analysts, ESG analysts
specialize by industry. The time-series files include the date that the scores were released for each company.
For most companies, an analyst issues one rating for all ESG categories every year but there are exceptions
as some companies have significant news that change their assessment. I merge the MSCI data with the
TruValue data by linking each end of month ESG sentiment datapoint for a firm to the closest in past time
MSCI ESG performance score. This ensures that for the date the sentiment is measured the ESG
performance score of the company was already released by MSCI. I impose a criterion to match the two
datasets by up to 24 months lag in MSCI ESG performance score. This is reasonable given that most scores
are updated by MSCI within 12 to 18 months. If more than 24 months have elapsed, it is likely that the
score is not representative of the firm anymore.
TruValue Labs has available data starting in the beginning of 2008 for the momentum score. However,
in 2008 the intersection of the datasets produces a sample of close to 200 stocks in each month. Over time,
the sample of stocks each month is increasing as MSCI and TruValue Labs are increasing coverage. Given
the volatility due to the financial crisis and the small number of stocks in the sample, I start the analysis in
2009. Therefore, the sample spans the 114 months between January 2009 and June 2018. I supplement the
ESG data with financial accounting data from Compustat and stock market data from CRSP. The merged
ESG performance and sentiment data are merged with the most recent past quarterly and annual Compustat
files based on quarterly earnings announcement dates and with CRSP monthly data based on calendar dates
(i.e. end of month sentiment data are matched with next month stock returns).
Table 1 presents the summary statistics for the sample used in the market valuation analysis and Table
2 the summary statistics for the sample used in the stock return analysis. Because the market valuation
analysis does not require calculation of the change in ESG performance from MSCI, the sample is slightly

Electronic copy available at: https://ssrn.com/abstract=3265502
15
larger at 138,349 firm-month pairs compared to 123,384 firm-month pairs for the stock return analysis
sample. Table 2 Panel A shows that the sample increases from approximately 350 companies in 2009 to
about 1,900 companies in 2018. Panel B presents summary statistics. Average ESG level is 4.21. There is
significant variability across companies with the standard deviation of 2.5 Average and median ESG change
are both close to zero. This is not surprising as some companies will experience performance declines and
some performance increases, with the overall industry-adjusted score change being close to zero. Of more
importance is the standard deviation of 1.27, which suggests significant variation across companies in ESG
performance changes over time. The average ESG Sentiment of 62 suggests that companies in the sample
have on average positive sentiment. Average and median ESG Sentiment Momentum are close to 50
suggesting that the sample in this study experience on average no significant change in the ESG sentiment.
Importantly, there is significant variation across firms as the standard deviation is 26. In fact, the standard
deviation of ESG Sentiment Momentum is higher than the standard deviation of ESG Sentiment.
Firms with higher ESG Level have higher MTB, ROE, and firm size with the univariate correlations
being close to 0.12, 0.08 and 0.15 respectively. ESG Change in contrast exhibits smaller univariate
correlations with the highest being with MTB (0.04). ESG Sentiment Momentum is significantly positively
correlated with past one-year revenue growth, but the correlation is very small (0.01). ESG Sentiment
exhibits stronger correlation with both past revenue growth but also with MTB (0.06), leverage (-0.07) and
firm size (-0.08). The univariate correlations between ESG Level and ESG Sentiment Momentum is zero
and with ESG Sentiment is 0.09. ESG Sentiment Momentum is not correlated with ESG Change either.
The firms in the sample are larger than the universe of companies listed in US markets. This is not
surprising as it is a function of ESG data coverage tilted towards larger firms. Average and median market
capitalization is $3.7 and $3.4 billion. However, it has implications for the tests. Past literature has found
that a range of investment strategies are more likely to have significant alphas for smaller firms (Novy-
5 ESG Performance in Table 1 is the weighted-average ESG score of MSCI and ESG Level in Table 2 Panel B is the
industry-adjusted weighted-average ESG score of MSCI which is derived from the former and it is industry-adjusted.
The industry-adjusted score exhibits similar mean and median but higher standard deviation.

Electronic copy available at: https://ssrn.com/abstract=3265502
16
Marx 2013). Therefore, it is likely that the tilt of the sample towards larger firms decreases the probability
of finding a significant alpha. However, the tilt towards larger firms has an advantage when it comes to
measurement quality of sentiment. According to TruValue Labs the measurement quality of sentiment
increases with the number of articles. In any given month, approximately 80-90% of the sample companies
have above median volume of articles, as measured by TruValue Labs within their universe of coverage.
Average and median market-to-book ratio is 2.6 and 2.5.
4. Market Valuation Results
Does public sentiment momentum influence the market pricing of corporate ESG performance? To answer
this question, I estimate market valuation models of ESG performance. Specifically, for each month, I
estimate cross-sectional models where the dependent variable is the natural logarithm of the market-to-
book ratio at the end of each month. The independent variables include a series of control factors and the
weighted-average ESG performance score from MSCI (ESG Performance) and its interaction with ESG
Sentiment Momentum.6 The model is below:
Ln (MTBit) = aj + b1 x ESG Performanceit + b2 x ESG Performanceit x ESG Sentiment Momentumit + Controlsit
MTB is measured at the end of each month as the market capitalization from CRSP and the most recent
publicly available total shareholder’s equity from the quarterly Compustat file.7 Controls include firm
profitability (ROE), firm size (natural logarithm of end of previous month market capitalization), past one-
year sales growth, past six-month stock returns, and financial leverage (one minus total shareholder’s equity
over total assets). The model includes two-digit SIC code fixed effects and month fixed effects. I demean
ESG Performance and ESG Sentiment Momentum to facilitate interpretation of the estimated coefficient on
the interaction term b2. Demeaning the two variables allows for the base effect of ESG Performance to be
evaluated at the neutral level of ESG Sentiment Momentum when including the interaction term.
6 I use the weighted average ESG score that is not industry adjusted in the market valuation models as they include
industry fixed effects. Using the industry-adjusted ESG score yields similar results. 7 I use the quarterly earnings announcement data to determine whether shareholder’s equity is publicly disclosed.

Electronic copy available at: https://ssrn.com/abstract=3265502
17
Before showing the results for the full model, I estimate a base model of the association between ESG
performance and market valuation. Figure 1 shows the exponentially weighted moving average estimated
coefficient on ESG Performance from cross-sectional models estimated each month between 2003 and
2018.8 To mitigate the likelihood that differences over time are driven by changes in the sample with
available ESG data as data coverage increases over time, I require that a firm appears at least 120 months
in the sample. This way the sample is significantly more balanced over time. The average number of firms,
across months, is approximately 300. The market pricing of ESG performance has increased significantly
as investors have shifted their views on the value of ESG performance consistent with the market
developments described in section 2. Importantly, the coefficient has shifted from a negative to a positive
territory. The fact that the price of corporate sustainability has increased over time could be attributed to
developments that favor the economics of ESG activities, as described in section 2 as well as an increasing
number of investors considering ESG data in their capital allocations. The sharp decline of the valuation
coefficient in 2016 coincides with the US presidential election in November 2016. One interpretation is that
investors expected the new administration not to benefit firms with investments in renewable energy and
other ESG activities that are inconsistent with the new administration’s agenda.9 Indeed, following the
elections firms with low ESG scores such as coal companies and private prison firms had large positive
returns while the returns of firms in wind and solar energy experienced sharp stock price declines. This case
increases confidence that the cross-sectional models yield estimated coefficients that reflect how investors
value a firm’s ESG performance.
In the first model of Table 3 Panel A, the estimated coefficient on the ESG performance variable is
positive and significant. A two points increase in ESG performance is associated with approximately 6.1%
higher market valuation in the period 2009-2018. The second model in Table 3 shows that the coefficient
8 I plot the exponentially weighted moving average to smooth out the intertemporal pattern. I use a lambda of 0.5 to
put more importance on more recent coefficients. However, the figure is very similar when I plot the cross-sectional
coefficients. 9 In April 2018, the Department of Labor issued new guidance that was widely interpreted as a pushback on ESG
investing. Relevant articles can be found here, here and here.

Electronic copy available at: https://ssrn.com/abstract=3265502
18
on ESG Performance stays the same when I add in the model ESG Sentiment Momentum. The coefficient
on ESG Performance stays identical because ESG performance and ESG sentiment momentum have a
univariate correlation of close to zero. The estimated coefficient on ESG sentiment momentum is
insignificant suggesting that on its own ESG sentiment momentum does not explain variation in corporate
valuation multiples. In the third model of Table 3, the coefficient on the interaction term between ESG
performance and sentiment is positive and statistically significant. The association between ESG
performance and market valuation seems to vary considerably as a function of sentiment. For a company
with negative sentiment momentum of 30 the increase in market valuation associated with a two-points
increase in ESG performance is only 4.2%. In contrast, for a company with positive sentiment momentum
of 80 the increase in market valuation associated with a two-points increase in ESG performance is more
than double at 8.6%. I evaluate the economic effect at these levels of sentiment momentum as they are close
to the average values in the long and short portfolio in the next section.
Panel B assesses the robustness of these results to alternative models. In the first model, I also include
gross margin as independent variable as firms with better ESG performance might have higher gross
margins. The variable loads with a significant coefficient and the coefficient on ROE loses significance
consistent with past research (Novy-Marx 2013). The difference in the valuation of ESG performance
becomes even more significant across public sentiment. It is now three times as large for firms with positive
sentiment relative to negative sentiment compared to Panel A where it was two times. For firms with
negative sentiment momentum a two-points increase in ESG performance is associated with 2.1% increase
in market valuation. For firms with positive sentiment momentum a two-points increase in ESG
performance is associated with 6.7% increase in market valuation. In the second model, in addition to one-
year revenue growth I add 3-year revenue growth as a determinant. In the third model, I also add one and
three-year asset growth as determinants. I am particularly worried about how past growth might affect the
relation between ESG performance, ESG sentiment momentum and market valuation as growth firms might
be more likely to make sustainability investments and to have more positive sentiment momentum. The
results are very similar across models. In unreported results, I add other variables in the model, such as

Electronic copy available at: https://ssrn.com/abstract=3265502
19
research and development expenditures, capital expenditures and past cumulative selling, general and
administrative expenses as a percentage of sales. None of those variables change the principal inferences.
Overall, the results suggest that public sentiment momentum has a considerable effect on how a firm’s
sustainability activities are valued in the market.
5. Stock Return Results
Portfolio Construction
I construct the ESG factor sorting, each month, firms in terciles according to ESG change or ESG level.10
The former leads to factor ESG1 and the latter to ESG2. All portfolio construction processes are described
in Appendix 1. Using the industry-adjusted ESG scores from MSCI creates more industry-balanced
portfolios avoiding the issue that industries where most companies have higher (lower) ESG Scores are
systematically included in long (short) portfolios, although this would not necessarily affect the portfolio
allocation rule based on changes rather than levels. Independently, I sort companies based on beginning of
month market capitalization and allocate them into terciles. Following standard factor construction process
(Fama and French 2018), I value-weight returns within each of the three size portfolios and three ESG score
portfolios. Then, within each month, I calculate the equal weighted average of returns across the three size
portfolios for each tercile of the ESG score. The ESG factor is then constructed as the return in the top ESG
tercile of firms minus the return in the bottom ESG tercile of firms.
Long and short portfolios in factors ESG3 and ESG4 are subsets of ESG1 and ESG2 respectively. ESG3
includes in the long and short portfolios the same stocks as ESG1 but excludes from the long (short)
portfolio firms at the bottom (top) tercile of ESG level. Effectively, it does not penalize firms for declines
in ESG performance if after the decline the ESG performance is industry-leading, and it does not reward
firms for increases in ESG performance if after the increase the ESG performance is industry-lagging. ESG4
includes in the long and short portfolios the same stocks as ESG2 but excludes from the long (short)
10 I use terciles as the main portfolio construction rule as my sample is limited compared to the sample in other papers
because of ESG data coverage requirements. Using quartile or quintiles leads to significantly thinner portfolios
especially when I perform analysis supplementing ESG performance scores with ESG sentiment.

Electronic copy available at: https://ssrn.com/abstract=3265502
20
portfolio firms at the bottom (top) tercile of ESG change. Effectively, it does not penalize firms for low
ESG performance if the change in ESG performance is industry-leading, and it does not reward firms for
high levels of ESG performance if the change in ESG performance is industry-lagging. While ESG3 and
ESG4 create portfolios with even larger differences in ESG profile, they lead to portfolios with fewer stocks
increasing the variability of returns on the factor over time. ESG5 is a combination of ESG1 and ESG2
adding the companies in the long portfolios and the companies in the short portfolios. To further optimize
the portfolio’s ESG profile it excludes from the short (long) portfolio firms with ESG performance increases
and firms that have industry-leading ESG performance as reflected in an MSCI ESG rating equal or above
A (ESG performance declines and firms that have industry-lagging ESG performance as reflected in an
MSCI ESG rating below B). The advantage of ESG5 is that it seeks to improve the ESG profile of the
portfolio while at the same time increasing the number of stocks in each portfolio thereby creating more
diversified portfolios.
I construct portfolios for each ESG factor by differentiating based on ESG Sentiment Momentum.
Effectively, the firms in the long and short portfolios are now allocated in two distinct portfolios. To classify
firms according to their ESG Sentiment Momentum I sort firms each month to two portfolios based on the
median of the ESG Sentiment Momentum score. Firms that are in the long portfolio but not in the high (low)
positive sentiment momentum portfolio are labelled as low (high) sentiment firms. Firms that are in the
short portfolio but not in the high (low) negative sentiment portfolio are labelled as low (high) sentiment
momentum firms. Indicatively, firms such as, the Movado Group, Domino’s, Overstock com., and Pinnacle
Financial services, have been included in the long portfolio of the low sentiment ESG factor. Firms such as
Buffalo Wild Wings, Regis, Liberty Media and Eagle Bancorp have been included in the short portfolio of
the low sentiment factor. Kroger, HP, Cheesecake Factory, and Ally Financial have been included in the
long portfolio of the high sentiment ESG factor. Vector Group, Electronic Arts, Krispy Kreme Doughnuts,
and Guess are some of the companies in the short portfolio of the high sentiment ESG factor. Appendix 2
provides an example of four companies in the restaurant industry and why they were classified in different
portfolios.

Electronic copy available at: https://ssrn.com/abstract=3265502
21
Table 4 Panel A presents summary statistics for the low sentiment momentum ESG factors and Panel
B for the high sentiment momentum ESG factors. By construction ESG1 and ESG3 exhibit larger
differences in ESG change between the short and long portfolios rather than ESG level. The opposite is the
case for ESG2 and ESG4. Furthermore, by construction, the difference in ESG change (ESG level) between
the short and long portfolios is larger in ESG3 (ESG4) compared to ESG1 (ESG2). ESG5 shows large
differences in both ESG level and change but also significant increase in the average number of stocks
included in the short and long portfolios. Across Panels A and B, the summary statistics on both ESG
change and ESG level are close to identical. By construction, what differs is sentiment. In Panel A (B) firms
in the long (short) portfolio have lower ESG Sentiment and ESG Sentiment Momentum. The difference in
ESG Sentiment is orders of magnitude lower than the difference in ESG Sentiment Momentum. This is
important as it suggests that what differs dramatically across portfolios is the trajectory of the sentiment
rather than the overall sentiment about a company. This means that even though the long portfolio in the
low sentiment momentum ESG factor has low sentiment momentum the overall sentiment is not negative.
Moreover, the average ESG Sentiment is higher than 50 for all portfolios suggesting that on average the
samples have more positive rather than negative sentiment even when there is negative momentum. These
statistics suggest that investors that care about ESG impacts would not find themselves in a position of
investing in stocks that would be outside their mandate (i.e. tobacco, coal etc.).
Stock Returns Analysis
Table 5 Panel A shows estimates for raw returns and t-statistics rejecting the null hypothesis that the average
monthly return on ESG1 and ESG2 factors is zero. The first two estimates are for the factors comprising
all stocks independent of sentiment. The average return is positive and marginally significant in the case of
ESG change (18 basis points monthly) or significant in the case of ESG level (24 basis points monthly).
The remaining columns present estimates separating the sample to the low and high sentiment samples. The
average raw return on the ESG factors is much higher for the low sentiment sample. The average return
based on ESG change and ESG level are 38 and 34 basis points monthly respectively. Both estimates are

Electronic copy available at: https://ssrn.com/abstract=3265502
22
highly statistically significant. In contrast, for the high sentiment sample the estimates are only 6 and 17
basis points and insignificant.
Panel B presents the results for factors ESG3-ESG5. For the low sentiment sample all factors have
positive and highly significant average raw returns. Based on ESG change (ESG3) the estimate rises to
0.47, ESG level (ESG4) to 0.40 and combined ESG change and level (ESG5) to 0.35. All are significant.
In contrast, the estimates among the high sentiment sample are not statistically different from zero. The
higher returns in Panel B suggests that further improving the ESG profile of the factor is beneficial to
investment returns. Figures 2c, 2b and 2c present graphically over time the returns to factors ESG3, ESG4
and ESG5. To keep the figures concise, I omit ESG1 and ESG2 as they provide similar insights. The low
sentiment factors performed well in the early and late years of the analysis period. The high sentiment
factors exhibit their worst performance in the late years. In fact, they yield negative returns after 2014.
Lower average returns and higher standard deviation of returns leads to the high sentiment ESG factors
exhibiting a Sharpe ratio between 0.04 and 0.11. In contrast, the Sharpe ratio of the low sentiment ESG
factors ranges between 0.23 and 0.29. The Sharpe ratios of the size, value, and momentum factors during
the same period have been 0.08, -0.05 and -0.05 for comparison purposes. The profitability and investment
factors had a Sharpe ratio of 0.07 and 0.01 respectively. The correlation between ESG1 and ESG2 is close
to 0.61 suggesting that ESG factors based on changes and levels yield returns with high positive correlation
but at the same time they are distinct strategies.
Table 6 follows the same structure as Table 5 but instead reports results from the four-factor model. I
use the ESG factor returns as the dependent variable in a model where independent variables include the
Fama-French (1993) market, size and value factors supplemented by the momentum factor (Carhart 1997).
The results for ESG1 and ESG2 are in Panel A. The alpha for both ESG1 and ESG2 among all firms is
positive (21 and 23 basis points) and significant. The two strategies have very different loadings on the
factors. Using ESG change as the basis for portfolio construction yields portfolio returns with a negative
loading on the market and value factors and a positive loading on the size factor. The coefficient on the
momentum factor is insignificant. In contrast, using ESG level as the basis for portfolio construction yields

Electronic copy available at: https://ssrn.com/abstract=3265502
23
portfolio returns with a negative loading on the momentum and value factors. The coefficients on the market
and size factors are insignificant.
Perhaps more interestingly, these results differ dramatically across low and high sentiment samples.
The ESG1 and ESG2 factors for the low sentiment sample yield alphas monthly of 37 and 30 basis points
respectively. ESG1 is not correlated with any of the factors while ESG2 exhibits a negative correlation only
with the momentum factor. In contrast, the ESG1 and ESG2 factors for the high sentiment sample yield
positive but insignificant alphas. ESG1 exhibits large negative loadings on the market and value factors and
a positive loading on the size factor. The coefficient on the momentum factor is insignificant. ESG2 exhibits
large negative loadings on the momentum and value factors. The coefficients on the market and size factors
are insignificant. The returns on the ESG factor among high sentiment firms are correlated strongly with
the returns of growth firms. The t-statistics of the coefficients on the value factors rise to 4.5-6.1 region
suggesting very reliable associations.
Panel B shows the models for factors ESG3-ESG5. The results tell a similar story. Alphas on the ESG
factors among low sentiment firms are between 35 and 38 basis points. The annual abnormal returns in the
range of 4.3-4.7% are very significant. In contrast, among high sentiment firms, alphas are much lower,
insignificant, and exhibit strong associations with other factors, in particular, the value factor. The loading
on the value factor is consistent with firms with more positive sentiment momentum and strong ESG
performance having higher valuation multiples. In more recent years, between 2015 and 2018, the low
sentiment ESG factor yields a positive and significant monthly alpha of about 27 basis points. In contrast,
the high sentiment ESG factor yields a negative but insignificant monthly alpha of about 12 basis points.
In Table 7, I add the gross profitability and the investment factor as independent variables in the model.
The results are similar for the low sentiment ESG factors. The high sentiment ESG factors exhibit strong
correlation with all other factors. The estimates suggest strong negative loadings with the market,
momentum, value and investment factors and positive loadings on the size and profitability factors. The
high sentiment ESG factor does better when market returns are lower, and it behaves similar to investing
in small, growth, high profitability, low momentum and aggressive investing firms.

Electronic copy available at: https://ssrn.com/abstract=3265502
24
Sorts on Size
To understand better the source of the significant alphas on the ESG factor, I estimate the four-factor model
separately for firms that are classified in each month in terciles according to beginning of month market
capitalization. Table 8 Panel A shows the results for each tercile of the low sentiment ESG5 factor. The
alpha is positive and significant across all terciles but its magnitude declines moving from small to medium
and large firms. Statistical significance declines as the portfolios become less diversified and as a result the
standard deviation of portfolio returns across months increases. The alpha increases from 26 basis points
for the large size sample to 36 basis points for the medium size sample and to 46 basis points for the small
size sample. It is worth highlighting that firms are labelled small or large in relative terms within the sample.
The firms in the small size sample are not small in absolute terms, as the ESG data coverage universe is
tilted towards large liquid firms.
Sorts on Market-to-Book ratio
Panel B presents similar analysis but now the three portfolios are formed based on beginning of month
market-to-book ratio (MTB). The alpha is positive and significant for both value and growth firms and
insignificant for the neutral portfolio. The alpha is 59 basis points within the sample of value firms and 42
basis points within the sample of growth firms. Both results for the size and MTB terciles should be
interpreted with caution as the portfolio decomposition produces more concentrated portfolios. Future
research can corroborate or reject these results as ESG data becomes more widely available.
I now turn to analyze international data to understand whether the results generalize to other markets.
It is not clear that this would be the case. Different markets have had different business, corporate reporting
and investment management developments and the role that news and thereby public sentiment might play
in capital markets is likely to be different. But importantly, the sentiment data derive from articles in
English. Thereby in non-English speaking countries the data omit a large fraction of the news that comprise
public sentiment.
6. International Data
Data and Sample

Electronic copy available at: https://ssrn.com/abstract=3265502
25
The data for international firms comes from Compustat Global. I calculate returns for each month from the
securities file and convert all prices and market capitalization data to US dollars based on exchange rates
from Bloomberg. Because TruValue Labs coverage of international firms starts later in the sample and
more firms are needed in each country for portfolio construction, I use data spanning 1st of January 2010
and 30th of June 2018. Therefore, all tests on the international sample use 102 monthly observations.
Table 9 Panel A shows that the number of stocks with available data in MSCI, TruValue and Compustat
Global increases from about 500 companies in 2010 to about 2,000 companies in 2018. The total number
of observations is 124,603 firm-month pairs. Panel B presents summary statistics for the whole international
sample. A few observations are worth pointing out. First, according to MSCI the international firms in the
sample have slightly better performance than the US firms. Of course, this could be because the
international firms in the sample are much larger than the US firms. Median market capitalization in the
international sample is about $6.2 billion. This is not surprising given the coverage criteria for both MSCI
and TruValue. Both data providers cover stocks in the major stock indices within each country. The median
MTB ratio is lower in the international sample at 1.73.
Portfolio Construction
The analysis in the international sample uses the portfolio construction process of ESG5. While ESG5 did
not yield the highest returns among the different ESG factors it is best suited for this sample as it increases
the number of stocks in both the long and short portfolios. This is especially important in the international
sample where the process requires enough stocks within each country or sub-region stock exchange. ESG5
for international firms is constructed in the same way as ESG5 for US firms but with an extra step where
returns are averaged across portfolios of stock exchange country or sub-regions after the process for ESG5
has been followed within each exchange country or sub-region. This ensures that the portfolios are not
dominated by stocks of specific exchange countries or sub-regions if some exchange countries or sub-
regions tend to exhibit higher or lower ESG scores. I construct two factors. The first, ESG5INT1, averages
returns across exchange countries and the second, ESG5INT2, averages returns across sub-regions that lump
together several countries. The advantage of the first version is that it assigns equal importance in the

Electronic copy available at: https://ssrn.com/abstract=3265502
26
calculation to each country thereby mitigating the effect of country-specific factors. However, its advantage
is its drawback as it assigns equal importance to exchanges that have large market size and exchanges with
small market size. The second version, ESG5INT2, addresses this concern by creating sub-regions and
lumping together exchanges to create closer to equal size stock exchange sub-regions.
For ESG5INT1 (ESG5INT2) each month, every stock is sorted independently within an exchange country
(sub-region) in terciles according to the change, level in ESG performance and beginning of month market
capitalization. For the firms in the top tercile of ESG change or level, value-weighted returns within each
country (sub-region) and size tercile (ESGTOPsmall, ESGTOPmedium, ESGTOPlarge) are calculated each month. The
equal weighted-return across the three size terciles (ESGTOPsmall, ESGTOPmedium, ESGTOPlarge) within a country
(sub-region) is the return for that month and country (sub-region) ESGTOP. The overall return for the long
portfolio of the ESG factor then is the equal-weighted return across all countries (sub-regions). For the
firms in the bottom tercile of ESG change or level, value-weighted returns within each country (sub-region)
and size tercile (ESGBOTsmall, ESGBOTmedium, ESGBOTlarge) are calculated each month. The equal weighted-
return across the three size terciles (ESGBOTsmall, ESGBOTmedium, ESGBOTlarge) is the return for that month and
country (sub-region) ESGBOT. The overall return for the short portfolio of the ESG factor then is the equal-
weighted return across all countries (sub-regions). The ESG factor then is the difference between ESGTOP
and ESGBOT in each month.
I classify firms into 12 sub-regions. The goal is to have sub-regions with enough companies to populate
the portfolios while lumping together countries that share common characteristics shaping a firm’s efforts
in the ESG domain. For countries with enough observations to stand on their own in the portfolio
construction, such as Japan, I treat them as separate sub-regions. The two exceptions are Australia and the
UK. While there are enough observations and it would be possible to represent standalone sub-regions, I
lump with them other countries that they share common characteristics and where these other countries do
not have enough observations to stand on their own. In the region of Asia-Pacific, the sub-regions are 1)
Australia and New Zealand, 2) Japan, 3) South-East Asia, including India, Indonesia, Thailand, Philippines
and Malaysia, 4) Chinese provinces and special administrative regions, China, Hong Kong and Taiwan,

Electronic copy available at: https://ssrn.com/abstract=3265502
27
and 5) other high GDP Asian countries, South Korea and Singapore. In the region of EMEA, the sub-
regions are 1) Central Europe, including Austria, Belgium, Switzerland, Netherlands, and Poland 2)
Germany, 3) France, 4) the Nordics, 5) Mediterranean and Middle East, including Italy, Spain, Greece,
Turkey, United Arab Emirates and Egypt, 6) British Isles, UK and Ireland and 7) South Africa.
Table 10 presents summary statistics for the long and short portfolios across all geographies to keep
the table concise. Note that the companies included in the long and short portfolios are the same across
ESG5INT1 and ESG5INT2. What differs across the two is the weight of each exchange country in the portfolio.
Therefore, across both factors the summary statistics are the same as tabulated in Table 10. As with Table
4 the statistics for ESG change and ESG level are almost identical across the low and high sentiment groups.
The short and long portfolios exhibit very large differences both in ESG change and ESG level. Again, the
differences for ESG sentiment are moderate but the differences for ESG sentiment momentum are very large.
Results
Table 11, Panel A presents the estimates both for raw returns and the results from estimating the four-factor
model for ESG5INT1. The factors are for the global market excluding the United States. The low sentiment
ESG factor has average returns of 44 basis points monthly and this estimate is statistically significant. The
alpha is 57 basis points and significant. There is a negative loading on the market factor suggesting that in
the international sample the ESG factor performs better during months with lower market returns. The same
is true for the high sentiment ESG factor. The alpha is negative but insignificant for this sample.
Panel B presents the estimates both for raw returns and the results from estimating the four-factor model
for ESG5INT2. The low sentiment ESG factor has average returns of 23 basis points monthly and this
estimate is statistically significant. The alpha is 35 basis points and significant. There is a negative loading
on the market and the size factor suggesting that in the international sample the ESG factor exhibits returns
that resemble more the returns of large firms. The same is true for the high sentiment ESG factor. The alpha
is positive and larger for the high sentiment ESG5INT2 compared to ESG5INT1. Further exploration suggests
that this is driven primarily by Japan, which in ESG5INT2 has a larger weight and where the high (low)
sentiment ESG factor performs well (poorly) during the period of the analysis. When I decompose the

Electronic copy available at: https://ssrn.com/abstract=3265502
28
international sample to the EMEA and the Asia-Pacific ex Japan region I find that the low sentiment ESG
factor yields positive and significant alpha in both regions.
7. Conclusion
The importance of public sentiment is well captured in the quote by Abraham Lincoln at the beginning of
this paper. During a speech he used it to defend his position for abolishing slavery against his opponent
Stephen Douglas, who accused Lincoln of hypocrisy by linking him to a document with extremist positions.
But while the importance of public sentiment was early on recognized by Lincoln and has been linked more
recently in the academic literature to a series of economic phenomena, such as consumer spending, we have
little evidence how it impacts the valuation of corporate activities and the returns to those activities.
According to the evidence presented in this paper, public sentiment momentum about a firm’s
sustainability activities has significant implications for the valuation of corporate sustainability activities
and the performance of portfolios that seek alignment with better ESG performance. In the presence of
negative public sentiment, firm sustainability activities are valued less and associated with positive
abnormal returns in the future. No such future positive abnormal returns are associated with firm
sustainability activities in the presence of positive public sentiment.
This paper is a first attempt at understanding the role of public sentiment in how markets value corporate
sustainability activities. Many questions remain unanswered. For example, how public sentiment about a
firm’s sustainability activities forms and what is the role of corporate disclosures both in shaping sentiment
but also in response to it? How do firms change their corporate sustainability activities in response to
changes in public sentiment? These and other questions are likely to lead to a more complete understanding
of the field in the intersection of business and society.

Electronic copy available at: https://ssrn.com/abstract=3265502
29
References
Amel-Zadeh, A. and Serafeim, G., 2018. Why and How Investors Use ESG Information: Evidence from a
Global Survey. Financial Analysts Journal, 74(3), pp.1-17.
Asness, C.S., Frazzini, A. and Pedersen, L.H., 2013. Quality minus junk. AQR Working paper.
Bénabou, R. and Tirole, J., 2010. Individual and corporate social responsibility. Economica, 77(305), pp.1-
19.
Barnea, A. and Rubin, A., 2010. Corporate social responsibility as a conflict between shareholders. Journal
of Business Ethics, 97(1), pp.71-86.
Bernow, S., Klempner, B., and Magnin, C., 2017. From why to why not. Sustainable investing as the new
normal. McKinsey report.
Bialkowski, J. and Starks, L.T., 2016. SRI funds: Investor demand, exogenous shocks and ESG profiles.
Working paper.
Bloomberg New Energy Finance, 2018. Electric Vehicle Outlook 2018.
Booz Allen Hamilton and USGBC, 2015. 2015 Green Building Economic Impact Study.
Borgers, A., Derwall, J., Koedijk, K. and Ter Horst, J., 2013. Stakeholder relations and stock returns: On
errors in investors' expectations and learning. Journal of Empirical Finance, 22, pp.159-175.
BP, 2017. BP Energy Outlook 2017 Edition.
Baker, M. and Wurgler, J., 2006. Investor sentiment and the cross‐section of stock returns. The Journal of
Finance, 61(4), pp.1645-1680.
Carbon Tracker Initiative, 2017. Expect the unexpected: the disruptive power of low-carbon technology.
Carhart, M.M., 1997. On persistence in mutual fund performance. The Journal of Finance, 52(1), pp.57-
82.
Catalyst, 2017. 2016 Catalyst Census: Women and Men Board Directors.
Ceres, 2014. Investing in the Clean Trillion: Closing the Clean Energy Investment Gap.
Cespa, G. and Cestone, G., 2007. Corporate social responsibility and managerial entrenchment. Journal of
Economics & Management Strategy, 16(3), pp.741-771.
Cheng, I.H., Hong, H. and Shue, K., 2013. Do managers do good with other people’s money? Working
paper.
Credit Suisse, 2016. ESG-Alpha: I am a Material Girl.
Deng, X., Kang, J.K. and Low, B.S., 2013. Corporate social responsibility and stakeholder value
maximization: Evidence from mergers. Journal of Financial Economics, 110(1), pp.87-109.
Eccles, R.G., Ioannou, I. and Serafeim, G., 2014. The impact of corporate sustainability on organizational
processes and performance. Management Science, 60(11), pp.2835-2857.

Electronic copy available at: https://ssrn.com/abstract=3265502
30
Edmans, A., 2011. Does the stock market fully value intangibles? Employee satisfaction and equity
prices. Journal of Financial Economics, 101(3), pp.621-640.
El Ghoul, S., Guedhami, O., Kwok, C.C. and Mishra, D.R., 2011. Does corporate social responsibility affect
the cost of capital? Journal of Banking & Finance, 35(9), pp.2388-2406.
Eurosif, 2008. European SRI Study 2008.
Fama, E.F. and French, K.R., 1993. Common risk factors in the returns on stocks and bonds. Journal of
Financial Economics, 33(1), pp.3-56.
Fama, E.F. and French, K.R., 2016. Dissecting anomalies with a five-factor model. The Review of Financial
Studies, 29(1), pp.69-103.
Fama, E.F. and French, K.R., 2018. Choosing factors. Journal of Financial Economics, 128(2), pp.234-
252.
Ferrell, A., Liang, H. and Renneboog, L., 2016. Socially responsible firms. Journal of Financial Economics,
122(3), pp.585-606.
Frankfurt School, UN Environment Programme, and Bloomberg New Energy Finance, 2018. Global trends
in renewable energy investment 2018,
Gartenberg, C.M., Prat, A. and Serafeim, G., 2018. Corporate purpose and financial performance.
Organization Science, forthcoming.
Generation Investment Management, 2017. Sustainability Trends Report.
Global Sustainability Investment Alliance, 2017. 2016 Global Sustainable Investment Review.
Grand View Research, 2017. Global Organic Foods & Beverages Market, Industry Report, 2018-20125.
Hartzmark, S.M. and Sussman, A.B., 2018. Do Investors Value Sustainability? A Natural Experiment
Examining Ranking and Fund Flows.
Hertzberg, F., 1959. The Motivation to Work. J. Wiley & Sons, New York.
Ioannou, I. and Serafeim, G., 2015. The impact of corporate social responsibility on investment
recommendations: Analysts' perceptions and shifting institutional logics. Strategic Management
Journal, 36(7), pp.1053-1081.
JP Morgan. A quantitative ESG metric for stock selection models. 2018.
Khan, M., Serafeim, G. and Yoon, A., 2016. Corporate sustainability: First evidence on materiality. The
Accounting Review, 91(6), pp.1697-1724.
Kitzmueller, M. and Shimshack, J., 2012. Economic perspectives on corporate social
responsibility. Journal of Economic Literature, 50(1), pp.51-84.
Konar, S. and Cohen, M.A., 2001. Does the market value environmental performance? Review of
Economics and Statistics, 83(2), pp.281-289.
MacGregor, D., 1960. The Human Side of Enterprise (Vol. 21, No. 166-171). McGraw‐Hill: New York.
Maslow, A.H., 1943. A theory of human motivation. Psychological Review, 50(4), p.370.

Electronic copy available at: https://ssrn.com/abstract=3265502
31
Miller, K, and Serafeim, G., 2015. Chief Sustainability Officers: Who Are They and What Do They Do?
Chap. 8 in Leading Sustainable Change: An Organizational Perspective, edited by Rebecca Henderson,
Ranjay Gulati, and Michael Tushman. Oxford University Press.
Novy-Marx, R., 2013. The other side of value: The gross profitability premium. Journal of Financial
Economics, 108(1), pp.1-28.
Packaged Facts, 2015. Non-GMO Foods: U.S. and Global Market Perspective, 2nd Edition.
Pagano, M. and Volpin, P.F., 2005. Managers, workers, and corporate control. The Journal of
Finance, 60(2), pp.841-868.
Porter, M.E. and Kramer, M.R., 2011. Creating shared value. Harvard Business Review 89 (1-2).
Prakash, M., Matsumura, E.M. and Vera-Munoz, S.C., 2014. Firm-value effects of carbon emissions and
carbon disclosures. The Accounting Review, 89(2), pp.695-724.
Russell Investments, 2018. Materiality matters: Targeting the ESG issues that can impact performance –
the materiality ESG score.
Stambaugh, R.F., Yu, J. and Yuan, Y., 2012. The short of it: Investor sentiment and anomalies. Journal of
Financial Economics, 104(2), pp.288-302.
WWF, Ceres, Calvert Investments, David Gardiner and Associates, 2014. Power Forward 2.0.
Yu, J. and Yuan, Y., 2011. Investor sentiment and the mean–variance relation. Journal of Financial
Economics, 100(2), pp.367-381.

Electronic copy available at: https://ssrn.com/abstract=3265502
32
Appendix 1
Factor Description
ESG1: ESG changes Each month, every stock is sorted independently in terciles according to the change in
ESG performance and beginning of month market capitalization. For the firms in the top
tercile of ESG change, value-weighted returns within each size tercile (ESGTOPsmall,
ESGTOPmedium, ESGTOPlarge) are calculated each month. The equal weighted-return across
the three size terciles (ESGTOPsmall, ESGTOPmedium, ESGTOPlarge) is the return for that month
ESGTOP. For the firms in the bottom tercile of ESG change, value-weighted returns within
each size tercile are calculated each month ESGBOTsmall, ESGBOTmedium, ESGBOTlarge. The
equal weighted-return across the three size terciles (ESGBOTsmall, ESGBOTmedium,
ESGBOTlarge) is the return for that month ESGBOT. ESG1 is the difference between ESGTOP
and ESGBOT in each month. The low (high) sentiment version of the factor includes in the
TOP and BOT portfolios only stocks that are below (above) median in the ESG sentiment
momentum score
ESG2: ESG levels Each month, every stock is sorted independently in terciles according to the level of ESG
performance and beginning of month market capitalization. For the firms in the top tercile
of ESG level, value-weighted returns within each size tercile (ESGTOPsmall, ESGTOPmedium,
ESGTOPlarge) are calculated each month. The equal weighted-return across the three size
terciles (ESGTOPsmall, ESGTOPmedium, ESGTOPlarge) is the return for that month ESGTOP. For
the firms in the bottom tercile of ESG levl, value-weighted returns within each size tercile
are calculated each month ESGBOTsmall, ESGBOTmedium, ESGBOTlarge. The equal weighted-
return across the three size terciles (ESGBOTsmall, ESGBOTmedium, ESGBOTlarge) is the return
for that month ESGBOT. ESG2 is the difference between ESGTOP and ESGBOT in each
month. The low (high) sentiment version of the factor includes in the TOP and BOT
portfolios only stocks that are below (above) median in the ESG sentiment momentum
score
ESG3: ESG changes
accounting for ESG
level
ESG3 follows the same process with ESG1 but excludes companies in a given month
from the TOP (BOT) portfolio that are in the bottom (top) tercile of ESG performance
level
ESG4: ESG levels
accounting for ESG
change
ESG4 follows the same process with ESG2 but excludes companies in a given month
from the TOP (BOT) portfolio that are in the bottom (top) tercile of ESG performance
change
ESG5: ESG combined
changes and levels
ESG5 combines in the TOP (BOT) portfolio, in any given month, stocks that are in ESG1
or ESG2 TOP (BOT) portfolio and imposes absolute filters. Excludes companies from
the TOP portfolio with lower than ESG B rating (<=1.4 ESG score) or negative ESG
performance change in a given month. Excludes companies from the BOTTOM portfolio
with ESG A rating and above (=>5.7 ESG score) or positive ESG performance change in
a given month
ESG5INT1: ESG5
International Sample
by Exchange Country
Each month, every stock is sorted independently in terciles according to the level, change
in ESG performance and beginning of month market capitalization. For the firms in the
top tercile of ESG level or change, value-weighted returns within each size tercile
(ESGTOPsmall, ESGTOPmedium, ESGTOPlarge) are calculated each month separately for each
exchange country. The equal weighted-return across the three size terciles (ESGTOPsmall,
ESGTOPmedium, ESGTOPlarge) is the return for that month ESGTOP separately for each
exchange country. The portfolio level ESGTOP each month is then the equal weighted
average of the exchange country specific ESGTOP. For the firms in the bottom tercile of
ESG level or change, value-weighted returns within each size tercile are calculated each
month ESGBOTsmall, ESGBOTmedium, ESGBOTlarge separately for each exchange country. The
equal weighted-return across the three size terciles (ESGBOTsmall, ESGBOTmedium,
ESGBOTlarge) is the return for that month ESGBOT separately for each exchange country.
The portfolio level ESGBOT each month is then the equal weighted average of the
exchange country specific ESGBOT. ESG5 INT1 is the difference between ESGTOP and
ESGBOT in each month

Electronic copy available at: https://ssrn.com/abstract=3265502
33
ESG5INT2: ESG5
International Sample
by Exchange Region
Each month, every stock is sorted independently in terciles according to the level, change
in ESG performance and beginning of month market capitalization. For the firms in the
top tercile of ESG level or change, value-weighted returns within each size tercile
(ESGTOPsmall, ESGTOPmedium, ESGTOPlarge) are calculated each month separately for each
exchange region. The equal weighted-return across the three size terciles (ESGTOPsmall,
ESGTOPmedium, ESGTOPlarge) is the return for that month ESGTOP separately for each
exchange region. The portfolio level ESGTOP each month is then the equal weighted
average of the exchange region specific ESGTOP. For the firms in the bottom tercile of
ESG level or change, value-weighted returns within each size tercile are calculated each
month ESGBOTsmall, ESGBOTmedium, ESGBOTlarge separately for each exchange region. The
equal weighted-return across the three size terciles (ESGBOTsmall, ESGBOTmedium,
ESGBOTlarge) is the return for that month ESGBOT separately for each exchange region. The
portfolio level ESGBOT each month is then the equal weighted average of the exchange
region specific ESGBOT. ESG5 INT2 is the difference between ESGTOP and ESGBOT in each
month

Electronic copy available at: https://ssrn.com/abstract=3265502
34
Appendix 2
Domino's
Pizza
Buffalo Wild
Wings
The
Cheesecake
Factory
Krispy Kreme
Doughnuts
ESG Performance High Low High Low
ESG Sentiment Momentum Low High High Low
ESG Performance 5.2 2.6 5.2 2.6
Climate Change 9.3 6.0 7.1 6.0
Product Safety & Quality 3.0 2.5 5.6 2.6
Opportunities in Nutrition & Health 4.4 1.6 2.5 0.2
ESG Sentiment Momentum 15.0 76.4 87.0 17.1
Customer Welfare 36.6 87.4 85.4 19.0
Fair Disclosure & Marketing 72.1 91.6 67.2 14.9
Product Quality & Safety 32.3 87.3 87.2 18.1
Fuel Management 50.0 N/A 50.0 50.0
Greenhouse Gas Emissions N/A N/A 50.0 N/A
The restaurant industry provides an illustration of the selection process of the proposed long-short portfolio.
I intentionally choose examples of companies that tend to focus on the broad customer base of the restaurant
industry instead of niche players that offer only healthy food. All companies entered in the ESG5 portfolios
around March 2014 and apart from Krispy Kreme they were still in the portfolios until June 2018. The table
provides ESG performance and sentiment momentum data from 2014 for Domino’s Pizza (High ESG
Performance – Low ESG Sentiment), Buffalo Wild Wings (Low ESG Performance – High ESG Sentiment),
The Cheesecake Factory (High ESG Performance – High ESG Sentiment) and Krispy Kreme Doughnuts
(Low ESG Performance – Low ESG Sentiment). The ESG performance score is the overall industry-
adjusted ESG score provided by MSCI. The selected ESG performance sub-topics are components of the
overall ESG performance score that are emphasized as they are driving the differences across companies.
MSCI assigns a higher weight on social than environmental or governance issues within the restaurant
industry. MSCI applies an approximate 60%-30%-10% weighting for social, environmental and
governance issues, respectively, which reflects the weighting of the importance of these issues for the
restaurant industry. Domino’s Pizza has a high “Climate Change” score in addition to relatively higher
“Product Safety & Quality” score and “Opportunities in Nutrition & Health” score. Comparatively, Buffalo
Wild Wings receives a “low” ESG performance score due to relatively lower performance on all three
categories. A similar analysis explains the difference in ESG performance scores between The Cheesecake
Factory and Krispy Kreme Doughnuts. ESG sentiment scores show a much more positive sentiment for
Buffalo Wild Wings and The Cheesecake Factory compared to Domino’s Pizza and Krispy Kreme
Doughnuts. Given that all four companies have either missing data or the same scores for environmental
sub-topics, their overall ESG sentiment score is driven by the social dimensions of “Customer Welfare”,
“Fair Disclosure & Marketing” and “Product Quality & Safety” scores.

Electronic copy available at: https://ssrn.com/abstract=3265502
35
Figure 1: Market Valuation of Corporate ESG Performance Score over time
Note: Figure 1 plots the exponentially weighted moving average coefficient on ESG performance from cross-sectional models. For each month, I estimate models where the dependent variable
is the natural logarithm of the market-to-book ratio (MTB). MTB is measured at the end of each month as the market capitalization from CRSP and the most recent publicly available total
shareholder’s equity from the quarterly Compustat file. Independent variables include the ESG performance score from MSCI, firm profitability (ROE), firm size (natural logarithm of end of
month market capitalization), past one-year sales growth, past six-month stock returns, and financial leverage (one minus total shareholder’s equity over total assets). The model includes two-
digit SIC code fixed effects for the US sample. To mitigate the likelihood that differences over time are driven by changes in the sample as ESG data coverage increases over time, a firm is
included if it appears at least 120 months. MSCI scores are available starting 2003.
-0.08
-0.06
-0.04
-0.02
0
0.02
0.04
0.06
0.08
1/1
/20
03
6/1
/20
03
11/1
/200
3
4/1
/20
04
9/1
/20
04
2/1
/20
05
7/1
/20
05
12/1
/200
5
5/1
/20
06
10/1
/200
6
3/1
/20
07
8/1
/20
07
1/1
/20
08
6/1
/20
08
11/1
/200
8
4/1
/20
09
9/1
/20
09
2/1
/20
10
7/1
/20
10
12/1
/201
0
5/1
/20
11
10/1
/201
1
3/1
/20
12
8/1
/20
12
1/1
/20
13
6/1
/20
13
11/1
/201
3
4/1
/20
14
9/1
/20
14
2/1
/20
15
7/1
/20
15
12/1
/201
5
5/1
/20
16
10/1
/201
6
3/1
/20
17
8/1
/20
17
1/1
/20
18
6/1
/20
18

Electronic copy available at: https://ssrn.com/abstract=3265502
36
Figure 2a: Evolution of $1 invested in ESG3: Changes in ESG Performance
Figure 2b: Evolution of $1 invested in ESG4: Levels of ESG Performance
0.90
1.00
1.10
1.20
1.30
1.40
1.50
1.60
1.70
1.80
12/1
/200
8
4/1
/20
09
8/1
/20
09
12/1
/200
9
4/1
/20
10
8/1
/20
10
12/1
/201
0
4/1
/20
11
8/1
/20
11
12/1
/201
1
4/1
/20
12
8/1
/20
12
12/1
/201
2
4/1
/20
13
8/1
/20
13
12/1
/201
3
4/1
/20
14
8/1
/20
14
12/1
/201
4
4/1
/20
15
8/1
/20
15
12/1
/201
5
4/1
/20
16
8/1
/20
16
12/1
/201
6
4/1
/20
17
8/1
/20
17
12/1
/201
7
4/1
/20
18
Performance of ESG Factors
ESG Low Sentiment ESG High Sentiment
0.90
1.00
1.10
1.20
1.30
1.40
1.50
1.60
12/1
/200
8
4/1
/20
09
8/1
/20
09
12/1
/200
9
4/1
/20
10
8/1
/20
10
12/1
/201
0
4/1
/20
11
8/1
/20
11
12/1
/201
1
4/1
/20
12
8/1
/20
12
12/1
/201
2
4/1
/20
13
8/1
/20
13
12/1
/201
3
4/1
/20
14
8/1
/20
14
12/1
/201
4
4/1
/20
15
8/1
/20
15
12/1
/201
5
4/1
/20
16
8/1
/20
16
12/1
/201
6
4/1
/20
17
8/1
/20
17
12/1
/201
7
4/1
/20
18
Performance of ESG Factors
ESG Low Sentiment ESG High Sentiment

Electronic copy available at: https://ssrn.com/abstract=3265502
37
Figure 2c: Evolution of $1 invested in ESG5: Changes and Levels of ESG Performance
Note: Figures 2a-2c plot the evolution of $1 dollar invested in the ESG1, 2 and 5 factors for high and low sentiment samples. ESG factor
portfolio construction is defined in the Appendix. The period is 1/1/2009 until 6/30/2018.
0.90
1.00
1.10
1.20
1.30
1.40
1.50
1.60
1/1
/20
09
5/1
/20
09
9/1
/20
09
1/1
/20
10
5/1
/20
10
9/1
/20
10
1/1
/20
11
5/1
/20
11
9/1
/20
11
1/1
/20
12
5/1
/20
12
9/1
/20
12
1/1
/20
13
5/1
/20
13
9/1
/20
13
1/1
/20
14
5/1
/20
14
9/1
/20
14
1/1
/20
15
5/1
/20
15
9/1
/20
15
1/1
/20
16
5/1
/20
16
9/1
/20
16
1/1
/20
17
5/1
/20
17
9/1
/20
17
1/1
/20
18
5/1
/20
18
Performance of ESG Factors
ESG Low Sentiment ESG High Sentiment

Electronic copy available at: https://ssrn.com/abstract=3265502
38
Figure 3a: Evolution of $1 invested in ESG5INT1 Global x US
Figure 3b: Evolution of $1 invested in the long and short portfolios of ESG5INT2 Global x US
Note: Figures 3a-3b plot the evolution of $1 dollar invested in the ESG5INT1 and ESG5INT2 factor for high and low sentiment samples.
Portfolio construction is defined in the Appendix. The period is 1/1/2010 until 6/30/2018.
0.80
0.90
1.00
1.10
1.20
1.30
1.40
1.50
1.60
12/1
/200
9
4/1
/20
10
8/1
/20
10
12/1
/201
0
4/1
/20
11
8/1
/20
11
12/1
/201
1
4/1
/20
12
8/1
/20
12
12/1
/201
2
4/1
/20
13
8/1
/20
13
12/1
/201
3
4/1
/20
14
8/1
/20
14
12/1
/201
4
4/1
/20
15
8/1
/20
15
12/1
/201
5
4/1
/20
16
8/1
/20
16
12/1
/201
6
4/1
/20
17
8/1
/20
17
12/1
/201
7
4/1
/20
18
Performance of ESG Factors
ESG Low Sentiment ESG High Sentiment
0.90
0.95
1.00
1.05
1.10
1.15
1.20
1.25
1.30
12/1
/200
9
4/1
/20
10
8/1
/20
10
12/1
/201
0
4/1
/20
11
8/1
/20
11
12/1
/201
1
4/1
/20
12
8/1
/20
12
12/1
/201
2
4/1
/20
13
8/1
/20
13
12/1
/201
3
4/1
/20
14
8/1
/20
14
12/1
/201
4
4/1
/20
15
8/1
/20
15
12/1
/201
5
4/1
/20
16
8/1
/20
16
12/1
/201
6
4/1
/20
17
8/1
/20
17
12/1
/201
7
4/1
/20
18
Performance of ESG Factors
ESG Low Sentiment ESG High Sentiment

Electronic copy available at: https://ssrn.com/abstract=3265502
39
Table 1
Summary Statistics for Market Valuation Analysis Sample
Variable Name Mean Median Std Dev Interquartile Range
ESG Performance 4.47 4.40 1.09 1.30
ESG Sentiment Momentum 51.42 50.00 25.82 48.99
Past Return 0.08 0.07 0.28 0.27
Leverage 0.57 0.58 0.23 0.34
Log Market Cap 14.94 14.81 1.57 2.25
Log MTB 0.95 0.91 0.75 1.05
Revenue growth 0.07 0.05 0.22 0.15
ROE 0.08 0.10 0.27 0.14
ESG performance is the level of a firm’s ESG performance in a given month as rated by MSCI’s weighted-average score. ESG Sentiment Momentum is TruValue
Labs’ Momentum score which is derived from the Insight Score and measured as the slope or trajectory over a trailing 12-month time (TTM) period. Past return is
the cumulative stock returns over the past six months. Leverage is one minus total equity over total debt. Log Market Cap is the natural logarithm of beginning of
month market capitalization. Log MTB is the natural logarithm of end of month market-to-book ratio. Revenue growth is past one-year revenue growth rate. ROE
is net income over total shareholders’ equity. Data span the period from 1st of January 2009 to 30th of June 2018 and they are measured monthly. Number of
observations is 138,349.

Electronic copy available at: https://ssrn.com/abstract=3265502
40
Table 2
Panel A: Number of Companies by Month
Year Month N Year Month N Year Month N Year Month N Year Month N
2009 1 337 2011 1 350 2013 1 543 2015 1 1723 2017 1 1900
2009 2 337 2011 2 349 2013 2 558 2015 2 1724 2017 2 1939
2009 3 337 2011 3 356 2013 3 565 2015 3 1738 2017 3 1928
2009 4 332 2011 4 364 2013 4 567 2015 4 1739 2017 4 1941
2009 5 339 2011 5 380 2013 5 582 2015 5 1738 2017 5 1932
2009 6 343 2011 6 384 2013 6 602 2015 6 1746 2017 6 1934
2009 7 347 2011 7 389 2013 7 612 2015 7 1790 2017 7 1932
2009 8 350 2011 8 394 2013 8 619 2015 8 1813 2017 8 1966
2009 9 340 2011 9 395 2013 9 635 2015 9 1811 2017 9 1960
2009 10 343 2011 10 399 2013 10 675 2015 10 1810 2017 10 1954
2009 11 343 2011 11 401 2013 11 803 2015 11 1844 2017 11 1944
2009 12 344 2011 12 403 2013 12 871 2015 12 1850 2017 12 1933
2010 1 341 2012 1 408 2014 1 1443 2016 1 1837 2018 1 1931
2010 2 343 2012 2 410 2014 2 1473 2016 2 1860 2018 2 1947
2010 3 345 2012 3 413 2014 3 1534 2016 3 1866 2018 3 1934
2010 4 345 2012 4 414 2014 4 1554 2016 4 1896 2018 4 1920
2010 5 352 2012 5 416 2014 5 1565 2016 5 1895 2018 5 1902
2010 6 344 2012 6 421 2014 6 1591 2016 6 1897 2018 6 1889
2010 7 347 2012 7 423 2014 7 1599 2016 7 1895
2010 8 338 2012 8 431 2014 8 1610 2016 8 1892
2010 9 348 2012 9 431 2014 9 1621 2016 9 1876
2010 10 336 2012 10 438 2014 10 1628 2016 10 1924
2010 11 341 2012 11 526 2014 11 1631 2016 11 1922
2010 12 347 2012 12 536 2014 12 1672 2016 12 1909

Electronic copy available at: https://ssrn.com/abstract=3265502
41
Panel B: Summary Statistics for Stock Return Analyses Sample
Variable Mean Median Std Dev Interquartile Range
ESG Level 4.21 4.10 2.00 2.80
ESG Change 0.04 0.00 1.27 1.30
ESG Sentiment 61.81 63.71 15.62 19.79
ESG Sentiment Momentum 51.25 50.00 26.05 49.72
Log Market Cap 15.12 15.03 1.57 2.25
Log MTB 0.95 0.92 0.75 1.04
In Panel A, number of stocks is the number of stocks with available data from MSCI, TruValue Labs, and CRSP. The number of observations is 123,384 firm-
month pairs. In Panel B, ESG level is the level of a firm’s ESG performance in a given month as rated by MSCI’s industry-adjusted score. ESG change is the
change in a firm’s ESG performance in a given month, calculated as the difference from the previous MSCI rating and maintained at this value for the minimum
of, until the score is updated or 24 months. ESG sentiment is the Insight Score from TruValue Labs calculated as an exponentially-weighted moving average of
daily sentiment scores where the half-life of an event’s influence on the Insight score is 6 months. ESG Sentiment Momentum is TruValue Lab’s Momentum score
which is derived from the Insight Score and measured as the slope or trajectory over a trailing 12-month time (TTM) period. Log Market Cap is the natural logarithm
of beginning of month market capitalization in millions of USD. Log MTB is the natural logarithm of end of month market-to-book ratio. Data span the period
from 1st of January 2009 to 30th of June 2018 and they are measured monthly.

Electronic copy available at: https://ssrn.com/abstract=3265502
42
Table 3
Panel A: Market Valuation of Corporate ESG Performance Scores and Public Sentiment
Parameter Estimate t-value Estimate t-value Estimate t-value
Intercept -0.55595 -4.24 -0.55603 -4.24 -0.55631 -4.24
ESG Performance 0.03043 3.22 0.03043 3.22 0.03034 3.22
ESG Sentiment Momentum 0.00002 0.14 0.00003 0.20
ESG Performance*ESG Sentiment Momentum 0.00044 2.90
Past Return 0.52341 12.01 0.52339 12.01 0.52326 11.98
Leverage 0.43290 6.98 0.43291 6.98 0.43208 6.97
Log Market Cap 0.11372 12.82 0.11372 12.82 0.11372 12.83
Revenue Growth 0.40213 11.11 0.40211 11.11 0.40242 11.12
ROE 0.22268 4.77 0.22263 4.76 0.22213 4.76
Industry effects Yes Yes Yes Year-month effects Yes Yes Yes Adj R-squared 39.47% 39.47% 39.49%
The dependent variable is Log MTB, the natural logarithm of end of month market-to-book ratio. ESG performance is the level of a firm’s ESG performance in a
given month as rated by MSCI’s weighted-average score. ESG Sentiment Momentum is TruValue Lab’s Momentum score which is derived from the Insight Score
and measured as the slope or trajectory over a trailing 12-month time (TTM) period. I demean ESG Level and ESG Sentiment Momentum to facilitate interpretation
of the interaction term. Past return is the cumulative stock returns over the past six months. Leverage is one minus total equity over total debt. Log Market Cap is
the natural logarithm of beginning of month market capitalization. Revenue growth is past one-year revenue growth rate. ROE is net income over total shareholder’s
equity. Data span the period from 1st of January 2009 to 30th of June 2018 and they are measured monthly. Standard errors are clustered at the firm level and are
robust to heteroscedasticity. Number of observations is 138,349.

Electronic copy available at: https://ssrn.com/abstract=3265502
43
Panel B: Market Valuation of Corporate ESG Performance Scores and Public Sentiment - Additional Models
Parameter Estimate t-value Estimate t-value Estimate t-value
Intercept -1.20552 -9.48 -1.22630 -9.57 -1.30268 -10.27
ESG Level 0.01961 2.23 0.02028 2.31 0.02108 2.41
ESG Sentiment Momentum 0.00004 0.24 0.00004 0.25 0.00002 0.12
ESG Level*ESG Sentiment Momentum 0.00046 3.22 0.00042 2.96 0.00042 2.96
Past Return 0.50965 11.50 0.51381 11.43 0.51814 11.40
Leverage 0.59679 10.11 0.60684 10.19 0.64157 10.78
Log Market Cap 0.12723 15.24 0.12701 15.22 0.12621 15.26
Revenue Growth 0.34684 9.85 0.28325 8.20 0.15742 4.62
3-year Revenue Growth 0.04392 2.76 0.01909 0.85
ROE 0.00135 0.03 0.02370 0.53 -0.00373 -0.08
Gross Margin 1.26268 18.71 1.27053 18.57 1.33307 19.15
Asset Growth 0.27408 9.17
3-year Asset Growth 0.03645 1.72
Industry effects Yes Yes Yes Year-month effects Yes Yes Yes Adj R-squared 46.75% 47.07% 47.65%
The dependent variable is Log MTB, the natural logarithm of end of month market-to-book ratio. ESG level is the level of a firm’s ESG performance in a given
month as rated by MSCI’s industry-adjusted score. ESG Sentiment Momentum is TruValue Lab’s Momentum score which is derived from the Insight Score and
measured as the slope or trajectory over a trailing 12-month time (TTM) period. I demean ESG Level and ESG Sentiment Momentum to facilitate interpretation
of the interaction term. Past return is the cumulative stock returns over the past six months. Leverage is one minus total equity over total debt. Log Market Cap is
the natural logarithm of beginning of month market capitalization. Revenue growth is past one-year revenue growth rate. 3-year Revenue growth is past three-year
revenue growth rate. ROE is net income over total shareholder’s equity. Asset growth is past one-year asset growth rate. 3-year Asset growth is past three-year
asset growth rate. Data span the period from 1st of January 2009 to 30th of June 2018 and they are measured monthly. Standard errors are clustered at the firm level
and are robust to heteroscedasticity. Number of observations is 138,349 for the first model and 137,270 for the second and third models.

Electronic copy available at: https://ssrn.com/abstract=3265502
44
Table 4
Panel A: Summary Statistics for Low Sentiment ESG Factor
ESG1 ESG2 ESG3 ESG4 ESG5
Variable Portfolio Mean St Dev Mean St Dev Mean St Dev Mean St Dev Mean St Dev
ESG Level
Short 3.67 1.88 2.03 0.87 2.87 1.29 1.96 0.92 2.78 1.42
Long 4.82 1.82 6.46 1.16 5.44 1.46 6.46 1.16 5.23 1.82
Diff 1.15 -0.07 4.43 0.28 2.57 0.17 4.51 0.24 2.45 0.41
ESG Change
Short -1.23 0.85 -0.42 1.15 -1.29 0.90 -0.76 0.99 -1.01 0.91
Long 1.31 0.90 0.45 1.31 1.40 0.94 0.45 1.31 1.10 0.94
Diff 2.54 0.05 0.87 0.16 2.69 0.04 1.21 0.32 2.11 0.02
ESG
Sentiment
Short 66.16 14.35 64.64 15.06 65.59 14.64 64.78 15.02 65.40 14.68
Long 58.40 15.73 60.18 14.71 59.24 15.48 60.18 14.71 58.86 15.44
Diff -7.76 1.38 -4.46 -0.35 -6.35 0.84 -4.60 -0.31 -6.54 0.76
ESG
Sentiment
Momentum
Short 75.86 11.17 76.08 11.33 76.09 11.30 76.20 11.31 76.03 11.22
Long 30.62 14.64 30.49 13.96 30.82 14.54 30.49 13.96 30.55 14.54
Diff -45.24 3.47 -45.58 2.63 -45.26 3.24 -45.71 2.66 -45.48 3.33
Number of
Stocks
Short 167 161 128 129 177 Long 195 192 156 192 236

Electronic copy available at: https://ssrn.com/abstract=3265502
45
Panel B: Summary Statistics for High Sentiment ESG Factor
ESG1 ESG2 ESG3 ESG4 ESG5
Variable Portfolio Mean St Dev Mean St Dev Mean St Dev Mean St Dev Mean St Dev
ESG Level
Short 3.65 1.85 2.08 0.82 2.90 1.26 2.01 0.86 2.78 1.37
Long 4.88 1.85 6.46 1.18 5.48 1.50 6.46 1.18 5.36 1.79
Diff 1.24 0.00 4.38 0.36 2.58 0.23 4.45 0.32 2.58 0.43
ESG Change
Short -1.24 0.84 -0.39 1.12 -1.28 0.88 -0.72 0.96 -0.99 0.91
Long 1.32 0.94 0.46 1.31 1.40 0.98 0.46 1.31 0.90 1.20
Diff 2.56 0.09 0.84 0.20 2.68 0.10 1.18 0.36 1.89 0.29
ESG
Sentiment
Short 57.22 15.86 55.31 16.47 56.58 16.16 55.38 16.52 56.33 16.29
Long 66.55 13.73 67.50 12.96 67.13 13.29 67.50 12.96 66.92 13.44
Diff 9.33 -2.14 12.19 -3.51 10.55 -2.87 12.12 -3.56 10.59 -2.85
ESG
Sentiment
Momentum
Short 30.87 14.58 30.67 15.07 30.95 14.84 30.88 15.08 30.79 14.85
Long 75.67 11.29 75.04 10.94 75.69 11.26 75.04 10.94 75.48 11.20
Diff 44.80 -3.30 44.37 -4.13 44.74 -3.58 44.16 -4.14 44.69 -3.65
Number of
Stocks
Short 193 197 150 158 212 Long 166 168 134 168 217
ESG1-ESG5 factors are defined in the Appendix. Long (short) portfolios comprise stocks in TOP (BOT). Diff is the difference between the value for the long and
short portfolio. Panel A (B) presents statistics for the low (high) sentiment momentum portfolio. ESG level is the level of a firm’s ESG performance in a given
month as rated by MSCI’s industry-adjusted score. ESG change is the change in a firm’s ESG performance in a given month, calculated as the difference from the
previous MSCI rating and maintained at this value for the minimum of, until the score is updated or 24 months. ESG sentiment is the Insight Score from TruValue
Labs calculated as an exponentially-weighted moving average of daily sentiment scores where the half-life of an event’s influence on the Insight score is 6 months.
ESG Sentiment Momentum is TruValue Lab’s Momentum score which is derived from the Insight Score and measured as the slope or trajectory over a trailing 12-
month time (TTM) period. Number of stocks is the average number of stocks included in each portfolio across all months. Data span the period from 1st of January
2009 to 30th of June 2018 and they are measured monthly. The number of observations is 123,384 firm-month pairs.

Electronic copy available at: https://ssrn.com/abstract=3265502
46
Table 5
Panel A: Raw Returns for ESG Factors based on ESG performance changes and levels
All Sentiment Low Sentiment High Sentiment
Factor ESG1 ESG2 ESG1 ESG2 ESG1 ESG2
Parameter Estimate t-value Estimate t-value Estimate t-value Estimate t-value Estimate t-value Estimate t-value
Return 0.182 1.77 0.240 2.19 0.379 2.88 0.340 2.48 0.061 0.45 0.169 1.12
Panel B: Raw Returns for ESG factors after improving portfolio ESG profile
Low Sentiment High Sentiment
Factor ESG3 ESG4 ESG5 ESG3 ESG4 ESG5
Parameter Estimate t-value Estimate t-value Estimate t-value Estimate t-value Estimate t-value Estimate t-value
Return 0.467 3.11 0.399 2.75 0.354 3.23 0.162 0.96 0.182 1.05 0.213 1.45
ESG1-ESG5 factors are defined in the Appendix. Data span the period from 1st of January 2009 to 30th of June 2018 and are measured monthly. The number of
data points is 114 monthly observations. The table shows the average raw return for each factor and the t-statistic measuring whether the average raw return is
different from zero.

Electronic copy available at: https://ssrn.com/abstract=3265502
47
Table 6
Panel A: Four-factor Model Estimates for ESG factors based on ESG performance changes and levels
All Sentiment Low Sentiment High Sentiment
Factor ESG1 ESG2 ESG1 ESG2 ESG1 ESG2
Parameter Estimate t-value Estimate t-value Estimate t-value Estimate t-value Estimate t-value Estimate t-value
Alpha 0.206 2.15 0.232 2.30 0.366 3.08 0.299 2.17 0.110 0.91 0.166 1.28
Market -0.057 -1.92 -0.027 -0.82 -0.016 -0.39 0.029 0.62 -0.093 -2.72 -0.057 -1.41
SMB 0.076 1.71 -0.044 -1.04 0.048 0.80 -0.097 -1.58 0.118 2.11 0.020 0.32
UMD -0.065 -1.00 -0.091 -3.00 -0.092 -1.27 -0.068 -1.98 -0.046 -0.78 -0.099 -2.55
HML -0.109 -1.89 -0.190 -4.62 -0.004 -0.05 -0.045 -0.68 -0.224 -4.45 -0.311 -6.13
Panel B: Four-factor Model Estimates for ESG factors after improving portfolio ESG profile
Low Sentiment High Sentiment
Factor ESG3 ESG4 ESG5 ESG3 ESG4 ESG5
Parameter Estimate t-value Estimate t-value Estimate t-value Estimate t-value Estimate t-value Estimate t-value
Alpha 0.384 2.83 0.374 2.59 0.345 3.35 0.199 1.26 0.215 1.48 0.219 1.85
Market 0.035 0.64 0.005 0.10 -0.015 -0.37 -0.099 -2.17 -0.103 -2.76 -0.084 -2.72
SMB 0.016 0.24 -0.101 -1.62 0.012 0.24 0.108 1.50 0.047 0.66 0.107 1.69
UMD -0.117 -1.85 -0.093 -2.92 -0.064 -1.39 -0.097 -1.24 -0.117 -2.43 -0.125 -1.91
HML -0.046 -0.53 -0.107 -1.76 -0.060 -0.90 -0.282 -3.35 -0.393 -6.73 -0.320 -5.92
ESG1-ESG5 factors are defined in the Appendix. Data span the period from 1st of January 2009 to 30th of June 2018 and are measured monthly. The number of
data points is 114 monthly observations. The table shows estimates where the dependent variable is each month the return on the ESG factor and independent
variables are factor-mimicking portfolios for market (Market), size (SMB), momentum (UMD) and value (HML). Alpha is the excess return earned by the ESG
portfolio after accounting for the other factors.

Electronic copy available at: https://ssrn.com/abstract=3265502
48
Table 7
Panel A: Six-factor Model Estimates for Low Sentiment ESG Factor
ESG1 ESG2 ESG3 ESG4 ESG5
Parameter Estimate t-value Estimate t-value Estimate t-value Estimate t-value Estimate t-value
Alpha 0.347 3.01 0.288 2.12 0.356 2.73 0.359 2.45 0.338 3.39
Market -0.013 -0.30 0.031 0.64 0.043 0.78 0.009 0.18 -0.015 -0.35
SMB 0.097 1.38 -0.062 -1.01 0.065 0.85 -0.075 -1.12 0.045 0.80
UMD -0.085 -1.28 -0.064 -2.03 -0.111 -1.94 -0.092 -3.07 -0.058 -1.36
HML 0.044 0.45 0.013 0.16 0.000 0.00 -0.076 -1.07 -0.014 -0.16
RMW 0.151 1.34 0.107 1.01 0.178 1.67 0.084 0.75 0.093 1.06
CMA -0.124 -1.10 -0.112 -0.90 -0.100 -0.76 -0.038 -0.29 -0.116 -1.17
Panel B: Six-factor Model Estimates for High Sentiment ESG Factor
ESG1 ESG2 ESG3 ESG4 ESG5
Parameter Estimate t-value Estimate t-value Estimate t-value Estimate t-value Estimate t-value
Alpha 0.093 0.79 0.139 1.07 0.171 1.11 0.178 1.23 0.188 1.62
Market -0.090 -2.63 -0.050 -1.36 -0.094 -2.10 -0.092 -2.53 -0.076 -2.47
SMB 0.176 2.99 0.084 1.27 0.194 2.72 0.115 1.58 0.172 2.57
UMD -0.032 -0.64 -0.086 -2.66 -0.077 -1.21 -0.104 -2.54 -0.112 -2.01
HML -0.133 -2.40 -0.203 -2.63 -0.141 -1.63 -0.299 -3.39 -0.230 -3.24
RMW 0.207 2.51 0.250 2.73 0.317 2.84 0.278 2.74 0.257 2.69
CMA -0.252 -2.37 -0.259 -1.97 -0.365 -2.59 -0.222 -1.88 -0.234 -2.13
ESG1-ESG5 factors are defined in the Appendix. Data span the period from 1st of January 2009 to 30th of June 2018 and are measured monthly. The number of
data points is 114 monthly observations. The table shows estimates where the dependent variable is each month the return on the ESG factor and independent
variables are factor-mimicking portfolios for market (Market), size (SMB), momentum (UMD), value (HML), profitability (RMW) and investment (CMA). Alpha
is the excess return earned by the ESG portfolio after accounting for the other factors.

Electronic copy available at: https://ssrn.com/abstract=3265502
49
Table 8
Panel A: Four-factor Model Estimates for Low Sentiment ESG Factor by Firm Size
Size Small Medium Large
Parameter Estimate t-value Estimate t-value Estimate t-value
Alpha 0.456 1.88 0.361 2.23 0.259 1.68
Market -0.109 -1.20 -0.067 -1.23 -0.035 -0.64
SMB 0.136 0.98 0.104 1.33 -0.020 -0.31
UMD -0.096 -0.50 -0.031 -1.07 -0.118 -2.75
HML -0.117 -0.94 -0.074 -1.23 -0.024 -0.29
Panel B: Four-factor Model Estimates for Low Sentiment ESG Factor by Market-to-Book Ratio
Market-to-Book Value Neutral Growth
Parameter Estimate t-value Estimate t-value Estimate t-value
Alpha 0.588 3.05 0.071 0.48 0.418 1.93
Market -0.007 -0.11 0.018 0.39 -0.045 -0.62
SMB -0.068 -0.73 -0.133 -2.37 0.183 1.89
UMD -0.098 -1.87 -0.073 -2.25 -0.003 -0.04
HML -0.053 -0.73 -0.003 -0.04 0.026 0.19
ESG1-ESG5 factors are defined in the Appendix. Data span the period from 1st of January 2009 to 30th of June 2018 and are measured monthly. The number of
data points is 114 monthly observations. The table shows estimates where the dependent variable is each month the return on the ESG factor and independent
variables are factor-mimicking portfolios for market (Market), size (SMB), momentum (UMD) and value (HML). In Panel A (B) the sample is split in terciles
according to beginning of month market capitalization (market-to-book ratio). Alpha is the excess return earned by the ESG portfolio after accounting for the other
factors.
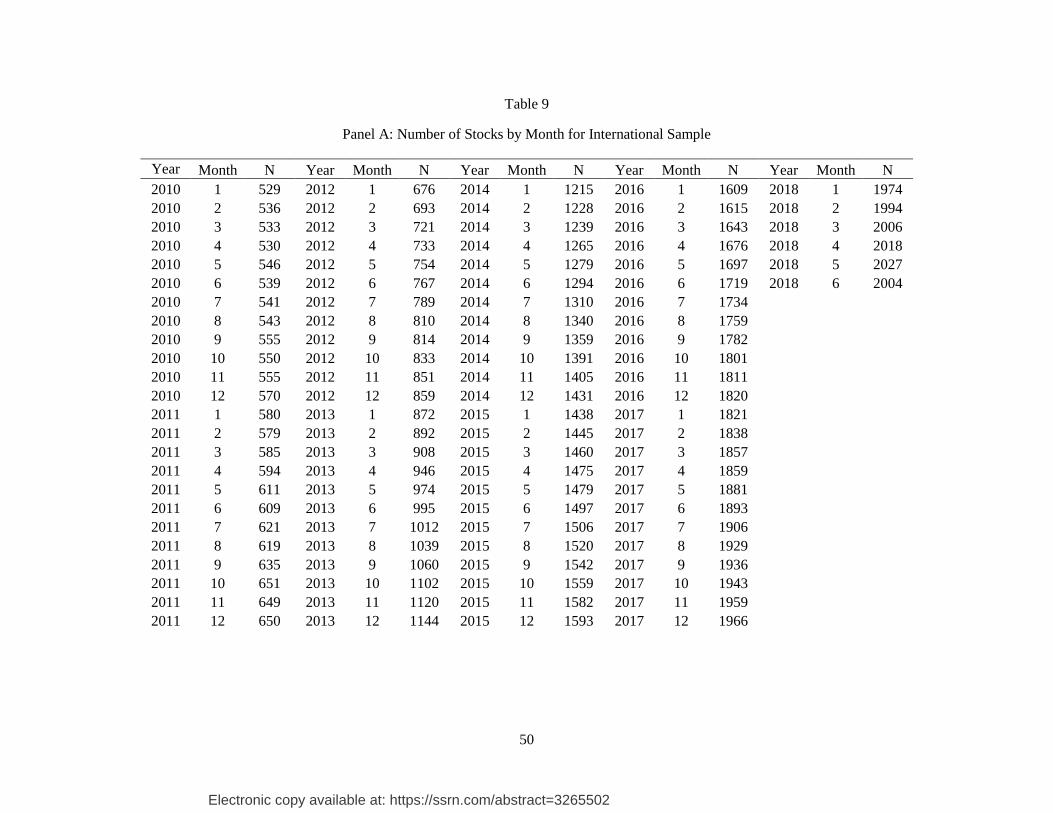
Electronic copy available at: https://ssrn.com/abstract=3265502
50
Table 9
Panel A: Number of Stocks by Month for International Sample
Year Month N Year Month N Year Month N Year Month N Year Month N
2010 1 529 2012 1 676 2014 1 1215 2016 1 1609 2018 1 1974
2010 2 536 2012 2 693 2014 2 1228 2016 2 1615 2018 2 1994
2010 3 533 2012 3 721 2014 3 1239 2016 3 1643 2018 3 2006
2010 4 530 2012 4 733 2014 4 1265 2016 4 1676 2018 4 2018
2010 5 546 2012 5 754 2014 5 1279 2016 5 1697 2018 5 2027
2010 6 539 2012 6 767 2014 6 1294 2016 6 1719 2018 6 2004
2010 7 541 2012 7 789 2014 7 1310 2016 7 1734
2010 8 543 2012 8 810 2014 8 1340 2016 8 1759
2010 9 555 2012 9 814 2014 9 1359 2016 9 1782
2010 10 550 2012 10 833 2014 10 1391 2016 10 1801
2010 11 555 2012 11 851 2014 11 1405 2016 11 1811
2010 12 570 2012 12 859 2014 12 1431 2016 12 1820
2011 1 580 2013 1 872 2015 1 1438 2017 1 1821
2011 2 579 2013 2 892 2015 2 1445 2017 2 1838
2011 3 585 2013 3 908 2015 3 1460 2017 3 1857
2011 4 594 2013 4 946 2015 4 1475 2017 4 1859
2011 5 611 2013 5 974 2015 5 1479 2017 5 1881
2011 6 609 2013 6 995 2015 6 1497 2017 6 1893
2011 7 621 2013 7 1012 2015 7 1506 2017 7 1906
2011 8 619 2013 8 1039 2015 8 1520 2017 8 1929
2011 9 635 2013 9 1060 2015 9 1542 2017 9 1936
2011 10 651 2013 10 1102 2015 10 1559 2017 10 1943
2011 11 649 2013 11 1120 2015 11 1582 2017 11 1959
2011 12 650 2013 12 1144 2015 12 1593 2017 12 1966

Electronic copy available at: https://ssrn.com/abstract=3265502
51
Panel B: Number of Companies-Month Observations by Stock Exchange Country
Exchange Country N % Exchange Country N %
Australia 11380 9.13 Malaysia 2399 1.93
Austria 784 0.63 Netherlands 1879 1.51
Belgium 697 0.56 New Zealand 898 0.72
China 2596 2.08 Norway 1329 1.07
Denmark 1353 1.09 Philippines 1060 0.85
Egypt 320 0.26 Poland 1032 0.83
Finland 1204 0.97 Singapore 2240 1.80
France 6216 4.99 South Africa 5303 4.26
Germany 7415 5.95 South Korea 4949 3.97
Greece 439 0.35 Spain 1941 1.56
Hong Kong 6406 5.14 Sweden 2421 1.94
India 4596 3.69 Switzerland 2978 2.39
Indonesia 1426 1.14 Taiwan 3942 3.16
Ireland 490 0.39 Thailand 1036 0.83
Israel 763 0.61 Turkey 1043 0.84
Italy 2170 1.74 United Arab Emirates 298 0.24
Japan 23081 18.52 United Kingdom 18519 14.86
Panel C: Summary Statistics for International Sample
Variable Mean Median Std Dev Interquartile Range
ESG Level 5.38 5.50 2.41 3.40
ESG Change 0.09 0.00 1.29 1.22
ESG Sentiment 61.22 63.23 16.93 22.24
ESG Sentiment Momentum 51.17 50.00 25.52 47.98
Log Market Cap 8.76 8.73 1.26 1.62
Log MTB 0.61 0.55 0.79 1.05

Electronic copy available at: https://ssrn.com/abstract=3265502
52
In Panel A, number of stocks is the number of stocks with available data from MSCI, TruValue Labs, and Compustat Global. The number of observations is
124,603 firm-month pairs. Panel B shows the number of observations by exchange country, the country that a company is traded in a stock exchange. In Panel C,
ESG level is the level of a firm’s ESG performance in each month as rated by MSCI’s industry-adjusted score. ESG change is the change in a firm’s ESG
performance in a given month, calculated as the difference from the previous MSCI rating and maintained at this value for the minimum of, until the score is
updated or 24 months. ESG sentiment is the Insight Score from TruValue Labs calculated as an exponentially-weighted moving average of daily sentiment scores
where the half-life of an event’s influence on the Insight score is 6 months. ESG Sentiment Momentum is TruValue Lab’s Momentum score which is derived from
the Insight Score and measured as the slope or trajectory over a trailing 12-month time (TTM) period. Log Market Cap is the natural logarithm of beginning of
month market capitalization in millions of USD. Log MTB is the natural logarithm of end of month market-to-book ratio. Data span the period from 1st of January
2010 to 30th of June 2018 and they are measured monthly.

Electronic copy available at: https://ssrn.com/abstract=3265502
53
Table 10
Summary Statistics for International Sample ESG Factor
ESG5 Low Sentiment ESG5 High Sentiment
Mean St Dev Mean St Dev
ESG Level
Short 3.14 1.57 3.15 1.58
Long 6.45 2.16 6.52 2.12
Diff 3.32 0.58 3.37 0.54
ESG Change
Short -0.92 1.09 -1.02 1.07
Long 1.09 1.00 0.90 1.11
Diff 2.01 -0.08 1.93 0.03
ESG Sentiment
Short 64.2 16.1 54.8 17.9
Long 57.4 16.7 66.7 15.1
Diff -6.8 0.6 11.9 -2.8
ESG Sentiment
Momentum
Short 72.7 14.6 30.9 15.5
Long 31.2 15.5 72.3 14.2
Diff -41.5 0.9 41.4 -1.3
Number of Stocks Short 154 172 Long 265 269
Long (short) portfolios comprise stocks in TOP (BOT). Diff is the difference between the value for the long and short portfolio. ESG level is the level of a firm’s
ESG performance in a given month as rated by MSCI’s industry-adjusted score. ESG change is the change in a firm’s ESG performance in a given month, calculated
as the difference from the previous MSCI rating and maintained at this value for the minimum of, until the score is updated or 24 months. ESG sentiment is the
Insight Score from TruValue Labs calculated as an exponentially-weighted moving average of daily sentiment scores where the half-life of an event’s influence on
the Insight score is 6 months. ESG Sentiment Momentum is TruValue Lab’s Momentum score which is derived from the Insight Score and measured as the slope
or trajectory over a trailing 12-month time (TTM) period. Number of stocks is the average number of stocks included in each portfolio across all months. Data span
the period from 1st of January 2010 to 30th of June 2018 and they are measured monthly. The number of observations is 124,603 firm-month pairs.

Electronic copy available at: https://ssrn.com/abstract=3265502
54
Table 11
Panel A: Raw Return and Four Factor Model Estimates for ESG5INT1 Factor
Geography All International
Sample Low Sentiment High Sentiment
Parameter Estimate t-value Estimate t-value Estimate t-value Estimate t-value
Alpha 0.429 2.85 0.570 3.59 -0.040 -0.30 0.022 0.14
Market -0.105 -2.73 -0.084 -1.64
SMB -0.126 -1.06 -0.044 -0.52
UMD -0.065 -0.82 -0.003 -0.04
HML 0.008 0.08 -0.021 -0.17
Panel B: Raw Return and Four Factor Model Estimates for ESG5INT2 Factor
Geography All International
Sample Low Sentiment High Sentiment
Parameter Estimate t-value Estimate t-value Estimate t-value Estimate t-value
Alpha 0.233 2.06 0.346 3.24 0.146 1.09 0.223 1.53
Market -0.108 -4.00 -0.098 -2.20
SMB -0.166 -2.02 -0.234 -2.45
UMD -0.020 -0.32 0.028 0.40
HML -0.018 -0.24 -0.147 -1.34
Portfolios are formed according to ESG5INT1 and ESG5INT2 factor, defined in the Appendix. Data span the period from 1st of January 2010 to 30th of June 2018
and are measured monthly. The number of data points is 102 monthly observations. The table shows estimates of models where the dependent variable is for each
month the return on the ESG factor and independent variables are factor-mimicking portfolios for market (Market), size (SMB), momentum (UMD) and value
(HML). The estimates on the factor-mimicking portfolios are sourced from Ken French’s website and they represent the estimates for the global excluding the US
universe of stocks. Alpha is the excess return earned by the ESG portfolio after accounting for the other factors. Before the four-factor model the table shows the
average monthly raw return and the t-statistic measuring whether it is significantly different from zero. Panels A and B show results for all international firms in
the sample split by low and high ESG sentiment.