public sector trends report - ipa
TRANSCRIPT
Research Paper Nº8
Public Sector Trends 2012
State of the Public Service Series
November 2012
Richard Boyle
0
120
100
80
60
40
20
0
10%
20%
30%
40%
50%
60%
70%
80%
90%
100%

1
Public Sector Trends 2012
State of the Public Service Series
November 2012
Research Paper Nº8
Public Sector Trends 2012Richard Boyle

2
Public Sector Trends 2012

3
Public Sector Trends 2012
Foreword 4
Main findings 5
1. Introduction 9
2. The size and cost of the public sector 11
3. The quality of public administration 21
4. Public service efficiency and performance 27
5. Trust and confidence in public administration 42
6. Conclusion 46
References 47
Appendix 1 Indicators used to make up the Public Administration Quality indicator 48
Contents
Dr. Richard Boyle is Head of Research, Publishing and Corporate Relations with the Institute of Public
Administration. He has written extensively on public service reform and on the evaluation of public services.

4
Public Sector Trends 2012
In the State of the Public Service research series, we seek to provide evidence-informed research and commentary
on key aspects of contemporary Irish public administration. The authors of these reports bring their considerable
expertise and practical knowledge to the topics selected so as to provide evidence, insights and recommendations to
support future development. Our aim is that these reports will not only inform, but also challenge current thinking
about how the Irish public service performs. It is intended that these short research reports will be of relevance and
use not only to public servants, but also to policy makers and the wider public.
This report examines trends in public sector development and is the third in our annual series. The intention is
to help inform the debate on Ireland’s public sector and public administration, and its role in Irish society. There
has been much talk recently about the continued relevance of the Public Service (Croke Park) Agreement and the
role and efficiency of public servants. Much of the discussion takes place based on anecdote, without accessing
information on how the public sector is performing and how it compares internationally.
Here we try to bring some evidence to bear on the important debate on the future shape and size of the public
sector. Using data gathered from a number of sources, information on the size and cost of the public sector, the
quality of public administration, efficiency and performance, and levels of trust and confidence is presented in a
simple but rigorous manner.
Foreword
Brian CawleyDirector GeneralInstitute of Public Administration

5
Public Sector Trends 2012
Main findings
In terms of overall performance, the data presented in this paper would tend to suggest that the quality of Ireland’s public
administration remains close to the average for the European Union. Indeed, there are some signs that aspects of quality
are seen as having improved in recent times. This is a notable achievement for a small state such as Ireland, especially at
a time of reducing numbers of public servants and limited resources available for public services.
The size and cost of the public sector
• From 2008 to 2010, as GDP shrank as a result of the recession in Ireland, Ireland’s government expenditure as a
percentage of GDP increased rapidly. In 2011, however, expenditure as a percentage of GDP dropped to 48.1 per cent,
just a little below the European average. Using GNI (gross national income) rather than GDP, the size of the public sector
has been above the EU average since 2008. In 2011 government expenditure as a percentage of GNI was 59.1 per cent.
This is the highest level in the EU, above Denmark at 57.9 per cent of GDP.
• Public expenditure per head of population, which had been growing significantly faster than the EU average up to
2010, fell back in 2011. It is still above the European average, but is now closer to the average.
• There has been a significant drop in the numbers employed in both the public sector and public service from 2008,
with a drop of around 8 per cent in each case. Numbers employed in the public sector and public service in 2012 are
now back down to close to 2005 levels of employment.
• Two out of every three people employed in the public service work in either health or education. In 2012, there were
approximately 102,000 people employed in the health sector and 92,000 people employed in the education sector.
• Numbers have fallen in all sectors since 2008. The biggest drop proportionally has been in the non commercial state
agencies (19 per cent), local authorities (14 per cent) and the justice sector (13 per cent). The smallest drop proportionally
has been in the education sector (3 per cent).
• A growing population and shrinking public workforce mean that public sector employees per 000 population has
been dropping since 2008 and is at 73.6 public sector employees per 000 population in 2012. Public service employment
is around 65.5 public servants per 000 population.
• The Exchequer pay and pensions bill reached a peak of €18.753bn in 2008. From 2008 to 2012, as the cutbacks in
numbers and pay introduced by the Government have taken effect, the Exchequer pay and pensions bill has decreased
to €16.904bn in 2012.
• While the Exchequer pay bill has continued to decrease each year from 2008, the Exchequer pensions bill has increased,
from €1.656bn in 2008 to €2.502bn in 2012.
• The health and education sectors account for the vast majority of the Exchequer pay bill. In 2012, the health pay bill
(€5.986bn) was 41.6 per cent of the total and the education pay bill (€4.846bn) 33.6 per cent of the total.
• The non-commercial state-sponsored bodies share of the Exchequer pay bill has fallen significantly between 2002 and
2012, from 4.3 per cent to 2.7 per cent.

6
Public Sector Trends 2012
The quality of public administration
• Surveys of business executives show that the quality of Ireland’s public administration is seen as above the European
average. Ireland’s score on a quality of public administration index increased slightly in 2012 compared to European
averages. Ireland came 5th of the EU27 on this indicator in 2012. Ireland’s ranking on this quality indicator tends to have
been slightly above the EU15 average and well above the EU27 average over the last decade. The Nordic countries lead
the way, with Finland, Sweden and Denmark being the top three ranked for the last five years.
• Ireland’s score on an indicator ranking the upholding of traditional public service values such as independence from
political interference, freedom from bribery and corruption, and reliability and administrative fairness improved in 2012.
So too did Ireland’s score on an indicator assessing the encouragement of competition and provision of a supportive
regulatory environment. In 2012, Ireland ranked 3rd of the EU27, behind Sweden and Finland, improving from 6th in
2011.
• The World Bank produces an annual composite indicator of government effectiveness. Ireland’s government effectiveness
score was slightly above the EU15 average from 2005 to 2008, but declined over that time period, and in 2009 fell below
the EU15 average. It stabilised in 2010 (the latest year for which information is available on this indicator) when Ireland
ranked 12th of the EU27.
• Against the World Bank regulatory quality indicator, Ireland’s score remained well above the European average in
2010. However, in 2008, Ireland ranked first of all EU countries on this indicator. The impact of the regulatory problems
identified in the financial sector in 2009 clearly impacted on the indicator, and Ireland dropped to 7th ranked European
country on this indicator in 2010, with Denmark now having the highest ranking.
Public service efficiency and performance
• Surveys of business executives show that Ireland is seen as relatively un-bureaucratic when it comes to dealing with
businesses. Only in Sweden, Finland, Denmark and Estonia is bureaucracy seen as less of a hindrance to business activity.
• The same opinion surveys show that there is a perception that the composition of government spending is wasteful.
However, Ireland’s score on this wastefulness indicator has improved over the last two years and is now close to the EU27
average score, with Ireland ranking 13th of the EU27 on this indicator.
• Perceptions that government decisions are effectively implemented in Ireland have improved in the last two years,
after getting worse for a number of years before that.
• Overall, Ireland continues to do relatively well amongst EU countries against World Bank indicators that assess the
impact of public administration on the ability of companies to do business. The efficiency of the tax regime comes out
particularly strongly.
• Ireland is close to, but generally just below, the EU27 average with regard to how changes in public services to
businesses to support innovation in recent years are concerned. Ireland scores quite well with regard to providing options
to complete government forms over the internet and providing access to information on government services over the
internet. But Ireland is rated relatively poorly with regard to issues such as reductions in time required to obtain permits
or licenses, faster response times and securing reductions in financial costs to companies.

7
Public Sector Trends 2012
• While Ireland is close to the EU27 average with regard to perceived public service support for innovation in businesses,
Ireland scores relatively well with regard to the perceived quality of services provided to support businesses being innovative.
The provision of high quality information and advice and accessibility of that information and advice are ranked particularly
highly.
• In terms of high-level sectoral outcomes, taking education first, Ireland’s scores worsened between 2006 and 2009
in terms of educational attainment, particularly in maths. But the competitive advantage of our education system is
perceived to have improved in 2011 and 2012; Ireland ranked third European country on this indicator in 2012, behind
Finland and Denmark.
• In health, life expectancy and child mortality are around the European average. Similarly against a ‘basket’ of outcomes
assessed by the Euro Health Consumer Index, Ireland performs around the EU15 average. As with most other European
countries, Ireland improved its score on this health outcomes index between 2009 and 2012. Sweden, the Netherlands
and Finland achieve the top three rankings on this index.
Trust and confidence in public administration
• There have been dramatic shifts in the level of trust in government in Ireland. From 2008 to 2010 levels of trust in
government fell significantly. In autumn 2010, Ireland expressed the lowest level of trust in government of any of the
EU27 (10 per cent). By spring 2011, the level of public trust had increased significantly to 42 per cent expressing trust
in the Irish government, close to the EU15 average. But this fell back to 22 per cent by autumn 2011 and 24 per cent in
spring 2012.
• Trust in parliament displays a similar pattern to trust in government, dropping to an all time low of 12 per cent in 2010
and recovering to 39 per cent in spring 2011. This level of trust fell again to 21 per cent in autumn 2011, and increased
slightly to 24 per cent in spring 2012. The Nordic countries of Sweden, Denmark and Finland display the highest levels
of trust in their national parliaments.
• Trust in regional and local authorities in Ireland is low. The level of trust in regional and local authorities in Ireland
was at 26 per cent in 2011, down from 40 per cent in 2008. It increased slightly to 30 per cent in spring 2012. This is
one of the lowest levels of trust in the EU. Only Greece, Italy and Spain report lower levels of trust in regional and local
authorities in 2012.

8
Public Sector Trends 2012
Conclusions
• Numbers employed in the public sector continue to fall. As a percentage of total employment, public service numbers
are not excessive by European standards. As the population continues to increase (placing increasing demands on public
services) and as numbers are reduced further to meet fiscal and economic targets, the challenge of maintaining services
and the skills and capacity needed to provide those services increases. This focuses particular attention on the need for
process improvement to enhance efficiencies and for reducing programme expenditure in some areas (not only more for
less but also less for less).
• The local authority and justice sectors have been particularly hit by staffing reductions. Capacity development in these
areas is of pressing concern.
• The Exchequer pay bill continues to decline from its high in 2008. But the pensions bill is increasing as numbers leaving
and taking early retirement impact on the bill. The need for fiscal discipline to be maintained in these areas remains.
• Given the reductions in numbers and public expenditure, perceptions of the quality of public administration have held
up remarkably well. Irish public services are seen as relatively un-bureaucratic compared to most European countries. The
quality of services to businesses is ranked relatively highly. There is much of Irish public service provision that is seen in a
positive light despite the challenges being faced.
• Trust in government and parliament remains fragile, and trust in local government is low. Much remains to be done
to re-build and maintain the trust of the Irish people in government.
9
Public Sector Trends 2012
There are no clear or agreed definitions for comparative ranking of public administrations. But most people would agree
that a number of elements need to be included in any assessment:
• The size and cost of the public sector. While size and cost alone are not the sole or even main determinants of
good public administration, nevertheless in terms of value for money in the delivery of public services, keeping check on
the size and cost of the public sector and public service is an important consideration.
• Thequalityofpublicadministration. Public administration includes policy making, policy legislation and management
of the public sector. Such dimensions of public administration can only be measured by subjective indicators of quality
which give a sense of how good the public administration is.
• Publicserviceefficiencyandperformance. There is an onus on public administration, all the more so in times of
financial stringency, to show that services are being provided efficiently and that performance is of the highest standard.
The delivery of social and economic outcomes in an efficient manner is central to an effective public administration.
• Trustandconfidenceinpublicadministration. The general public ultimately must have trust and confidence in
the public administration of a country if it is to be effective.
In this study we examine indicators for each of these four elements of public administration. Where possible and
appropriate, data is included for other European countries, to enable comparisons to be made. Also, where data are
available, we have provided trend data going back over the last decade. The intention is to provide a snapshot of trends
in public administration performance in Ireland, to highlight where we are doing well and what challenges are presented
and where improvements need to be made.
In a number of charts, as well as showing Ireland’s rating relative to the EU15 and EU27 averages, the top ranked and
bottom ranked country at the most recent data gathering are included for comparative purposes.
In its style and content, the report draws on a number of efforts to benchmark and compare public sector efficiency
and performance. These include a European Central Bank (ECB) international comparison of public sector efficiency1, a
study by the Netherlands Social and Cultural Planning Office (SCP) of comparative public sector performance2, the World
Bank governance indicators project3, the OECD Government at a Glance project4, and an IPA study comparing public
administrations5.
1. Introduction
1 Afonso et al (2003)2 Social Cultural and Planning Office (2004) 3 See http://info.worldbank.org/governance/wgi/index.asp 4 See http://www.oecd.org/gov/indicators/govataglance5 Boyle (2007)
10
Public Sector Trends 2012
A word of caution about data limitations
The data presented here needs to be interpreted with great care. First, there is the issue of whether the indicators used
to represent public administration provision and quality really captures what public service is about. Indicators, by their
nature, only give a partial picture. Second, much of the international comparative data in this report is qualitative data
derived from opinion surveys. This survey data comprises small-scale samples of opinion from academics, managers and
experts in the business community. The survey data is thus limited both in terms of its overall reliability and the fact that
it represents the views of limited sections of the community. Third, the point scores arrived at on some indicators (on a
scale from 1–10 for the IMD and WEF data and between –2.5 and +2.5 for the World Bank governance indicators) should
not be interpreted too strictly, as there are margins of error associated with these estimates. Fourth, changes over time
should be viewed cautiously. Many of the indicators assessed represent ‘snapshots’ at one particular point in time. Small
shifts in annual ranking are not particularly meaningful.
In all, when interpreting the findings set out in this paper, these limitations should be borne in mind. In particular, small
variations in scores should be interpreted cautiously. These may be no more than random variations to be expected given
the data being used. What is of interest is to identify broad patterns emerging from the data.
11
Public Sector Trends 2012
There are a range of indicators that show the size and cost of the public sector and public service6. Government expenditure
as a share of GDP/GNI7, level of public expenditure per head of population and public sector employment trends all give
a sense of size. The cost of the public sector is shown by data on the Exchequer pay and pensions bill.
2. The size and cost of the public sector
6 In this study, the public service is defined as the public sector minus the commercial state-sponsored bodies.7 Gross National Income (GNI) is equal to Gross National Product (GNP) plus EU subsidies less EU taxes. The relationship between GDP and GNI in Ireland is
unusual among EU countries, with Luxembourg the only other country where the difference between the two measures is more than 10% of GDP.
The gap reflects the magnitude of repatriated profits from Ireland that inflates the GDP figure.
12
Public Sector Trends 2012
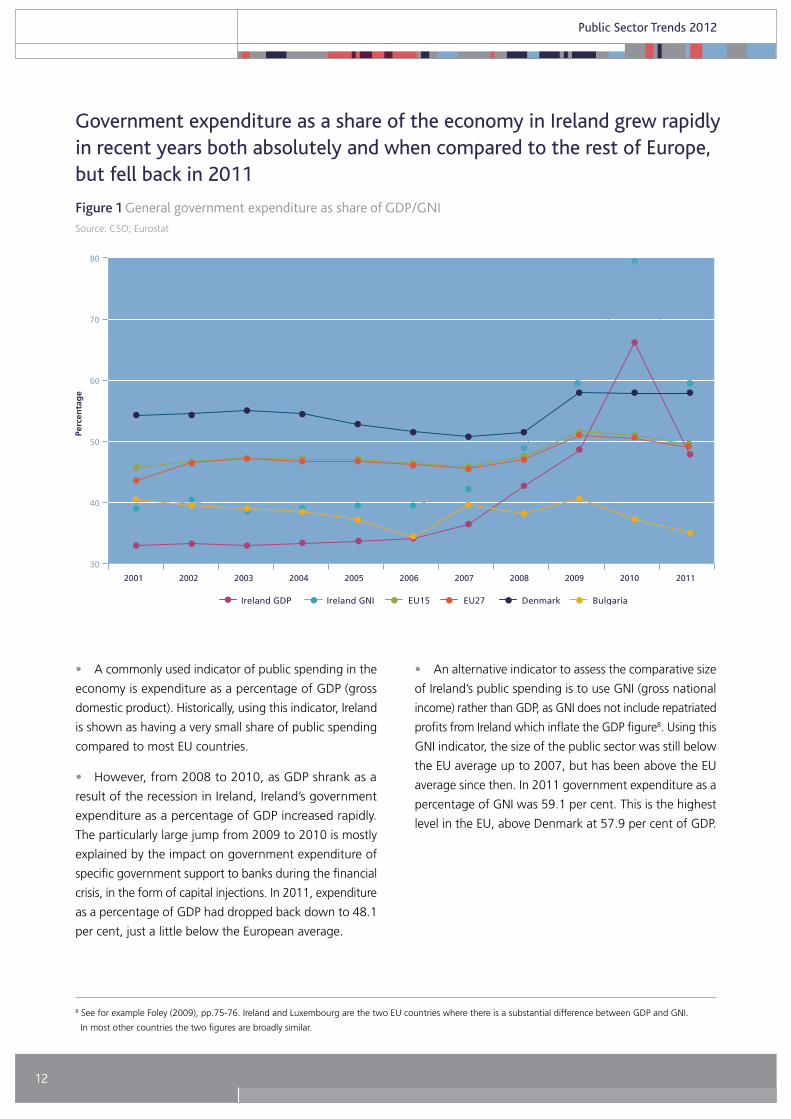
Government expenditure as a share of the economy in Ireland grew rapidly in recent years both absolutely and when compared to the rest of Europe, but fell back in 2011
Source: CSO; Eurostat
Figure 1 General government expenditure as share of GDP/GNI
8 See for example Foley (2009), pp.75-76. Ireland and Luxembourg are the two EU countries where there is a substantial difference between GDP and GNI.
In most other countries the two figures are broadly similar.
• A commonly used indicator of public spending in the
economy is expenditure as a percentage of GDP (gross
domestic product). Historically, using this indicator, Ireland
is shown as having a very small share of public spending
compared to most EU countries.
• However, from 2008 to 2010, as GDP shrank as a
result of the recession in Ireland, Ireland’s government
expenditure as a percentage of GDP increased rapidly.
The particularly large jump from 2009 to 2010 is mostly
explained by the impact on government expenditure of
specific government support to banks during the financial
crisis, in the form of capital injections. In 2011, expenditure
as a percentage of GDP had dropped back down to 48.1
per cent, just a little below the European average.
• An alternative indicator to assess the comparative size
of Ireland’s public spending is to use GNI (gross national
income) rather than GDP, as GNI does not include repatriated
profits from Ireland which inflate the GDP figure8. Using this
GNI indicator, the size of the public sector was still below
the EU average up to 2007, but has been above the EU
average since then. In 2011 government expenditure as a
percentage of GNI was 59.1 per cent. This is the highest
level in the EU, above Denmark at 57.9 per cent of GDP.
13
Public Sector Trends 2012
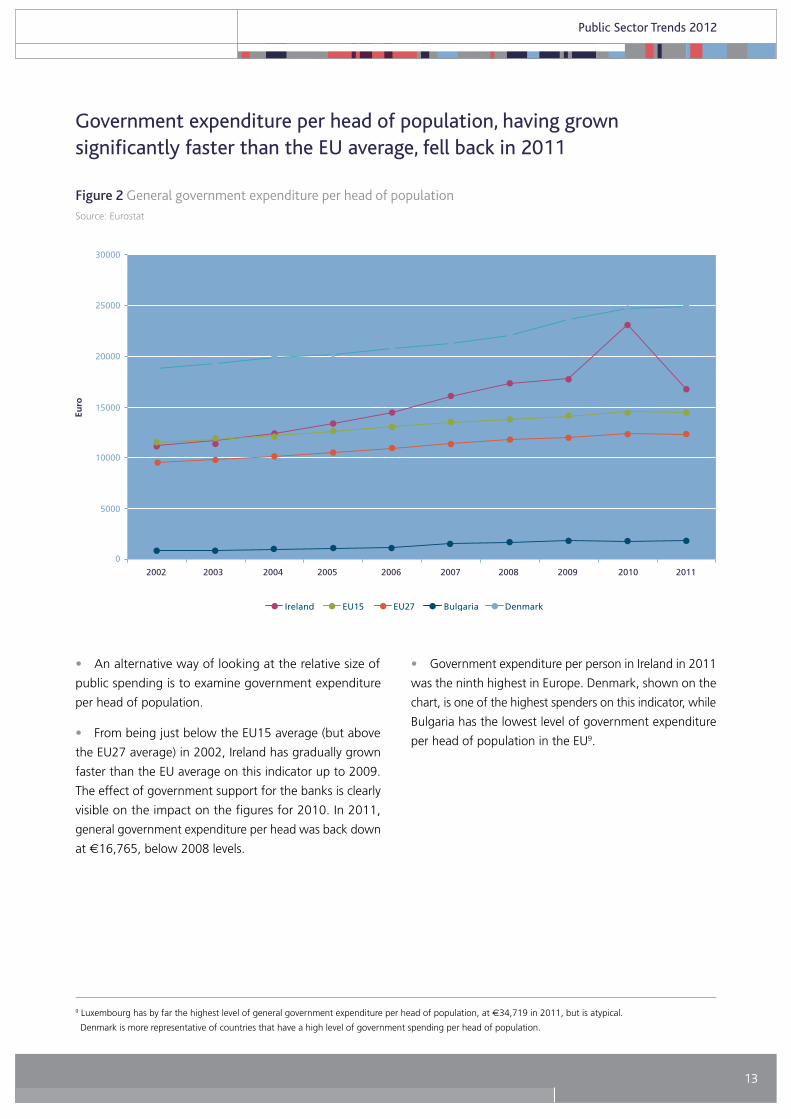
Government expenditure per head of population, having grown significantly faster than the EU average, fell back in 2011
9 Luxembourg has by far the highest level of general government expenditure per head of population, at €34,719 in 2011, but is atypical.
Denmark is more representative of countries that have a high level of government spending per head of population.
Source: Eurostat
Figure 2 General government expenditure per head of population
• An alternative way of looking at the relative size of
public spending is to examine government expenditure
per head of population.
• From being just below the EU15 average (but above
the EU27 average) in 2002, Ireland has gradually grown
faster than the EU average on this indicator up to 2009.
The effect of government support for the banks is clearly
visible on the impact on the figures for 2010. In 2011,
general government expenditure per head was back down
at €16,765, below 2008 levels.
• Government expenditure per person in Ireland in 2011
was the ninth highest in Europe. Denmark, shown on the
chart, is one of the highest spenders on this indicator, while
Bulgaria has the lowest level of government expenditure
per head of population in the EU9.

14
Public Sector Trends 2012
Numbers employed in the public sector and the public service continue to decline
Source: Department of Finance, Budgetary and Economic Statistics
Figure 3 Numbers employed in the public sector and public service
• The total number of people employed in the public
sector grew from around 317,000 in 2001 to 360,000 in
2008, a growth of 14 per cent.
• Excluding commercial state-sponsored bodies, the
numbers employed in the public service grew from 270,000
in 2000 to 320,000 in 2008, a growth of 19 per cent.
• There has been a significant drop in the numbers
employed in both the public sector and public service from
2008, with a drop of around 8 per cent in each case.
• Numbers employed in the public sector and public
service in 2012 are now back down to close to 2005 levels
of employment.

15
Public Sector Trends 2012
The health and education sectors continue to account for the vast majority of public sector jobs
Source: Department of Finance, Budgetary and Economic Statistics
Figure 4 Public sector employment by sector
• Growth in public sector numbers from 2001 to 2008
was primarily concentrated in the health and education
sectors.
• Two out of every three people employed in the public
service work in either health or education. In 2012, there
were approximately 102,000 people employed in the health
sector and 92,000 people employed in the education sector.
• Numbers have fallen in all sectors since 2008. The
biggest drop proportionally has been in the non commercial
state agencies (19 per cent), local authorities (14 per cent)
and the justice sector (13 per cent). The smallest drop
proportionally has been in the education sector (3 per
cent).
• Those employed in non-commercial state-sponsored
bodies (so called quangos) account for under 4 per cent
of the public service workforce.
16
Public Sector Trends 2012
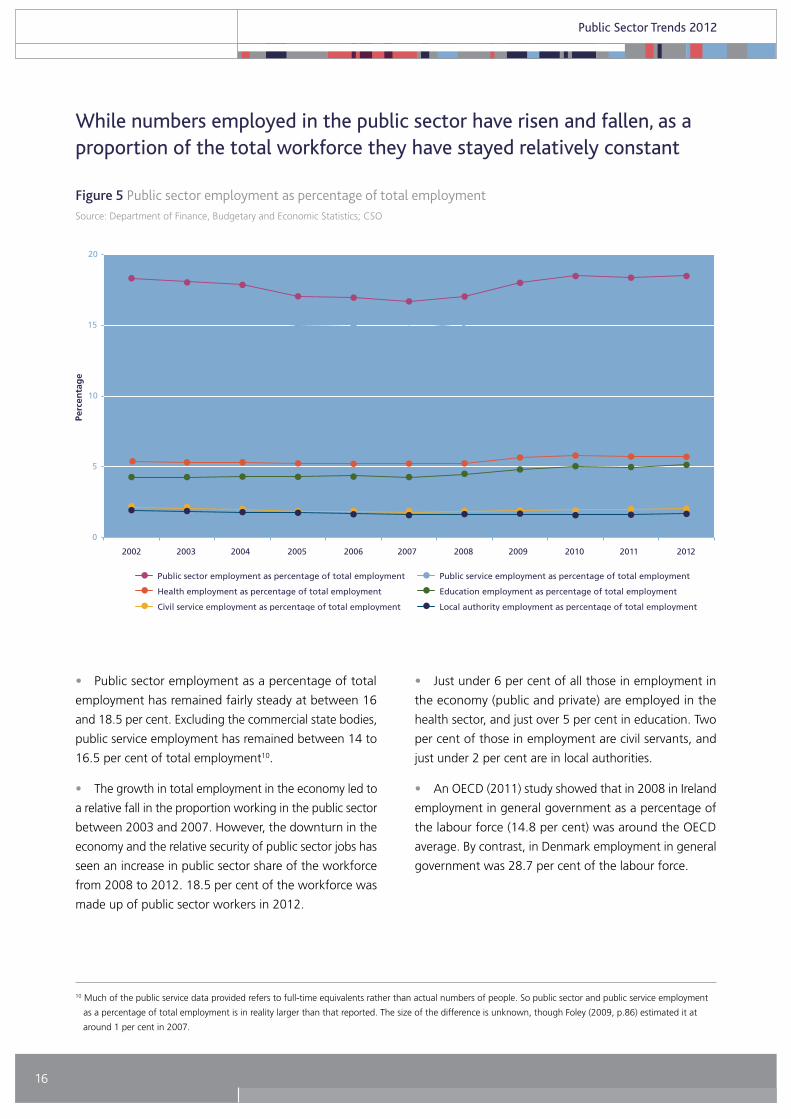
While numbers employed in the public sector have risen and fallen, as a proportion of the total workforce they have stayed relatively constant
Source: Department of Finance, Budgetary and Economic Statistics; CSO
Figure 5 Public sector employment as percentage of total employment
10 Much of the public service data provided refers to full-time equivalents rather than actual numbers of people. So public sector and public service employment
as a percentage of total employment is in reality larger than that reported. The size of the difference is unknown, though Foley (2009, p.86) estimated it at
around 1 per cent in 2007.
• Public sector employment as a percentage of total
employment has remained fairly steady at between 16
and 18.5 per cent. Excluding the commercial state bodies,
public service employment has remained between 14 to
16.5 per cent of total employment10.
• The growth in total employment in the economy led to
a relative fall in the proportion working in the public sector
between 2003 and 2007. However, the downturn in the
economy and the relative security of public sector jobs has
seen an increase in public sector share of the workforce
from 2008 to 2012. 18.5 per cent of the workforce was
made up of public sector workers in 2012.
• Just under 6 per cent of all those in employment in
the economy (public and private) are employed in the
health sector, and just over 5 per cent in education. Two
per cent of those in employment are civil servants, and
just under 2 per cent are in local authorities.
• An OECD (2011) study showed that in 2008 in Ireland
employment in general government as a percentage of
the labour force (14.8 per cent) was around the OECD
average. By contrast, in Denmark employment in general
government was 28.7 per cent of the labour force.

17
Public Sector Trends 2012
Public sector employment continues to decline relative to the total population
Source: Department of Finance, Budgetary and Economic Statistics; CSO
Figure 6 Public sector and public service employment per 000 population
• Public sector employment relative to the population
was relatively stable at between 80 and 85 public sector
employees per 000 population, but has been dropping
since 2008 and was at 73.6 public sector employees per
000 population in 2012.
• Public service employment is around 65.5 public servants
per 000 population in 2012, also showing a significant
decline from 2008.
• An OECD (2010) study comparing 8 countries (Denmark,
Sweden, Finland, the UK, Canada, Ireland, the Netherlands
and New Zealand) showed that Ireland had the third lowest
general government employment per 000 population (67)
in 2006, and significantly behind Denmark (137), Sweden
(125) and Finland (99).
18
Public Sector Trends 2012
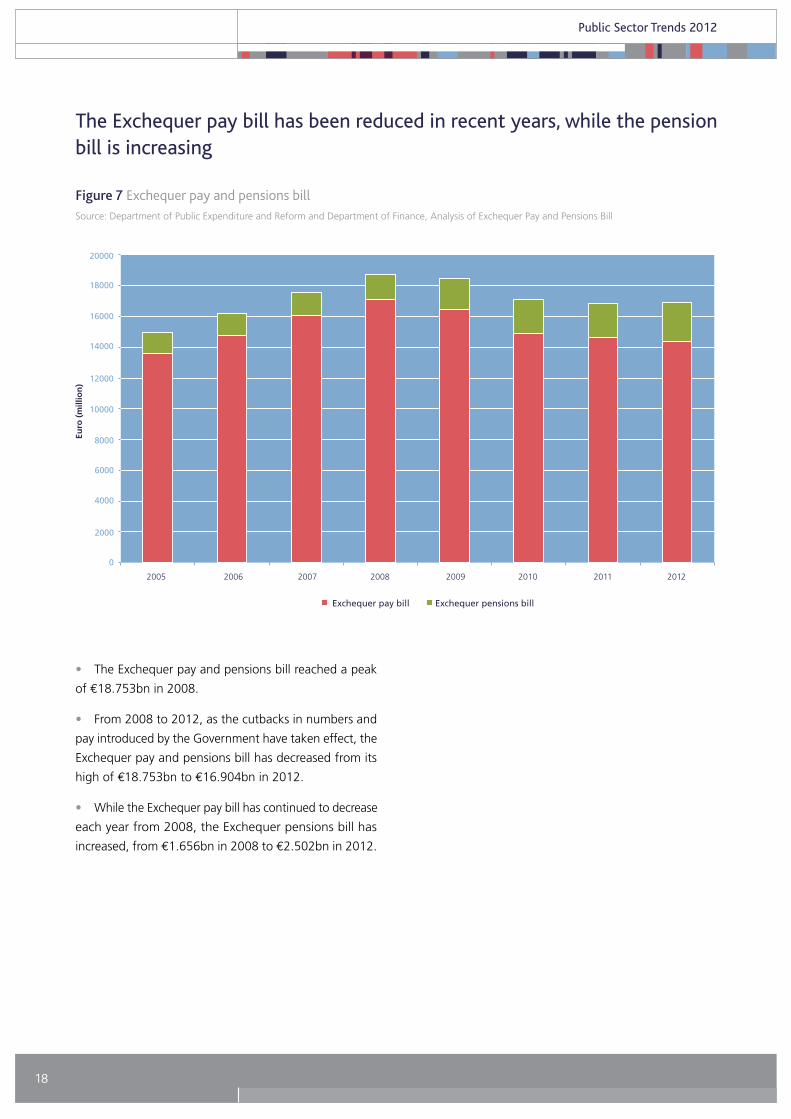
The Exchequer pay bill has been reduced in recent years, while the pension bill is increasing
Source: Department of Public Expenditure and Reform and Department of Finance, Analysis of Exchequer Pay and Pensions Bill
Figure 7 Exchequer pay and pensions bill
• The Exchequer pay and pensions bill reached a peak
of €18.753bn in 2008.
• From 2008 to 2012, as the cutbacks in numbers and
pay introduced by the Government have taken effect, the
Exchequer pay and pensions bill has decreased from its
high of €18.753bn to €16.904bn in 2012.
• While the Exchequer pay bill has continued to decrease
each year from 2008, the Exchequer pensions bill has
increased, from €1.656bn in 2008 to €2.502bn in 2012.

19
Public Sector Trends 2012
Exchequer pay and pensions as a percentage of GDP/GNP rose rapidly from 2007 to 2009 but has now stabilised
Source: Department of Public Expenditure and Reform and Department of Finance, Analysis of Exchequer Pay and Pensions Bill
Figure 8 Exchequer pay and pensions bill as percentage of GDP/GNP
• Up to 2007, despite the increase in the Exchequer pay
and pensions bill, as a percentage of GDP and GNP it had
held relatively steady, at around 9 per cent of GDP and
10-11 per cent of GNP.
• In 2008 and 2009, as the recession hit, the percentage
of GDP and GNP taken up by the Exchequer pay and
pensions bill rose rapidly. In 2009, the Exchequer pay and
pensions bill accounted for 11.6 per cent of GDP and 14.1
per cent of GNP.
• The effects of the cutbacks in numbers and pay rates
introduced in 2009 is having an impact, with a fall back in
the percentage of GDP and GNP taken up by the Exchequer
pay and pensions bill in 2010 and 2011 (10.6 per cent of
GDP and 13.3 per cent of GNP in 2011).
20
Public Sector Trends 2012
The health and education sectors account for the major share of the Exchequer pay bill
Source: Department of Public Expenditure and Reform and Department of Finance, Analysis of Exchequer Pay and Pensions Bill
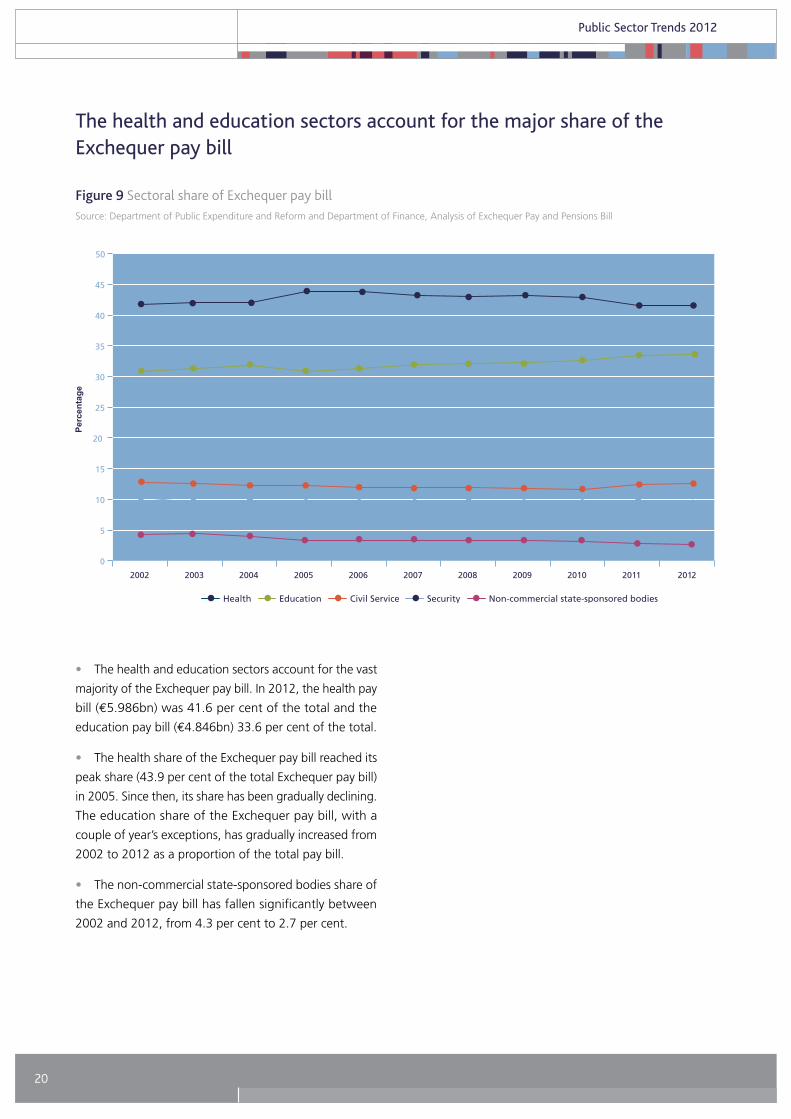
Figure 9 Sectoral share of Exchequer pay bill
• The health and education sectors account for the vast
majority of the Exchequer pay bill. In 2012, the health pay
bill (€5.986bn) was 41.6 per cent of the total and the
education pay bill (€4.846bn) 33.6 per cent of the total.
• The health share of the Exchequer pay bill reached its
peak share (43.9 per cent of the total Exchequer pay bill)
in 2005. Since then, its share has been gradually declining.
The education share of the Exchequer pay bill, with a
couple of year’s exceptions, has gradually increased from
2002 to 2012 as a proportion of the total pay bill.
• The non-commercial state-sponsored bodies share of
the Exchequer pay bill has fallen significantly between
2002 and 2012, from 4.3 per cent to 2.7 per cent.
21
Public Sector Trends 2012
An indicator of the quality of public administration, based on work undertaken by the Social and Cultural Planning Office
(2004) in the Netherlands and taken further by Boyle (2007) is used to assess the quality of public administration. Sixteen
indicators derived from both IMD and WEF executive opinion surveys are combined to make up an aggregate public
administration quality indicator (see Appendix 1 for details)11. It is complemented by two subsets of this indicator, one of
which shows trends in perception about the application of traditional public service values in public administration, the
other showing perceptions of the type of competitive and regulatory regime fostered by public administration.
These indicators are supplemented by World Bank indicators of government effectiveness and regulatory quality, developed
as part of the World Bank’s brief to promote good governance.
3. The quality of public administration
11 This quality of public administration indicator was developed by the IPA and has been used internationally, notably in work for the Hong Kong administration
benchmarking their public service.

22
Public Sector Trends 2012
The quality of Irish public administration is seen as above the European average and has improved comparatively over the last couple of years
Source: IPA analysis based on IMD and WEF data
Figure 10 Quality of public administration score 2003-2012
• Ireland’s score on the quality of public administration
index increase slightly in 2012 compared to European
averages. Ireland came 5th of the EU27 on this indicator
in 2012.
• Ireland’s ranking on this quality indicator tends to have
been slightly above the EU15 average and well above the
EU27 average over the last decade.
• The Nordic countries lead the way, with Finland, Sweden
and Denmark being the top three ranked for the last five
years.
23
Public Sector Trends 2012
Irish maintenance of traditional public service values is seen to be around the EU15 average
Source: IPA analysis based on IMD World Competitiveness Yearbook and WEF Global Competitiveness Report
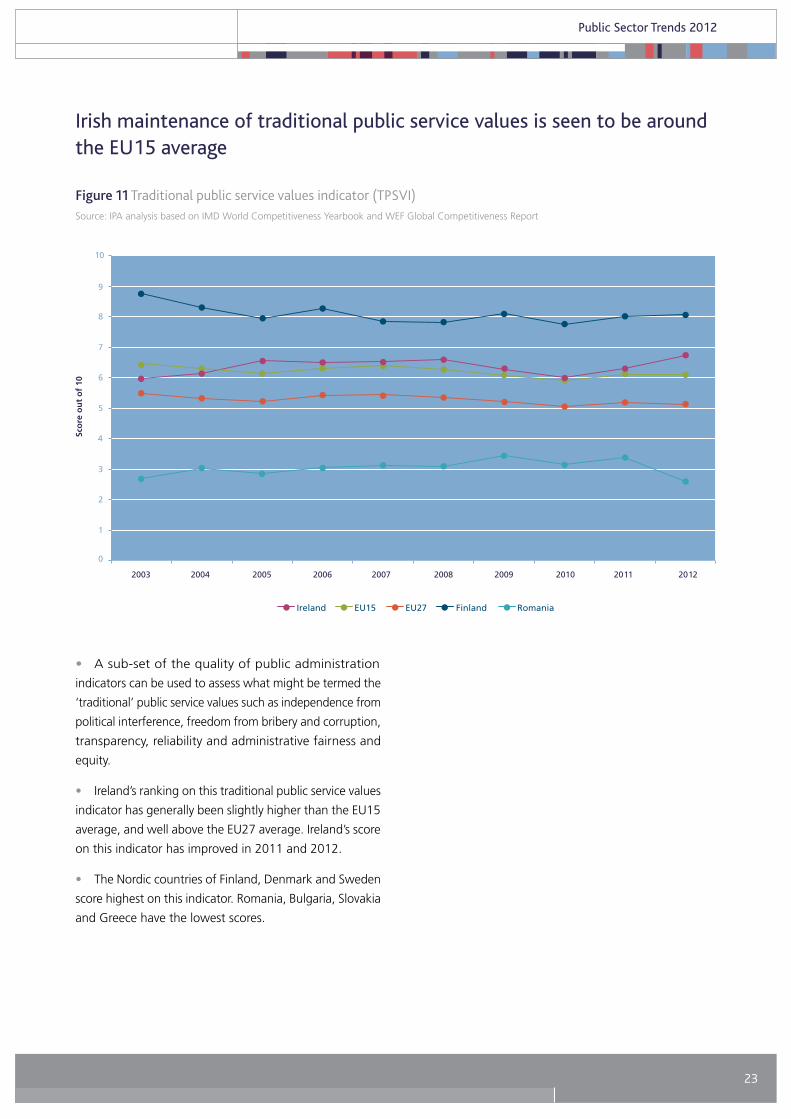
Figure 11 Traditional public service values indicator (TPSVI)
• A sub-set of the quality of public administration
indicators can be used to assess what might be termed the
‘traditional’ public service values such as independence from
political interference, freedom from bribery and corruption,
transparency, reliability and administrative fairness and
equity.
• Ireland’s ranking on this traditional public service values
indicator has generally been slightly higher than the EU15
average, and well above the EU27 average. Ireland’s score
on this indicator has improved in 2011 and 2012.
• The Nordic countries of Finland, Denmark and Sweden
score highest on this indicator. Romania, Bulgaria, Slovakia
and Greece have the lowest scores.
24
Public Sector Trends 2012
Ireland’s public administration is seen as one of the best in Europe in encouraging competition and providing a supportive regulatory environment
Source: IPA analysis based on IMD World Competitiveness Yearbook and WEF Global Competitiveness Report
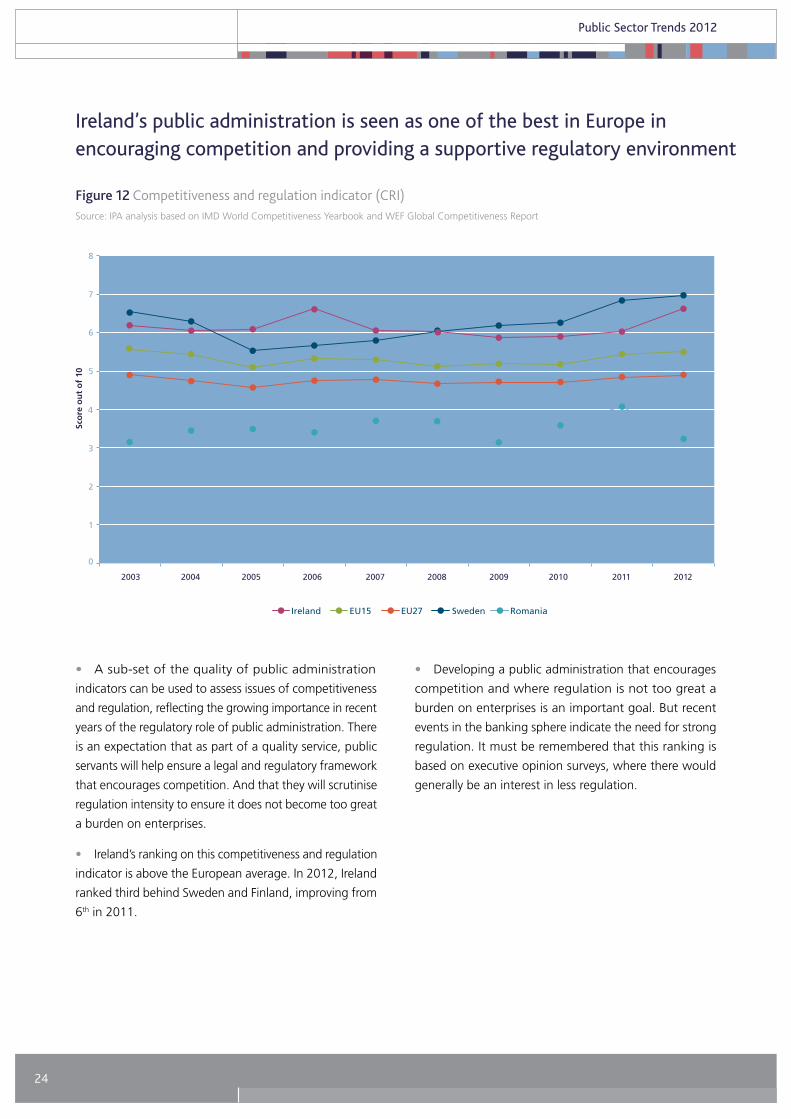
Figure 12 Competitiveness and regulation indicator (CRI)
• A sub-set of the quality of public administration
indicators can be used to assess issues of competitiveness
and regulation, reflecting the growing importance in recent
years of the regulatory role of public administration. There
is an expectation that as part of a quality service, public
servants will help ensure a legal and regulatory framework
that encourages competition. And that they will scrutinise
regulation intensity to ensure it does not become too great
a burden on enterprises.
• Ireland’s ranking on this competitiveness and regulation
indicator is above the European average. In 2012, Ireland
ranked third behind Sweden and Finland, improving from
6th in 2011.
• Developing a public administration that encourages
competition and where regulation is not too great a
burden on enterprises is an important goal. But recent
events in the banking sphere indicate the need for strong
regulation. It must be remembered that this ranking is
based on executive opinion surveys, where there would
generally be an interest in less regulation.
25
Public Sector Trends 2012
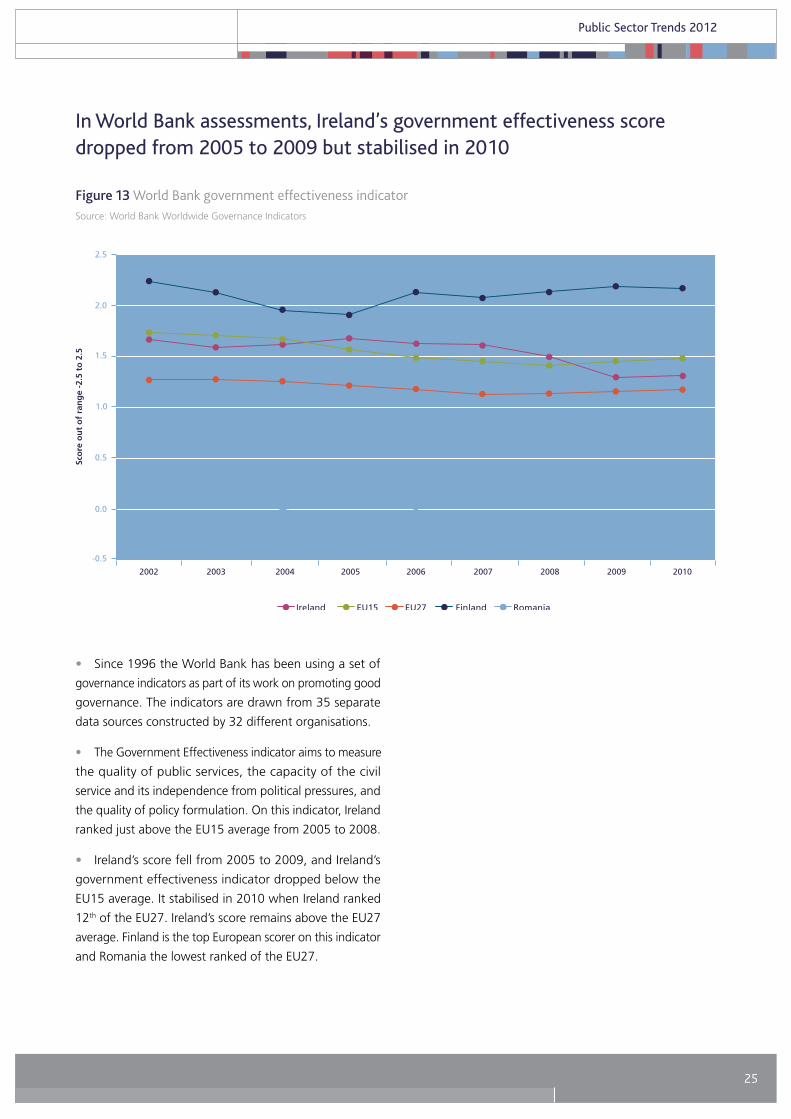
In World Bank assessments, Ireland’s government effectiveness score dropped from 2005 to 2009 but stabilised in 2010
Source: World Bank Worldwide Governance Indicators
Figure 13 World Bank government effectiveness indicator
• Since 1996 the World Bank has been using a set of
governance indicators as part of its work on promoting good
governance. The indicators are drawn from 35 separate
data sources constructed by 32 different organisations.
• The Government Effectiveness indicator aims to measure
the quality of public services, the capacity of the civil
service and its independence from political pressures, and
the quality of policy formulation. On this indicator, Ireland
ranked just above the EU15 average from 2005 to 2008.
• Ireland’s score fell from 2005 to 2009, and Ireland’s
government effectiveness indicator dropped below the
EU15 average. It stabilised in 2010 when Ireland ranked
12th of the EU27. Ireland’s score remains above the EU27
average. Finland is the top European scorer on this indicator
and Romania the lowest ranked of the EU27.

26
Public Sector Trends 2012
In World Bank assessments, Ireland’s regulatory quality indicator remains above the European average
Source: World Bank Worldwide Governance Indicators
Figure 14 World Bank regulatory quality indicator
• The Regulatory Quality indicator aims to measure
the ability of the government to provide sound policies
and regulations that enable and promote private sector
development. On this indicator Ireland ranks as well above
the EU15 and EU27 average scores, particularly from 2006
onwards.
• In 2008, Ireland ranked first of all EU countries on this
indicator. However, the impact of the regulatory problems
identified in the financial sector in 2009 clearly impacted
on the indicator, and Ireland has dropped to 7th ranked
European country on this indicator in 2010, with Denmark
now having the highest ranking.

27
Public Sector Trends 2012
Information from executive opinion surveys shows perceptions of business people regarding the efficiency of public services.
The World Bank Doing Business indicator set provides some information on the efficiency of service provided to business
by public administration. Data from a 2012 Eurobarometer study of perceptions of businesses on innovation in the public
service and its impact on business is included as a guide to performance in this important sphere of governmental activity12.
Ultimately, the provision of public administration is intended to achieve social outcomes in sectors such as health, education,
law and order and transport. As such it is important that any review of public administration looks at sectoral outcomes.
In this report, some high-level education and health indicators are included, given that these areas are the largest areas
of public expenditure.
Attainment and enrolment are two important indicators of the education system, enrolment focusing on process and
attainment on outcome. The European Central Bank (ECB, 2003) and Netherlands Social and Cultural Planning Office
(SCP, 2004) used secondary school enrolment and educational achievement indicators in their international comparisons
of public sector efficiency and performance. They are the main indicators used in this report.
In the health sector, two commonly used indicators, again used in the ECB and SCP studies, are life expectancy and infant
mortality. They are used here to illustrate outcomes in the health sector. They are supplemented by a composite health
outcomes index developed as part of the Euro Health Consumer Index.
4. Public service efficiency and performance
12 European Commission (2012), Innovation in the Public Sector: Its Perception in and Impact on Business, Flash Eurobarometer 343,
http://ec.europa.eu/public_opinion/flash/fl_343_sum_en.pdf (accessed 24 September 2012).

28
Public Sector Trends 2012
Irish public services are seen as relatively un-bureaucratic compared to most European countries
Source: IMD World Competitiveness Yearbook
Figure 15 Bureaucracy hinders business activity
• Respondents to the executive opinion survey carried out
by IMD for their World Competitiveness Yearbook indicate
that compared to most European countries, bureaucracy
in Ireland is seen as less of a hindrance to business activity.
• Only in Sweden, Finland, Denmark and Estonia is
bureaucracy seen as less of a hindrance to business activity.
The comparative trends have been fairly consistent since
2006, with improvements in the scores for Ireland and
the EU averages in 2011 and 2012. By contrast, Greece,
the lowest European scorer on this indicator, has seen its
score decrease since 2007.

29
Public Sector Trends 2012
There is a perception of wastefulness of public spending in Ireland but things are seen as having improved in the last two years
Source: WEF Global Competitiveness Report
Figure 16 The composition of public spending is wasteful
• Respondents to the WEF Global Competitiveness Report
executive opinion survey suggest that there is a perception
that Ireland is more wasteful in its public spending than
many other European countries.
• There was a worsening of the perception about the
wastefulness of public spending in Ireland from 2008 to
2010, with a slight pick up in 2011 which has continued
in 2012.
• Ireland’s score on this indicator has improved over the
last two years and is now close to the EU27 average score,
with Ireland ranking 13th of the EU27 on this indicator.
• Sweden is seen as having the least wasteful public
spending in Europe, a perception that has improved
significantly since the early 2000s when it was below the
EU15 average. By contrast, Greece scores worst on this
indicator.

30
Public Sector Trends 2012
• Respondents to the executive opinion survey carried
out by IMD for their World Competitiveness Yearbook
indicate that the perception that government decisions
are effectively implemented in Ireland has improved in the
last two years, after getting worse for a number of years
before that.
• In the mid 2000s, Ireland’s ranking on this indicator was
well above the European average. In 2010, the ranking
fell below both the EU15 and EU27 averages. Ireland
improved to 8th of the EU27 on this indicator in 2012.
Sweden scores best on this indicator, followed closely by
Finland.
Effective implementation of government decisions is seen as improving in the last two years
Source: IMD World Competitiveness Yearbook
Figure 17 Government decisions are effectively implemented

31
Public Sector Trends 2012
Ireland’s public administration continues to provide a relatively efficient level of service to business
Source: WEF Global Competitiveness Report
Figure 18 World Bank Doing Business indicators 2011
• A ‘bottom-up’ approach to assessing efficiency of public
administration is taken by the World Bank in some of their
Doing Business indicator set, with performance assessed
from a service user perspective.
• The number of days estimated that it takes an
entrepreneur to start a business in Ireland has remained
at 13 for the last five years, which is the EU15 average
(the EU15 average was 15 days in 2010). In Belgium and
Hungary it takes 4 days.
• The number of days to complete all procedures required
for a business in the construction industry to build a
standardised warehouse was estimated at 141 days in
Ireland in 2011, down from 192 days in 2010, and lower
than the EU15 average (155 days) and the EU27 average
(189 days). The best performers are Finland and Denmark
with an estimated 66 days and 67 days respectively.
• The number of hours it takes a medium-sized company
to pay tax in a given year is estimated as significantly lower
in Ireland, at 76 hours, than it is for the EU15 (158 hours)
and EU27 (208 hours) averages, though the European
averages are coming down while Ireland’s performance is
static. Ireland ranks second in the EU behind Luxembourg
on this indicator.
• Overall, Ireland does relatively well in the EU against
these World Bank indicators that assess the impact of public
administration on the ability of companies to do business.

32
Public Sector Trends 2012
• Ireland is close to, but generally just below, the EU27
average with regard to how changes in public services
to businesses to support innovation in recent years are
concerned.
• Ireland scores quite well with regard to providing
options to complete government forms over the internet
and providing access to information on government
services over the internet. Though it is still ranked some
way behind European leaders in these areas such as Latvia,
France, Finland and Slovenia.
• Ireland is rated relatively poorly, as are many other
countries, with regard to reductions in time required
to obtain permits or licenses, faster response times and
securing reductions in financial costs to companies.
Public service supports for business innovation are seen as around the European average
Source: Eurobarometer
Figure 19 Changes in public services to business to support innovation

33
Public Sector Trends 2012
Ireland is rated relatively well with regard to the perceived impact of public service innovations on businesses
Source: Eurobarometer
Figure 20 Impact of public service innovations on businesses
• Ireland rates relatively well compared to many European
countries with regard to the perceived impact of public
service innovations on business.
• The quality of information and advice provided and
minimising the time spent by companies using public
services are rated particularly highly. Response time from
the public sector is also rated above the European average.
• Ireland rates less well overall and comparatively
with regard to the impact of public services on costs for
companies, and the role of the public education system
and training programmes in supporting the provision of
skilled personnel for companies.

34
Public Sector Trends 2012
Ireland around the European average in terms of supporting innovation in business
Source: Eurobarometer
Figure 21 Business views on public service support for innovation
• Ireland is close to the EU27 average with regard to
perceived public service support for innovation in businesses.
• Ireland is seen as slightly above the European average
with regard to the role of the regulatory and fiscal system
in supporting company innovation.
• Ireland is slightly below the European average regarding
how public services are seen as doing a good job in creating
the right conditions for companies to innovate. Luxembourg,
Malta, Finland and Estonia are seen as leading here.
35
Public Sector Trends 2012
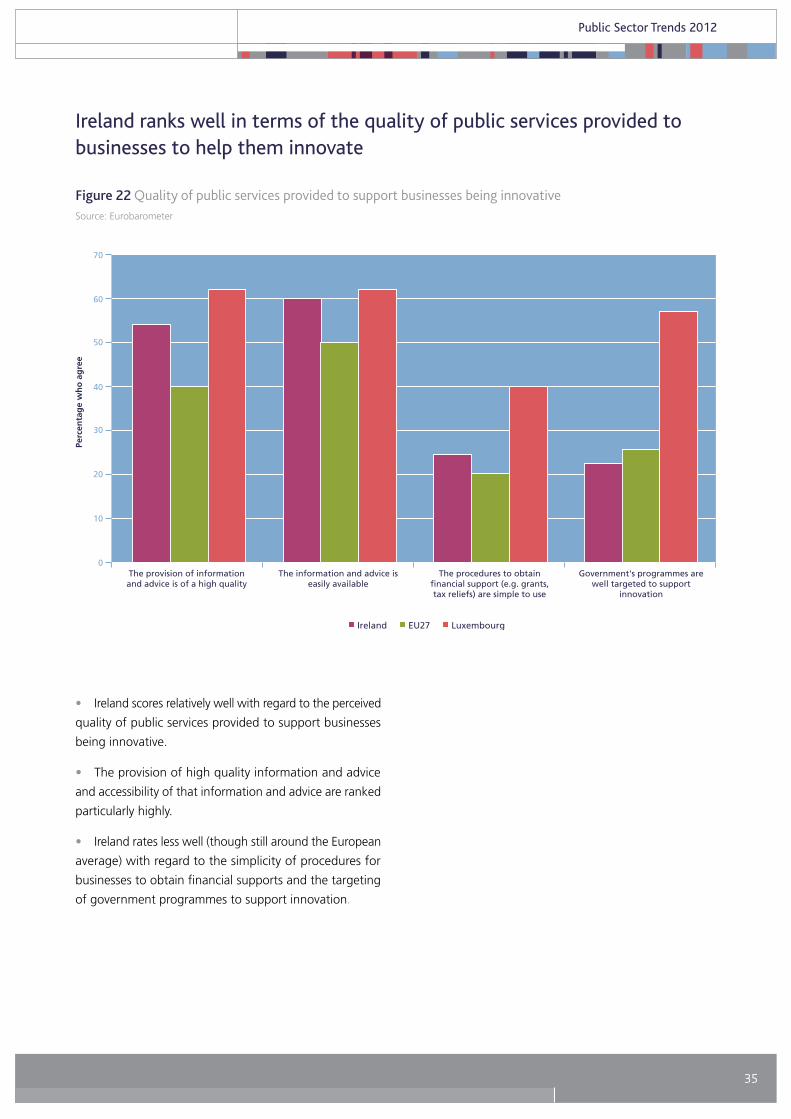
Ireland ranks well in terms of the quality of public services provided to businesses to help them innovate
Source: Eurobarometer
Figure 22 Quality of public services provided to support businesses being innovative
• Ireland scores relatively well with regard to the perceived
quality of public services provided to support businesses
being innovative.
• The provision of high quality information and advice
and accessibility of that information and advice are ranked
particularly highly.
• Ireland rates less well (though still around the European
average) with regard to the simplicity of procedures for
businesses to obtain financial supports and the targeting
of government programmes to support innovation.
36
Public Sector Trends 2012
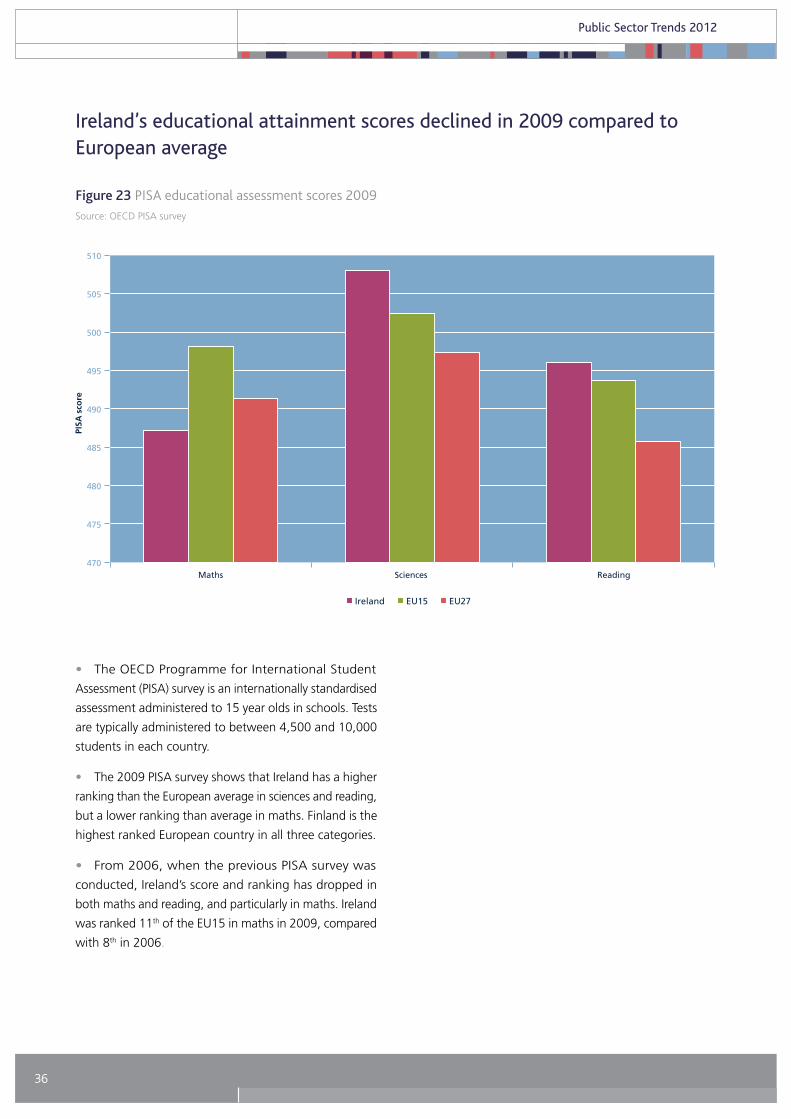
• The OECD Programme for International Student
Assessment (PISA) survey is an internationally standardised
assessment administered to 15 year olds in schools. Tests
are typically administered to between 4,500 and 10,000
students in each country.
• The 2009 PISA survey shows that Ireland has a higher
ranking than the European average in sciences and reading,
but a lower ranking than average in maths. Finland is the
highest ranked European country in all three categories.
• From 2006, when the previous PISA survey was
conducted, Ireland’s score and ranking has dropped in
both maths and reading, and particularly in maths. Ireland
was ranked 11th of the EU15 in maths in 2009, compared
with 8th in 2006.
Ireland’s educational attainment scores declined in 2009 compared to European average
Source: OECD PISA survey
Figure 23 PISA educational assessment scores 2009

37
Public Sector Trends 2012
Secondary school enrolment is somewhat behind the European average
Source: IMD World Competitiveness Yearbook
Figure 24 Secondary school enrolment
• In 2009, the last year for which comparative data is
available, the percentage in full-time education in Ireland
was 89 per cent, compared to 93 per cent average for the
EU15.
• The percentage in full-time education has been
consistently rising in Ireland in recent years. But it is still
somewhat below the European average. France, Slovakia
and Sweden had the best enrolment rates in 2009.
38
Public Sector Trends 2012
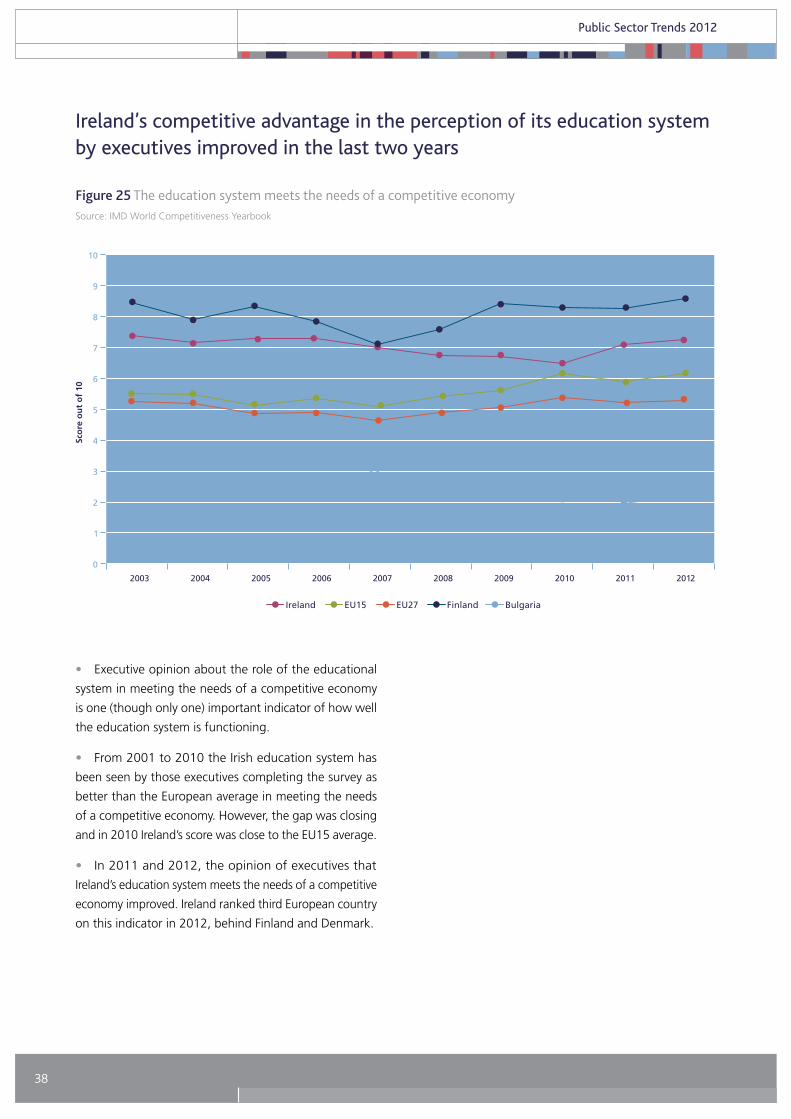
• Executive opinion about the role of the educational
system in meeting the needs of a competitive economy
is one (though only one) important indicator of how well
the education system is functioning.
• From 2001 to 2010 the Irish education system has
been seen by those executives completing the survey as
better than the European average in meeting the needs
of a competitive economy. However, the gap was closing
and in 2010 Ireland’s score was close to the EU15 average.
• In 2011 and 2012, the opinion of executives that
Ireland’s education system meets the needs of a competitive
economy improved. Ireland ranked third European country
on this indicator in 2012, behind Finland and Denmark.
Ireland’s competitive advantage in the perception of its education system by executives improved in the last two years
Source: IMD World Competitiveness Yearbook
Figure 25 The education system meets the needs of a competitive economy

39
Public Sector Trends 2012
Life expectancy is around the European average
Source: WHO, WHOSIS (life expectancy); IMD World Competitiveness Yearbook (healthy life expectancy)
Figure 26 Life expectancy
• Lifeexpectancyatbirthin2009at80yearswasjust
around the average for the EU15 and better than the EU27
average.
• Healthylifeexpectancyatbirth(theaveragenumber
of years that a person can expect to live in ‘full health’) in
2009 in Ireland was 73 years, around the EU15 average.

40
Public Sector Trends 2012
• Under 5 infant mortality per 000 live births in Ireland
has fallen from 6 in 2004 to 4 in 2011.
• For most countries in the EU15 the infant mortality
rate is around 3 or 4 per 000 live births. Sweden had the
lowest mortality rate at 2.8 in 2011, and Romania the
highest at 12.5.
Child mortality is around the European average
Source: WHO, WHOSIS
Figure 27 Child mortality

41
Public Sector Trends 2012
Ireland ranks around the EU15 average in achieving desirable health outcomes
Source: Euro Health Consumer Index 2012
Figure 28 European consumer health outcomes index
• The Euro Health Consumer Index 2012 (Health Consumer
Powerhouse 2012) includes a composite ‘basket’ measure
of a sub-set of indicators focused on health outcomes13.
The higher the score on this index, the better the outcomes.
• As with most other European countries, Ireland improved
its score on this outcomes index between 2009 and 2012.
• Ireland ranks around the EU15 average on this health
outcomes index. Sweden, the Netherlands and Finland
achieve the top three rankings.
13 The outcomes measured in 2012 are: heart infarct case mortality; infant deaths; ratio of cancer deaths to incidence; preventable years of life lost;
mrsa infections; caesarean sections; undiagnosed diabetes; depression.

42
Public Sector Trends 2012
Twice a year Eurobarometer measures the level of public confidence in the national government and the national parliament.
National government is not defined, and the extent to which it covers both political and administrative elements of
government is unclear. But it is likely to primarily reflect levels of trust in the political parties in power at the time of the
survey. Periodic surveys of trust in regional and local authorities by Eurobarometer are also examined.
5. Trust and confidence in public administration

43
Public Sector Trends 2012
Trust in government remains volatile
Source: Eurobarometer
Figure 29 Level of trust in government
• The level of public trust in government in Ireland tended
to be slightly below the EU15 average from 2001 to 2008,
and at or around the EU27 average from 2004 to 2008.
• However, there was a dramatic fall in the level of trust
in government in Ireland from 2008 to 2010. Trust in
government in the rest of Europe also fell, but only slightly.
In autumn 2010, Ireland expressed the lowest level of trust
in government of any of the EU27 (10 per cent).
• By spring 2011, the level of public trust had increased
significantly to 42 per cent expressing trust in the Irish
government, close to the EU15 average. This fell back to
22 per cent by autumn 2011 and 24 per cent in spring
2012.
44
Public Sector Trends 2012
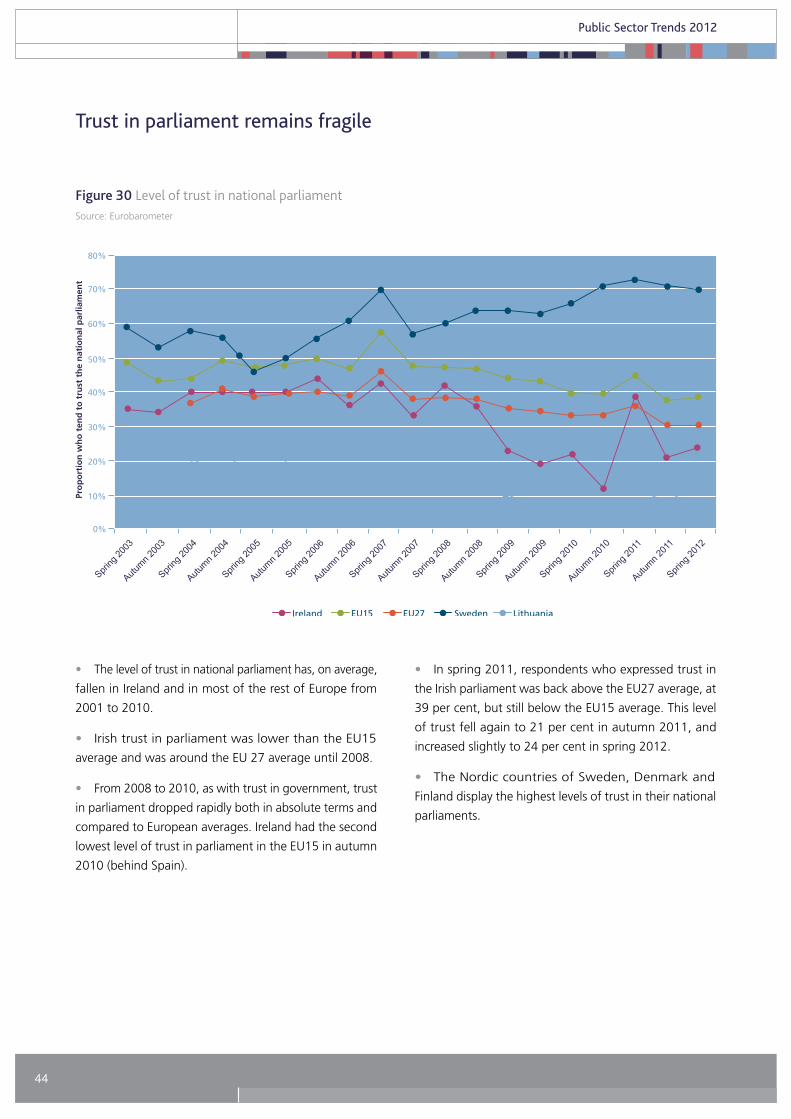
• The level of trust in national parliament has, on average,
fallen in Ireland and in most of the rest of Europe from
2001 to 2010.
• Irish trust in parliament was lower than the EU15
average and was around the EU 27 average until 2008.
• From 2008 to 2010, as with trust in government, trust
in parliament dropped rapidly both in absolute terms and
compared to European averages. Ireland had the second
lowest level of trust in parliament in the EU15 in autumn
2010 (behind Spain).
• In spring 2011, respondents who expressed trust in
the Irish parliament was back above the EU27 average, at
39 per cent, but still below the EU15 average. This level
of trust fell again to 21 per cent in autumn 2011, and
increased slightly to 24 per cent in spring 2012.
• The Nordic countries of Sweden, Denmark and
Finland display the highest levels of trust in their national
parliaments.
Trust in parliament remains fragile
Source: Eurobarometer
Figure 30 Level of trust in national parliament

45
Public Sector Trends 2012
Trust in regional and local authorities is low
Source: Eurobarometer
Figure 31 Level of trust in regional or local public authorities
• The level of trust in regional and local authorities in
Ireland was at 26 per cent in 2011, down from 40 per
cent in 2008. It increased slightly to 30 per cent in spring
2012.
• This is one of the lowest levels of trust in the EU. Only
Greece, Italy and Spain report lower levels of trust in local
authorities in 2012.

46
Public Sector Trends 2012
In terms of overall performance, the data presented in this paper would tend to suggest that the quality of Ireland’s
public administration remains close to the average for the European Union. Indeed, there are some signs that aspects of
quality are seen as having improved in the last two years. This is a notable achievement for a small state such as Ireland,
especially at a time of reducing numbers of public servants and limited resources available for public services.
Knowing where we rank in Europe can point out areas where we need to improve, and identify countries we might learn
from. Many of the indicators used here are based on people’s perceptions of the public service and are clearly influenced
by general economic, political and cultural conditions rather than necessarily any actual change in service. Nevertheless,
such indicators are important in that perceptions influence how people see Ireland as a place to live, do business and
invest. Findings emerging in this light include:
• Numbers employed in the public sector continue to fall. As a percentage of total employment, public service numbers
are not excessive by European standards. As the population continues to increase (placing increasing demands on public
services) and as numbers are reduced further to meet fiscal and economic targets, the challenge of maintaining services
and the skills and capacity needed to provide those services increases. This focuses particular attention on the need for
process improvement to enhance efficiencies and for reducing programme expenditure in some areas.
• The local authority and justice sectors have been particularly hit by staffing reductions. Capacity development in these
areas is of pressing concern.
• The Exchequer pay bill continues to decline from its high in 2008. But the pensions bill is increasing as numbers leaving
and taking early retirement impact on the bill. The need for fiscal discipline to be maintained in these areas remains.
• Given the reductions in numbers and public expenditure, perceptions of the quality of public administration have held
up remarkably well. Irish public services are seen as relatively un-bureaucratic compared to most European countries. The
quality of services to businesses is ranked relatively highly. There is much of Irish public service provision that is seen in a
positive light despite the challenges being faced.
• Trust in government and parliament remains fragile, and trust in local government is low. Much remains to be done
to re-build and maintain the trust of the Irish people in government.
6. Conclusion

47
Public Sector Trends 2012
Afonso, A., L. Schuknecht and V. Tanzi (2003), Public Sector Efficiency: An International Comparison, Working Paper
No. 242, Frankfurt: European Central Bank
Boyle, R. (2007), Comparing Public Administrations, Committee for Public Management Research Report No. 7, Dublin:
Institute of Public Administration
Boyle, R. and M. MacCarthaigh (2011), Fit for Purpose? Challenges for Irish Public Administration and Priorities for
Public Service Reform, Dublin: Institute of Public Administration, http://www.ipa.ie/pdf/Fit_For_Purpose_New_Report.pdf
(accessed November 8 2012)
Foley, A. (2009), ‘The size, cost and efficiency of the public service’, Administration, Vol. 57, No. 1, pp69-101
Health Consumer Powerhouse (2012), Euro Health Consumer Index 2012, Health Consumer Powerhouse, http://www.
healthpowerhouse.com/files/Report-EHCI-2012.pdf (accessed November 8 2012)
OECD (2011), Government at a Glance 2011, Paris: OECD, http://www.oecd.org/gov/indicators/govataglance, (accessed
November 8 2012)
OECD (2010), Public Administration After New Public Management, OECD: Paris
Social and Cultural Planning Office (2004), Public Sector Performance: An International Comparison of Education,
Health Care, Law and Order and Public Administration, The Hague: Social and Cultural Planning Office.
References
48
Public Sector Trends 2012
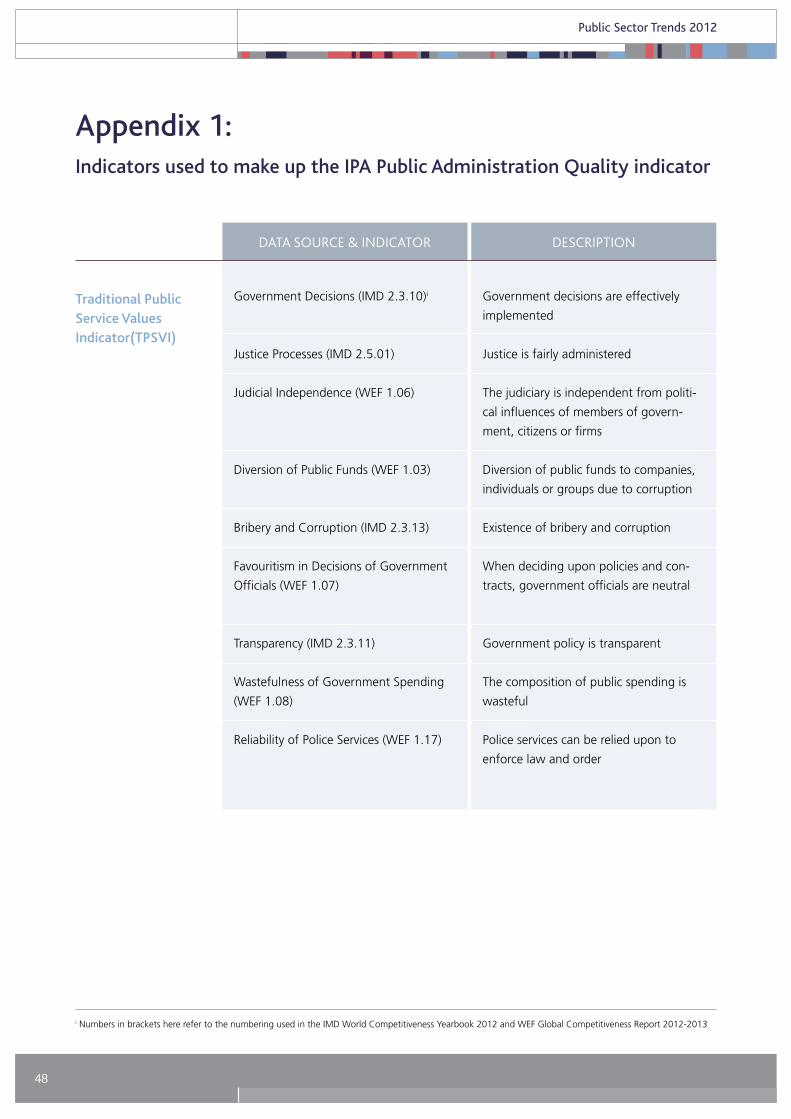
Appendix 1: Indicators used to make up the IPA Public Administration Quality indicator
DATA SouRCE & INDICAToR DESCRIPTIoN
Government Decisions (IMD 2.3.10)i
Justice Processes (IMD 2.5.01)
Judicial Independence (WEF 1.06)
Diversion of Public Funds (WEF 1.03)
Bribery and Corruption (IMD 2.3.13)
Favouritism in Decisions of Government
Officials (WEF 1.07)
Transparency (IMD 2.3.11)
Wastefulness of Government Spending
(WEF 1.08)
Reliability of Police Services (WEF 1.17)
Traditional Public Service Values Indicator(TPSVI)
Government decisions are effectively
implemented
Justice is fairly administered
The judiciary is independent from politi-
cal influences of members of govern-
ment, citizens or firms
Diversion of public funds to companies,
individuals or groups due to corruption
Existence of bribery and corruption
When deciding upon policies and con-
tracts, government officials are neutral
Government policy is transparent
The composition of public spending is
wasteful
Police services can be relied upon to
enforce law and order
i Numbers in brackets here refer to the numbering used in the IMD World Competitiveness Yearbook 2012 and WEF Global Competitiveness Report 2012-2013
49
Public Sector Trends 2012
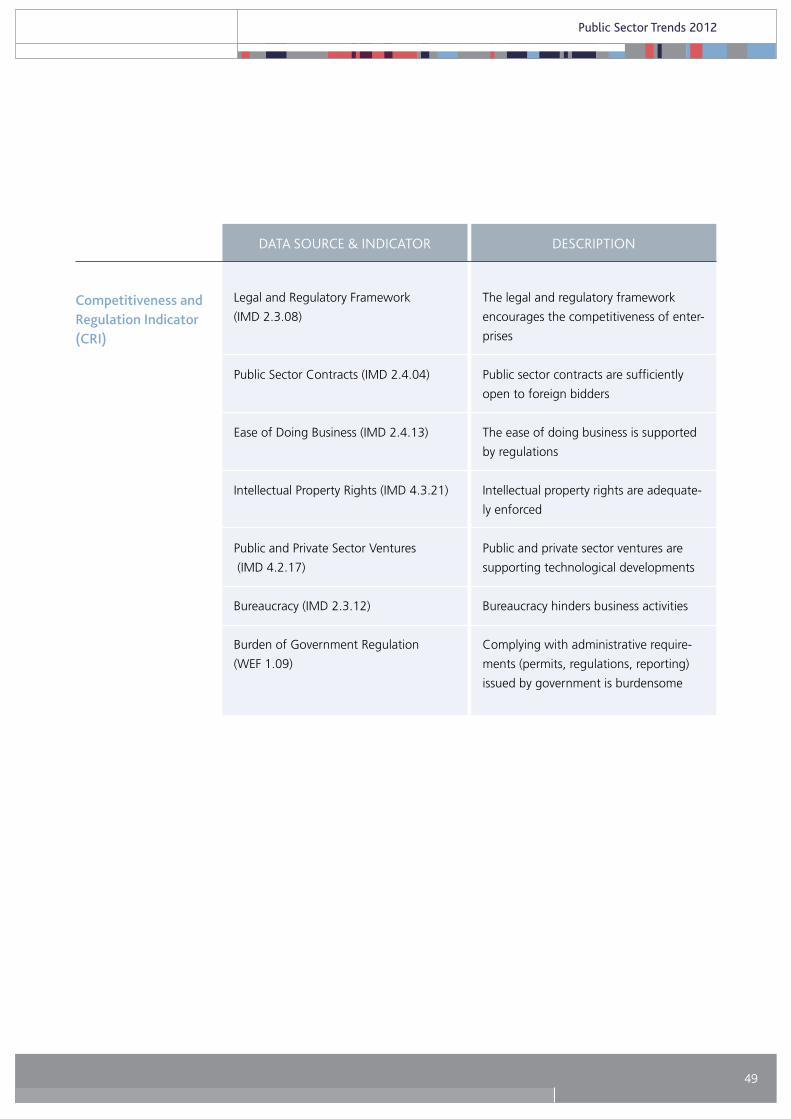
DATA SouRCE & INDICAToR DESCRIPTIoN
Legal and Regulatory Framework
(IMD 2.3.08)
Public Sector Contracts (IMD 2.4.04)
Ease of Doing Business (IMD 2.4.13)
Intellectual Property Rights (IMD 4.3.21)
Public and Private Sector Ventures
(IMD 4.2.17)
Bureaucracy (IMD 2.3.12)
Burden of Government Regulation
(WEF 1.09)
Competitiveness and Regulation Indicator (CRI)
The legal and regulatory framework
encourages the competitiveness of enter-
prises
Public sector contracts are sufficiently
open to foreign bidders
The ease of doing business is supported
by regulations
Intellectual property rights are adequate-
ly enforced
Public and private sector ventures are
supporting technological developments
Bureaucracy hinders business activities
Complying with administrative require-
ments (permits, regulations, reporting)
issued by government is burdensome