public sector reform in hungary: views and experiences from
TRANSCRIPT

Public Sector Reform in Hungary:
Views and Experiences from Senior Executives
Country Report as part of the COCOPS Research Project
György Hajnal
May 2013
Coordination for Cohesion in the Public Sector of the Future (COCOPS): www.cocops.eu
COCOPS Work Package 3, Country Report Hungary – May 2013 Page 2
About COCOPS
The COCOPS project (Coordinating for Cohesion in the Public Sector of the Future) seeks to
comparatively and quantitatively assess the impact of New Public Management-style reforms in
European countries, drawing on a team of European public administration scholars from 11
universities in 10 countries. It analyses the impact of reforms in public management and public
services that address citizens’ service needs and social cohesion in Europe. Evaluating the extent and
consequences of NPM’s alleged fragmenting tendencies and the resulting need for coordination is a
key part of assessing these impacts. It is funded under the European Union’s 7th Framework
Programme as a Small or Medium-Scale Focused Research Project (2011-2014).
About the Author
György Hajnal is Associate Professor at the Department of Public Policy and Management at the
Corvinus University of Budapest, and Senior Researcher of the Hungarian Academy of Sciences,
Center for Social Research, Institute of Political Science
The research leading to these results has received funding from the European Union’s Seventh
Framework Programme under grant agreement No. 266887 (Project COCOPS), Socio-economic
Sciences & Humanities.
ISSN 2211-2006
COCOPS Work Package 3, Country Report Hungary – May 2013 Page 3
Contents
1. Introduction .................................................................................................................................. 4
2. Context and Status Quo of Public Administration Reform in Hungary ......................................... 7
3. Data and Method .......................................................................................................................... 9
3.1 Sampling and Access Strategy and Survey Implementation ......................................................... 9
Organizations involved in the sample ........................................................................................... 9
Access strategy and response rates ............................................................................................ 11
3.2 Organizational Context of Respondents ...................................................................................... 12
3.2 Socio-demographic Background of Respondents ....................................................................... 13
4. Values and Attitudes of Public Sector Executives ....................................................................... 16
5. Characteristics of the Work Context in Public Administration ................................................... 19
6. Relevance of NPM and post NPM Reforms ................................................................................ 23
6.1. Policy field level ..................................................................................................................... 23
6.2. Organizational level ............................................................................................................... 25
6.3. Individual level ....................................................................................................................... 28
7. Impact of the Fiscal Crisis on Public Administration ................................................................... 29
8. Outcomes of Public Administration Performance ...................................................................... 31
8.1 Overall .................................................................................................................................... 31
8.2 Policy Field ............................................................................................................................. 32
8.3 Individual Level ...................................................................................................................... 34
9. Findings from the Employment and Health sector ..................................................................... 35
10. Conclusion ................................................................................................................................... 36
List of Figures ......................................................................................................................................... 38
References ............................................................................................................................................. 39

COCOPS Work Package 3, Country Report Hungary – May 2013 Page 4
1. Introduction1
Coordinating for Cohesion in the Public Sector of the Future (COCOPS), as one of the largest
comparative public management research projects in Europe, intends to provide a comprehensive
picture of the challenges facing the public sector in European countries and to systematically explore
the impact of New Public Management (NPM)-style reforms in Europe. The project brings together
public administration scholars from eleven universities in ten countries2 and is funded as part of the
European Union’s 7th Framework Programme between January 2011 and June 2014.3 The research is
comparative and evidence-based, drawing on both existing data and innovative new quantitative and
qualitative data collection, at both national and policy sector levels. A cornerstone of the project is
the COCOPS Executive Survey on Public Sector Reform in Europe: an original, large-scale survey of
public sector top executives in ten European countries, exploring executives’ opinions and
experiences with regards to public sector reforms in general government, as well as more particularly
in the health and employment policy sectors.
Scholars within the public administration discipline have long underlined the need for more
quantitative and rigorous comparative research, going beyond single-country and single-organization
approaches (see Derlien 1992; Fitzpatrick et al 2011; Pollitt 2011; Raadschelders and Lee 2011).
Moreover, few research initiatives have explored in depth the transformation of public
administrations as triggered by NPM reform discourses in a systematic comparative form (Van de
Walle and Hammerschmid 2011). Responding to such concerns, this survey offers systematic
evidence regarding the dynamics of public administration reform in Europe, with the goal to create
an encompassing and systematic picture of public administration after more than two decades of
NPM reforms.
From a theoretical perspective the survey builds on the perception of three major reform paradigms
(New Public Management, Public Governance and the Neo-Weberian State) as described by Pollitt
and Bouckaert (2011). Focusing on top executives, it follows pioneering elite studies such as those of
Aberbach, Putnam and Rockman (see Putnam 1976, Aberbach et al. 1981, and Aberbach and
Rockman 2006), which lay the foundation for many other both national and cross-national executive
surveys (e.g. Mayntz and Derlien 1988; Christensen and Laegreid 2007; Bertelli et al. 2007; Trondal
2010; Bauer et al. 2009; COBRA survey; UDITE survey).
Methodologically it also draws inspiration from cross-national population surveys such as the
European Social Science Survey, European Values Survey, the International Social Survey Program; as
well as from experiences with cross-national surveys such as those of the Survey Research Centre at
the University of Michigan (2010).
As set out by the project's terms of reference the goal of this large-scale survey is to analyse national
administrations (both ministries and agencies) in the participating countries and also to take a closer
1
This introduction is based on Hammeschmid, Görnitz, Oprisor and Stimac (2013), and appears in the same
form in all WP3 COCOPS country reports. 2
Erasmus University Rotterdam, Hertie School of Governance Berlin, University of Bergen, Bocconi University, University of Cantabria, Cardiff University, CNRS Paris, Corvinus University Budapest, University of Exeter, KU Leuven, Tallinn University of Technology 3 More information on the project is available at www.cocops.eu

COCOPS Work Package 3, Country Report Hungary – May 2013 Page 5
look at the policy fields employment and health. The survey aims to explore public sector executives´
perceptions, experiences and opinions with regards to their work context and administrative
reforms, but also on other factors such as values and identities and the impact of the fiscal crisis. The
core survey implemented in all participating countries consists of 31 questions structured in four
parts (I) General information; (II) Management and Work Practice of Your Organization; (III) Public
Sector Reform and the Fiscal Crisis; (IV) Attitudes, Preferences and Personal Information. The survey
is a result of the joint work of all the national research teams within the COCOPS project and under
the leadership of a team of researchers at the Hertie School of Governance in Berlin. In addition,
further universities from other European countries were included as strategic partners to replicate
the survey in these countries.4
Three essential challenges connected to the design of the questionnaire and the survey methodology
had to be handled by the research team: a sample design that would allow systematic comparative
analyses; an access strategy to produce (statistically sufficient) high response rates; and a
questionnaire design and translation that would assure conceptual equivalence between all
countries. As a general principle, the survey team opted for a balanced and pragmatic approach with
a view on a maximum of quality and comparability, while still allowing for sufficient flexibility within
each country’s context. A core questionnaire developed by the survey team in English was translated
into country-specific versions by the respective national research teams and – if assumed helpful –
optional questions were added. With regards to the population definition, the research team
targeted a group with relevant experience to assess overall developments and trends both on an
organizational and policy field level. In general, top executives are viewed as such informants
regarding the state of administration, given their privileged vantage point (Walker and Enticott
2004), but also, with the blurring of the classical boundaries between politicians and civil servants
(Aberbach et al. 1981), due to their own role in policy-making and their influence on the choice and
implementation of reforms (Christensen and Lægreid 1999; Ridder et al. 2006). A major critique
raised against elite surveys however (see in particular Enticott et al. 2008) is that they usually focus
on a limited selection of individuals at the top of the organization. As these individuals are relatively
disconnected from processes at lower levels in the organizations, and also due to issues of
desirability, such an approach is bound to provide a biased image of the respective organization(s).
These are important points to take into consideration when interpreting the results.
In order to avoid random sampling and issues of representativeness, the COCOPS executive survey is
based on a full census of all central government ministries and agencies. It covers all high level public
sector executives who in their respective positions can be expected to be involved in public
administration reform processes. A core set of binding sample principles, based on a detailed
mapping of national administrative structures, was followed by all teams in all central government
areas and especially in the case of employment and health. Deviations were only allowed if precise
equivalence could not be established due to the specificity of administrative structures. Local
government and service delivery levels were excluded for the purpose of this survey. Generally,
within all central government ministries and subordinated agencies the two top-administrative levels
were addressed; in some cases invitations were also sent to executives on the third level if, due to
their policy relevance, this was deemed appropriate. State-owned enterprises and audit courts were
4 The Vienna University of Economics and Business for Austria, the Kaunas University of Technology for Lithuania, the Technical University of Lisbon for Portugal, Copenhagen Business School, the Belgrade Fund for Political Excellence for Serbia and the University of Bern for Switzerland

COCOPS Work Package 3, Country Report Hungary – May 2013 Page 6
not included due to their different task repertoire. In the fields of employment and health, as special
focus areas, regional and state government ministries and agencies were also included if relevant –
without addressing however direct service delivery levels (e.g. hospitals, job centers).
Moreover, the survey explicitly covers different units of analysis (see Pollitt 2011: 121, on units of
analysis in comparative public administration research) to allow for multi-level analyses: policy field,
organization and individual experiences of the respondent. These are explored through the
(self)perceptions of public sector executives, acknowledged in research as the closest channel into
objective processes and developments within public organizations and, at least in the absence of
stringent limitations, as reliable predictors of administrative behaviour (see Aberbach et al. 1981;
Bauer et al. 2009).
The survey was implemented online, with standardized webpages being built in the national
language(s) for each country. Flexibility was allowed, and even recommended, in the data collection
strategies used by national teams, due to major differences in administrative cultures between the
countries. A major emphasis was put on a thorough data cleaning and harmonization at the end of
the survey, to make sure that final results were comparable across countries and that any deviations
allowed during the implementation process were explained and controlled.5
The survey was launched in May 2012 and implemented in two rounds (May-July 2012, and
September-November 2012). In these two rounds combined, the survey was sent out to over 20.000
high ranking civil servants in the ten participating countries via post and email (using either a
personalized access link or an anonymous one), depending on each country´s predefined access
strategy. Invitations were followed by reminders and, in cases where response rates were low, teams
took additional measures, such as phone or postal reminders, to increase the number of survey
participants. In the beginning of November 2012, all surveys were closed, and all datasets were
cleaned, checked and harmonized according to a standardised procedure for all countries.
Table 1. Number of invitations and response rates of the COCOPS survey (by end of December 2012)
Country Invitations Sent* Survey
completions Response rate %
Austria 1745 637 36.50
Estonia 913 321 35.16
France 5297 1193 22.52
Germany 2295 566 24.66
Hungary 1200 351 29.25
Italy 1703 343 20.14
Netherlands 977 293 29.99
Norway 1299 436 33.56
Spain 1778 321 18.05
UK 3100 353 11.39
Total 20307 4814 23.71
*The invitations sent represent the final number of invitations that has reached respondents, after the exclusion of any failure deliveries, wrong addresses etc.
5 The details of the survey design and implementation process can be found in the survey Research Report (see
Hammerschmid, Oprisor, Stimac, 2013).

COCOPS Work Package 3, Country Report Hungary – May 2013 Page 7
By the end of 2012 there were 4814 valid answers available from ten participating countries and an
overall response rate of 23.7% (for details see Error! Reference source not found.). These answers
are the basis for the respective country reports. The data in both the national and the integrated
datasets are subject to strict anonymity regulations, to protect individual respondents, whereas
aggregate data will be published according to a set of rules commonly agreed upon by the research
teams involved.
The current country report summarizes the findings for Hungary along with some first comparisons
with the aggregate results from all of the ten validated surveys in Austria, Estonia, France, Germany,
Hungary, Italy, Netherlands, Norway, Spain and UK. A more systematic comparative report based on
these country reports will follow in summer 2013.
2. Context and Status Quo of Public Administration Reform in Hungary
Hungary is a unitary, parliamentary republic. The executive branch is divided into three levels. The
Hungarian central government subsystem is divided into ministries, the number of which ranged
between 12 and 18 between 1990 and 2010; at the core of which lied the Prime Minister’s Office
(PMO) with the head of the Cabinet, the Prime Minister, on its peak. Ministries are chiefly
responsible for policy-making while most of the implementation tasks – especially those with a
territorial dimension – are carried out by agencies.
At the second, sub-ministerial level one finds a number of agencies – public organizations with
nation-wide competence supervised by a ministry or the Cabinet. Many of these central agencies
have field offices on county or even lower (local) administrative levels (e.g. employment, tax offices),
employing a significant share of civil servants. Between 1990 and 2006 the proliferation of these
agencies was a constant trend in Hungary. In this period there were various organizations possibly
regarded as agencies, but there were no overarching legal framework for agency type organizations.
In 2006 and as part of its attempts to (re)gain control over government apparatuses the second
Gyurcsány cabinet initiated a law regulating the basic structural features of government
organizations. This regulation included a clearly defined, closed agency typology, which all existing
and new agencies had to comply with.
At the third level of administration one finds the local governments. The local government system is
a two-tier one involving, at the upper tier, nineteen counties and the capital city Budapest, and, at
the lower, municipal tier almost 3200 local governments governed by elected councils. Local
governments were, until very recently, responsible for a broad set of public service provision tasks,
including child care, education, health, and local physical infrastructure services. Since 2011 however
a sweeping wave of centalization reached the local government system, as a result of which much of
the health and education services having been taken over by the central government.
Hungary’s state structures as having existed in most of the post-1990 period can be assessed as a
relatively unique one characterized by such elements as:

COCOPS Work Package 3, Country Report Hungary – May 2013 Page 8
- a strong legislature exercising numerous executive functions too (supervisor of public corporations, elector of key officials of other branches);
- a high proportion of laws requiring a qualified, (two-thirds) majority to be changed;
- a strong and dense system of checks and balances outside the executive branch, including the possibly strongest constitutional court in Europe, a public prosecution not controlled by the executive;
- an entirely autonomous administration of the judiciary; and
- an ever-expanding system of various ombudsmen.
These elements were mostly rooted in the political deals stroke around the system change and were
driven, among others, by such factors as (i) an intention to block any future attempts at reverting the
liberal democratic political changes and (ii) the partly unfounded idealism – partly fed by a swing-of-
the-pendulum-type reaction to the totalitarian past – of major political forces and their partly naive
belief in the self-organizing and controlling capacity of politco-administrative systems. These
building blocks, in sum, resulted in a governance system – sometimes referred to as “regulatory
impotence” (Hajnal 2010; see also Sárközy 2011) – limiting policy makers capability to act to a
dysfunctional extent.
From 2010 – the inauguration of the second Orbán Cabinet – a new policy on administrative reform
and on cornerstones of the state structure emerged. This spectacular change was driven by a quest
to further enhance the political control of administrative apparatuses – this time, unlike previous
attempts, backed by a two-third majority enabling the Cabinet. It is important to note that similar
attempts could already be observed in the previous years too. In particular, the second Gyurcsány
Cabinet took a number of attempts at strengthening central political control over apparatuses and
policies (Hajnal 2010, 2011). However these efforts, just like most of the previous ones, were
deemed to fail because of the lack of political strength necessary to break through the built-in
barriers against major change.
The broad-scope structural changes having taken place in 2010-2011 can best be understood in a
broader framework characterized by a decisive and successful attempt to get rid of the extremely
status quo oriented system of checks and balances, and to strengthen hierarchical and political
control in all spheres and segments of state organization. This quest for enlarging the “action radius”
of the political executive was however motivated not only by the quest for power. The extremely
harsh external (macroeconomic, financial and social) conditions set, from 2008 onwards, by the
economic crisis and the related requirements of the EU and IMF with regards to the containment of
public deficit and debt posed a serious additional challenge.
Many of reform measures necessitated fundamental constitutional changes or, at least, involved the
adoption by the governing parties with a two-third majority. This series of reforms resulted, in
December 2011, in the adoption of an entirely new constitution. It involves a range of elements
partly extending even beyond the executive branch, a non-exhaustive, illustrative list of which is
given below.
- The ministerial structures underwent far-reaching structural changes, as a result of which
eight integrated ‘superministries’ emerged. At the same time the PMO was re-structured
into a Ministry of Public Administration and Justice (MPAJ) with a broader task portfolio.

COCOPS Work Package 3, Country Report Hungary – May 2013 Page 9
Within this larger entity a new one – called, once again, the Prime Minister’s Office –
emerged, exerting control over a number politically highly salient areas.
- The regional (middle-tier) branches of agencies have been integrated to the 20 county level
(so-called) ‘Government Offices’ strictly controlled directed by the government and headed
by political appointees (MPs, political state secretaries etc.).
- According to the new Local Government Act (in effect from 2013) local governments’ scope
of duties and competencies are dramatically reduced (e.g. many important functions in the
field of operating secondary education and health care facilities will be taken over by the
central government).
- The new civil service legislation put recruitment and hiring of central state administrative
apparatus under strict vertical (administrative and political) control. Recruitment is strictly
controlled by the MPAJ, which is considered, in the case of managerial appointments, as a
veto right enabling its holder to enforce political considerations against
administrative/technical ones. It has been an unknown governmental vertical coordination
measure in the practice up to now (Müller 2011; pp. 135). Moreover, although the newly
introduced provision enabling the employer to dismiss the civil servants without any
justification was invalidated by the Constitutional Court, the new regulation assesses the
loyalty as an employment requirement for every civil servant. Being contravened of it might
result in dismissal.
It should be noted that underlying most of the above changes different kinds of justification appear,
oftentimes quite reasonably. For example the – or, rather: some sort of – local government reform
has for long been an urgent task given the debt burden trapping a very large proportion of local
governments as well as the broadening quality and accessibility gaps of local services they provide.
3. Data and Method
3.1 Sampling and Access Strategy and Survey Implementation
Organizations involved in the sample
Considering the requirements set by the sampling guidelines, the structural features and sizes of the
organizations possibly involved, and the possibilities for access (in particular, the extremely high
organizational volatility/continuous structural reshuffling as well as personnel turnover within both
changed and unchanged organizations having characterized the organizational landscape) the
following organizations were involved in the sampling:
- Central government ministries
- Central government agencies
- Territorial level organizations (regional, county and local level – the latter especially in
employment and health sectors)

COCOPS Work Package 3, Country Report Hungary – May 2013 Page 10
Organizational level
Employment Health Other (General) TOTAL
Central government ministry 1 1 6 8
Central agency 2 3 29 34
Subnational organisations6 40 58 - 98
TOTAL 43 62 38 143
Central government
On the level of ministries, all of the relevant contact information of the existing ministries was
reachable and the large majority of them were correct. According to the 32 central agencies there
were 3 organizations that did not provide any information of the management. These institutions
were newly established – mostly in the period when the data collection was carried out (spring 2012)
– and the members of the management had not been nominated/appointed then. Other 3 of the
central agencies provided contact information only on the top-level. There were some employee
fluctuations in the management duo to the organizational realignments, so around 30 invitations
that have not reached the respondents.
Employment
Organizations of the employment policy sector were included in the sample at all tiers of the
administrative hierarchy. These are the following: the ministry and the agency level, and county level
and local level field offices of the employment agency (altogether about 150 organizations).
The whole of the employment sector has been realigned in 1st January 2012. The two major central
employment agencies have been merged, the regional offices have been absorbed in the county –
level Government Offices, the number of the employees has been narrowed and many personal
changes were achieved. There were many overlapping and outdated information available that time
concerning the contact data. These facts caused uncertainty both of the central and regional levels,
and 60-70 – mostly due to the overlapping, parallel mailing addresses- invitations that have not
reached the respondents.
Health
Organizations of the health administration sector were included on all tiers of the administrative
hierarchy. These are as follows: the ministry and agencies in charge, the regional (n=7) directorates
of the Health Insurance Administration, county level organs, and sub-county (local) level
organizations of the National Public Health and Medical Officer Service (83 organizations in total).
On the central level almost the entire targeted population was reachable via e-mail. On the county
level (N=20) – with 3 exceptions – only the top-management (first level) could be invited to the
survey due to the lack of contact information. It means about 40-50 losses of potential responders.
On the sub-county level the entire population was reachable.
6 Note that oftentimes it is difficult to tell whether one organizational unit qualifies as a ’separate
organization’ or, rather, as sub-unit of a larger organization

COCOPS Work Package 3, Country Report Hungary – May 2013 Page 11
Access strategy and response rates
The survey was implemented as an online questionnaire. In a very few cases respondents returned
hard copies to the research team; these questionnaires were entered by the researchers manually.
Acquiring an accurate and up-to-date list of organizational managers and their email addresses was a
very difficult task, for various reasons:
- Government organizations at all levels were, prior to as well as during the survey, constantly
re-organized at a very high rate. For example, the territorial level units of almost all agencies
were merged, and a large number of central agencies were re-shuffled or newly created in
the months preceding the survey. The IT systems (including the updating of email addresses,
websites etc.) could oftentimes not follow this pace of change (for example, three newly
established central agencies did not have a web site at the time of the survey). Consequently,
a number of employees had more than one email address at a time, while the addresses of
many others were not identifiable.
- Apart from the large-scale organizational restructurings there was/is a high rate of turnover,
particularly in the managerial positions. Therefore address lists became outdated quickly.
- Finally, despite national freedom-of-information legislation the availability of personnel data
is often difficult. Although in many of the cases names and contact details of managers are
published on the internet in a number of other cases the researchers had to rely on other
(personal, telephone, written etc.) sources of information.
Contact data were entered into a Microsoft Access database. Personalized emails, including follow-
up mails, were sent from this application. Invitations were sent as non-identifiable for the sake of
ensuring confidentiality.
Note however that one invitation does not necessarily equal one real person since there were a
number of emails that either did not reach a real respondent, or reached the same respondent two
times (on two different email addresses).
The total numbers (for all three categories) can be estimated as follows:
- non-existing email addresses: minimum 111
- duplicate email addresses: minimum 30 (these occurred in the employment sector)
In addition to these there were presumably a number of other emails which were sent to existing
email addresses (not rejected by the mail server) but whose owners had already left the position or
did not receive the email for other reasons (organizational restructuring etc.). The minimum number
of these addressees is 30.
In total, a minimum of 161 emails did not reach a real recipient. Therefore the number of real
addresses can be estimated not more than 1329. On the basis of practical judgement the real
number is around 1200, taking into account the fact that in a number of cases the email addresses of
invitees could not be revealed and the ‘forwarding-down’ method (by the invitees’ superiors) was
relied upon. About three weeks after the first invitations a reminder / thank you mail was circulated.
The composition of respondents (broken down by policy sector) is plotted on the below chart.

COCOPS Work Package 3, Country Report Hungary – May 2013 Page 12
Figure 1. Policy field sample shares
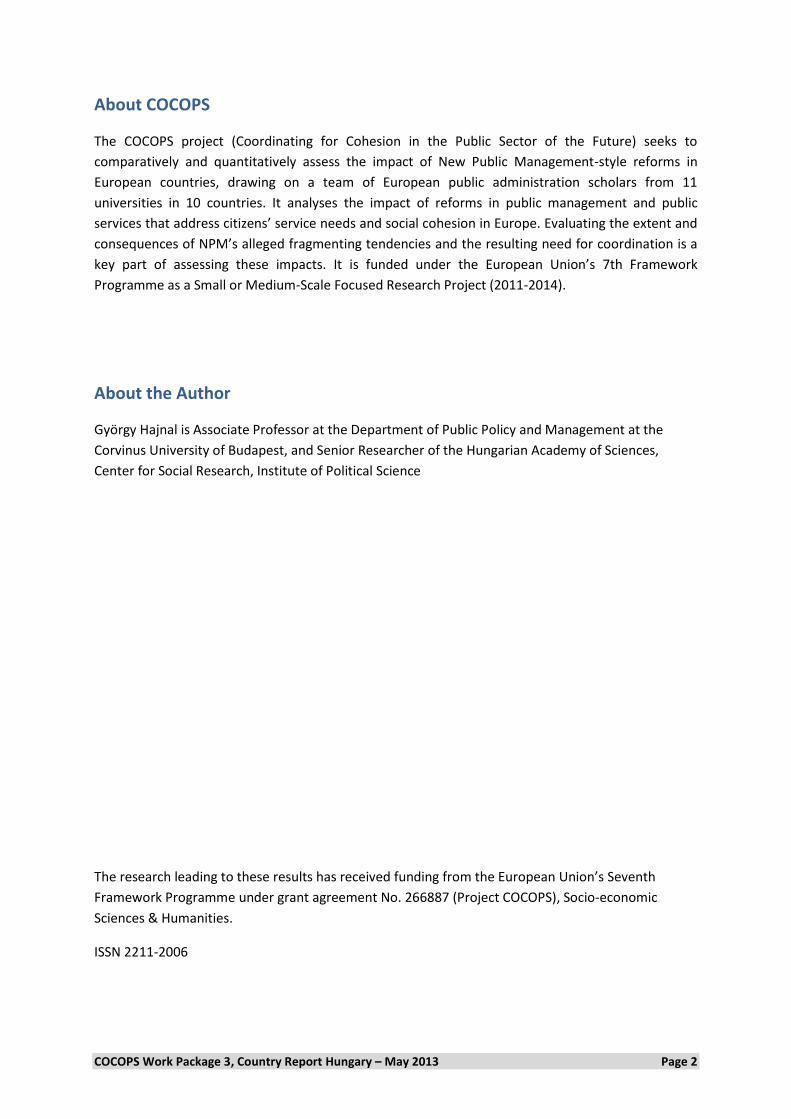
3.2 Organizational Context of Respondents In terms of the administrative tiers involved, more than one quarter of respondents work in a
subnational level organizations. Note that all these respondents belong to either the health or the
employment sector; administrative organs belonging to other sectors were included only on the
ministry and the central government agency level. From among the central (national scope)
organizations approximately the same number of respondents are employed by a ministry and by an
agency, respectively.
The distribution of respondents across organizational size categories is similar to the one found on
the European level. However, smaller organizations (up to 500 staff) have a somewhat smaller
weight (about 42% as opposed to 50%). Instead, medium sized organizations (between 500 and
1000) appear in larger a proportion.
0.0%
5.0%
10.0%
15.0%
20.0%
25.0%
30.0%
35.0%
COCOPS Work Package 3, Country Report Hungary – May 2013 Page 13
Figure 2. Organization type and size shares
3.2 Socio-demographic Background of Respondents Figure 3 below summarizes the distribution of selected variables describing respondents’ soci-
demographic characteristics.
In terms of respondents’ socio-economic characteristics it is surprising that the proportion of women
is, compared to other countries, quite high: 43% as opposed to the European average of 32%. It
should be noted however that in the top managerial positions males are strongly and significantly
over-represented (70%) while in the lower (3rd hierarhical) level under-represented (44%).
The age distribution of respondents is even more spectacularly different from the “typical COCOPS
pattern”. At the upper end of the spectrum the share of respondents aged 56 or more is only 20% as
opposed to the one-third proportion to be found on the European level. At the lower end the
difference is even greater: one fifth of the respondents are 35 or younger, which is in sharp contrast
with the ~6% overall European figure. The (relative) majority of managers are in the 36 to 45 range.
When controlling for hierarchical level the pattern changes nevertheless: in the category of top
managers young civil servants are significantly under-represented (3% as opposed to 20% at the level
of the entire sample).
These patterns are neither necessarily, nor even probably representative of the entire population of
public managers. It is unfortunately not possible, on the basis of available data, to tell whether/to
what extent these patterns reflect the population distributions. The following features of the context
may however shed additional light on this issue.
The mass “exodus” of senior managers – usually in their forties or rather fifties – from central
government organizations started already around 2006-2007. From the term of the second
Gyurcsány Cabinet (2006-2008) it became accepted that officials with very modest (even minimal)
administrative track record became (deputy) state secretaries in their early thirties. This trend
spectacularly accelerated and proliferated after the 2010 elections. The forced (not infrequently
unlawful) wave of retirements reached far outside the realm of central government to local
governments, the broader public sector (health, education) and even the judicial sector. This
sweeping wave was often backed by harsh legislative measures (some of which were successfully
35.00%
38.53%
26.47%
Ministry at central government level
Agency or subordinate government body at centralgovernment level
Agency or subordinate government body at state orregional government level
5.88% 7.65%
28.53%
34.12%
20.29%
3.82%
< 50 50-99 100-499
500-999 1000-5000 > 5000

COCOPS Work Package 3, Country Report Hungary – May 2013 Page 14
challenged even before the European Court of Justice), and a similar informal / cultural backing.
Different stakeholders such as trade unions and civic organizations tried to resist these changes but
this resistance was most of the time swept aside. Besides the above factors self-selection may have
played some role too. It may be assumed that in the entire population age and seniority are
positively correlated while age and responsiveness negatively. Therefore less senior and younger
managers are more likely to respond and thus might have become over-represented in the response
set.
Figure 3. Socio-demographic shares (f.l.t.r.) Gender, Age, Hierarchy in organization, Educational background
An absolute majority of respondents belong to the second hierarchical level in the organization
(bottom-left panel of Figure 3). The proportion of first-level managers is, compared to the overall
COCOPS results, modest. According to our judgment it is nevertheless still quite high, compared to
the general unavailability and extremely stressed time management of top-level bureaucrats.
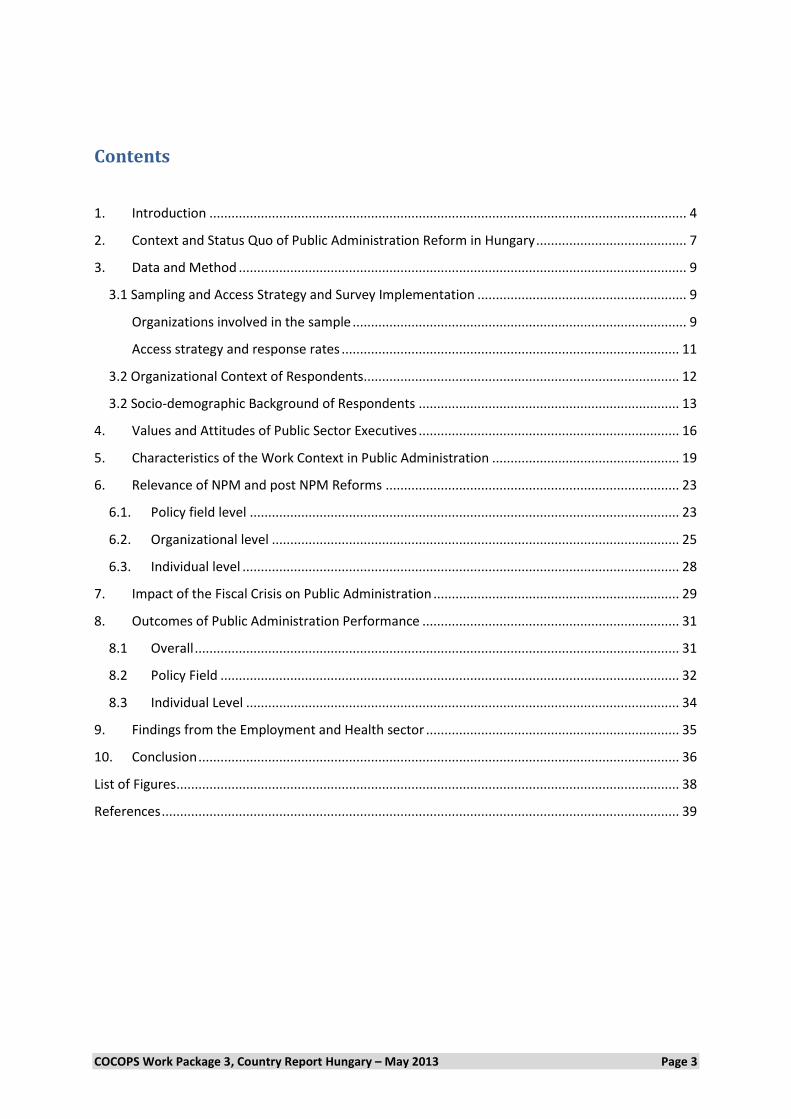
In terms of their educational achievement Hungarian respondents are somewhat less educated as
less than 10% (as opposed to 15% European figure) has a doctoral degree while 22% has a BA level
only – presumably most of whom completed the College of Public Administration. The most
remarkable feature of data on education is the high proportion of those having a legal background
(40% as opposed to the overall 27% frequency in the COCOPS sample). Note that in addition to the
majority of these respondents having an MA in Law graduates having a BA in ‘Public Administration’
(previously: College of Public Administration) are also coded into this category. This is justified by the
fact that, in line with the disciplinary traditions of the field in Hungary, approximately two thirds of
56.62% 43.38%
Male Female
19.93%
34.64% 24.84%
19.93%
0.65%
35 or less 36-4546-55 56-6566 or older
11.44%
56.89%
31.67%
Top hierarchical level in organisation
Second hierarchical level in organisation
Third hierarchical level in organisation
22.22%
68.30%
9.48%
Graduate degree (BA level)
Postgraduate degree (MA level)
PhD/doctoral degree
COCOPS Work Package 3, Country Report Hungary – May 2013 Page 15
program curricula in these programs are of a fundamentally legal character (Hajnal 1999, Hajnal-
Jenei 2008).
It is remarkable that public managers with a business / economics educational background are quite
significant in terms of their proportion, which is clearly above the European average (29 as opposed
to 23%). A third feature to be observed is the minimal presence of graduates of programs specifically
designed to staff the public sector (Political Science and ‘real’ Public Administration programs). In
order to properly contextualize this figure it is important to know that since the introduction of the
Bologna reforms in Hungary only one ‘real’ (i.e., non-legal) Public Administration program operated
at the MA level (the so-called MA in Public Policy and Management at the Corvinus University of
Budapest). However this has been, and still is, a relatively small program with a few dozens of
graduates per year.
Figure 4. Educational fields (respondents could check more than one field)
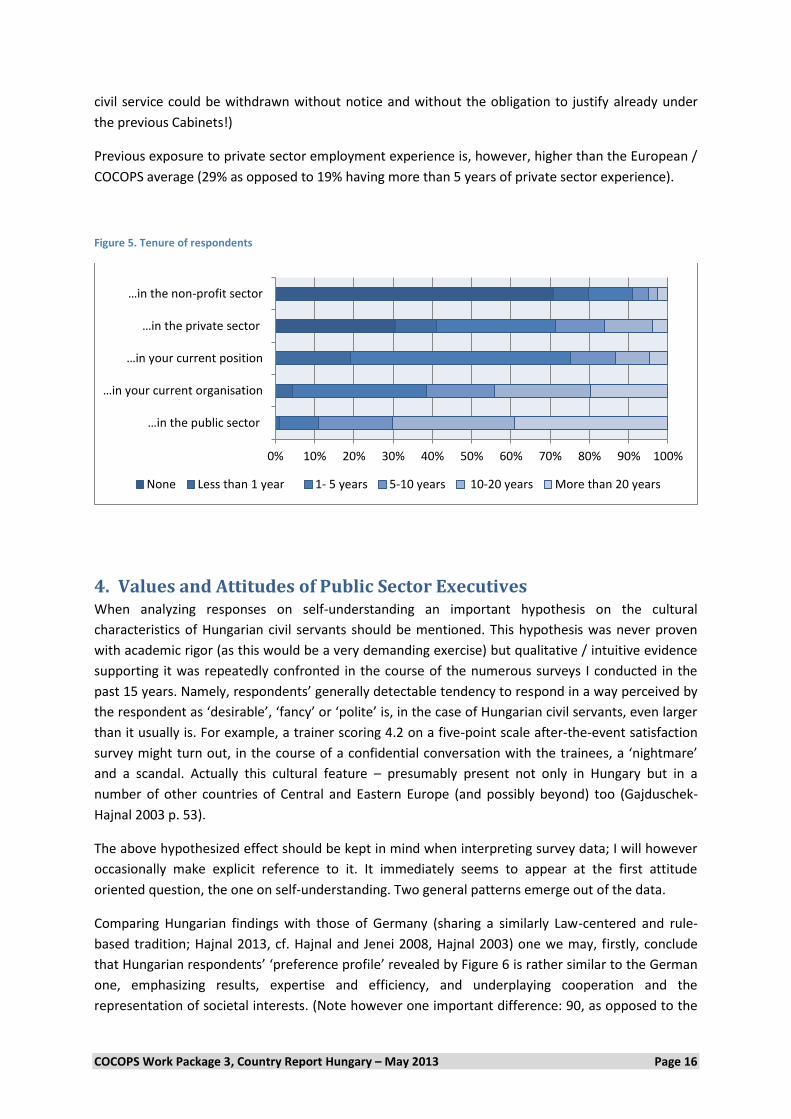
The pattern of tenure of respondents revealed by the Figure 5 corresponds to the one identified
earlier in relation to respondents’ seniority. In contrast to the European figure averaging at 60% only
40% of respondents have served more than 20 years in the public sector.
One of the most remarkable features of the data is that three fourths of respondents served less
than 5 years in their current position. It may well be assumed that a vast majority of these persons
took their current position after the 2010 inauguration of the second Orbán Cabinet. The second
Orbán Cabinet initiated, immediately after its inauguration, a radical elimination of the civil service
dismissal regulations. The new civil service legislation put recruitment and hiring of central state
administrative apparatus under strict vertical (administrative and political) control. The new
legislation enabled the employer to dismiss the civil servants without any justification – this level of
protection is significantly weaker as the one characterizing regular labor law. Although this piece of
legislation was later on invalidated by the Constitutional Court, the employment status of those
already having been removed (mostly in managerial ranks) was not restituted. Moreover, even the
new regulation assesses the loyalty as an employment requirement for every civil servant. Being
contravened of it might result in dismissal – a rather easy, and presumably oftentimes relied-upon,
way of getting rid of unwanted personnel. (Note however that managerial nomination in the entire
0.0%5.0%
10.0%15.0%20.0%25.0%30.0%35.0%40.0%45.0%
Law Business/management/
economics
Political science/public
administration
Other socialsciences andhumanities
Medical science Natural sciencesand engineering
COCOPS Work Package 3, Country Report Hungary – May 2013 Page 16
civil service could be withdrawn without notice and without the obligation to justify already under
the previous Cabinets!)
Previous exposure to private sector employment experience is, however, higher than the European /
COCOPS average (29% as opposed to 19% having more than 5 years of private sector experience).
Figure 5. Tenure of respondents
4. Values and Attitudes of Public Sector Executives When analyzing responses on self-understanding an important hypothesis on the cultural
characteristics of Hungarian civil servants should be mentioned. This hypothesis was never proven
with academic rigor (as this would be a very demanding exercise) but qualitative / intuitive evidence
supporting it was repeatedly confronted in the course of the numerous surveys I conducted in the
past 15 years. Namely, respondents’ generally detectable tendency to respond in a way perceived by
the respondent as ‘desirable’, ‘fancy’ or ‘polite’ is, in the case of Hungarian civil servants, even larger
than it usually is. For example, a trainer scoring 4.2 on a five-point scale after-the-event satisfaction
survey might turn out, in the course of a confidential conversation with the trainees, a ‘nightmare’
and a scandal. Actually this cultural feature – presumably present not only in Hungary but in a
number of other countries of Central and Eastern Europe (and possibly beyond) too (Gajduschek-
Hajnal 2003 p. 53).
The above hypothesized effect should be kept in mind when interpreting survey data; I will however
occasionally make explicit reference to it. It immediately seems to appear at the first attitude
oriented question, the one on self-understanding. Two general patterns emerge out of the data.
Comparing Hungarian findings with those of Germany (sharing a similarly Law-centered and rule-
based tradition; Hajnal 2013, cf. Hajnal and Jenei 2008, Hajnal 2003) one we may, firstly, conclude
that Hungarian respondents’ ‘preference profile’ revealed by Figure 6 is rather similar to the German
one, emphasizing results, expertise and efficiency, and underplaying cooperation and the
representation of societal interests. (Note however one important difference: 90, as opposed to the
0% 10% 20% 30% 40% 50% 60% 70% 80% 90% 100%
…in the public sector
…in your current organisation
…in your current position
…in the private sector
…in the non-profit sector
None Less than 1 year 1- 5 years 5-10 years 10-20 years More than 20 years

COCOPS Work Package 3, Country Report Hungary – May 2013 Page 17
56% figure for Germany, agrees with the impartial execution of laws; see next paragraphs.) This
similarity is not surprising given the strongly Germanic and legalistic tradition of Hungarian public
administration (Hajnal-Jenei 2008, Hajnal 2003 and 2013). Therefore the self-understanding of
Hungarian public managers may be interpreted in a way similar to the one found in the German
report – that is, a sign of a neo-Weberian attitude set.
Secondly however, Hungarian respondents agree with all of the listed (presumably) positive /
appealing values to an extent larger than the German respondents. In other words, they agree with
whatever they have to agree with to a larger extent. Therefore a direct comparison of means /
distributions with the ones found in other countries may be somewhat problematic; rather, some
kind of a normalization of data across countries (e.g. calculation of Z-scores) could provide for a basis
for doing so.
Figure 6. Identity and self-understanding (Q: I mainly understand my role as public executive as)
Figure 7. Priorities as public servants (Q: Public services often need to balance different priorities. Where would you place your own position
In terms of the competing values facing public service we find a relatively balanced pattern in two
dimensions: user charges versus tax financed services, and quality versus efficiency. Along the other
four dimensions there is a more definite tendency towards one or the other extreme of the
dichotomy. Respondents tend to prefer efficiency over equity, rule observation over the
achievement of results, customer focus versus citizen orientation, and state provision over market
provision.
The tendency is particularly strong in the case of rule observation and state provision. These patterns
seem to be consistent with the data plotted on the previous chart. Hungarian public managers have a
strong preference for a Weberian ethos of bureaucracy, focusing on rules and the state, instead of
results and the market. On the other hand they underplay the moral dimensions of public service,
and assume a more technocratic role instead.
0% 10% 20% 30% 40% 50% 60% 70% 80% 90% 100%
Ensuring impartial implementation of laws and…
Getting public organisations to work together
Achieving results
Providing a voice for societal interests
Developing new policy agendas
Providing expertise and technical knowledge
Finding joint solutions to solve problems of…
Ensuring efficient use of resources
Strongly disagree … … … … … Strongly agree

COCOPS Work Package 3, Country Report Hungary – May 2013 Page 18
With regards to the personal motivation of public managers the two least characteristic motivators
are flexible working hours, and social status (an arithmetic mean of 4.33 and 4.03, respectively).
These results are identical with the overall COCOPS findings.
This pattern is understandable in the Hungarian context: public managers working schedule is usually
very stretched and rigid, and they do not enjoy a social status that corresponds that of employees
with similar educational background and tenure in the corporate or, say, the academic sector. It may
therefore be expected that those who have a high preference for these values are likely to choose, in
the longer term, another career path.
On the other hand, the two most important motivating factors are – more or less consistently with
the overall COCOPS results – interesting work, and room to make decisions (arithmetic mean of 6.07
and 6.09, respectively).
These data suggest that public managers choose their occupation for intrinsic reasons. It should be
noted however that the dimensions of intrinsic motivation, in which they score high do not involve
such elements as the urge to serve to public interest. Neither do they score particularly high on
dimensions related to material rewards. All this adds up to a profile consistent with those revealed
by answers to earlier questions: respondents seem to have a personal but technocratic interest in
what they do.
Figure 8. Motivation (Q: How important do you personally think it is in a job to have)
The value preferences displayed on the figure below suggest that Hungarian public managers have
stronger-than-average disagreement with three statements. Interestingly enough, the largest
disagreement appears in relation to the status quo orientation: although more than 40% disagrees
about 42% agrees with this statement (mean 3.92), which is significantly higher than the 2.8 mean
for the entire COCOPS sample. On the other hand respondents do not particularly favor taking risks
either (mean 4.23).
0% 10% 20% 30% 40% 50% 60% 70% 80% 90% 100%
Interesting work
High income
Opportunities to help other people
Job security
Room to make decisions
Good opportunities for promotion
Doing something that is useful to society
Flexible working hours
Status
Not important at all … … … … … Very important

COCOPS Work Package 3, Country Report Hungary – May 2013 Page 19
Figure 9. Social value preferences (Q: Please indicate how far you agree or disagree with the following statements)
The proper interpretation of the above findings requires further exploratory and, possibly,
explanatory analysis. It may be noted that respondents do not particularly seem to trust other people
either. At the other extreme, the largest support appears for the claim that creativity is important for
the respondent. Taking responsibility for decisions enjoys an (almost) similarly high support
These patterns, at large, are consistent with the profile revealed by earlier items: respondents place
a value on those aspects of their work that are related to the intellectual challenge and act of
deciding and taking responsibility. On the other hand they underplay the human, societal and moral
dimensions.
5. Characteristics of the Work Context in Public Administration Responses on goal ambiguity are interesting (see Figure 10): while respondents think that goals are
clearly stated and communicated throughout the organization (about 60% agreeing, mean=5.5,
about the same as the overall COCOPS sample), they also think that the organization is characterized
by a high number of goals (64% agreeing, mean=5.7 as opposed to 5.0 in the overall COCOPS
sample).
Part of the solution to the interpretive problem posed by the above data may be that the feeling of
not being rewarded (by the political masters) is primarily related to respondents’ own experience,
while the other, more managerial and technical questions of goal ambiguity are interpreted in the
context of the entire organization.
0% 10% 20% 30% 40% 50% 60% 70% 80% 90% 100%
I believe that success depends on ability rather…
I like taking responsibility for making decisions
I make decisions and move on
Being creative and thinking up new ideas are…
I avoid doing anything that might upset the…
Being successful is very important to me
I like to take risks
I believe that most people can be trusted
Strongly disagree … … … … … Strongly agree Prefer not to answer

COCOPS Work Package 3, Country Report Hungary – May 2013 Page 20
Figure 10. Goal ambiguity (Q: To what extent do the following statements apply to your organization?)
The following set of questions (summarized on Figure 11) refers to different dimensions of the
autonomy and discretion enjoyed by respondents.
The lowest level of autonomy appears in relation to contracting out services, 62% perceiving very
little autonomy (mean=1.9 as opposed to 3.3 in the overall COCOPS sample). This may be related to
the high level of centralization (in most organizations service contracts have to be signed by the
organization’s no.1. manager, and this decision is often further constrained by budget limitations).
Proceeding in an ascending order of autonomy the second-lowest level appears in relation to
planning and executing budgets (mean=2.55 as opposed to 3.92 in the entire sample).
At the other extreme, a significant extent of autonomy appears in relation to implementation (44%
perceiving a higher-than-medium level of autonomy, mean=4.91), exceeding the European average
by 0.3. This dimension of autonomy is significantly higher than the second-highest, policy design and
choice (mean=3.71 as opposed to 3.80 in the overall COCOPS sample).
The remaining four dimensions of autonomy may be located between the above extremes.
These data suggest that respondents feel a relative lack of being constrained in terms of the ends to
be pursued and the processes and methods chosen to achieve them on the one hand, but a very
strong sense of being constrained in relation to deciding the budgetary means and service
procurement necessary to perform these tasks.
0% 10% 20% 30% 40% 50% 60% 70% 80% 90% 100%
Our goals are clearly stated
Our goals are communicated to all staff
We have a high number of goals
It is easy to observe and measure our activities
Strongly disagree … … … … … Strongly agree

COCOPS Work Package 3, Country Report Hungary – May 2013 Page 21
Figure 11. Degree of management autonomy (Q: In my position, I have the following degree of autonomy with regard to)
The above data may be supplemented by the following items referring to the frequency of
interactions with different actors (Figure 12).
Understandably, administrative superiors and direct staff are in a very frequent interaction with
respondents; in these cases a majority of respondents report very frequent contact (in both cases
about 50% of respondents have daily contact with them). At the other extreme we find the
respective ministers (never: 56% as opposed to 36% in the overall sample), trade unions (never: 44%
as opposed to 20% in the overall sample) and international organizations (other than EU entities;
never: 49% - similar to the overall COCOPS sample). However if we focus on those relationships
where at least monthly contact frequency is reported an interesting picture emerges. Namely, only
6% of respondents have a contact their minister at least once a month – as opposed to the 30%
figure for the entire COCOPS sample. The same figure is 12% for other politicians (as opposed 36%
for the entire COCOPS sample).
These figures suggest that politicization in terms of personal contact is fairly low in Hungary in a
comparative perspective; my personal interpretation would be that it works through channels other
than personal contact with politicians – for example, through direct contacts with administrative
superiors.
0% 10% 20% 30% 40% 50% 60% 70% 80% 90% 100%
Budget allocations
Contracting out services
Promoting staff
Hiring staff
Dismissing or removing staff
Changes in the structure of my organisation
Policy choice and design
Policy implementation
Very low autonomy … … … … … Very high autonomy

COCOPS Work Package 3, Country Report Hungary – May 2013 Page 22
Figure 12. Interaction frequency (Q: Please indicate how frequently you typically interact with the following actors or bodies)
Figure 13. Coordination quality (Q: How would you characterize collaboration in your own policy field between)
In terms of the perceived quality of coordination (summarized in Figure 13) respondents are
relatively more critical towards coordination between different policy areas (mean: 4.1 – note that is
still substantially better than the 3.55 mean for the entire COCOPS sample) and coordination
between national and supra-/international organizations (mean: 4.1, the lowest among the
dimensions examined here). The highest satisfaction appears in relation to coordination quality in
the respondents’ own policy area (mean: 4.6). It should be noted however that those unable to
assess appear in a high proportion (up to 30% in the case of supra-/international coordination).
Interestingly, the assessment of coordination quality is significantly better in Hungary than in the
overall COCOPS sample across practically all dimensions. This fact – and basically any finding related
to perceptions on coordination – should be viewed keeping in mind that the very concept of
coordination in government is, firstly, barely present and used in the Hungarian context and,
0% 10% 20% 30% 40% 50% 60% 70% 80% 90%100%
My responsible Minister
Other politicians
My direct staff
Subordinate agencies and bodies
Administrative units within my organisation such as…
Audit organisations, inspectorates and regulatory bodies
Other government departments outside my own…
Local/regional government
Private sector companies
Trade union representatives
European Union institutions
International bodies (e.g. IMF, OECD, ILO)
Media
Never Rarely Yearly Monthly Weekly Daily
0% 10% 20% 30% 40% 50% 60% 70% 80% 90% 100%
National government bodies within the samepolicy area
National government bodies from different policyareas
National and local/regional government bodies
National and supra-national bodies/internationalorganisations
Government bodies and private and voluntarysector stakeholders
Very poor … … … … … Very good Cannot assess

COCOPS Work Package 3, Country Report Hungary – May 2013 Page 23
secondly, even if it’s used it is understood in a sense that markedly differs from the common English
/ international use of the term (Hajnal and Kovács 2013).
Finally, the politicization of administration is examined through a series of questions directly related
to different dimensions of political control. These responses are plotted below (Figure 14).
Figure 14. Degree of politization (Q: What is your view on the following statements)
Interference with routine matters of the respondent’s organizations appears in only 12% of the cases
as opposed to the 21.5%y frequency observed in the entire COCOSP sample (values 5 and above). A
strikingly low 17% of respondents think that politicians respect technical expertise (as opposed to the
54% figure appearing in the entire COCOPS sample). Since (i) these data seem to contradict to one
another to some extent, and (ii) at the same time both of these figures are clear outliers in a
comparative perspective further investigation is necessary to properly interpret them. An initial
hypothesis would be that by claiming “regular interference in routine activities” the respondent
would in fact suspect his/her political master with illegal or even criminal activities – the risk of what
is unlikely to be taken even if that was in fact true. In a similar vein, 41% tend to agree with the claim
that politicians regularly interfere with senior appointments – the true figure probably being very
close to 100%. This is supported by the fact that 64% of respondents (as opposed to the 55% in the
total COCOPS sample) tend to agree with the statement that removing issues from the realm of
politics would improve things – a figure much higher than the ones appearing in other counties’ data.
6. Relevance of NPM and post NPM Reforms
6.1. Policy field level Going from the lowest to the highest figuring techniques appearing, according to respondents’
perceptions, in the reform measures characterizing their broader policy field privatization appears as
the most unpopular element, 93% claiming rather not using this (mean=1.5 as opposed to 2.58 in the
0% 10% 20% 30% 40% 50% 60% 70% 80% 90%100%
Politicians respect the technical expertise of seniorexecutives
Politicians regularly influence senior-levelappointments in my organisation
In my organisation politicians interfere in routineactivities
Senior executives and not politicians initiatereforms or new policies
Removing issues and activities from the realms ofpolitics produces better policies
Strongly disagree … … … … … Strongly agree Cannot assess
COCOPS Work Package 3, Country Report Hungary – May 2013 Page 24
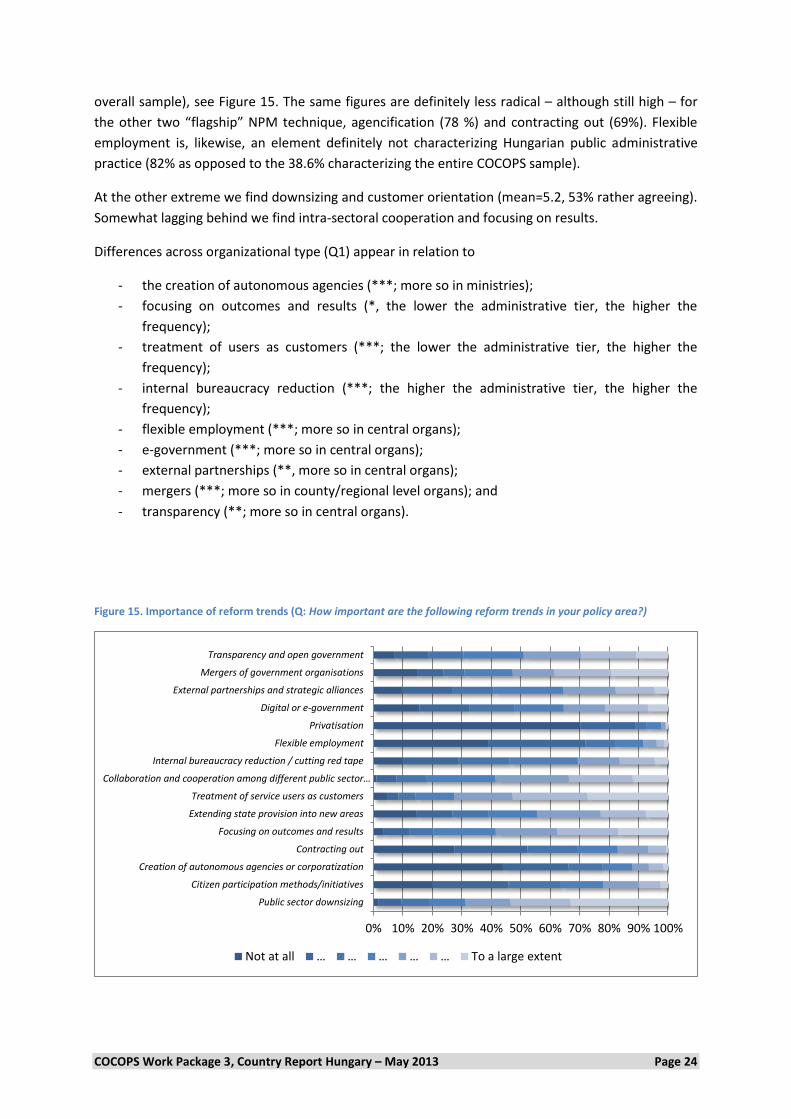
overall sample), see Figure 15. The same figures are definitely less radical – although still high – for
the other two “flagship” NPM technique, agencification (78 %) and contracting out (69%). Flexible
employment is, likewise, an element definitely not characterizing Hungarian public administrative
practice (82% as opposed to the 38.6% characterizing the entire COCOPS sample).
At the other extreme we find downsizing and customer orientation (mean=5.2, 53% rather agreeing).
Somewhat lagging behind we find intra-sectoral cooperation and focusing on results.
Differences across organizational type (Q1) appear in relation to
- the creation of autonomous agencies (***; more so in ministries);
- focusing on outcomes and results (*, the lower the administrative tier, the higher the
frequency);
- treatment of users as customers (***; the lower the administrative tier, the higher the
frequency);
- internal bureaucracy reduction (***; the higher the administrative tier, the higher the
frequency);
- flexible employment (***; more so in central organs);
- e-government (***; more so in central organs);
- external partnerships (**, more so in central organs);
- mergers (***; more so in county/regional level organs); and
- transparency (**; more so in central organs).
Figure 15. Importance of reform trends (Q: How important are the following reform trends in your policy area?)
0% 10% 20% 30% 40% 50% 60% 70% 80% 90% 100%
Public sector downsizing
Citizen participation methods/initiatives
Creation of autonomous agencies or corporatization
Contracting out
Focusing on outcomes and results
Extending state provision into new areas
Treatment of service users as customers
Collaboration and cooperation among different public sector…
Internal bureaucracy reduction / cutting red tape
Flexible employment
Privatisation
Digital or e-government
External partnerships and strategic alliances
Mergers of government organisations
Transparency and open government
Not at all … … … … … To a large extent

COCOPS Work Package 3, Country Report Hungary – May 2013 Page 25
The different statements about the nature and results of reforms happening to respondents’ own
policy field (see Figure 16) are perceived as top-down rather than bottom-up (mean=2.6); cutting
costs rather than improving services (mean=3.7); driven by politicians rather than by senior
executives (mean=4.1); and contested, rather than supported by unions (mean=4.5). In all but the
fourth dimensions Hungarian perceptions lean towards the former (as opposed to the latter) end of
the spectrum, compared to the overall COCOPS data.
Opinions on the remaining features of reforms are closer to the mid-point (+/- 1 range of the 5.5
value). This picture seems consistent with findings related to the underplayed role of public
managers in substantive decisions affecting resources too (presented earlier).
Figure 16. Dynamics of public sector reform (Q: Public sector reforms in my policy area tend to be)
6.2. Organizational level The most popular management techniques (values 5 and above on Figure 17) employed in
respondents’ organization are internal steering by contract (43%)7, customer surveys (43%), service
points for customers (42%), and performance appraisal (41%)8. The first two techniques appear in a
similar extent in the overall COCOPS data, performance appraisal is however much more frequent
elsewhere (almost 80%). At the other extreme of the spectrum we find performance related pay
(78% rather not using), cost accounting systems (67%) and decentralization of staffing decisions
(64%) and of financial decisions (63%).
Understandably, these elements appear with different frequencies across different organization
types (only statistically significant relationships are listed):
7 Note however that in a vast majority of the cases this presumable does not mean a formal system of
management, rather, the existence of individual agreements between (certain) superiors and
(certain) subordinates to perform a certain task
8 Note however that this is usually not associated with performance related pay: 6%
0% 10% 20% 30% 40% 50% 60% 70% 80% 90% 100%
Top down - Bottom up
Consistent - Inconsistent
Comprehensive- Partial
Driven by politicians- Driven by senior executives
Crisis and incident driven- Planned
Substantial - Symbolic
Contested by unions - Supported by unions
About cost-cutting & savings - About service improvement
No public involvement - High public involvement
Unsuccessful - Successful
Too demanding- Not demanding enough

COCOPS Work Package 3, Country Report Hungary – May 2013 Page 26
- Strategic / business planning (**; mostly in central agencies);
- Customer surveys (***; the lower the administrative tier, the higher the frequency);
- Service points for customers (***; the lower the administrative tier, the higher the
frequency);
- Quality management (***; the lower the administrative tier, the higher the frequency);
- Codes of conduct (*; mostly in central agencies);
- Internal steering by contract (the lower the administrative tier, the higher the frequency);
- MBO (the lower the administrative tier, the higher the frequency; note that the
understanding of the concept by the respondents of the concept involved is questionable at
best);
- Benchmarking (**;the lower the administrative tier, the higher the frequency; the
understanding of the concept by respondents is questionable again);
- Cost accounting (*; mostly in central agencies);
- Decentralizing budget decisions (*; the lower the administrative tier, the higher the
frequency);
- Performance related pay (***; mostly in central organs);
- Performance appraisal (***;the lower the administrative tier, the higher the frequency); and
- Risk management (***; lowest in ministries, highest in central agencies);
Figure 17. Relevance of different management instruments (Q: To what extent are the following instruments used in your organization?)
When asked about the patterns of using PI’s in the respondent’s organization (Figure 18) the highest
frequency occurs, interestingly, in relation to measuring outputs and outcomes (33% rather
agreeing); note however that in absolute terms even this seems to be a rather low figure too. This is
particularly so as we move down the administrative tiers (***). This frequency is larger than the one
0% 10% 20% 30% 40% 50% 60% 70% 80% 90% 100%
Assess whether I reach my targets
Monitor the performance of my colleagues
Identify problems that need attention
Foster learning and improvement
Satisfy requirements of my line manager
Communicate what my organisation does to…
Engage with external stakeholders (e.g. interest…
Manage the image of my organisation
Not at all … … … … … To a large extent

COCOPS Work Package 3, Country Report Hungary – May 2013 Page 27
found in relation to “measuring inputs and processes” (only 21% rather agreeing, lower values in
ministries ***). These pieces of information suggest that issues of validity might be present here,
given that budget and staffing decisions are, according to both responses presented earlier and
expert information, very strongly centralized and regulated. It may be hypothesized that the
measurement of outputs and outcomes is perceived by the respondents as a sort of “must”, without
which it is difficult for them to appear as legitimate.
At the other extreme, being rewarded for achieving results occurs quite rarely (76% rather not
agreeing), especially on the lowest tier of administration (***), where as much as 93% rather does
not agree with this claim.
It may be noted that the (perceived) absence of using PI’s on politicians’ part (54% disagreeing, mean
= 3.41, similar to overall COCOPS results) may, in the light of data presented earlier – suggesting that
performing well and achieving results is not unimportant for respondents – be interpreted as
respondents having a high standard of reference in relation to being rewarded by politicians for high
performance, to which standards politicians are oftentimes not up to.
Figure 18. Relevance of performance management (Q: To what extent do the following statements apply to your organization?)
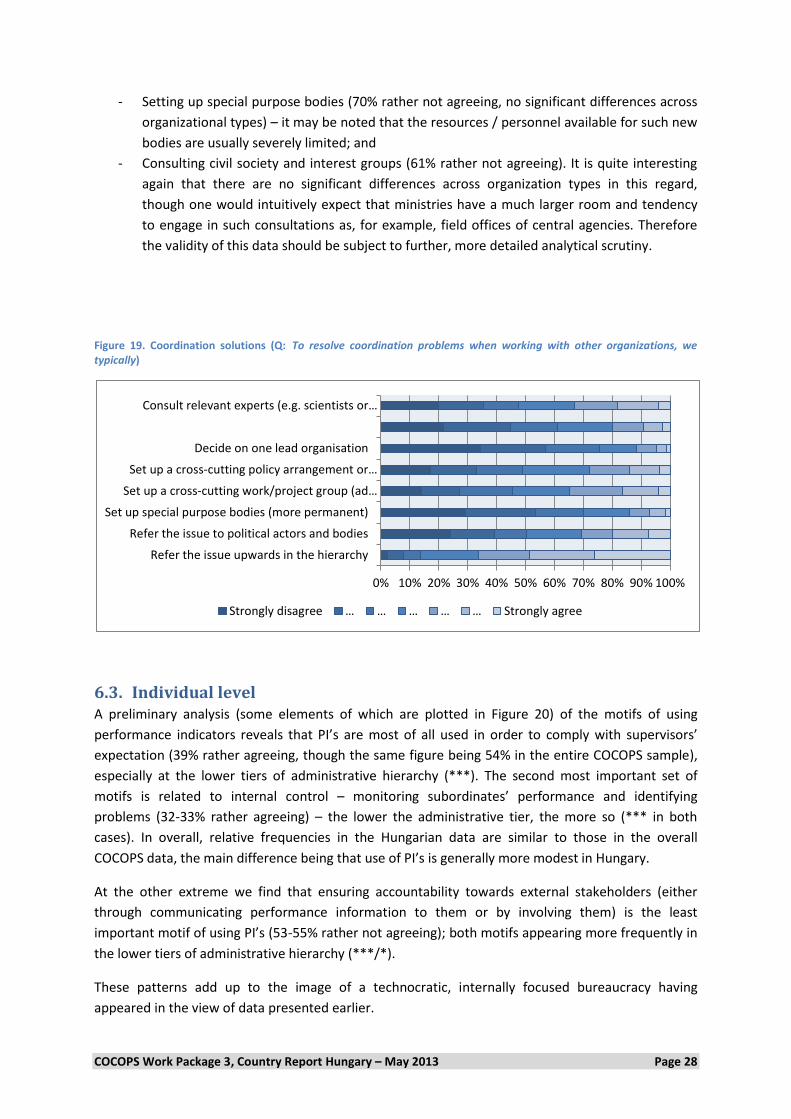
The third organizational level set of indicators examined here are related to organizational responses
given to coordination problems. It is not surprising that by far the most frequent response to such
situations is referring the issue upwards in the hierarchy (49% rather agreeing – interestingly, this
figure is 67% in the entire COCOPS sample). This approach seems to be equally present across all
administrative tiers (no significant differences across organization types).
All other solutions seem to be unpopular rather than popular (means in all cases below 3.5). The
most unpopular are the following.
- Deciding on one lead organization (76% rather not agreeing), minor differences across
organization categories (*);
0% 10% 20% 30% 40% 50% 60% 70% 80% 90%100%
We mainly measure inputs and processes
We mainly measure outputs and outcomes
We are rewarded for achieving our goals
We face clear sanctions for not achieving our goals
Politicians use indicators to monitor ourperformance
Strongly disagree … … … … … Strongly agree
COCOPS Work Package 3, Country Report Hungary – May 2013 Page 28
- Setting up special purpose bodies (70% rather not agreeing, no significant differences across
organizational types) – it may be noted that the resources / personnel available for such new
bodies are usually severely limited; and
- Consulting civil society and interest groups (61% rather not agreeing). It is quite interesting
again that there are no significant differences across organization types in this regard,
though one would intuitively expect that ministries have a much larger room and tendency
to engage in such consultations as, for example, field offices of central agencies. Therefore
the validity of this data should be subject to further, more detailed analytical scrutiny.
Figure 19. Coordination solutions (Q: To resolve coordination problems when working with other organizations, we typically)
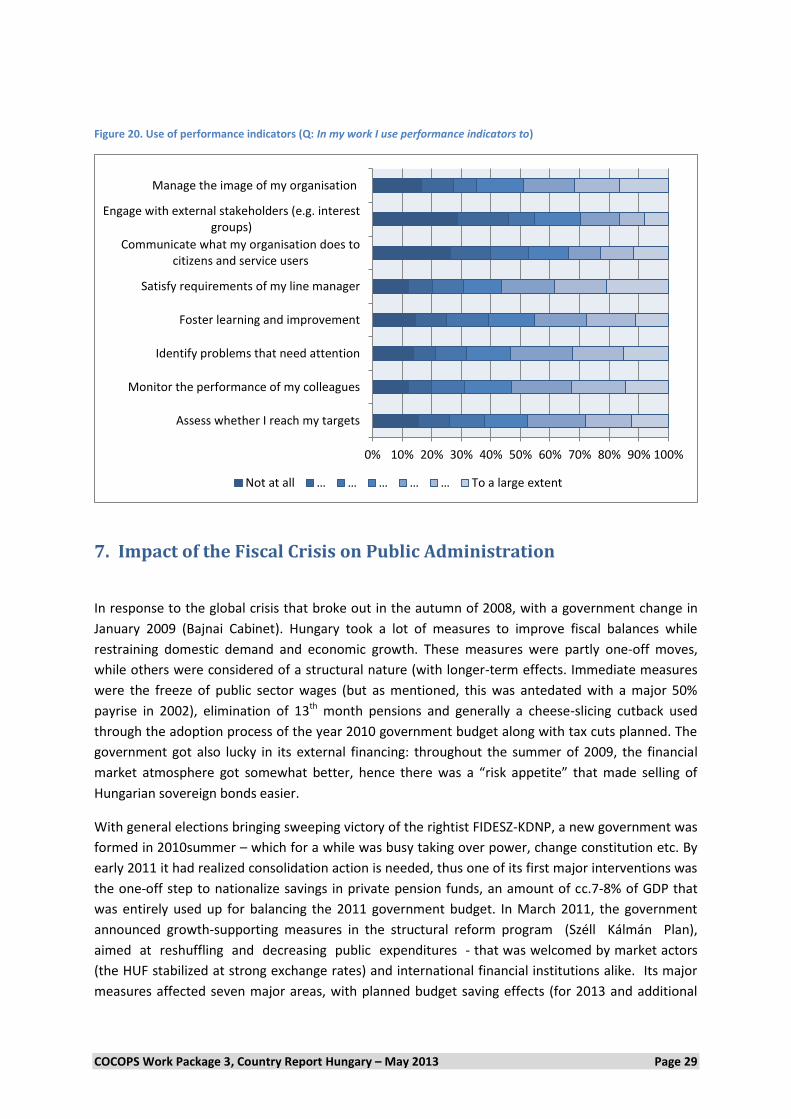
6.3. Individual level A preliminary analysis (some elements of which are plotted in Figure 20) of the motifs of using
performance indicators reveals that PI’s are most of all used in order to comply with supervisors’
expectation (39% rather agreeing, though the same figure being 54% in the entire COCOPS sample),
especially at the lower tiers of administrative hierarchy (***). The second most important set of
motifs is related to internal control – monitoring subordinates’ performance and identifying
problems (32-33% rather agreeing) – the lower the administrative tier, the more so (*** in both
cases). In overall, relative frequencies in the Hungarian data are similar to those in the overall
COCOPS data, the main difference being that use of PI’s is generally more modest in Hungary.
At the other extreme we find that ensuring accountability towards external stakeholders (either
through communicating performance information to them or by involving them) is the least
important motif of using PI’s (53-55% rather not agreeing); both motifs appearing more frequently in
the lower tiers of administrative hierarchy (***/*).
These patterns add up to the image of a technocratic, internally focused bureaucracy having
appeared in the view of data presented earlier.
0% 10% 20% 30% 40% 50% 60% 70% 80% 90% 100%
Refer the issue upwards in the hierarchy
Refer the issue to political actors and bodies
Set up special purpose bodies (more permanent)
Set up a cross-cutting work/project group (ad…
Set up a cross-cutting policy arrangement or…
Decide on one lead organisation
Consult relevant experts (e.g. scientists or…
Strongly disagree … … … … … Strongly agree
COCOPS Work Package 3, Country Report Hungary – May 2013 Page 29
Figure 20. Use of performance indicators (Q: In my work I use performance indicators to)
7. Impact of the Fiscal Crisis on Public Administration
In response to the global crisis that broke out in the autumn of 2008, with a government change in
January 2009 (Bajnai Cabinet). Hungary took a lot of measures to improve fiscal balances while
restraining domestic demand and economic growth. These measures were partly one-off moves,
while others were considered of a structural nature (with longer-term effects. Immediate measures
were the freeze of public sector wages (but as mentioned, this was antedated with a major 50%
payrise in 2002), elimination of 13th month pensions and generally a cheese-slicing cutback used
through the adoption process of the year 2010 government budget along with tax cuts planned. The
government got also lucky in its external financing: throughout the summer of 2009, the financial
market atmosphere got somewhat better, hence there was a “risk appetite” that made selling of
Hungarian sovereign bonds easier.
With general elections bringing sweeping victory of the rightist FIDESZ-KDNP, a new government was
formed in 2010summer – which for a while was busy taking over power, change constitution etc. By
early 2011 it had realized consolidation action is needed, thus one of its first major interventions was
the one-off step to nationalize savings in private pension funds, an amount of cc.7-8% of GDP that
was entirely used up for balancing the 2011 government budget. In March 2011, the government
announced growth-supporting measures in the structural reform program (Széll Kálmán Plan),
aimed at reshuffling and decreasing public expenditures - that was welcomed by market actors
(the HUF stabilized at strong exchange rates) and international financial institutions alike. Its major
measures affected seven major areas, with planned budget saving effects (for 2013 and additional
0% 10% 20% 30% 40% 50% 60% 70% 80% 90% 100%
Assess whether I reach my targets
Monitor the performance of my colleagues
Identify problems that need attention
Foster learning and improvement
Satisfy requirements of my line manager
Communicate what my organisation does tocitizens and service users
Engage with external stakeholders (e.g. interestgroups)
Manage the image of my organisation
Not at all … … … … … To a large extent
COCOPS Work Package 3, Country Report Hungary – May 2013 Page 30
352 bn HUF saving was planned, i.e. 902 is the total budget savings planned – supposedly compared
to 2010 budget conditions) :
The government also introduced additional fiscal consolidation measures in the Convergence
Programme of April 2011, and a total of 1500-1700 billion HUF further consolidation measures the
2012 Budget Bill in order to attain the 2012 deficit target of 2.5% of GDP. However by the fall of
2011 it seemed already clear that the government was unable to keep itself to all planned measures,
hence the further huge measures in the 2012 Budget Bill. Instead of concentrating on cutbacks in
government expenditure as originally planned in the Szell Kalman Plan, for 2012 major tax increases
(+2% VAT) and new taxes had been introduced to balance on the revenue side. No pre-calculations
are available yet for the performance of the Szell Kalman Plan 2.0.
The above broader picture is necessary to properly contextualize respondents’ views on the impact
of the fiscal crisis presented below.
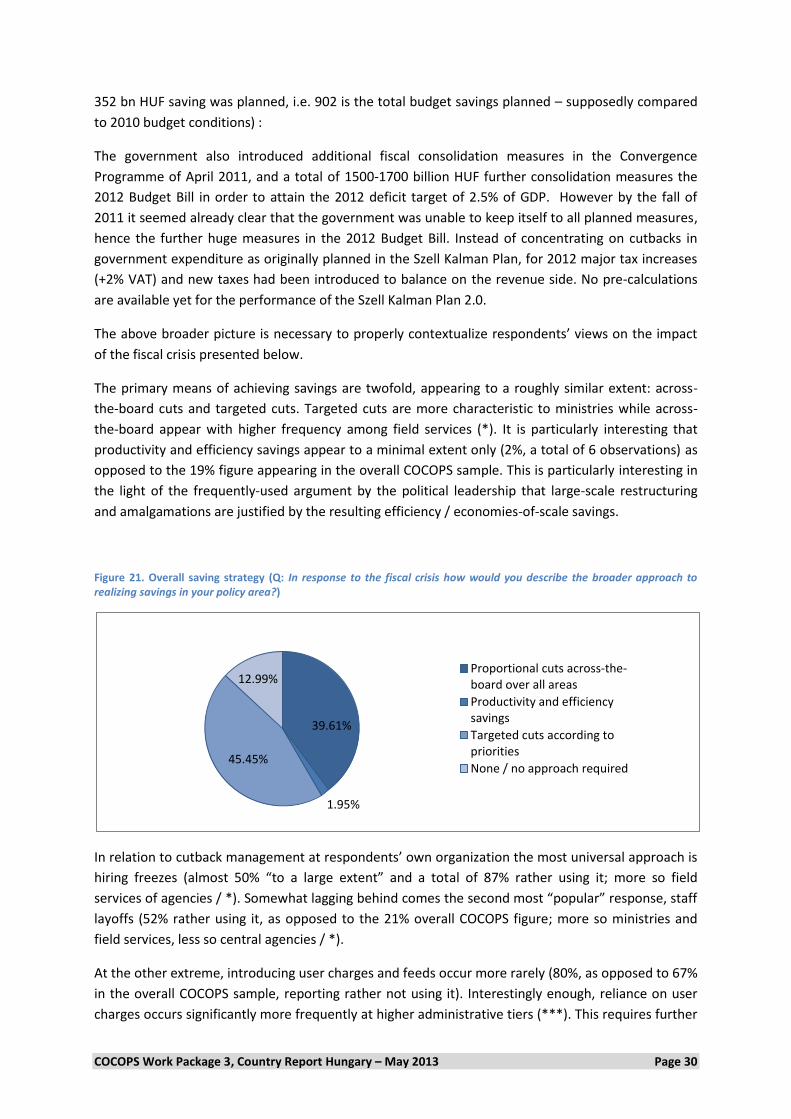
The primary means of achieving savings are twofold, appearing to a roughly similar extent: across-
the-board cuts and targeted cuts. Targeted cuts are more characteristic to ministries while across-
the-board appear with higher frequency among field services (*). It is particularly interesting that
productivity and efficiency savings appear to a minimal extent only (2%, a total of 6 observations) as
opposed to the 19% figure appearing in the overall COCOPS sample. This is particularly interesting in
the light of the frequently-used argument by the political leadership that large-scale restructuring
and amalgamations are justified by the resulting efficiency / economies-of-scale savings.
Figure 21. Overall saving strategy (Q: In response to the fiscal crisis how would you describe the broader approach to realizing savings in your policy area?)
In relation to cutback management at respondents’ own organization the most universal approach is
hiring freezes (almost 50% “to a large extent” and a total of 87% rather using it; more so field
services of agencies / *). Somewhat lagging behind comes the second most “popular” response, staff
layoffs (52% rather using it, as opposed to the 21% overall COCOPS figure; more so ministries and
field services, less so central agencies / *).
At the other extreme, introducing user charges and feeds occur more rarely (80%, as opposed to 67%
in the overall COCOPS sample, reporting rather not using it). Interestingly enough, reliance on user
charges occurs significantly more frequently at higher administrative tiers (***). This requires further
39.61%
1.95%
45.45%
12.99% Proportional cuts across-the-board over all areas
Productivity and efficiencysavings
Targeted cuts according topriorities
None / no approach required

COCOPS Work Package 3, Country Report Hungary – May 2013 Page 31
exploration since almost all administrative services are provided by agencies; it may be that
respondents interpreted the question according to where the decision about the introduction of user
charges was made, which is the ministry (or a higher instance).
Figure 22. Cutback measures at organizational level (Q: In response to the fiscal crisis, to what extent has your organization applied the following cutback measures?)
8. Outcomes of Public Administration Performance
8.1. Overall Respondent’s assessment regarding how public administration changed as compared to five years
ago reveals a rather critical picture (see Figure 23). In order to properly contextualize response data
to this item one has to keep in mind two things. Firstly, Spring 2007 was in the middle of the
legitimacy crisis of the second Gyurcsány Cabinet (a few months after the (partly extremely violent)
wave of political protest and unrest strongly supported by the then opposition, now government,
party FIDESZ). Secondly, as earlier data on tenure revealed almost all of the respondents got into
their current position after the 2010 elections. This means that a vast majority of them may safely
assumed to be FIDESZ loyalists.
In the light of (i) these information and (ii) the perceived threat and anxiety on the part of
respondents regarding revealing “improper” attitudes it is striking that the majority (53%) or
respondents think that the current situation is rather worse than better than it was five years earlier
(note that the same figure is 33% for the entire COCOPS sample). Within this overall pattern ministry
officials see things significantly rosier (*), as do officials having been employed in their present
position for not more than 5 years (*; slightly above the 5.5 mid-point of the scale).
0% 10% 20% 30% 40% 50% 60% 70% 80% 90% 100%
Staff layoffs
Hiring freezes
Pay cuts
Pay freezes
Cuts to existing programmes
Postponing or cancelling new programmes
Downsizing back office functions
Reducing front line presence
Increased fees and user charges for users
Not at all … … … … … To a large extent
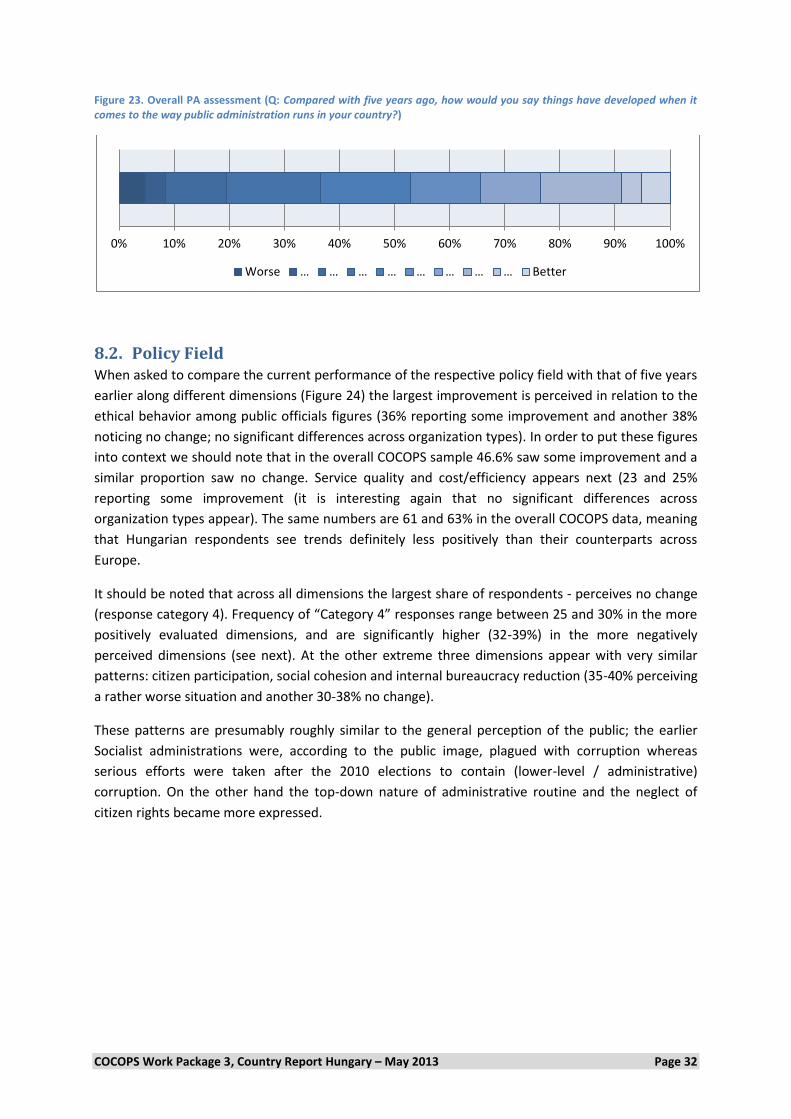
COCOPS Work Package 3, Country Report Hungary – May 2013 Page 32
Figure 23. Overall PA assessment (Q: Compared with five years ago, how would you say things have developed when it comes to the way public administration runs in your country?)
8.2. Policy Field When asked to compare the current performance of the respective policy field with that of five years
earlier along different dimensions (Figure 24) the largest improvement is perceived in relation to the
ethical behavior among public officials figures (36% reporting some improvement and another 38%
noticing no change; no significant differences across organization types). In order to put these figures
into context we should note that in the overall COCOPS sample 46.6% saw some improvement and a
similar proportion saw no change. Service quality and cost/efficiency appears next (23 and 25%
reporting some improvement (it is interesting again that no significant differences across
organization types appear). The same numbers are 61 and 63% in the overall COCOPS data, meaning
that Hungarian respondents see trends definitely less positively than their counterparts across
Europe.
It should be noted that across all dimensions the largest share of respondents - perceives no change
(response category 4). Frequency of “Category 4” responses range between 25 and 30% in the more
positively evaluated dimensions, and are significantly higher (32-39%) in the more negatively
perceived dimensions (see next). At the other extreme three dimensions appear with very similar
patterns: citizen participation, social cohesion and internal bureaucracy reduction (35-40% perceiving
a rather worse situation and another 30-38% no change).
These patterns are presumably roughly similar to the general perception of the public; the earlier
Socialist administrations were, according to the public image, plagued with corruption whereas
serious efforts were taken after the 2010 elections to contain (lower-level / administrative)
corruption. On the other hand the top-down nature of administrative routine and the neglect of
citizen rights became more expressed.
0% 10% 20% 30% 40% 50% 60% 70% 80% 90% 100%
Worse … … … … … … … … Better

COCOPS Work Package 3, Country Report Hungary – May 2013 Page 33
Figure 24. Different performance dimensions (Q: Thinking about your policy area over the last five years how would you rate the way public administration has performed on the following dimensions?)
Respondents’ views on their own organization’s workplace climate – plotted in Figure 25 – are
surprisingly positive, all of them averaging well above the mid-point of the scale (4.0). According to
these views people in the organizations are trustworthy (mean: 5.4, similarly to the overall COCOPS
data), they enthusiastically pursue common goals (5.0), openly communicate and share information
(4.9), have confidence in one another and share an ambition for the organization (4.7), and
share/accept constructive criticism and view themselves as partners within the organization (~4.5).
These data are by-and-large similar to the ones found in the entire COCOPS sample.
Figure 25. Social capital and trust (Q: People in my organization)
0% 10% 20% 30% 40% 50% 60% 70% 80% 90% 100%
Cost and efficiency
Service quality
Innovation
Policy effectiveness
Policy coherence and coordination
External transparency and openness
Citizen participation and involvement
Social cohesion
Internal bureaucracy reduction / cutting red tape
Ethical behaviour among public officials
Equal access to services
Fair treatment of citizens
Staff motivation and attitudes towards work
Attractiveness of the public sector as an employer
Citizen trust in government
Deteriorated significantly … … … … … Improved significantly
0% 10% 20% 30% 40% 50% 60% 70% 80% 90% 100%
Engage in open and honest communication with one another
Share and accept constructive criticisms without making it personal
Willingly share information with one another
Have confidence in one another
Have a strong team spirit
Are trustworthy
Share the same ambitions and vision for the organisation
Enthusiastically pursue collective goals and mission
View themselves as partners in charting the organisation’s direction
Strongly disagree … … … … … Strongly agree

COCOPS Work Package 3, Country Report Hungary – May 2013 Page 34
8.3. Individual Level Respondents’ workplace satisfaction is, again, surprisingly high (Figure 26). The mean overall
satisfaction is 5.6 on the 7-point scale (61% rather agreeing with the claim and another 9% being on
the mid-point of the scale). This satisfaction is similar to the one found in the overall COCOPS sample;
it is however significantly (**) lower in ministries than in other organization types however.
Respondents more often than not feel valued for what they do (mean 5.1, 48% rather agreeing; no
significant values across organization types), and 39% would recommend the organization as a
workplace to others (significantly less so in ministries; ***). 50% rather does not agree with the claim
that they are regularly overloaded with tasks (it may be noted that public managers usually work
under high time pressure). Interestingly, no significant differences appear across organization types.
Figure 26. Job satisfaction (Q: When thinking about my work and the organization I work for)
Loyalty to the organization seems to be a very strongly held value among respondents across all
layers of the administrative hierarchy (51% “strongly”, a total of 83% rather agreeing; no significant
differences across organization types). In addition, people personally strongly identify with their
organization, which suggests a less professional organizational culture (62% rather agreeing, though
significantly less so in ministries; ***). A similar pattern appears in relation to respondents’
willingness to spend the rest of their career within the current organization.
These data suggest, in line with data on personal motivation presented earlier, that public managers
are driven by an internal, though strongly technocratic, intellectual and power-related, motivation of
performing “well”, largely despite / irrespective of external motivators (or the lack thereof).
0% 10% 20% 30% 40% 50% 60% 70% 80% 90% 100%
I get a sense of satisfaction from my work
I feel valued for the work I do
I regularly feel overloaded or unable to cope
I would recommend it as a good place to work
Strongly disagree … … … … … Strongly agree

COCOPS Work Package 3, Country Report Hungary – May 2013 Page 35
Figure 27. Organizational commitment (Q: When thinking about my work and the organization I work for)
9. Findings from the Employment and Health sector In relation to the reform / management instruments applied a number of significant differences
appear between Employment (E), Health (H) and Other (O) types of policy field. The most important
ones are as follows:
- Strategic planning more frequently appears in O (*);
- Customer surveys are much more frequent in E (***);
- The same is the case with service points for customers as well as
- Quality management systems and
- Internal steering by contract (except that in the latter three dimensions H organizations
figure also significantly higher than O);
- Benchmarking is, again, significantly more frequent in E (***);
- Decentralization of budget decisions is, again, significantly more characteristic for E (***);
interestingly however E is significantly less decentralized in this respect than O.
- Performance related pay is significantly less characteristic for H and E than for O (***); finally
- On the other hand, performance assessment is most characteristic for E and the least for O
(**).
These data suggest that the employment sector is rather different – and, specifically, much more
reformed along managerial lines – than other segments of the administration. It should however be
noted that the number of respondents from the employment sector is much higher than from the
other sector (30% of all respondents are from the employment sector). Moreover, the composition
of these respondents is different too as many of them are from the lowest (sub-county) tier of
administration.
Another respect, in which it is worth comparing the different sectors is the extent of politicization. In
this regard we may not that interaction with the relevant minister is the lowest in the E, somewhat
higher in the H and much higher in the O sector (***). A similar though less marked (*) pattern
0% 20% 40% 60% 80% 100%
I really feel as if this organisation's problems aremy own
I would be very happy to spend the rest of mycareer with this organisation
It would be very hard for me to leave myorganisation right now, even if I wanted to
I was taught to believe in the value of remainingloyal to one organisation
Things were better in the days when people stayedwith one organisation for most of their career
Strongly disagree … … … … … Strongly agree
COCOPS Work Package 3, Country Report Hungary – May 2013 Page 36
appears in relation to interactions with other politicians. Nevertheless, little or no significant
difference appears in relation to the politics-administration dichotomy (Q12).
Finally, there are a number of significant differences in relation to how the outcomes of public
administration reforms are evaluated.
- The overall assessment of reforms is the worst in H, somewhat better in E, and the best in O
(***).
- Within this general assessment, cost and efficiency is significantly poorer in H (**);
- The same is the case with service quality and
- Innovation (***), except that here O are significantly better than E too;
- The same order (highest: O, lowest: H) holds for policy effectiveness (***) as well as
- Policy coherence and coordination (***),
- Attractiveness of the public sector as an employer (**), and
- External transparency and openness (*);
- In terms of internal bureaucracy reduction O are better than H and E (***);
- The only dimension where H and E outperforms O is fair treatment of citizens (*), although
with little difference
In sum, the evaluation of performance for the past 5-year period is, throughout a large number of
dimensions, consistently the worst in the health sector, somewhat better in the employment sector,
and significantly better in the other sectors / general government (note that the scale reliability as
measured by Cronbach’s Alpha is very high, 0.92, for the Q19 variables!).
These findings form an interesting contrast with the stronger managerialization of the field detected
a few paragraphs earlier. It is of course not possible to detect a cause-and-effect relationship
between the two phenomena; however the hypothesis definitely deserves a closer and more in-
depth scrutiny.
10. Conclusion Surveying senior public managers is a difficult task involving many foreseen as well as possibly
unnoticed caveats anytime and anywhere; so was the case in Hungary throughout the past 10-15
years too. The situation however became markedly more difficult as a result the sweeping changes
having taken place after the 2010 elections. These – partly formal-legal (e.g. dismantling the labor
protection of civil servants) and partly informal or cultural – changes presumably led to a deepening
distrust and increasing fear of retaliation on the part of respondents. Since these features had
already characterized the Hungarian civil service before the post-2010 changes to a significant extent
it may be safely assumed that the resulting problems of validity have an effect on data quality
indeed. Therefore accepting data and findings at face value, making direct comparisons with other
countries etc. poses serious potential problems that can be lessened only by careful analysis based
on a sound qualitative familiarity with the setting.
This note of caution is in order before I set out to summarize, in an admittedly somewhat arbitrary
manner, the most significant findings of this preliminary analysis.
Hungarian senior public managers seem to be driven by an internal motif of achievement and task
fulfillment rather than external incentives. They do not feel to be particularly appreciated by their
COCOPS Work Package 3, Country Report Hungary – May 2013 Page 37
political masters, neither are they driven by a wish to help others, lessen societal problems, or the
like. Rather, they perceive their tasks in more technical terms, appreciate the intellectual complexity
and possibly the power and influence associated with their position.
Respondents are, in the view of the circumstances outlined in the introductory paragraph to this
concluding section, surprisingly critical regarding the process and particularly the results of the
achievements of the current Orbán Cabinet. The Socialist governance characterizing 2007 (as well as
the preceding and succeeding years) had an outstandingly bad image not only among the Center-
Right opinions leaders but throughout the whole spectrum of news media. It was this notoriously
poor perception (involving severe corruption at all levels, inefficiency and lack of direction) that most
significantly contributed to the landslide defeat of the Socialists in 2010 and the 2/3 victory of the
current FIDESZ party alliance. Despite all this, a majority of respondents hold the view that the
current performance of the public administration is not better or even worse than that of five years
ago – both in general and in a number of particular sub-dimensions.
The situation regarding the outcome and the general perception of ‘public administration reforms’
(whatever this means) is somewhat even worse in the two focus sector of the present study,
employment and – in particular – health. This is so despite (or partly possibly because?) the fact that
these sectors were and are characterized, according to insider respondents’ view, by the reliance on
modern management concepts and techniques to an extent larger than other segments of the
administration.
On the other hand – and in the view of the previous findings somewhat surprisingly – public
managers perceive their own working environment in a surprisingly positive way. They derive
significant personal satisfaction from their job, and the workplace morale seems to be relatively
good, especially if one contrasts this with the lasting and severe budgetary squeezes etc. This positive
evaluation significantly decreases however as one gets closer to the realm of politics (from field
services of agencies towards ministries). Moreover we should keep in mind that since respondents
are top level managers in their organizations these data are most probably systematically biased
upwards.
The findings and hypotheses formulated throughout the report and above need, of course, further
specification, theoretical contextualization, and careful analysis.

COCOPS Work Package 3, Country Report Hungary – May 2013 Page 38
List of Figures
Figure 1. Policy field sample shares ...................................................................................................................... 12
Figure 2. Organization type and size shares .......................................................................................................... 13
Figure 3. Socio-demographic shares (f.l.t.r.) Gender, Age, Hierarchy in organization, Educational background . 14
Figure 4. Educational fields (respondents could check more than one field) ....................................................... 15
Figure 5. Tenure of respondents ........................................................................................................................... 16
Figure 6. Identity and self-understanding (Q: I mainly understand my role as public executive as) ..................... 17
Figure 7. Priorities as public servants (Q: Public services often need to balance different priorities. Where would
you place your own position ................................................................................................................................. 17
Figure 8. Motivation (Q: How important do you personally think it is in a job to have) ....................................... 18
Figure 9. Social value preferences (Q: Please indicate how far you agree or disagree with the following
statements) ........................................................................................................................................................... 19
Figure 10. Goal ambiguity (Q: To what extent do the following statements apply to your organization?) .......... 20
Figure 11. Degree of management autonomy (Q: In my position, I have the following degree of autonomy with
regard to) .............................................................................................................................................................. 21
Figure 12. Interaction frequency (Q: Please indicate how frequently you typically interact with the following
actors or bodies) .................................................................................................................................................... 22
Figure 13. Coordination quality (Q: How would you characterize collaboration in your own policy field between)
.............................................................................................................................................................................. 22
Figure 14. Degree of politization (Q: What is your view on the following statements) ........................................ 23
Figure 19. Importance of reform trends (Q: How important are the following reform trends in your policy area?)
.............................................................................................................................................................................. 24
Figure 20. Dynamics of public sector reform (Q: Public sector reforms in my policy area tend to be) ................. 25
Figure 16. Relevance of different management instruments (Q: To what extent are the following instruments
used in your organization?) ................................................................................................................................... 26
Figure 17. Relevance of performance management (Q: To what extent do the following statements apply to
your organization?) ............................................................................................................................................... 27
Figure 18. Coordination solutions (Q: To resolve coordination problems when working with other organizations,
we typically) .......................................................................................................................................................... 28
Figure 15. Use of performance indicators (Q: In my work I use performance indicators to) ................................ 29
Figure 21. Overall saving strategy (Q: In response to the fiscal crisis how would you describe the broader
approach to realizing savings in your policy area?) .............................................................................................. 30
Figure 22. Cutback measures at organizational level (Q: In response to the fiscal crisis, to what extent has your
organization applied the following cutback measures?) ...................................................................................... 31
Figure 23. Overall PA assessment (Q: Compared with five years ago, how would you say things have developed
when it comes to the way public administration runs in your country?) .............................................................. 32
Figure 24. Different performance dimensions (Q: Thinking about your policy area over the last five years how
would you rate the way public administration has performed on the following dimensions?) ............................ 33
Figure 25. Social capital and trust (Q: People in my organization) ....................................................................... 33
Figure 26. Job satisfaction (Q: When thinking about my work and the organization I work for) ......................... 34
Figure 27. Organizational commitment (Q: When thinking about my work and the organization I work for) ..... 35

COCOPS Work Package 3, Country Report Hungary – May 2013 Page 39
References
Aberbach, J. D., Putnam, R. D., Rockman, B. A. (1981). Bureaucrats and Politicians in Western Democracies. Cambridge/
Massachusetts/London: Harvard University Press.
Aberbach, J. D., Rockman, B. A. (2006). The Past and Future of Political-Administrative Relations: Research from
“Bureaucrats and Politicians” to “In the Web of Politics” and Beyond'. International Journal of Public Administration,
29(12):977-995.
Bauer, M., Dehouse, R., Hooghe, L., Kassim, H., Peterson, J., Thompson, A. (2009). The European Commission of the 21st
Century: Views From the Inside. The EU-Consent Network: Last accessed 01.12.2012 at
http://www.pol.ed.ac.uk/eu_consent/commission_survey
Bertelli, A., Lewis, A., Nixon, D. (2007). Survey on the Future of the Government Service Survey on the Future of Government
Service. Last accessed 09.12.2012 http://www.princeton.edu/sfgs/.
Christensen, T., Lægreid, P. (1999). New Public Management: Design, Resistance, or Transformation? A Study of How
Modern Reforms Are Received in a Civil Service System. Public Productivity & Management Review 23(2):169-193.
Christensen, T. and Lægreid, P. (2007). NPM and beyond: leadership, culture, and demography. Paper prepared for: The
Leading the Future of the Public Sector: The Third Transatlantic Dialogue University of Delaware, Newark, Delaware, USA,
May 31–June 2, 2007
Comparative Public Organisation Data Base for Research and Analysis Network - COBRA. Survey and database on autonomy
and control of agencies. Last accessed 09.12.2012 at http://soc.kuleuven.be/io/cost/survey/index.htm
Derlien, H.-U. (1992). Observations on the State of Comparative Administration Research in Europe - More Comparable
than Comparative. Governance: An International Journal of Policy, 5: 279-311.
Enticott, G., Boyne, G.A., Walker, R.M. (2008). The Use of Multiple Informants in Public Administration Research: Data
Aggregation Using Organizational Echelons. Journal of Public Administration and Research Theory, 19: 229-53
Fitzpatrick, J., Goggin, M., Heikkila, T., Klingner, D., Machado, J., Martell, C. (2011). A New Look at Comparative Public
Administration: Trends in Research and an Agenda for the Future. Public Administration Review, 71(6): 821-830.
Hammerschmid, G., Görnitz, A., Oprisor, A., Stimac, V. (2013). Public Sector Reform in Germany: Views and Experiences from
Senior Executives. Country Report as part of the COCOPS Research Project. Available at www.cocops.eu.
Hammerschmid, G., Oprisor, A., Stimac, V. (2013). COCOPS Executive Survey on Public Sector Reform in Europe. Research
Report. Available at www.cocops.eu.
Gajduschek György (2008): Rendnek lenni kellene. Tények és elemzések a közigazgatási ellenőrzési és bírságolási
tevékenységről. [Analysing and interpreting empirical data on administrative regulatory activity in Hungary.] Budapest:
KSZK, 2008, pp. 220-228
Gajduschek, György and György Hajnal (2003): Civil Service Training Assistance Projects in the Former Communist
Countries: An Assessment, Budapest: LGI Publications
Hajnal, György and Éva Kovács (2013): Analyzing the motives of reforming central government coordination in Hungary: A
case study of one-stop-government reforms. XVII IRSPM Annual Conference, 10-12 April 2013, Prague, Czech Republic
Hajnal, György (2013): The disciplinary (re)orientation of Public Administration education in Europe: A survey. XVII IRSPM
Annual Conference, 10-12 April 2013, Prague, Czech Republic
Hajnal, György (2011): Agencies and the politics of agencification in Hungary, Transylvanian Review of Administrative
Sciences 2011 (Special Issue) pp. 74-92
COCOPS Work Package 3, Country Report Hungary – May 2013 Page 40
Hajnal, György (2010): Failing Policies or Failing Politicians? Policy Failures in Hungary, World Political Science Review 6:1
Article 13
Hajnal, György (2008): Public management reforms: Hungary, In: Bouckaert, Geert, Juraj Nemec, Vitalis Nakrosis, György
Hajnal and Kristiina Tönnisson (2008) (ed.): Public management reforms in Central and Eastern Europe, Bratislava: NISPAcee
pp. 121-150
Hajnal, György and György Jenei (2008): Közigazgatási rendszerek, valamint közigazgatás- és közmenedzsment-tudomány és
-képzés Európában és Magyarországon, Köz-gazdaság 2008/4 pp. 1-21
Hammerschmid, G., Görnitz, A., Oprisor, A., Stimac, V. (2013). Public Sector Reform in Germany: Views and Experiences from
Senior Executives. Country Report as part of the COCOPS Research Project. Available at www.cocops.eu.
Hammerschmid, G., Oprisor, A., Stimac, V. (2013). COCOPS Executive Survey on Public Sector Reform in Europe. Research
Report. Available at www.cocops.eu.
Mayntz, R. (1997). Verwaltungsreform und gesellschaftlicher Wandel. In Grande, E., Prätorius, R. (Eds.), Modernisierung des
Staates? Staatslehre und politische Verwaltung. Baden-Baden: Nomos.
Müller, György (2011): Magyar kormányzati viszonyok, Pécs: Dialóg Campus
Pollitt, C. (2011). Not odious but onerous: Comparative public administration. Public Administration. 89(1): 114–127
Pollitt, C., Bouckaert, G. (2011). Public Management Reform: A Comparative Analysis - New Public Management,
Governance, and the Neo-Weberian State. Oxford University Press
Putnam R.D. (1976). The Comparative Study of Political Elites. Englewood Cliffs, N.J.: Prentice-Hall
Raadschelders J. C. N., Lee, K.-H. (2011): Trends in the Study of Public Administration: Empirical and Qualitative
Observations from Public Administration Review, 2000–2009. Public Administration Review. 71(1):19-33.
Ridder, H.-G., Bruns, H.-J., Spier, F. (2006): Managing Implementation Processes: The role of public managers in the
implementation of accrual accounting – evidence from six case studies in Germany. In: Public Management Review. No.
1/2006
Sárközy, Tamás (2012): Magyarország kormányzás 1978-2012, Budapest: Park Kiadó
Survey Research Center. (2010). Guidelines for Best Practice in Cross-Cultural Surveys. Ann Arbor, MI: Survey Research
Center, Institute for Social Research, University of Michigan. Last accessed 01.12.2012 at http://www.ccsg.isr.umich.edu/
Trondal, J. (2010). An Emergent European Executive Order. Oxford: Oxford University Press.
Walker, R. M., Enticott, G. (2004). Exploring variations in management reform values and actions: An empirical analysis.
Journal of Public Administration, Research and Theory, 14:417–34.