(public pack)agenda document for safer bromley partnership
TRANSCRIPT

To: Members of the
STRATEGIC GROUP
Chris Hafford, (Borough Commander) (Chairman)
Councillor Kate Lymer (Portfolio Holder for Public Protection and Safety) and Councillor Tim Stevens J.P. (Safer Neighbourhood Board)
Anne Ball, (Mayor's Office for Policing and Crime) Sara Bowrey, Education, Care & Health Services Daniel Cartwright, (Borough Commander, Fire Services) Clare Elcombe, Environment & Community Services Selene Grandison, National Probation Service - London Trevor Lawry, Metropolitan Police Lissa Moore, (Croydon and Bromley Community Rehabilitation Company) Paula Morrison, (LBB Assistant Director, Public Health) Councillor Tim Stevens J.P., Safer Neighbourhood Board Chief Inspector David Tait, (Metropolitan Police) Rob Vale, (LBB Trading Standards Manager) Kay Weiss, (LBB Assistant Director of Safeguarding and Social Care)
A meeting of the Safer Bromley Partnership Strategic Group will be held at
Committee Room 1 - Bromley Civic Centre on THURSDAY 3 DECEMBER 2015 at 10.00 am
A G E N D A
1
APOLOGIES FOR ABSENCE
2
MINUTES OF THE MEETING PREVIOUS MEETING--28TH SEPTEMBER 2015 (Pages 3 - 14)
3
MATTERS ARISING REPORT (Pages 15 - 18)
4 QUESTIONS TO THE SAFER BROMLEY PARTNERSHIP FROM COUNCILLORS OR MEMBERS OF THE PUBLIC
Questions to the Safer Bromley Partnership Strategic Group should be received by 5.00pm on Friday 27th November 2015.
Contact for this Agenda: Steve Wood
Tel: 020 8313 4316 E-mail: [email protected] London Borough of Bromley 24 November 2015

5
CHAIRMAN'S UPDATE
6
UPDATE FROM THE SAFER NEIGHBOURHOOD BOARD
7
STRATEGIC ASSESSMENT AND THE SAFER BROMLEY PARTNERSHIP CONTROL STRATEGY (Pages 19 - 58)
8
REVIEW OF SBP INITIATIVES
a
Trading Standards and London Fire Brigade Vulnerable Adults Initiative
b
New Psychoactive Substances
c
Update on the PREVENT Strategy
9
VICTIM SUPPORT UPDATE
10
PRESENTATION FROM COMMUNITY PAYBACK
11
REPORTS FROM SUB-GROUPS
a
Domestic Abuse Sub Group Update
b
Youth Offending Sub Group Update
c
Gangs Sub Group Update
d
Offender Management Sub Group Update
e
ASB Sub Group Update
12
COMMUNICATIONS UPDATE
13
INFORMATION ITEMS (Pages 59 - 62)
14
ANY OTHER BUSINESS
15 DATE AND TIME OF NEXT MEETING
The date of the next meeting is Thursday 10th March 2016 at 10.00am.
1
SAFER BROMLEY PARTNERSHIP STRATEGIC GROUP
Minutes of the meeting held at 10.00 am on 28 September 2015
Present:
Councillor Tim Stevens J.P., Safer Neighbourhood Board
Sara Bowrey, Education, Care & Health Services Daniel Cartwright, (Borough Commander, Fire Services) Nigel Davies, (LBB Director, Environmental Services) Paula Morrison, (LBB Assistant Director, Public Health) Chief Inspector David Tait, (Metropolitan Police) Rob Vale, (LBB Trading Standards Manager) Kay Weiss, (LBB Assistant Director of Safeguarding and Social Care) Selene Grandison (National Probation Service)
Also Present:
Susie Clark, (LBB Communications Officer) Pratheepan Jeyapragasam, (LBB Crime Analyst) Trevor Lawry, Metropolitan Police
21 APOLOGIES FOR ABSENCE
Action
Apologies were received from Paul Lehane and from Anne Ball from MOPAC. Apologies were received later in the day from Cllr Kate Lymer. Apologies were also received from Mr Terry Belcher.
22 MINUTES OF THE PREVIOUS MEETING
Action
The minutes of the meeting held on the 16th June 2015 were agreed.
23 MATTERS ARISING
Action
Matters arising from previous meetings were noted.
24 CHAIRMAN'S UPDATE
Action
The Police update was given by the Chief Inspector for the Safer Neighbourhood Teams—David Tait. He updated the Strategic Group as follows:
MOPAC 7 crime overall had reduced by 16.3%, which equated to 1910 less victims
Burglary figures had reduced by 27.8%, which was a reduction of 951 victims
Criminal Damage had reduced by 8.1%, which was a
Page 3
Agenda Item 2

Safer Bromley Partnership Strategic Group 28 September 2015
2
reduction of 209 victims
Robbery had reduced by 46.8%, which was a reduction of 328 victims
Theft from motor vehicles had reduced by 26.6%, which was a reduction of 556 victims
Theft from the Person had reduced by 8.2%, which was a reduction of 25 victims
Challenges still existed concerning the theft of motor vehicles which had increased by 2.3%, this equated to 17 more victims. Violence with injury had increased by 7.5% which equated to 142 more victims. Cllr Tim Stevens was happy with what he perceived to be a proactive and successful campaign to promote domestic abuse issues, and the achievements of the Police in bringing about effective prosecutions; he was happy with the figures that were being presented by the Police at the meeting. The Chief Inspector confirmed that it was Police policy to promote awareness of domestic abuse issues as much as they could, along with proactive intervention and prosecution. The Head of Trading Standards and Community Safety confirmed that detail would be made available in the Strategic Assessment. The Chief Inspector spoke about the planned Government Spending Review that was due in December 2015, and expressed concern about future cuts to the MET budget, and the impact the cuts may have on local policing. He stated that as the Police had already made reductions to buildings, his concern now was a possible loss of personnel. He feared that Bromley could end up losing all of their PCSOs. Superintendent Trevor Lawry (the new Deputy Borough Police Commander) informed the Group that the Police would be anticipating revised budget figures to be available in December 2015, and that modelling would take place until then. The Strategic Group were updated concerning the roll out of “Met Trace” “Met Trace” was an invisible liquid that could be used to mark property; it was only visible under UV light. The MET plan was that 440,000 homes would use the product to mark items over a three year period. Previous trials of the product had resulted in a fall in burglaries by 70%. Distribution of the product in Bromley had already commenced, with a team of 1PC and 5 PCSOs. The plan for Bromley was to distribute 3500 kits to 4,300 households in roads with the highest number of recorded burglaries in different Wards. The Chief Inspector highlighted the success of police officers using body worn video equipment, especially in domestic abuse cases; this would continue to be rolled out across the MET.
Page 4

Safer Bromley Partnership Strategic Group 28 September 2015
3
RESOLVED that: (1) the Police update be noted (2) the Police to update the Group in early 2016 after the Spending Review that would take place in December 2015.
CH
25 UPDATE FROM THE SAFER NEIGHBOURHOOD BOARD
Action
The update concerning the Safer Neighbourhood Board (SNB) was given by the Chairman of the Board, Cllr Tim Stevens JP. The SNB had last meet in July 2015 at a location in Biggin Hill when Chief Inspector David Tait had presented. This was a very well attended meeting with about 40 people in attendance. The SNB was meeting at various locations around the Borough, and turnouts were generally very good. Cllr Stevens stated that:
Around 80 people had attended the SNB meeting at Beckenham
Around 70 had attended at Mottingham
Around 50-60 had attended at Orpington
Around 40-50 had attended at Biggin Hill The Crime Summit was well attended and was a great success, with Bromley Youth Council having a significant impact with their presentation concerning Public Transport issues. Cllr Stevens stated that congratulations were in order to Danie Gordon and her team. There was also a presentation concerning gangs and knife crime. The next meeting of the SNB would be in Penge in November 2015—a suitable location was being sourced. Cllr Stevens asked for clarification concerning the relationship/role that existed between Community Payback and the Safer Bromley Partnership Strategic Group. This had been an issue that both the Group and the Public Protection and Safety PDS Committee required clarification on. The Head of Trading Standards and Community Safety informed the Group that he had recently been informed of a new contact within Probation Services that would be able to provide clarification. This person was Nicola Walters who was a Senior Operations Manager with responsibility for Community Payback. An update would be provided to Group members as soon as this was available. Cllr Stevens reminded the Group that previous difficulties had existed around transport and supervision, but these issues had now been removed and this should help in facilitating a smooth transition back into a productive relationship with Community Payback. Members of the Group were hopeful that this would be the case, as it would be useful for the Youth Offending Service to have access to this resource for young offenders.
Page 5

Safer Bromley Partnership Strategic Group 28 September 2015
4
RESOLVED that: (1) the update from the Chairman of the Safer Neighbourhood Board be noted (2) contact be made with Nicola Walters from Probation Services to re-establish the relationship between Community Payback and LBB (3) the Youth Offending Service to seek to utilise the Community Payback service in the future for young offenders.
RV RV/KW
26 REVIEW OF SBP INITIATIVES AND OPERATION CRYSTAL UPDATE
Action
The Head of Trading Standards and Community Safety informed the Group that ASB initiatives and Operation Crystal had been going well. The various initiatives were progressing in accordance with the aims and objectives that had been desired by MOPAC (Mayor’s Office for Policing and Crime). Operation Crystal was a MOPAC funded anti-social behaviour initiative that had been set up to tackle crime, with the funding running from March 2013 to December 2016. Operation Crystal had been successful in clearing long term rubbish, cleaning away graffiti, dealing with high profile offenders, and in raising the awareness in the community from public services to deal with problems in the area. Exit strategies would be discussed with MOPAC in the near future. The Borough Fire Commander informed the Group that the Borough Fire Brigade had been working with the Police and LBB as part of Operation Crystal. Both the Police and the Fire Service had plans in place to deal with Halloween and the firework season. RESOLVED that the ASB update be noted.
27 THE SBP STRATEGIC ASSESSMENT DOCUMENT
Action
The update concerning the SBP Strategic Assessment Document was provided by the Head of Trading Standards and Community Safety. He introduced Mr Pratheepan Jeyaprayesam to the Group; Mr Jeyaprayesam was an analyst who would be providing support to the Group in drafting the Strategic Document. It was noted that data would be available online from the MOPAC dashboard which would assist in drafting the Assessment. The Group agreed that finalising the Strategic Document should be a priority, and that the Borough Commander would need to be consulted concerning this. The LBB Assistant Director for Public Health stated that as well as
Page 6

Safer Bromley Partnership Strategic Group 28 September 2015
5
crime data, the assessment should consider all relevant issues, including health and housing. The Head of Trading Standards and Community Safety agreed with this and stated that the new MOPAC data dashboard would assist with this—the updated and more comprehensive data dashboard would be available at some point in October 2015. It was noted that a couple of graduates would be working with LBB on an interim basis to assist in drafting the strategy. The Borough Fire Commander highlighted the approaching “Impact Factor” days. These were days when speakers would be drafted in to speak to young people concerning the consequences of their actions. Schools were involved, and the funding was provided by MOPAC. As domestic violence had been an issue that had been mentioned at the meeting, the Borough Fire Commander stated that the issue of domestic violence and abuse could be incorporated in to an “Impact Factor” day. The Chairman highlighted the importance of all members of the Strategic Group to be working and communicating effectively together so that everyone was fully sighted and aware of the overall strategic objectives and where data should be fed into. It was also the case that Portfolio funding was available to assist with projects. RESOLVED that the update on the Strategic Document be noted, and that the finalising of the document be progressed as a priority.
RV/PJ
28 UPDATE ON NEW PSYCHOACTIVE SUBSTANCES
Action
The Group were reminded that the Government was proposing new legislation that would provide for a blanket ban on selling new psychoactive substances (NPS). Members had previously noted a shop selling NPS substances in Penge, and that this premises was being monitored. No issues had been reported concerning the premises, and so no enforcement action had been taken to date. A member expressed the view that if the new legislation was passed through Parliament, this would not be an end to the problem as it would shift underground. The Head of Trading Standards and Community Safety stated that he would be visiting the shop in Anerley with the Director and Assistant Director of Public Health in the next few days to see what products were being sold, and what health information was being given to customers by the business A matter of concern to the Strategic Group at this time was the mis-use of nitrous oxide. The Group felt that this was an emerging issue that was causing problems, and had connections with organised crime, as good profits could be made from selling the substance. It was mentioned that a Public Spaces Protection Order could be issued to ban usage, but the limitation with this was that such an order would be confined to a defined geographical area.
Page 7
Safer Bromley Partnership Strategic Group 28 September 2015
6
The Head of Trading Standards and Community Safety reported that he had been tasked by the Portfolio Holder for Public Protection to review the action taken by LB Lambeth in respect of PSP Orders to tackle issues arising from the mis-use of nitrous oxide. A member of the Group enquired as to the current status of “Khat” which was an amphetamine type of drug used as a stimulant, particularly by certain ethic communities. It was noted that this was now a class “C” drug that was illegal to possess or distribute to others. RESOLVED that the update on new psychoactive substances be noted.
29 COUNTER TERRORISM AND SECURITY ACT 2015
Action
The Head of Trading Standards and Community Safety outlined the statutory obligations imposed upon local authorities as a result of the Counter Terrorism and Security Act 2015. It was the statutory responsibility of the Strategic Group to lead, and to develop and implement an action plan. Human Resources were leading on training all front line staff and E Learning packages were being developed. Training was already in place for Housing and for Children’s Social Services. A Channel referral process should be developed, and everyone needed to understand the expectation to respond. RESOLVED that: (1) the update on the Counter Terrorism and Security Act 2015 be noted (2) further updates be brought to the SBP in the future, especially concerning the training of front line staff.
RV
30 UPDATE ON THE JOINT MEETING BETWEEN THE GENERAL PURPOSES AND LICENSING COMMITTEE AND THE PUBLIC PROTECTION AND SAFETY PDS COMMITTEE
Action
The update on the joint meeting was given to the Strategic Group by Cllr Tim Stevens JP, in his capacity as Chairman of the General Purposes and Licensing Committee. He explained to members of the Group that previous meetings had been held within LBB to discuss current licensing policy, particularly as it had become clear that there were problems emerging with the night time economy in Bromley. On the 23rd June 2015 a meeting had been held with Ward Councillors for Bromley Town and for Copers Cope. This had been followed by a “Tories On” meeting the following day that was similarly looking at licensing policy and emerging
Page 8

Safer Bromley Partnership Strategic Group 28 September 2015
7
problems in the Bromley night time economy. Subsequent to these meetings, a new Draft Licensing Policy had been developed around 12 key action points. Several key venues had been identified as problematic, and these had been visited by the local authority and the police to discuss issues, and to try and formulate solutions. At the joint meeting between the GP&L Committee and the Public Protection and Safety PDS Committee on the 14th July 2015, the Police were represented by the Borough Commander and PC Jonathan Booth. The Police expressed the view that certain licensed premises were taking advantage of a relaxation of licensing policy, including a relaxation of the Cumulative Impact Areas policy in July 2013. Cllr Tim Stevens referred to the recent review of the premises licence of the Vu Vu Nightclub that had taken place on 12th August 2015. Various sanctions had been levied against Vu Vu as a result of the Hearing, including a 30 day ban. He felt it was important that LBB send the correct message to licensed premises that were not taking their responsibilities seriously. Modifications had also been made to some of the parking restrictions affecting the cab office in East Street to make it easier for them to pick up and remove Vu Vu clients from the vicinity. Chief Inspector Tait stated that this was a good example of Partnership working between LBB and the Police. RESOLVED that the update on the joint meeting between the GP&L Committee and the Public Protection & Safety PDS Committee be noted.
31 UPDATES FROM SUB-GROUPS
Action
Individual Sub Group Updates follow.
32 Domestic Abuse Sub Group Update
Action
The update concerning the Domestic Abuse Sub Group was given by the Head of Trading Standards and Community Safety as the lead for Domestic Abuse was off on maternity leave. He informed the group that he was looking to arrange cover as soon as possible and that he was hoping that this would be in place by October 2015. The Group heard that the Domestic Homicide Review Case went to the Panel the previous week, and LBB were waiting for a response. Discussions were ongoing with MOPAC to fund a replacement to cover the maternity leave of the Domestic Abuse Lead Officer.
33 Youth Offending Sub Group Update
Action
The Assistant Director for Child Safeguarding and Children’s Social
Page 9

Safer Bromley Partnership Strategic Group 28 September 2015
8
Care updated the Strategic Group concerning the Youth Offending Service Improvement Plan. It was noted that the Improvement Plan had been approved by the Youth Justice Board, any by HMI Probation. Members were notified that the Youth Offending Service Management Board and senior operational staff across Bromley had been re-organised. There was now one senior strategic board chaired by the LBB Chief Executive. The newly created Youth Management Board had been provided with appropriate training by the Youth Justice Board. A LBB Youth Justice Plan had just been written and had been circulated for comment. A national self-assessment on pre court work had been undertaken with positive results. The Assistant Director reported that for the first time, LBB had noticed an increase in the number of young people committing first time offences. However, the percentage of young people reoffending had decreased and the percentage of young people in custody has decreased. A new interim Head of Service had been appointed and also the service was seconding a representative from the YJB for six months. This was felt necessary to increase the pace of change. The newly appointed internal Head of Service would be scrutinising performance quality issues in the Youth Offending Service and in partner agencies, and would also be implementing whatever new strategic plans required to be implemented. The Assistant Director informed the Group that a large number of staff had left the organisation subsequent to the inspection and eight new staff members had joined the Youth Offending Service in September 2015. The Assistant Director concluded by underlining that it was now time to move forward and to make progress. She explained that HMI Probation would normally follow up with an inspection a year subsequent to the original one, so she was expecting a new inspection to occur during May 2016. To prepare for this she would be carrying out a mock inspection during January 2016. RESOLVED that the Youth Offending Sub Group update be noted.
34 Gangs Sub Group Update
Action
The Gangs Sub Group update was given by Chief Inspector David Tait. The Gangs Sub Group had met previously during July 2015. The Gangs Sub Group had met on 22nd September 2015 with the
Page 10

Safer Bromley Partnership Strategic Group 28 September 2015
9
Heads of 7 primary schools to discuss prevention funded activity, and the response was positive. The Gangs Sub Group would be meeting next on 1st October 2015, and the Assistant Director for Safeguarding and Children’s Social Care would be attending. There was mention of the problems that had been encountered previously with gangs from Lewisham and Penge. It was noted that the main protagonist in this regard was now in prison and that for the moment the problems seemed to have eased. Various actions were ongoing. It was noted that a response from a letter concerning the inappropriate placing of gang nominals had not been responded to; this was something that the Group would chase. The letter was a joint letter from the Borough Police Commander and LBB’s Chief Executive, and was written to the Home Office. The letter was agreed by the Public Protection and Safety Portfolio Holder. The Group heard that there were 27 gang nominals identified in Bromley, and a number of these were currently in prison. The problem of the inappropriate placement of gang nominals was London wide and not just confined to Bromley. An issue of concern was the fact that in many cases, gang nominals were being relocated in neighbouring boroughs, often in close geographical proximity to their borough of origin, which defeated the purpose of relocating these individuals. The idea was to get them away from areas of conflict, not just to relocate them across a boundary line where they were still near to the original conflict location. The Assistant Director for Safeguarding and Children’s Social Care spoke to the Group concerning the work of the Children’s Trust Partnership. She informed the Group that their annual trust workshop was taking place soon, and that it may be a good idea to allocate a morning to discussing the problems relating to Gangs. RESOLVED that: (1) the Gangs Sub Group update be noted (2) the Strategic Group chase the response to the letter that was sent to the Home Office, highlighting the inappropriate placement of gang nominals in Bromley.
KL/CH
35 Offender Management Sub Group Update
Action
The Group were updated as follows:
The Offender Management Sub Group met in July 2015 and at
Page 11

Safer Bromley Partnership Strategic Group 28 September 2015
10
this meeting Terms of Reference were agreed
There was an urgent need for Integrated Offender Management to be supported and resourced
It was expected that a graduate would be recruited on an interim basis to assist with administrative and analytical functions
LBB did not have access to the IDIOM system
The Offender Management Sub Group would be meeting in October 2015
RESOLVED that the Offender Management Sub Group update be noted
36 ASB Sub Group Update
Action
This update was provided by the Bromley Borough Fire Commander. The ASB Sub Group met bi-monthly, but was in touch on a weekly basis. It was noted that data and information was fed from the Fire Service to LBB and to the Police. LBB reported the data monthly. The Fire Service were preparing for Halloween and Bonfire Night, and were in the process of providing advice and leaflets to the general public and to traders. There were occasions when fire safety advice was provided to LBB Trading Standards, and the Borough Fire Commander highlighted that this was a good example of effective partnership working. RESOLVED that the ASB update be noted.
37 COMMUNICATIONS UPDATE
Action
This update was provided by Susie Clark, LBB Communications Officer. It was noted that work had been undertaken with the Nat West Bank in Locksbottom concerning bank protocols. It had previously come to the attention of the Police and to LBB Trading Standards, of incidences where individuals (usually the elderly and vulnerable) had entered the Bank, and withdrawn cash sums which in some cases were quite large and out of character with their normal pattern of behaviour. In some of these cases it had come to light that they were victims of various scams and rouge traders. The work that had been undertaken with Trading Standards and Banks, was to make bank staff aware of this practice, and what things to look out for.
Page 12

Safer Bromley Partnership Strategic Group 28 September 2015
11
At the meeting of the Public Protection and Safety PDS Committee on the 15th September 2015, the Chairman praised the work of the ASB initiative—Operation Crystal, which had been a great success. The Chairman had requested that a press release be drafted to publicise this, and this was being worked on by the Communications Department. “Check a Trade” was being launched soon, and press release was also being drafted to publicise this. Articles were also being prepared concerning food hygiene and food substitution. Press releases were also being prepared concerning the recent Crime Summit. Safety advice would be published on the Bromley website concerning Halloween and Bonfire Night. RESOLVED that the Communications update be noted.
38 INFORMATION ITEMS
Action
The Borough Commander’s Newsletters were noted.
39 ANY OTHER BUSINESS
Action
It was noted that Beckenham would be fully assessed for the Purple Flag award in November and an update be provided to the next meeting.
40 DATE AND TIME OF NEXT MEETING
Action
The next meeting is scheduled for December 3rd 2015 at 10.00am.
The Meeting ended at 11.30am
Chairman
Page 13

This page is left intentionally blank
Page 14

1
Report No. CSD 16005
London Borough of Bromley
PART ONE - PUBLIC
Decision Maker: Safer Bromley Partnership Strategic Group
Date: 3rd December 2015
Decision Type: Non Urgent Non Executive Non Key
Title: MATTERS ARISING
Contact Officer: Steve Wood, Democratic Services Officer Tel: 020 8313 4316 E-mail: [email protected]
Chief Officer: Mark Bowen, Director of Corporate Services
Ward: N/A
1. Reason for report
1.1 Appendix A updates Members on matters arising from previous meetings.
________________________________________________________________________________
2. RECOMMENDATION
2.1 The Group is asked to review progress on matters arising from previous meetings.
Non-Applicable Sections: Policy/Financial/Legal/Personnel
Background Documents: (Access via Contact Officer)
Minutes of the last meeting, and the previous Matters Arising Report.
Page 15
Agenda Item 3

2
Corporate Policy 1. Policy Status: Existing Policy
2. BBB Priority: Excellent Council/Safer Bromley ________________________________________________________________________________
Financial
1. Cost of proposal: No Cost
2. Ongoing costs: Not Applicable
3. Budget head/performance centre: Democratic Services
4. Total current budget for this head: £326,980.
5. Source of funding: 2015/16 revenue budget ________________________________________________________________________________
Staff
1. Number of staff (current and additional): 10 posts (8.75fte)
2. If from existing staff resources, number of staff hours: Completion of “Matters Arising” Reports for PP&S PDS meetings can take up to a few hours per meeting.
________________________________________________________________________________
Legal
1. Legal Requirement: None
2. Call-in: Not Applicable ________________________________________________________________________________
Customer Impact
1. Estimated number of users/beneficiaries (current and projected): This report is intended primarily for Members of the Safer Bromley Partnership Strategic Group.
________________________________________________________________________________
Ward Councillor Views
1. Have Ward Councillors been asked for comments? Not Applicable
2. Summary of Ward Councillors comments: N/A
Page 16

3
Appendix A
Minute Number/Title
Matters Arising Update
3-16th June 2015 Matters Arising
No administrative support for IOM co-ordination. No IOM contingency fund. No administrative support for Community Safety. Funding solutions to be sourced urgently.
There will be no reprofiling of MOPAC funding to accommodate IOM. There is a possibility of tasking a graduate subject to funding, and a funding application has been made to Finance.
Since the last meeting, a graduate intern has been appointed to assist with Community Safety administrative support.
6-16th June 2015 Probation Services and CRC’s.
Lissa Moore to provide contact details to Nigel Davies concerning the contact details required to re-engage with Community Payback. Re-engagement with Community Payback to take place subsequently.
Lissa Moore (Anderson) has passed on contact details for Nicola Walters who is the Senior Operations Manager for CP. Contact has been made with Nicola Walters, who will be attending the meeting on December 3rd with Lisa Whitley who will be the CP contact for LBB going forward.
8-16th June 2015 SBP Strategy Document.
It was agreed at the June meeting that the revised SBP Strategy Document be prioritised, and presented to the September meeting.
The SBP Strategy Document will be presented to the Group at the December meeting.
9-16th June 2015 Psychoactive Substances.
It was noted at the June meeting that LBB and the police were monitoring a premises in Anerley that was selling NPS substances. It was agreed that any further developments concerning this premises would be brought to the meeting in September.
Mental Health Leads have been asked for further information concerning this matter but have not responded yet. LBB have received one intelligence report about a vulnerable adult being hospitalised after using products from this shop. Enquiries are ongoing.
11-16th June 2015 Domestic Abuse Sub Group Update.
It was agreed at the June 2015 meeting that the Borough Commander would contact relevant groups or organisations that had not been engaging with the Bromley Domestic Abuse and VAWG Steering Group to encourage participation and support.
Update to be provided to the December meeting by the Borough Commander. Recruitment is underway to fill the vacancy for the Domestic Abuse Commissioner role to cover maternity leave.
13-16th June 2015 Gangs Sub Group Update.
It was agreed that the services of GAV (Growing Against Violence) be used, and the relevant funding sourced.
Jane Bailey will be meeting with targeted schools in late September to assess support for using GAV
Minute 25 28th September 2015 Safer Neighbourhood Board
It was resolved that the Youth Offending Service would seek to utilise the Community Payback programme in the future to provide constructive work in the community for young offenders.
Will be discussed with Community Payback at the meeting.
Page 17
4
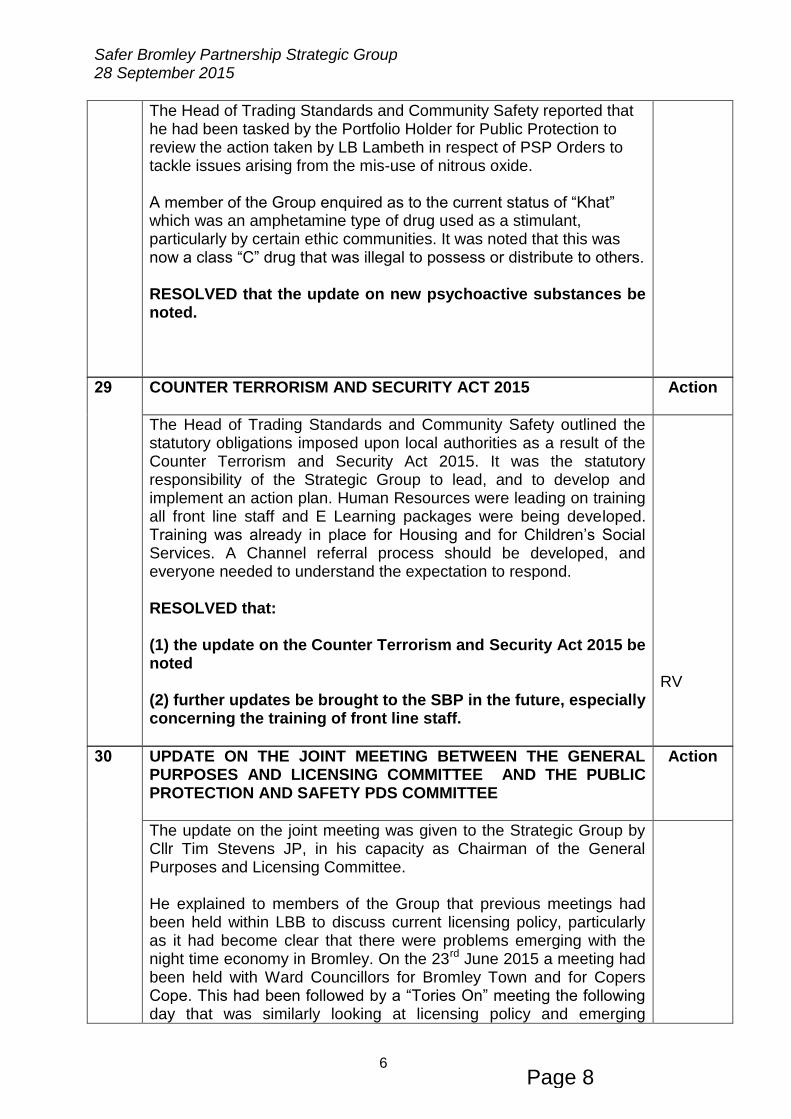
Minute 28 28th September 2015 Psychoactive Substances
It was noted that the Head of Community Safety and Trading Standards had been tasked by the Portfolio Holder for Public Protection to liaise with LB Lambeth concerning the use of Public Spaces Protection Orders to control the abuse of nitrous oxide.
A meeting has recently taken place with Lambeth, and Rob Vale will update the Group at the meeting.
Minute 29 28th September 2015 Counter Terrorism and Security Act 2015
It was resolved that future updates be brought to the Group as required, especially concerning the training of front line staff.
The Head of Trading Standards and Community Safety will update the Group at the December meeting.
Minute 34 28th September 2015 Gangs Sub Group Update
It was resolved that the Strategic Group chase the response to the letter that was sent to the Home Office, highlighting the inappropriate placement of gang nominals in Bromley.
At the recent PPS/PDS Committee meeting it was noted that LBB were being kept informed concerning the placement of Gang Nominals in Bromley, and that recent placements were coming from further away, and not just across LBB’s boundary.
Page 18

1
Bromley Crime Data Strategic Assessment 2015
This Strategic Assessment is an objective analysis of Bromley’s criminal offence data. Its purpose is to provide the Safer Bromley Partnership (SBP) with an understanding of where and to what extent crime and anti-social behaviour is an issue in the borough. This will enable the partnership to identify, based on sound evidence, what issues need to be addressed in the borough and where. This report therefore does not address why crime is the way it is in Bromley, nor how this should be addressed; but rather what the data shows us across key categories of crime so we can tailor a suitable response. This report contains analysis of Bromley’s 2015 (2014/15 financial year & 2015 rolling data to Sept. 2015) crime data:
at the ward level
compared to other London boroughs
compared to historical trends
in relation to MOPAC crime categories and targets
To give this report some perspective, it should be noted that Bromley’s crime rate per thousand of its population is less than that of Outer London, London and National rates (Fig.1). However, Bromley still ranks behind other London Boroughs in key crime categories (Fig. 3) highlighting the need for further progress to be made.
Fig.1: Bromley, Outer London, London and National Crime rates (source: GLA Borough Profiles 2015)
Contents
Bromley Crime Data Strategic Assessment 2015 ............................................................................................................. 1
Section 1: MOPAC Crime Dashboard Analysis ................................................................................................................ 2
Section 2: GLA London Data store data Analysis ............................................................................................................. 6
Section 3: Wider Strategic Analysis ................................................................................................................................ 28
64.1 69.4
84
65.7
0
10
20
30
40
50
60
70
80
90
Bromley Outer London London National
Crime Rates Per Thousand Population 2014/15
Page 19
Agenda Item 7

2
Section 1: MOPAC Crime Dashboard Analysis The data in Section 1 is sourced from the publicly available Mayor's Office for Policing And Crime’s (MOPAC) Crime Dashboards, which presents data compiled from the Metropolitan Police. This data uses rolling 12 month data up to September 2015 (the most recent update at time of writing), as well as historical data. MOPAC has previously set a 20% reduction target (baselined against data from 2012/13) for 7 key priority crime categories by 2016. These 7 priority crime categories are:
- Burglary (both residential and non-residential) - Criminal Damage - Robbery - Theft from Motor Vehicle (TFMV) - Theft of Motor Vehicle (TOMV) - Theft Person - Violence With Injury (VWI)
These crime types have been selected because they are high volume, have sizeable impact on Londoners and are clearly understood by the public. These crime types are also all victim-based offences and make up around half of all Total Notifiable Offences. (See the MOPAC Police and Crime Plan for details of all MOPAC priority areas). MOPAC 20% Crime Target Progress to date As of September 2015, Bromley’s rolling 12-month total offences volume has fallen by 16.4% against the 2012/13 baseline, well on course towards the 20% reduction target set for March 2016 (See Fig.2). Fig. 2: Bromley’s MOPAC 7 total crime reductions against 20% reduction target against 2012/13 baseline as of September 2015
Across all London boroughs, the average reduction is 18.7% as of September 2015; ~2% better in terms of achieving the target compared to Bromley. However other London boroughs show a range of progress; LB Waltham Forest for example have reduced their MOPAC 7 offence volume by over 30% to date since baseline, whereas other boroughs have seen totals volumes actually increase. Figure 3 overleaf shows Bromley’s rankings in terms of the each MOPAC 7 priority offence.
Page 20
3
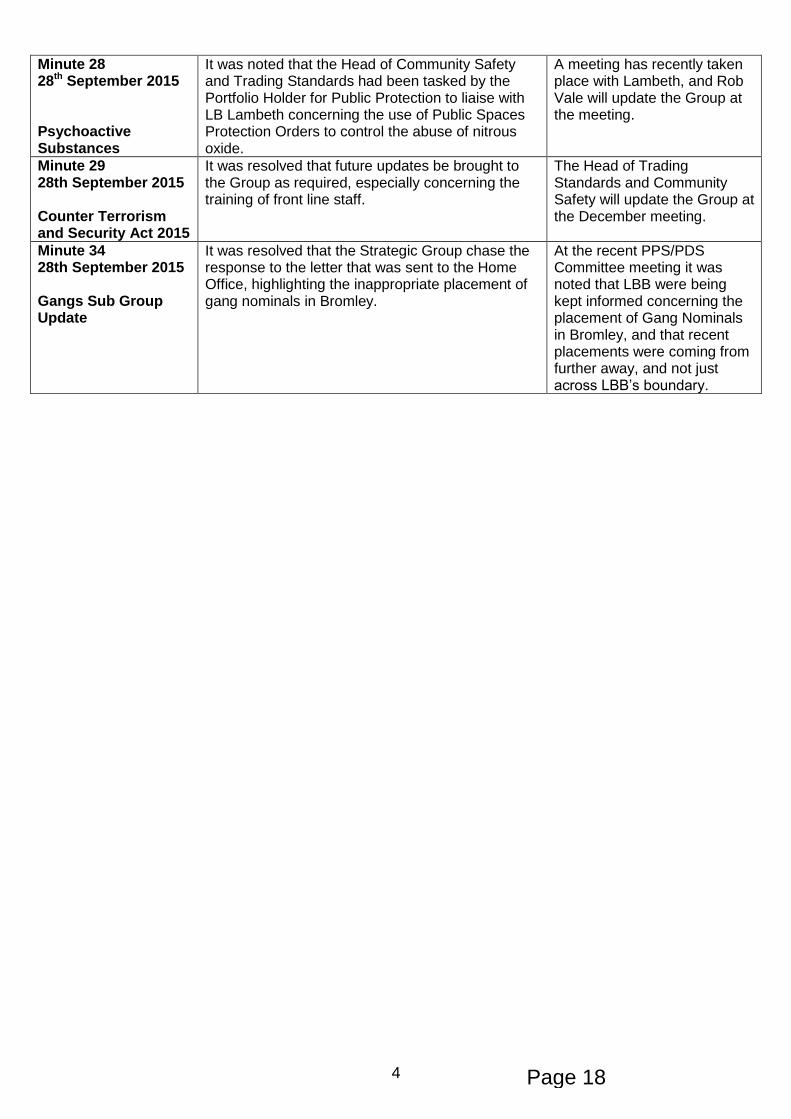
Fig.3: Bromley’s rankings in the individual MOPAC 7 crime categories out of 32 boroughs (1 being the lowest volume, 32 the highest) as of September 2015 Robbery, Theft from Motor Vehicles, Theft from Person and Violence with Injury in Bromley all perform well relative to other London boroughs and are in the bottom half of the London rankings (i.e. a rank of <16). However Burglary, Theft of Motor Vehicle Offences and Criminal Damage Offences are ranked in the top half of all boroughs, and these categories warrant greater attention. In terms of local performance, Croydon to the borough’s west ranks higher (i.e. worse) in every MOPAC category compared to Bromley, whereas Bexley to the north-east ranks lower (i.e. better) across all categories. NB this is due to the MOPAC ranking using absolute numbers of offences rather than offences ‘per head’ - meaning that boroughs with the largest populations (such as Croydon) will almost inevitably have the highest rankings. The graph below accounts for this by showing the MOPAC 7 offence total for each borough divided by the number of residents in each borough – giving a crime ‘per head’ value. In this, Bromley has the 7
th best ranking in London.
0
0.01
0.02
0.03
0.04
0.05
0.06
0.07
0.08
0.09
MOPAC 7 total crime data 'per head', rolling 12 month data to Sept. 2015
Page 21

4
Fig. 4 below shows the total volume of offences between Sept. 2014 and Sept. 2015 (i.e. 9,824 offences) broken down into the percentage of each different MOPAC 7 priority crime category. Violence with Injury, Burglary and Criminal Damage take up the biggest proportion of total MOPAC 7 offences, making up around three quarters offences in total. Theft Person and Robbery make up much smaller percentages of total offences, although Theft of Motor Vehicle and Theft from Motor vehicle also make up a significant proportion of total offences. Fig.4: Percentage of Bromley’s total MOPAC 7 offences per category (12-month rolling data, September 2015)
Figure 5 below shows how each of the 7 priority crime categories have changed relative to the 2012/13 baseline. The two categories which have shown increases against the 2012/13 baseline as of Sept. 2015 are Theft of Motor Vehicle (+3.1%) and Violence with Injury (+7.3%). There is however a 48% reduction in Robbery and sizeable reductions across other categories such as Burglary and Theft from Motor vehicle etc, culminating in the 16.4% overall reduction in offences overall compared to the baseline. Fig.5: Percentage change of MOPAC 7 total offences (as of September 2015 compared 2012/13 baseline)
Burglary 25%
Criminal Damage 24%
Robbery 4%
Theft from Motor Vehicle
16%
Theft of Motor Vehicle
8%
Theft Person 3%
Violence With Injury 20%
MOPAC 7 Offences per catregory- 12 month rolling data up to September 2015
-28
%
-9.0
%
-48
%
-27
%
+3.1
%
-9%
+7.3
%
-50.0%
-40.0%
-30.0%
-20.0%
-10.0%
0.0%
10.0%
Bu
rglary
Crim
inal D
amage
Ro
bb
ery
Theft fro
m M
oto
r Veh
icle
Theft o
f Mo
tor V
ehicle
Theft fro
m P
erson
Vio
lence W
ith In
jury
Page 22

5
Figure 6 f shows progress of each MOPAC 7 priority offence category (blue) relative to the 20% reduction target (red line) target in absolute/ numerical terms, taken directly from the dashboard.
Fig.6: MOPAC 7 Crime Volume in Bromley against 20% target reduction - March 2012/13 to September 2015
It can be seen that 4 categories are on track/ below target as of September 2015 (Burglary, Robbery, Theft from MVs, Theft from Person), although other categories have seen spikes / upward trends that have pushed the actual number of offences above the target for September 2015 (Criminal Damage, Theft of MV offences and Violence with Injury Offences) . Of these, Theft of MVs and Violence with Injury offences actually have greater numbers in September 2015 than compared to the 2012/13 baseline, although all other categories have seen reductions in this period relative to the baseline.
Page 23

6
Section 2: GLA London Data store data Analysis In autumn 2015, the Greater London Authority (GLA) released a powerful new analysis tool that can sort and compare data across a range of themes (Education, Emergency Services, Ethnicity and Origin, Financial, Health, Households, Population, Transport etc.), variables (i.e. more specific categories and indicators etc.) and locations (London-wide, Borough-wide, Neighbourhood-wide and ward-wide). The analysis in Section 2 uses this tool and its data to analyse Bromley’s MOPAC 7 data in relation to ward, other borough and historical trends in order to identify and associate certain crime types to specific locations. This could potentially help target crime more efficiently and establish specific local action plans etc. going forwards. In the following analysis, when a diagram is inputted from the tool, different wards/ areas/ boroughs etc. will have a colour assigned to indicate the relative amount of offences in that area. The cream and light green colours indicate relatively low amounts of an offence taken place, whereas the blue through to navy colours indicating relatively high amounts of offences taken place in that area (see below). The low and high colours are established relative to the wards with the lowest and highest number of offences respectively.
NB It should be noted that ‘2015’ data in this tool refers to 2014/15 financial year data (i.e. 01.04.14 to 31.03.15) as opposed to the data in Section 1, which used a rolling and more ‘up-to-date’ 12-month dataset. Fig.7: Totals by crime type: Percentage of Bromley’s total MOPAC 7 offences per category (2014/15 financial year)
Figure 7 is similar to Figure 4 in terms of proportions of total offences attributed to each offence category, but uses data from the 2014/15 financial year (rather than a rolling 12-month dataset) and hence there are subtle differences.
Total Violence with injury 21%
Robbery 4%
Burglary 26% Theft of Motor
vehichle 7%
Theft from a motor vehichle
16%
Theft from the Person
3%
Criminal Damage (vandalism)
23%
Incidents of crime by MOPAC 7 offence category in Bromley, 2014/2015 Financial Year
Page 24

7
Figure 8 below gives context to the MOPAC tool analysis in section 2 by showing Bromley’s location relative to London, and Bromley’s wards and their geographic location within the borough. Fig 8: Bromley’s position in London (left) and Bromley’s wards position in the borough (right)
Page 25

8
2.1: MOPAC 7 Priority Offences Totals i) by ward
In terms of total MOPAC 7 offences by ward, it is evident that the highest number of offences tend to be clustered in wards in both the north-west (Penge and Cator, Crystal Palace) and the north-east of the borough (Cray Valley West and East), in addition to Bromley Town centre. Low offence wards include clusters to the south of the borough- e.g. Biggin Hill and Darwin, with other wards in the centre of the borough having moderate levels of offences.
773 769 744
704 653
598 583
478 461 435 417
392 382 339 321 317 293 287 270
204 184 143
0
100
200
300
400
500
600
700
800
900
MOPAC 7 Priority Offences Totals
Page 26

9
2.1: MOPAC 7 Priority Offences Totals ii) London Comparison and Historical
London Comparison
London 2014/15 Average Offences: 10,306
Bromley 2014/15 Offences: 9,832
Bromley above or below London average? Below
Bromley’s 12 month-rolling data borough rank /32 (1= best, 32=worst) :
14
Historical
0
5000
10000
15000
20000
25000
2006 2007 2008 2009 2010 2011 2012 2013 2014 2015
Nu
mb
er
of
off
en
ces
MOPAC 7 Total Offences since 2006
Page 27

10
2.2 Total of Violence with injury i) by ward
Bromley town has the greatest number of VWI offences in 2014/15. There are relatively high volumes of offences in the north-west and north-east wards, similar to 2.1.
216
181
152 151 135 134
124 114 113
92 90 87 80 77
53 46
37 32 28 27 26 26
0
50
100
150
200
250
Total of Violence with injury
Page 28

11
2.2 Total of Violence with injury ii) London Comparison and Historical
London Comparison
London 2014/15 Average Offences: 2,185
Bromley 2014/15 Offences: 2,039
Bromley above or below London average?
Below
Bromley’s 12 month-rolling data borough rank /32 (1= best, 32=worst) :
11
Historical
Note the recent increase in offences in this category since 2013, despite initial progress since 2006.
0
500
1000
1500
2000
2500
3000
2006 2007 2008 2009 2010 2011 2012 2013 2014 2015
Nu
mb
er
of
Off
en
ces
Total of Violence with injury
Page 29

12
2.3 Robbery i) by ward
Greatest number of robbery offences taking place in Bromley Town ward, followed by two wards in the north-west of the borough (Crystal Palace and Penge and Cator) with relatively high volumes of robbery offences.
65
52 49
28
22 21 18
15 12 12 12
10 9 9 9 7 7 6 6 5
3 3
0
10
20
30
40
50
60
70
Robbery
Page 30

13
2.3 Robbery ii) London Comparison and Historical
London Comparison
London 2014/15 Average Offences: 685
Bromley 2014/15 Offences: 387
Bromley above or below London average?
Below
Bromley’s 12 month-rolling data borough rank /32 (1= best, 32=worst) :
9
Historical
Note the downward trend in robbery since a peak in offences in 2007.
0
200
400
600
800
1000
1200
2006 2007 2008 2009 2010 2011 2012 2013 2014 2015
Nu
mb
er
of
Off
en
ces
Robbery
Page 31

14
2.4 Burglary i) by ward
Greatest volumes of burglary offences for 2014/15 in the Cray valley wards to the north-east of the borough, with Crystal Palace, Orpington and Penge and Cator wards also seeing significant volumes of incidents. Note the relatively low levels again in Darwin and Biggin Hill wards.
199
179 173
166 157
139 138 132
121 112
106 102 100 98 94 93 85 80 77
67
45 42
0
50
100
150
200
250
Burglary
Page 32

15
2.4 Burglary ii) London Comparison and Historical
London Comparison
London 2014/15 Average Offences: 2,302
Bromley 2014/15 Offences: 2,521
Bromley above or below London average?
Above
Bromley’s 12 month-rolling data borough rank /32 (1= best, 32=worst) :
21
Historical:
0
500
1000
1500
2000
2500
3000
3500
4000
4500
2006 2007 2008 2009 2010 2011 2012 2013 2014 2015
Nu
mb
er
of
Off
en
ces
Burglary
Page 33

16
2.5 Theft of a Motor Vehicle i) by ward
Highest levels of ToMV from the Cray Valley wards in the north-east of the borough, followed by Penge and Cator and Crystal Palace wards to the borough’s north-west.
70
59 59
53
43 42 40
35 35 33 32
28 24
22 18 18
16 14 13 12 11
9
0
10
20
30
40
50
60
70
80
Theft of a Motor Vehicle
Page 34

17
2.5 Theft of a Motor Vehicle ii) London Comparison and Historical London Comparison
London Comparison
London 2014/15 Average Offences: 689
Bromley 2014/15 Offences: 681
Bromley above or below London average?
Below
Bromley’s 12 month-rolling data borough rank /32 (1= best, 32=worst) :
20
Historical
Note a downward trend since 2006, but a small increase since 2013/14.
0
200
400
600
800
1000
1200
1400
1600
1800
2006 2007 2008 2009 2010 2011 2012 2013 2014 2015
Nu
mb
er
of
Off
en
ces
Theft of a Motor Vehicle
Page 35

18
2.6 Theft from a motor vehicle i) by ward
Highest volumes of TfMV in the adjacent Penge and Cator and Copers Cope ward to the boroughs north-west. Note the relatively high levels in Cray Valley East and Chislehurst wards.
121
111 103 102
97
85 84 79
75 75 71 69 67 65
61 59 55 52 51 48
44
33
0
20
40
60
80
100
120
140
Theft from a Motor Vehicle
Page 36

19
2.6 Theft from a motor vehicle ii) London Comparison and Historical London Comparison
London Comparison
London 2014/15 Average Offences: 1,560
Bromley 2014/15 Offences: 1,622
Bromley above or below London average?
Above
Bromley’s 12 month-rolling data borough rank /32 (1= best, 32=worst) :
14
Historical
Note the downward trend in TfMV since a peak in 2009.
0
500
1000
1500
2000
2500
3000
3500
2006 2007 2008 2009 2010 2011 2012 2013 2014 2015
Nu
mb
er
of
Off
en
ces
Theft from a Motor Vehicle
Page 37

20
2.7 Theft from the person i) by ward
Note the number of offences in the Bromley Town centre ward (significantly higher than other wards).
82
29
21
16 13 12 12 11 10 9 8 7 7 7 6 5 4 4 3 2 1 0
0
10
20
30
40
50
60
70
80
90
Theft from the Person
Page 38

21
2.7 Theft from the person ii) London Comparison and Historical London Comparison:
London Comparison
London 2014/15 Average Offences: 981
Bromley 2014/15 Offences: 279
Bromley above or below London average?
Below
Bromley’s 12 month-rolling data borough rank /32 (1= best, 32=worst) :
5
Historical
Note the downward trend in theft from the person since a peak in 2006.
0
100
200
300
400
500
600
700
800
2006 2007 2008 2009 2010 2011 2012 2013 2014 2015
Nu
mb
er
of
Off
en
ces
Theft from the person
Page 39

22
2.8 Criminal Damage (Vandalism) i) by ward
Note the high volumes of criminal damage offences in the Cray Valley wards, as well as in the Penge and Cator, Bromley Town and Orpington wards.
201 199
177 171 167
144 137 134
114 106
98 87 85
65 63 63 60 56 53 40 34
25
0
50
100
150
200
250
Criminal Damage (Vandalism)
Page 40

23
2.8 Criminal Damage (Vandalism) ii) London Comparison and Historical London Comparison
London Comparison
London 2014/15 Average Offences: 1,904
Bromley 2014/15 Offences: 2,303
Bromley above or below London average?
Above
Bromley’s 12 month-rolling data borough rank /32 (1= best, 32=worst) :
25
Historical Comparison
Note the downward trend since 2006, with a slight increase in 2014/15 compared to 2013/14.
0
1000
2000
3000
4000
5000
6000
7000
2006 2007 2008 2009 2010 2011 2012 2013 2014 2015
Nu
mb
er
of
Off
en
ces
Criminal Damage (Vandalism)
Page 41

24
2.9: Trend Analysis From the MOPAC 7 offences analysis documented in sections 2.1 to 2.8, it can be concluded that:
There are relatively high levels of offences across the north-west (Penge and Cator, Crystal Palace, Copers Cope wards) and in the Cray Valley wards (Cray Valley East and Cray Valley West)
Bromley Town centre also has particularly high levels of offences in Total Violence with Injury, Robbery and Theft from Person crime categories
Darwin and Biggin Hill and Shortlands wards have consistently low numbers of offences across the board
Relative to 2006, all crime categories have seen significant reductions as of 2014/15 (see Fig.9)
Violence with injury, Theft of Motor Vehicle and Criminal Damage have seen small increases in recent years Fig.9: All MOPAC 7 category number of offences since 2006.
0
1000
2000
3000
4000
5000
6000
7000
2006 2007 2008 2009 2010 2011 2012 2013 2014 2015
Nu
mb
er
of
Off
en
ces
All MOPAC 7 offences 2006-2014/15
Burglary Criminal Damage (vandalism) Robbery
Theft from Motor Vehicle Theft of Motor Vehicle Theft from Person
Violence with Injury
Page 42

25
Fig.10: MOPAC 7 priority offences per ward, 2014/15
Figure 10 shows all ward data for the 7 crime categories. Outliers- i.e. wards with the highest levels of offences relative to other wards in each category can be easily identified.
Page 43

26
Fig.11: Ward breakdown of MOPAC 7 Priority Offences, 2014/15
Figure 11 shows the same data from Figure 10 plotted by ward rather than by crime category. Again, outliers (e.g. high offences in a crime category relative to other wards) can be easily identified, and overall performance can be compared between wards.
Page 44

27
Fig.12: Top three wards with highest offences for each category (number of incidents in the brackets)
MOPAC Crime Category Ward with most incidents
Ward with 2nd
most incidents
Ward with 3rd
most incidents
Total Violence with injury Bromley Town (216) Penge and Cator (181) Cray Valley East (152)
Robbery Bromley Town (65) Crystal Palace (52) Penge and Cator (49)
Burglary Cray Valley East (199) Cray Valley West (179) Crystal Palace (173)
Theft of Motor vehicle Cray Valley East (70) Penge and Cator (59) Cray Valley West (59)
Theft from a motor vehicle Penge and Cator (121) Copers Cope (111) Cray Valley East (103)
Theft from the Person Bromley Town (82) Penge and Cator (29) Copers Cope (21)
Criminal Damage (vandalism) Cray Valley East (201) Cray Valley West (199) Bromley Town (171)
MOPAC 7 Totals Penge and Cator (773) Cray Valley East (769) Bromley Town (744)
As highlighted through analysis 2.1-2.8, the wards with the highest incidents in each category are dominated by Bromley Town, Penge and Cator, and Cray Valley East and West.
Fig.13: Top two MOPAC 7 categories with most incidents in each ward (number of incidents in brackets)
Ward Category with Most Incidents Category with 2nd
Most Incidents
Bickley Burglary (80) Theft from a Motor vehicle (67)
Biggin Hill Theft from a Motor Vehicle (44) Burglary (42)
Bromley Common and Keston Total Violence with Injury (124) Criminal Damage (vandalism) (114)
Bromley Town Total Violence with Injury (216) Criminal Damage (vandalism) (171)
Chelsfield and Pratts Bottom Burglary (139) Theft from a motor vehicle (59)
Chislehurst Burglary (132) Theft from a motor vehicle (102)
Clock House Burglary (112) Theft from a motor vehicle (85)
Copers Cope Burglary (138) Total Violence with Injury / Criminal Damage (vandalism) (134)
Cray Valley East Criminal Damage (vandalism) (201) Burglary (199)
Cray Valley West Criminal Damage (vandalism) (199) Burglary (179)
Crystal Palace Burglary (173) Criminal Damage (vandalism) (144)
Darwin Burglary (45) Total Violence with Injury (26)
Farnborough and Crofton Criminal Damage (vandalism) (85) Total Violence with Injury / Burglary (77)
Hayes and Coney Hall Burglary (121) Theft from a motor vehicle (71)
Kelsey and Eden Park Total Violence with Injury (114) Criminal Damage (vandalism) (106)
Mottingham & Chislehurst North Criminal Damage (vandalism) (137) Burglary (98)
Orpington Criminal Damage (vandalism) (167) Burglary (166)
Penge and Cator Total Violence with Injury (181) Criminal Damage (vandalism) (177)
Petts Wood and Knoll Burglary (85) Theft from a motor vehicle (65)
Plaistow and Sundridge Criminal Damage (vandalism) (98) Burglary (93)
Shortlands Burglary (67) Theft from a motor vehicle (61)
West Wickham Burglary (102) Theft from a motor vehicle (75)
Figures 12 and 13 show a number of trends:
Burglary is the category with the most incidents in a number of wards, with particularly high number of offences in Chelsfield and Pratts Bottom, Keston & Bromley Common, Cray Valley East, Crystal Palace, Hayes and Coney Hall is relatively high
Theft from a motor vehicle is often the second most common crime category in each ward
Page 45

28
Section 3: Wider Strategic Analysis A variety of data sources were used in section 3, including police recorded crime and incidents, MOPAC dashboards, youth offending service (YOS), and Borough’s ASB data and domestic violence data, covering data since the 2010/11 financial year. 3.1: Personal Acquisitive Crime This section will outline the trends and patterns of personal acquisitive crime, i.e. crime types where the victim was an individual rather than a business or community within Bromley. Overall, most acquisitive crime types have recorded a reduction in the last five years. However, increases have been seen in some crime types e.g. Theft from Shops and Theft/Taking of Motor Vehicle. Figure 14: Long term trend for Bromley – selected acquisitive crime types
3.1.1: Theft from Shop Theft from shop remains the highest volume of this group of crimes. It can be seen from figure 14 above that over the last five years the volume has shown an overall increase. However, it should be noted that 2012/13 recorded a substantial reduction. Comparing 2014/15 with 2013/14, there was an increase of 3% recorded. However this was very low compared to the increase in theft from shop offences between 2012/13 and 2013/14 (34%). 3.1.2: Theft of Motor Vehicle Theft/Taking of Motor Vehicle recorded a reduction of 13% between 2010/11 and 2014/15. However, in 2014/15, 681 offences have been recorded; whilst in the same period last year 555 offences were recorded (an increase of 23%). 3.1.3: Dwelling Burglary Whilst dwelling burglary has seen an issue over the years, the progress made on reducing the volume is substantial. The overall long term trend is a reduction. During the 2014/15 financial year, there were 1654 burglaries offences reported to the Police - a reduction of 19% compared with the same period previous year. The Partnership will need to be mindful of the successes to date when exploring any future options for tackling this crime type. 3.1.4: Personal Robbery The volume of offences of personal robbery per year remains low; between 2010/11 and 2014/15 the volume of offences deceased from 573 to 337 (a 41% reduction). 3.1.5: Theft from Motor Vehicle
The volume of offences of Theft from Motor Vehicle 2010/11 and 2014/15 the volume of offences decreased from 2131 to 1622 (24% reduction between 2010/11 and 2014/15).
0
500
1000
1500
2000
2500
FY 10/11 FY 11/12 FY 12/13 FY 13/14 FY 14/15
Nu
mb
er
of
Off
en
ce
s
Financial year
Personal Robbery
Burglary in A Dwelling
Theft/Taking Of Motor Vehicle Theft From Motor Vehicle
Theft From Shops
Theft Person
Theft/Taking Of Pedal Cycles
Page 46

29
3.2: Violent Crime This section will cover the analysis on types of violence related offences, which are of importance to the Partnership when reviewing its priorities for the forthcoming year. 3.2.1: Total Violence against the Person Figure 15: Total Violence against the Person and Total Sexual Offences in Bromley - 2010/11 to 2014/15
NB: the use of two separate axes- violence against the person on left and total sexual offences on the right. Overall total violent crime has increased significantly over the last 5 years (See Fig.15). Between 2010/11 and 2014/15 the volume of violence against the person offences increased from 4844 to 5968 (a 23% increase). When we drill down further into what makes up this 23% increase we find an increase of 38% in relation to harassment, 42% for common Assault and most significantly an increase of 150% for Wounding/GBH, which account for a large proportion of this increase. 3.2.2: Sexual offences Total sexual offences have also increased significantly over the last five years (see Fig.15). There were 396 sexual offences recorded in 2014/15, compared to 241 in 2010/11, and 292 in 2006/7 (Fig.16). Bromley’s number of sexual offences in 2014/15 was below the London average (see table below).
However in the last 5 years rape has gone up by 106%, and other sexual offences also increased by 49%.
0
50
100
150
200
250
300
350
400
450
0
1000
2000
3000
4000
5000
6000
7000
2010/11 2011/12 2012/13 2013/14 2014/15
To
tal S
ex
ua
l O
ffe
nc
es
(b
lue
)
To
tal V
iole
nc
e A
ga
ins
t th
e P
ers
on
(g
ree
n)
Total Violence Against The Person Total Sexual Offences
London Comparison
London 2014/15 Average Offences: 460
Bromley 2014/15 Offences: 396
Bromley above or below London average?
Below
Page 47

30
Fig.16: Total Sexual offences in Bromley, 2006 to 2015 (financial years)
Note the increase in total sexual offences since 2013
Fig.17: Sexual offences by ward 2014/15
Fig.18: Screen-grab from MOPAC dashboard- 12 month rolling data to September 2015
0
50
100
150
200
250
300
350
400
450
2006 2007 2008 2009 2010 2011 2012 2013 2014 2015
Total Sexual Offences 2006 to 2015
43
38
28 26 26 26
24 22 22
18
13 13 11 10 10 10 9 8 6 5
3 2
0 5
10 15 20 25 30 35 40 45 50
Sexual Offences by ward 2014/15
Page 48

31
3.3: Domestic Violence/ Abuse See MOPAC domestic and sexual violence dashboard Figure 19: 4year trend for Bromley -Overall patterns of Domestic violence
The number of domestic incidents has increased, from 4 227 in the previous year to 4 718 in the 2014/15 period. There were 2,290 domestic violent offences recorded and flagged with an aggravating factor of domestic violence in Bromley over the 2014/15 period, which was an increase of 29% compared with 2013/14. Of these 33% offences were of a violent nature, compared to 38% the year before. Bromley sits in 10
th position in the London Boroughs (32 having
the highest/worst rate and 1st the lowest/best); recording 15 domestic incidents per 1,000 populations. Note the sharp
increase in domestic abuse offences since 2013 as shown in Fig.20 below. Figure 20: Domestic Abuse offences in Bromley, 2006 to 2015 (financial years)
Fig 21: Screen-grab from MOPAC dashboard- 12 month rolling data to September 2015
3,589
1,511
608
3,565
1,496
516
4,227
1,770
676
4,718
2,290
754
0
500
1,000
1,500
2,000
2,500
3,000
3,500
4,000
4,500
5,000
All Domestic Incidents Domestic Abuse Offences Domestic Violence with Injury
2011/12
2012/13
2013/14
2014/15
1000
1200
1400
1600
1800
2000
2200
2400
2006 2007 2008 2009 2010 2011 2012 2013 2014 2015
Domestic Abuse Offences 2006 to 2015
Page 49

32
Fig.21: Domestic Abuse Offences by ward 2014/15
3.4: Criminal Damage Fig.21: Criminal damage financial year 10/11 to 14/15
Overall the total Criminal Damage offences have reduced significantly over the last 5 years. During the 2014/15 period, there were 2302 criminal damage incidents recorded in the borough, up by 255 on the previous year (+12%). The most prevalent offence type within the category of ‘criminal damage’ was found to be vehicle damage, accounting for 40% of offences (922 incidents). Vehicle damage offences have also increased when compared to the previous year by 11% (up by 88 offences), however the significant increase (31%) was identified on “criminal Damage to other building” offences. Also see more analysis in section 2.8.
213
194
177 165
156 151 148
128 120 117 113
77 73 64 61 59 56
47 46 38 34
20
0
50
100
150
200
250
Domestic Abuse Offences by Ward 2014/15
0
500
1000
1500
2000
2500
3000
FY 10/11 FY 11/12 FY 12/13 FY 13/14 FY 14/15
Criminal Damage
Page 50

33
3.5: Drug Offences Fig.22: Drugs Offences - financial year 10/11 to 14/15
There was a significant decrease in all drug offences, particularly drug trafficking and possession of drugs. During the 2014/15 period there were 930 Drug related offences recorded in Bromley, representing a 15% reduction compared with the previous year. 3.6: Bromley Council Anti-Social Behaviour cases Fig.23: ASB Offences - financial year 10/11 to 14/15
During the 2014/15 period, there were 3,955 anti-social behaviour (ASB) incidents recorded by the council in Bromley - a 10% decrease on the previous year. Bromley has recorded the lowest number of ASB incidents in this period compared with each of the previous four years (April 10 to March 15).
800
850
900
950
1000
1050
1100
1150
FY 10/11 FY 11/12 FY 12/13 FY 13/14 FY 14/15
Drugs Offences
0
1000
2000
3000
4000
5000
6000
2010/11 2011/12 2012/13 2013/14 2014/15
ASB Incidents
Page 51

34
Fig.24: Anti-Social Behaviour Incidents by ward 2014/15
All the wards have seen a decrease in the number of incidents over 10/11 to 14/15 period. In 2014/15 Crystal Palace is shown to be the top for ASB incidents in the borough, recording 9% of the total recorded figures (339 incidents).
339 323 311
271 255
241 238 227 213 205 192
169 150 140
116 107 105 103 76 71 60
43
0
50
100
150
200
250
300
350
400
Anti-Social Behaviour Incidents by ward 2014/15
Page 52

35
3.7: Youth Crime There have been 198 youth offenders’ who committed 569 offences in Bromley during the 2014/15 period; this was an increase of 19% offences compared with the previous year (April 14 to March 15). 87% of the youth offenders were Male and 69% of theses offenders are being of white ethnicity. The highest volumes of crimes committed against this victim group are Violent against the Person, Theft and Handling and Drug offences. 3.7.1 First time Entrance There were 26 first time entrants (FTE) to the Criminal Justice System between April and June 2015 in Bromley; 92% of these young people were boys. The two most common offence types were Theft and Handling (7) and violence against the person (14). Performance over the last 12 months indicates Bromley YOS has seen an increase of 32 young people entering the Criminal Justice System compared with 2013/14. Fig.24 a) First Time Entrants to the Youth Justice System by year. Bromley YOS Youth Justice Strategic Plan 2015-16
3.7.2 Youth Reoffending Fig.24 b): Youth Reoffending
This chart shows whether a young person reoffends or not within the same period. Bromley is below the London rate but substantially above the national youth re-offending rate. Comparing this to the previous year, Bromley has reduced the binary reoffending rate by 5.2% (N=43.23% to 40.99%). The number of young people that have offended is lower; however the number of offences committed by these young people is significantly high. In the last reporting period (Jul 12 – Jun 13) re-offences 16.2% greater compared with the same period in the previous year.
0
50
100
150
200
250
2010/11 2011/12 2012/13 2013/14 2014/15
First Time Entrants to the Youth Justice System (FTE) - national and local (unverified) data
Number of FTE (national data) Number of FTE (local data (unverified))
41.0% 42.2%
36.5%
32%
34%
36%
38%
40%
42%
44%
Reoffending rates after 12 months binary rate - Jul 12 to Jun 13 cohort (latest period)
Bromley
London
England
Page 53

36
Fig. 24 c) Rate of Proven Re-offending by Young People who have previously offended (national reoffending data)
Year Size of cohort Number of re-offences within 12 months of original conviction
Number of Offences
Frequency Binary
2012/13 243 101 281 1.16 41%
2011/12 256 110 261 1.02 43%
2010/11 374 129 318 0.85 34.5%
2009/10 485 151 371 0.76 31%
Note the frequency of reoffending by young people has been on the increase consistently since 2009/10. Fig.24 d) Young People Receiving a Conviction in Court who are Sentenced to Custody over time
Year Sentenced to Custody Custody Rate Per 1,000 of 10-17 population
2014/15 17 0.57%
2013/14 23 0.78%
2012/13 9 0.3%
2011/12 15 0.5%
2010/11 15 0.59%
Bromley has seen a 26% reduction in 2014/15 compared with 2013/14, translating to 6 fewer sentence outcomes. There was a spike in the custody figures during the period Apr 13 - Jun 14.
Page 54
37
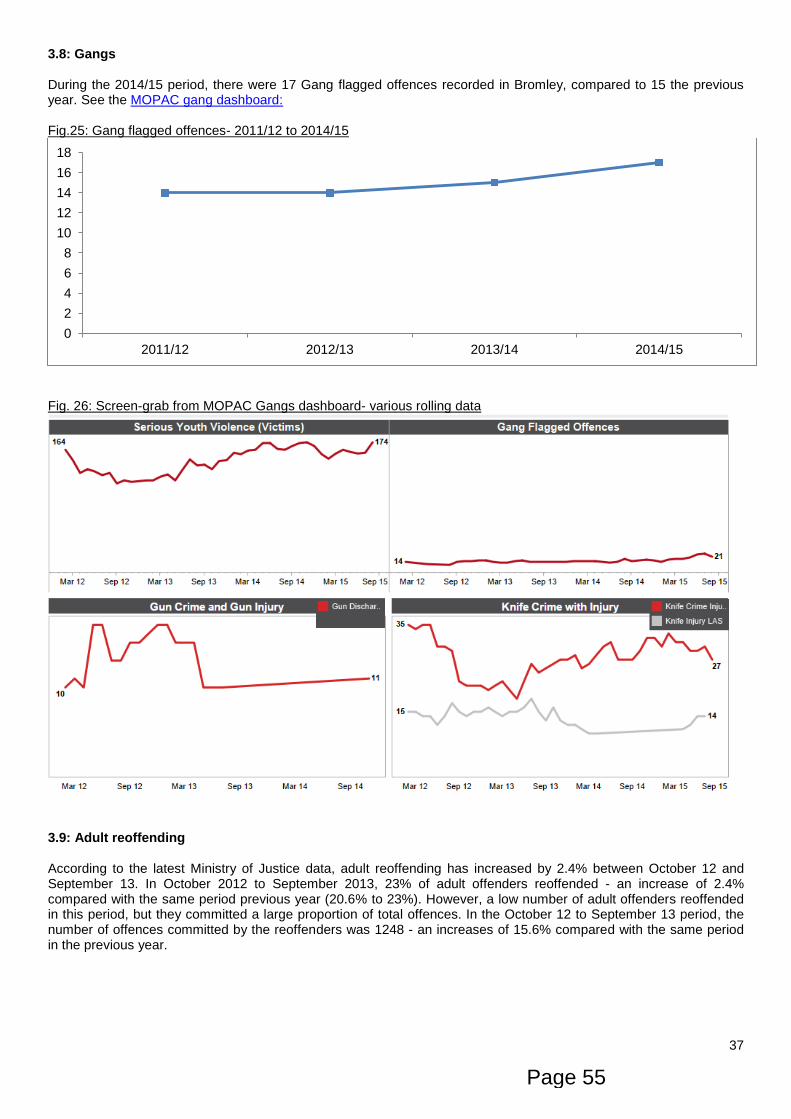
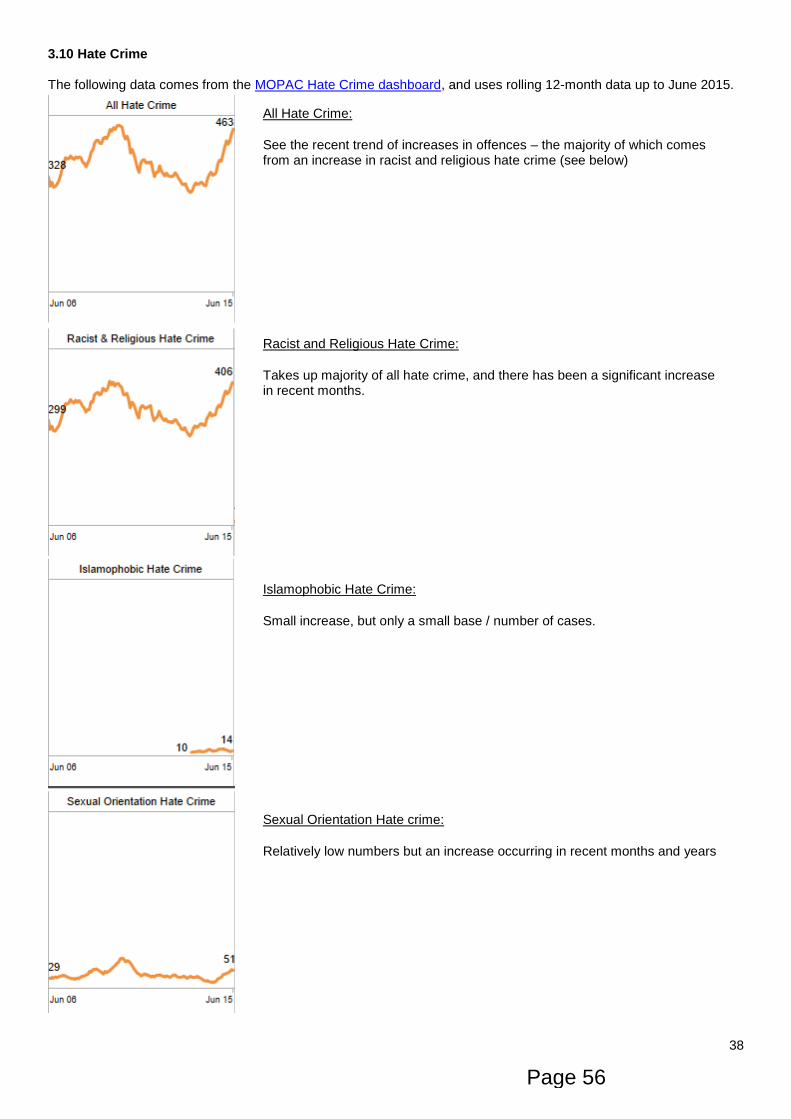
3.8: Gangs During the 2014/15 period, there were 17 Gang flagged offences recorded in Bromley, compared to 15 the previous year. See the MOPAC gang dashboard: Fig.25: Gang flagged offences- 2011/12 to 2014/15
Fig. 26: Screen-grab from MOPAC Gangs dashboard- various rolling data
3.9: Adult reoffending According to the latest Ministry of Justice data, adult reoffending has increased by 2.4% between October 12 and September 13. In October 2012 to September 2013, 23% of adult offenders reoffended - an increase of 2.4% compared with the same period previous year (20.6% to 23%). However, a low number of adult offenders reoffended in this period, but they committed a large proportion of total offences. In the October 12 to September 13 period, the number of offences committed by the reoffenders was 1248 - an increases of 15.6% compared with the same period in the previous year.
0
2
4
6
8
10
12
14
16
18
2011/12 2012/13 2013/14 2014/15
Page 55
38
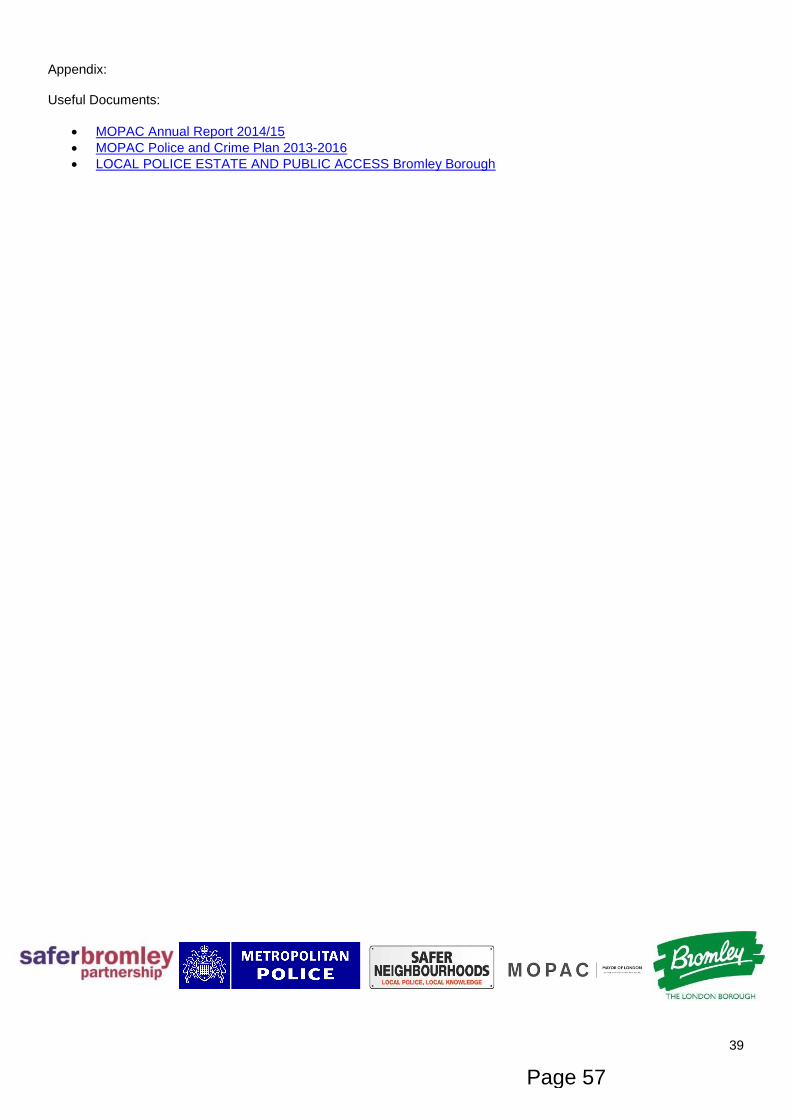
3.10 Hate Crime The following data comes from the MOPAC Hate Crime dashboard, and uses rolling 12-month data up to June 2015.
All Hate Crime:
See the recent trend of increases in offences – the majority of which comes from an increase in racist and religious hate crime (see below) Racist and Religious Hate Crime:
Takes up majority of all hate crime, and there has been a significant increase in recent months. Islamophobic Hate Crime:
Small increase, but only a small base / number of cases. Sexual Orientation Hate crime:
Relatively low numbers but an increase occurring in recent months and years
Page 56
39
Appendix: Useful Documents:
MOPAC Annual Report 2014/15
MOPAC Police and Crime Plan 2013-2016
LOCAL POLICE ESTATE AND PUBLIC ACCESS Bromley Borough
Page 57

This page is left intentionally blank

11 1
Bromley Borough Commander’s Newsletter
September 2015
TOTAL POLICING
Introduction Good morning / afternoon. Welcome to the September issue of my monthly external newsletter. I want to use this issue as an opportunity to set out some of the challenges facing the Metropolitan Police Service in the next months and years. I feel this is necessary after some of the feedback I have received from you after the Crime Summit in September and last month’s newsletter. Of course, I will also set out how we are doing in terms of making Bromley a safer Borough. Operation and Crime Update As you know, the MPS were set a four-year target to reduce crime across seven crime types by 20% by April 2016. We are now six months away from this date so I thought you would like an update on where we are. Overall, the MPS is currently at -18.7% which equates to 76,850 less victims of crime. In Bromley, we are closing the gap and are at -16.45 which means there are now 1931 fewer victims of crime than there were in the baseline year on 2011/12. I think this is testament to the great work that is done in partnership between the community, our partners and my police officers and staff. In relation to the individual offence types, there is clearly some excellent news. Burglary is down by 27.6% (or 946 offences), criminal damage is at -8.7% (225 offences), robbery has reduced by 637 offences (-48.1%), theft from motor vehicle is down by 26.6% (556 offences) and theft from the person has reduced by m8.5%, which equates to 26 offences. Violence with injury offences have increased by 7.3% (138 offences) and theft of motor vehicle is up by 2.8% (21 offences) although the rise for this crime type is more significantly up in the last nine months. I’m pleased to say that our calls to Anti-Social behaviour have also reduced by 14.5%. Also of note is that for emergency calls where we have a 15 minute target, we achieve this on almost 91% of occasions, despite the fact we are the largest geographical borough in London. We also reach 92.4% of our non-emergency calls within the 60 minute target. None of this means that we are, or can be complacent. Some short-term increases in crime are challenging us and the number of calls we do respond to is still high. My officers are rolling out Met-Trace across a number of wards to tackle burglary, we are just embarking on our operational plans for Halloween / Bonfire night to impact on traditional ASB issues and we are just about to launch our annual response to the darker evenings when burglary increases. Operation Bumblebee has some tried and tested tactics that will balance crime prevention advice to householders with some targeted activity against known offenders. Last week I held a Commendation ceremony where a number of police officers and members of the public received an award for their actions. The incidents that they dealt with included life saving interventions, superb investigations into complex criminal activity, problem-solving to address ASB on an estate and an armed incident. Of particular note was the incident last New Year’s Eve in Petts Wood where several members of the public chased and caught a suspect who had just robbed a bank. Their bravery was outstanding and very worthy of recognition.
Page 59
Agenda Item 13

22 2
Bromley Borough Commander’s Newsletter
September 2015
TOTAL POLICING
Challenges for the Metropolitan Police
The Commissioner has recently been talking publically about the challenges facing the MPS in light of expected cuts to our budget of between 25-40%. There has been some national publicity about the impact of this on a number of issues including the future of PCSO’s, the number of police officers in London, how we provide public access services and the structure through which we deliver policing. As I explained in the last newsletter, the Commissioner and Management Board are looking at what options there are to deliver the required budget savings, but no decisions have been made, despite any rumours you may have heard. In fact, the Commissioner has been consistently saying that no decisions will be made until we know the scale of the reduction which can’t happen before December. It is clearly prudent and good practice to explore the possible impact and risk on a range of options before committing to any course of action. Consultation and communication will be key to any changes, both internally with our staff and externally with our communities and partners. In the meantime, the Commissioner will continue to lobby to secure the best possible settlement for the MPS and for London from both the Home Office and the Mayor.
Operation Bumblebee
More than 5000 homes were burgled in London by thieves simply walking in through unlocked doors. The Bumblebee campaign material highlights this fact, and carries the reminder ‘Always lock before you leave’ while encouraging the public to visit crime prevention site more information and advice. Just one month before the clocks go back - traditionally a time of increased criminal activity - breakfast radio ads will target listeners in cars or at home, while digital displays will reach commuters at key underground connections.
The campaign focuses on locking the front door as a simple step for members of the public to take, which could have a dramatic impact on burglary numbers. The Met is advising Londoners to:
Close and lock all your doors and windows, even if you are only going out for a few minutes. Make sure UPVC doors are properly locked with a key. Make sure the side and/or back gate is locked. Lock your shed or garage. Make sure that any valuables are out of sight. Leave some lights on if it will be dark before you get home. Don’t leave your car keys or ID documents near doors, windows or your letterbox.
While we see a rise in burglaries of this nature in autumn the overall number of burglaries continues to fall. While prevention is vital, the MPS also recognises the need to target known or suspected burglars as well and Operation Bumblebee will continue to investigate and pursue suspects and bring them before the courts.
Chris Hafford
Borough Commander
Page 60

33 3
Bromley Borough Commander’s Newsletter
September 2015
TOTAL POLICING
Contacting the police in Bromley There are a number of ways that you can contact the police. If a crime is currently taking place and you are in immediate danger, please always dial 999. If you wish to contact the Metropolitan Police Service and it is not an emergency, please call our non-emergency number, 101. You can request a visit from a local officer within 48 hours via this number too. Certain categories of crime or incidents committed in the London area can now be reported over the internet, as long as an urgent response is not required. Please visit the MPS website for further information – www.met.police.uk You can also contact any of our Neighbourhood Policing Teams by telephone or email – visit the MPS website www.met.police.uk, type your postcode into the team finder and you’ll be directed to your local team’s webpage which contains their contact details. In non-emergency situations you can visit any Front Counter:
Bromley Police Station, High Street, Bromley, BR1 1ER has a front counter open 24 hours a day
Penge SNT base, Maple Road, Penge, SE20 8RE is open:
Monday to Friday (excluding public holidays) between 11am - 7 pm (closed 3pm- 4pm).
West Wickham SNT base, 9 High Street, West Wickham, BR4 0LP is open:
Monday and Thursday: 1pm - 4pm Tuesday, Wednesday and Friday: 10am - 1pm
There are also currently three Contact Points across the Borough. Contact points provide a convenient opportunity to speak to the local police face to face. They are an alternative to visiting a police station front counter for non urgent issues. These are:
Biggin Hill SNT base, 192-194 Main Road, Biggin Hill, TN16 3BB Cray Valley SNT base, 43 - 45 High Street, St Mary Cray, BR5 3NJ Green Street Green SNT base, 49 High Street, Green St Green, BR6 6BG
Their opening times are: Wednesday and Thursday evenings: 7pm - 8pm Saturday afternoons: 2pm - 3pm
Page 61

44 4
Bromley Borough Commander’s Newsletter
September 2015
TOTAL POLICING
A/Inspector Andy Buckley
Contact numbers for Safer Neighbourhood Teams in the North East Neighbourhood
Bickley 020 8721 2610 Bromley Town 020 8721 2859 Chislehurst 020 8721 2612 Mottingham & Chislehurst North 020 8721 2889
Plaistow & Sundridge 020 8721 2613
Inspector Ian Brown
Contact numbers for Safer Neighbourhood Teams in
the South West Neighbourhood
Biggin Hill 020 8721 2820 Bromley Common & Keston 020 8721 2607 Darwin 020 8721 2603 Hayes & Coney Hall 020 8649 3548
West Wickham 020 8721 2608
Inspector Phyllis Rooney
Contact numbers for Safer Neighbourhood Teams in the North West Neighbourhood
Clock House 020 8721 2615 Copers Cope 020 8721 2772 Crystal Palace 020 8721 2604 Kelsey & Eden Park 020 8721 2616
Penge & Cator 020 8649 3541
Shortlands 020 8721 2614
Inspector Toby Noar
Contact numbers for Safer Neighbourhood Teams in the South East Neighbourhood
Chelsfield & Pratts Bottom 020 8721 2605 Cray Valley East 020 8284 8113 Cray Valley West 020 8721 2611 Farnborough & Crofton 020 8721 2606
Orpington 020 8721 2729
Petts Wood & Knoll 020 8721 2609
Page 62