public infrastructure, location of private schools and primary
TRANSCRIPT

DI
SC
US
SI
ON
P
AP
ER
S
ER
IE
S
Forschungsinstitut zur Zukunft der ArbeitInstitute for the Study of Labor
Public Infrastructure, Location of Private Schools and Primary School Attainment in an Emerging Economy
IZA DP No. 4572
November 2009
Sarmistha Pal

Public Infrastructure, Location of
Private Schools and Primary School Attainment in an Emerging Economy
Sarmistha Pal CEDI, Brunel University
and IZA
Discussion Paper No. 4572 November 2009
IZA
P.O. Box 7240 53072 Bonn
Germany
Phone: +49-228-3894-0 Fax: +49-228-3894-180
E-mail: [email protected]
Any opinions expressed here are those of the author(s) and not those of IZA. Research published in this series may include views on policy, but the institute itself takes no institutional policy positions. The Institute for the Study of Labor (IZA) in Bonn is a local and virtual international research center and a place of communication between science, politics and business. IZA is an independent nonprofit organization supported by Deutsche Post Foundation. The center is associated with the University of Bonn and offers a stimulating research environment through its international network, workshops and conferences, data service, project support, research visits and doctoral program. IZA engages in (i) original and internationally competitive research in all fields of labor economics, (ii) development of policy concepts, and (iii) dissemination of research results and concepts to the interested public. IZA Discussion Papers often represent preliminary work and are circulated to encourage discussion. Citation of such a paper should account for its provisional character. A revised version may be available directly from the author.

IZA Discussion Paper No. 4572 November 2009
ABSTRACT
Public Infrastructure, Location of Private Schools and Primary School Attainment in an Emerging Economy*
The paper argues that access to public infrastructure plays a crucial role on the presence of private schools in a community, as it could not only minimise the cost of production, but also ensure a high return to private investment. Results using community, school and child/household-level PROBE survey data from five north Indian states provide some support to this central hypothesis: even after controlling for all other factors, access to village infrastructural facilities is associated with a higher likelihood of having a private school in the community. This is also corroborated by an analysis of household demand for private schools. The paper concludes by examining the effect of private school presence on year 5 pass rates: while all-school pass rates are significantly higher in villages with a private school, private school presence fails to have significant effect on local state school pass rates. JEL Classification: I20, I30, O15, P36 Keywords: school privatisation, school choice, school attainment, local public
infrastructure, failing state schools, simultaneity bias, instrumental variable Corresponding author: Sarmistha Pal CEDI, Department of Economics and Finance Brunel University Uxbridge UB8 3PH United Kingdom E-mail: [email protected]
* Financial Assistance from the Leverhulme Trust is gratefully acknowledged. I am grateful to the Managing Editor and an anonymous referee for very constructive suggestions during revisions. I would also like to thank Geeta Kingdon and Francois Leclercq for the data, and Paul Glewwe for very detailed comments and John Bennett, Sugata Ghosh, Elisabetta Iossa, Remi Jedawab, Geeta Kingdon, David Newhouse, Peter Orazem, Chris Skoll and also the participants of the Minnesota International Development conference in Minneapolis, CSAE conference in Oxford and Institute of Education Staff Seminar for many discussions/suggestions on earlier drafts. I am however solely responsible for any errors.

1
Public Infrastructure, Location of Private Schools and Primary School Attainment in an Emerging Economy
1. Introduction
Investment in education is critical for economic growth and poverty alleviation. Eight out of ten
of the world's children live in developing countries, thus posing important education policy
challenges for the authorities in these countries. Traditionally, investment in schooling has been
financed by the state. In an era of stagnating public budgets for education (as well as other
accounts), private financing of education has gradually been gaining importance across the world,
including many emerging economies.
India is an important case in point, as the market for schooling is changing fast in
India’s emerging economy, especially since the launch of its economic liberalisation
programme back in 1991. While public providers traditionally dominate the supply side,
a growing number of private providers are entering the schooling market, frequently
giving rise to a coexistence of public and private providers in the same locality (Public
Report On Basic Education or PROBE in short, 1999). A changing structure of the
education market may affect the productivity/performance of schools through changing
behaviour of market participants, namely, schools, parents and students. In this context,
the present paper examines the factors determining the presence of and household

2
demand for private schools and also the effect of school privatization on primary school
attainment in a sample of Indian villages, drawn from five PROBE states including Bihar,
Madhya Pradesh (MP), Rajasthan, Uttar Pradesh (UP) and Himachal Pradesh (HP) (for
details of the survey see Drèze and Kingdon, 2001).
There is a sizeable literature that identifies the effects of both demand and supply
factors contributing to low levels of literacy in India. This literature highlights the role of
household resources/income (Pal, 2004), gender gap in school enrolment and attainment
attributable to low returns to female education (Kingdon, 1998), parental preferences and
opportunity costs of schooling (Pal, 2004) as well as poor quality of state-schooling (e.g.,
see Drèze and Kingdon, 2001; Muralidharan and Kremer, 2006) including teacher’s
absenteeism, lack of education materials, discriminatory behaviour of teachers and peers.
In this process, the role of private fee-charging schools has largely been overlooked
despite their growing importance over the past two decades or so. Thus one can find a
limited number of attempts to study aspects of increasing school privatization in the
country. For example, Bashir (1994) and Kingdon (1996) test the relative efficiency of
public and private schooling in selected regions in India,1 Muralidharan and Kremer
(2006) explore the growth of private schools in major states in India while Pal and
Kingdon (2009) examine the effect of school privatization on universal literacy in the
Indian districts.
1 The literature on the effects of private schools on educational outcomes in other low-income countries is limited too, important exceptions being Bedi and Garg (2000), Beegle and Newhouse (2006) for Indonesia. There is however no consensus as to whether private schools are more efficient. A related but relatively new and emerging literature pertains to the growth of private tutoring in developing countries, e.g., see Tansel and Bircan (2006), Dang Hai-Anh (2007). The lack of literature for developing countries in this respect could perhaps be attributed to the lack of available data. In contrast, there is a sizeable literature on the effects of private schools and school competition on educational outcomes in more developed countries, especially in the US. For example, see Hoxby (1994), Epple and Romano (1998), Eide et al. (1999), Cullen et al. (2006).

3
The present paper goes beyond the existing literature in terms of objectives,
methodology and therefore its results. We not only consider the factors determining the
presence of private schools in a village, but also examine the corresponding demand for
private schools as well as the possible effect of presence of private schools on primary
school attainment in the sample.
Our central argument is that given a highly unequal distribution of resources in
India, there may be historical concentration of well-off households in some villages.2
These better-off households are better placed to lobby for and set up private schools,
(especially if state schools are failing) in much the same way as they may lobby for and
ensure access to better public roads, electricity and other infrastructural facilities in the
communities they reside. While the role of household wealth/income and/or quality of
local state schools for the demand for fee paying private schools needs little explanations,
that of public infrastructure is not well-understood in this respect. This is one central
contribution of the paper.
The underlying argument is that access to public infrastructure is likely to lower
the production costs of private providers and therefore could enhance the rate of return to
private investment. Access to public infrastructure may also directly enhance the
marginal products of both private capital and labour. The latter highlights the role of
public capital and infrastructure on private productivity as well as rate of return to private
investment (a la Aschauer, 1989, 1997, Barro, 1990). There may however be some
crowding out of private investment, especially if increased investment in public capital
and infrastructure is financed through an increase in distortionary taxes, thus lowering the
2The latter does not necessarily imply a high rate of migration from less developed to more developed villages in the state; in fact rural-to-rural migration within a state is rather low (less than 5% of the population) and majority of the migrants are women who move to husband’s place after marriage.

4
expected net rate of return to private investment. While the regional scientists have
emphasized the role of investment in public infrastructure to enhance regional
competitiveness (e.g., Vickerman, 1990), role of poor infrastructure has received
relatively little attention to explain the lopsided development in developing countries
(with the important exception of Reinikka and Svensson, 2002).3 Accordingly, we argue
that private schools are more likely to be present in more developed villages with better
access to public infrastructure like pucca (concrete) road, piped water, electricity, phone
and post-office. A natural corollary of this proposition is that remote villages, deprived of
public infrastructural facilities, will also be deprived of access to private schools.
Second, we examine the factors determining the household demand for private
schools in the sample villages and in doing so, we not only include household
characteristics (e.g., parental education, religion, family composition), but also
characteristics of local state schools (pupils per teacher, teachers’ attendance rate) as well
as village infrastructural development index; the latter is included with a view to assess
the role of village infrastructure on demand for private schools, among other factors.
Finally, we examine the effect of private school presence on school attainment in
the sample villages, where attainment at the village-level has been measured by the pass
rates (i.e., percentage of students passing) in class V examination. This is a general test of
Mathematics and English conducted by the state primary school board taken at the end of
the primary level (i.e., year 5) by students in recognized schools (government and private
unaided) in the sample. In particular, we first assess the effect of private school presence
on average government school pass rates in a given village. The underlying hypothesis is
3 There is however a growing literature on the provision of public services like health and education in developing countries (e.g., Chaudhury et al. 2005).

5
whether competition from newly emerging private schools in a village improves class-V
pass rates in the local government schools, as they compete for the same pool of children.
We also assess the effect of private school presence on pooled class V pass rates for all
schools at the village-level. The latter relates to our argument that presence of private
schools in a village is driven by presence of better-off (e.g., more educated) households
as well as better infrastructural development, which in turn may boost schooling
attainment in these villages.
In terms of methodology, an important concern of the paper is to minimize the
potential endogeneity bias of our estimates. In particular, one may raise concerns about
the endogeneity of village infrastructural facilities in the determination of access to
private schools as well as demand for private schools, both of which are central to our
analysis. In an attempt to find an exogenous instrument of village infrastructure, we first
compute an weighted average of access to various public infrastructure in a village
including access to pucca road, electricity, phone, piped water, and post-office, using
principal component analysis. Subsequently, following the recent political economy
literature (e.g., see Pal and Ghosh, 2008), we determine a village’s access to this
composite measure of village infrastructure, using distribution of land and ethnic
heterogeneity in the locality (see section 2.3). Predicted value of this composite
infrastructural index has been used as a potentially exogenous instrument of village-level
infrastructural facilities; this is ensured by predicting this variable using variables, which
are not included in the determination of presence of private school in a village (section
3.1) or household demand for private schools (see sections 3.2).

6
Results using the child/household-, school- and village-level PROBE data-set
provide some support to our central hypotheses. First, more ethnically diverse villages
have less public infrastructure; however, more unequal villages (i.e., those with higher
standard deviation of landholding) would have more public infrastructure, even if they
are ethnically more diverse. Second, private schools are more likely to be present in
villages closer to the district head quarters and with access to better infrastructural
facilities and also where government school teachers’ absence rate is low. Third, after
controlling for various household and individual characteristics, a sample household is
likely to send a child to local private schools if the household resides in villages with
better access to public infrastructure and also if the quality of local state schools is poor.
Finally, presence of private school has a significant positive impact on village-level all-
school (pooled) class V pass rates while it fails to have a significant impact on village
government school class V pass rates. In other words, there is no evidence that presence
of private schools boost attainment of local government schools in our sample.
The analysis is developed as follows. Section 2 discusses the data while section 3
explains the hypotheses and methodology. Section 4 presents and analyses the results and
the final section concludes.
2. Data Description
One important reason for the lack of research on public and private schools in India (as
well as other developing countries) has been the scarcity of appropriate school-, village-
and/or district-level data for both private and public schools from across the country.

7
Among the existing studies, Bashir (1994) studied the case of Tamil Nadu while Kingdon
(1996) focused on urban UP. Muralidharan and Kremer (2006) have used their own
survey data to examine the rise of private schools across a sample of major Indian states.
One could in principle try to use the recently released district-level Seventh round of All
India School Education Survey (AISES) data collected in 2002-03. There are however
some serious shortcomings of this data-set for our purpose: first, the survey focuses on
collecting very detailed inputs from schools under different management (government,
private aided, private unaided, local body etc.), but does not have any information on
attendance or attainment of students. Second, AISES data only focuses on recognized
schools in India while a large number of new private schools in the Indian states remain
unrecognized (e.g., see Table 2). Finally, AISES data do not have any information on
household characteristics of children studying in schools under different types of
management.
In the absence of any better alternative source, the present paper makes use of the
school- village- and child/household-level information obtained from the PROBE survey
data (for details of the data, see Dréze and Kingdon, 2001) collected during September to
December 1996. Although somewhat dated, this data covers households, schools and
villages drawn from five Indian states including four of the country’s worst performing
states, namely, Bihar, MP, Rajasthan and UP; the fifth state is a much better-off state
Himachal Pradesh (HP). The sample of schools in the PROBE survey includes both
recognized and non-recognised schools under different management. Although the
sample size is small, the amount of information we have for the schools (various inputs as
well as indicator of performance), child/households and villages is quite unique and not

8
generally available in any other existing surveys. Moreover, this sample focuses on some
of the worst performing states and the coexistence of private and state schools in our
sample gives us an opportunity to study the objectives of our interest that remain rather
unexplored not only in the Indian context, but also any other emerging economy. We not
only use the school and village-level data, but also make use of the household-level data
collected from 123 sample villages4 (part of the PROBE data used by Dréze and
Kingdon, 2001).
There are 290 schools surveyed across five sample states. Among these 290
schools, 45 schools (i.e., 16%) were private unaided schools5, which include both private
recognised (36%) and uncrecognised (64%) schools with a primary section attached to
it.6 Hindi or Urdu has been the medium of instruction in about 90% of these sample
schools under private management; less than 5% of these schools used English as the
medium of instruction.7 Thus unlike some existing literature (e.g., Munshi and
Rosenzweig, 2006), the medium of instruction was not significantly different between
private and government schools included in the PROBE survey. All state and private
schools in our sample catered to primary education.
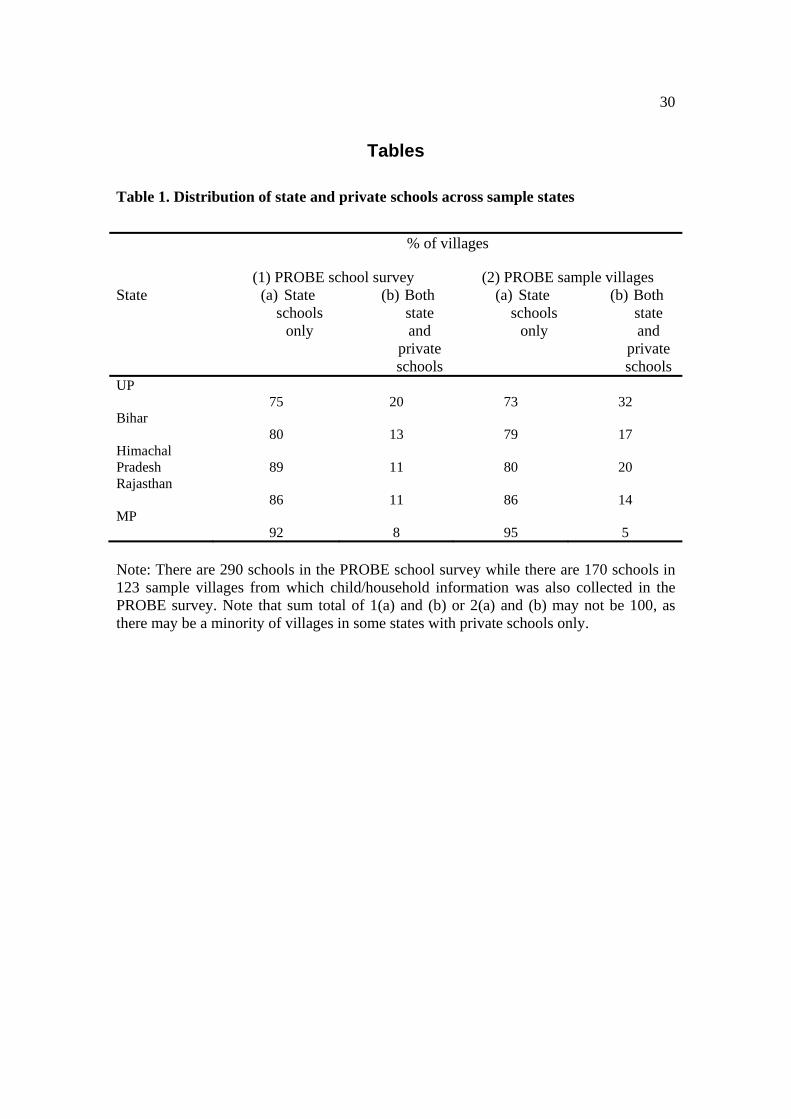
Table 1 shows the distribution of state and private schools across the villages in
the selected states. Clearly, public providers dominated the schooling market in that as
high as 80% of the sample villages had only state-run schools (the proportion ranges
between 75% in UP to 92% in MP). In contrast, the corresponding proportion of villages 4 Note that the total number of schools in the school data-set is 290 while the number falls to 170 when we consider 123 sample villages from which household data was collected in the PROBE survey (see column 2 of Table 1). Information was collected from about 4500 children belonging to 1322 households residing in 123 sample villages in the PROBE states. 5 This excludes the private schools receiving aid from the government. 6 All private and state schools in the PROBE survey provided primary education, which is the focus of our analysis in this paper. 7 PROBE survey does not however allow us to identify religious PUA schools from others.

9
with private (recognised or unrecognised) schools is much lower8 and in most cases
private schools tend to be set up in a village with existing state-run schools.
Table 2 highlights the significant variation in the rate of privatisation across the
PROBE states. While 28% of UP villages has private schools with primary section, it was
only 8% in MP in 1996. If however we compare these proportions with those observed by
Muralidharan and Kremer (2006), the growth rate of privatisation over a period of 1996-
2002/03 appears to be dramatic in UP, Bihar and Rajasthan and MP; the rate of increase
has however been rather modest in the more prosperous state of HP. Finally, the
privatisation rate appears to be much smaller if we consider the figures obtained from 7th
AISES for these PROBE states over the same period; the difference is largely attributed
to the fact that AISES data have focused only on recognised schools. Thus a much higher
proportion of private schools in the Indian states, especially those in the worse-
performing PROBE states, tend to be unrecognised and the difference is particularly
striking for the state of Bihar. The latter further justifies our attempt to use the PROBE
data that includes information on both recognised and unrecognised schools in the
selected states.
2.1. Comparison of Public and Private Schools
The existing literature highlights the differential characteristics of state and private
schools with respect to both school inputs and indicators of school
performance/attainment. Table 3 summarises the differences between state and private
8 Also note that the number of private schools will be one in almost all cases, if at all.

10
schools in our sample not only in school inputs, but also in school performance. Among
possible performance indicators, we have information on class five pass rates, i.e., the
proportion of class v students passing the end of year test in a given type of school
(government or private unaided). The table also shows the corresponding t-statistics for
mean differences in a set of selected characteristics of these two schools, when
significant. There are significant differences in the input choice; for example, private
school teachers are often younger and have more education, but often do not have any
teacher’s training.9 These two groups of schools are also significantly different with
respect to average enrolment (i.e., average number of students at the primary level),
pupil-teacher ratio as well as pass rates in the class V (taken at the end of the primary
level). In particular, average enrolment as well as pupils per teacher is significantly
higher while pass rates are significantly lower in state schools.
2.2. Comparison of villages with/without private school
We also compare the demographic, socio-economic and school characteristics of the
villages with and without private schools, which in turn highlights if there is any
systematic difference between these two groups of villages. Results of a simple mean test
summarised in Table 4 indicate that villages with private schools tend to enjoy better
infrastructural facilities, as reflected in their access to piped water, electricity, phone, post
office etc. These villages are also significantly closer to the pucca road as well as the
district head quarters. Second, villages with private schools tend to be larger (in terms of
population) and have relatively more educated parents. These villages also have lower 9 Kingdon (1996) suggests that annual per pupil salaries of private school teachers were significantly lower than those spent on teachers in government or private aided schools. The latter seems to be compatible with their profit maximisation motive of private schools.

11
proportion of low caste and Muslim population, who are often poorer and also have less
assets. In other words, private schools are more likely to be present in villages with
better-off households and better public infrastructure. Finally we consider class 5 pass
rates as a useful indicator of quality/attainment of primary education at the village level.
Clearly, pass rates in class V examination taken at the end of the year are significantly
higher in the villages with private schools.
Note however that an overwhelming majority of private schools in our sample
prevails in the villages with at least one state school. Presence of private schools in
sample villages could thus offer more choice for parents, especially those who are not
budget constrained. The natural hypothesis to test would therefore be whether the
presence of private schools improves the school attainment in a village (in comparison to
that without a private school), in general, and also the attainment of village states schools,
in particular. This is discussed in section 3.3.
2.3. Access to public infrastructure
As already indicated, access to village-level public infrastructural facilities plays a central
role in our analysis. We observe if the village has access to piped water, electricity, phone
and post office. We also know the distance of the village from the nearest pucca road and
the district head quarter. Table 2 compares the average village-level public infrastructural
facilities in the PROBE data, among others, in the sample states and highlights the extent
of inter-state variation in this respect. On an average, villages in HP are more developed
with better access to public infrastructural facilities. In contrast, the remaining four states
lie at the other end of the distribution not only in terms of access to many public

12
infrastructural facilities, but also in terms of average per capita state domestic product.
Using principal component analysis, we construct a composite village
infrastructural development index, which is a weighted average (Bartlett score) of the
village’s access to piped water, electricity, phone and post office. The question that may
however arise at this point is whether one can treat access to public infrastructure in a
village to be purely exogenous. In fact there is now a growing political economy
literature on public goods provision in the low-income countries, which identifies ethnic
fractionalisation and elite dominance as two crucial factors determining access to
infrastructure. In general, there is confirmation from the Indian districts that more
heterogeneous communities tend to be politically weaker and therefore are less likely to
get the goods they want and more likely to get some of the inferior substitutes (e.g., see
Banerjee and Somnathan, 2007). Second, following Bourguignon and Verdier (2000) and
Galor and Moav (2006), we examine the role of land distribution on a village’s access to
public infrastructure in India. The underlying idea is that presence of a landed elite may
influence provision of public infrastructure; presence of a landed elite is measured here
by the standard deviation (as a measure of inequality) in the distribution of land.
Accordingly, we determine the composite index of village-level public infrastructure in
terms of village land distribution (mean and standard deviation) and an index of ethnic
fractionalisation (defined as one minus the sum of square of population shares belonging
to various caste/religion groups in the village). We also include an interaction between
land inequality index and ethnic frationalisation in our analysis.
OLS estimates of village infrastructural index summarised in Table 5 do suggest
that more ethnically diverse villages have less public infrastructure; while land inequality

13
index is not significant on its own, the interaction term between land inequality index and
ethnic heterogeneity index is. Thus more unequal villages (i.e., those with higher standard
deviation of landholding) would have more public infrastructure, even if they are
ethnically more diverse. These ordinary least square (ols) coefficients naturally estimate
the marginal effects of the relevant variables. Given that the index of land inequality is
not significant, the total effect of land inequality in our sample could be calculated as
0.11*0.28= 0.0308, if the value of ethnic heterogeneity is held at its mean level. 10 Taken
together, there is some confirmation that villages with more unequal landholding tend to
have better access to public infrastructure. Accordingly we could use the predicted value
of composite village infrastructural index as an instrument of infrastructure in estimating
equations (1) and (2), provided we satisfy some exclusion restriction (see further
discussion in section 3).
3. Hypotheses and Methodology
This section formalises our hypotheses and methodology for the empirical analysis.
3.1. Presence of private schools
Given that only about 16% of the sample villages in the PROBE survey had a private
school, an important question would be to examine what determines the presence of
private schools. Note however that there has been a single private school, if at all, which
10 So the total effect of land inequality in the sample is being dominated by the indirect effect of land inequality through the interaction term with ethnic heterogeneity; we could thus ignore the insignificant direct effect of land inequality.
14
in turn induces us to empirically determine a binary variable PRIVS (rather than the
number of private schools in a village) that takes a value 1 if there is a private school in
the village and zero otherwise. 11
There are some underlying assumptions that we need to clarify here. First, it is
assumed here that most private schools are recently established (for example, see
Muralidharan and Kremer, 2006), i.e., state schools were established before the private
schools.12 Second, we assume that the provision of state education is exogenous
(determined, e.g., by government policies). Accordingly, we determine the likelihood of
having a private school in a village v located in the s-th state as follows:
(1)
where Xvs includes the set of village-specific explanatory variables in a given state s.
The set of explanatory variables X could account for the structure of existing
schooling market as well as the access to public infrastructure in the village. First, we
argue that the structure of the existing schooling market can be captured by the
characteristics of existing state schools. In this respect, we include teachers’ attendance
rate, absence of the head teacher (a binary variable) in the final specification.13 Second,
public infrastructure is largely location specific, location choice of private firms,
especially the smaller ones, may thus follow the location of public infrastructure, thus
minimizing some sunk costs of production. Our analysis in this respect highlights the
11 The reference category is the government schools, which include both government and private aided schools. These two types of schools are similar in many respects with both being entirely financed by the government and having little/no control over staffing (hiring/firing), curricula, teaching materials and budget allocation. The main difference between these two types of schools is that the latter are nominally privately managed, though there could be some inter-state variation in the management of PA schools. Private schools here refer to unaided (recognised and unrecognised included) schools. 12 We however do not observe the year a school was founded. 13 We experiment with a number of other characteristics of the existing state schools including multi-grade teaching, number of infrastructural facilities available, pupil teacher ratio. Results shown in Table 6 represent the estimates of the parsimonious specification.
15
potential role of composite village-level public infrastructural index (obtained from the
first principal component) that we have computed in section 2.3. In addition, we include
the distance of the village from the nearest pucca road and also the district head quarter.
In addition to enhancing the rate of return to private investment, a village’s access to
public infrastructure could also capture the strength of demand for private schools as
better off villages with better access to public infrastructure tend to be inhabited by better
off households, who are more likely to send their children to private schools. This is also
reflected in the determination of composite index of village infrastructure in section 2.3.
However, one could argue that village’s public infrastructure is potentially
endogenous to determining village’s access to private school; this is because better-off
households may lobby for and set up private school in much the same way as they may
lobby for better public roads, electricity etc. Thus village’s access to public infrastructure
is likely to be correlated with the error term of equation (1) determining the presence of
private schools in the village. In the absence of a better alternative, we use the predicted
value of the composite village infrastructural index as an instrument (see section 2.3).
This is because the predicted value of the variable (access to public infrastructure) is
closely correlated with the actual variable while its correlation with the error term of
equation (1) would be minimized since a village’s access to public infrastructure has
been predicted by ethnic diversity and inequality in the distribution of landholding (see
discussion in section 2) and none of these variables have been included to determine
either the presence of a private school (see equation 1).
There may however remain a number of unobservable factors that may influence
the presence of a private school in a village. Our estimates are likely to be biased, if these

16
are not accounted for. In particular, economic prosperity of the state may be an important
factor influencing both the demand for (e.g., through its effect on fertility) and the supply
of (e.g., government spending on state schools) private schools in the state; to this end,
we include state-level fixed effects δs as additional controls. So long as the unobservables
are state-specific, inclusion of state controls would minimise the potential bias of our
estimates.
Given the binary nature of the dependent variable PRIVS, we use a binary probit
model to determine the presence of private schools in the market. Table 6 shows the
coefficient estimates (as well as the corresponding marginal effects) of two
specifications: specification (1) includes only village-level characteristics while
specification (2) includes selected characteristics of state schools as well. In both cases
we control for state-level prosperity.
3.2. Household demand for private schools
A related question is to analyse whether the presence of private school in a locality has
been a response to the corresponding demand for private schools in the local schooling
market. In this respect, we analyse the parental choice of private schools (as against state
schools) in the sample villages. The latter will be determined, among others, by the
characteristics of individual child and its siblings, parental income/education as well as
caste/religion14, quality of local state schools (as reflected in teaching as well as
infrastructural facilities offered) as well as the community infrastructural facilities. To
this end, we determine the likelihood that a local household sends a child i to a private
14 Note that in the light of our discussion in section 3.1., we also assess the robustness of our results in terms of alternative instruments.
17
school in the village v located in the state s, i.e. Pdivs
15
(2)
The set of explanatory variables X includes the individual/household characteristics of
the child (gender, age), characteristics of his/her siblings (proportion of younger male and
female children aged below 18 years), his/her parents (education, caste/religion) living in
a village v in state s. We also include the non-household characteristics Z of state
school(s) (e.g., pupil per teacher, proportion of teachers present and also the number of
infrastructural facilities available) in a village as well as the composite infrastructural
index (predicted)16 of the village. The underlying idea is that for given values of other
variables, parental choice of private schools could be a response to the characteristics of
local state schools and/or local village infrastructural index. Finally, we include the state
level fixed effects s to control for the unobserved state-level factors, e.g., state domestic
product (sdp), fertility rate etc. (e.g., see Table 3), affecting the relationship.
Note that the identifying variables in the two probit equations (ever-enrolment and
parental choice of private schools) are village infrastructural index (predicted) and the
sibling composition variables, i.e., the proportion of younger male and female children
aged between 5-18 years. Given that access to a state school in a village is determined by
government policy, we argue that village level infrastructural index is relevant in the
parental choice of private schools only and not in the decision for ever-enrolment.
Similarly, the proportion of younger male and female children aged 5-18 in a household
15 Note that we use different notation Pd
ivs to indicate the household choice of private schools and distinguish it from the presence of a private school Pvs discussed in section 3.1. 16 We continue to use the predicted value of the infrastructural index as this would minimise the potential simultaneity bias.

18
would highlight the household resource constraint effect, if any, and as such would be
important only in the parental choice of fee-paying private schools.
Given that a significant proportion of sample children are never enrolled17,
derivation of the demand for private school Pdivs needs to account for the possibility of
ever-enrolment. Using PROBE household-level data, we therefore use a simultaneous
probit model to jointly determine the likelihood of ever-enrolment (a binary variable) and
also whether a child attends a private school (a second binary variable). An alternative
would be to use a bivariate probit model of parental choice of private school with
selection for ever-enrolled children. Note however that the main difference between a
simultaneous probit model and bivariate probit model with selection is that the latter
assumes a sequential decision process (parents first decide whether to enrol a child and
then selecting the enrolled children decides whether to send an ever-enrolled child to a
private school). One could however argue that these two decisions are determined
simultaneously and not sequentially. Thus a multivariate simultaneous probit may be
more pertinent in this context. These results are presented and discussed in section 4.2. In
order to check the robustness, we compare these simultaneous probit estimates with
corresponding bivariate probit estimates with selection for ever-enrolment.18
3.3. Effects of School Choice on School Attainment
It is natural to argue that the presence of private schools would affect school attainment
through strategic response(s) of state schools. There is some literature on the game
17 Note that a significantly larger proportion of boys (60% as opposed to 40% of girls) are ever-enrolled in our sample while a larger proportion of ever-enrolled girls (19.6% as opposed to 15.6% of boys) go to private schools. If however we consider the proportion of total boys and girls going to private schools, the proportion is very similar (around 11% for both boys and girls). 18 Appendix Table A1 shows the probit estimates of ever-enrolment in our sample.

19
theoretic models of mixed duopoly/oligopoly where at least one public firm may coexist
with at least one private firm (e.g., see Ware, 1986); each type of firms has different
objective functions though it is unclear as to how an incumbent government school would
respond to the entry of a private school in the locality. Along these lines, one could
examine whether the presence of private schools have any impact on school attainment
measured by the pass rates of the local state school(s). If not, it can be concluded that the
element of competition seems to be absent among the government schools in our sample,
who tend to enjoy a secure source of funding in India, largely independent of school
performance.
Second, in view of Table 4, it is expected that villages with private schools would
experience differential pass rates (relative to villages without private schools).Thus a
related issue is to examine the possible effect of school type (private unaided and others)
on the overall class V pass rates (for state and private schools pooled together) in the
village, if any. The underlying argument is that the presence of better-off households
(more educated and non-Muslim households, as highlighted in Table 4) and more public
infrastructure could contribute to higher primary pass rates in villages with private
schools.
Accordingly, we argue that school attainment is a function of school type which
in turn depends on school inputs. Accordingly, we determine (a) average class V pass
rates Qvs (pooling both state and private schools together) in village v located in state s
and also (b) average class V pass rates Qgvs of the state school(s) in village v located in
state s. 19
19 We also tried to use pupil-teacher ratio PTR as an alternative indicator of school quality. Some may however argue that PTR is not a good indicator of school quality in this context as presence of both private

20
1 2 3
1 2 4
vs vs s vs
gvs vs s vs
Q P
Q P
(3)
where Pvs is a binary variable indicating the presence of a private school in the village
while s denotes the control for state-specific fixed effects. Note however that the
presence of a private school in a village v in state s is a choice variable emerging from
equation (1); therefore simple OLS estimates of (3) are going to be biased. In the absence
of any better instrument, we generate the predicted value of Pvs using the probit estimates
equation (2) (shown in Table 6) and use this predicted value as a possible instrument in a
2SLS estimate. Given that there are some identifying variables, e.g., characteristics of
state schools and also those of the village, which are only included in the determination
of presence of private schools Pvs from equation (1) but not in the determination of school
attainment in set of equations (3), it is expected that the correlation between predicted
presence of private school derived from equation (1) and the error terms in the set of
equations (3) could be minimised when we consider 2SLS estimates.
Nevertheless, our ability to generate the best possible instruments is limited by the
fact that we only have access to a single (and not repeated) cross-section data. It is thus
possible that the difference in the 2SLS and the corresponding OLS estimates could
reflect the measurement errors in the instruments used. It can however be argued here that
if private schools tend to locate in places where unobserved parents' tastes/preferences for
education are higher, we are likely to overestimate the impact of private schools on
educational outcomes; in this case the estimates obtained would be an upper bound of the
true effect. Similarly, if competition from private schools causes public schools to
and state schools in a village would naturally be accompanied by lower PTR relative to villages with one type of school. Accordingly we choose class V pass rates to be a more appropriate indicator of school quality.

21
increase their quality, the impact of the presence of private schools on public school
quality is likely to be overestimated. OLS and 2SLS estimates of the set of equations (3)
are summarised in Table 8.
4. Results
This section describes and analyses the estimates of presence of private schools equation
(1) (see section 4.1), household choice of private schools equation (2) (see section 4.2)
and effect of private school presence on primary pass rates equations (3) (see section 4.3).
4.1. Presence of private schools
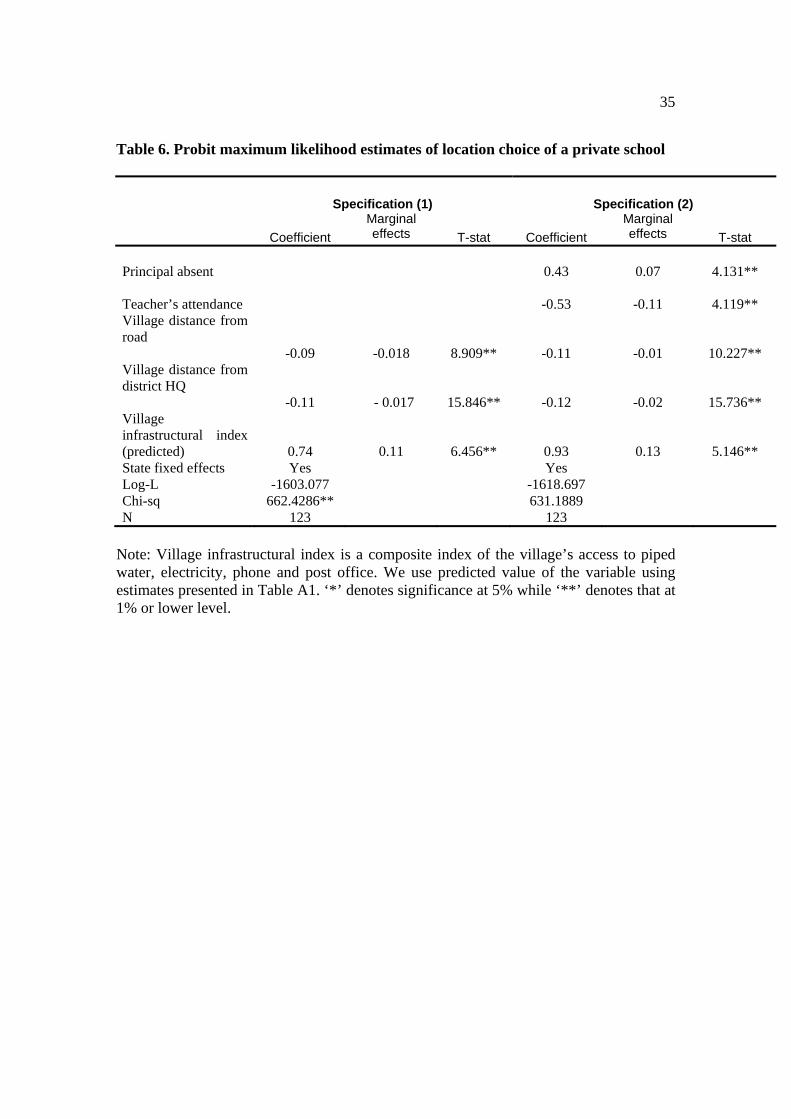
State-fixed effects probit maximum likelihood estimates of the presence of private school
equation (1) are shown in Table 6. Since probit estimates do not correspond to the
marginal effects, we also show the corresponding marginal effects for each explanatory
variable. We have estimates using specifications (1) and (2). While specification (1)
includes only the village characteristics (e.g., location of the village, infrastructural
development of the villages), specification (2) includes characteristics of village
government schools (e.g., attendance of school head and other assistant teachers) as well.
Given that the goodness of fit reflected in the likelihood ratio chi-square statistic is
significantly higher for specification (2), our discussion is couched here in terms of the
estimates of specification (2).
There is evidence that the likelihood of private school presence in a village is

22
significantly influenced by the characteristics of local state-run schools.20 In particular,
presence of both the head and assistant teachers matter a lot; in fact, the likelihood of
private school presence is significantly higher if the attendance of head and other teachers
in the local government school is lower. This provides some support to the hypothesis
that after controlling for all other factors, private school is more likely to be present in the
village with poorly functioning state-run schools (e.g., see Muralidharan and Kremer,
2006).
More interestingly, these results highlight the importance of public infrastructure
(predicted) on private school presence in the sample villages, something that has never
been examined in the Indian context. There is suggestion that even after controlling for
other factors, village-development index (comprised of the village’s access to electricity,
piped water, phone and post-office) plays a significant role – more developed villages
with access to these public infrastructural facilities are significantly more likely to have a
private school; the latter is likely to be compatible with a higher rate of return on private
investment, which in turn provides some support to the public capital hypothesis. In
addition, private schools are more likely to be present in villages closer to pucca road and
district head quarter.
4.2. Household demand for private schools
Table 7 summarises the estimates of equation (2) that parents send a child to a private
school in the village. We show three sets of estimates here: column (1) shows the
uncorrected univariate probit estimates of the likelihood that parents send a child to a 20 We also tried to include the number of existing state schools in each village though it was never significant in any specification; this is perhaps because of the lack of variation in the variable across the sample villages.

23
private school; these estimates are however likely to be biased as it does not correct for
the probability of ever-enrolment. Columns (2) and (3) respectively show the
simultaneous and bivariate (sequential) probit estimates of parental choice of private
schools; while the simultaneous probit estimates jointly determine the possibility of ever-
enrolment and choice of private school, bivariate probit estimates with selection correct
for the selectivity bias that the child has ever been enrolled (estimates of ever-enrolment
are shown in Appendix Table A1). While correlation coefficients in both simultaneous
and bivariate probit models are significant, there are evidence of some mis-specification
in the bivariate estimates; in particular, the positive coefficient estimate of pupil-teacher
ratio or negative coefficient of teacher’s attendance rate appears to be counter-intuitive;
the latter may be a result of treating enrolment and private school choice as sequential
rather than simultaneous.
Therefore, our discussion in this subsection is couched in terms of the
simultaneous probit estimates shown in column (2) of parental choice of private schools.
In general, gender of the child is important; while boys are less likely to go to a private
school (note that this is significant only at 10% level; also see footnote 17), boys from
families with higher proportion of female children (aged less than 18) are more likely to
go to a private school in our sample. Many of the household, local state schools and
village infrastructure characteristics are significant too. First, there is suggestion that the
likelihood of private schooling is significantly higher for children born to more educated
parents and also for those belonging to non-Muslim households.21 In a sense, parental
education and caste/religion in India can be taken to be good measures of wealth in India.
21 In fact Table 4 suggests that there is no low caste or Muslim households who send their children to private school.

24
There is thus suggestion that children from better off families22 are more likely to attend
fee-paying private schools, which is naturally to be expected for the choice of fee-paying
schools. Secondly, instrument of village composite infrastructural facilities is positive
and highly significant, thus indicating a higher demand for private schools from
households residing in more developed villages with access to more infrastructural
facilities. As argued earlier, the latter could be taken as a measure of wealth effect as
well, as better off households tend to live in better off villages with better access to public
infrastructure. This result corresponds to the similar result for equation (1) (see Table 6).
Finally, ceteris paribus, estimates of equation (2) further corroborate the estimates of
equation (1) presented in section 4.1 in that the household demand for private schools is
significantly related to the quality of local government schools. In particular, parents are
more likely to send their children to private schools when pupil-teacher ratio is higher
and teacher’s attendance rate is lower in the local state schools, thus indirectly revealing
their preferences for better schooling services provided by private schools. School’s
physical infrastructure however remains statistically insignificant.
4.3. Estimates of school attainment
Finally we consider estimates of equations (3) highlighting the effects of private school
presence on class V pass rates in Government school and also the village-specific class V
pass rates as shown in Table 8. For each variable, two sets of estimates are produced:
simple ols estimates and 2sls estimates, where the instrument for private school presence
is nothing but the predicted value of private school presence derived from probit 22 We also tried including household landholding as an additional explanatory variable though it was never significant in any specification. That is why we dropped it from the final specification. Note however that we do not observe household income or expenditure.

25
estimates of equation (1) shown in Table 6. We argue that the instrumented 2SLS
estimates are better than the corresponding ols estimates as the former minimises the
estimation bias arising from the inclusion of a potential endogenous variable.
Accordingly, our discussion below is couched in terms of the 2SLS estimates only.
Private school presence does not seem to have any significant effect on
government school pass rates (see column 2, Table 8), but has a significant effect on
village-level pass rates (see column 4, Table 8). Further, marginal effects of private
school presence on village pass rates are higher if we consider the 2SLS (rather than ols)
estimates.
Despite our best efforts to minimise possible biases due to unobserved
heterogeneity and simultaneity, one needs to interpret these estimates cautiously. First,
use of single cross-section PROBE data means that we cannot control for the possible
correlation between infrastructural development and some unobserved determinants of
pass rates over time. In particular, one is likely to over-estimate the impact of private
school on village-level pass rates as private schools tend to be present in places where
unobserved parents’ preferences for education are higher.
5. Concluding Comments
In an era of increasing school privatisation around the globe including many emerging
countries, it is important to understand the nature and consequences of school
privatisation. India is an important case in point, as public providers in the country are
increasingly being challenged by a growing number of private providers though relatively

26
little is known in this respect. The present paper is a first attempt to bridge this important
gap of the literature.
Results from the PROBE villages in India offer some interesting insights and
highlight the role of village-level public infrastructure (as reflected in the access to
concrete road, electricity, piped water, phone and post office), among other things, on
both supply and demand for private schools. Given the possible endogeneity of
infrastructural development in a village in the determination of presence of private
schools, we generate an instrument using the inequality in the distribution of landholding
and ethnic fractionalisation index in the village, which are not included in the
determination of private school presence. After controlling for all possible factors, there
is evidence that private schools are more likely to be present in villages with more
infrastructural facilities and poor quality of public schools. These findings are also
corroborated by an analysis of household demand for private schools. The essential
implication is that villages distant from the district head quarter and motorable road
would continue to remain deprived of essential public and private facilities, especially if
they are unable to organise powerful collective action. The process of development would
remain lopsided until and unless the responsible authorities target these disadvantaged
areas for the provision of essential public infrastructure.
While emergence of private schools fails to have a perceptible effect on
government school pass rates in our sample, it is associated with a significantly higher
village-level pass rates. In the absence of any strategic response from existing state
schools to private entry, higher pass rates in villages with private schools are likely to be
driven by choice of differential school inputs, which in turn highlight the roles of village

27
demographics, wealth distribution as well as access to public infrastructure all of which
seem to be closely intertwined. One however needs to interpret these estimates cautiously
because of the problems of unobserved time-varying heterogeneity and reverse causality
in our analysis using single cross-section data. This is an issue that remains little
understood in the literature and we hope future research will generate further wisdom in
this respect.
References
Aschauer, D. (1989). ‘Is Public Expenditure Productive?’ Journal of Monetary Economics, 23, 177-203. Aschauer, D. (1997) ‘Output and Employment Effects of Public Capital’, working paper, Jerome Levy Economic Institute. Barro, R. (1990). ‘Government Spending in A Simple Model of Endogenous Growth’, Journal of Political Economy, 98, S103-25. Bashir, S. (1994) ‘Public versus Private in Primary Education: Comparison of School Effectiveness and Costs in Tamil Nadu’, PhD Dissertation, London School of Economics. Bayer, P., F. Ferreira and R. McMillan. 2003. A Unified Framework for Measuring Preferences for Schools and Neighborhoods, mimeo, University of Toronto. Bedi, A.S. and A. Garg. (2000) ‘The Effectiveness of Private versus Public Schools: The Case of Indonesia’, Journal of Development Economics 61, 463-94. Beegle., K. and D. Newhouse. (2006) ‘The Effect of School Type on Academic Achievement- Evidence from Indonesia’, Journal of Human Resources XL1(3), 529-557. Behrman,J.R., and Knowles,J.C. (1999) ‘Household Income and Child Schooling in Vietnam’, The World Bank Economic Review, Vol.13(2), 211-56. Black. S. 1999. ‘Do Better Schools Matter? Parental Valuation of Elementary Education’, Quarterly Journal of Economics 114(2), 577-99 Brown, D. 1979. ‘The Location Decision of the Firm: An Overview of Theory and Evidence’ Papers in Regional Science, 43(1), 23-39

28
Butcher C, Case A (1994) ‘The Effect of Sibling Sex Composition on Women's Education and Earnings, Quarterly Journal of Economics 109(3), 531-63. Census of India. (2001) ‘Data Highlights: Migration Tables D1, D2 and D3’, Office of the Registrar General, India, Government of India. www.censusindia.net/results/dseries/data_highlights_D1D2D3.pdf. Chaudhury, N., J. Hammer, M. Kremer, K. Muralidharan and H. Rogers. (2005) ‘Missing in Action: Teachers and Health Workers Absence in Developing Countries’, Journal of Economic Perspectives. Cullen, J. B. Jacob and S. Levitt. 2006. ‘THE EFFECT OF SCHOOL CHOICE ON PARTICIPANTS: EVIDENCE FROM RANDOMIZED LOTTERIES’, Econometrica 74(5): 1191- 1230. Dang, Hai-Anh. 2007 . “The Determinants and Impact of Private Tutoring Classes in Vietnam”. Economics of Education Review, 26(6): 684-699. De, A., M. Majumdar, M. Samson, and C. Noronha. (2000) ‘Role of Private Schools in Basic Education’ National Institute of Education Planning and Administration and Ministry of Human Resource Development, Government of India: Year 2000 Assessment: Education for All. De Fraja, Giovanni and F. Delbono. (1990) ‘Game Theoretic Models of Mixed Oligopoly’, Journal of Economic Surveys 4(1), 1-17. Drèze, Jean and Geeta Kingdon. (2001) “School Participation in Rural India”, Review of Development Economics, 5(1), 1-33. Eide, E. D. Brewer and Ehrenberg. 1998. ‘Does It Pay to Attend an Elite Private College?Evidence on the effects of Undergraduate College Quality on Graduate School Attendance’, Economics of Education Review 17(4), 371-76. Epple, D. and R. Romano. (1998) ‘Competition between Private and Public Schools, Vouchers and Peer Group Effects’, American Economic Review 88(1), 585-610. Hansen, N. (1965). ‘Unbalanced Growth and Regional Development’, Western Economic Journal 4, 3-14. Hoxby, C. (1994) ‘Do Private Schools Provide Competition for Public Schools?’ NBER working paper No. 4978d. Kingdon, Geeta. (1996) “The Quality and Efficiency of Public and Private Schools: A Case Study of Urban India”, Oxford Bulletin of Economics and Statistics, 58(1), 55-80. Kingdon, G. 1998. ‘Does the Labour Market Explain Lower Female Schooling in India?’, Journal of Development Studies, 35(1), 39-65. Martin, P. and A. Rogers. (1995) Industrial Location and Public Infrastructure’, Journal of International Economics 39, 335-351.

29
Munshi, K. and M. Rosenzweig. (2006) ‘Traditional Institutions Meet the Modern World: Caste, Gender and Schooling Choice in a Globalizing Economy’, American Economic Review, 1225-1252. Muralidharan, K. and M. Kremer. (2006) ‘Public and Private Schools in Rural India’, mimeo Harvard University. Pal, S. (2004). ‘How Much of the Gender Difference in Child School Enrolment Can Be Explained? Evidence from Rural India’, Bulletin of Economic Research 56(2), 133-158. Pal, S. and S. Ghosh. (2007) ‘Elite Dominance and Underinvestment in Mass Education: An Analysis of the Disparity in Social Development of the Indian States 1960-92’, IZA discussion paper no. 2852, University of Bonn, Germany. Pal, S. and G. Kingdon (2009) ‘Private School Growth and Universal Literacy: A Panel District-level Analysis for India’, mimeo Brunel University and Institute of Education, London. PROBE Team. (1999) ‘Public Report on Basic Education in India’, Oxford University Press. Reinikka, R. and J. Svensson. (2002) ‘Coping with Poor Public Capital’, Journal of Development Economics, 69, 51-69. Schmenner, R. 1978. ‘The Manufacturing Location Decision: Evidence from Cincinnati and New England’, Economic Development Research Report, Graduate School of Business, Harvard University, Cambridge, Massaschusetts. Tansel, Aysit and Fatma Bircan. (2006). “Demand for Education in Turkey: A Tobit Analysis of Private Tutoring Expenditures.” Economics of Education Review, 25(3), 303-313. Vickerman, R.W. 1990. ‘Infrastructure and Regional Development’, Pion: London. Ware, J. (1986) ‘A Model of Public Enterprise with Entry’, Canadian Journal of Economics, 642-55.
30
Tables
Table 1. Distribution of state and private schools across sample states
% of villages
(1) PROBE school survey (2) PROBE sample villages State (a) State
schools only
(b) Both state and
private schools
(a) State schools
only
(b) Both state and
private schools
UP 75
20 73 32
Bihar 80
13 79 17
Himachal Pradesh 89
11 80 20
Rajasthan 86
11 86 14
MP 92
8 95 5
Note: There are 290 schools in the PROBE school survey while there are 170 schools in 123 sample villages from which child/household information was also collected in the PROBE survey. Note that sum total of 1(a) and (b) or 2(a) and (b) may not be 100, as there may be a minority of villages in some states with private schools only.

31
Table 2. An Inter-state comparison of selected characteristics
Averages UP Bihar MP Rajasthan HP
Enrollment 145 157 127 146 93 Pupil-Teacher
Ratio 53 49 49 49 26
% of never-enrolled children
34 36 38 37 24
Pass rate (%) 89 83 61 90 85 Distance from
pucca road (km)
1.94 3.87 5.6 3.7 2.3
Village development index (1-4)[1]
1.17 0.75 1.35 1.43 3.19
Low caste households(%)
55 76 80 47 63
Muslim households(%)
17 11 1 6 3
Per capita sdp, 1996
6713 4231 7571 8974 10583
Total fertility rate, 1991[2]
5.1 4.4 4.6 4.6 3.1
Birth rate, 1990-92
(per 1000)[2]
35.8 31.9 35.7 34.4 27.9
% of villages with a private schools, 1996
28 20 8 14 11
% of villages with no school
[3]
26 15 14 19 5.2
% of villages with private schools [3]
26.1 1 18.2 26.2 5.8
% of villages with private
schools, 2003 [4]
57 54 23 52 15
Note: Most information are gathered from PROBE survey (1999) unless otherwise stated. PROBE information relates to the schools and households in the sample villages only. [1] This is a composite index comprising of the village’s access to piped water, electricity, phone and post-office, obtained using principal component analysis. [2] Total fertility rate is obtained from 1991 Census data; birth rate for 1990-92 is obtained from NFHS 1992-93. [3] Source: AISES 7th round 2002-03. [4] Source: Muralidharan and Kremer (2006); Note that AISES data focuses on recognised schools only while PROBE and Muralidharan and Kremer consider both recognised and unrecognised schools.

32
Table 3. Comparison of private and state schools School characteristics Private school State school T-statistics
(equal variances are not assumed)
Teacher does multi-grade teaching (%)
72 73 -
No of school infrastructural facilities [1]
5.8 4.8 3.245**
Principal absent (%) 18 33 -2.411* Teacher’s attendance rate (%)
81 81
Female teachers (%) 23 21 - Hardcore punisher (%) 89 84 - Teacher’s education (years)
13.5 13 -
Teacher’s age (years) 28 38 -5.099** Class 1 teacher lives in the same village (%)
69 27 5.533**
Teachers with pre-service training (%)
18 67 -7.437**
Teachers with in-service training (%)
11 54 -7.288**
Enrolment 108 144 -2.439* Pupil teacher ratio 24.5 47.6 -9.228** Pass rate in class V board exam (%)[2]
99.2 94.3 4.759**
Note: T-statistic is shown only when the statistic is significant. ‘*’ denotes significance at 5% while ‘**’ denotes that at 1% or lower level. [1] It is a composite index of functional school infrastructural facilities that includes access to drinking water, toilet, electricity, fan, playground, blackboard etc. [2] Class V pass rate is defined as the percentage of total students in class 5 passing the examination at the end of the year.

33
Table 4. Comparison of villages with and without private schools Average village characteristics
Villages with a private school
Villages without a private school
T-statistic for mean comparison
Pupil per teacher 48.38 44.89 0.830
Class V pass rates 92.3 80.8 2.547*
Population > 1000 (%) 50 21 14.446**
Male education (years) 6.497 5.080 15.857**
Female education (years) 2.266 1.158 15.533**
Low caste households (%) 58 63 -4.928 **
Muslim households (%) 5 11 -10.155 **
Access to piped water (%) 33 15 9.776 **
Access to phone (%) 52 20 16.079**
Access to Post Office (%) 47 24 11.850 **
Average distance from pucca
road (km)
1.6 3.6 -20.663 **
Average distance from
district HQ (km)
3.2 8.5 -30.105**
Composite village
infrastructural index
0.69 -0.02 17.067**
Mean landholding 3.8 3.1 6.674**
SD of landholding 3.8 3.3 4.051**
Ethnic fractionalisation 0.62 0.73 -12.698**
Note: ‘*’ denotes significance at 5% while ‘**’ denotes that at 1% or lower level. These statistics are based on the information obtained from the sample villages only. There were 1322 households and 170 schools in 123 sample villages. Composite infrastructural index is the first principal component of the village’s access to piped water, electricity, phone and post office. Index of ethnic fractionalisation is given by 1-∑p2
i, where pi is the population proportion of upper caste Hindu, SC, ST and Muslim living in each village.

34
Table 5. OLS estimates of village infrastructural development index
Coefficient T-stat Ethnic heterogeneity -0.07 4.752** Mean landholding -0.03 2.843** SD of landholding -0.14 1.179 Ethnic hety*SD of land 0.11 6.262** State fixed effects Yes Yes R2 0.18 F-stat 20.00** N 123 Note: ‘*’ denotes significance at 5% while ‘**’ denotes that at 1% or lower level.
35
Table 6. Probit maximum likelihood estimates of location choice of a private school
Specification (1) Specification (2)
Coefficient
Marginal effects T-stat
Coefficient
Marginal effects T-stat
Principal absent
0.43
0.07
4.131**
Teacher’s attendance
-0.53
-0.11
4.119** Village distance from road
-0.09
-0.018 8.909** -0.11
-0.01 10.227** Village distance from district HQ
-0.11
- 0.017 15.846** -0.12
-0.02 15.736** Village infrastructural index (predicted) 0.74
0.11 6.456** 0.93
0.13 5.146** State fixed effects Yes Yes Log-L -1603.077 -1618.697 Chi-sq 662.4286** 631.1889 N 123 123
Note: Village infrastructural index is a composite index of the village’s access to piped water, electricity, phone and post office. We use predicted value of the variable using estimates presented in Table A1. ‘*’ denotes significance at 5% while ‘**’ denotes that at 1% or lower level.

Table 7. Estimates of household demand for private schools
(1)
Univariate probit
(2)
Simultaneous probit [1]
(3)
Bivariate probit [1]
Variables Coefficient T-statistic Coefficient T-statistic Coefficient T-statistic
Child is a male -0.30 -3.656** ‐0.176 ‐1.7† -0.30 -3.490** Child> 10 years -0.04 0.822 ‐0.011 ‐0.22 -0.07 1.438 Proportion of male <18 years 0.004 1.091 ‐0.226 ‐0.86 0.004 0.066 Proportion of female < 18 years -0.52 -2.360* ‐0.745 ‐3.31** -0.51 -2.273* Male*proportion of young female <18 yrs 0.51 2.351* 0.678 2.00* 0.51 2.265* Mother’s education 0.05 6.843** 0.049 5.51** 0.05 6.648** Father’s education -0.001 -1.406 0.0196 3.34** -0.001 -1.305 Muslim -0.32 -3.332** ‐0.221 ‐2.26* -0.32 -3.182** Pupil teacher ratio in the state school -0.01 -7.672** 0.009 2.76** -0.01 -6.932** % of teacher present in the state school 0.12 5.764** ‐1.947 ‐5.5** 0.12 1.613 No. of infrastructural facilities in the state school -0.10 -4.963** 0.040 1.31 -0.10 -4.555** Village infrastructure (predicted) 1.92 8.248** 0.305 2.76** 1.91 7.688** State fixed effects Yes Yes Yes
RHO(1,2) - 0.04 1.810† 0.05 1.802†
Log L -1857.735 -4203.042 -4459.689
LR 153.1138
N 4461 4461 4461
Note: ‘*’ denotes significance at 5% while ‘**’ denotes that at 1% or lower level. ‘†’ denotes significance at 10% level. [1] Simultaneous and bivariate probit estimates correct for the possibility of ever-enrolment.

37
Table 8. Estimates of private school presence on class V pass rates Govt. school pass rates Village pass rates
(Govt & private school) Variables (1) OLS (2) 2SLS (3) OLS (4) 2SLS Coefficient
(T-statistics) Coefficient (T-statistics)
Coefficient (T-statistics)
Coefficient (T-statistics)
Presence of private school
0.09 (1.412)
0.56 (1.363)
0.14 (9.070)**
0.22 (3.095)**
Intercept Yes Yes Yes Yes State control Yes Yes Yes Yes R2 0.44 0.28 0.23 0.13 F-stat 4.63** 5.59** 46.82** 13.49** N 123 123 123 123 Note: ‘**’ denotes the level of significance at 1% or lower level. Class V pass rate is defined as the percentage of total students in class 5 passing the school examination at the end of the year.
Appendix:
Table A1. Probit estimates of Ever-enrolment
Probability of ever enrolment Marginal effects
Variable Coefficient T-stat ME T-stat MALE 0.37 8.98** 0.13 9.00** 10<AGE<=16 0.98 21.03** 0.32 24.48** Mother’s edn 0.02 3.17** 0.01 3.18** Father’s edn 0.04 8.53** 0.02 8.55** MUSLIM -0.19 -2.76** -0.07 -2.69* State control Yes Yes Log L -2464.59 Chi sq 656.57
Note: ‘*’ denotes significance at 5% while ‘**’ denotes that at 1% or lower level.