public health surveillance: methods and application 223 · pdf filepublic health surveillance:...
TRANSCRIPT

Public Health Surveillance: Methods and Application
Jim Tielsch, Ph.D.Department of International Health
July 2004

Text
• Teutsch SM & Churchill RE (eds). Principles and Practice of Public Health Surveillance, 2nd ed. Oxford University Press, 2000.

Definition of Surveillance
Ongoing, systematic collection, analysis, and interpretation of health-related data essential to the planning, implementation, and evaluation of public health practice, closely integrated with the timely dissemination of these data to those responsible for prevention and control.

Definition-2
Systematic, ongoing• Collection• Analysis• Interpretation• Dissemination• Link to public health practice

Purposes of Surveillance
• Assess health status of a population.• Prioritize public health priorities.• Assess program effectiveness.• Stimulate research:
– Basic– Applied– Operational

Types of Conditions for Which Surveillance is Used
• Communicable diseases• Chronic diseases
Cancer, Malnutrition• Occupational injuries• Other injuriesIntentional (suicide, homicide)Unintentional (falls)• Health effects of toxic exposures• Personal health practicesSmoking, Sexual Behavior, Drug Use,Alcohol

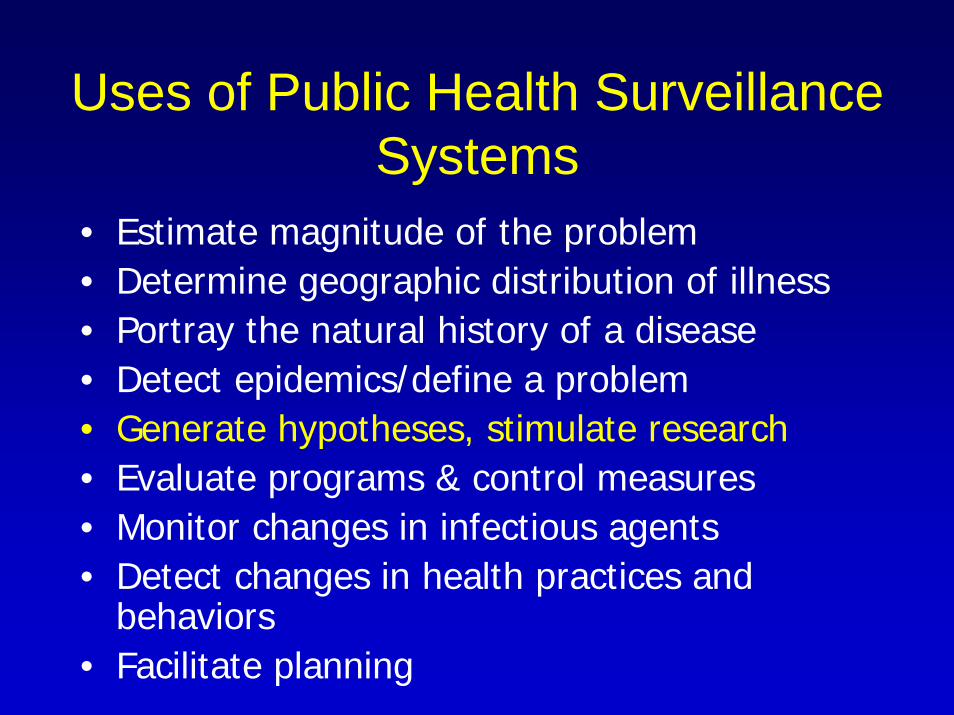
Uses of Public Health Surveillance Systems
• Estimate magnitude of the problem• Determine geographic distribution of illness• Portray the natural history of a disease• Detect epidemics/define a problem• Generate hypotheses, stimulate research• Evaluate programs & control measures• Monitor changes in infectious agents• Detect changes in health practices and
behaviors• Facilitate planning

SHIGELLOSIS1970-2000
Year
0
5
10
15
1970 1975 1980 1985 1990 1995 2000
Rep
orte
d C
ases
per
100
.000
Pop
ulat
ion
Source: CDC. Summary of notifiable diseases. 1998.

Uses of Public Health Surveillance Systems
• Estimate magnitude of the problem• Determine geographic distribution of illness• Portray the natural history of a disease• Detect epidemics/define a problem• Generate hypotheses, stimulate research• Evaluate programs & control measures• Monitor changes in infectious agents• Detect changes in health practices and
behaviors• Facilitate planning

Rate of HEPATITIS AUnited States and territories, 2000
AM SAMOA
10.0 - 19.9 >< 5.0 5.0 - 9.9 20.0
NA
NA
CNMI
Source: CDC. Summary of notifiable diseases. 1998.
NYC
DC
PR
VI
GUAM

Uses of Public Health Surveillance Systems
• Estimate magnitude of the problem• Determine geographic distribution of illness• Portray the natural history of a disease• Detect epidemics/define a problem• Generate hypotheses, stimulate research• Evaluate programs & control measures• Monitor changes in infectious agents• Detect changes in health practices and
behaviors• Facilitate planning

1986 1987 1988 1989 1990 1991 1992 1993 1994 1995 1996 1997 1998 1999 2000
National Center for Infectious Diseases (NCID) data*National Notifiable Diseases Surveillance System (NNDSS) data
TOXIC-SHOCK SYNDROME (TSS)United States, 1985-2000
*Includes cases meeting the CDC definition for confirmed and probable cases for staphylococcal TSS. Reporting for fourth quarter 2000 not yet available
0
20
40
60
80
100
120
140
160
Year (Quarter)
Rep
orte
d C
ases
1985

Uses of Public Health Surveillance Systems
• Estimate magnitude of the problem• Determine geographic distribution of illness• Portray the natural history of a disease• Detect epidemics/define a problem• Generate hypotheses, stimulate research• Evaluate programs & control measures• Monitor changes in infectious agents• Detect changes in health practices and
behaviors• Facilitate planning

Outbreak caused by sautéed onions, IL
Outbreak caused by fermentedfish/sea products, AK
Outbreak caused bybaked potatoes, TX
Laboratory-confirmed cases*National Notifiable DiseasesSurveillance System (NNDSS) data
BOTULISM (Foodborne) United States, 1980-2000
*Data from annual survey of State Epidemiologists and Directors of State Public Health Laboratories.
0
10
20
30
40
50
60
70
80
90
100
110
Year
1980 1985 1990 1995 2000
Rep
orte
d C
ases
Uses of Public Health Surveillance Systems
• Estimate magnitude of the problem• Determine geographic distribution of illness• Portray the natural history of a disease• Detect epidemics/define a problem• Generate hypotheses, stimulate research• Evaluate programs & control measures• Monitor changes in infectious agents• Detect changes in health practices and
behaviors• Facilitate planning

POLIOMYELITIS (paralytic) United States, 1970-2000
0
5
10
15
20
25
30
35
40
Year1970 1975 1980 1985 1990 1995 2000
Rep
orte
d C
ase s
Source: CDC. Summary of notifiable diseases. 2000.

Uses of Public Health Surveillance Systems
• Estimate magnitude of the problem• Determine geographic distribution of illness• Portray the natural history of a disease• Detect epidemics/define a problem• Generate hypotheses, stimulate research• Evaluate programs & control measures• Monitor changes in infectious agents• Detect changes in health practices and
behaviors• Facilitate planning
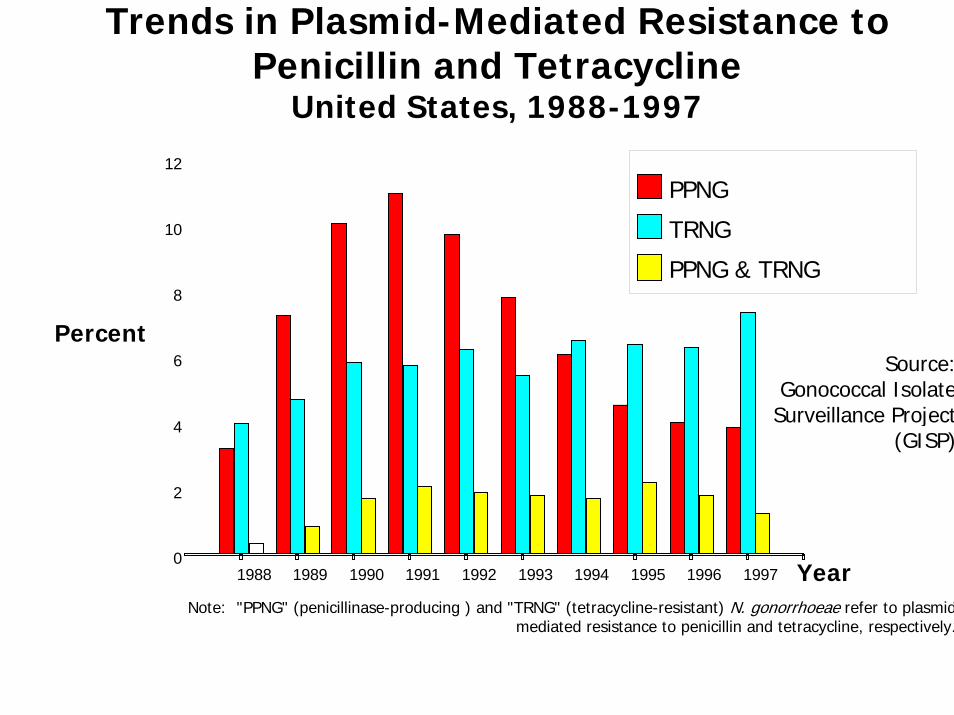
Trends in Plasmid-Mediated Resistance to Penicillin and Tetracycline
United States, 1988-1997
Source: Gonococcal Isolate
Surveillance Project (GISP)
Percent
0
2
4
6
8
10
12
1988 1989 1990 1991 1992 1993 1994 1995 1996 1997
PPNG
TRNG
PPNG & TRNG
Note: "PPNG" (penicillinase-producing ) and "TRNG" (tetracycline-resistant) N. gonorrhoeae refer to plasmid mediated resistance to penicillin and tetracycline, respectively.
Year

Uses of Public Health Surveillance Systems
• Estimate magnitude of the problem• Determine geographic distribution of illness• Portray the natural history of a disease• Detect epidemics/define a problem• Generate hypotheses, stimulate research• Evaluate programs & control measures• Monitor changes in infectious agents• Detect changes in health practices and
behaviors• Facilitate planning


Source: BRFSS 1998

Approaches to Surveillance
1. Coverage2. Intensity3. Standardization4. Analysis & Interpretation5. Dissemination6. Evaluation

Coverage-1
Two Basic Strategies:1. Universal
• Choose entire population or a representative sample to monitor for condition of interest.
• Acute flaccid paralysis (polio)• Measles• Food Poisoning• Bioterrorism agents

Coverage-2
2. Sentinel• Choose key “location” to monitor for condition of
interest.• “Locations” might include• Sites• Events• Providers• Animals/Vectors• -Choose a “location” that is most susceptible to
change.

Intensity-1Two Basic Approaches:1. Active
Periodic solicitation of case reports from reporting sources such as physicians, hospitals, laboratories, etc.
Eg. Routine search of hospital records for cases of disease x in the discharge listings.

Intensity-2Active SurveillanceAdvantages-Can be very sensitive.-Can collect more detailed information.-May be more representative.
Disadvantages-Cost.-Labor intensive.-Difficult to sustain over time.

Intensity-32. Passive
Relies on health care providers to report on their own initiative. Must make this reporting process simple and time efficient.
Eg. Vast majority of surveillance systems are passive.

Intensity-4Passive SurveillanceAdvantages• Cost.• Easier to design and carry out.• Useful for monitoring trends over time.Disadvantages• Low sensitivity.• Amount of data available is limited.• May not be representative.

Standardization-11) Case Definitions-Critical decision for surveillance system design.
Will impact on the amount, type, and quality of data needed.
-High sensitivity and specificity are desired (what else is new?). Balance between costs and benefits associated with false positive and false negative reports.
-Decide if laboratory confirmation is required (infectious) or if evidence of underlying cause is required (chronic).
-MUST consider false positive rate if a positive notification requires investigation

Sensitivity & SpecificityCondition Present?
Yes No Total
Yes ATrue +
BFalse +
A+B
No CFalse -
DTrue -
C+D
Total A+C B+D N
Detected by
System?
Sensitivity=A/A+C Specificity=D/B+D

Hepatitis A Case Reporting by Physicians’ Specialtyand by Active:Passive Sample Category
Kentucky, 1983
Active Sample Passive Sample
Specialty N Cases Rate*
N Cases Rate
GP/FPPediatricsInternal Medicine
All**
717471____216
473_____14
5.69.54.2
6.5
737172_____216
230_____5
2.74.20.0
2.3
*Cases per 100 physicians**Active:Passive reporting rate ratio, adjusted for specialty = 2.8 (95% C.L. = 1.1 - 7.2)

Standardization-22) Data Collection• Should be driven by policy decisions.• HIPPA regulations will play a role.• Standardize forms and processes for data
collection.• KISS (Keep It Simple Stupid (you not them))• Henderson’s Golden Rule for passive systems:*
– Line listing is best– Half a page is okay– One side of one page is maximum.
*Doesn’t always work this way, but emphasizes the need to think carefully about every data item.

Standardization-33) Data Processing & Management
• Common data definitions & dictionary• Common coding practices• Identification of responsible party at each
reporting location, not the Boss!• Case definition validation• Timing of reporting, during investigation or after
completion?• Dates, dates, dates• Duplicate reporting• Error corrections and editing loops

Analysis & Interpretation
Common Questions to Address• Is the condition reported more frequently than
expected?– To what level?– Does this constitute “alert” status?
• Is there a geographic or time cluster of cases?– Does this require an investigation?
• Has anything changed in the system to distort the analysis over time?

Analysis & Interpretation-2• Person, place and time are traditional
approaches to analysis.• Must be timely and limited to most important
questions.• Focus must be on consistency over time in
style of presentation and criteria for “alert”status.
• Care must be given to interpretations of trends over time, especially in passive systems where actual sensitivity and specificity are not well known.

Dissemination
• Primary users of information must be identified during system design. This should include those who contribute information to the system.
• Regular updating of dissemination lists.• Involvement of customers in analysis
and interpretation, especially if they are primary decision makers for action.

Dissemination-2
• Feedback system for users of the system.
• Set of recommendations BASED ON THE DATA and other circumstances should be included in each report.

EvaluationBased on fundamental attributes of an effective
system:*-Timeliness-Simplicity-Flexibility-Acceptability-Sensitivity, Specificity, and PPV-Representativeness
*Relative importance of each of these attributes will vary depending on the system and the disease.
Summary
• Definition of surveillance• Uses and purpose of surveillance• Approaches to surveillance
– Coverage– Intensity– Standardization– Analysis & Interpretation– Dissemination– Evaluation