public health services - hamilton, ontario · 2014 phs business plan highlights public health...
TRANSCRIPT

1
Public Health Services
General Issues Committee
February 7, 2014
2014 TAX OPERATING BUDGET
Item 4.1

2
• Public Health Services provides the following programs and related services:
SERVICE DELIVERY PROFILES
Public Health Services 2014 Budget
Public Health
- Foundational Standards
- Chronic Disease & Injury
Prevention
- Environmental Health
- Infectious Diseases
- Emergency Preparedness
- Family Health
Corporate Services
- Public Health Departmental Support
Services including Organizational
Standards

3
Prosperous and Healthy Community • PHS Consolidation in Downtown Core
– More efficient and effective business processes and customer service
– Hotelling work model
– Electronic documentation
– Consolidating inventory management
• Integrated, multi-modal, public transportation
– collaborating with Public Works and partner engagement
2014 PHS Business Plan Highlights
Public Health Services 2014 Budget
• 200 PHS jobs coming downtown
• 5,000 dental clinic visits
• 4,600 sexual health clinic visits
• 450 McMaster jobs downtown
• 54,000 McMaster clinic visits

4
Prosperous and Healthy Community
• Neighborhood Action Plans
– needle pick-up
– healthy eating and physical activity in schools
2014 PHS Business Plan Highlights
Public Health Services 2014 Budget

Prosperous and Healthy Community
• Mental Health & Addiction Services
– Health Links Initiatives
– Youth Alcohol Prevention
(in response to Skinner Report)
– Harm Reduction Network
5
2014 PHS Business Plan Highlights
Public Health Services 2014 Budget

6
Prosperous and Healthy Community
• Revised Healthy Babies Healthy Children protocol
• Healthy Birth Weights Coalition
2014 PHS Business Plan Highlights
Public Health Services 2014 Budget

“Healthy Families Hamilton”
Facebook page
• Launched in September
• 1,242 “likes” by year end
• City Manager Award Nomination
7
2014 PHS Business Plan Highlights
Public Health Services 2014 Budget

8
Prosperous and Healthy Community • Prevention of Childhood Obesity- Healthy Kids Strategy
• Food Strategy
• Collaboration with school boards
– Curriculum on poverty and Social Determinants of Health
• Women Health Educator Program
2014 PHS Business Plan Highlights
Public Health Services 2014 Budget

9
Prosperous and Healthy Community
• Environmental Health Issues – Healthy Built Environment Strategy
– Smoke-free Outdoor Recreational Areas By-law
– Air Quality Task Force recommendations
to be implemented
2014 PHS Business Plan Highlights
Public Health Services 2014 Budget
10
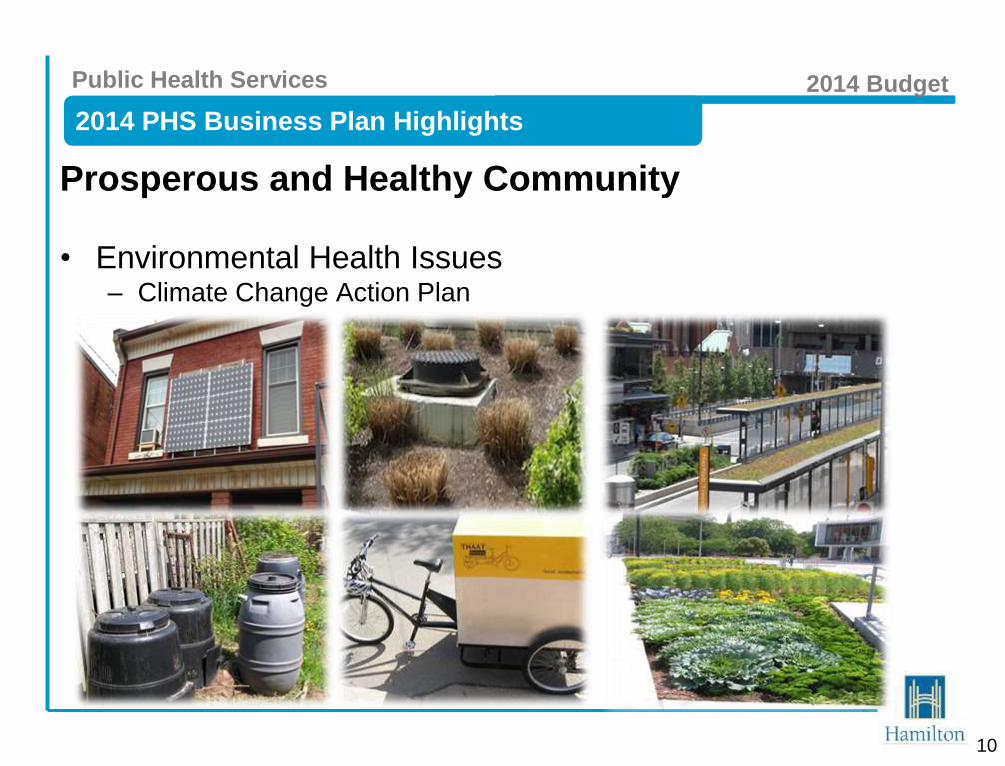
Prosperous and Healthy Community
• Environmental Health Issues – Climate Change Action Plan
2014 PHS Business Plan Highlights
Public Health Services 2014 Budget
11
• Valuable & Sustainable Services
– Continuous Service Improvement
• E-Health Initiatives (OSCAR, Panorama)
• Performance Management System
– Audits
– Performance and Reporting System
– Evaluations
• Management Development Program
(City Manager Award Nomination)
• Web Redevelopment
• Research Policy approved by BOH
2014 PHS Business Plan Highlights
Public Health Services 2014 Budget

12
• Valuable & Sustainable Services
– Engaging and informing citizens and stakeholders • Three-colour Food Premise Inspection Disclosure Card System
2014 PHS Business Plan Highlights
Public Health Services 2014 Budget

13
• Leadership & Governance
– Built organizational capacity to deliver business objectives:
• Staff competency development program
• PHS Emergency Response Plan and staff training
• Succession planning for leadership position
– Board of Health
• Continuous Education
• Orientation
• Self-Evaluation process
• Risk Monitoring Tool
2014 PHS Business Plan Highlights
Public Health Services 2014 Budget

14
OVERVIEW
Complement
(FTE)
Management Other Total Staff to Mgt
Ratio
2013 37.50 370.52 408.02 9.88:1
2014 37.50 368.48 405.98 9.83:1
Change 0.00 (2.04) (2.04)
Public Health Services 2014 Budget

15
2014 GROSS - NET DEPARTMENTAL BUDGET
Public Health Services 2014 Budget
Public Health Services
2013 2013 2014
Restated Projected PreliminaryBudget Actual Budget $ %
EMPLOYEE RELATED COSTS 38,732,420 38,307,680 39,405,610 673,190 1.7%
MATERIAL AND SUPPLY 2,074,980 2,073,150 2,063,640 (11,340) (0.5)%
VEHICLE EXPENSES 32,310 34,790 33,890 1,580 4.9%
BUILDING AND GROUND 1,785,390 1,771,860 1,914,280 128,890 7.2%
CONSULTING 1,270 14,480 1,270 0 0.0%
CONTRACTUAL 1,660,880 1,777,790 1,670,140 9,260 0.6%
AGENCIES and SUPPORT PAYMENTS 160,650 159,880 160,340 (310) (0.2)%
RESERVES / RECOVERIES 386,540 398,420 361,920 (24,620) (6.4)%
COST ALLOCATIONS 2,090,880 2,093,200 2,116,480 25,600 1.2%
FINANCIAL 2,021,280 1,756,430 2,025,240 3,960 0.2%
TOTAL EXPENDITURES 48,946,600 48,387,680 49,752,830 806,230 1.6%
FEES AND GENERAL (1,606,330) (1,582,190) (1,519,190) 87,140 5.4%
GRANTS AND SUBSIDIES (36,840,480) (36,305,740) (37,248,740) (408,260) (1.1)%
RESERVES 0 0 (187,610) (187,610) (100.0)%
TOTAL REVENUES (38,446,810) (37,887,930) (38,955,540) (508,730) (1.3)%
NET LEVY 10,499,790 10,499,750 10,797,290 297,500 2.8%
2014 Preliminary vs.
2013 Restated

16
Public Health Services 2014 Budget
2014 Gross Expenditures $ 49,752,830
17
Public Health Services 2014 Budget
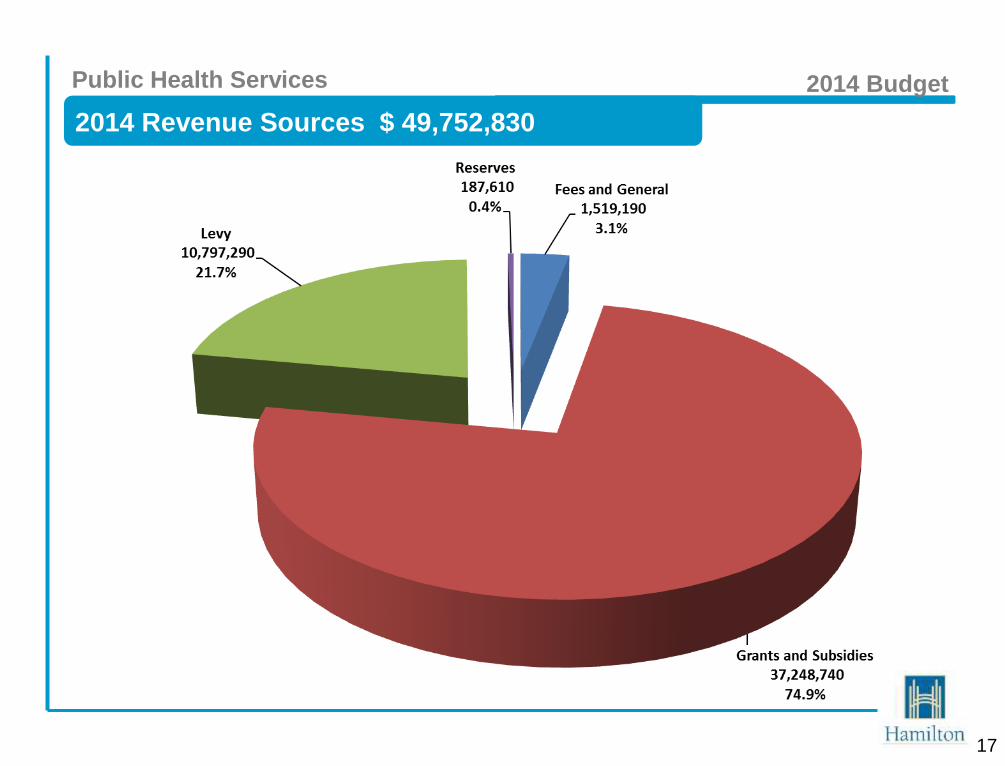
2014 Revenue Sources $ 49,752,830

18
Public Health Services 2014 Budget
MANDATORY PUBLIC HEALTH

19
Public Health Services 2014 Budget
GROSS/NET Budget by Funding Source
Program Details
2014
Gross
($000s)
2014
Net
($000s)
Net % of
Gross
PH Mandatory Programs $33,776 $8,974 26.6%
100% Funded Programs 13,492 304 2.3%
Locally Mandated Programs 1,259 1,201 95.4%
Small Drinking Water Systems 58 17 29.1%
CINOT Expansion 204 51 25.0%
Vector Borne Disease 965 251 26.0%
TOTAL $49,753 $10,797 21.7%

20
2014 NET OPERATING BUDGET BY DIVISION
Public Health Services 2014 Budget
Public Health Services
2013 2013 2014
Restated Projected Preliminary
Budget Actual Budget $ %
Medical Officer of Health 2,155,480 2,155,050 2,279,700 124,220 5.8%
Clinical & Preventive Services 2,209,760 2,374,070 2,334,620 124,860 5.7%
Family Health 1,189,920 1,210,820 1,238,430 48,510 4.1%
Health Protection 2,186,630 2,080,100 2,216,990 30,360 1.4%
Healthy Living 1,850,140 1,687,730 1,812,810 (37,330) (2.0)%
Planning & Business Improvement 907,860 991,980 914,730 6,870 0.8%
NET LEVY 10,499,790 10,499,750 10,797,290 297,500 2.8%
2013 Restated
2014 Preliminary vs.

21
2014 MAJOR COST DRIVERS
Public Health Services 2014 Budget
gross net
• Employee related increases $722,040 $559,600
• Rent/Facilities $122,670 $122,670
• Risk cost allocation ($29,490) ($29,490)
• Indirect Cost Allocations $21,330 $19,100
• User fees 2% increase ($10,810) ($10,810)
• Provincial vaccine program $30,380 $30,380
• Provincial cost shared subsidy 2% ($459,930) ($459,930)

22
2014 BASE BUDGET SAVINGS
Public Health Services 2014 Budget
Base budget savings included in base budget:
– Efficiencies ($13,740)
– Revenues ($ 1,010)
Total ($14,750)

23
Public Health Services
2014 TAX OPERATING BUDGET
Additional Information

24
FTE Complement by Funding Source
Public Health Services 2014 Budget
25 25
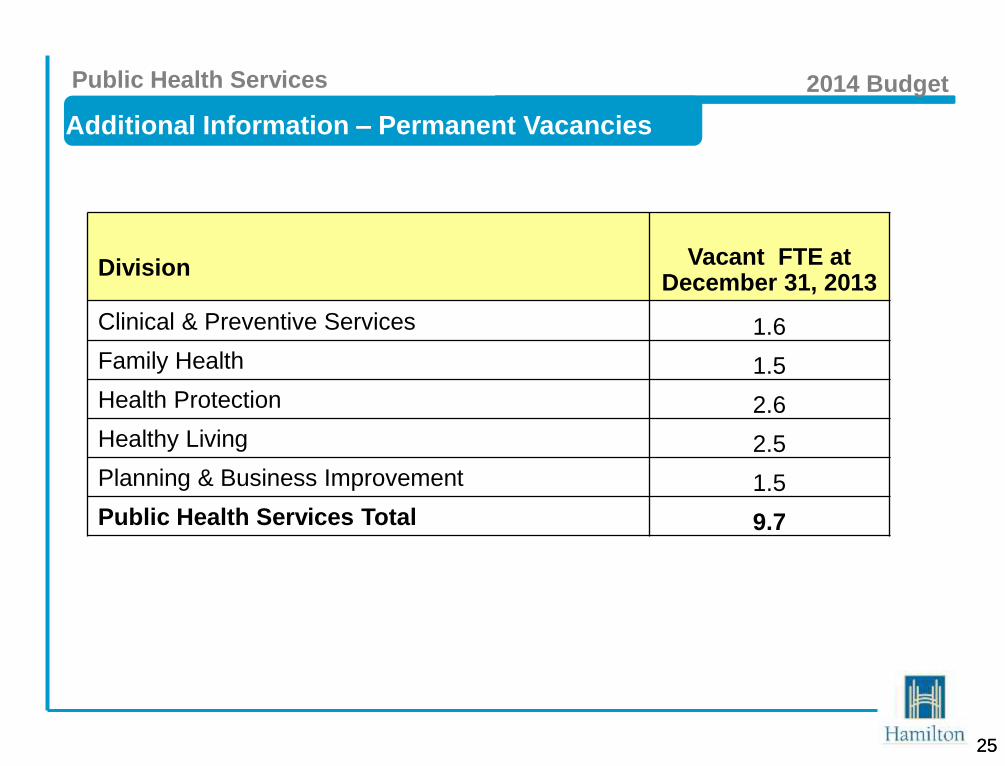
Additional Information – Permanent Vacancies
Public Health Services 2014 Budget
Division Vacant FTE at December 31, 2013
Clinical & Preventive Services 1.6
Family Health 1.5
Health Protection 2.6
Healthy Living 2.5
Planning & Business Improvement 1.5
Public Health Services Total 9.7

26
2014 TAX OPERATING BUDGET
2014 Budget by Division

27
Medical Officer of Health
Public Health Services 2014 Budget

28
2014 GROSS - NET DIVISIONAL BUDGET
Medical Officer of Health 2014 Budget
Medical Officer of Health
2013 2013 2014
Restated Projected PreliminaryBudget Actual Budget $ %
EMPLOYEE RELATED COSTS 2,457,950 2,464,580 2,639,170 181,220 7.4%
MATERIAL AND SUPPLY 21,630 29,600 21,110 (520) (2.4)%
VEHICLE EXPENSES 5,520 5,520 5,740 220 4.0%
BUILDING AND GROUND 1,349,090 1,336,390 1,487,960 138,870 10.3%
CONSULTING 0 2,820 0 0 0.0%
CONTRACTUAL 13,230 14,580 13,150 (80) (0.6)%
RESERVES / RECOVERIES 125,380 114,020 116,870 (8,510) (6.8)%
COST ALLOCATIONS 1,642,650 1,642,650 1,659,070 16,420 1.0%
FINANCIAL 87,810 88,560 87,810 0 0.0%
TOTAL EXPENDITURES 5,703,260 5,698,720 6,030,880 327,620 5.7%
FEES AND GENERAL (42,510) (102,720) (42,510) 0 0.0%
GRANTS AND SUBSIDIES (3,505,270) (3,440,950) (3,521,060) (15,790) (0.5)%
RESERVES 0 0 (187,610) (187,610) (100.0)%
TOTAL REVENUES (3,547,780) (3,543,670) (3,751,180) (203,400) (5.7)%
NET LEVY 2,155,480 2,155,050 2,279,700 124,220 5.8%
2014 Preliminary vs.
2013 Restated
29
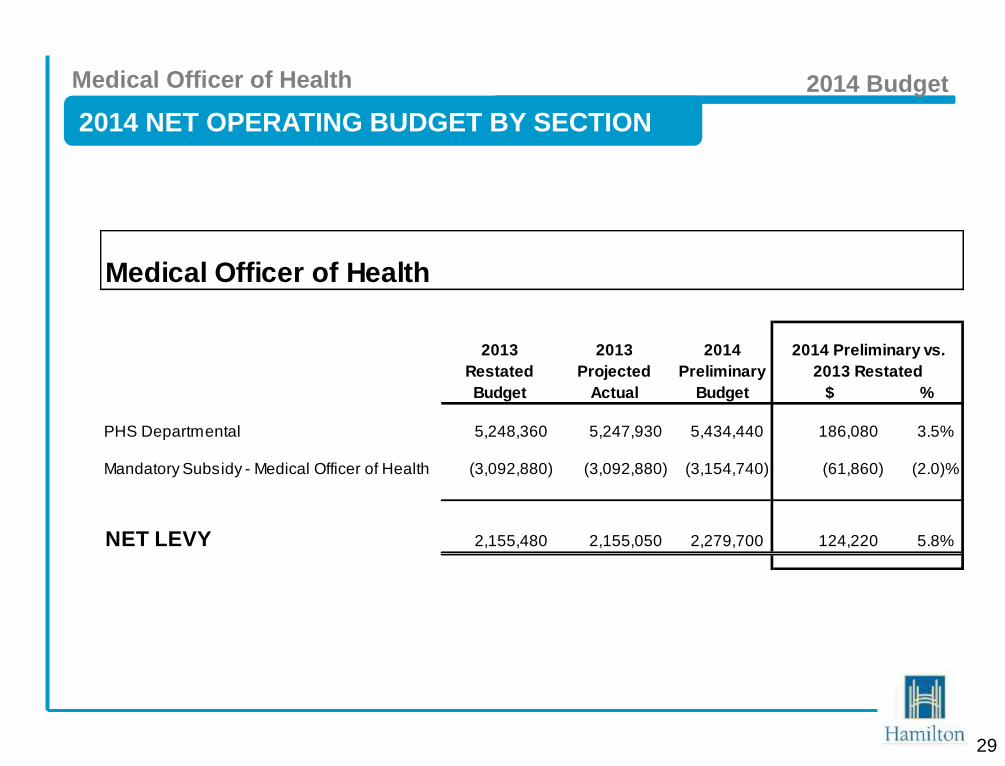
2014 NET OPERATING BUDGET BY SECTION
Medical Officer of Health 2014 Budget
Medical Officer of Health
2013 2013 2014
Restated Projected Preliminary
Budget Actual Budget $ %
PHS Departmental 5,248,360 5,247,930 5,434,440 186,080 3.5%
Mandatory Subsidy - Medical Officer of Health (3,092,880) (3,092,880) (3,154,740) (61,860) (2.0)%
NET LEVY 2,155,480 2,155,050 2,279,700 124,220 5.8%
2013 Restated
2014 Preliminary vs.

30
Clinical & Preventive
Services
Public Health Services 2014 Budget
Clinical & Preventive Services 2014 Budget
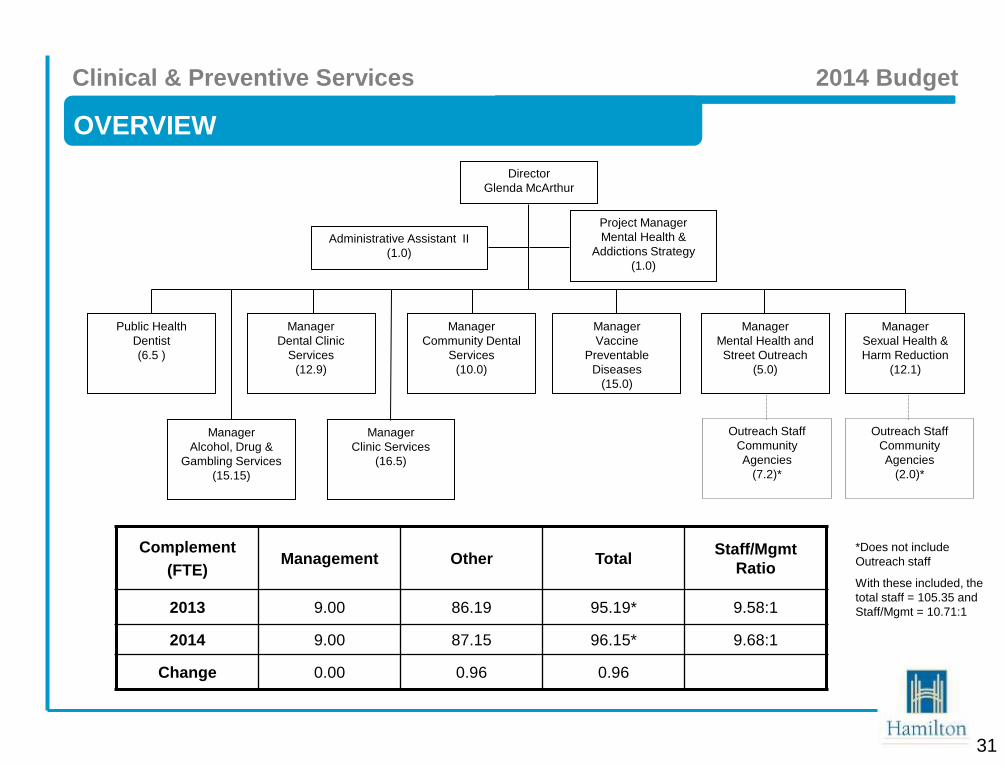
OVERVIEW
Complement
(FTE) Management Other Total
Staff/Mgmt
Ratio
2013 9.00 86.19 95.19* 9.58:1
2014 9.00 87.15 96.15* 9.68:1
Change 0.00 0.96 0.96
*Does not include
Outreach staff
With these included, the
total staff = 105.35 and
Staff/Mgmt = 10.71:1
Manager
Dental Clinic
Services
(12.9)
Manager
Sexual Health &
Harm Reduction
(12.1)
Manager
Mental Health and
Street Outreach
(5.0)
Public Health
Dentist
(6.5 )
Manager
Community Dental
Services
(10.0)
Manager
Vaccine
Preventable
Diseases
(15.0)
Director
Glenda McArthur
Administrative Assistant II
(1.0)
Manager
Alcohol, Drug &
Gambling Services
(15.15)
Manager
Clinic Services
(16.5)
Outreach Staff
Community
Agencies
(7.2)*
Outreach Staff
Community
Agencies
(2.0)*
Project Manager
Mental Health &
Addictions Strategy
(1.0)
31

32
Clinical & Preventive Services 2014 Budget
PERFORMANCE METRICS / SERVICE LEVELS
Accountability Agreement
Performance Indicator
Target
Actual
% confirmed gonorrhoea cases where follow-up started
within 2 business days 100% 100%
% of HPV vaccine wasted that is stored/administered
by the public health unit 0.5% 0.7%
% of influenza vaccine wasted that is
stored/administered by the public health unit 2.3% 2.4%
% of eligible school-aged children who have
completed immunizations for Hepatitis B 74.7% 89.7%
% of eligible school-aged children who have
completed immunizations for HPV 55.2% 74.7%
% of eligible school-aged children who have
completed immunizations for meningococcus 88.1% 88.3%
33
Clinical & Preventive Services 2014 Budget
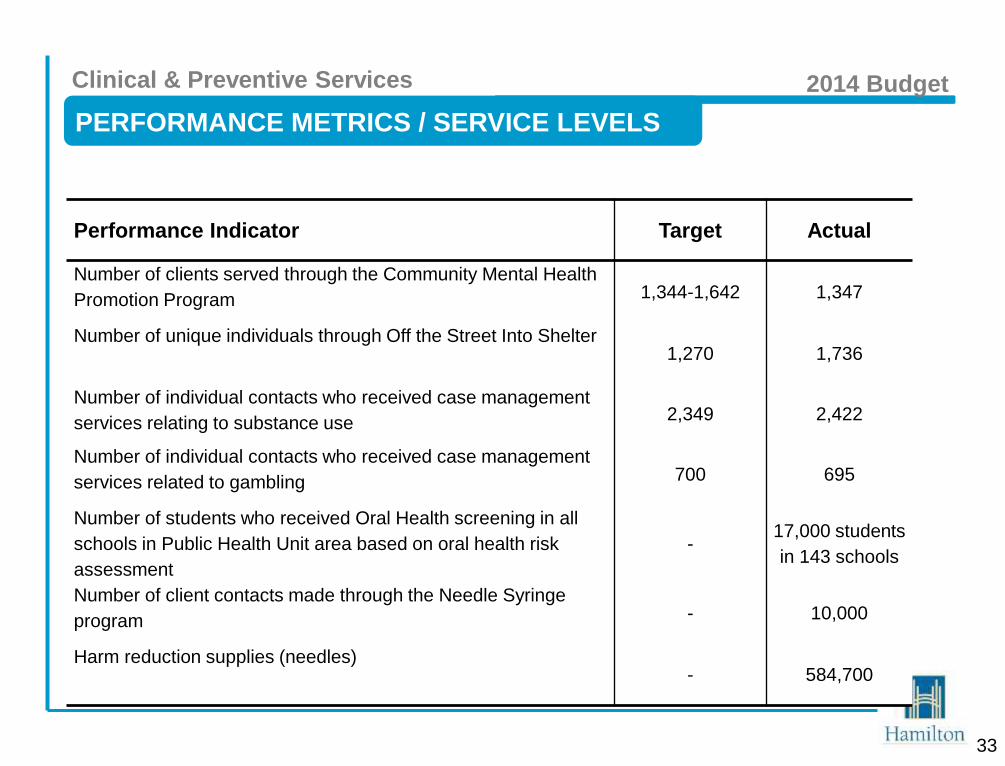
PERFORMANCE METRICS / SERVICE LEVELS
Performance Indicator Target Actual
Number of clients served through the Community Mental Health
Promotion Program 1,344-1,642 1,347
Number of unique individuals through Off the Street Into Shelter 1,270 1,736
Number of individual contacts who received case management
services relating to substance use 2,349 2,422
Number of individual contacts who received case management
services related to gambling 700 695
Number of students who received Oral Health screening in all
schools in Public Health Unit area based on oral health risk
assessment
- 17,000 students
in 143 schools
Number of client contacts made through the Needle Syringe
program - 10,000
Harm reduction supplies (needles) - 584,700

34
2014 GROSS - NET DIVISIONAL BUDGET
Clinical & Preventive Services 2014 Budget
Clinical & Preventive Services
2013 2013 2014
Restated Projected PreliminaryBudget Actual Budget $ %
EMPLOYEE RELATED COSTS 8,013,480 7,854,870 8,187,630 174,150 2.2%
MATERIAL AND SUPPLY 678,710 655,430 696,670 17,960 2.6%
VEHICLE EXPENSES 26,790 29,270 28,150 1,360 5.1%
BUILDING AND GROUND 151,010 150,170 138,810 (12,200) (8.1)%
CONTRACTUAL 540,840 642,830 554,740 13,900 2.6%
AGENCIES and SUPPORT PAYMENTS 250 50 250 0 0.0%
RESERVES / RECOVERIES (99,810) (93,770) (96,800) 3,010 3.0%
COST ALLOCATIONS 135,600 135,600 136,890 1,290 1.0%
FINANCIAL 1,613,940 1,410,790 1,624,650 10,710 0.7%
TOTAL EXPENDITURES 11,060,810 10,785,230 11,271,000 210,190 1.9%
FEES AND GENERAL (439,920) (437,410) (442,210) (2,290) (0.5)%
GRANTS AND SUBSIDIES (8,411,130) (7,973,750) (8,494,170) (83,040) (1.0)%
TOTAL REVENUES (8,851,050) (8,411,160) (8,936,380) (85,330) (1.0)%
NET LEVY 2,209,760 2,374,070 2,334,620 124,860 5.7%
2014 Preliminary vs.
2013 Restated

35
2014 NET OPERATING BUDGET BY SECTION
Clinical & Preventive Services 2014 Budget
Clinical & Preventive Services
2013 2013 2014
Restated Projected Preliminary
Budget Actual Budget $ %
Administration - Clinical & Preventive Services 261,290 254,050 265,130 3,840 1.5%
Vaccine Preventable Disease Program 1,810,550 1,904,670 1,896,860 86,310 4.8%
Dental Services 2,266,060 2,235,620 2,306,950 40,890 1.8%
Mental Health & Addictions 15,000 15,000 15,000 0 0.0%
Sexual Health & Harm Reduction 2,316,430 2,424,310 2,399,440 83,010 3.6%
Mandatory Subsidy - Clinical & Preventive Services (4,459,570) (4,459,570) (4,548,760) (89,190) (2.0)%
NET LEVY 2,209,760 2,374,070 2,334,620 124,860 5.7%
2013 Restated
2014 Preliminary vs.

36
Family Health
Public Health Services 2014 Budget

37
OVERVIEW
Complement
(FTE)
Management Other Total Staff to Mgt
Ratio
2013 8.00 89.80 97.80* 11.23:1
2014 8.00 87.30 95.30* 10.91:1
Change 0.00 (2.50) (2.50)
Family Health 2014 Budget
* Does not include:
11 FTE Family Home
Visitors, 1 FTE FHV
Supervisor
With these staff included,
total staff = 107.3
Staff/Mgmt ratio = 12.41:1

• Baby Friendly Initiative (BFI)
– intermediate status
– on track for designation in 2014
38
Family Health 2014 Budget
PERFORMANCE METRICS / SERVICE LEVELS

39
Family Health 2014 Budget
PERFORMANCE METRICS / SERVICE LEVELS
Child Health Program Service Indicator
Nurse-Family Partnership 1,985 visits
Healthy Babies Healthy Children >8,000 home visits
Car seat installation/Education 284 car seats
Health Connections 6,527 calls
Breastfeeding Clinic 1,041 visits
Welcome Baby (Canadian Prenatal Nutrition Program) 5,383 visits

40
Reproductive Health
• Prenatal group education
– 650 adults and 57 young parents
• On-line prenatal education: 91 registrants
Child and Adolescent Services
– 751 new clients admitted
(each receiving an average of 6-10 sessions annually)
Family Health 2014 Budget
PERFORMANCE METRICS / SERVICE LEVELS

41
2014 GROSS - NET DIVISIONAL BUDGET
Family Health 2014 Budget
Family Health
2013 2013 2014
Restated Projected PreliminaryBudget Actual Budget $ %
EMPLOYEE RELATED COSTS 9,128,240 9,078,950 9,086,030 (42,210) (0.5)%
MATERIAL AND SUPPLY 420,400 373,890 409,590 (10,810) (2.6)%
BUILDING AND GROUND 184,880 186,080 185,250 370 0.2%
CONSULTING 800 2,790 800 0 0.0%
CONTRACTUAL 819,400 832,140 818,100 (1,300) (0.2)%
AGENCIES and SUPPORT PAYMENTS 0 0 290 290 100.0%
RESERVES / RECOVERIES 35,110 41,160 36,850 1,740 5.0%
COST ALLOCATIONS 181,420 181,420 188,000 6,580 3.6%
FINANCIAL 60,930 61,800 67,280 6,360 10.4%
TOTAL EXPENDITURES 10,831,180 10,758,220 10,792,200 (38,980) (0.4)%
FEES AND GENERAL (569,900) (476,400) (423,160) 146,740 25.7%
GRANTS AND SUBSIDIES (9,071,360) (9,071,000) (9,130,610) (59,250) (0.7)%
TOTAL REVENUES (9,641,260) (9,547,400) (9,553,770) 87,490 0.9%
NET LEVY 1,189,920 1,210,820 1,238,430 48,510 4.1%
2014 Preliminary vs.
2013 Restated
42
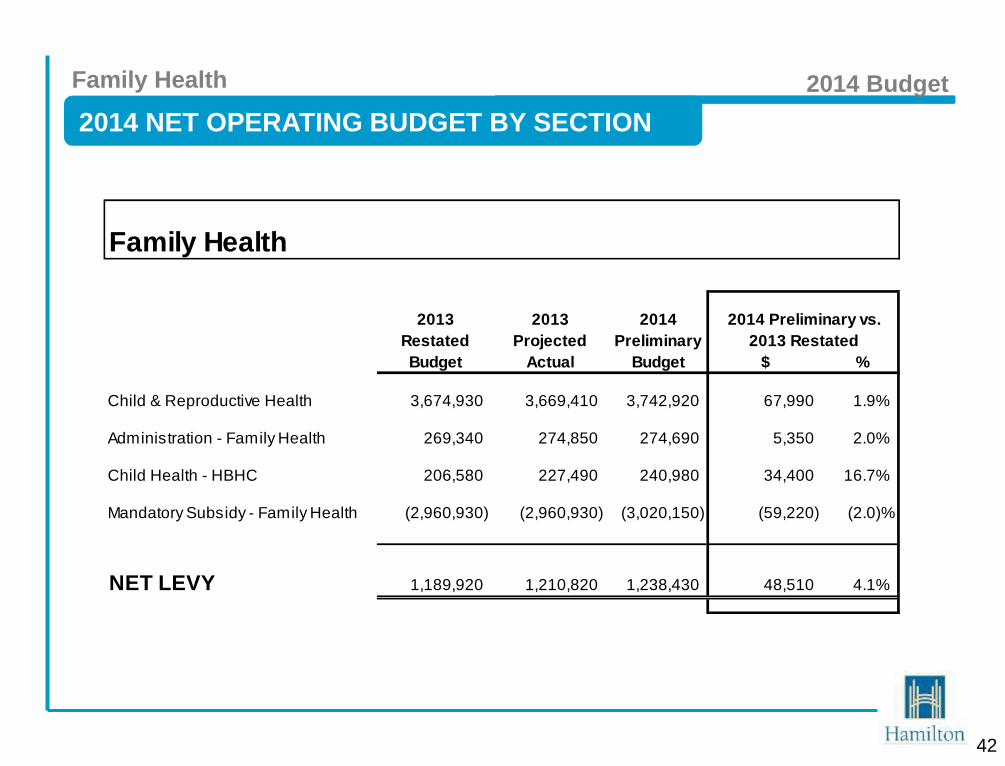
2014 NET OPERATING BUDGET BY SECTION
Family Health 2014 Budget
Family Health
2013 2013 2014
Restated Projected Preliminary
Budget Actual Budget $ %
Child & Reproductive Health 3,674,930 3,669,410 3,742,920 67,990 1.9%
Administration - Family Health 269,340 274,850 274,690 5,350 2.0%
Child Health - HBHC 206,580 227,490 240,980 34,400 16.7%
Mandatory Subsidy - Family Health (2,960,930) (2,960,930) (3,020,150) (59,220) (2.0)%
NET LEVY 1,189,920 1,210,820 1,238,430 48,510 4.1%
2013 Restated
2014 Preliminary vs.

43
Health Protection
Public Health Services 2014 Budget

44
OVERVIEW
Complement
(FTE)S
Management Other Total Staff to Mgt
Ratio
2013 7.00 69.26 76.26 9.89:1
2014 7.00 69.26 76.26 9.89:1
Change 0.00 0.00 0.00
Health Protection 2014 Budget
Manager
Infectious
Disease/Infection
Control Program
(14.5)
Manager
Health Hazards
Program
(9.6)
Manager
Food Safety
Program
(14.56)
Manager
Infectious
Disease & TB
Program
(11.4)
Manager
Vector Borne
Disease Program
(14.35)
Manager
Safe Water
Program
(8.85)
Director
Robert Hall
Administrative Assistant II
(1.0)
Quality Assurance
Advisor
(1.0)

45
Health Protection 2014 Budget
PERFORMANCE METRICS / SERVICE LEVELS
Accountability Agreement
Performance Indicator Target Actuals
% high risk food premises inspected once every 4
months while in operation 95% 88.7%
% of Class A pools inspected while in operation 100% 95.7%
% of confirmed invasive Group A Streptococcal Disease
cases where initiation of follow-up occurred on the
same day as receipt of lab confirmation of a positive
case
100% 100%
46
Health Protection 2014 Budget
PERFORMANCE METRICS / SERVICE LEVELS
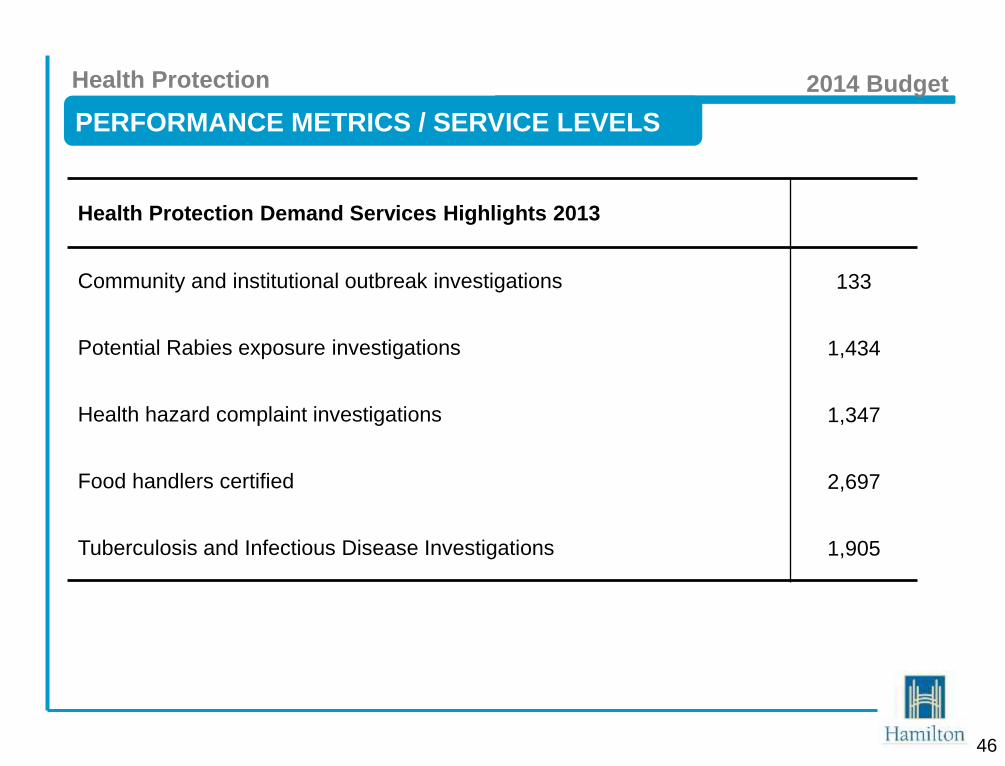
Health Protection Demand Services Highlights 2013
Community and institutional outbreak investigations 133
Potential Rabies exposure investigations 1,434
Health hazard complaint investigations 1,347
Food handlers certified 2,697
Tuberculosis and Infectious Disease Investigations 1,905

47
2014 GROSS - NET DIVISIONAL BUDGET
Health Protection 2014 Budget
Health Protection
2013 2013 2014
Restated Projected PreliminaryBudget Actual Budget $ %
EMPLOYEE RELATED COSTS 7,412,710 7,312,480 7,580,140 167,430 2.3%
MATERIAL AND SUPPLY 293,060 268,640 282,940 (10,120) (3.5)%
BUILDING AND GROUND 23,640 23,680 23,810 170 0.7%
CONSULTING 470 8,870 470 0 0.0%
CONTRACTUAL 250,520 213,160 250,520 0 0.0%
AGENCIES and SUPPORT PAYMENTS 81,000 81,000 81,000 0 0.0%
RESERVES / RECOVERIES 248,000 254,800 219,910 (28,090) (11.3)%
COST ALLOCATIONS 52,650 54,970 53,160 510 1.0%
FINANCIAL 82,630 65,760 81,480 (1,150) (1.4)%
TOTAL EXPENDITURES 8,444,680 8,283,360 8,573,430 128,750 1.5%
FEES AND GENERAL (429,190) (440,080) (437,460) (8,270) (1.9)%
GRANTS AND SUBSIDIES (5,828,860) (5,763,180) (5,918,980) (90,120) (1.5)%
TOTAL REVENUES (6,258,050) (6,203,260) (6,356,440) (98,390) (1.6)%
NET LEVY 2,186,630 2,080,100 2,216,990 30,360 1.4%
2014 Preliminary vs.
2013 Restated

48
2014 NET OPERATING BUDGET BY SECTION
Health Protection 2014 Budget
Health Protection
2013 2013 2014
Restated Projected Preliminary
Budget Actual Budget $ %
Administration - Health Protection 574,110 513,710 580,740 6,630 1.2%
Environmental Health 4,898,230 4,906,330 5,006,600 108,370 2.2%
TB/Infectious Disease Control 1,060,540 1,023,810 1,088,020 27,480 2.6%
Residential Care Facilities 247,450 247,480 219,140 (28,310) (11.4)%
Vector-Borne Diseases 238,020 220,480 250,840 12,820 5.4%
Mandatory Subsidy - Health Protection (4,831,720) (4,831,720) (4,928,350) (96,630) (2.0)%
NET LEVY 2,186,630 2,080,100 2,216,990 30,360 1.4%
2013 Restated
2014 Preliminary vs.

49
Healthy Living
Public Health Services 2014 Budget

50
OVERVIEW
Complement
(FTE)
Management Other Total Staff to Mgt
Ratio
2013 7.00 75.27 82.27 10.75:1
2014 7.00 74.77 81.77 10.68:1
Change 0.00 (0.50) (0.50)
Healthy Living 2014 Budget

51
Healthy Living 2014 Budget
PERFORMANCE METRICS / SERVICE LEVELS
Accountability Agreement
Performance Indicator Targets Target Actual
% of youth (ages 12-18) who have never smoked a whole
cigarette 88.3% 94.7%
% of tobacco vendors in compliance with youth access
legislation at last inspection >90% 92.1%
Number of fall-related emergency visits in adults aged 65+
(rate per 100,000 per year)
Maintain or
improve
current rate 5639*

52
Healthy Living 2014 Budget
PERFORMANCE METRICS / SERVICE LEVELS
Healthy Living Demand Services Highlights 2013
YouTube video hits re underage drinking in response to Skinner inquest 863 hits
Number of clients reached through Women Health Educator Program 803 clients
Number of Health Promoting Partnership Schools 79 schools
Number of employees reached across 5 workplaces in Tobacco
Workplace Cessation Project
8,796
employees
Number of Smoke-Free Ontario Act inspections and enforcement
checks 1,851
53
2014 GROSS - NET DIVISIONAL BUDGET
Healthy Living 2014 Budget
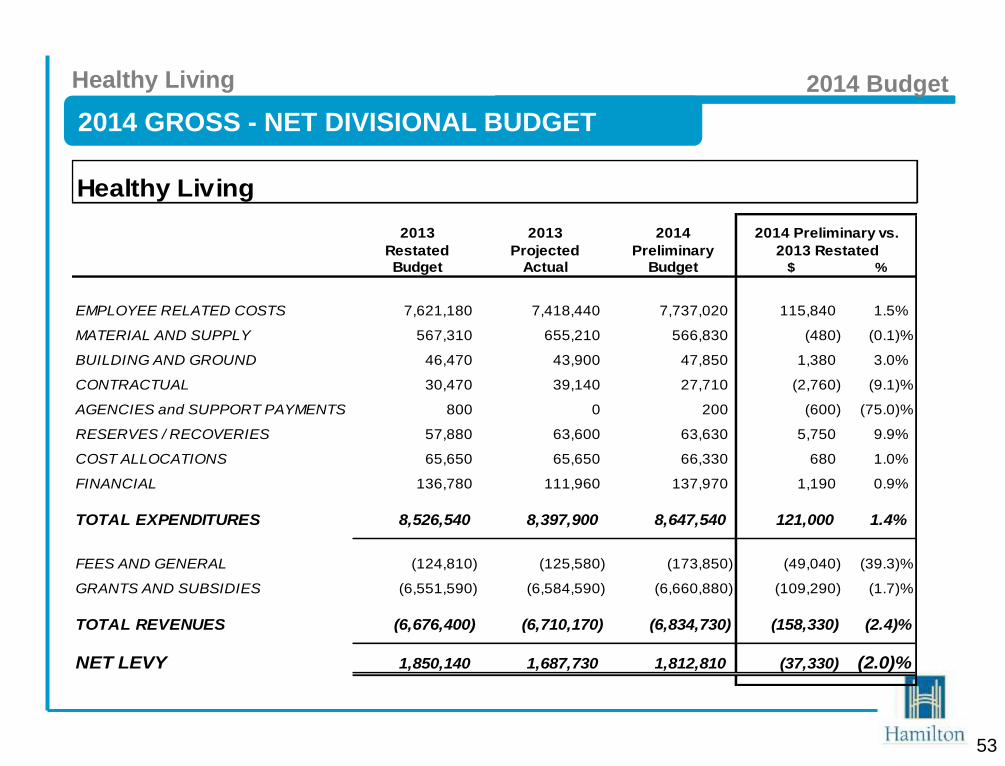
Healthy Living
2013 2013 2014
Restated Projected PreliminaryBudget Actual Budget $ %
EMPLOYEE RELATED COSTS 7,621,180 7,418,440 7,737,020 115,840 1.5%
MATERIAL AND SUPPLY 567,310 655,210 566,830 (480) (0.1)%
BUILDING AND GROUND 46,470 43,900 47,850 1,380 3.0%
CONTRACTUAL 30,470 39,140 27,710 (2,760) (9.1)%
AGENCIES and SUPPORT PAYMENTS 800 0 200 (600) (75.0)%
RESERVES / RECOVERIES 57,880 63,600 63,630 5,750 9.9%
COST ALLOCATIONS 65,650 65,650 66,330 680 1.0%
FINANCIAL 136,780 111,960 137,970 1,190 0.9%
TOTAL EXPENDITURES 8,526,540 8,397,900 8,647,540 121,000 1.4%
FEES AND GENERAL (124,810) (125,580) (173,850) (49,040) (39.3)%
GRANTS AND SUBSIDIES (6,551,590) (6,584,590) (6,660,880) (109,290) (1.7)%
TOTAL REVENUES (6,676,400) (6,710,170) (6,834,730) (158,330) (2.4)%
NET LEVY 1,850,140 1,687,730 1,812,810 (37,330) (2.0)%
2014 Preliminary vs.
2013 Restated
54
2014 NET OPERATING BUDGET BY SECTION
Healthy Living 2014 Budget
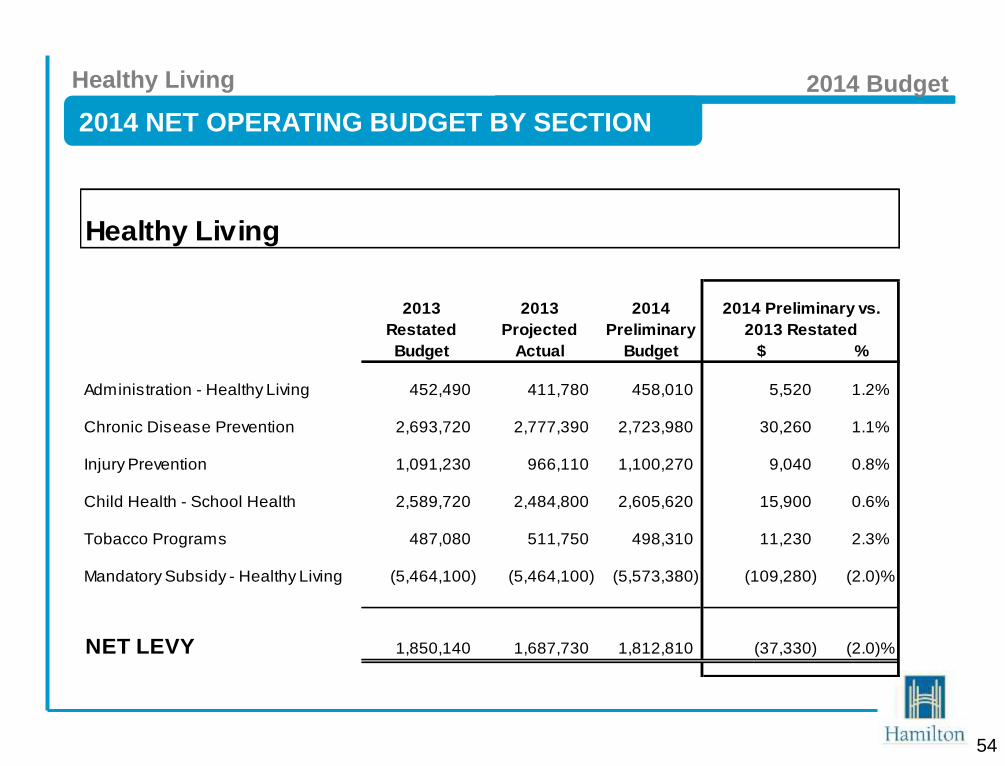
Healthy Living
2013 2013 2014
Restated Projected Preliminary
Budget Actual Budget $ %
Administration - Healthy Living 452,490 411,780 458,010 5,520 1.2%
Chronic Disease Prevention 2,693,720 2,777,390 2,723,980 30,260 1.1%
Injury Prevention 1,091,230 966,110 1,100,270 9,040 0.8%
Child Health - School Health 2,589,720 2,484,800 2,605,620 15,900 0.6%
Tobacco Programs 487,080 511,750 498,310 11,230 2.3%
Mandatory Subsidy - Healthy Living (5,464,100) (5,464,100) (5,573,380) (109,280) (2.0)%
NET LEVY 1,850,140 1,687,730 1,812,810 (37,330) (2.0)%
2013 Restated
2014 Preliminary vs.

55
Planning & Business
Improvement
Public Health Services 2014 Budget

56
OVERVIEW
Complement
(FTE)
Management Other Total Staff to Mgt
Ratio
2013 4.00 37.00 41.00 9.25:1
2014 4.00 37.00 41.00 9.25:1
Change 0.00 0.00 0.00
Planning & Business Improvement 2014 Budget
Health Safety & Wellness Specialist
Organizational Development Specialist
(2.0)
Manager
Applied Research &
Evaluation
(14.0)
Manager
Strategic Projects
and Services
(10.0)
Manager
Surveillance Unit
(13.0)
Administrative Assistant II
(1.0)
Director
Teresa Bendo
57
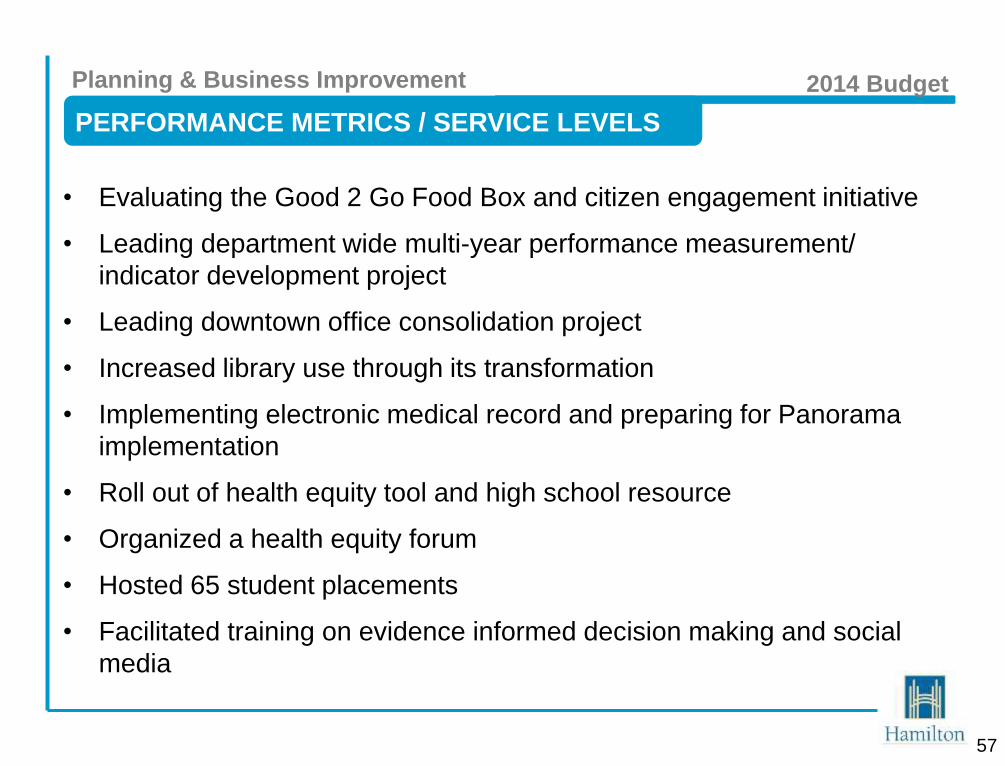
• Evaluating the Good 2 Go Food Box and citizen engagement initiative
• Leading department wide multi-year performance measurement/
indicator development project
• Leading downtown office consolidation project
• Increased library use through its transformation
• Implementing electronic medical record and preparing for Panorama
implementation
• Roll out of health equity tool and high school resource
• Organized a health equity forum
• Hosted 65 student placements
• Facilitated training on evidence informed decision making and social
media
Planning & Business Improvement 2014 Budget
PERFORMANCE METRICS / SERVICE LEVELS
58
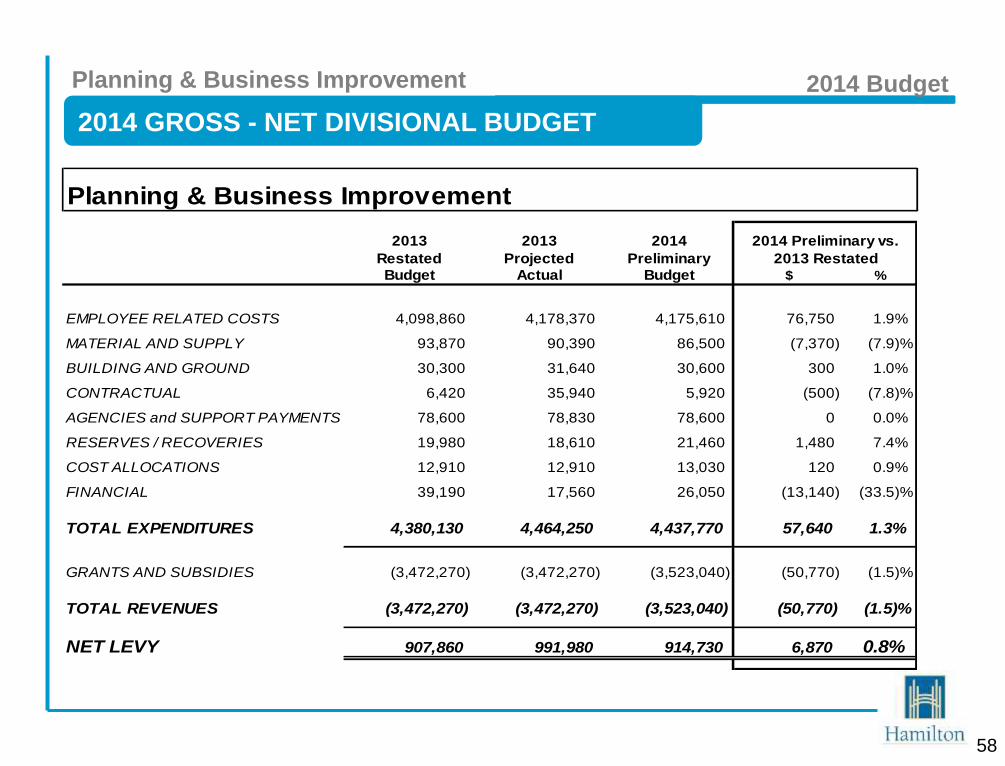
2014 GROSS - NET DIVISIONAL BUDGET
Planning & Business Improvement 2014 Budget
Planning & Business Improvement
2013 2013 2014
Restated Projected PreliminaryBudget Actual Budget $ %
EMPLOYEE RELATED COSTS 4,098,860 4,178,370 4,175,610 76,750 1.9%
MATERIAL AND SUPPLY 93,870 90,390 86,500 (7,370) (7.9)%
BUILDING AND GROUND 30,300 31,640 30,600 300 1.0%
CONTRACTUAL 6,420 35,940 5,920 (500) (7.8)%
AGENCIES and SUPPORT PAYMENTS 78,600 78,830 78,600 0 0.0%
RESERVES / RECOVERIES 19,980 18,610 21,460 1,480 7.4%
COST ALLOCATIONS 12,910 12,910 13,030 120 0.9%
FINANCIAL 39,190 17,560 26,050 (13,140) (33.5)%
TOTAL EXPENDITURES 4,380,130 4,464,250 4,437,770 57,640 1.3%
GRANTS AND SUBSIDIES (3,472,270) (3,472,270) (3,523,040) (50,770) (1.5)%
TOTAL REVENUES (3,472,270) (3,472,270) (3,523,040) (50,770) (1.5)%
NET LEVY 907,860 991,980 914,730 6,870 0.8%
2014 Preliminary vs.
2013 Restated
59
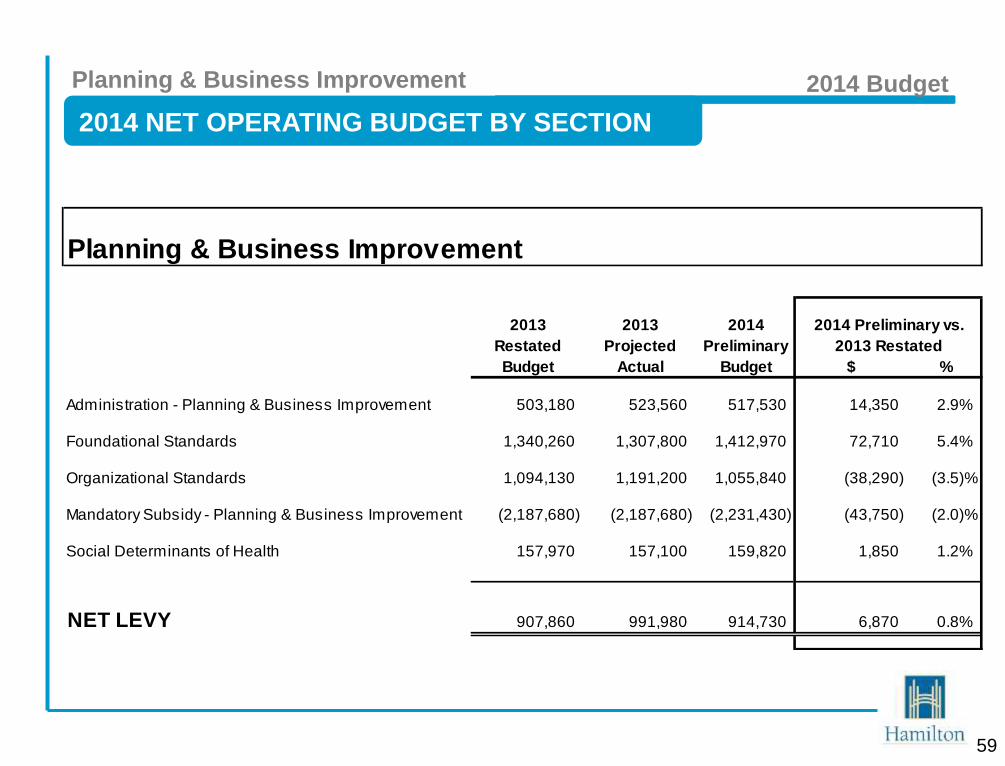
2014 NET OPERATING BUDGET BY SECTION
Planning & Business Improvement 2014 Budget
Planning & Business Improvement
2013 2013 2014
Restated Projected Preliminary
Budget Actual Budget $ %
Administration - Planning & Business Improvement 503,180 523,560 517,530 14,350 2.9%
Foundational Standards 1,340,260 1,307,800 1,412,970 72,710 5.4%
Organizational Standards 1,094,130 1,191,200 1,055,840 (38,290) (3.5)%
Mandatory Subsidy - Planning & Business Improvement (2,187,680) (2,187,680) (2,231,430) (43,750) (2.0)%
Social Determinants of Health 157,970 157,100 159,820 1,850 1.2%
NET LEVY 907,860 991,980 914,730 6,870 0.8%
2013 Restated
2014 Preliminary vs.

60
Thank you
Public Health Services 2014 Budget