public health services - hamilton, ontario · • public health services supports the ......
TRANSCRIPT

1
Public Health Services
General Issues Committee
February 10, 2015
2015 TAX OPERATING BUDGET
Item 7.1

2
• Public Health Services supports the following programs and related services:
SERVICE DELIVERY PROFILES
Public Health Services 2015 Budget
Public Health
- Foundation Standards
- Chronic Disease & Injury Prevention
- Environmental Health
- Infectious Diseases
- Emergency Preparedness
- Family Health
Corporate Services
-Public Health Departmental Support
Services
Organizational Standards
Finance and Administration
Information Services
Human Resources

3
Prosperous and Healthy Community
• PHS Consolidation in Downtown Core
- Phase 1 move to Robert Thompson completed
- Implemented face to face reception area
- Centralized inventory management
- Successfully introduced hoteling and telecommuting
2014 HIGHLIGHTS
Public Health Services 2015 Budget
• 200 PHS jobs coming downtown
• 5,000 dental clinic visits
• 4,600 sexual health clinic visits
• 450 McMaster jobs downtown
• 54,000 McMaster clinic visits

4
Prosperous and Healthy Community
• Neighbourhood Action Plans
- Participation in 214 (47%) of neighbourhood actions
Examples:
- Canada Learning Bond
- Lead awareness project
- Community Food Advisors’ healthy eating sessions
- Glendale photovoice – infrastructure issues
- Community Points
- VAN needle pick up and sweeps
- Private property, education
- School Health Action Team
links to action plans
2014 HIGHLIGHTS
Public Health Services 2015 Budget

5
Prosperous and Healthy Community
• Hamilton Overdose & Prevention Education (HOPE)
• Coordinated Needle Pick Up across City
• Downtown Dental Clinic
• Health System Navigators (Bed Bugs, McQuesten)
• “Epipen initiative” in Jackson Square (Epinephrine Auto-Injector Pilot Project)
2014 HIGHLIGHTS
Public Health Services 2015 Budget

6
Prosperous and Healthy Community
• Mental Health & Addictions Services
- Developed mental health framework to inform future
initiatives and approach
- Conducted provincial research project to determine best practices for
child and youth mental health promotion
- Implemented youth alcohol harm reduction campaign
• Health Links Collaboratives
– Mental Health & Addictions
– Frail & Elderly
2014 HIGHLIGHTS
Public Health Services 2015 Budget

7
Prosperous and Healthy Community
• Environmental Health Issues
- Air Quality Task Force recommendations to be implemented
- Climate Change Action Plan
- Community
- Corporate
• Healthy Built Environment
- Improving Health by Design report
2014 HIGHLIGHTS
Public Health Services 2015 Budget

8
Valuable & Sustainable Services
• Continuous service improvement
- E-Health Initiatives (OSCAR, Panorama)
- Performance Measurement System
- Program Evaluations
• Waterdown Sexual Health Clinic
• School Immunization Program
• Good to Go Food Box
• HOPE
2014 HIGHLIGHTS
Public Health Services 2015 Budget

9
Valuable & Sustainable Services
• Engaging and informing citizens and stakeholders
- Food Premise Inspection Disclosure Card System
- Food Summit
- Healthy Birth Weight
- Community Points Needle Pick Up
- Foundation for Cleaner Air/Upwind
Downwind Conference
-”Let’s Talk About Weather” Community Climate Change Action Plan
2014 HIGHLIGHTS
Public Health Services 2015 Budget

10
Leadership & Governance
• Moving toward Culture of Accountability and
Engagement
– Denison Employee Culture Survey completed
– Employee Culture Action Plan completed
1) Communicated Denison Survey results to all PHS staff
2) Performance and Accountability Development (PAD)
implemented across leadership team
3) Gained understanding of baseline Denison results
• Led the Pan Am 2015 City of Hamilton Emergency
Management Plan
• Board of Health Self Evaluation
2014 HIGHLIGHTS
Public Health Services 2015 Budget

11
Departmental Operational Work Plan Approach
2015 INITIATIVES
Public Health Services 2015 Budget

12
External Departmental Operational Work Plan
Priorities
• Hamilton Healthy Kids Strategy - Community Challenge
• Food Strategy
• Mental Well-being and Resiliency
• Healthy Birth Weight Strategy
• Health System Integration
2015 INITIATIVES
Public Health Services 2015 Budget

13
Internal Departmental Operational
Workplan Priorities
• Culture Plan – Workplace of Choice
• Privacy, records and information
management system
• Program administrative support
2015 INITIATIVES
Public Health Services 2015 Budget

14
Other Emerging Priorities and Service Demands
• New requirements in Ontario Public Health Standards
(OPHS)
• Menu labelling promotion and enforcement • Public transparency in investigations and inspections
• Smoke Free Ontario expanded enforcement • Revised food safety standards
• Mental health promotion • Revised program indicators
• Review of public health standards • Safe water program protocol
• Bed bugs, rat infestations
• Low Income Integrated Dental Program
• Increased inspections for Influenza Vaccine providers;
reach of vaccination for vulnerable groups for cervical
cancer and meningitis
2015 INITIATIVES
Public Health Services 2015 Budget

15
Other Emerging Priorities and Service Demands
• Pan Am games
• McMaster Health Campus – phase 2 move
• Keep programs and services relevant using social media,
information technology, and support increasingly mobile
work force
• Performance measurement for all programs by 2016 with
the development of a performance dashboard
• Implement new performance appraisal tool (PAD -
Performance Accountability and Development) for all staff in
department
2015 INITIATIVES
Public Health Services 2015 Budget

16
2015 Preliminary
Tax Operating Budget
2015 TAX OPERATING BUDGET

17
OVERVIEW
Complement
(FTE)
Management Other Total Staff to Mgt
Ratio
2014 37.50 368.40 405.90 9.82:1
2015 37.50 367.80 405.30 9.81:1
Change 0.00 (0.60) (0.60)
Public Health Services 2015 Budget
18
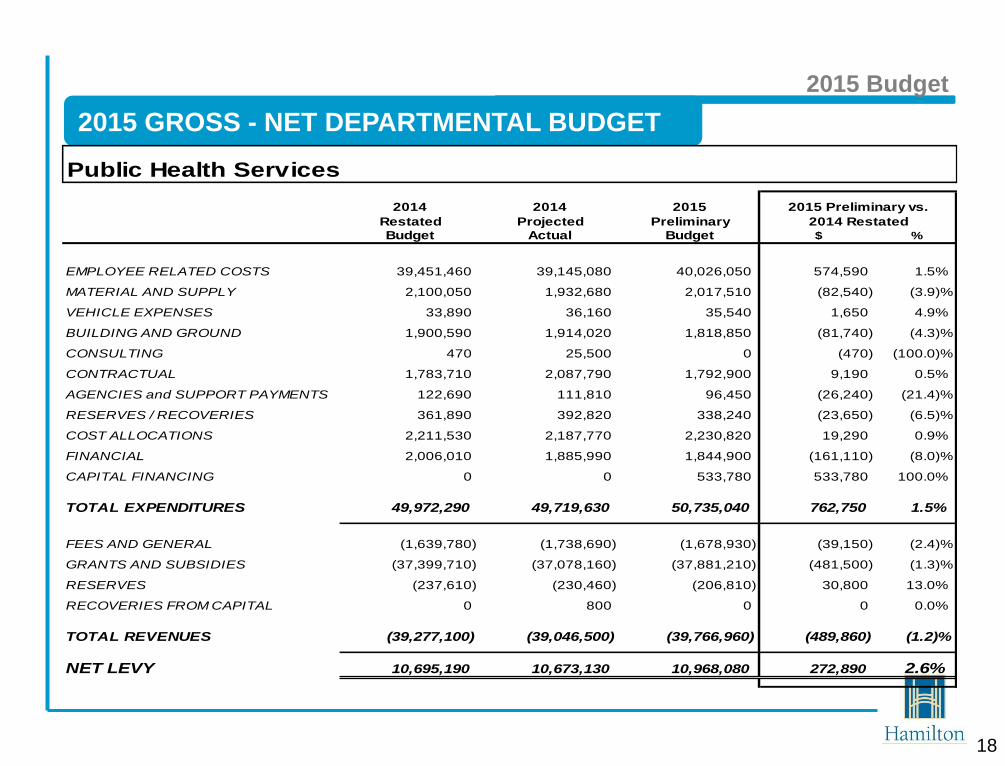
2015 GROSS - NET DEPARTMENTAL BUDGET
2015 Budget
Public Health Services
2014 2014 2015
Restated Projected PreliminaryBudget Actual Budget $ %
EMPLOYEE RELATED COSTS 39,451,460 39,145,080 40,026,050 574,590 1.5%
MATERIAL AND SUPPLY 2,100,050 1,932,680 2,017,510 (82,540) (3.9)%
VEHICLE EXPENSES 33,890 36,160 35,540 1,650 4.9%
BUILDING AND GROUND 1,900,590 1,914,020 1,818,850 (81,740) (4.3)%
CONSULTING 470 25,500 0 (470) (100.0)%
CONTRACTUAL 1,783,710 2,087,790 1,792,900 9,190 0.5%
AGENCIES and SUPPORT PAYMENTS 122,690 111,810 96,450 (26,240) (21.4)%
RESERVES / RECOVERIES 361,890 392,820 338,240 (23,650) (6.5)%
COST ALLOCATIONS 2,211,530 2,187,770 2,230,820 19,290 0.9%
FINANCIAL 2,006,010 1,885,990 1,844,900 (161,110) (8.0)%
CAPITAL FINANCING 0 0 533,780 533,780 100.0%
TOTAL EXPENDITURES 49,972,290 49,719,630 50,735,040 762,750 1.5%
FEES AND GENERAL (1,639,780) (1,738,690) (1,678,930) (39,150) (2.4)%
GRANTS AND SUBSIDIES (37,399,710) (37,078,160) (37,881,210) (481,500) (1.3)%
RESERVES (237,610) (230,460) (206,810) 30,800 13.0%
RECOVERIES FROM CAPITAL 0 800 0 0 0.0%
TOTAL REVENUES (39,277,100) (39,046,500) (39,766,960) (489,860) (1.2)%
NET LEVY 10,695,190 10,673,130 10,968,080 272,890 2.6%
2015 Preliminary vs.
2014 Restated

Public Health Services
19
2015 Gross Expenditures $50,735,040
2015 Budget

20
2015 Revenue Sources $50,735,040
Public Health Services 2015 Budget

21
Gross/Net Budget by Funding Source
Public Health Services 2015 Budget
Program Details
2015
Gross
($000s)
2015
Net
($000s)
Net % of
Gross
PH Mandatory Programs $34,380 $9,045 26.3%
100% Funded Programs 13,881 420 3.0%
Locally Mandated Programs 1,258 1,198 95.3%
Small Drinking Water Systems 55 14 25.1%
CINOT Expansion 204 51 25.0%
Vector Borne Disease 958 240 25.0%
TOTAL $50,735 $10,968 21.6%
22
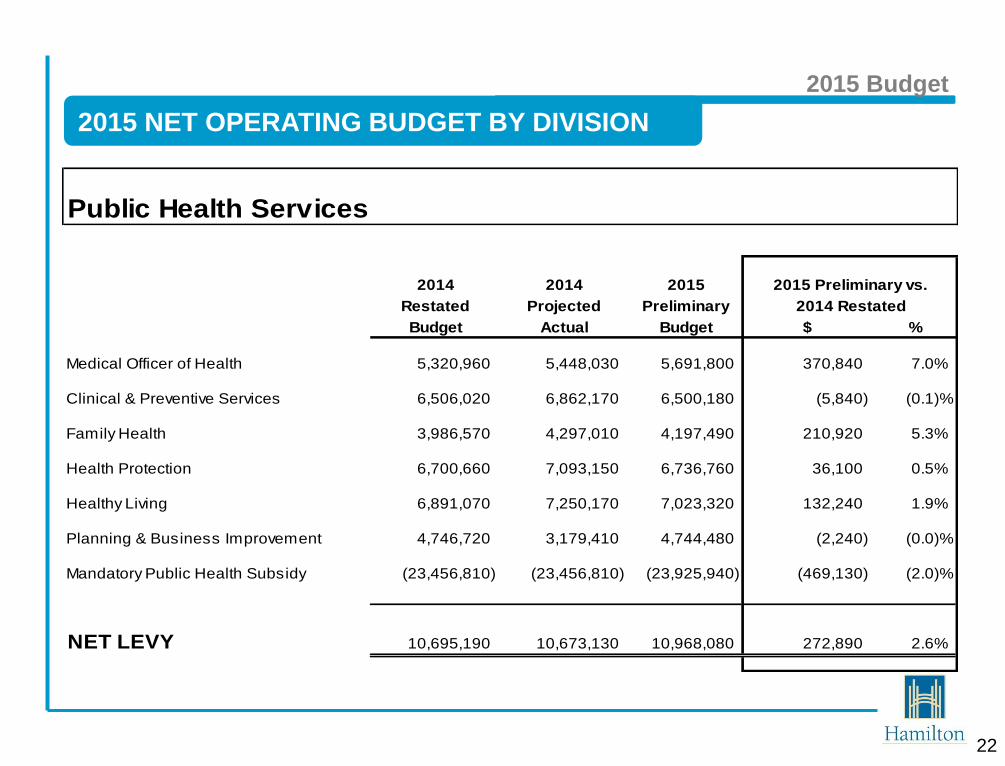
2015 NET OPERATING BUDGET BY DIVISION
2015 Budget
Public Health Services
2014 2014 2015
Restated Projected Preliminary
Budget Actual Budget $ %
Medical Officer of Health 5,320,960 5,448,030 5,691,800 370,840 7.0%
Clinical & Preventive Services 6,506,020 6,862,170 6,500,180 (5,840) (0.1)%
Family Health 3,986,570 4,297,010 4,197,490 210,920 5.3%
Health Protection 6,700,660 7,093,150 6,736,760 36,100 0.5%
Healthy Living 6,891,070 7,250,170 7,023,320 132,240 1.9%
Planning & Business Improvement 4,746,720 3,179,410 4,744,480 (2,240) (0.0)%
Mandatory Public Health Subsidy (23,456,810) (23,456,810) (23,925,940) (469,130) (2.0)%
NET LEVY 10,695,190 10,673,130 10,968,080 272,890 2.6%
2014 Restated
2015 Preliminary vs.

23
2015 MAJOR COST DRIVERS
Public Health Services 2015 Budget
net
Employee related increases $ 702,730
Provincial cost shared subsidy (469,130)
Rent/Facilities/Clinic (227,990)
Debt Charge 533,780
Efficiencies (171,010)
Program Admin Review (85,690)
Public Health Services
Additional Information
24
2015 Budget

25
Low Income Dental Integration Plan
• Integration of 6 oral health programs for low income
children/youth into 1 dental program
• Administration and eligibility determination will be
centralized and contracted out
• Preventive services will only be available to those children
who meet financial eligibility rather than need
• Local health units will continue with school screening and
refer families to the new program if eligible
2015 CHALLENGES
Public Health Services 2015 Budget

CPS FHD
HLD HPD
PBI
PH
S P
rog
ram
Ad
min
istr
ati
ve
S
up
po
rt
CPS
FHD
HLD
HPD
PBI
Public Health Services 2015 Budget
PROGRAM ADMINISTRATIVE SUPPORT REVIEW

27
PROGRAM ADMINISTRATIVE SUPPORT REVIEW
Public Health Services 2015 Budget
Program Administrative Support benefits:
• Better client services
• Better program support
• Better work environment
• Save money

28
Accommodations Impact (BOH11026) $476,450
Mitigation:
• 2014 Efficiencies ($77,050)
• 2014 Program Secretary (32,700)
• 2015 Efficiencies (124,800)
• 2015 Clinic Rent (110,000)
• 2015 Facilities Project Manager (46,210)
• 2015 Program Admin review (85,690)
($476,450)
ACCOMMODATIONS
Public Health Services 2015 Budget
29
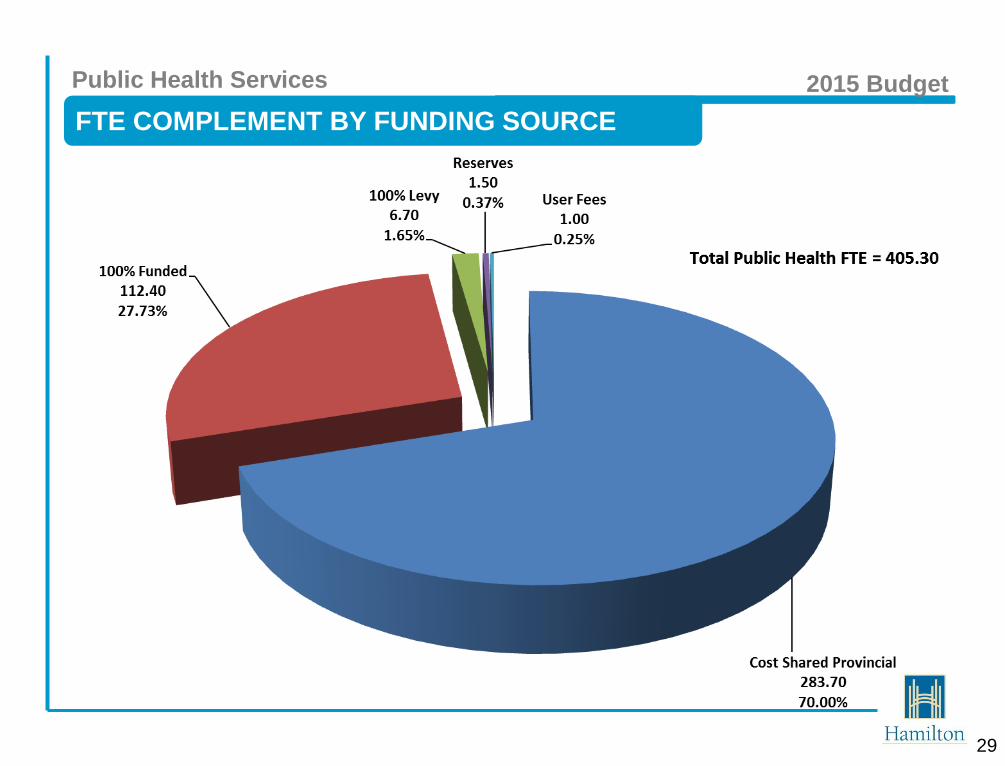
FTE COMPLEMENT BY FUNDING SOURCE
Public Health Services 2015 Budget

30
PERMANENT VACANCIES
Public Health Services 2015 Budget
Division Vacant FTE at
December 31, 2014
Clinical & Preventive Services 1.80
Healthy Living 3.00
Planning & Business Improvement 2.00
Public Health Services Total 6.80

31
2015 TAX OPERATING BUDGET
2015 Budget by Division

32
Medical Officer of Health
Public Health Services 2015 Budget

33
2015 GROSS - NET DIVISIONAL BUDGET
2015 Budget
Medical Officer of Health
2014 2014 2015
Restated Projected PreliminaryBudget Actual Budget $ %
EMPLOYEE RELATED COSTS 2,617,360 2,467,370 2,549,340 (68,020) (2.6)%
MATERIAL AND SUPPLY 16,980 42,730 16,240 (740) (4.4)%
BUILDING AND GROUND 1,460,520 1,479,500 1,368,430 (92,090) (6.3)%
CONSULTING 0 25,500 0 0 0.0%
CONTRACTUAL 12,850 193,570 12,850 0 0.0%
RESERVES / RECOVERIES 112,810 117,730 103,940 (8,870) (7.9)%
COST ALLOCATIONS 1,659,070 1,659,070 1,675,660 16,590 1.0%
FINANCIAL 87,810 112,430 63,830 (23,980) (27.3)%
CAPITAL FINANCING 0 0 533,780 533,780 100.0%
TOTAL EXPENDITURES 5,967,400 6,097,900 6,324,070 356,670 6.0%
FEES AND GENERAL (42,510) (73,250) (42,510) 0 0.0%
GRANTS AND SUBSIDIES (366,320) (348,140) (382,950) (16,630) (4.5)%
RESERVES (237,610) (228,480) (206,810) 30,800 13.0%
TOTAL REVENUES (646,440) (649,870) (632,270) 14,170 2.2%
NET LEVY 5,320,960 5,448,030 5,691,800 370,840 7.0%
2015 Preliminary vs.
2014 Restated
34
Clinical & Preventive
Services
Public Health Services 2015 Budget

35
Clinical & Preventive Services 2015 Budget
PERFORMANCE METRICS / SERVICE LEVELS
2014 Accountability Agreement
Performance Indicators Target Actual
% confirmed gonorrhea cases where follow-up started within 2
business days
100% 100%
% of HPV vaccine wasted that is stored/administered by the
public health unit (2013/14 school year)
0.5% 0.7%
% of influenza vaccine wasted that is stored/administered by the
public health unit (2013/14 season) 2.3% 2.4%
% of refrigerators storing publicly funded vaccines that have
received a completed routine annual cold chain inspection 100% 99.3%

36
Clinical & Preventive Services 2015 Budget
PERFORMANCE METRICS / SERVICE LEVELS
2014 Accountability Agreement
Performance Indicators Target Actual
% of eligible school-aged children who have completed
immunizations for Hepatitis B No ministry
performance
targets set for
2013/14 school
year
80%
% of eligible school-aged children who have completed
immunizations for HPV 59.38%
% of eligible school-aged children who have completed
immunizations for meningococcus 84.7%
% of all JK, SK and Grade 2 students who received oral health
screening in all publicly funded schools 100% 100%

37
Clinical & Preventive Services 2015 Budget
PERFORMANCE METRICS / SERVICE LEVELS
Service Highlights 2014 Target Actual
Number of clients served through the Community Mental
Health Promotion Program 1,344-1,642 1,192
Number of unique individuals served through Off the Street
Into Shelter (OSIS) 1,270 1,510
Number of individual contacts who received case
management services relating to substance use 2,349 2,139
Number of individual contacts who received case
management services related to gambling 700 624
Number of clients served through Dental Clinic and Bus 5000 4638
Number of client contacts made through the Needle
Syringe program 7500 8614
Harm reduction supplies (needles)
600,000 732,559

38
OVERVIEW
Complement
(FTE)
Management Other Total Staff to Mgt
Ratio
2014 8.00 83.55 91.55 10.44:1
2015 8.00 82.75 90.75 10.34:1
Change 0.00 (0.80) (0.80)
Clinical & Preventive Services 2015 Budget
Director
Glenda McArthur
Manager
Dental Clinic
Services
(11.9)
Manager
Sexual Health &
Harm Reduction
(11.1)
Manager
Mental Health and
Street Outreach
(5.0)
Manager
Community Dental
Services
(10.0)***
Manager
Vaccine
Preventable
Diseases
(14.0)
Manager
Alcohol, Drug &
Gambling Services
(14.35)
Manager
Clinic Services
(15.5)
Outreach Staff
Community
Agencies
(6.2)*
Outreach Staff
Community
Agencies
(2.0)*
Administrative Assistant II
(1.0)
Project Manager, Mental
Health & Addictions Strategy
(1.0)**
Dental Claims Payment
(5.9)
* Does not include
Outreach staff
** Budget in OMOH
*** Includes 1.0 FTE 100%
funded program
secretary position that
report to Business
Operations Manager

39
2015 NET OPERATING BUDGET BY SECTION
2015 Budget
Clinical & Preventive Services
2014 2014 2015
Restated Projected Preliminary
Budget Actual Budget $ %
Administration - Clinical & Preventive Services 264,880 315,600 269,490 4,610 1.7%
Vaccine Preventable Disease Program 1,840,590 2,017,180 1,872,560 31,970 1.7%
Dental Services 2,141,030 2,172,970 2,165,220 24,190 1.1%
Mental Health & Addictions 15,000 15,000 15,000 0 0.0%
Sexual Health & Harm Reduction 2,244,520 2,341,420 2,177,910 (66,610) (3.0)%
NET LEVY 6,506,020 6,862,170 6,500,180 (5,840) (0.1)%
2014 Restated
2015 Preliminary vs.
40
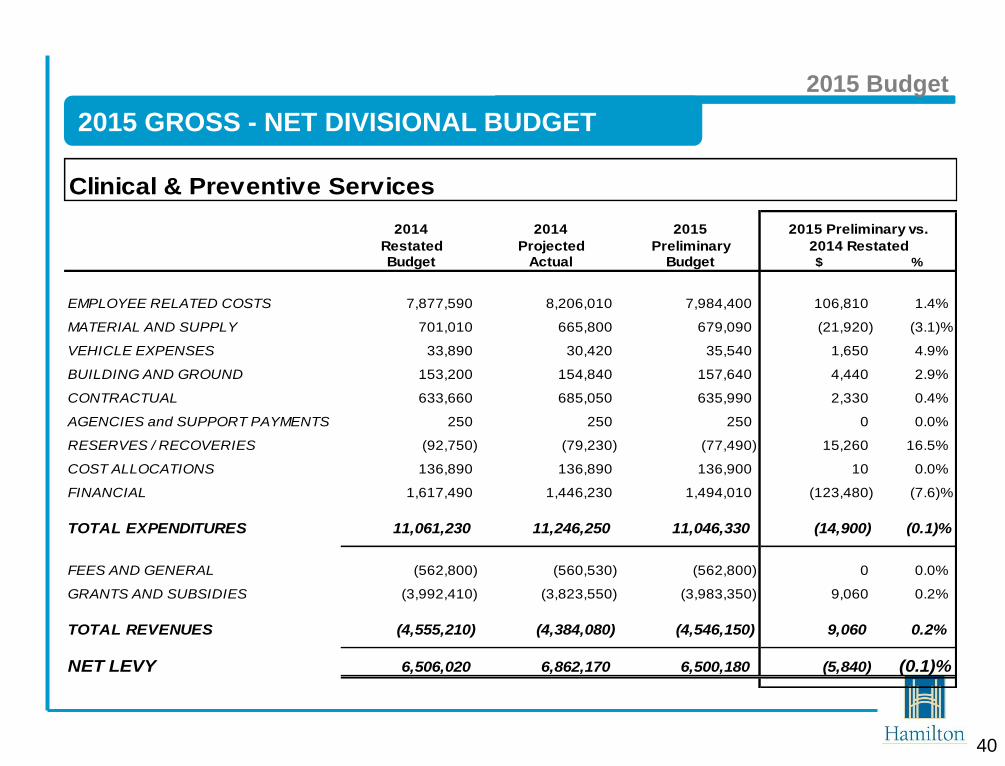
2015 GROSS - NET DIVISIONAL BUDGET
2015 Budget
Clinical & Preventive Services
2014 2014 2015
Restated Projected PreliminaryBudget Actual Budget $ %
EMPLOYEE RELATED COSTS 7,877,590 8,206,010 7,984,400 106,810 1.4%
MATERIAL AND SUPPLY 701,010 665,800 679,090 (21,920) (3.1)%
VEHICLE EXPENSES 33,890 30,420 35,540 1,650 4.9%
BUILDING AND GROUND 153,200 154,840 157,640 4,440 2.9%
CONTRACTUAL 633,660 685,050 635,990 2,330 0.4%
AGENCIES and SUPPORT PAYMENTS 250 250 250 0 0.0%
RESERVES / RECOVERIES (92,750) (79,230) (77,490) 15,260 16.5%
COST ALLOCATIONS 136,890 136,890 136,900 10 0.0%
FINANCIAL 1,617,490 1,446,230 1,494,010 (123,480) (7.6)%
TOTAL EXPENDITURES 11,061,230 11,246,250 11,046,330 (14,900) (0.1)%
FEES AND GENERAL (562,800) (560,530) (562,800) 0 0.0%
GRANTS AND SUBSIDIES (3,992,410) (3,823,550) (3,983,350) 9,060 0.2%
TOTAL REVENUES (4,555,210) (4,384,080) (4,546,150) 9,060 0.2%
NET LEVY 6,506,020 6,862,170 6,500,180 (5,840) (0.1)%
2015 Preliminary vs.
2014 Restated

41
Family Health
Public Health Services 2015 Budget

42
2015 Budget
PERFORMANCE METRICS / SERVICE LEVELS
Family Health
2014 Accountability Agreement
Performance Indicators 2013 2014
Baby Friendly Initiative (BFI)
Intermediate
status
On track for
designation in
2015
Service Highlights 2014 2013 2014
Health Connections 6,527 calls 6,300 calls
Healthy Babies Healthy Children 8,000 home
visits
8,000 home
visits
Nurse-Family Partnership 1,985 home
visits
1,878 home
visits
Car Seat Installation/Education 284 car seats 320 car seats

43
2015 Budget
PERFORMANCE METRICS / SERVICE LEVELS
Family Health
Service Highlights 2014 2013 2014
Breastfeeding Clinic 1,041 visits 638 visits
Welcome Baby (Canadian Prenatal Nutrition Program) 5,383 visits 5,528 visits
“Check It Out” 210 families 181 families
Prenatal Group Education (face to face, on line)
650 adult
parents
57 young
parents
686 adult
parents
100 young
parents
Quit Smoking Clinic Services
(pregnant/breastfeeding parents of young children)
22
individuals
92 contacts
51
individuals
208 contacts
Child and Adolescent Services 751 new
clients
784 new
clients

44
OVERVIEW
Complement
(FTE)
Management Other Total Staff to Mgt
Ratio
2014 8.00 83.31 91.31 10.41:1
2015 8.00 83.31 91.31 10.41:1
Change 0.00 0.00 0.00
Family Health 2015 Budget
Manager
Healthy Babies
Healthy Children,
Hamilton Family
Health Team
Secondment
(11.5)**
Family Home
Visitors
(11.0)*
FHV Supervisor
(1.0)*
Manager
Child Health
Positive Parenting,
Child Safety,
Health
Connections
(14.0)
Manager
Reproductive
Health and Early
Identification
(9.8)
Manager
Child and
Adolescent
Services
(19.8)
Manager
Child Health
Nutrition,
Canadian Prenatal
Nutrition Program,
Breastfeeding
(11.8)
Manager
Healthy Babies
Healthy Children,
Health
Connections
(12.4)**
Manager
Nurse-Family
Partnership,
Postpartum Mood
Disorder
(10.0)**
Administrative Assistant II
(1.0)
Director
Dorothy Barr
* Does not include: 11.0
FTE FHV; 1.0 FTE FHV
Supervisor
** Includes 3.4 FTE 100%
funded program
secretary positions that
report to Business
Operations Manager

45
2015 NET OPERATING BUDGET BY SECTION
2015 Budget
Family Health
2014 2014 2015
Restated Projected Preliminary
Budget Actual Budget $ %
Child & Reproductive Health 3,504,400 3,738,860 3,596,330 91,930 2.6%
Administration - Family Health 273,890 275,740 277,520 3,630 1.3%
Child Health - HBHC 208,280 282,410 323,640 115,360 55.4%
NET LEVY 3,986,570 4,297,010 4,197,490 210,920 5.3%
2014 Restated
2015 Preliminary vs.

46
2015 GROSS - NET DIVISIONAL BUDGET
2015 Budget
Family Health
2014 2014 2015
Restated Projected PreliminaryBudget Actual Budget $ %
EMPLOYEE RELATED COSTS 8,795,550 9,104,100 9,027,020 231,470 2.6%
MATERIAL AND SUPPLY 390,360 359,850 354,400 (35,960) (9.2)%
BUILDING AND GROUND 184,750 179,100 186,800 2,050 1.1%
CONTRACTUAL 853,130 865,850 862,140 9,010 1.1%
AGENCIES and SUPPORT PAYMENTS 290 290 0 (290) (100.0)%
RESERVES / RECOVERIES 36,840 40,240 43,580 6,740 18.3%
COST ALLOCATIONS 283,050 259,290 284,900 1,850 0.7%
FINANCIAL 55,210 82,110 51,780 (3,430) (6.2)%
TOTAL EXPENDITURES 10,599,180 10,890,830 10,810,620 211,440 2.0%
FEES AND GENERAL (423,160) (412,530) (423,680) (520) (0.1)%
GRANTS AND SUBSIDIES (6,189,450) (6,181,300) (6,189,450) 0 0.0%
TOTAL REVENUES (6,612,610) (6,593,830) (6,613,130) (520) 0.0%
NET LEVY 3,986,570 4,297,010 4,197,490 210,920 5.3%
2015 Preliminary vs.
2014 Restated

47
Health Protection
Public Health Services 2015 Budget

2014 Accountability Agreement
Performance Indicators Target Actuals
% of high - risk food premises inspected once every four
months while in operation
98.4% 98.8%
% of moderate - risk food premises inspected once every six
months while in operation 93% 95.1%
% of Class A pools inspected while in operation 98% 100%
% of high - risk Small Drinking Water System inspections
completed for those that are due for re-inspection TBD 100%
48
Health Protection 2015 Budget
PERFORMANCE METRICS / SERVICE LEVELS

2014 Accountability Agreement
Performance Indicators Target Actuals
% of public spas inspected while in operation TBD 100%
% of personal service setting inspected annually 95% 99.9%
% of suspected rabies exposures reported with investigations
initiated within one day of PHU notification TBD 100%
% of confirmed invasive Group A Streptococcal Disease cases
where initiation of follow-up occurred on the same day as
receipt of lab confirmation of a positive case
100% 100%
49
Health Protection 2015 Budget
PERFORMANCE METRICS / SERVICE LEVELS

50
Health Protection 2015 Budget
PERFORMANCE METRICS / SERVICE LEVELS
Service Highlights 2014 2013 2014
Community and institutional outbreak investigations 133 123
Health hazard/Pest control complaint investigations 1347 1324
Tuberculosis and Infectious Disease Investigations 1905 2062
Emerging Trends
Infectious Diseases
-MERS CoV, Ebola, Enterovirus D-68
Vector Borne Investigations
-Mosquitoes for Eastern Equine Encephalitis and Chikungunya
Diseases, Ticks for Lyme Disease

51
OVERVIEW
Complement
(FTE)
Management Other Total Staff to Mgt
Ratio
2014 7.00 62.66 69.66 8.95:1
2015 7.00 62.66 69.66 8.95:1
Change 0.00 0.00 0.00
Health Protection 2015 Budget
Director
Robert Hall
Administrative Assistant II
(1.0)
Quality Assurance
Advisor
(1.0)
Manager
Infectious
Disease & TB
Program
(10.4)
Manager
Infectious
Disease/Infection
Control Program
(13.5)
Manager
Vector Borne
Disease
Program
(13.35)*
Manager
Safe Water
Program
(7.85)
Manager
Food Safety
Program
(12.56)
Manager
Health
Hazards
Program
(9.0)
* Includes 0.6 FTE other
funded program
secretary position that
reports to Business
Operations Manager

52
2015 NET OPERATING BUDGET BY SECTION
2015 Budget
Health Protection
2014 2014 2015
Restated Projected Preliminary
Budget Actual Budget $ %
Administration - Health Protection 578,910 628,230 586,560 7,650 1.3%
Environmental Health 4,633,140 4,966,790 4,674,580 41,440 0.9%
TB/Infectious Disease Control 1,018,630 1,065,010 1,038,410 19,780 1.9%
Residential Care Facilities 219,140 220,940 197,570 (21,570) (9.8)%
Vector-Borne Diseases 250,840 212,180 239,630 (11,210) (4.5)%
NET LEVY 6,700,660 7,093,150 6,736,760 36,100 0.5%
2014 Restated
2015 Preliminary vs.

53
2015 GROSS - NET DIVISIONAL BUDGET
2015 Budget
Health Protection
2014 2014 2015
Restated Projected PreliminaryBudget Actual Budget $ %
EMPLOYEE RELATED COSTS 7,151,300 7,442,290 7,231,560 80,260 1.1%
MATERIAL AND SUPPLY 267,110 217,170 270,830 3,720 1.4%
BUILDING AND GROUND 23,810 25,850 24,510 700 2.9%
CONSULTING 470 0 0 (470) (100.0)%
CONTRACTUAL 250,520 274,070 247,440 (3,080) (1.2)%
AGENCIES and SUPPORT PAYMENTS 81,000 80,950 81,000 0 0.0%
RESERVES / RECOVERIES 219,900 226,560 193,380 (26,520) (12.1)%
COST ALLOCATIONS 53,160 53,160 53,200 40 0.1%
FINANCIAL 81,480 92,000 76,480 (5,000) (6.1)%
TOTAL EXPENDITURES 8,128,750 8,412,040 8,178,400 49,650 0.6%
FEES AND GENERAL (437,460) (450,880) (446,210) (8,750) (2.0)%
GRANTS AND SUBSIDIES (990,630) (868,010) (995,430) (4,800) (0.5)%
TOTAL REVENUES (1,428,090) (1,318,890) (1,441,640) (13,550) (0.9)%
NET LEVY 6,700,660 7,093,150 6,736,760 36,100 0.5%
2015 Preliminary vs.
2014 Restated
54
Healthy Living
Public Health Services 2015 Budget

55
Healthy Living 2015 Budget
PERFORMANCE METRICS / SERVICE LEVELS
2014 Accountability Agreement
Performance Indicators Target Actual
% of youth (ages 12-18) who have never smoked a whole
cigarette (2013) 88.3% 94.7%
% of tobacco vendors in compliance with youth access
legislation at last inspection 90% 95%
% of secondary schools inspected once per year for
compliance with Section (10) of the Smoke-Free Ontario Act
% tobacco retailers inspected for compliance with Section
(3) of the Smoke-Free Ontario Act
% tobacco retailers inspected once per year for compliance
with display, handling and promotion Sections of the Smoke-
Free Ontario Act
100%
100%
100%
100%
100%
100%

56
Healthy Living 2015 Budget
PERFORMANCE METRICS / SERVICE LEVELS
2014 Accountability Agreement
Performance Indicators Target Actual
Number of fall-related emergency visits in adults aged 65+
(rate per 100,000 per year)
Maintain or
improve
current rate
5409
Service Highlights 2014 2013 2014
Hamilton Helmet Initiative:
• # of helmets purchased through elementary schools 4481 3749
• # of free helmets provided to residents in need 696 1427

Service Highlights 2014 2013 2014
YouTube video hits re underage drinking in response to
Skinner inquest 863 hits 2305 hits
Cancer prevention for hard to reach clients - 11,292
individuals
Registered tanning salons, Skin Cancer Prevention Act New in 2014 41 (100%) salons
Tobacco Workplace Cessation Project 8,796 employees
Number of tobacco inspections and enforcement checks
(SFO, By-law 11-080) 1,851 1,821
Youth engagement:
• Youth healthy living programming reach
• Health Action Teams, Health Promoting
Partnership Schools
32,706
79 schools
36,768
79 schools
Food Strategy:
• Food Charter
• 2015 community engagement plan
• Community 2014 Food Forum
New in 2014
Endorsed
Developed
>100 participants
57
Healthy Living 2015 Budget
PERFORMANCE METRICS / SERVICE LEVELS
58
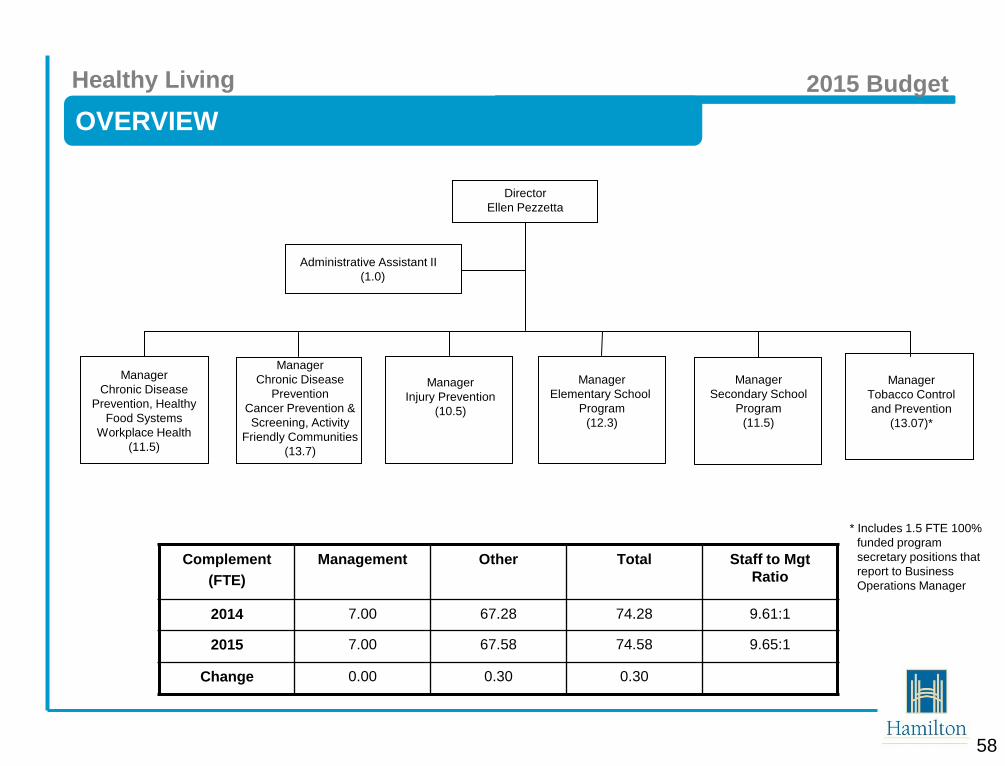
OVERVIEW
Complement
(FTE)
Management Other Total Staff to Mgt
Ratio
2014 7.00 67.28 74.28 9.61:1
2015 7.00 67.58 74.58 9.65:1
Change 0.00 0.30 0.30
Healthy Living 2015 Budget
Manager
Elementary School
Program
(12.3)
Manager
Secondary School
Program
(11.5)
Manager
Chronic Disease
Prevention, Healthy
Food Systems
Workplace Health
(11.5)
Manager
Injury Prevention
(10.5)
Manager
Chronic Disease
Prevention
Cancer Prevention &
Screening, Activity
Friendly Communities
(13.7)
Manager
Tobacco Control
and Prevention
(13.07)*
Administrative Assistant II
(1.0)
Director
Ellen Pezzetta
* Includes 1.5 FTE 100%
funded program
secretary positions that
report to Business
Operations Manager

59
2015 NET OPERATING BUDGET BY SECTION
2015 Budget
Healthy Living
2014 2014 2015
Restated Projected Preliminary
Budget Actual Budget $ %
Administration - Healthy Living 384,130 373,870 395,080 10,950 2.9%
Chronic Disease Prevention 2,530,030 2,717,590 2,601,460 71,430 2.8%
Injury Prevention 1,000,920 1,059,020 1,020,600 19,680 2.0%
Child Health - School Health 2,472,330 2,596,050 2,489,220 16,890 0.7%
Tobacco Programs 503,660 503,640 516,950 13,290 2.6%
NET LEVY 6,891,070 7,250,170 7,023,320 132,240 1.9%
2014 Restated
2015 Preliminary vs.

60
2015 GROSS - NET DIVISIONAL BUDGET
2015 Budget
Healthy Living
2014 2014 2015
Restated Projected PreliminaryBudget Actual Budget $ %
EMPLOYEE RELATED COSTS 7,255,020 7,668,760 7,443,700 188,670 2.6%
MATERIAL AND SUPPLY 578,920 585,230 567,800 (11,120) (1.9)%
BUILDING AND GROUND 47,710 42,870 49,740 2,030 4.3%
CONTRACTUAL 27,630 45,010 27,630 0 0.0%
AGENCIES and SUPPORT PAYMENTS 200 320 200 0 0.0%
RESERVES / RECOVERIES 63,630 64,260 49,820 (13,810) (21.7)%
COST ALLOCATIONS 66,330 66,330 67,010 680 1.0%
FINANCIAL 137,970 132,360 133,640 (4,330) (3.1)%
TOTAL EXPENDITURES 8,177,410 8,605,140 8,339,540 162,120 2.0%
FEES AND GENERAL (173,850) (242,680) (203,730) (29,880) (17.2)%
GRANTS AND SUBSIDIES (1,112,490) (1,112,290) (1,112,490) 0 0.0%
TOTAL REVENUES (1,286,340) (1,354,970) (1,316,220) (29,880) (2.3)%
NET LEVY 6,891,070 7,250,170 7,023,320 132,240 1.9%
2015 Preliminary vs.
2014 Restated

61
Planning & Business
Improvement
Public Health Services 2015 Budget

62
Planning and Business Improvement 2015 Budget
PERFORMANCE METRICS / SERVICE LEVELS
Service Highlights 2014 2013 2014
Canada Learning Bond RESP’s established for low income
families New 2014 207 children
Performance measurement and continuous quality
improvement
- fully operational
- pilot testing of indicators
- in development
- to be initiated in 2015
New 2014
6 programs
8 programs
17 programs
10 programs
Evaluations 4 4 complete
1 in progress
Downtown office consolidation project
~ 400 staff
moved
Student placements facilitated 73 students 56 students

63
OVERVIEW
Complement
(FTE)
Management Other Total Staff to Mgt
Ratio
2014 5.00 59.10 64.10 11.82:1
2015 5.00 59.00 64.00 11.80:1
Change 0.00 (0.10) (0.10)
Planning & Business Improvement 2015 Budget
Health Safety & Wellness Specialist
Organizational Development Specialist
(2.0)
Manager
Applied Research &
Evaluation
(13.0)
Manager
Strategic Projects
and Services
(9.5)
Manager
Business
Operations
(25.5)
Administrative Assistant II
(1.0)
Director
Michelle Baird (A)
Manager
Surveillance Unit
(12.0)
100% Funded
Program
Secretaries
(6.5)*
* Additional 6.5 FTE
program secretaries
funded through other
programs report to
Business Operations
Manager

64
2015 NET OPERATING BUDGET BY SECTION
2015 Budget
Planning & Business Improvement
2014 2014 2015
Restated Projected Preliminary
Budget Actual Budget $ %
Administration - Planning & Business Improvement2,319,400 679,470 2,253,110 (66,290) (2.9)%
Foundational Standards 1,244,550 1,316,210 1,284,090 39,540 3.2%
Organizational Standards 1,023,450 1,029,350 1,045,420 21,970 2.1%
Social Determinants of Health 159,320 154,380 161,860 2,540 1.6%
NET LEVY 4,746,720 3,179,410 4,744,480 (2,240) 0.0%
2014 Restated
2015 Preliminary vs.

65
2015 GROSS - NET DIVISIONAL BUDGET
2015 Budget
Planning & Business Improvement
2014 2014 2015
Restated Projected PreliminaryBudget Actual Budget $ %
EMPLOYEE RELATED COSTS 5,754,640 4,256,560 5,790,030 35,390 0.6%
MATERIAL AND SUPPLY 145,670 67,640 129,150 (16,520) (11.3)%
BUILDING AND GROUND 30,600 31,870 31,730 1,130 3.7%
CONTRACTUAL 5,920 24,240 6,850 930 15.7%
AGENCIES and SUPPORT PAYMENTS 40,950 30,000 15,000 (25,950) (63.4)%
RESERVES / RECOVERIES 21,460 23,270 25,010 3,550 16.5%
COST ALLOCATIONS 13,030 13,030 13,150 120 0.9%
FINANCIAL 26,050 20,860 25,160 (890) (3.4)%
TOTAL EXPENDITURES 6,038,320 4,467,470 6,036,080 (2,240) 0.0%
GRANTS AND SUBSIDIES (1,291,600) (1,288,060) (1,291,600) 0 0.0%
TOTAL REVENUES (1,291,600) (1,288,060) (1,291,600) 0 0.0%
NET LEVY 4,746,720 3,179,410 4,744,480 (2,240) 0.0%
2015 Preliminary vs.
2014 Restated

Public Health Services
Thank-you
66
2015 Budget

67
MANDATORY PUBLIC HEALTH
Public Health Services 2015 Budget