public health in philadelphia: economics, health and ... health in philadelphia: economics, health...
TRANSCRIPT

Public Health in Public Health in Philadelphia:Philadelphia:Economics, Health and Economics, Health and
DisparitiesDisparitiesDonald F. Schwarz, MD, MPHDonald F. Schwarz, MD, MPHDeputy Mayor for Health and Deputy Mayor for Health and
Opportunity and Health CommissionerOpportunity and Health CommissionerCity of PhiladelphiaCity of Philadelphia

OverviewOverview
Interlocking cycles of disadvantage Interlocking cycles of disadvantage Education and opportunityEducation and opportunityHealth and disparitiesHealth and disparitiesProgress Progress Economic crisisEconomic crisisWhere to go from here Where to go from here
Interlocking Cycles of Disadvantage
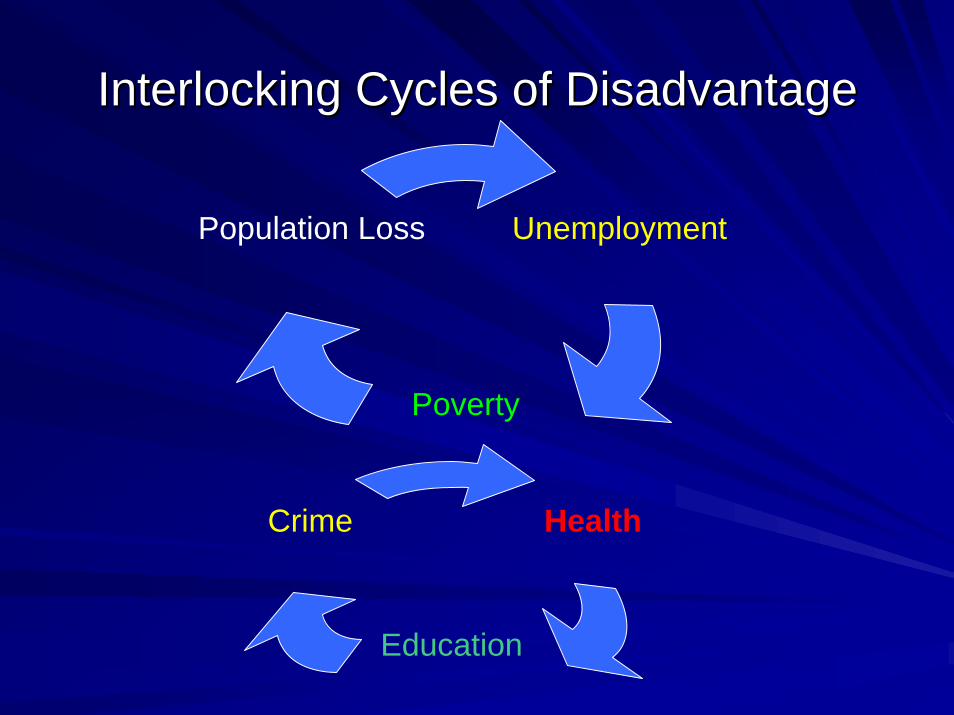
Interlocking Cycles of DisadvantageInterlocking Cycles of Disadvantage
Unemployment
Poverty
Population Loss
Health
Education
Crime

Manufacturing Workers -1980

Manufacturing Workers -1990

Manufacturing Workers -2000
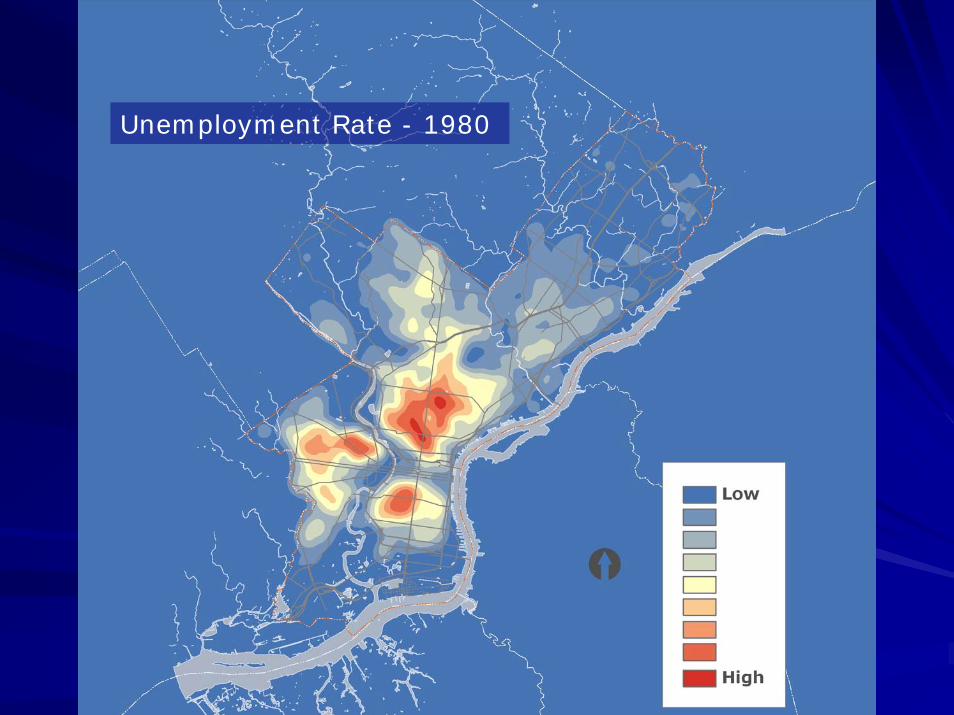
Unemployment Rate - 1980

Unemployment Rate - 1990
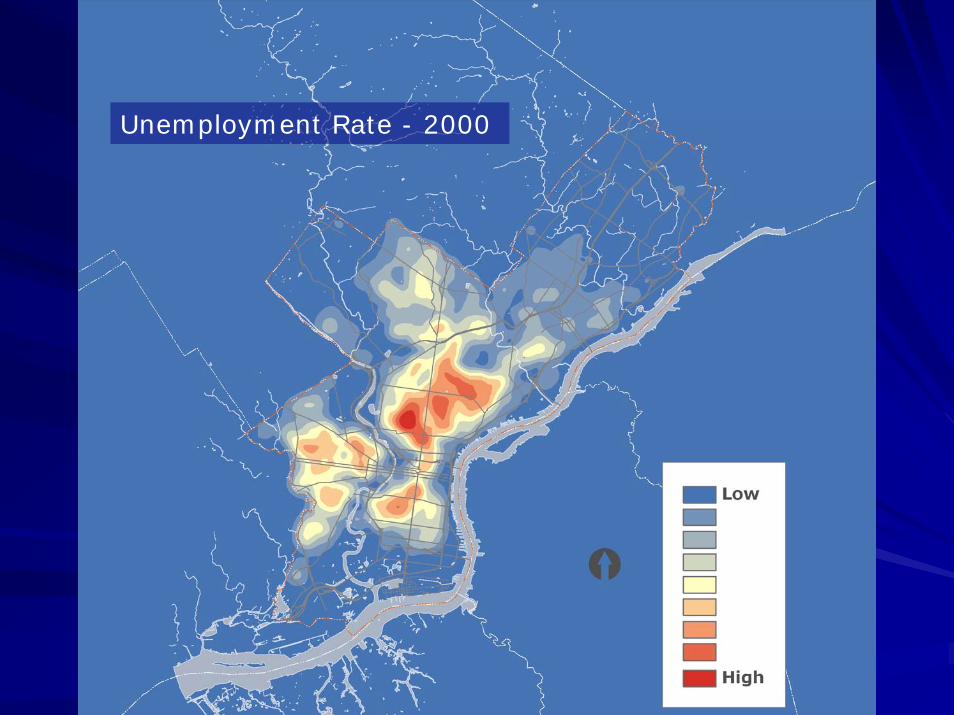
Unemployment Rate - 2000
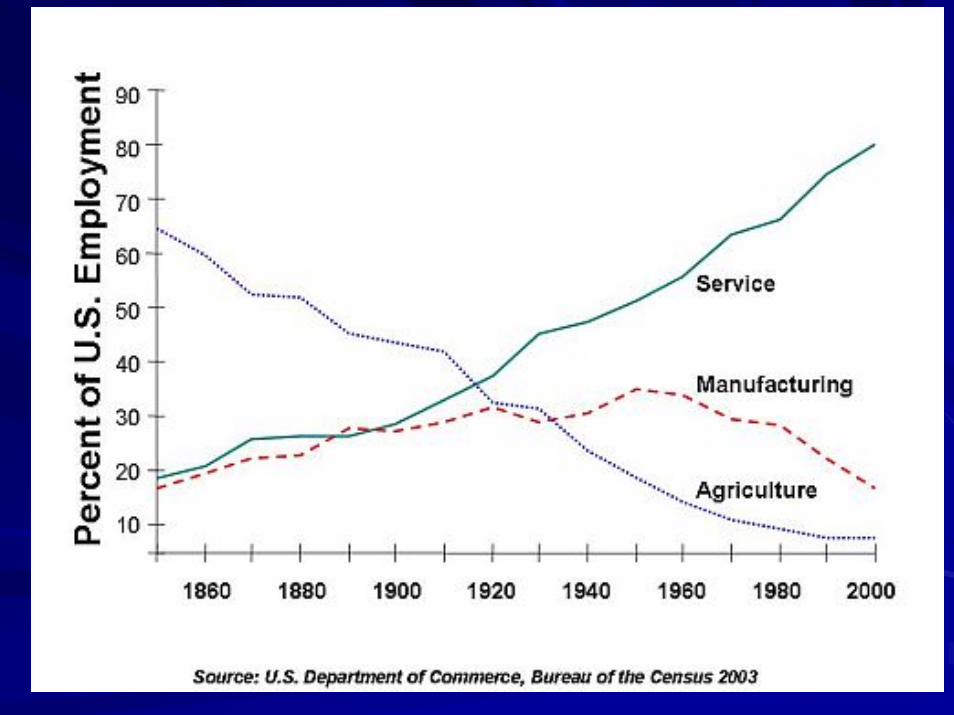

U.S. EmploymentU.S. EmploymentNonNon--farm, average monthly changefarm, average monthly change
9000-35000
-51000-4000
-40000-16000
3000-3000
-17000-27000
25000-17000
60009000
-60000 -40000 -20000 0 20000 40000
Government
Other services
Leisure and hospitality
EDUCATION AND HEALTH SERVICES
Professional and business services
Financial activities
Information
Utilities
Transportation and warehousing
Retail trade
Wholesale trade
Manufacturing
Construction
Natural resources and mining
Source: Bureau of Labor Statistics, Current Employment Statistics Survey, Oct 3, 2008.

Annual Unemployment Rate 1990-2008
0.0
1.0
2.0
3.0
4.0
5.0
6.0
7.0
8.0
9.0
10.0
1990
1992
1994
1996
1998
2000
2002
2004
2006
2008
Perc
enta
ge in
Pov
erty
National Rate PA Rate Philadelphia Rate
ClintonBushBush
Source: US Bureau of the Census, Annual Population Survey, 2008.

Top 10 Most Populous CitiesTop 10 Most Populous CitiesUnemployment, 2007Unemployment, 2007
0
1
2
3
4
5
6
Percent Unemployed
City
PhoenixSan AntonioHoustonDallasSan DiegoNew YorkSan JoseChicagoLos AngelesPhiladelphia
U.S. Bureau of the Census, Annual Population Survey, 2008.

Health Care EmploymentHealth Care EmploymentMonthlyMonthly Change in Growth Rates, 2007 Change in Growth Rates, 2007 vsvs 20082008
-1900
-1200
-1600
-1300
-7700
-4200
-10000 -8000 -6000 -4000 -2000 0
Nursing and Residential Care
Hospitals
Home Health Care Services
Outpatient Care Centers
Offices of Physicians
Ambulatory Health Care Services
Source: Bureau of Labor Statistics, Current Employment Statistics Survey, Oct 3, 2008.

Health Care as a Percent of GNPHealth Care as a Percent of GNP
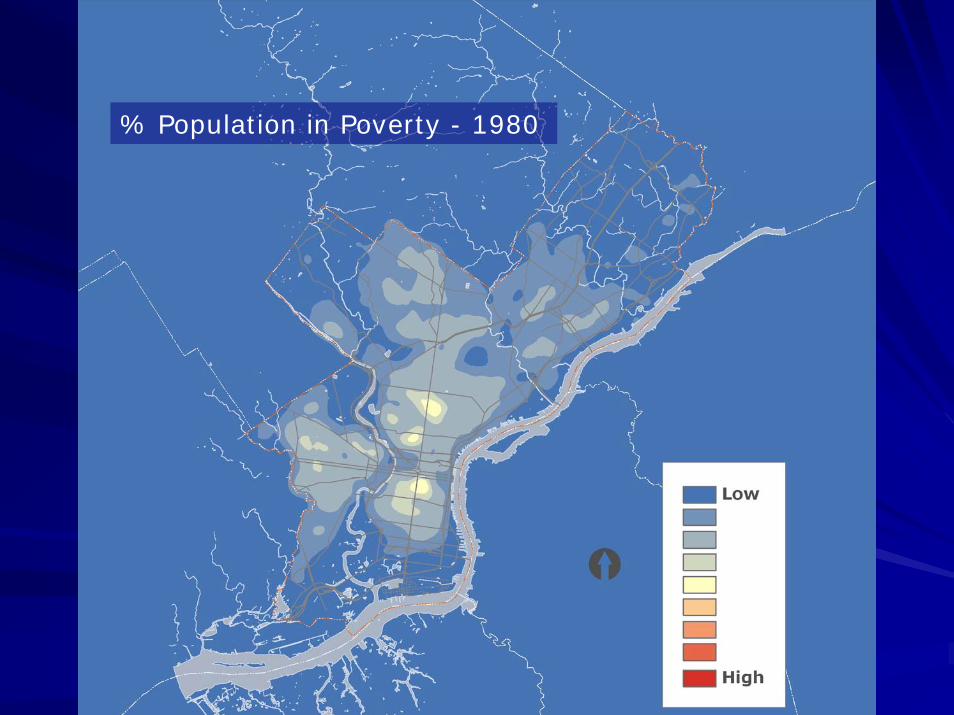
% Population in Poverty - 1980

% Population in Poverty - 1990

% Population in Poverty - 2000
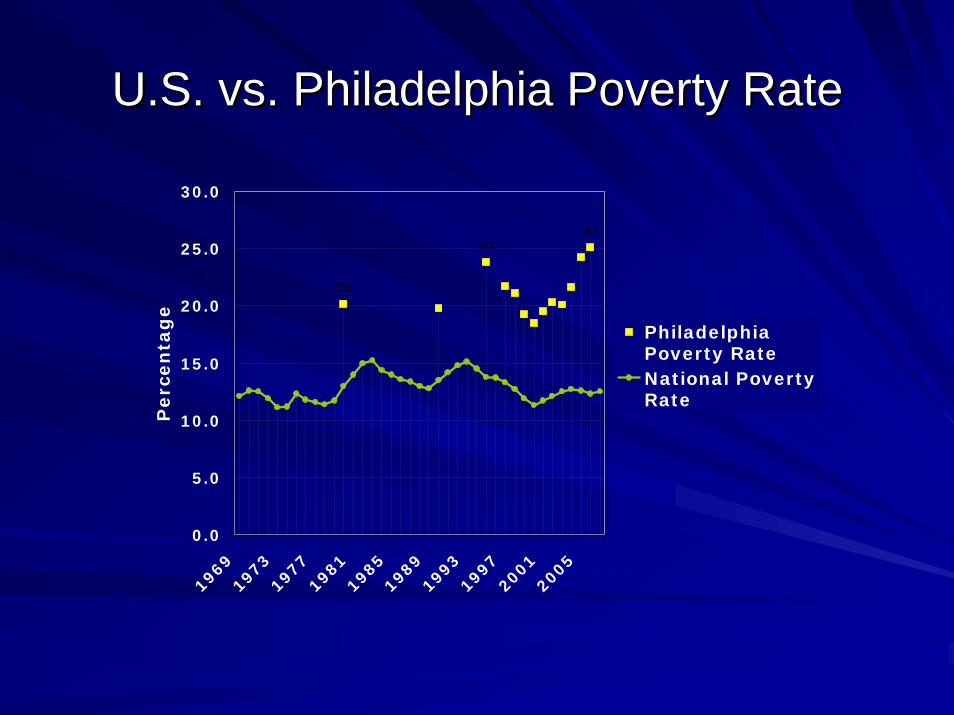
U.S. vs. Philadelphia Poverty RateU.S. vs. Philadelphia Poverty Rate
25.123.8
20.2
0.0
5.0
10.0
15.0
20.0
25.0
30.0
1969
1973
1977
1981
1985
1989
1993
1997
2001
2005
Perc
en
tag
e
PhiladelphiaPoverty RateNational PovertyRate

Top 10 CitiesTop 10 Cities’’ Poverty RatePoverty Rate
0
5
10
15
20
25
Percent in poverty
City
San JoseSan DiegoPhoenixSan AntonioNew YorkChicagoLos AngelesHoustonDallasPhiladelphia
U.S. Bureau of the Census, Annual Population Survey, 2008.

Interlocking Cycles of DisadvantageInterlocking Cycles of Disadvantage
Unemployment
Poverty
Population Loss
Health
Education
Crime

Rate of Population Change: 1980 - 1990

Rate of Population Change: 1990 - 2000

Rate of Population Change: 2000 - 2007
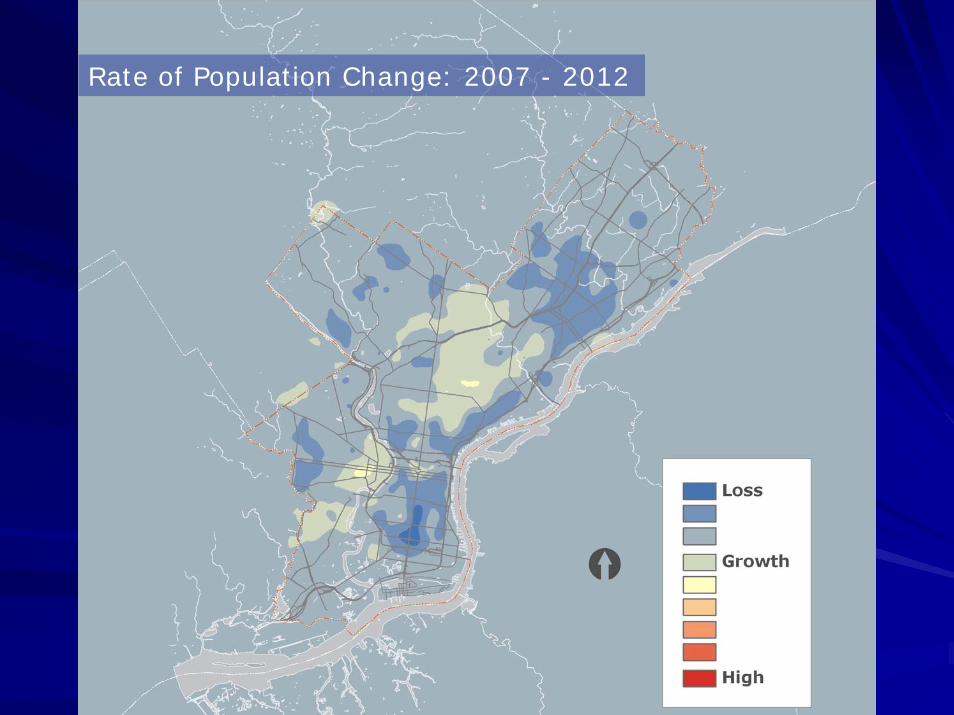
Rate of Population Change: 2007 - 2012

-10
-5
0
5
10
15
20
25
30
35
40
1970-1980 1980-1990 1990-2000
Perc
enta
ge C
hang
e
Native-Born Black Native-Born White Foreign Born
Philadelphia: Impact of ImmigrationPhiladelphia: Impact of Immigration
Source: Katz M, Philadelphia Migration Project; from U.S. Census, 2000.

-30
-20
-10
0
10
20
30
40
50
1970-1980 1980-1990 1990-2000Perc
enta
ge C
hang
e
Foreign Born Native-Born
Philadelphia: Impact of ImmigrationPhiladelphia: Impact of ImmigrationAge 20Age 20--30 Years30 Years
Source: Katz M, Philadelphia Migration Project; from U.S. Census, 2000.

Philadelphia BirthsPhiladelphia BirthsRace/EthnicityRace/Ethnicity
0
2000
4000
6000
8000
10000
12000
14000
1996 1998 2000 2002 2004 2006
WhiteBlackAsianHispanic

10 Largest U.S. Cities10 Largest U.S. CitiesRankRank 19601960 2007200711 New York CityNew York City New York CityNew York City22 ChicagoChicago Los AngelesLos Angeles33 Los AngelesLos Angeles ChicagoChicago44 PhiladelphiaPhiladelphia HoustonHouston55 DetroitDetroit PhoenixPhoenix66 BaltimoreBaltimore PhiladelphiaPhiladelphia77 HoustonHouston San AntonioSan Antonio88 ClevelandCleveland San DiegoSan Diego99 Washington, DCWashington, DC DallasDallas1010 St. LouisSt. Louis San JoseSan Jose

Philadelphia BirthsPhiladelphia Births19601960--20062006
0
5000
10000
15000
20000
25000
30000
35000
40000
45000
50000
1960
1962
1964
1966
1968
1970
1972
1974
1976
1978
1980
1982
1984
1986
1988
1990
1992
1994
1996
1998
2000
2002
2004
2006
2008
Births
0
5
10
15
20
25 Births Per 1,000
Births Birth Rate
Source: City of Philadelphia, Vital Statistics Reports
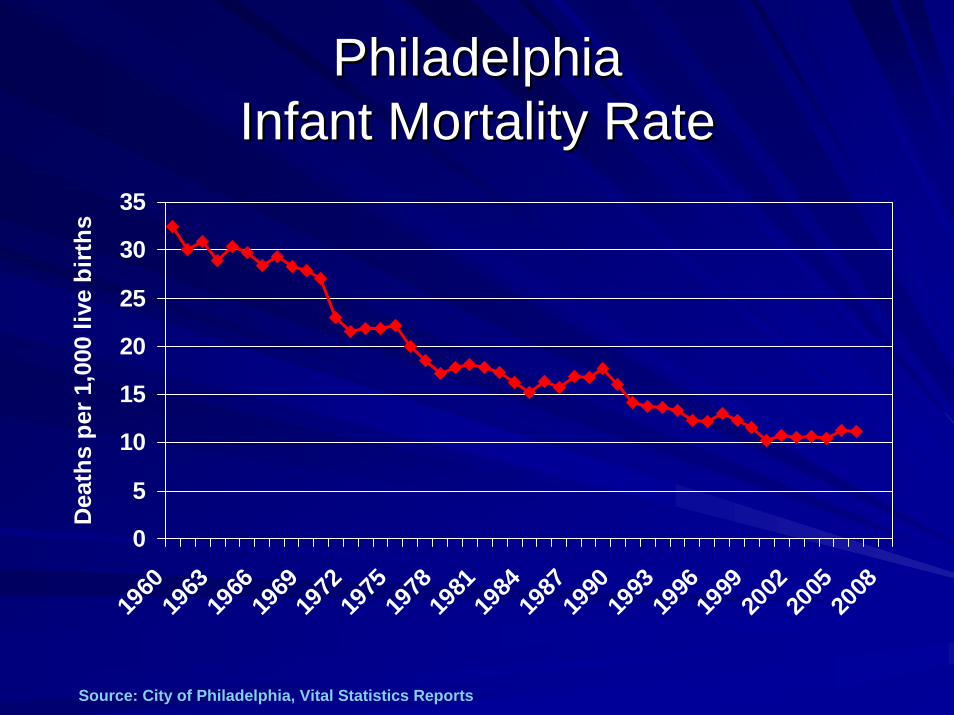
PhiladelphiaPhiladelphiaInfant Mortality RateInfant Mortality Rate
0
5
10
15
20
25
30
35
1960
1963
1966
1969
1972
1975
1978
1981
1984
1987
1990
1993
1996
1999
2002
2005
2008
Dea
ths
per 1
,000
live
birt
hs
Source: City of Philadelphia, Vital Statistics Reports
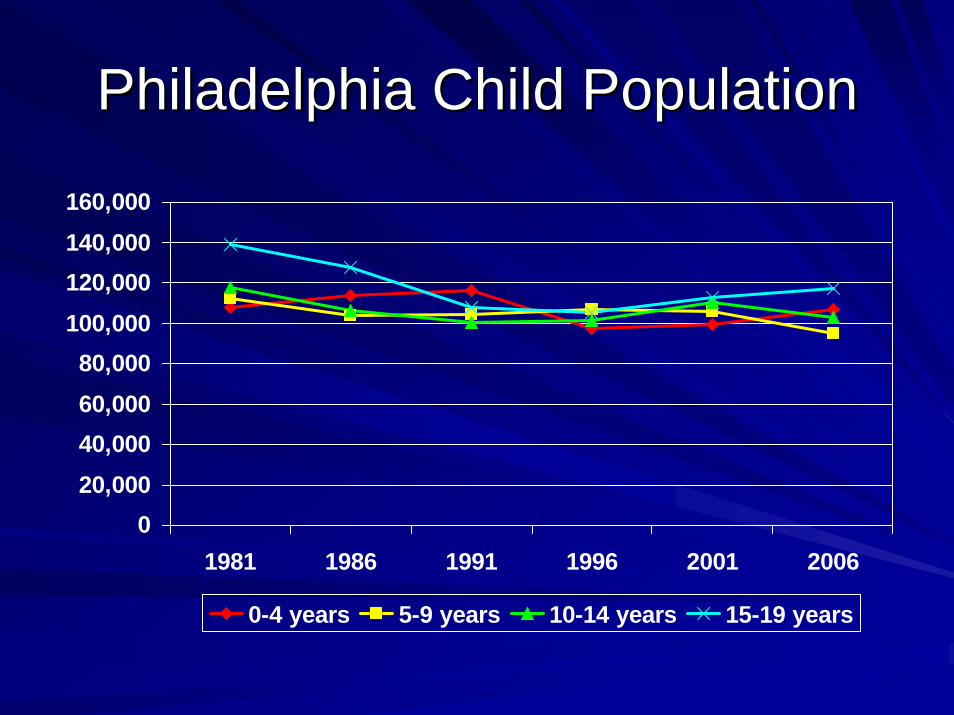
Philadelphia Child PopulationPhiladelphia Child Population
020,00040,00060,00080,000
100,000120,000140,000160,000
1981 1986 1991 1996 2001 2006
0-4 years 5-9 years 10-14 years 15-19 years

Philadelphia Philadelphia Elder:ChildElder:Child RatioRatio
0
0.1
0.2
0.3
0.4
0.5
0.6
1981 1986 1991 1996 2001 2006
Pers
ons
65+/
Birt
h-19
yea
rs

Education and Opportunity

Interlocking Cycles of DisadvantageInterlocking Cycles of Disadvantage
Unemployment
Poverty
Population Loss
Health
Education
Crime

Philadelphia Reading AchievementPhiladelphia Reading AchievementThird GradersThird Graders
0%10%20%30%40%50%60%70%80%90%
100%
2005 2006 2007 2008
Perc
enta
ge
Advanced or Proficient Basic Below Basic
51.6%
48.4%
Source: School District of Philadelphia, 2008.
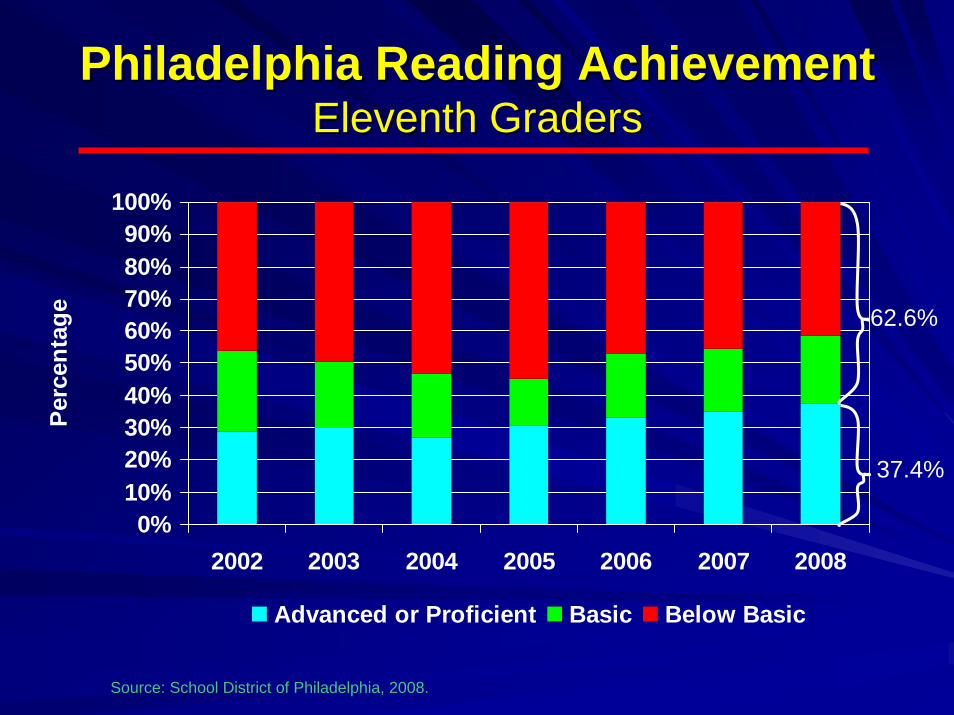
Philadelphia Reading AchievementPhiladelphia Reading AchievementEleventh GradersEleventh Graders
0%10%20%30%40%50%60%70%80%90%
100%
2002 2003 2004 2005 2006 2007 2008
Perc
enta
ge
Advanced or Proficient Basic Below Basic
62.6%
37.4%
Source: School District of Philadelphia, 2008.

Household Income by Educational AttainmentHousehold Income by Educational AttainmentPhiladelphia, 2007Philadelphia, 2007
$19,172$25,647
$32,067
$41,859
$53,826
$31,056
$0
$10,000
$20,000
$30,000
$40,000
$50,000
$60,000
Hou
seho
ld E
arni
ng <HSHS Grad/GEDSome Coll/AssocBachelorsGraduate DegreeAll
U.S. Census Bureau, American Community Survey, 2007.

Unemployment by Educational AttainmentUnemployment by Educational AttainmentPhiladelphia, 2007Philadelphia, 2007
14%
10%
8%
4%
8%
0%
2%
4%
6%
8%
10%
12%
14%
Perc
ent U
nem
ploy
ed
<HSHS Grad/GEDSome Coll/AssocBachelorsAll
U.S. Census Bureau, American Community Survey, 2007.

Poverty Rate by Educational AttainmentPoverty Rate by Educational AttainmentPhiladelphia, 2007Philadelphia, 2007
33%
18%
14%
8% 7%
0%
5%
10%
15%
20%
25%
30%
35%
Perc
ent P
oor <HS
HS Grad/GEDSome Coll/AssocBachelorsGraduate Degree
U.S. Census Bureau, American Community Survey, 2007.

Philadelphia Reading ProficiencyPhiladelphia Reading ProficiencyAll GradesAll Grades
0%10%20%30%40%50%60%70%80%90%
100%
White Black Latino Asian
Basis/Below BasicAdvanced/Proficient
60% 62%
Source: School District of Philadelphia, 2008.
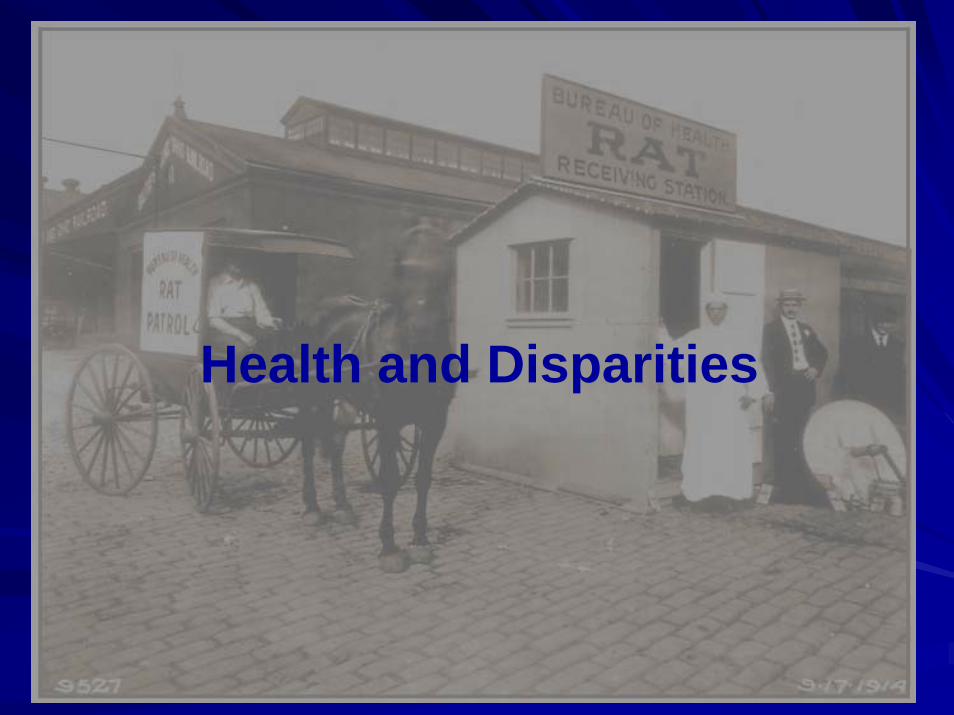
Health and Disparities

Infant MortalityInfant MortalityDeaths before 1 year per 1,000 live birthsDeaths before 1 year per 1,000 live births
0
5
10
15
20
25
30
1986 1991 1996 2001 2006U.S.PA
PhilaW. Phila
Source: City of Philadelphia, Vital Statistics Reports: Centers for Disease Control, Vital Statistics.

U.S. Infant Mortality Rates by CityU.S. Infant Mortality Rates by City
02468
10121416
Detroit
Baltim
ore DCNOLA
Philadelp
hiaChica
goHousto
nNYC LA
1996-19992000-2004

Philadelphia, 1961Philadelphia, 1961--20062006Infant Mortality RateInfant Mortality Rate
05
101520253035404550
1961 1966 1971 1976 1981 1986 1991 1996 2001 2006
WHITEBLACK

Inadequate Prenatal CareInadequate Prenatal CarePercent of births with third trimester or no carePercent of births with third trimester or no care
0
5
10
15
20
1986 1991 1996 2001 2006U.S.PennsylvaniaPhiladelphiaWest Phila
Source: City of Philadelphia, Vital Statistics Reports: Centers for Disease Control, Vital Statistics

Philadelphia BirthsPhiladelphia BirthsPoor Prenatal Care and Low Poor Prenatal Care and Low
BirthweightBirthweight
02468
1012141618
1960
1963
1966
1969
1972
1975
1978
1981
1984
1987
1990
1993
1996
1999
2002
2005
2008
Perc
enta
ge o
f Birt
hs
Low Birthweight Late or No Prenatal Care
Source: City of Philadelphia, Vital Statistics Reports

Homicide RatesHomicide RatesDeaths per 100,000 PopulationDeaths per 100,000 Population
05
10152025303540
1986 1991 1996 2001 2006U.S.PA
PhilaW. Phila
Source: City of Philadelphia, Vital Statistics Reports: Centers for Disease Control, Vital Statistics

Philadelphia, 1961Philadelphia, 1961--20062006Homicide, 15Homicide, 15--19 Year Old Males19 Year Old Males
050
100150200250300350400
1961 1966 1971 1976 1981 1986 1991 1996 2001 2006
WHITE NON-WHITE

Gonorrhea RatesGonorrhea RatesReported cases per 100,000 populationReported cases per 100,000 population
0200400600800
100012001400
1986 1991 1996 2001 2006U.S.PA
PhilaW. Phila
Source: City of Philadelphia, Vital Statistics Reports: Centers for Disease Control, Vital Statistics

Syphilis RatesSyphilis RatesReported Cases per 100,000 populationReported Cases per 100,000 population
050
100150200250300350400450
1986 1991 1996 2001 2006U.S.PA
PhilaW. Phila
Source: City of Philadelphia, Vital Statistics Reports: Centers for Disease Control, Vital Statistics
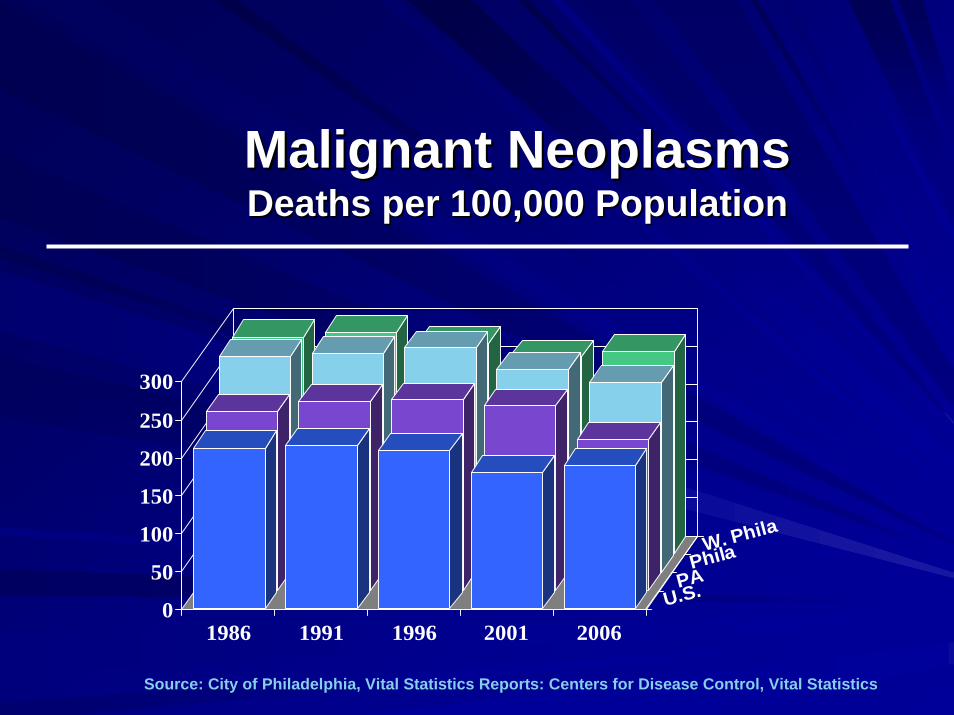
Malignant Malignant NeoplasmsNeoplasmsDeaths per 100,000 PopulationDeaths per 100,000 Population
0
50
100
150
200
250
300
1986 1991 1996 2001 2006U.S.PA
PhilaW. Phila
Source: City of Philadelphia, Vital Statistics Reports: Centers for Disease Control, Vital Statistics

Philadelphia, 1961Philadelphia, 1961--20062006Child Mortality, Ages 5Child Mortality, Ages 5--9 Years9 Years
0
10
20
30
40
50
60
1961 1966 1971 1976 1981 1986 1991 1996 2001 2006
WHITEBLACK

Progress
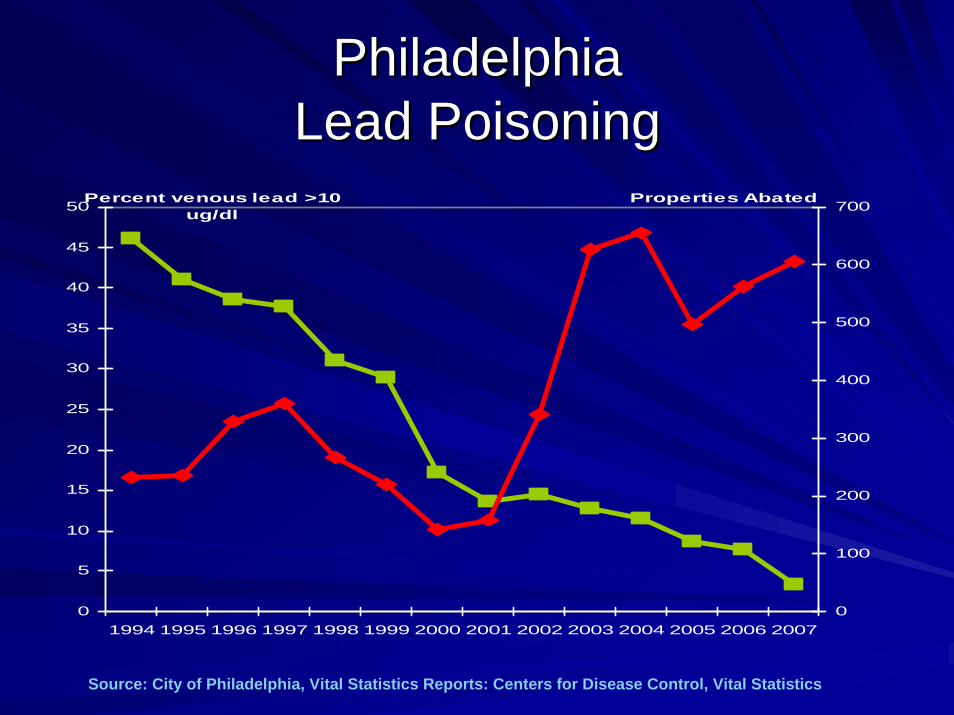
PhiladelphiaPhiladelphiaLead PoisoningLead Poisoning
0
5
10
15
20
25
30
35
40
45
50
1994 1995 1996 1997 1998 1999 2000 2001 2002 2003 2004 2005 2006 2007
Percent venous lead >10 ug/dl
0
100
200
300
400
500
600
700Properties Abated
Source: City of Philadelphia, Vital Statistics Reports: Centers for Disease Control, Vital Statistics
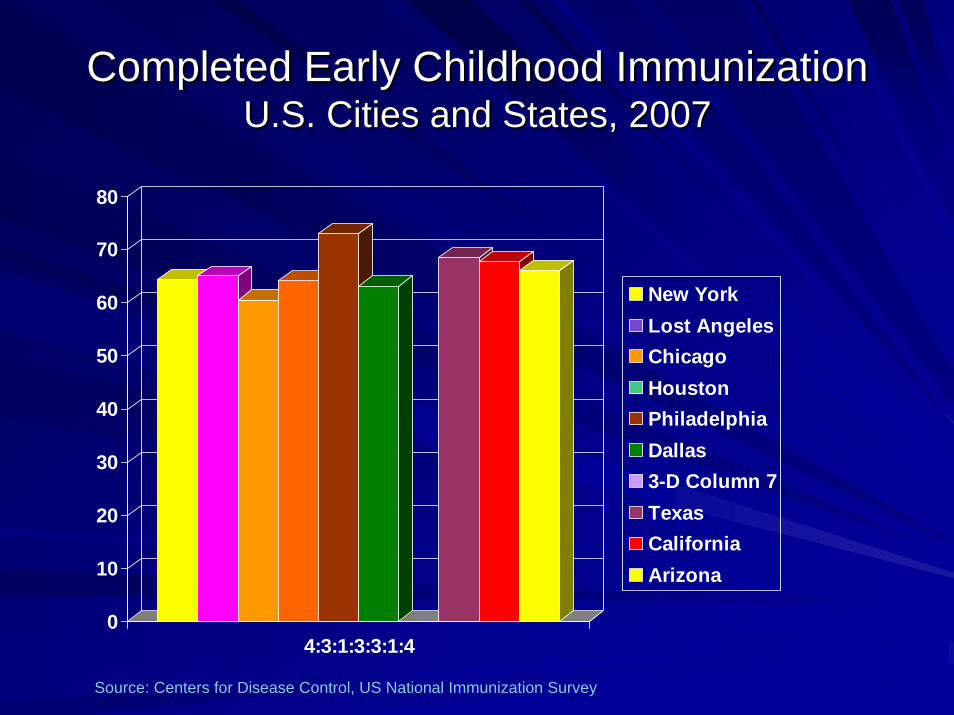
Completed Early Childhood ImmunizationCompleted Early Childhood ImmunizationU.S. Cities and States, 2007U.S. Cities and States, 2007
0
10
20
30
40
50
60
70
80
4:3:1:3:3:1:4
New YorkLost AngelesChicagoHoustonPhiladelphiaDallas3-D Column 7TexasCaliforniaArizona
Source: Centers for Disease Control, US National Immunization Survey

Infant/Toddler Early InterventionInfant/Toddler Early Intervention
0500
1,0001,5002,0002,5003,0003,5004,0004,5005,000
Number
FY2003 FY2004 FY2005 FY2006 FY2007
ReferralsActive
Source: Office of Mental Retardation Services, Philadelphia, 2008.

Economic Crisis
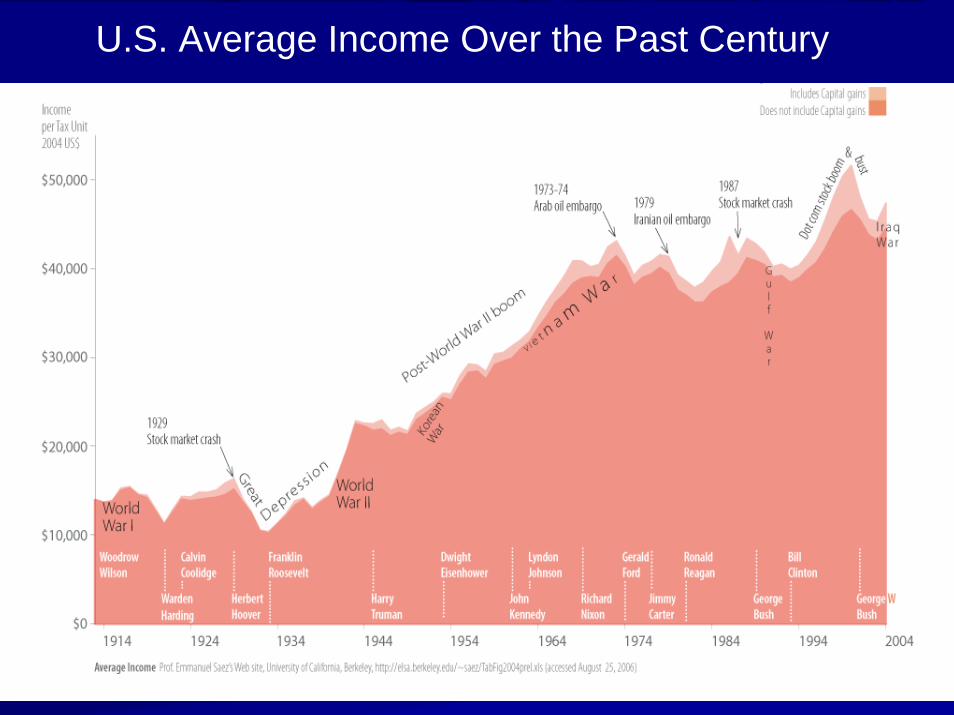
U.S. Average Income Over the Past Century

Differential Spending on ChildrenDifferential Spending on Children
Source: Pati S, Keren R, Alessandrini EA, Schwarz DF, Generational Differences In U.S. Public Spending, 1980-2000, Health Affairs, Vol 23, Issue 5, 131-141.Copyright ©2004 by Project HOPE, all rights reserved.

Source: Pati S, Keren R, Alessandrini EA, Schwarz DF, Generational Differences In U.S. Public Spending, 1980-2000, Health Affairs, Vol 23, Issue 5, 131-141.
Differential Spending on ChildrenDifferential Spending on Children
Copyright ©2004 by Project HOPE, all rights reserved.
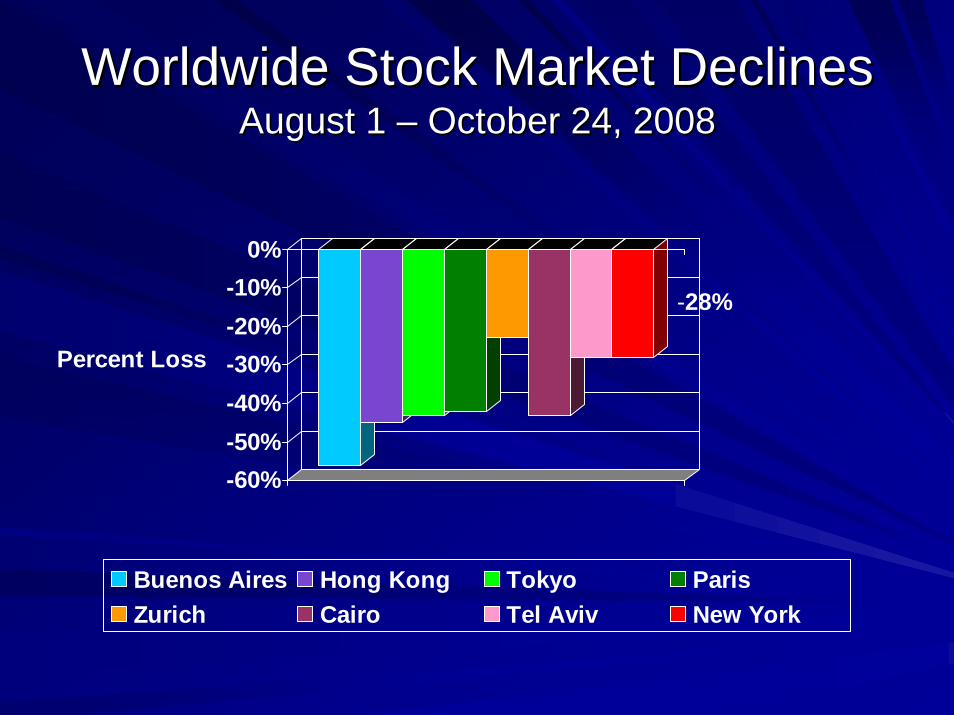
Worldwide Stock Market DeclinesWorldwide Stock Market DeclinesAugust 1 August 1 –– October 24, 2008October 24, 2008
-60%-50%-40%-30%-20%-10%
0%
Percent Loss
Buenos Aires Hong Kong Tokyo ParisZurich Cairo Tel Aviv New York
-28%

Philadelphia Financial ProjectionsPhiladelphia Financial ProjectionsOctober, 2008October, 2008
($900,000)($800,000)($700,000)($600,000)($500,000)($400,000)($300,000)($200,000)($100,000)
$0$100,000$200,000
City Fund Balance
FY08 FY09 FY10 FY11 FY12 FY 13
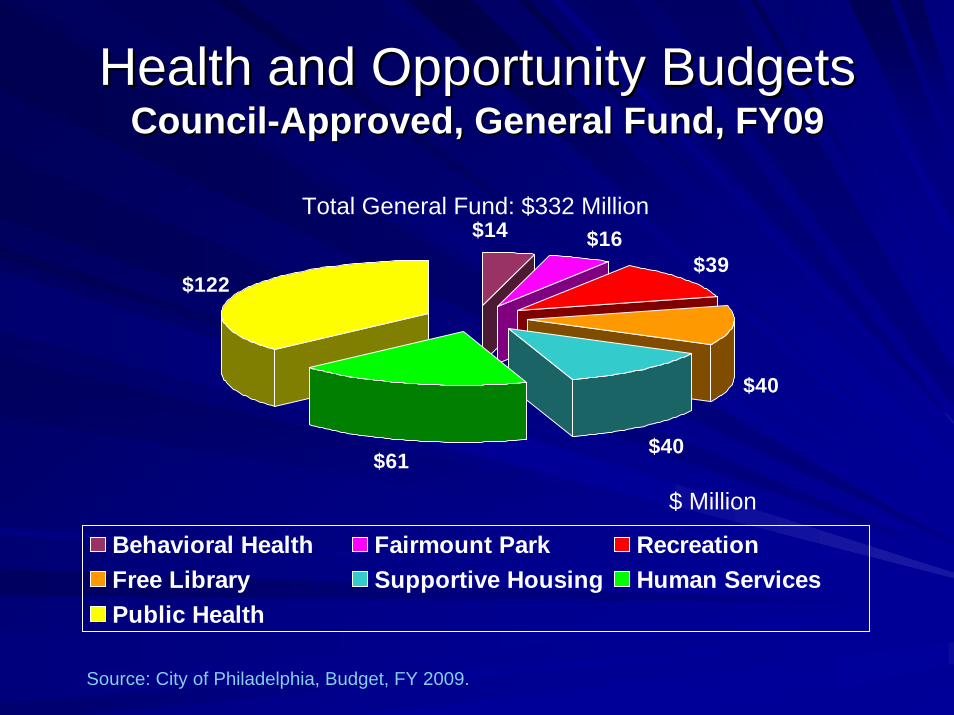
Health and Opportunity BudgetsHealth and Opportunity BudgetsCouncilCouncil--Approved, General Fund, FY09Approved, General Fund, FY09
$16$39
$40
$40$61
$122
$14
Behavioral Health Fairmount Park RecreationFree Library Supportive Housing Human ServicesPublic Health
Total General Fund: $332 Million
$ Million
Source: City of Philadelphia, Budget, FY 2009.

Health and Opportunity BudgetsHealth and Opportunity BudgetsCouncilCouncil--Approved, Grants and Contracts,FY09Approved, Grants and Contracts,FY09
$49
$572
$80$8$58
$16
$1,40
0
Behavioral Health Fairmount Park Free LibraryHuman Services Public Health RecreationSupportive Housing
Total grants andcontracts: $2.183 Billion
$ Million
Source: City of Philadelphia, Budget, FY 2009.
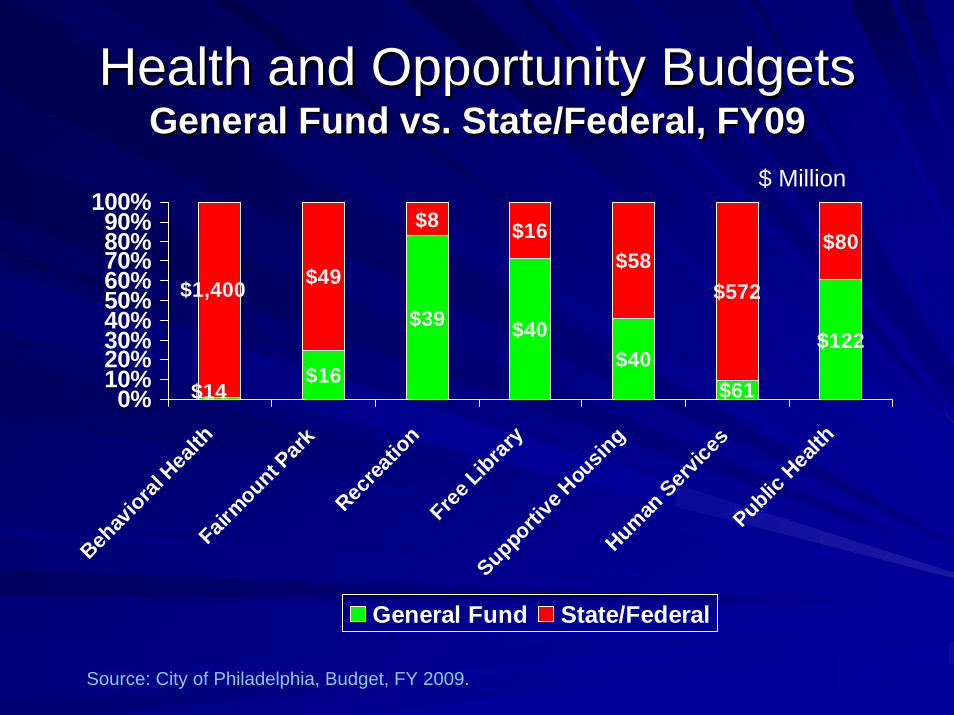
Health and Opportunity BudgetsHealth and Opportunity BudgetsGeneral Fund vs. State/Federal, FY09General Fund vs. State/Federal, FY09
$16
$39 $40$40
$61
$122
$49
$8 $16$58
$572
$80
$14
$1,400
0%10%20%30%40%50%60%70%80%90%
100%
Behav
ioral H
ealth
Fairmount P
ark
Recrea
tion
Free Librar
ySuppo
rtive
Hou
sing
Human Serv
ices
Public H
ealth
General Fund State/Federal
$ Million
Source: City of Philadelphia, Budget, FY 2009.

J. J. Heckman Science 312, 1900 -1902 (2006)
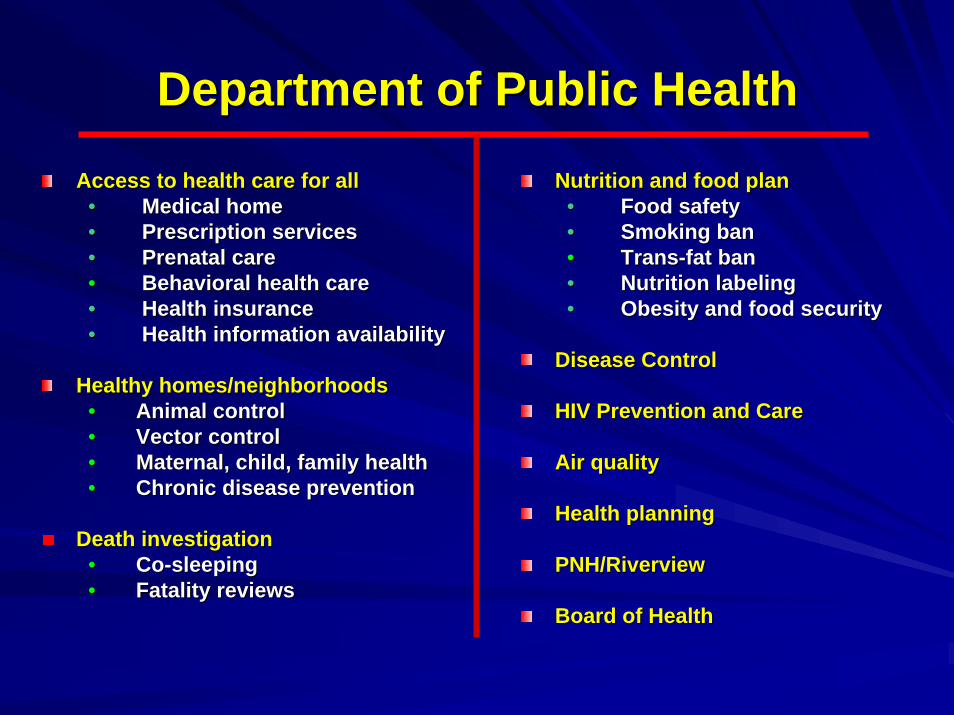
Department of Public HealthDepartment of Public Health
Access to health care for allAccess to health care for all•• Medical homeMedical home•• Prescription servicesPrescription services•• Prenatal carePrenatal care•• Behavioral health care Behavioral health care •• Health insuranceHealth insurance•• Health information availabilityHealth information availability
Healthy homes/neighborhoodsHealthy homes/neighborhoods•• Animal controlAnimal control•• Vector controlVector control•• Maternal, child, family healthMaternal, child, family health•• Chronic disease preventionChronic disease prevention
Death investigationDeath investigation•• CoCo--sleepingsleeping•• Fatality reviewsFatality reviews
Nutrition and food planNutrition and food plan•• Food safetyFood safety•• Smoking banSmoking ban•• TransTrans--fat banfat ban•• Nutrition labeling Nutrition labeling •• Obesity and food securityObesity and food security
Disease ControlDisease Control
HIV Prevention and CareHIV Prevention and Care
Air qualityAir quality
Health planningHealth planning
PNH/RiverviewPNH/Riverview
Board of HealthBoard of Health

Continuum of PreventionContinuum of PreventionPrimary Prevention for all
Secondary Prevention for those at risk
Tertiary Prevention for those affected
•Immunization•Food quality •Air quality management•Ambulatory health
•Lead poisoning prevention•STD screeningTargeted home visitingAmbulatory health
•TB control•Philadelphia Nursing Home•Vector Control •Ambulatory health

Health and OpportunityHealth and OpportunityOperating PrinciplesOperating Principles
Service delivery in a context of Service delivery in a context of preventionpreventionFamilyFamily--focused interventions to promote focused interventions to promote child and community wellchild and community well--beingbeingBestBest--practicespracticesCommunityCommunity--partneredpartneredEmphasis on costEmphasis on cost--effective programmingeffective programmingCrossCross--agency collaborationagency collaborationLive within a budgetLive within a budget

Key OutcomesKey Outcomes
Every child will enter kindergarten Every child will enter kindergarten ready to learn through investment in ready to learn through investment in familiesfamilies
Every 18 yearEvery 18 year--old will graduate from old will graduate from high schoolhigh school
Every senior will feel safe at home Every senior will feel safe at home
Every Philadelphian will have a homeEvery Philadelphian will have a home
