public health assessment - ldh.la.gov
TRANSCRIPT

Public Health Assessment
Review of Data from the 2010 EPA Mossville Site Investigation Mossville, Calcasieu Parish, Louisiana
Prepared by
Louisiana Department of Health and Hospitals
JULY 9, 2013
COMMENT PERIOD ENDS: SEPTEMBER 9, 2013
Prepared under a Cooperative Agreement with the U.S. DEPARTMENT OF HEALTH AND HUMAN SERVICES
Agency for Toxic Substances and Disease Registry Division of Community Health Investigations
Atlanta, Georgia 30333
Initial/Public Comment Release

THE ATSDR PUBLIC HEALTH ASSESSMENT: A NOTE OF EXPLANATION This Public Health Assessment-Public Comment Release was prepared by ATSDR pursuant to the Comprehensive Environmental Response, Compensation, and Liability Act (CERCLA or Superfund) section 104 (i)(6) (42 U.S.C. 9604 (i)(6), and in accordance with our implementing regulations (42 C.F.R. Part 90). In preparing this document, ATSDR’s Cooperative Agreement Partner has collected relevant health data, environmental data, and community health concerns from the Environmental Protection Agency (EPA), state and local health and environmental agencies, the community, and potentially responsible parties, where appropriate. This document represents the agency’s best efforts, based on currently available information, to fulfill the statutory criteria set out in CERCLA section 104 (i)(6) within a limited time frame. To the extent possible, it presents an assessment of potential risks to human health. Actions authorized by CERCLA section 104 (i)(11), or otherwise authorized by CERCLA, may be undertaken to prevent or mitigate human exposure or risks to human health. In addition, ATSDR’s Cooperative Agreement Partner will utilize this document to determine if follow-up health actions are appropriate at this time. This document has now been released for a 60-day public comment period. Subsequent to the public comment period, ATSDR’s Cooperative Agreement Partner will address all public comments and revise or append the document as appropriate. The public health assessment will then be reissued. This will conclude the public health assessment process for this site, unless additional information is obtained by ATSDR’s Cooperative Agreement Partner which, in the agency’s opinion, indicates a need to revise or append the conclusions previously issued. Use of trade names is for identification only and does not constitute endorsement by the U.S. Department of Health and Human Services.
Please address comments regarding this report to:
Agency for Toxic Substances and Disease Registry Attn: Records Center
1600 Clifton Road, N.E., MS F-09 Atlanta, Georgia 30333
You May Contact ATSDR Toll Free at 1-800-CDC-INFO or
Visit our Home Page at: http://www.atsdr.cdc.gov

Mossville Site Investigation Initial/Public Comment Release
PUBLIC HEALTH ASSESSMENT
Review of Data from the 2010 EPA Mossville Site Investigation Mossville, Calcasieu Parish, Louisiana
Prepared by:
Louisiana Department of Health and Hospitals Office of Public Health
Section for Environmental Epidemiology and Toxicology Under Cooperative Agreement with the
U.S. Department of Health and Human Services Agency for Toxic Substances and Disease Registry
This information is distributed solely for the purpose of predissemination public comment under applicable information quality guidelines. It has not been formally disseminated by the Agency for Toxic Substances and Disease Registry. It does not represent and should not be construed to represent any agency determination or policy.

EPA Mossville SI Review
ii
Table of Contents List of Acronyms ........................................................................................................................................ iii Summary ...................................................................................................................................................... 4 Statement of Issue and Purpose ................................................................................................................. 7 Background ................................................................................................................................................. 7 Community Concerns ................................................................................................................................. 8 Demographics .............................................................................................................................................. 9 Discussion .................................................................................................................................................... 9
Data Used ............................................................................................................................................... 10 Data Limitations ..................................................................................................................................... 12 Evaluation Process .................................................................................................................................. 15 Health Effects Evaluation ....................................................................................................................... 15
Child Health Considerations .................................................................................................................... 19 Conclusions ................................................................................................................................................ 20 Recommendations ..................................................................................................................................... 21 Public Health Action Plan ........................................................................................................................ 21 Report Preparation ................................................................................................................................... 23 References .................................................................................................................................................. 24 APPENDIX A: Maps ................................................................................................................................ 26 APPENDIX B: Chronology of Events ..................................................................................................... 32 APPENDIX C: Data Evaluation .............................................................................................................. 42 APPENDIX D: Toxicological Summaries ............................................................................................... 70

EPA Mossville SI Review
iii
List of Acronyms
2,3,7,8-TCDD 2,3,7,8-tetrachlorodibenzo-p-dioxin AOI area of interest ATSDR Agency for Toxic Substances and Disease Registry BaP benzo(a)pyrene CDC Centers for Disease Control COC contaminant of concern CREG Cancer Risk Evaluation Guide EMEG Environmental Media Evaluation Guide ft bgs feet below ground surface LDEQ Louisiana Department of Environmental Quality LDHH Louisiana Department of Health and Hospitals MEAN Mossville Environmental Action Now mg/kg/day milligrams per kilogram per day mg/L milligrams per liter MRL minimal risk levels NPL National Priorities List NEJAC National Environmental Justice Advisory Council OPH Office of Public Health PAH polycyclic aromatic hydrocarbon PCB polychlorinated biphenyl ppb parts per billion ppm parts per million QA/QC quality assurance/quality control RECAP Risk Evaluation/Corrective Action Program RfD reference dose RMEG Reference dose Media Evaluation Guide RSL Regional Screening Level SEET Section of Environmental Epidemiology and Toxicology SVOC semivolatile organic compound TEF toxicity equivalency factor TEQ toxicity equivalency quotient US EPA United States Environmental Protection Agency VOC volatile organic compound WW Water Works

EPA Mossville SI Review
4
Summary
Introduction Members of the community of Mossville, LA have expressed concerns about environmental health issues related to potential exposures to chemical releases from industrial facilities in nearby Westlake and Lake Charles, LA. At the community’s request, the United States Environmental Protection Agency (US EPA) sampled water, sediment, soil, and soil gas from the Mossville community. Data collected from these sampling events was summarized in the EPA document, “Site Inspection: Mossville, North of Highway 90, Sulphur and Westlake, Calcasieu Parish, Louisiana”.
Through our cooperative agreement with the Agency for Toxic Substances and Disease Registry (ATSDR), the Louisiana Department of Health and Hospitals/Office of Public Health/Section of Environmental Epidemiology and Toxicology (LDHH/OPH/SEET) has evaluated the samples collected from the Mossville area of interest (AOI). LDHH/OPH/SEET’s review of this data was performed to determine whether the soil, sediment, or water in Mossville contains concentrations of contaminants that could pose harm to public health.
Conclusion Having reviewed the data collected for the 2010 Mossville Site Inspection, SEET has arrived at the following conclusions:
1. A number of the analytes reported as non-detects were analyzed using method detection limits that were higher than the comparison values used as screening tools. These contaminants may still have been present in concentrations that the screening process would identify as requiring further evaluation.
2. Current exposures to the chemical levels found in municipal water samples from the Mossville AOI are not expected to harm people’s health. A very small increase in cancer risk was estimated for a lifetime exposure to trihalomethane levels detected at Parcels 05 and 08, but the average concentrations of trihalomethanes present over time is not likely be high enough to result in these estimated increases.
3. Contaminants detected in surface water and sediment from the three manmade ponds sampled in the Mossville AOI pose no harm to public health.

EPA Mossville SI Review
5
4. Childhood exposures to lead should be kept as low as possible to prevent lead poisoning. Children’s exposure to lead-contaminated soil in the Mossville AOI can be limited by covering the bare soil with grass, bushes, or 4-6 inches of lead-free wood chips, mulch, soil, or sand, or by preventing children from coming into contact with the source of lead contamination.
Basis for Decision
1. Depending upon how low the analytical method detection limits are, contaminants reported as non-detects may still be present in concentrations that the health-based screening process would identify as requiring further evaluation.
2. Trihalomethanes are a regulated byproduct of water disinfection and are not likely to pose a significant exposure to community members.
3. The contaminants detected in the ponds pose no harm to public health. Community members are also not exposed to the water or sediment in the ponds for significant periods over time.
4. Limiting children’s contact with bare soil can protect them from exposure to soil lead.
Next Steps The use of lower method detection limits in the analysis of future samples collected from the Mossville AOI would allow for a more complete screening of any contaminants present to determine whether further evaluation is needed.
Resampling of municipal water from Mossville would be useful in determining whether trihalomethanes resulting from water disinfection are consistently present at concentrations that could pose harm to public health.
If there is strong evidence that fish from the three ponds in the Mossville AOI are a significant part of the community’s diet, then a larger number of fish samples should be collected from these ponds to evaluate whether the fish being consumed are accumulating contaminants that may pose harm to public health..
If additional soil gas sampling is performed using a method that measures the concentrations of any contaminants vaporizing from the soil, SEET is available to assess the soil

EPA Mossville SI Review
6
gas contaminant concentrations detected at the site.
Further sampling of the soils in Parcels 4 and 10 could be used to determine whether the concentrations of cadmium, copper, and lead that were of concern in this assessment are an accurate reflection of the average concentrations of these metals found throughout these properties.
SEET will be available to assess samples collected in further investigations or assessments performed in Mossville, LA.
The information within this public health assessment will be made available to the community members and stakeholders in Mossville, LA.
For More Information If you have further concerns about the site, you can call ATSDR at 1-800-CDC-INFO and ask for information about the Mossville community. Questions may also be directed to LDHH/OPH/SEET at 1-888-293-7020.

EPA Mossville SI Review
7
Statement of Issue and Purpose
Residents of Mossville, Calcasieu Parish, Louisiana are concerned about how their quality of life and health may have been impacted by long-term exposure to contaminants migrating from the factories adjacent to their community. Of particular concern are accidental and historical releases of dioxin. To address Mossville community concerns, the EPA performed a Site Investigation in Mossville in April 2010. The Site Investigation was designed to evaluate whether conditions in Mossville pose a threat to human health and the environment, to determine the need for additional investigation, and, if appropriate, to support site evaluation for proposal to the National Priorities List (NPL). The results of the investigation were released in a May 3, 2011 document, “Site Inspection: Mossville, North of Highway 90, Sulphur and Westlake, Calcasieu Parish, Louisiana”. The Louisiana Department of Health and Hospitals/Office of Public Health/Section of Environmental Epidemiology (LDHH/OPH/SEET) has reviewed data from the Site Investigation to assess whether conditions in Mossville may pose harm to public health.
Background
Mossville, LA is a historically African-American community said to have been founded in the late 1790’s by the descendants of slaves. Mossville is located in an unincorporated area near the cities of Westlake and Sulphur in Calcasieu Parish, LA (see Appendix A, Figure A-1) [1, 2]. A primarily residential community, Mossville is situated near a number of chemical refineries. Industrial development began in this portion of Calcasieu Parish in the 1920’s, following the local discovery of petroleum and gas reserves [2]. Figure A-2 shows the locations of a number of industrial sites within a five mile radius of the community. These industrial sites include factories operated by Sasol North America Inc., Georgia Gulf Lake, ConocoPhillips Co., Lyondale Chemical Co., and PPG Industries, Inc [3].
At the May 1997 meeting of the National Environmental Justice Advisory Council (NEJAC), a representative from the Mossville Environmental Action Now (MEAN) community group presented concerns about environmental justice issues within the Mossville community. The representative described the lack of proper drainage and sewage systems, health issues experienced by community members, and the pollution problems attributed to the industries surrounding the community [4]. Following recommendations from NEJAC, the United States Environmental Protection Agency (US EPA) and the Agency for Toxic Substances and Disease Registry (ATSDR) began to work with the community to identify the health impacts that historical and current industrial releases may have caused in the community [5]. SEET and the Louisiana Department of Environmental Quality (LDEQ) have joined the federal agencies in working to address the concerns of the Mossville community and to identify any health hazards posed by current or historical releases of contaminants to the environment. Appendix B outlines the chronology of activities performed by these agencies and others in the Mossville community.

EPA Mossville SI Review
8
The latest environmental investigation in Mossville, the April 2010 EPA Site Investigation, was performed in an area of interest (AOI) located west and northwest of chemical plants in Westlake and northern Lake Charles (see Figure A-1). This AOI is predominantly residential, with a few commercial properties and some areas of woodlands. The approximately 1.5 square mile area is bounded by Village Orphanage to the north, the KCS Railroad tracks to the south, VCM Plant Road to the east, and Junius Road to the west. One thousand six hundred properties are located within these boundaries on Old Spanish Trail/Burton Road, Prater Road, Evergreen Road, and LA 108N Cities Service Highway. The majority of these properties are privately owned. In the easternmost portion of the AOI, in a subdivision known as the Bel Air Subdivision (bounded by Ringmaiden Rd., Old Spanish Trail Rd., VCM Plant Rd., and 7th/8th Street), 295 of the 329 lots are currently owned by Sasol North America; the majority of the structures on these lots have been removed, and access to many of the streets are blocked [2].
Community Concerns
Mossville community members worry that the proximity of a number of industrial facilities to the Mossville community has an impact on their health and quality of life. Community members have expressed concern that their sources of food and water as well as their residences have been contaminated by potentially harmful releases of chemicals from industrial facilities.
Dioxin has been of particular concern to the Mossville community. Dioxins, or chlorinated dibenzo-p-dioxins, are a family of compounds that are found at low levels everywhere in the environment. The most toxic of the dioxins is 2,3,7,8-tetrachlorodibenzo-p-dioxin (2,3,7,8-TCDD), which is classified as “Carcinogenic to humans (sufficient human evidence)” by the International Agency for Research on Cancer and the National Toxicology Program. Dioxin can be produced during incomplete combustion such as forest fires, cigarette smoking, and industrial or municipal incineration processes. Dioxins also occur as a byproduct of manufacturing processes that use chlorinated organic chemicals. Exposure to high levels of dioxin can cause chloracne (a severe skin disease characterized by acne-like lesions), rashes, skin discoloration, and excessive body hair. High dioxin exposures can also result in alterations in metabolism and changes in hormone levels. Studies have shown that exposures to high levels of 2,3,7,8-TCDD may increase the risk of cancer in people [6]. In the late 1990’s the ATSDR began an exposure investigation to see if residents of Mossville were being exposed to high levels of dioxin. A follow-up exposure investigation was published in 2006. Through these investigations, ATSDR made the following conclusions:
No dioxin was found in water sampled from three local wells. The levels of dioxin found in soil, indoor dust, and locally raised nuts, fruit, and
vegetables did not increase between the two exposure investigations and were not present at levels of concern.

EPA Mossville SI Review
9
Locally caught fish contained high levels of dioxins. Residents were cautioned to follow safety precautions about eating those fish.
No link was found between the level of dioxin in a person’s blood and the level of dioxin in their home environment.
Residents older than 45 years did have higher levels of dioxin in their blood, but not enough to cause illness.
Most persons’ blood dioxin level decreased since they were first tested [7].
Demographics
According to US Census tract data accessed in 2009 for the EPA Site Inspection report, the population within the Mossville AOI is 665, and the population within a 1-mile radius of the Mossville AOI is 6,287 [2]. The US Census Bureau does not report data for unincorporated cities; therefore, more recent detailed demographic information for Mossville is not currently available.
A visual on-site count of homes performed in 2009 by EPA Region 6 staff yielded an approximate total of 215 homes within the AOI:
Three homes were located in the area bounded by VCM Plant Road/Rigmaiden Avenue/Old Spanish Trail/8th Avenue.
Two hundred and six homes were located in the area bounded by Junius Road/Rigmaiden Road/Highway 90/Village Orphanage Road; one of these homes was later destroyed by fire.
Six homes were located on Evergreen Road outside of the Village Orphanage Road boundary [8].
Within the AOI there is one school, A Child’s Reflection, which is a daycare and preschool located at 943 Prater Road in Sulphur, LA, 70663, in the southern portion of the site (see Figure A-1) [9]. The Rigmaiden Recreation Center is also located within the AOI [2].
Discussion
Because there are no records indicating that wastes from the chemical plants have been disposed of within the AOI, any contamination within the Mossville AOI is likely to be due to deposition from industrial air emissions to local soils [2]. EPA therefore sampled soil from several locations throughout the AOI. Due to the residents’ concerns regarding local water quality, EPA also sampled groundwater, municipal water, and surface water and sediment. Soil gas samples, which measure the concentrations of contaminants present in the air space between soil particles, were collected as a result of comments received on the EPA Quality Assurance Sampling Plan for the scheduled sampling

EPA Mossville SI Review
10
events. One fish sample was also collected after residents reported that some fishing occurs in the ponds from which surface water samples were collected [2].
Data Used
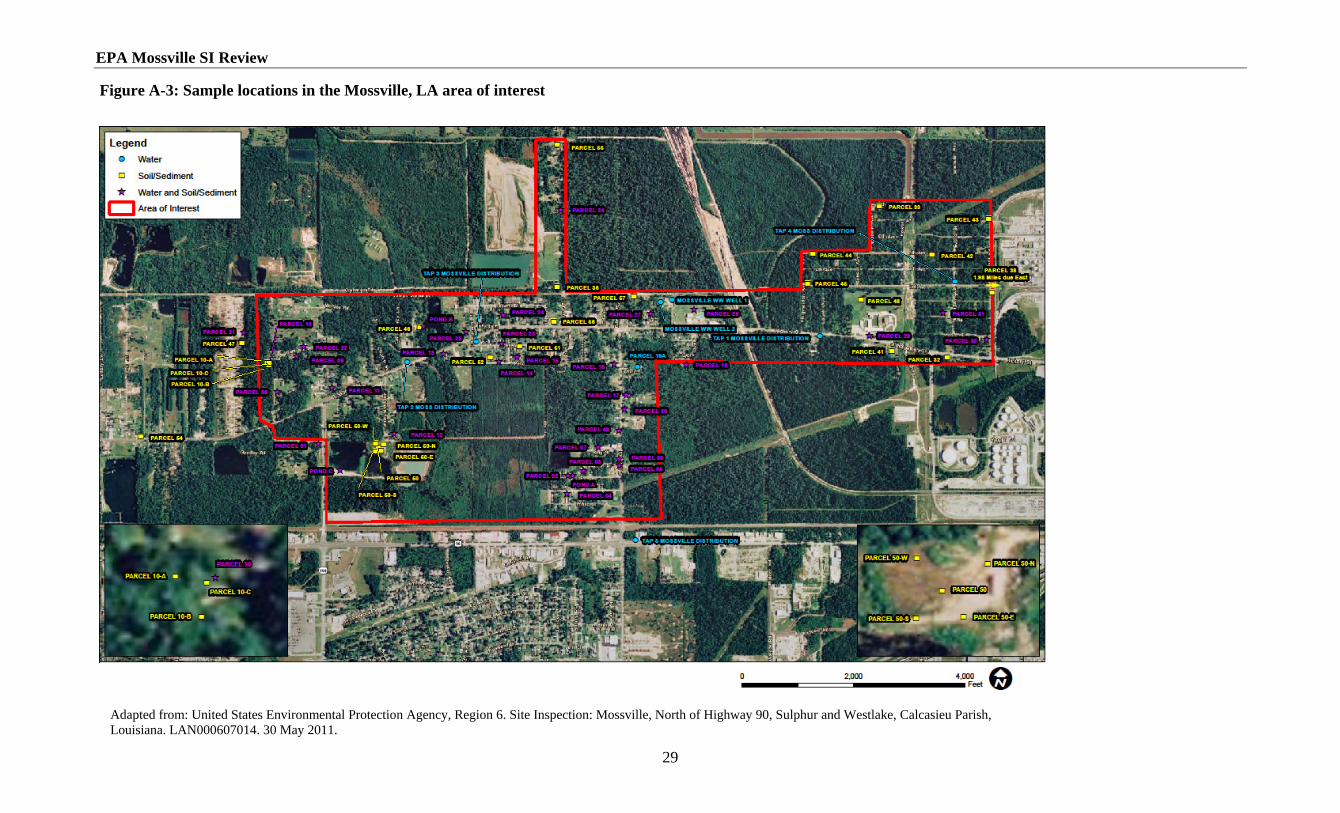
All samples for the EPA Site Inspection of Mossville were collected and analyzed using EPA’s rigorous quality assurance/quality control (QA/QC) procedures [2]. Figure A-3 summarizes the sample sources and locations. All samples, excluding groundwater samples from the residential wells and soil gas samples, were analyzed for dioxins and furans, polychlorinated biphenyls (PCBs), semivolatile organic compounds (SVOCs), pesticides, volatile organic compounds (VOCs), and metals. The residential well water samples were analyzed for all of these compounds excluding dioxins. Soil gas samples were analyzed for VOC content only [2].
The original dioxin samples collected on the initial sampling dates for groundwater, municipal water, surface water, sediment, and soil were rejected from analysis because of QA issues. A final round of sampling was conducted from August 16 – August 20, 2010 for dioxin analysis only. The dioxin concentrations SEET assessed were therefore from samples collected from August 16 – August 20, 2010 [2].
Groundwater
Treated groundwater was collected from the taps at the Westlake Community Center, which originates from wells outside the AOI and served as the background sample for groundwater [2].
Groundwater sampled from the Mossville AOI was collected at the tap nearest each well before any water treatment. On April 28-29, 2010, samples were collected from two residential wells in the AOI. Two samples were collected from a well located in Parcel 36 and one sample was collected from a well located in Parcel 40 [2]. On April 28- 29, 2010, samples were collected from two public supply wells in the Mossville AOI. One sample was collected from Mossville Water Works (WW) Well 1 and two samples were collected from Mossville WW Well 2. Samples were re-collected from these wells on August 17, 2010, for dioxin analysis only [2].
Municipal water
Treated groundwater collected from the taps at the Westlake Community Center, which originates from wells outside the AOI, also served as the background sample for assessment of the municipal water samples [2].
The evaluation of the municipal water system was conducted to document the system’s current compliance status with the requirements of the Safe Drinking Water Act and the ability of the water system to achieve future compliance. Distribution system samples were collected from five distribution system monitoring locations during the April and August 2010 sampling events. Residential water samples were collected directly from

EPA Mossville SI Review
11
indoor or outdoor taps at 33 residential Mossville properties in April 2010 and at 8 residential properties in August 2010 [2].
Surface Water and Sediment
No background samples were taken for comparison to surface water and sediment sampled from ponds within the Mossville AOI.
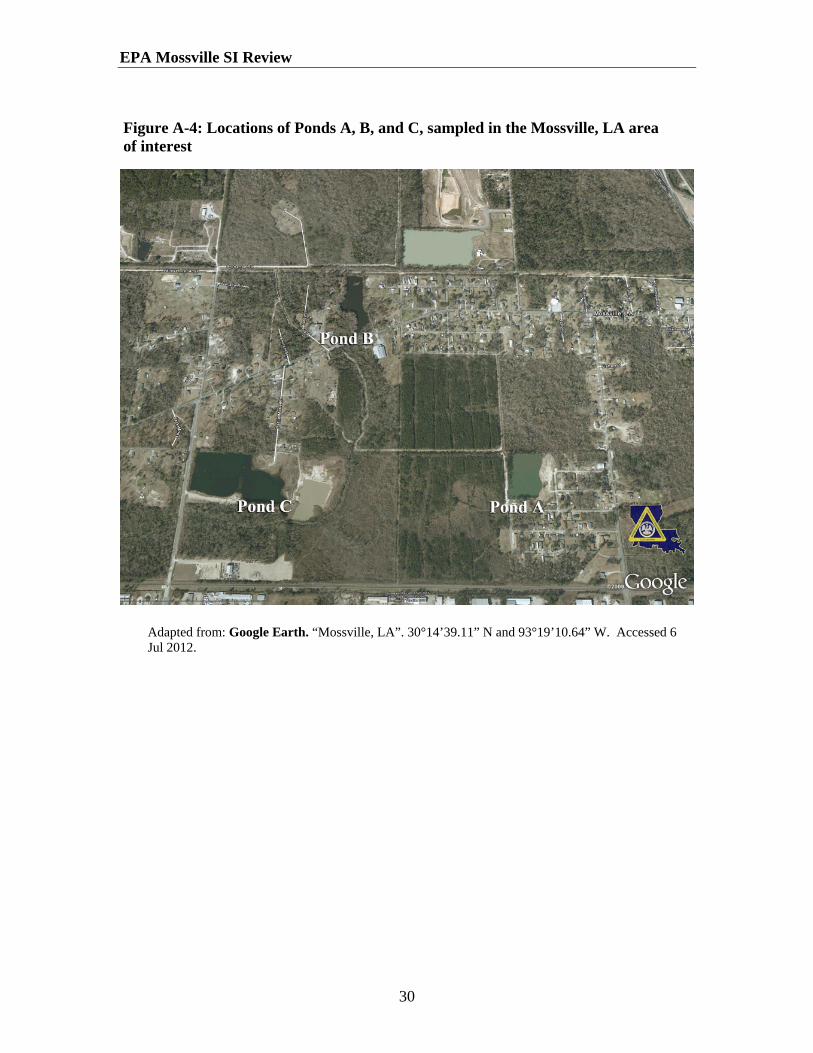
Surface water and sediment were sampled from three ponds (identified as Pond A, Pond B, and Pond C, see Figure A-4) within the in April 2010 and in August 2010. The ponds are believed to result from the excavation of sand or soil for use in building in the Lake Charles area; Pond C is actively used for this purpose at present. Residents report that at least one of the ponds, Pond C, has been used for waste disposal. The Site Investigation states that due to the shallow depth to groundwater in the Mossville AOI, the water levels in these ponds are likely to be closely associated to the shallow groundwater [2].
Pond A is approximately 400 feet by 500 feet, with an unknown depth. It is located west of Princess Street and north of Duke Street [2].
Pond B is an irregularly-shaped impoundment of approximately 900 feet in length and 75-300 feet in width, with an unknown depth. It is located north of East Burton Street, east of Edna Hardy Lane, and west of Benjamin Street [2].
Pond C actually encompasses three impoundments of 600 by 470 feet, 400 by 350 feet, and 500 by 300 feet, with unknown depths. These impoundments are located east of Coach Williams Drive [2].
During each sampling event, one sample of surface water and one sample of bottom sediment were collected each from Ponds A and B and two samples of surface water and bottom sediment were collected from Pond C.
Fish
Fish sampling was added to the Mossville Site Inspection when area residents and property owners reported that fishing for consumption of bass, gar and catfish has occurred in the three ponds sampled within the Mossville AOI. A single fish sample was collected from Pond C on May 20, 2010 and analyzed for metals, pesticides, PCB, and dioxins [2].
No background samples were collected for fish [2].
Soil
A background soil sample was collected from the Westlake Community Center (designated as Parcel 38), which is outside the Mossville AOI.
Soil samples were collected from 45 locations within the Mossville AOI in April 2010 and from 58 locations in August 2010. For all analyses except for VOCs, soil from within

EPA Mossville SI Review
12
0-12 inches below ground surface was homogenized. The fractions analyzed for VOCs were cored without homogenization [2].
Soil Gas
The background sample for soil gas analysis was collected from Parcel 33, which is located up/cross gradient from the groundwater flow direction in the shallow aquifers beneath the Mossville AOI [2].
A plume of contaminated groundwater originating from the Sasol North America facility underlies a portion of the Mossville AOI. The groundwater that forms this plume has been found to contain 1,2-dichloroethane, 1,1-dichloroethene, 1,1,2-trichloroethane, trichloroethene, 1,1-dichloroethane and vinyl chloride and is undergoing active remediation. To assess the possible impact of this contamination on the Mossville AOI, soil gas sampling was performed at residences in the vicinity of the plume. Soil gas was collected by 10 passive gas samplers, each installed at a depth of approximately two feet below ground surface (ft bgs) at four properties within the eastern portion of the Mossville AOI. The soil gas samplers were installed on May 12, 2010 and retrieved on May 19, 2010 [2].
Data Limitations
The evaluation of the data collected during the 2010 EPA Site Inspection of the Mossville AOI has several limitations, including the following:
In multiple instances in which contaminants were identified as “not detected”, the lowest amounts of contaminants detectable by the laboratory method used to analyze the samples (method detection limits) were above the CVs used to screen these contaminants. These contaminants, though not detected, may still have been present at concentrations that the screening process would identify as requiring further evaluation.
Data collected from the single fish sample may not be representative of levels of any contaminants that may accumulate in other fish in the ponds.
ATSDR methodology defines surface soil as 0-3 inches below ground surface. Contaminant concentrations detected in soils sampled from the Mossville AOI, which were collected from 0-12 inches below ground surface, may not be representative of contaminant concentrations found in surface soil [10].
The passive soil gas sampling technique used at the Mossville AOI directly measures the mass of contaminants collected by the sampler’s adsorbent material as gases migrate from groundwater to the soil surface [11]. The results are reported as ion flux rather than as concentrations. Contaminant concentrations

EPA Mossville SI Review
13
cannot be estimated from these results because the samplers do not record the total volume of gas that comes into contact with the samplers during the sampling period. The soil gas data collected from the AOI is therefore not suitable for the concentration-based evaluation process used in this Public Health Assessment [12, 13].
Exposure Pathways An exposure pathway consists of five elements: a source of contamination, transport through an environmental medium (air, water, or soil), a point of exposure, a route of human exposure (ingestion, dermal exposure, or inhalation), and a population. Completed pathways require that all five necessary elements exist and that exposure to a contaminant has occurred in the past, is presently occurring, or will occur in the future. An exposure pathway can be eliminated if at least one of the five elements is missing and will never be present.
Groundwater
Exposure to contaminants detected in groundwater sampled from the Mossville AOI occurs through ingestion, dermal contact, or inhalation of water vapor (for volatile and semi-volatile contaminants) during domestic use.
The Chicot Aquifer, from which Mossville obtains its groundwater, has three principal freshwater bearing zones, the “200, 500, and 700” foot sand zones, so named for the depths at which they occur east and south of Mossville, in the industrial area of Lake Charles. The Mossville public water supply uses the “500 foot” sand zone of the Chicot Aquifer. Under Mossville, this zone begins at a depth of 390 ft bgs and is 170 feet thick [2].
The EPA Site Inspection lists a total of six public supply wells, two private domestic wells, one irrigation well, and 25 wells that serve as environmental monitoring points within the Mossville AOI. Two of the public supply wells provide water within Mossville and draw water from the “500 foot” sand of the Chicot Aquifer [2].
The Site Inspection included a water well survey performed for a 4-mile radius of the Mossville AOI. Within this radius are registered 100 public supply wells (see Figure A-5), 467 private domestic wells (443 of which are active), 17 irrigation wells, 126 industrial supply wells, and 1,032 wells installed for environmental sampling purposes. The active public supply wells are utilized by the cities of Lake Charles, Westlake, Sulphur, and other Calcasieu Parish water districts. The majority of the public supply wells draw from the “500 foot” sand of the Chicot Aquifer [2].
Groundwater contamination has been documented under the Sasol North America, Georgia Gulf, and ConocoPhillips facilities and has been previously delineated in groundwater monitoring events unrelated to the Mossville Site Inspection. Natural groundwater flow in this area is typically to the south or southwest, though regional flow is often impacted by nearby bayous, rivers, and tidal actions. Pumping for remediation

EPA Mossville SI Review
14
programs at the Sasol and ConocoPhillips facilities has altered the natural groundwater gradient at these properties, in some cases reversing the natural flow from the south to the north [2]. Based on the typical flow of groundwater in this region, the Sasol and Georgia Gulf facilities would be the most likely contributors to potential groundwater contamination in the Mossville AOI. The ConocoPhillips facility is located downgradient of Mossville and would not be expected to impact the community’s groundwater. Sampling for the Mossville Site Inspection did not include sampling of these groundwater zones because there are no public supply wells or residential wells drawing water from these zones of groundwater contamination. The public and private wells located in the Mossville AOI draw water from deeper aquifers than those containing the contaminated groundwater [2].
Municipal Water
The municipal water supply is the main source of water to residences and businesses in Mossville. Exposure to contaminants detected in municipal water sampled from the Mossville AOI occurs through ingestion, dermal contact, or inhalation of water vapor (for volatile and semi-volatile contaminants) during normal use of water from domestic taps.
Surface Water and Sediment
The water from the three ponds sampled in Mossville is not part of the public water supply, and consumption of this water is unlikely. However, Mossville residents have indicated that fishing for bass, gar, and catfish have occurred in these ponds and that catches from these ponds have been consumed [2]. Exposure to surface water or sediment contaminants from Ponds A, B, and C within the Mossville AOI occurs through incidental (accidental) ingestion or dermal contact.
Fish
Exposure to contaminants in fish occurs through ingestion.
Soil
Exposure to contaminants detected in soil samples occurs through incidental (accidental) ingestion, dermal contact, or pica behaviors in small children. Exposures would be more likely where ground cover, such as grass, is absent.
Soil Gas
Exposure to soil gas occurs through inhalation.

EPA Mossville SI Review
15
Evaluation Process
The evaluation process used to assess the potential public health hazard at the Mossville AOI site is described in Appendix C. Contaminant concentrations were initially screened using media-specific health comparison values (CVs). These conservative screening values are only used to determine which environmental contaminants need further evaluation. CVs are not used to predict adverse human health effects. Contaminant concentrations that exceeded CVs are identified as contaminants of concern (COCs) and are listed in bold red text in Tables C-3 through C-8 (Appendix C).
The dioxins, furans, and polycyclic aromatic hydrocarbons (PAHs) were evaluated using toxicity equivalency factors (TEFs). TEFs weight each contaminant in a family of similar compounds against the most toxic and most studied of the compounds in that family. Multiplying the concentration of each dioxin or furan by its TEF yields a toxicity equivalency quotient (TEQ). The sum of each family’s TEQs in each sample is used to evaluate the health effects of the dioxins and furans.
For conservative screening purposes, contaminants that were not detected were assessed using a value of half the method detection limit, or the lowest limit measureable by the laboratory methodology used for sample analysis.
Health Effects Evaluation
The following COCs were identified in municipal water samples:
Bromodichloromethane, bromoform, dibromochloromethane, and copper.
The following COCs were identified in soil and sediment samples:
1,2,3,7,8,9-HxCDD, benzo(a)anthracene, benzo(a)pyrene, benzo(b)fluoranthene, indeno(1,2,3-cd)pyrene, arsenic, cadmium, copper, lead, and zinc in soil samples.
Groundwater
The analytes detected in groundwater and listed in Tables C-1 (for private wells) and C-2 (for municipal wells) were present at concentrations that pose no harm to public health. However, the majority of the contaminants analyzed in groundwater samples were non-detects (not present at levels above the method detection limit). As explained in the Data Limitations section and demonstrated by the evaluation of estimated total dioxin and total PAH (including non-detects; Tables C-12 and C-13), contaminants that were not detected may still have been present in concentrations that the screening process would identify as requiring further evaluation.
Non-detects that may still have been present in concentrations requiring further evaluation include the following:
Dioxins and furans (assessed as a group)
PCBs: Aroclors 1221, 1232, 1242, 1248, 1260

EPA Mossville SI Review
16
Semi-volatile organics: 3,3’dichlorobenzidine; 4-nitroaniline; PAHs (assessed as a group); bis(2-chloroethyl)ether; bis(2-ethylhexyl)phthalate; hexachlorobenzene; hexachlorobutadiene; hexachloroethane; n-nitrosodi-n-propylamine; pentachlorophenol
Pesticides: aldrin, dieldrin, heptachlor epoxide, toxaphene
Volatile organics: 1,1,2,2-tetrachloroethane; 1,2-dibromoethane; tetrachloroethene; vinyl chloride
Metals: antimony, arsenic, cadmium, thallium
Municipal Water
Analytes detected in municipal water samples are listed in Table C-3 (for private residences) and C-4 (for distribution system monitoring locations). The majority of the contaminants analyzed in municipal water samples were non-detects. However, some of the contaminants that were not detected may still have been present in concentrations that the screening process would identify as requiring further evaluation.
Bromodichloromethane, bromoform, dibromochloromethane, and copper were detected at concentrations that identified them as COCs. The concentrations of the trihalomethanes (bromodichloromethane, bromoform, and dibromochloromethane) detected pose no noncancer harm to public health but could result in very small increases in cancer risk (see Table C-14). Trihalomethanes occur in drinking water as byproducts of chlorine treatment for disinfection [14]. The levels of trihalomethanes would therefore fluctuate with changes in the amount of chlorine used for water disinfection. The average concentrations of trihalomethanes present is not likely to remain high enough to result in these estimated cancer risks because of the Louisiana Department of Health and Hospitals Safe Drinking Water Program’s adoption of the Stage 2 Disinfectant/Disinfection Byproducts Federal Rule, which is designed to reduce potential cancer and reproductive and developmental health risks from disinfection byproducts by tightening water delivery systems’ observance of maximum contaminant levels (MCLs) set for disinfection byproducts [15, 16].
The presence of copper in the water samples may be due to the use of copper in plumbing lines. The doses that would occur from ingesting the highest concentrations of copper found in Mossville municipal water are below the NOAEL (no-observable-adverse-effects-level) of 0.042 milligrams per kilogram per day (mg/kg/day), corresponding to observed gastrointestinal disturbance in men and women [17]. The maximum concentration of copper detected (214 ppb or 0.214 milligrams per liter (mg/L)) is also below the maximum contaminant level goal (MCLG) identified for copper in the National Primary Drinking Water Standards (1.3 mg/L) [18]. Copper in municipal water in Mossville should therefore pose no harm to public health.
Non-detects that may still have been present in concentrations requiring further evaluation include the following:

EPA Mossville SI Review
17
Dioxins and furans (assessed as a group)
PCBs: Aroclors 1221, 1232, 1242, 1248, 1260
Semi-volatile organics: 3,3’dichlorobenzidine; 4-nitroaniline; PAHs (assessed as a group); bis(2-chloroethyl)ether; bis(2-ethylhexyl)phthalate; hexachlorobenzene; hexachlorobutadiene; hexachloroethane; n-nitrosodi-n-propylamine; pentachlorophenol
Pesticides: aldrin, dieldrin, heptachlor epoxide, toxaphene
Volatile organics: 1,1,2,2-tetrachloroethane; 1,2-dibromoethane; tetrachloroethene; vinyl chloride
Metals: antimony, arsenic, cadmium, thallium
Surface Water
As noted in the Exposure Pathways section, the three ponds sampled in the Mossville AOI do not serve as a drinking water source; ingestion of water from these ponds is therefore unlikely. Analytes detected in the water sampled from these ponds are listed in Table C-5. The majority of the contaminants analyzed in the water sampled from the three ponds in the Mossville AOI were non-detects. Some of the contaminants that were not detected may still have been present in concentrations that the screening process would identify as requiring further evaluation.
Non-detects that may still have been present in concentrations requiring further evaluation include the following:
Dioxins and furans (assessed as a group)
PCBs: Aroclors 1221, 1232, 1242, 1248, 1260
Semi-volatile organics: 3,3’dichlorobenzidine; 4-nitroaniline; PAHs (assessed as a group); bis(2-chloroethyl)ether; bis(2-ethylhexyl)phthalate; hexachlorobenzene; hexachlorobutadiene; hexachloroethane; n-nitrosodi-n-propylamine; pentachlorophenol
Pesticides: aldrin, heptachlor epoxide, toxaphene
Volatile organics: 1,1,2,2-tetrachloroethane; 1,2-dibromoethane; tetrachloroethene; vinyl chloride
Metals: antimony, arsenic, cadmium, thallium
Sediment
Analytes detected in sediment sampled from Mossville are listed in Table C-6. Many of the contaminants analyzed in sediment sampled from the three ponds in the Mossville

EPA Mossville SI Review
18
AOI were non-detects. Some of the contaminants that were not detected may still have been present in concentrations that the screening process would identify as requiring further evaluation.
Non-detects that may still have been present in concentrations requiring further evaluation include the following:
Semi-volatile organics: PAHs (assessed as a group), n-nitrosodi-n-propylamine,
Metals: thallium
Fish
The single fish sample was not reviewed for this Public Health Assessment due to the small number of samples.
The May 2011 Site Inspection reports that furans 1,2,3,4,7,8-HxCDF (detected at a concentration of 6.5 nanograms per kilogram - ng/kg) and 1,2,3,7,8-PeCDF (detected at a concentration of 0.27 ng/kg) were found in the fish tissue at concentrations that exceeded the EPA screening levels (2.4 ng/kg for 1,2,3,4,7,8-HxCDF and 0.24 ng/kg for 1,2,3,7,8-PeCDF). Other dioxins and furans were detected in the sample, generally at concentrations below screening levels and method detection limits. The TEQ calculated for the fish sampled (2.2903 ng/kg) exceeded the EPA screening level (0.24 ng/kg). The Site Inspection report concluded that fish in the ponds are likely to exceed health based limits for dioxins [2].
Soil
Analytes detected in soils sampled from Mossville are listed in Table C-7. COCs identified in soil samples included individual dioxins, individual PAHs, cadmium, copper, and lead. The concentrations of cadmium and copper found in Mossville soil samples do not pose harm to public health (see Table C-15). Although dioxin contamination has been a primary concern of the Mossville community, assessment of total dioxin levels was inconclusive because of the number of non-detects that may still have been present in concentrations that the screening process would identify as requiring further evaluation.
Lead exposures are evaluated in terms of blood lead levels. Lead was therefore not assessed for oral or dermal doses. Lead will be further discussed in the Child Health Considerations section.
Non-detects that may still have been present in concentrations requiring further evaluation include the following:
Dioxins and furans (assessed as a group)
Semi-volatile organics: PAHs (assessed as a group), n-nitrosodi-n-propylamine,
Metals: thallium

EPA Mossville SI Review
19
Soil Gas
The EPA Site Inspection report states that soil gas samples (Table C-8) did not contain contaminants associated with the plume of contaminated groundwater from the SASOL facility underlying the AOI [2]. As stated in the Data Limitations section, this data is not suitable for further assessment of potential health hazards.
Child Health Considerations
The physical differences between children and adults demand special emphasis in assessing public health hazards. Children play outdoors and engage in hand-to-mouth behaviors that increase their exposure potential. Children are shorter than are adults and breathe dust, soil, and vapors close to the ground. A child’s lower body weight and higher intake rate result in a greater dose of hazardous substance per unit of body weight. If toxic exposure levels are high enough during critical growth stages, the developing body systems of children can sustain permanent damage.
Children could be exposed to all of the media sampled for the EPA site investigation. The groundwater is in use for the public water supply, the municipal water is designed for public use, the ponds are not fenced or inaccessible, and the soil sources are only inaccessible where property owners place private fences around their lots. Infants were not considered for exposures to water and sediment in the ponds in the Mossville AOI because infants are unlikely to experience these exposures.
Children under the age of 6 years are particularly vulnerable to lead poisoning. Compared with adults, a larger proportion of the amount of lead ingested will enter the bloodstream in children. The severity of the effects depends upon the exposure. A child who ingests large amounts of lead may develop symptoms ranging from colic to brain damage, which can ultimately be fatal. A child who ingests smaller amounts of lead may develop much less severe but still important effects on development and behavior [19]. Under the Louisiana Administrative Code, universal blood lead screening for children under six years of age is required for all parishes in the state of Louisiana [20]. The current Centers for Disease Control (CDC) guideline for the blood lead level at or above which children should undergo additional medical monitoring is 5 micrograms per deciliter (5 ug/dl) [21].
Lead was detected in soil samples collected from the Mossville AOI. Lead-contaminated soil is one of the risk factors associated with elevated blood lead levels in children; other risk factors include lead-contaminated dust, deteriorating lead paint, and lead-contaminated water. No screening value is currently available for the evaluation of lead exposures because there is no “level of concern” currently identified for exposure to lead in soil [21]. Childhood exposures to lead should be kept as low as possible to prevent lead poisoning. The best way to protect children is to prevent them from coming into contact with the source of lead contamination. Children’s exposure to lead-contaminated

EPA Mossville SI Review
20
soil can be limited by covering the bare soil with grass, bushes, or 4-6 inches of lead-free wood chips, mulch, soil, or sand [19].
Lead was also detected in the sediments sampled from the bottoms of the three ponds in the Mossville AOI. However, recreational activities in these ponds by children are unlikely, and therefore childhood exposure to lead in these sediments is unlikely.
Small children ages 1-3 years old are also at increased risk for eating non-food items, like soil (that is, exhibiting pica behaviors). Although children live in Mossville, ATSDR does not know whether they exhibit pica behaviors. ATSDR suggests that parents monitor their children’s behavior while the children are playing outdoors to prevent their children from intentionally eating soil.
Conclusions
SEET and ATSDR are committed to recognizing and addressing the concerns of the Mossville community about the risks involved in exposure to unsafe chemicals. Our agencies are committed to providing the community of Mossville, LA with the best science-based information available to keep the community safe.
Having reviewed the data collected for the 2010 Mossville Site Inspection, SEET has arrived at the following conclusions:
1. A number of the analytes reported as non-detects were analyzed using method detection limits that were higher than the comparison values used as screening tools. These contaminants may still have been present in concentrations that the screening process would identify as requiring further evaluation.
2. Current exposures to the chemical levels found in municipal water samples from the Mossville AOI are not expected to harm people’s health. A very small increase in cancer risk was estimated for a lifetime exposure to trihalomethane levels detected at Parcels 05 and 08, but the average concentrations of trihalomethanes present over time is not likely be high enough to result in these estimated increases.
3. Contaminants detected in surface water and sediment from the three manmade ponds sampled in the Mossville AOI pose no harm to public health.
4. Childhood exposures to lead should be kept as low as possible to prevent lead poisoning. Children’s exposure to lead-contaminated soil in the Mossville AOI can be limited by covering the bare soil with grass, bushes, or 4-6 inches of lead-free wood chips, mulch, soil, or sand, or by preventing children from coming into contact with the source of lead contamination.
If you have further concerns about the site, you can call ATSDR at 1-800-CDC-INFO and ask for information about the Mossville site. Questions may also be directed to LDHH/OPH/SEET at 1-888-293-7020.

EPA Mossville SI Review
21
Recommendations
The use of lower method detection limits in the analysis of future samples collected from the Mossville AOI would allow for a more complete screening of any contaminants present to determine whether further evaluation is needed.
Resampling of municipal water from Mossville would be useful in determining whether trihalomethanes resulting from water disinfection are consistently present at concentrations that could pose harm to public health.
The Louisiana-issued “Protocol for Issuing Public Health Advisories for Chemical Contaminants in Recreationally Caught Fish and Shellfish”, states that when preliminary data suggest potential fish-tissue contamination, a more extensive data evaluation or collection should be conducted to provide adequate characterization of the concentration of contaminants in the edible species “to support the risk assessment and advisory process”. A sufficient sample size of locally-harvested fish is then needed in order to determine whether a public health advisory is appropriate [22]. Public comments about the Mossville Draft Site Inspection Report included concerns about the need for additional fish testing. The EPA response to these comments acknowledged that the single fish sampled from Pond C contained contaminants at concentrations above the EPA screening level but within the acceptable EPA risk range, and that sediment samples taken from the pond did not contain elevated contaminant levels and would not contribute to further accumulation of dioxin in fish tissue. The EPA response states that “as concentrations are within acceptable risk, EPA does not plan any follow up actions” [23]. If there is strong evidence that fish from the three ponds in the Mossville AOI are a significant part of the community’s diet, then a larger number of fish samples should be collected from these ponds to evaluate whether the fish being consumed are accumulating contaminants that may pose harm to public health.
If additional soil gas sampling is performed using a method that measures the concentrations of any contaminants vaporizing from the soil, SEET is available to assess the soil gas contaminant concentrations detected at the site.
Further sampling of the soils in Parcels 4 and10 could be used to determine whether the concentrations of cadmium, copper, and lead that were of concern in this assessment are an accurate reflection of the average concentrations of these metals found throughout these properties.
SEET will be available to assess samples collected in further investigations or assessments performed in Mossville, LA.
Public Health Action Plan

EPA Mossville SI Review
22
The information produced within this public health assessment will be disseminated to the community members and stakeholders in Mossville, LA.

EPA Mossville SI Review
23
Report Preparation This Public Health Assessment for the Review of Data from the EPA Mossville Site Inspection was prepared by the Louisiana Department of Health and Hospitals/Office of Public Health/Section of Environmental Epidemiology and Toxicology under a cooperative agreement with the federal Agency for Toxic Substances and Disease Registry (ATSDR). It is in accordance with the approved agency methods, policies, procedures existing at the date of publication. Editorial review was completed by the cooperative agreement partner. ATSDR has reviewed this document and concurs with its findings based on the information presented. Author Rosalind M. Green, Sc.D. Environmental Health Scientist Coordinator Louisiana Department of Health and Hospitals (LA DHH) Center for Environmental Health Sciences (CEHS) Office of Public Health (OPH) Section of Environmental Epidemiology and Toxicology (SEET) State Reviewers Kathleen Aubin, M.S.P.H., LA DHH/CEHS/OPH/SEET (PI, Appletree Grant) Shannon Soileau, M.S., LA DHH/CEHS/OPH/SEET Luann White, Ph.D., D.A.B.T., Toxicology Consultant, Tulane School of Public Health and Tropical Medicine Technical Project Officer Jeff Kellam Cooperative Agreement Team ATSDR/DHCI/CB

EPA Mossville SI Review
24
References
1. United States Environmental Protection Agency. Summary of Actions: Mossville Community, Calcasieu Parish, Louisiana. Oct 2010. Accessed 30 Sept 2011 at: http://www.epa.gov/region6/6sf/louisiana/calcasieu/index.html.
2. United States Environmental Protection Agency, Region 6. Site Inspection: Mossville, North of Highway 90, Sulphur and Westlake, Calcasieu Parish, Louisiana. LAN000607014. 30 May 2011.
3. Agency for Toxic Substances and Disease Registry. Health Consultation: Assessment of Cancer incidence from the Louisiana Tumor Registry from 1988-2004, Calcasieu Parish, Louisiana. Atlanta: US Department of Health and Human Services; 27 Sep 2007.
4. Summary of the Meeting of the National Environmental Justice Advisory Council, May 13-15, 1997. Accessed 30 Sept 2011 at the National Service Center for Environmental Publications (NSCEP) Search Publications page: http://www.epa.gov/nscep/index.html.
5. Agency for Toxic Substances and Disease Registry. Mossville (Calcasieu Parish), Louisiana: Overview. Accessed 30 September 2011 at: http://www.atsdr.cdc.gov/sites/mossville/overview.html
6. Agency for Toxic Substances and Disease Registry. Toxicological Profile for Chlorinated Dibenzo-p-Dioxins. Atlanta: US Department of Health and Human Services; Dec 1998.
7. Agency for Toxic Substances and Disease Registry. Mossville, LA, Follow-Up Exposure Investigation factsheet. Accessed 19 Jun at: http://www.atsdr.cdc.gov/sites/mossville/docs/MossvilleFactSheet.pdf
8. Mossville site visit and home count, EPA Community Involvement Staff, Aug 2009.
9. Google Earth. Mossville, LA 70669. 30°14’51.32” N and 93°18’31.97” W. Accessed 30 Sept 2011.
10. Agency for Toxic Substances and Disease Registry. Public Health Assessment Guidance Manual (Update). Atlanta: US Department of Health and Human Services; Dec 2005.
11. The Interstate Technology & Regulatory Council Vapor Intrusion Team. Vapor Intrusion Pathway: A Practical Guideline. Accessed 20 Jun 2012 at: www.itrcweb.org/documents/VI-1.pdf
12. United States Environmental Protection Agency. Expedited Site Assessment Tools For Underground Storage Tank Sites: A Guide For Regulators. Chapter IV: Soil-Gas Surveys. March 1997. Accessed 28 Mar 2012 at: http://www.epa.gov/swerust1/pubs/esa-ch4.pdf
13. Ohio Environmental Protection Agency. Sample Collection and Evaluation of

EPA Mossville SI Review
25
Vapor Intrusion to Indoor Air. Accessed 20 Jun 2012 at: http://www.epa.ohio.gov/portals/30/rules/vapor%20intrusion%20to%20indoor%20air.pdf
14. United States Environmental Protection Agency. Disinfection Byproducts: A Reference Resource. Accessed 22 Nov 2011 at: http://www.epa.gov/enviro/html/icr/gloss_dbp.html
15. Louisiana Department of Health and Hospitals. Center for Environmental Health: Safe Drinking Water Program. Accessed 28 Mar 2012 at: http://new.dhh.louisiana.gov/index.cfm/page/963
16. United States Environmental Protection Agency. Water: Stage 2 DBP Rule. Accessed 28 Mar 2012 at: http://water.epa.gov/lawsregs/rulesregs/sdwa/stage2/basicinformation.cfm
17. Agency for Toxic Substances and Disease Registry. Toxicological Profile for Copper. Atlanta: US Department of Health and Human Services; 21 Sep 2004.
18. United States Environmental Protection Agency. National Primary Drinking Water Regulations. Accessed 07 Feb 2012 at: http://water.epa.gov/drink/contaminants/index.cfm#List
19. Agency for Toxic Substances and Disease Registry. Health Consultation: An Evaluation of Pre- and Post- Hurricane Soil and Blood Lead Data from Orleans and St. Bernard Parishes. Atlanta: US Department of Health and Human Services; 21 Sep 2007.
20. Louisiana Childhood Lead Poisoning Prevention Program. Eliminating Childhood Lead Poisoning: A Strategic Plan for Louisiana. Accessed 29 Oct 2012 at: http://new.dhh.louisiana.gov/assets/oph/Center-PHCH/Center-PH/genetic/LEAD/ELIMINATION_PLAN.revised.2.pdf
21. Advisory Committee on Childhood Lead Poisoning Prevention, Centers for Disease Control and Prevention. Low Level Lead Exposure Harms Children: A Renewed Call for Primary Prevention. Accessed 25 Oct 2012 at: http://www.cdc.gov/nceh/lead/acclpp/acclpp_main.htm
22. Louisiana Department of Health and Hospitals, in collaboration with Louisiana Department of Environmental Quality, Louisiana Department of Agriculture and Forestry and Louisiana Department of Wildlife and Fisheries. Protocol for Issuing Public Health Advisories for Chemical Contaminants in Recreationally Caught Fish and Shellfish. Louisiana: May 2011.
23. United States Environmental Protection Agency. Response to Comments, EPA Mossville Draft Site Inspection Report. Accessed 6 Jul 2012 at: http://www.epa.gov/region6/6sf/louisiana/calcasieu/mossville/mossville_final_site_inspection/response_to_comments_on_the_epa_mossville_draft_site_inspection_report.pdf
EPA Mossville SI Review
26
APPENDIX A: Maps

EPA Mossville SI Review
27
Fig
ure
A-1
: L
ocat
ion
of
Mos
svil
le, L
A
Ada
pted
fro
m: U
nite
d S
tate
s E
nvir
onm
enta
l Pro
tect
ion
Age
ncy,
Reg
ion
6. S
ite I
nspe
ctio
n: M
ossv
ille,
Nor
th o
f H
ighw
ay 9
0, S
ulph
ur
and
Wes
tlake
, Cal
casi
eu P
aris
h, L
ouis
iana
. LA
N00
0607
014.
30
May
201
1
Day
care
Loc
atio
n re
trie
ved
from
:Goo
gle
Ear
th. M
ossv
ille,
LA
706
69. 3
0°14
’51.
32”
N a
nd 9
3°18
’31.
97”
W.
Acc
esse
d 30
Sep
t 201
1.

EPA Mossville SI Review
28
Fig
ure
A-2
: L
ocat
ion
s of
Ch
emic
al F
acil
itie
s in
th
e V
icin
ity
of M
ossv
ille
, LA
Ada
pted
fro
m: U
nite
d S
tate
s E
nvir
onm
enta
l Pro
tect
ion
Age
ncy,
Reg
ion
6. S
ite I
nspe
ctio
n: M
ossv
ille,
Nor
th o
f H
ighw
ay 9
0,
Sul
phur
and
Wes
tlake
, Cal
casi
eu P
aris
h, L
ouis
iana
. LA
N00
0607
014.
30
May
201
1.
Fig
ure
A-2
: L
ocat
ion
s of
Ch
emic
al F
acil
itie
s in
th
e V
icin
ity
of M
ossv
ille
, LA
EPA Mossville SI Review
29
Figure A-3: Sample locations in the Mossville, LA area of interest
Adapted from: United States Environmental Protection Agency, Region 6. Site Inspection: Mossville, North of Highway 90, Sulphur and Westlake, Calcasieu Parish, Louisiana. LAN000607014. 30 May 2011.
EPA Mossville SI Review
30
Figure A-4: Locations of Ponds A, B, and C, sampled in the Mossville, LA area of interest
Adapted from: Google Earth. “Mossville, LA”. 30°14’39.11” N and 93°19’10.64” W. Accessed 6 Jul 2012.

EPA Mossville SI Review
31
Ada
pted
fro
m: U
nite
d S
tate
s E
nvir
onm
enta
l Pro
tect
ion
Age
ncy,
Reg
ion
6. S
ite I
nspe
ctio
n: M
ossv
ille,
Nor
th o
f H
ighw
ay 9
0,
Sul
phur
and
Wes
tlake
, Cal
casi
eu P
aris
h, L
ouis
iana
. LA
N00
0607
014.
30
May
201
1.
Fig
ure
A-5
: P
ub
lic
Su
pp
ly W
ells
wit
hin
a F
our-
Mile
Rad
ius
of t
he
Mos
svil
le a
rea
of in
tere
st

EPA Mossville SI Review
32
APPENDIX B: Chronology of Events
EPA Mossville SI Review
33
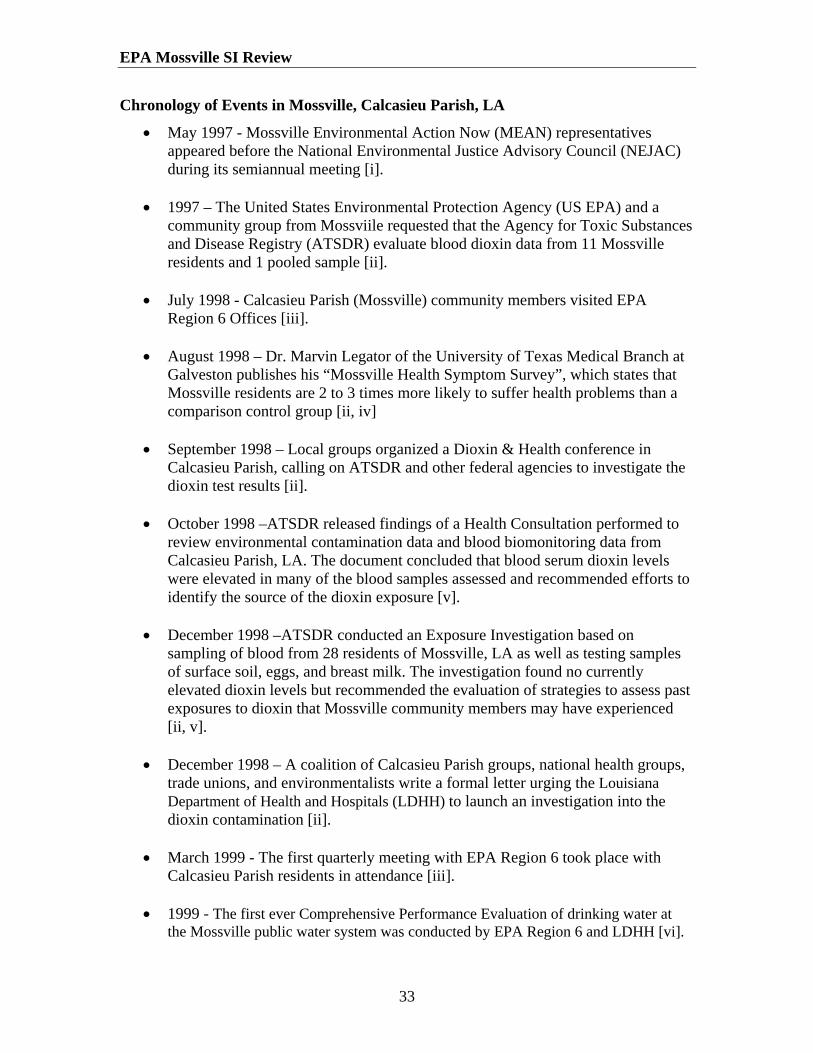
Chronology of Events in Mossville, Calcasieu Parish, LA
May 1997 - Mossville Environmental Action Now (MEAN) representatives appeared before the National Environmental Justice Advisory Council (NEJAC) during its semiannual meeting [i].
1997 – The United States Environmental Protection Agency (US EPA) and a community group from Mossviile requested that the Agency for Toxic Substances and Disease Registry (ATSDR) evaluate blood dioxin data from 11 Mossville residents and 1 pooled sample [ii].
July 1998 - Calcasieu Parish (Mossville) community members visited EPA Region 6 Offices [iii].
August 1998 – Dr. Marvin Legator of the University of Texas Medical Branch at Galveston publishes his “Mossville Health Symptom Survey”, which states that Mossville residents are 2 to 3 times more likely to suffer health problems than a comparison control group [ii, iv]
September 1998 – Local groups organized a Dioxin & Health conference in Calcasieu Parish, calling on ATSDR and other federal agencies to investigate the dioxin test results [ii].
October 1998 –ATSDR released findings of a Health Consultation performed to
review environmental contamination data and blood biomonitoring data from Calcasieu Parish, LA. The document concluded that blood serum dioxin levels were elevated in many of the blood samples assessed and recommended efforts to identify the source of the dioxin exposure [v].
December 1998 –ATSDR conducted an Exposure Investigation based on
sampling of blood from 28 residents of Mossville, LA as well as testing samples of surface soil, eggs, and breast milk. The investigation found no currently elevated dioxin levels but recommended the evaluation of strategies to assess past exposures to dioxin that Mossville community members may have experienced [ii, v].
December 1998 – A coalition of Calcasieu Parish groups, national health groups, trade unions, and environmentalists write a formal letter urging the Louisiana Department of Health and Hospitals (LDHH) to launch an investigation into the dioxin contamination [ii].
March 1999 - The first quarterly meeting with EPA Region 6 took place with Calcasieu Parish residents in attendance [iii].
1999 - The first ever Comprehensive Performance Evaluation of drinking water at
the Mossville public water system was conducted by EPA Region 6 and LDHH [vi].

EPA Mossville SI Review
34
1999 - 2001 - EPA began a Calcasieu Estuary-wide Superfund investigation that
included Bayou Verdine and Bayou d’Inde, which are close to Mossville. EPA also completed detailed compliance inspections of major facilities, including public water and industrial facilities [iii].
April 1999 – The public comment version of the Exposure Investigation ATSDR performed in the Mossville community is released [ii].
April 14, 1999 – A public availability session and public meeting hosted by ATSDR and government stakeholders was held in Mossville to collect community health concerns [iii].
April 1999 – A government task force consisting of federal agencies (ATSDR and EPA) and state agencies (Louisiana Department of Environmental Quality (LDEQ) and LDHH) is set up by Louisiana Governor Mike Foster to find answers to the concerns of the Mossville community [ii]
May 1999 – A fact sheet was mailed to the Mossville Community with the results of the ATSDR Mossville Exposure Investigation [iii].
May 1999 – MEAN held a community meeting calling for immediate health services and a permit-moratorium in the Mossville area [ii].
June 3, 1999 – ATSDR, EPA, LDEQ, and LDHH held a meeting with Mossville residents to discuss the formation of the Mossville Public Health Response Workgroup [ii, iii].
June 17, 1999 - The Mossville Public Health Response Workgroup established
sub-workgroups to focus on specific areas of community health concerns (Environmental Characterization Group, Demographics Group, Health Data Group, Health Education/Outreach Group, Media Group) [iii].
July 1999 – Dr. Peter Orris, an Association of Occupational and Environmental Clinics physician based out of Cook County Hospital, was brought on as an ATSDR consultant. Dr. Orris held private consultations with people who were tested for dioxin and subsequently held a community meeting to discuss dioxin contamination and health [ii].
November 1999 – ATSDR released the Exposure Investigation Report for Mossville, LA [v].
January 14, 2000 - The results of the Mossville Exposure Investigation were
mailed to 211 Medical Providers in Calcasieu Parish Medical Community [iii].

EPA Mossville SI Review
35
May 16, 2000 - ATSDR, LDHH, and LDEQ hosted a meeting with the Mossville Community to discuss the next steps in the Dioxin Exposure Investigation [iii].
May 2000 – MEAN released “Breathing Poison: Toxic Costs of Industries in Calcasieu Parish, LA” [ii]
June 20, 2000 - ATSDR presented finding of the exposure investigation to the Mossville Community at the request of MEAN [iii].
November 15-16, 2000 - Mossville Community members and stakeholders met to
discuss past and proposed public health actions by ATSDR in response to the community health concerns about dioxin [iii].
March 28, 2001 – A public meeting, briefing for elected officials, and a media availability session were held to discuss ATSDR plans for blood dioxin testing in Calcasieu Parish [iii].
2000 - 2001 - EPA, LDEQ and local industry conducted a pilot study with air toxics monitors that included one dioxin monitor [iii].
2001 - ATSDR reassessed their Exposure Investigation findings and initiated a follow-up Exposure Investigation [ii, iii].
2002 – ATSDR released an Air Modeling Health Consultation performed to characterize the air pathway in Mossville. This characterization was designed to help determine whether the dioxin found in blood samples could be from current exposures to airborne dioxin [iii].
January 2002 – LDHH released the “Mossville Residential Needs Assessment” to determine the Mossville community’s environmental and public health concerns [ii, iii].
January 2002 – LDHH released “Cancer in Calcasieu Parish, Louisiana: 1977-1997” [ii]
January 15-17, 2002 – EPA hosted community meetings to present information about ATSDR’s 2002 Dioxin Study of Calcasieu and Lafayette Parishes [iii].
February 2002 – ATSDR, in partnership with EPA, the Health Resources and Services Administration (HRSA), and Mossville community members, conducted the Calcasieu Parish Environmental Health Symposium for healthcare workers [ii, iii]
2002 - 2004 - A time critical action was selected for removal of high levels of ethylene dichloride in the sediments of Bayou Verdine [iii].
EPA Mossville SI Review
36
2003- LDHH became the primary agency for implementing health education activities in the Mossville Community. ATSDR had previously been responsible for communicating information to residents [iii].
April 29, 2003 - ATSDR Assistant Director and Staff met with MEAN at the Mount Zion Baptist Church, Mossville, Louisiana to discuss the dioxin exposure investigations and ATSDR’s assistance in obtaining a health clinic in Mossville [iii].
April 29, 2003 – ATSDR held a Public Meeting at the Westlake High School, Westlake, Louisiana about the 2001 Follow-up Exposure Investigation and the 2002 Dioxin Study [iii].
May 1, 2003 - ATSDR held a Public Meeting about 2002 Dioxin Study of Calcasieu and Lafayette Parishes Lafayette, Louisiana [iii].
2003 - Present - A non-time critical action was selected to address sediment contamination in the lower reaches of Bayou Verdine [iii].
September, 2004 - The first Calcasieu Community Health and Environmental
Forum was held at McNeese University to discuss the possible correlation between anencephaly and other neural-tube birth defects and possible causes of these conditions. Dr. Juan Manuel Acuana, ot the Centers Disease Control & Prevention (CDC) stated that “there is no factual evidence that supports a correlation between birth defects and industrial toxins” [iii].
March 2005 - LDHH/Office of Public Health/Section of Environmental Epidemiology and Toxicology (LDHH/OPH/SEET), through a cooperative agreement with ATSDR, released documents assessing sediment and water samples from the Calcasieu Estuary [v]
March 8, 2005 - The Inter-American Commission on Human Rights (IACHR) received the “Petition concerning the United States Government’s Failure to Protect the Human Rights of the Residents of Mossville, Louisiana, United States of America” from Advocates for Environmental Human Rights (AEHR, the “petitioners”) against the United States of America on behalf of the residents of Mossville, Louisiana and MEAN. The petition and its subsequent amendments alleged that Louisiana’s environmental policies exposed Mossville residents, the majority of which are African-Americans, to a disproportionate pollution burden [vii].
May 2, 2005 - The second Calcasieu Community Health and Environmental
Forum on Anencephaly was held at McNeese University [iii].
September 2005 - Hurricanes Katrina and Rita

EPA Mossville SI Review
37
October 2005 – ATSDR releases a comparison of blood dioxin levels in Calcasieu Parish vs. in Lafayette Parish in the “Serum Dioxin Levels in Residents of Calcasieu Parish, Louisiana” document [viii].
March 2006 - ATSDR released the results of its follow-up exposure investigation of blood dioxin levels in Calcasieu Parish and Mossville. The parish-wide investigation showed that Calcasieu residents have blood dioxin levels similar to those found in people nationally. The Mossville investigation found elevated dioxin levels in participants ages 45 and older while participants younger than the age of 45 had normal levels [v].
March 15, 2006 – ATSDR held a public meeting in Lake Charles, LA about the
Mossville follow-up dioxin exposure investigation and the parish-wide Dioxin Study [iii].
March 16, 2006 – ATSDR held a public meeting in Lafayette, LA about the parish-wide Dioxin Study [iii].
July 2006 - EPA completed time-critical recovery work in the Calcasieu Estuary [iii].
September 2006 – Wilma Subra and the Subra Company released the report, “Industrial Sources of Dioxin Poisoning in Mossville; a Report on the Facts that Government Agencies have Hidden” [ii].
October 9, 2006 - LDHH conducted a site visit to determine how many residents
remained in the Mossville area following the 2005 Gulf Coast Hurricanes. The purpose of the visit was to revise their communication strategy and to determine current populations’ needs [iii].
December 12, 2006 – The LDHH/OPH/SEET Health Educator contacted the President of MEAN to determine the community’s health concerns [iii].
January 3 & 23, 2007 – The LDHH/OPH/SEET Health Educator contacted the Advocates for Environmental Human Rights (AEHR) attorney representing MEAN to inform them of LDHH interest in holding community meetings to address residents concerns [iii].
January 30, 2007 - AEHR contacted the LDHH/OPH/SEET Health Educator to discuss communication plans for Mossville. LDHH was interested in holding meetings after the Cancer Incidence Review that was being written by LDHH was complete [iii].
February 13, 2007 - LDHH participated in the Louisiana Department of
Environmental Quality (LDEQ) Office of Environmental Services “Listening Session” to strengthen the agencies’ working relationships with communities.

EPA Mossville SI Review
38
MEAN, Calcasieu League for Environmental Action Now (CLEAN) and other community groups also attended and provided LDHH with their environmentally related health concerns and input on how the agency could collaborate with the public [iii].
2007 – EPA responded to the IACHR, requesting that the Commission “declare the Petition as inadmissible” [iii].
July 2007 – Wilma Subra and the Subra Company released “Industrial Sources of Dioxin Poisoning in Mossville, Louisiana: A Report Based on the Government’s Own Data” [ii, iii].
September 2007 – LDHH/OPH/SEET, through a cooperative agreement with ATSDR, released “Assessment of Cancer Incidence From the Louisiana Tumor Registry From 1988-2004” health consultation. The report found no clear pattern indicating that Calcasieu Parish has any consistently higher than expected rates for most cancers, the exceptions being melanoma of the skin in whites and cancer of the lung in women. The report also concluded that lthough dioxins are possibly linked to some cancers, correlations are not consistent across the board; cancer in Calcasieu Parish therefore cannot be predicted from the blood dioxin levels in the Exposure Investigation participants [ix].
September 2008 - Hurricanes Gustav and Ike July 2009 - Community Representatives at an Environmental Justice Listening
Session in New Orleans, LA and a NEJAC meeting in Washington, DC alleged that EPA has done nothing in Mossville [iii].
August 2009 - EPA tested water at the tap for five Mossville properties, and EPA initiated a Preliminary Assessment for Mossville, based on requests from the community [iii].
November 2009 - EPA responded to recommendations in the 2007 report, “Industrial Sources of Dioxin Poisoning in Mossville, LA”, by providing a history of involvement at the site and by listing future and ongoing activities [iii].
December 8, 2009 – ATSDR met with community members from Calcasieu Parish, La., in Atlanta, GA to explore methods of collaborating effectively, to answer the community’s health questions, and to develop an action plan for future activities to support improved health in the community [x].
January 2010 - EPA held a meeting to discuss the planned assessment of the
Mossville community and to provide the community with a basic understanding of the Superfund process. ATSDR, LDEQ and LDHH were also in attendance. EPA asked for the community’s support by soliciting input and inviting them to participate [iii].
EPA Mossville SI Review
39
February 25, 2010 - EPA, the Louisiana Bucket Brigade, Louisiana refineries, and
LDEQ, plant workers, and community representatives attended a meeting in New Orleans. Participants shared information and ideas about reducing accidental releases from refineries [iii].
March –April 2010 - ATSDR held a series of health related workshops for the Mossville community [iii].
March 2010 – The IACHR accepted a human rights complaint filed by AEHR on behalf of Mossville community members [vii].
April 13, 2010- EPA held a meeting to discuss the draft Preliminary Assessment and to present the proposed sampling plan to the Mossville community. EPA asked for the community’s support by soliciting input and soliciting access to properties for sampling [iii].
April 21, 2010-Representatives from EPA held a conference call with LDHH, Mossville Water System, and the Lake Area Industry Alliance to discuss water system needs and opportunities for assistance [iii].
April 26-30, 2010-EPA conducted Risk Management Program (RMP) Inspections at PPG Industries, Inc., Lake Charles Plant, and Calcasieu Refining Company [iii].
April 26, 2010- The EPA Site Assessment Manager hosted a question and answer session with the Mossville community prior to the field sampling for that week [iii]
April 27-30 2010- EPA collected samples from over 100 locations in the Mossville community, including residential taps, private wells, soils, sediments and the public water system [iii].
April 27, 2010- EPA and the Lake Charles Local Emergency Planning Committee (LEPC ) hosted a meeting to discuss improved communication between community members and industry, and community members and the LEPC [iii].
April 29-30 2010- EPA conducted comprehensive evaluation of the Mossville
Public Water System [iii].
May 14-21, 2010 – EPA conducted supplemental field samples. Samples were collected from one residential tap, a fish tissue sample was collected from one stock pond, and a passive soil gas samples were collected [iii].

EPA Mossville SI Review
40
June 2-3, 2010 – A CNN special, “Toxic America”, focuses on the Mossville community’s environmental and health concerns.
June 30, 2010 - EPA held a conference call with community representatives to discuss problems with the dioxin data and outlined plans to resample. The community requested that EPA provide a fact sheet to the public describing the issue [iii].
June 2010- EPA completed additional inspections near Mossville at the Sasol, Westlake Petrochemical and Firestone facilities [iii].
August 2, 2010- EPA sent letters to Mossville residents detailing their results from the April 2010 sampling [iii].
August 16, 2010 - EPA held a meeting to discuss the preliminary results of the
Comprehensive Evaluation of the Mossville Water System, informing Mossville community members that their drinking water is safe. EPA also provided an update of the Superfund Site Assessment process and solicited input from the community [iii].
August 17-19, 2010 - EPA re-sampled soil, tap water, surface water and sediment for dioxins in Mossville. These samples replaced dioxin samples that couldn’t be used from the original sampling event in May 2010 [iii].
August 20 & 21, 2010 – ATSDR and EPA met with the community, MEAN, Restore Explicit Symmetry To Our Ravaged Earth (RESTORE), the Bureau of Primary Care and Rural Health, LDHH, HRSA, a doctor of naprapathy and a representative of Enagic (a company that produces water treatment technology). The purpose of the meetings was to discuss options and cost for access to health care in the Mossville area. EPA also discussed the drawbacks of potential relocation of Mossville residents [iii].
October 8, 2010 – ATSDR organized an Access to Health Care Teleconference with Mossville stakeholders to discuss what options a plan of action for getting health care to the Mossville community. A committee was formed to initiate the information/data collection effort [iii].
October 18, 2010-EPA met with the Lake Area Industry Alliance (LAIA) to discuss industry participation in the action plan. Participating industries committed to consider each of the elements of the plan [iii].
References:
i. National Environmental Justice Advisory Council. Summary of the Meeting of the National Environmental Justice Advisory Council, May 13-15, 1997. Accessed 30 Sept 2011 at the National Service Center for Environmental Publications (NSCEP) Search Publications page: http://www.epa.gov/nscep/index.html.

EPA Mossville SI Review
41
ii. Agency for Toxic Substances and Disease Registry. Timeline: ATSDR Public Health initiative in Mossville/Calcasieu Parish, LA; 1997-Present (Compiled November 2009).
iii. United States Environmental Protection Agency, Region 6. Site Inspection: Mossville, North of Highway 90, Sulphur and Westlake, Calcasieu Parish, Louisiana. Appendix G. LAN000607014. 30 May 2011.
iv. National Environmental Justice Advisory Council. Fourteenth Meeting of the National Environmental Justice Advisory Council. Volume II. Wednesday, December 1, 1999. Accessed 12 October 2011 at: http://www.epa.gov/compliance/ej/resources/publications/nejac/nejacmtg/transcript-arl-120199.pdf
v. Agency for Toxic Substances and Disease Registry. Mossville (Calcasieu Parish), Louisiana: Health consultations, exposure investigations, and health studies. Accessed 10 October 2011 at: http://www.atsdr.cdc.gov/sites/mossville/publications.html
vi. United States Environmental Protection Agency. Environmental Justice 2000 Biennial Report: Continuing to Move Towards Collaborative and Constructive Problem-Solving. Report No. EPA/300-R-01-005. Oct 2001.
vii. Inter-American Commission on Human Rights. “Petition concerning the United States Government’s Failure to Protect the Human Rights of the Residents of Mossville, Louisiana, United States of America”. Petition 242-05. 2010 Mar 17. Accessed 11 Oct 2011 at: http://www.cidh.oas.org/annualrep/2010eng/USAD242-05EN.DOC
viii. Agency for Toxic Substances and Disease Registry. Serum Dioxin Levels in Residents of Calcasieu Parish, Louisiana. Atlanta: US Department of Health and Human Services; Oct 2005.
ix. Agency for Toxic Substances and Disease Registry. Assessment of Cancer Incidence From the Louisiana Tumor Registry From 1988-2004. Atlanta: US Department of Health and Human Services; Sept 2007.
x. Agency for Toxic Substances and Disease Registry. Press Room: ATSDR consults Calcasieu Parish residents in planning next steps. December 10, 2009. Accessed 12 October 2011 at: http://www.atsdr.cdc.gov/news/displaynews.asp?PRid=2459

EPA Mossville SI Review
42
APPENDIX C: Data Evaluation

EPA Mossville SI Review
43
Screening Process Tables C-1 through C-8 list the analytes identified in media sampled from the Mossville AOI. The following comparison values were used in the evaluation of samples collected from the Mossville AOI:
Reference dose Media Evaluation Guides (RMEGs) are estimated contaminant concentrations at which noncarcinogenic health effects are unlikely. They are calculated from the U.S. Environmental Protection Agency’s (EPA) reference dose (RfD).
Cancer Risk Evaluation Guides (CREGs) are estimated contaminant concentrations that would be expected to cause no more than one additional excess cancer in 1 million exposed persons over a lifetime. CREGs are calculated from EPA’s cancer slope factors (CSFs).
Environmental Media Evaluation Guides (EMEGs) are estimated contaminant concentrations at which noncarcinogenic health effects are unlikely. EMEGs are calculated from the Agency for Toxic Substances and Disease Registry’s (ATSDR) minimal risk levels (MRLs).
Regional Screening Levels (RSLs) are estimated contaminant concentrations in a media at which noncarcinogenic or carcinogenic health effects are unlikely.
Lead concentrations were reviewed using the Maximum Contaminant Level (MCL) Action Level for water samples and the EPA Residential Screening Level for soil and sediment samples.
When no comparison value was available for a contaminant, screening was based on the Louisiana Department of Environmental Quality’s Risk Evaluation/Corrective Action Program (RECAP) screening standards1. RECAP screening standards are concentrations at or above which remediation of a medium (soil, sediment, or water) should occur.
If a contaminant was not detected in any of the samples collected from groundwater, municipal water, surface water, sediment, or soil, it was excluded from the tables. For conservative screening purposes, the non-detects (the contaminants that were not detected at concentrations above the method detection limit) that are listed in the tables were assessed using a value of half the method detection limit (the lowest limit measureable by the laboratory methodology used for sample analysis). Contaminants fitting this description are marked with an “ND”.
The dioxins and furans were evaluated using toxicity equivalency factors (TEFs). TEFs weight each dioxin or furan’s relative toxicity in comparison to 2,3,7,8-tetrachlorodibenzo-p-dioxin (TCDD), one of the most toxic and most studied of the dioxins. Multiplying the concentration of each dioxin or furan by its TEF produced a toxicity equivalency quotient (TEQ). The sum of dioxin and furan TEQs in each sample
1 Louisiana Department of Environmental Quality Corrective Action Group. Risk Evaluation/Corrective Action Program. Aug 2003. Accessed 22 Nov 2011 at: http://www.deq.louisiana.gov/portal/tabid/2930/Default.aspx

EPA Mossville SI Review
44
was used to evaluate health effects of the dioxins and furans. The polycyclic aromatic hydrocarbons were also reviewed using TEFs, evaluating each PAH’s relative toxicity in comparison to benzo(a)pyrene. The potential health effects of estimated PAH concentrations were evaluated in terms of cancer risk. Tables C-9 and C-10 give examples of TEF use.
There were no comparison values, TEFs, or other screening standards available with which to evaluate lead, benzo(g,h,i)perylene, endrin aldehyde, and endrin ketone.

EPA Mossville SI Review
45
Table C-1: Ranges of analytes detected in groundwater sampled from private wells in the Mossville area of interest, April 28-29, 2010
Contaminant Background concentration
Range of concentrations detected (ppb*)
Minimum Maximum
Frequency of detections
Sample source,
Maximum
CV† (ppb)
CV reference
METALS
Barium ND (100)‡ ND (100) 232 2/3
(both from Parcel 36)
Parcel 36 2,000 Child Chronic
EMEG§
Calcium 27,900 34,100 79,200 3/3 Parcel 40 NA** (essential nutrient) ††
Iron ND (50) ND (50) 2,720 2/3
(both from Parcel 36)
Parcel 36 11,000 RSL‡‡
Magnesium 6,900 6,310 7,490 3/3 Parcel 36 NA (essential nutrient)
Manganese ND (7.5) 223 340 3/3 Parcel 36 500 Child RMEG§§
Sodium 46,900 23,100 39,100 3/3 Parcel 36 NA (essential nutrient)
Zinc ND (30) ND (30) 323 2/3
(both from Parcel 36)
Parcel 36 3,000 Child Chronic
EMEG
* ppb =parts per billion †CV=comparison value ‡ND = not detected; value in parenthesis is half the method detection limit §EMEG = Environmental Media Evaluation Guide **NA = Not applicable ††(essential nutrient) = Calcium, magnesium, and sodium are considered essential nutrients and do not exert toxic effects at low levels. ‡‡RSL = Regional Screening Level §§RMEG = Reference dose Media Evaluation Guide

EPA Mossville SI Review
46
Table C-2: Ranges of analytes detected in groundwater sampled from public supply wells in the Mossville area of interest, April 28-29, 2010
Contaminant Background concentration
Range of concentrations detected (ppb*)
Minimum Maximum
Frequency of detections
Sample source,
Maximum
CV† (ppb)
CV reference
METALS
Barium ND (100)‡ 229 236 3/3 Mossville
WW Well 2 2,000
Child Chronic EMEG§
Calcium 27,900 29,800 33,900 3/3 Mossville WW Well 2
NA** (essential nutrient) ††
Iron ND (50) 2080 2160 3/3 Mossville WW Well 1
11,000 RSL‡‡
Magnesium 6,900 7,110 7,750 3/3 Mossville WW Well 2
NA (essential nutrient)
Manganese ND (7.5) 340 352 3/3 Mossville WW Well 2
500 Child RMEG§§
Sodium 46,900 34,300 39,500 3/3 Mossville WW Well 1
NA (essential nutrient)
* ppb =parts per billion †CV=comparison value ‡ND = not detected; value in parenthesis is half the method detection limit §EMEG = Environmental Media Evaluation Guide **NA = Not applicable ††(essential nutrient) = Calcium, magnesium, and sodium are considered essential nutrients and do not exert toxic effects at low levels. ‡‡RSL = Regional Screening Level §§RMEG = Reference dose Media Evaluation Guide
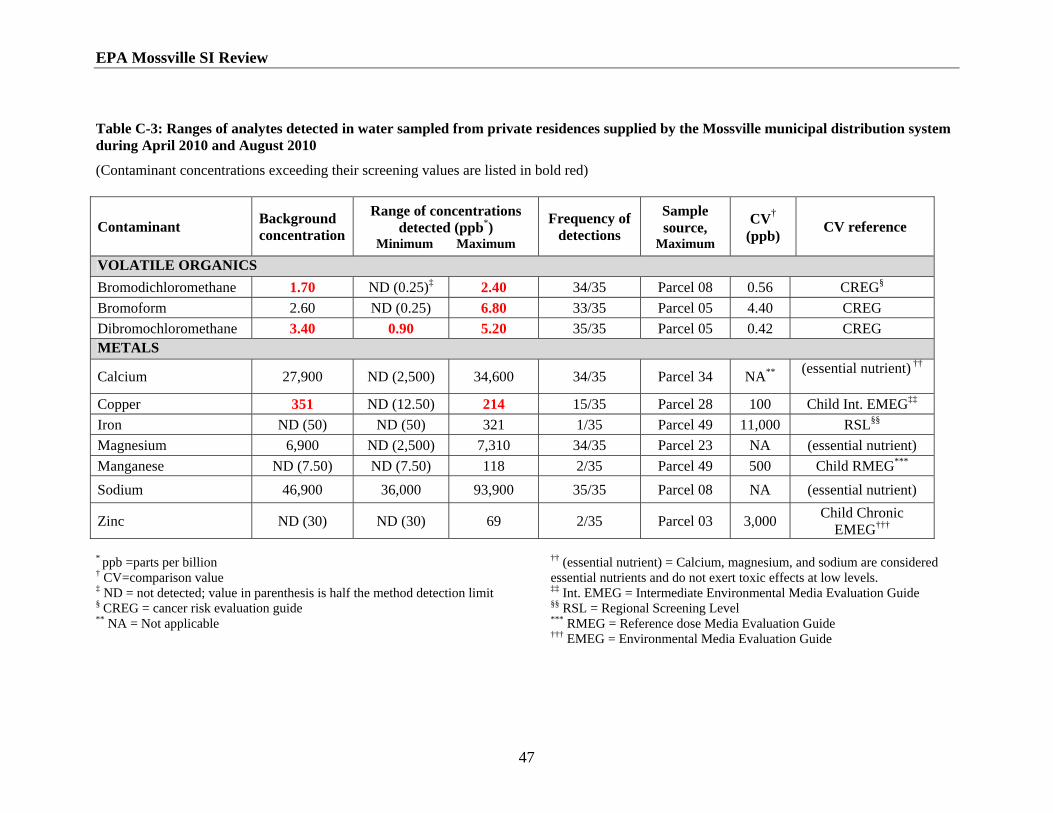
EPA Mossville SI Review
47
Table C-3: Ranges of analytes detected in water sampled from private residences supplied by the Mossville municipal distribution system during April 2010 and August 2010
(Contaminant concentrations exceeding their screening values are listed in bold red)
Contaminant Background concentration
Range of concentrations detected (ppb*)
Minimum Maximum
Frequency of detections
Sample source,
Maximum
CV† (ppb)
CV reference
VOLATILE ORGANICS
Bromodichloromethane 1.70 ND (0.25)‡ 2.40 34/35 Parcel 08 0.56 CREG§
Bromoform 2.60 ND (0.25) 6.80 33/35 Parcel 05 4.40 CREG
Dibromochloromethane 3.40 0.90 5.20 35/35 Parcel 05 0.42 CREG METALS
Calcium 27,900 ND (2,500) 34,600 34/35 Parcel 34 NA** (essential nutrient) ††
Copper 351 ND (12.50) 214 15/35 Parcel 28 100 Child Int. EMEG‡‡
Iron ND (50) ND (50) 321 1/35 Parcel 49 11,000 RSL§§
Magnesium 6,900 ND (2,500) 7,310 34/35 Parcel 23 NA (essential nutrient)
Manganese ND (7.50) ND (7.50) 118 2/35 Parcel 49 500 Child RMEG***
Sodium 46,900 36,000 93,900 35/35 Parcel 08 NA (essential nutrient)
Zinc ND (30) ND (30) 69 2/35 Parcel 03 3,000 Child Chronic
EMEG††† * ppb =parts per billion † CV=comparison value ‡ ND = not detected; value in parenthesis is half the method detection limit § CREG = cancer risk evaluation guide
** NA = Not applicable
†† (essential nutrient) = Calcium, magnesium, and sodium are considered essential nutrients and do not exert toxic effects at low levels. ‡‡ Int. EMEG = Intermediate Environmental Media Evaluation Guide §§ RSL = Regional Screening Level
*** RMEG = Reference dose Media Evaluation Guide
††† EMEG = Environmental Media Evaluation Guide

EPA Mossville SI Review
48
Table C-4: Ranges of analytes detected in water sampled from distribution system monitoring locations for the Mossville municipal distribution system during April 2010 and August 2010
(Contaminant concentrations exceeding their screening values are listed in bold red)
Contaminant Background concentration
Range of concentrations detected (ppb*)
Minimum Maximum
Frequency of detections
Sample source,
Maximum
CV† (ppb)
CV reference
VOLATILE ORGANICS
Bromodichloromethane 1.70 0.70 1.60 5/5 Tap 2 0.56 CREG‡
Bromoform 2.60 0.70 2.30 5/5 Tap 3 4.40 CREG
Dibromochloromethane 3.40 1.4 2.7 5/5 Tap 3 0.42 CREG METALS
Calcium 27,900 27,600 30,900 5/5 Tap 2 NA§ (essential nutrient) **
Magnesium 6,900 6,900 7,200 5/5 Tap 2 NA (essential nutrient)
Sodium 46,900 36,200 40,000 5/5 Tap 1 NA (essential nutrient) * ppb =parts per billion † CV=comparison value ‡ CREG = cancer risk evaluation guide limit § NA = Not applicable **(essential nutrient) = Calcium, magnesium, and sodium are considered essential nutrients and do not exert toxic effects at low levels.

EPA Mossville SI Review
49
Table C-5: Ranges of analytes detected in surface water sampled from the Mossville area of interest during April 2010 and August 2010
Contaminant Range of concentrations
detected (ppb*) Minimum Maximum
Frequency of detections
Sample source, Maximum
CV† (ppb)
CV reference
METALS
Calcium 17,000 32,600 4/4 -- NA ‡ (essential nutrient)§
Magnesium ND (2,500)** 10,800
2/4 (both from Pond C)
Pond C NA (essential nutrient)
Sodium 13,500 43,900 4/4 Pond C NA (essential nutrient)
* ppb =parts per billion † CV=comparison value ‡ NA = Not applicable §(essential nutrient) = Calcium, magnesium, and sodium are considered essential nutrients and do not exert toxic effects at low levels. ** ND = not detected; value in parenthesis is half the method detection limit

EPA Mossville SI Review
50
Table C-6: Ranges of analytes detected in sediment sampled from the Mossville area of interest during April 2010 and August 2010
(Contaminant concentrations exceeding their screening values are listed in bold red)
Contaminant Range of concentrations
detected (ppb*) Minimum Maximum
Frequency of detections
Sample source,
Maximum
CV† (ppb)
CV reference
DIOXINS AND FURANS 1,2,3,4,6,7,8,9-OCDD 0.403 0.882 4/4 Pond C NA‡ NA
1,2,3,4,6,7,8,9-OCDF ND (0.005)§ 0.041 1/4 Pond B NA NA
1,2,3,4,6,7,8-HpCDD 0.010 0.071 4/4 Pond B NA NA
1,2,3,4,6,7,8-HpCDF 0.003 0.040 1/4 Pond B NA NA
SEMI-VOLATILE ORGANICS 4-Methylphenol (p-Cresol)
105 2,900 1/4 Pond A 610,000 RSL**
VOLATILE ORGANICS Acetone 21 100 4/4 Pond B 50,000,000 Child RMEG††
Toluene 11 16 2/4 (both
from Pond C) Pond C 1,000,000 Child Int.‡‡ EMEG§§
METALS Aluminum 930,000 4,800,000 4/4 Pond A 50,000,000 Child Chronic EMEG
Arsenic 650 9,900 3/4 Pond B 20,000 Child Chronic EMEG
Barium 26,400 186,000 3/4 Pond B 10,000,000 Child Chronic EMEG
Calcium 2,930,000 16,400,000 4/4 Pond A NA (essential nutrient) ***
Chromium 2,200 14,900 4/4 Pond B
50,000 (Chromium VI),
75,000,000 (Chromium III)
Child Chronic EMEG (Chromium VI),
Child RMEG (Chromium III)
Copper 1,650 18,400 1/4 Pond B 500,000 Child Int. EMEG
Iron 1,750,000 24,500,000 4/4 Pond B 55,000,000 RSL

EPA Mossville SI Review
51
Contaminant Range of concentrations
detected (ppb*) Minimum Maximum
Frequency of detections
Sample source,
Maximum
CV† (ppb)
CV reference
Lead 2,800 24,600 4/4 Pond B NA NA
Magnesium ND
(331,000) 1,590,000 1/4 Pond A NA (essential nutrient)
Manganese 42,900 895,000 4/4 Pond B 2,500,000 Child RMEG
Vanadium 3,300 37,000 4/4 Pond B 500,000 Child Int. EMEG
Zinc ND (3,950) 4,800,000 2/4 Pond B 15,000,000 Child Chronic EMEG * ppb =parts per billion † CV=comparison value ‡ NA = not applicable § ND = not detected; value listed in parenthesis is half the method detection limit ** RSL = Regional Screening Level †† RMEG = Reference dose Media Evaluation Guide ‡‡Int. = Intermediate
§§ EMEG = Environmental Media Evaluation Guide *** (essential nutrient) = Calcium, magnesium, and sodium are considered essential nutrients and do not exert toxic effects at low levels.

EPA Mossville SI Review
52
Table C-7: Ranges of analytes detected in soil sampled from 0-12 inches below ground surface within the Mossville area of interest during April 2010 and August 2010
(Contaminant concentrations exceeding their screening values are listed in bold red)
Contaminant Background
concentration
Range of concentrations detected (ppb*)
Minimum Maximum
Frequency of detections
Sample source,
Maximum
CV† (ppb)
CV reference
DIOXINS AND FURANS
1,2,3,4,6,7,8,9-OCDD 13.400 ND (0.004)‡ 23.700 57/60 Parcel 16 NA§ NA
1,2,3,4,6,7,8,9-OCDF ND (0.004) ND (0.004) 0.262 51/60 Parcel 46 NA NA
1,2,3,4,6,7,8-HpCDD 0.064 0.008 0.563 60/60 Parcel 10 NA NA
1,2,3,4,6,7,8-HpCDF ND (0.002) ND (0.002) 0.232 53/60 Parcel 10-A NA NA
1,2,3,4,7,8,9-HpCDF ND (0.002) ND (0.002) 0.102 7/60 Parcel 46 NA NA
1,2,3,4,7,8-HxCDD ND (0.002) ND (0.002) 0.032 2/60 Parcel 10-A NA NA
1,2,3,4,7,8-HxCDF ND (0.002) ND (0.002) 0.110 24/60 Parcel 46 NA NA
1,2,3,6,7,8-HxCDD ND (0.002) ND (0.002) 0.039 23/60 Parcel 10 NA NA
1,2,3,6,7,8-HxCDF ND (0.002) ND (0.002) 0.047 8/60 Parcel 46 NA NA
1,2,3,7,8,9-HxCDD ND (0.002) ND (0.002) 0.040 21/60 Parcel 10 0.11 CREG**
1,2,3,7,8,9-HxCDF ND (0.002) ND (0.002) 0.043 2/60 Parcel 46 NA NA
1,2,3,7,8-PeCDD ND (0.002) ND (0.002) 0.015 1/60 Parcel 10 NA NA
1,2,3,7,8-PeCDF ND (0.002) ND (0.002) 0.029 5/60 Parcel 46 NA NA
2,3,4,6,7,8-HxCDF ND (0.002) ND (0.002) 0.044 8/60 Parcel 10-A NA NA
2,3,4,7,8-PeCDF ND (0.002) ND (0.002) 0.047 7/60 Parcel 46 1.5 Child Int. ††
EMEG‡‡
2,3,7,8-TCDD ND (0.0004) ND (0.0004) 0.006 1/60 Parcel 10 0.050 Child Chronic
EMEG 2,3,7,8-TCDF ND (0.0004) ND (0.0004) 0.040 19/60 Parcel 10 NA NA
POLYCHLORINATED BIPHENYLS

EPA Mossville SI Review
53
Contaminant Background
concentration
Range of concentrations detected (ppb*)
Minimum Maximum
Frequency of detections
Sample source,
Maximum
CV† (ppb)
CV reference
Aroclor-1254 ND (17.50) ND (17.50) 310 2/49 Parcel 10 1,000 Child Chronic
EMEG SEMI-VOLATILE ORGANICS
Benzaldehyde ND (90) ND (85) 500 9/49 Parcel 22 5,000,000 Child RMEG§§
Benzo (a) anthracene ND (90) ND (85) 660 1/49 Parcel 10 150 RSL***
Benzo (a) pyrene ND (90) ND (85) 850 2/49 Parcel 10 96 CREG
Benzo (b) fluoranthene ND (90) ND (85) 880 5/49 Parcel 10 150 RSL
Benzo (g,h,i) perylene ND (90) ND (85) 580 3/49 Parcel 10 NA NA
Benzo (k) fluoranthene ND (90) ND (85) 850 2/49 Parcel 10 1,500 RSL Bis(2-ethylhexyl)phthalate
ND (90)ND (85) 2,100 22/49 Parcel 10 35,000 RSL
Butyl benzyl phthalate ND (90) ND (85) 1,600 3/49 Parcel 13 10,000,000 Child RMEG
Caprolactam ND (90) ND (85) 250 1/49 Parcel 43 25,000,000 Child RMEG
Chrysene ND (90) ND (85) 890 3/49 Parcel 10 15,000 RSL
Fluoranthene ND (90)
ND (85) 1,400 2/49 Parcel 10 20,000,000 Child Int.
EMEG Indeno (1,2,3-cd) pyrene ND (90) ND (85) 540 1/49 Parcel 10 150 RSL
Naphthalene ND (90) ND (85) 320 1/49 Parcel 18 1,000,000 Child RMEG
Phenanthrene ND (90)
ND (85) 510 2/49 Parcel 10 2,100,000 RECAP Soil
SSni††† Pyrene ND (90) ND (85) 1,300 3/49 Parcel 10 1,500,000 Child RMEG
PESTICIDES
4,4'-DDE ND (1.75) ND (1.70) 8.50 4/49 Parcel 01 2,100 CREG
4,4'-DDT ND (1.75) ND (1.70) 24 9/49 Parcel 10 2,100 CREG
Dieldrin ND (1.75) ND (1.70) 10 2/49 Parcel 10 44 CREG
Endrin ND (1.75) ND (1.70) 5.70 3/49 Parcel 12 15,000 Child Int.

EPA Mossville SI Review
54
Contaminant Background
concentration
Range of concentrations detected (ppb*)
Minimum Maximum
Frequency of detections
Sample source,
Maximum
CV† (ppb)
CV reference
EMEG
Endrin aldehyde ND (1.75) ND (1.70) 7.30 1/49 Parcel 31 NA NA
Endrin ketone ND (1.75) ND (1.70) 4.40 1/49 Parcel 06 NA NA
gamma-Chlordane ND (0.90) ND (0.85) 70 3/49 Parcel 46 2,000 CREG
Heptachlor epoxide ND (0.90) ND (0.85) 8.10 1/49 Parcel 46 77 CREG
Methoxychlor ND (9) ND (8.50) 37 1/49 Parcel 10 250,000 Child Int.
EMEG VOLATILE ORGANICS
2-Butanone ND (6) ND (4.65) 110 3/49 Parcel 47 30,000,000 Child RMEG
Acetone 31 ND (4.65) 330 24/49 Parcel 14 100,000,000 Child Int.
EMEG
Chloroform ND (3) ND (2.35) 9.50 2/49 Parcel 12 500,000 Child Chronic
EMEG Methylene chloride ND (3) ND (2.35) 16 4/49 Parcel 02 350,000 CREG
METALS
Aluminum 3,340,000 1,120,000 37,600,000 49/49 Parcel 04 50,000,000 Child Chronic
EMEG
Arsenic ND (600) 600 16,700 48/49 Parcel 04 20,000 Child Chronic
EMEG
Barium 86,100 30,800 2,070,000 49/49 Parcel 04 10,000,000 Child Chronic
EMEG
Beryllium ND (290) ND (255) 2,.400 2/49 Parcel 04 100,000 Child Chronic
EMEG
Cadmium ND (290) ND (255) 6,500 5/49 Parcel 10 5,000 Child Chronic
EMEG
Calcium 3,030,000 ND (318,000) 75,900,000 49/49 Parcel 04 NA (essential
nutrient)‡‡‡
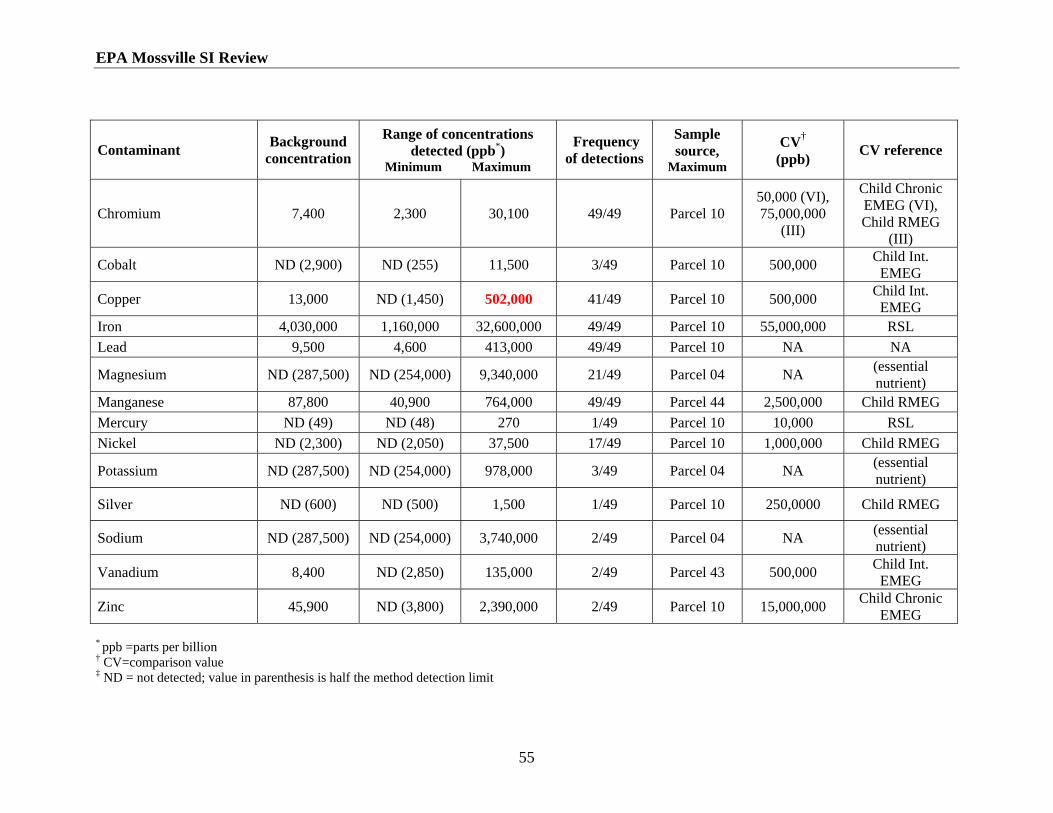
EPA Mossville SI Review
55
Contaminant Background
concentration
Range of concentrations detected (ppb*)
Minimum Maximum
Frequency of detections
Sample source,
Maximum
CV† (ppb)
CV reference
Chromium 7,400 2,300 30,100 49/49 Parcel 10 50,000 (VI), 75,000,000
(III)
Child Chronic EMEG (VI), Child RMEG
(III)
Cobalt ND (2,900) ND (255) 11,500 3/49 Parcel 10 500,000 Child Int. EMEG
Copper 13,000 ND (1,450) 502,000 41/49 Parcel 10 500,000 Child Int. EMEG
Iron 4,030,000 1,160,000 32,600,000 49/49 Parcel 10 55,000,000 RSL
Lead 9,500 4,600 413,000 49/49 Parcel 10 NA NA
Magnesium ND (287,500) ND (254,000) 9,340,000 21/49 Parcel 04 NA (essential nutrient)
Manganese 87,800 40,900 764,000 49/49 Parcel 44 2,500,000 Child RMEG
Mercury ND (49) ND (48) 270 1/49 Parcel 10 10,000 RSL
Nickel ND (2,300) ND (2,050) 37,500 17/49 Parcel 10 1,000,000 Child RMEG
Potassium ND (287,500) ND (254,000) 978,000 3/49 Parcel 04 NA (essential nutrient)
Silver ND (600) ND (500) 1,500 1/49 Parcel 10 250,0000 Child RMEG
Sodium ND (287,500) ND (254,000) 3,740,000 2/49 Parcel 04 NA (essential nutrient)
Vanadium 8,400 ND (2,850) 135,000 2/49 Parcel 43 500,000 Child Int.
EMEG
Zinc 45,900 ND (3,800) 2,390,000 2/49 Parcel 10 15,000,000 Child Chronic
EMEG * ppb =parts per billion † CV=comparison value ‡ ND = not detected; value in parenthesis is half the method detection limit

EPA Mossville SI Review
56
§ NA = not applicable ** CREG = cancer risk evaluation guide †† Int. = Intermediate
‡‡EMEG = Environmental Media Evaluation Guide §§RMEG = Reference dose Media Evaluation Guide
***RSL = Regional Screening Level ††† RECAP Soil SSni =Louisiana Department of Environmental Quality Risk Evaluation/Corrective Action Program Screening Option Soil Screening Standard
for Non-industrial exposures ‡‡‡(essential nutrient) = Calcium, magnesium, and sodium are considered essential nutrients and do not exert toxic effects at low levels.
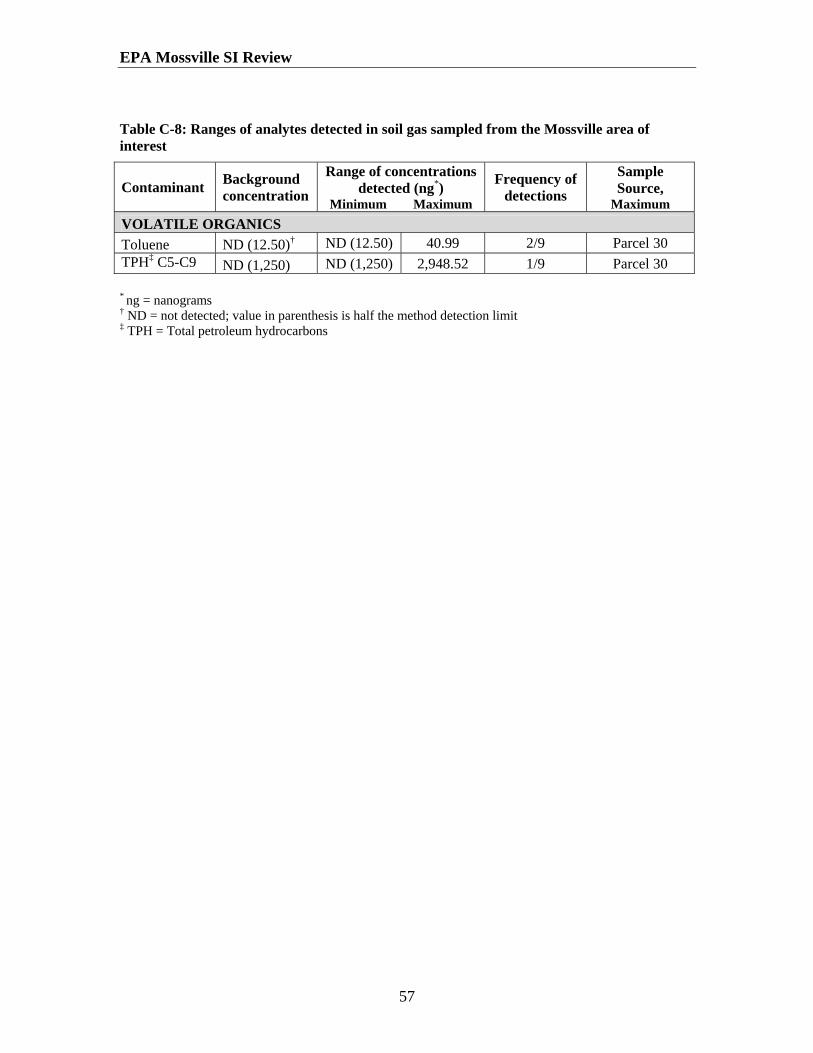
EPA Mossville SI Review
57
Table C-8: Ranges of analytes detected in soil gas sampled from the Mossville area of interest
Contaminant Background concentration
Range of concentrations detected (ng*)
Minimum Maximum
Frequency of detections
Sample Source,
Maximum
VOLATILE ORGANICS
Toluene ND (12.50)† ND (12.50) 40.99 2/9 Parcel 30 TPH‡ C5-C9 ND (1,250) ND (1,250) 2,948.52 1/9 Parcel 30 * ng = nanograms † ND = not detected; value in parenthesis is half the method detection limit ‡ TPH = Total petroleum hydrocarbons

EPA Mossville SI Review
58
Table C-9: Example of toxicity equivalency quotients (TEQs) for dioxins and furans, Surface Water data from Pond A
Contaminant* Concentration
(ppb*) TEF† TEQ‡
2,3,7,8-TCDD 0.00545 1 0.00545
1,2,3,7,8-PeCDD 0.01520 1 0.01520
1,2,3,4,7,8-HxCDD 0.01430 0.1 0.00143
1,2,3,7,8,9-HxCDD 0.03960 0.1 0.00396
1,2,3,6,7,8-HxCDD 0.03940 0.1 0.00394
1,2,3,4,6,7,8-HpCDD 0.56300 0.01 0.00563
1,2,3,4,6,7,8,9-OCDD 5.19000 0.0003 0.00156
2,3,7,8-TCDF 0.03620 0.1 0.00362
1,2,3,7,8-PeCDF 0.01770 0.03 0.00053
2,3,4,7,8-PeCDF 0.02480 0.3 0.00744
1,2,3,4,7,8-HxCDF 0.02190 0.1 0.00219
1,2,3,6,7,8-HxCDF 0.01970 0.1 0.00197
2,3,4,6,7,8-HxCDF 0.02230 0.1 0.00223
1,2,3,7,8,9-HxCDF ND§ (0.00235) 0.1 0.00024
1,2,3,4,6,7,8-HpCDF 0.14500 0.01 0.00145
1,2,3,4,7,8,9-HpCDF 0.00802 0.01 0.00008
1,2,3,4,6,7,8,9-OCDF 0.17900 0.0003 0.00005
Total TEQ
0.05697
*ppb = parts per billion †TEF = toxicity equivalency factors ‡TEQ = toxicity equivalency quotient §ND = not detected; value in parenthesis is half the method detection limit TEQ information retrieved from: Van den Berg, M., LS Birnbaum, M Denison, M De Vito, W Farland, M Feeley, H Fiedler, H Hakansson, A Hanberg, L Haws, M Rose, S Safe, D Schrenk, C Tohyama, A Tritscher, Jo Tuomisto, M Tysklind, N Walker, and RE Peterson. 2006. The 2005 World Health Organization Re-evaluation of Human and Mammalian Toxic Equivalency Factors for Dioxins and Dioxin-like Compounds. Toxicological Sciences 93(2), 223–241.

EPA Mossville SI Review
59
Table C-10: Toxicity equivalency quotients (TEQs) for polycyclic aromatic hydrocarbons, Soil data from Parcel 10.
PAH* Concentration
(ppb†) TEF‡ TEQ§**
Acenaphthene ND (105)** 0.001 0.105
Acenaphthylene ND (105) 0.001 0.105
Anthracene ND (105) 0.01 1.05
Benzo(a)anthracene 660 0.1 66
Benzo(a)pyrene 850 1 850
Benzo(b)fluoranthene 880 0.1 88
Benzo(k)fluoranthene 850 0.1 85
Chrysene 890 0.01 8.9
Dibenzo(a,h)anthracene ND (105) 5 525
Fluoranthene 1400 0.001 1.4
Fluorene ND (105) 0.001 0.105
Indeno(1,2,3-cd)pyrene 540 0.1 5.4
Phenanthrene 510 0.001 0.51
Pyrene 1300 0.001 1.3
Total PAH TEQ
1632.875
*PAH = polycyclic aromatic hydrocarbon †ppb = parts per billion ‡TEF = toxicity equivalency factors § TEQ = toxicity equivalency quotient ** ND = not detected; value in parenthesis is half the method detection limit TEFs retrieved from: Agency for Toxic Substances and Disease Registry. Toxicological Profile for Polycyclic Aromatic Hydrocarbons. Atlanta. US Department of Health and Human Services; 1995.
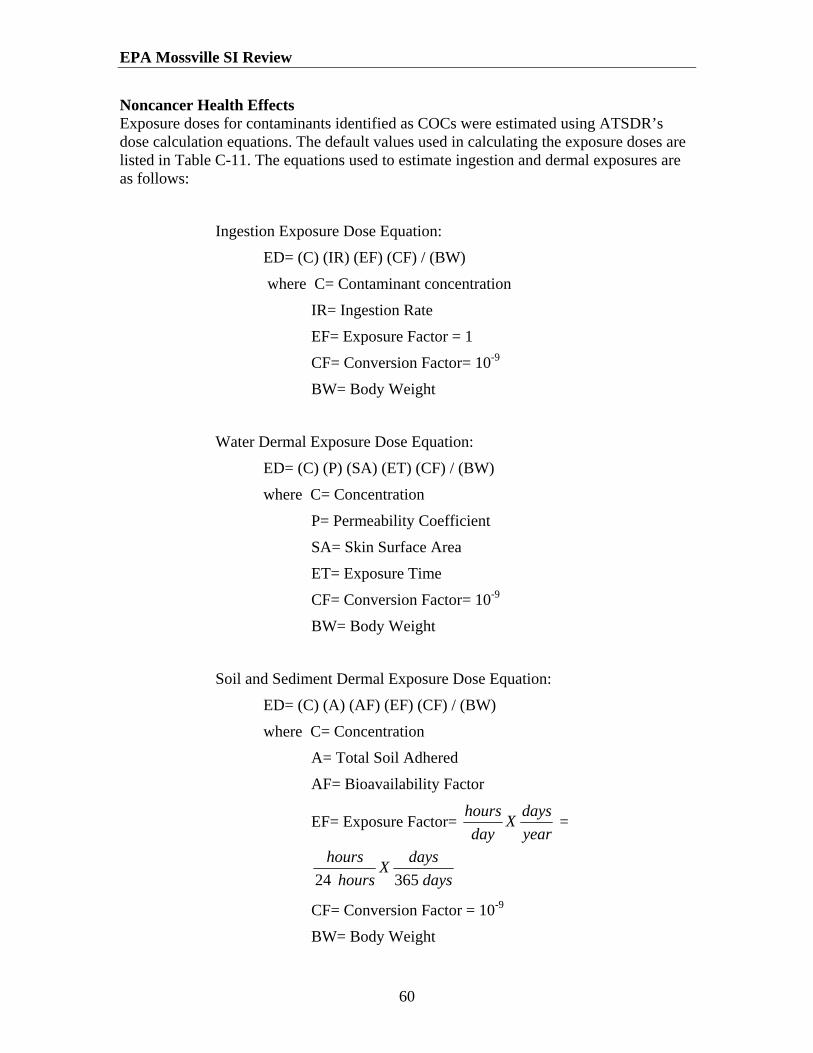
EPA Mossville SI Review
60
Noncancer Health Effects Exposure doses for contaminants identified as COCs were estimated using ATSDR’s dose calculation equations. The default values used in calculating the exposure doses are listed in Table C-11. The equations used to estimate ingestion and dermal exposures are as follows:
Ingestion Exposure Dose Equation:
ED= (C) (IR) (EF) (CF) / (BW)
where C= Contaminant concentration
IR= Ingestion Rate
EF= Exposure Factor = 1
CF= Conversion Factor= 10-9
BW= Body Weight
Water Dermal Exposure Dose Equation:
ED= (C) (P) (SA) (ET) (CF) / (BW)
where C= Concentration
P= Permeability Coefficient
SA= Skin Surface Area
ET= Exposure Time
CF= Conversion Factor= 10-9
BW= Body Weight
Soil and Sediment Dermal Exposure Dose Equation:
ED= (C) (A) (AF) (EF) (CF) / (BW)
where C= Concentration
A= Total Soil Adhered
AF= Bioavailability Factor
EF= Exposure Factor= year
daysX
day
hours =
days
daysX
hours
hours
36524
CF= Conversion Factor = 10-9
BW= Body Weight

EPA Mossville SI Review
61
Table C-11: Default values used to estimate incidental ingestion and dermal exposure doses for contaminants of concern at the Mossville area of interest
Ingestion: Intake Rate Children Adults
Water 1 L/day* 2 L/day
Pond Water (incidental intake) 100 ml/day† 200 ml/day
Sediment/Soil (incidental intake) 200 mg/day‡ 100 mg/day Dermal: Skin Surface Area (100% exposed)
15,235 cm2§ (adolescents 12-17 yrs**) 8750 cm2 (children 1-11 yrs)
3500 cm2 (infants) 19,400 cm2
Dermal: Total Soil/Sediment Adherence
3,044.62 mg†† (adolescents 12-17 yrs) 1,750.875 mg (children 1-11 yrs)
700.28 mg (infants) 1,357.99 mg
Exposure Factor for water ingestion:
1days
daysX
hours
hours
365
365
24
24
Exposure Factor for dermal water exposures:
0.083 days
daysX
hours
hours
365
365
24
2
Exposure Factor for soil exposures:
0.083days
daysX
hours
hours
365
365
24
2
Exposure Factor for recreational exposures (pond water and sediment):
0.016days
daysX
hours
hours
365
72
24
2
Weight:
for Ingestion Exposures16 kg‡‡ (children 1-6 yrs)
10 kg (infants) 70 kg
for Dermal Exposures
50 kg (adolescents 12-17 yrs) 30 kg (children 1-11 yrs)
10 kg (infants) 70 kg
Chemical-Specific Dermal Factors
Permeability Coefficient Water (cm/hr§§)
Bioavailability Factor Soil/Sediment (unitless)
metals -- 0.1 bromodichloromethane 0.000189 --
bromoform 0.0000921 -- dibromochloromethane 0.000132 --
copper 0.001 -- dieldrin 0.000472 -- dioxins 0.0265 0.1
PAHs 0.0241 0.1 * L/day = liters per day

EPA Mossville SI Review
62
†ml/day = liters per day ‡mg/day = milligrams per day § cm2 = cubic centimeters **yrs = years ††mg = milligrams ‡‡kg = kilograms §§cm/hr = centimeters per hour

EPA Mossville SI Review
63
For dermal exposures, some chemical-specific permeability coefficients (for water exposures) or bioavailability factors (for soil or sediment exposures) were available to determine how much of each contaminant would be absorbed from contact with the soil. The permeability coefficients used to estimate dermal absorption in the Mossville AOI are listed in Table C-11. The estimated exposure doses were compared to the appropriate health guideline values, which are doses below which adverse health effects are unlikely. These values are based on valid toxicological studies. The health guideline values used in the evaluation of Mossville samples are listed below:
A reference dose (RfD) is an estimated daily lifetime exposure to a substance that is unlikely to cause adverse noncancer health effects to human populations. RfDs may be found in the EPA’s Integrated Risk Information System (IRIS) at http://www.epa.gov/iris.
A minimum risk level (MRL) is an estimated daily human exposure to a substance that is not likely to cause adverse noncancer health effects over a specified duration of exposure. Developed by the ATSDR, MRLs are not intended to be used as predictors of adverse health effects. MRLs may be found at http://www.atsdr.cdc.gov/mrls.html.
Tables C-12 and C-13 list example exposure doses for total dioxin and total PAH exposures in the Mossville AOI, as estimated from the method detection limits. Note that the majority of dioxins and PAHs were reported as non-detects; these exposure doses are therefore not actual exposures and were not used to make health-based assessments. The estimated total cancer risks calculated in these tables demonstrate how contaminants that fall below method detection limits may still be present at concentrations that could require further evaluation.
Tables C-14 through C-15 list the exposure doses for contaminants detected in the Mossville AOI. Exposure doses that exceeded the health guideline values were compared to the no-observed-adverse-effects level (NOAEL) or lowest-observed-adverse-effects level (LOAEL) for that contaminant. The NOAEL is the lowest level of continuous exposure to a contaminant that has been observed to cause no adverse health effects. If no NOAEL was available, exposure doses that exceeded the health guideline values were compared to the lowest-observed-adverse-effects level (LOAEL), the lowest level of continuous exposure to a contaminant that has been observed to result in adverse health effects. Exposure doses that do not exceed NOAELs or LOAELs are not considered likely to pose harm to public health. If a contaminant exposure dose exceeds a NOAEL or LOAEL, available toxicological studies will be reviewed to determine which organ(s) are affected by similar exposure doses.
Calculation of Carcinogenic Risk
SEET estimated the lifetime excess cancer risk (LECR) for COCs that are recognized as potential cancer-causing agents. The LECR represents the increase in the probability of

EPA Mossville SI Review
64
an individual developing cancer as a result of being exposed to a contaminant over a lifetime. Where appropriate, the estimated increases in cancer risk are listed in Tables C-12 through C-15.
Cancer risks for all contaminants except dioxins and furans were calculated for each age group by multiplying each age group’s exposure dose by EPA’s cancer slope factor (available at http://www.epa.gov/iris) and summing the cancer risks across age groups and exposure routes (ingestion or dermal) for each potential cancer-causing agent. The results estimate the worst-case maximum increase in the risk of developing cancer after exposure to the contaminant. This estimation is accurate within one order of magnitude. The risk above which cancer may potentially be due to an external cause rather than to population variation is 10-6 or 1 excess cancer per 1,000,000 people.
The EPA is currently reassessing the toxicity of 2,3,7,8-tetrachlorodibenzo-p-dioxin2. Cancer risks for this contaminant and related dioxins and furans were therefore estimated using the California Office of Environmental Health Hazard Assessment’s oral slope factor (available at http://www.oehha.ca.gov/risk/ChemicalDB/index.asp).
Because of the uncertainties involved in estimating carcinogenic risk, ATSDR employs a weight-of-evidence approach in describing carcinogenic risk, using words as well as numeric terms.3 Therefore, a calculated cancer risk of 2 excess cancers per 10,000 people might actually be 2 excess cancers per 1,000 people or 2 excess cancers per 100,000 people.
Note that the estimated cancer risks PAHs in Table C-13 included contaminants that were not detected in environmental samples. These estimates were not used to make health-based assessments.
2 http://www.epa.gov/iris/subst/1024.htm 3 Agency for Toxic Substances and Disease Registry.1993. Cancer policy framework. Atlanta, Georgia: US Department of Health and Human Services.

EPA Mossville SI Review
65
Table C-12: Example of estimated total dioxin exposure doses in the Mossville area of interest
(Dioxins were not detected in many of the soil samples. These estimates are calculated using half the detection limit where actual detected concentrations are unavailable)
Source Health Guidelines
(mg/kg/day*)
Ingestion dose(mg/kg/day)
Dermal dose(mg/kg/day)
CSF (mg/kg/day)-1
Increased Cancer Risk Total Cancer Risk Ingestion Dermal
Soil, Parcel 10 (total TEQ = 5.70 x 10-02 ppb) infant ED:
7.00 x 10⁻¹⁰ (oral RfD)
9.46 x 10⁻¹¹ 3.31 x 10⁻¹¹
130,000
1.23 x 10-05 4.30 x 10E-06 1.66 x 10-05
child ED: 5.91 x 10⁻¹¹ 2.76 x 10⁻¹¹ 7.68 x 10-06 3.59 x 10-06 1.13 x 10-05
adolescent ED -- 2.88 x 10⁻¹¹ 3.74 x 10-06 3.74 x 10-06
adult ED: 6.76 x 10⁻¹² 9.18 x 10⁻¹² 8.79 x 10-07 1.19 x 10-06 2.07 x 10-06
Lifetime Excess Cancer Risk from dioxins in Soil from Parcel 10 = 3.37 x 10-05or 0.0000337 (approximately 3 excess cancers per 100,000 people)
* mg/kg/day = milligrams per kilogram per day † TEQ = toxicity equivalency quotient ‡ ppb = parts per billion § ED = exposure dose ** RfD = reference dose
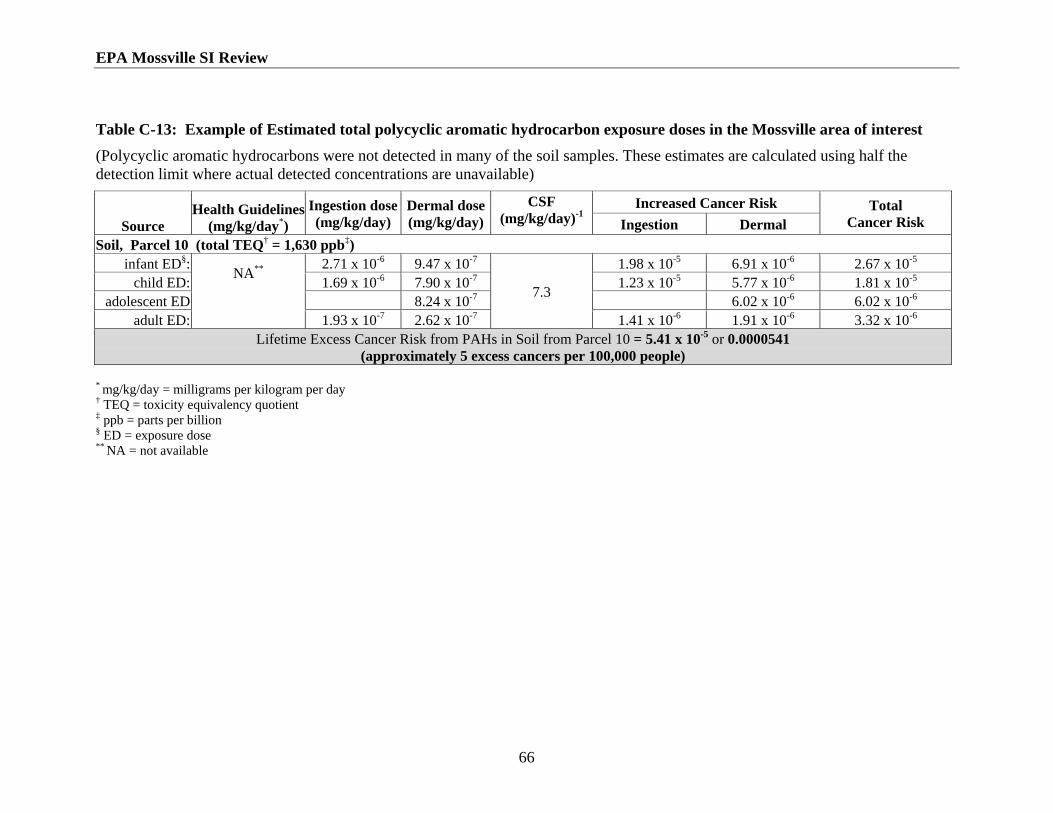
EPA Mossville SI Review
66
Table C-13: Example of Estimated total polycyclic aromatic hydrocarbon exposure doses in the Mossville area of interest
(Polycyclic aromatic hydrocarbons were not detected in many of the soil samples. These estimates are calculated using half the detection limit where actual detected concentrations are unavailable)
Source Health Guidelines
(mg/kg/day*)
Ingestion dose(mg/kg/day)
Dermal dose(mg/kg/day)
CSF (mg/kg/day)-1
Increased Cancer Risk Total Cancer Risk Ingestion Dermal
Soil, Parcel 10 (total TEQ† = 1,630 ppb‡) infant ED§:
NA** 2.71 x 10⁻⁶ 9.47 x 10⁻⁷
7.3
1.98 x 10⁻⁵ 6.91 x 10⁻⁶ 2.67 x 10⁻⁵ child ED: 1.69 x 10⁻⁶ 7.90 x 10⁻⁷ 1.23 x 10⁻⁵ 5.77 x 10⁻⁶ 1.81 x 10⁻⁵
adolescent ED 8.24 x 10⁻⁷ 6.02 x 10⁻⁶ 6.02 x 10⁻⁶ adult ED: 1.93 x 10⁻⁷ 2.62 x 10⁻⁷ 1.41 x 10⁻⁶ 1.91 x 10⁻⁶ 3.32 x 10⁻⁶
Lifetime Excess Cancer Risk from PAHs in Soil from Parcel 10 = 5.41 x 10⁻⁵ or 0.0000541 (approximately 5 excess cancers per 100,000 people)
* mg/kg/day = milligrams per kilogram per day † TEQ = toxicity equivalency quotient ‡ ppb = parts per billion § ED = exposure dose ** NA = not available

EPA Mossville SI Review
67
Table C-14: Assessment of contaminants of concern detected in Mossville municipal water
Contaminant Health Guidelines
(mg/kg/day*)
Ingestion dose(mg/kg/day)
Dermal dose (mg/kg/day)
CSF Increased Cancer Risk
Total Cancer
Risk (mg/kg/day)-1 Ingestion Dermal
Bromodichloromethane (2.4 ppb†, Parcel 08)
infant ED‡: 0.02
(chronic oral MRL§)
2.40 x 10⁻⁴ 1.39 x 10⁻⁹ 6.2 x 10⁻² 1.49 x 10⁻⁵ 8.62 x 10⁻¹¹ 1.49 x 10⁻⁵ child ED: 1.50 x 10⁻⁴ 1.16 x 10⁻⁹ 6.2 x 10⁻² 9.30 x 10⁻⁶ 7.19 x 10⁻¹¹ 9.30 x 10⁻⁶
adolescent ED -- 1.21 x 10⁻⁹ 6.2 x 10⁻² -- 7.50 x 10⁻¹¹ 7.50 x 10⁻¹¹ adult ED: 6.86 x 10⁻⁵ 3.86 x 10⁻¹⁰ 6.2 x 10⁻² 4.25 x 10⁻⁶ 2.39 x 10⁻¹¹ 4.25 x 10⁻⁶
Lifetime Excess Cancer Risk from Bromodichloromethane in Municipal Water = 2.84 x 10-05or 0.0000284 (approximately 3 excess cancers per 100,000 people)
Bromoform (6.8 ppb, Parcel 05)
infant ED: 0.02
(chronic oral MRL)
6.80 x 10⁻⁴ 3.95 x 10⁻⁹ 7.9 x 10⁻³ 5.37 x 10⁻⁶ 3.12 x 10⁻¹¹ 5.37 x 10⁻⁶ child ED: 4.25 x 10⁻⁴ 3.29 x 10⁻⁹ 7.9 x 10⁻³ 3.36 x 10⁻⁶ 2.60 x 10⁻¹¹ 3.36 x 10⁻⁶
adolescent ED -- 3.44 x 10⁻⁹ 7.9 x 10⁻³ -- 2.72 x 10⁻¹¹ 2.72 x 10⁻¹¹ adult ED: 1.94 x 10⁻⁴ 1.09 x 10⁻⁹ 7.9 x 10⁻³ 1.53 x 10⁻⁶ 8.61 x 10⁻¹² 1.53 x 10⁻⁶
Lifetime Excess Cancer Risk from Bromform in Municipal Water = 1.03 x 10-05or 0.0000103 ( approximately 1 excess cancer per 100,000 people )
Dibromochloromethane (5.20 ppb, Parcel 05)
infant ED‡: 0.09
(chronic oral MRL)
5.20 x 10⁻⁴ 3.02 x 10⁻⁹ 8.4 x 10⁻² 4.37 x 10⁻⁵ 2.54 x 10⁻¹⁰ 4.37 x 10⁻⁵ child ED: 3.25 x 10⁻⁴ 2.52 x 10⁻⁹ 8.4 x 10⁻² 2.73 x 10⁻⁵ 2.12 x 10⁻¹⁰ 2.73 x 10⁻⁵
adolescent ED -- 2.63 x 10⁻⁹ 8.4 x 10⁻² -- 2.21 x 10⁻¹⁰ 2.21 x 10⁻¹⁰ adult ED: 1.49 x 10⁻⁴ 8.37 x 10⁻¹⁰ 8.4 x 10⁻² 1.25 x 10⁻⁵ 7.03 x 10⁻¹¹ 1.25 x 10⁻⁵
Lifetime Excess Cancer Risk from Dibromochloromethane in Municipal Water = 8.35 x 10-05 or 0.0000835 ( approximately 8 excess cancers per 100,000 people)
Copper (214 ppb, Parcel 27)
infant ED: 0.01 (intermediate oral
0.0214 1.24 x 10⁻⁷ NA** NA NA NAchild ED: 0.0134 1.04 x 10⁻⁷ NA NA NA NA
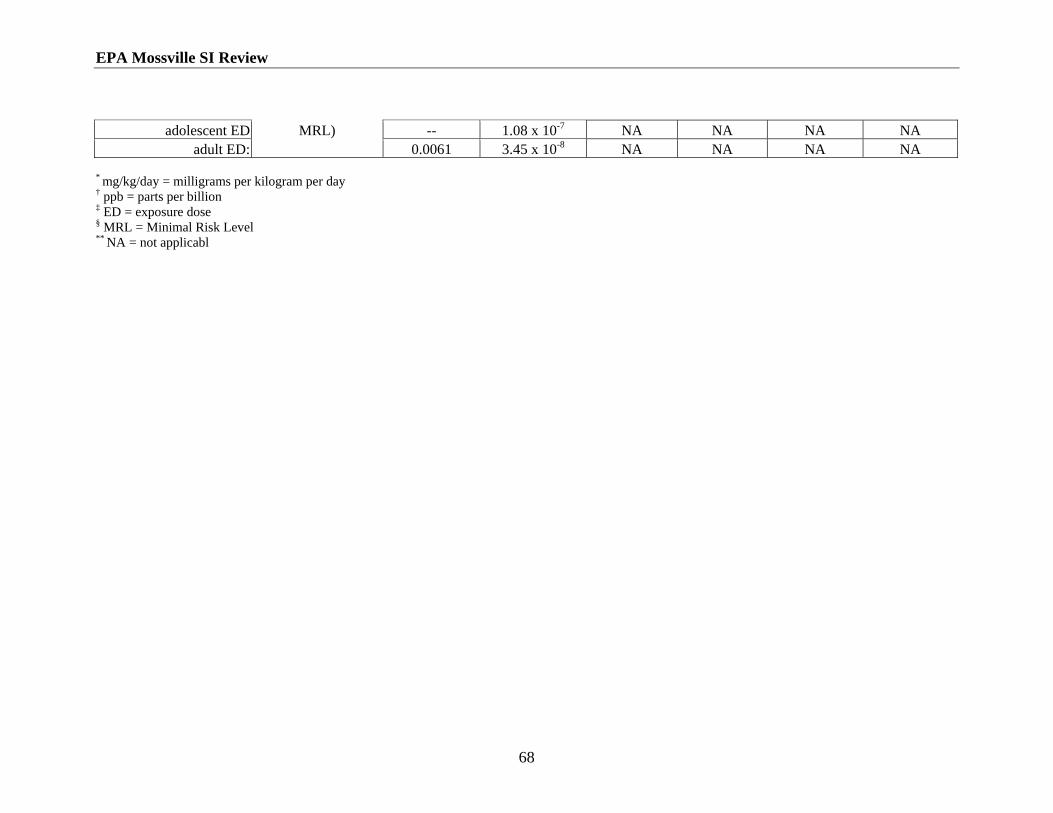
EPA Mossville SI Review
68
* mg/kg/day = milligrams per kilogram per day † ppb = parts per billion ‡ ED = exposure dose § MRL = Minimal Risk Level ** NA = not applicabl
adolescent ED MRL) -- 1.08 x 10⁻⁷ NA NA NA NAadult ED: 0.0061 3.45 x 10⁻⁸ NA NA NA NA

EPA Mossville SI Review
69
Table C-15: Assessment of contaminants of concern detected in Mossville soil
* mg/kg/day = milligrams per kilogram per day † ppb = parts per billion ‡ ED = exposure dose § RfD = reference dose **NA = not applicable
Contaminant Health Guidelines
(mg/kg/day*)
Ingestion dose (mg/kg/day)
Dermal dose (mg/kg/day)
Cadmium (6,500 ppb, Parcel 10)
infant ED: 0.0005
oral RFD
1.08 x 10⁻⁵ 3.78 x 10⁻⁶ child ED: 6.74 x 10⁻⁶ 3.15 x 10⁻⁶
adolescent ED -- 3.29 x 10⁻⁶ adult ED: 7.71 x 10⁻⁷ 1.05 x 10⁻⁶
Copper (502,000 ppb, Parcel 10)
infant ED: 0.01 intermediate oral
MRL
0.000833 0.000292
child ED: 0.000521 0.000243
adolescent ED: -- 0.000254
adult ED: 0.0000595 0.0000808

EPA Mossville SI Review
70
APPENDIX D: Toxicological Summaries

EPA Mossville SI Review
71
The toxicological summaries are based on ATSDR’s ToxFAQs (http://www.atsdr.cdc.gov/toxfaqs/index.asp). The health effects described in this appendix have been observed at much higher levels of exposure than those that occur from events of environmental contamination. The occurrences of health effects are determined by the type of contamination present, the concentration of the contaminant, the exposure pathway, the frequency and duration of a person’s exposure, and the individual sensitivity of exposed persons. Bromodichloromethane: Bromodichloromethane is a colorless, nonflammable liquid. Small amounts are formed naturally by algae in the oceans. Only small quantities of bromodichloromethane are produced in the United States for use in laboratories or to make other chemicals. Most bromodichloromethane is formed as a by-product when chlorine is added to drinking water to kill bacteria.
In water, bromodichloromethane will evaporate to the air and/or be broken down slowly by bacteria.When released to soil, most will evaporate to the air but some of it will be broken down by bacteria. Bromodichloromethane does not build up in the food chain.
The most likely way people are exposed to bromodichloromethane is by drinking chlorinated water.Some bromodichloromethane may enter your body directly through your skin when bathing or swimming.
No studies are available regarding health effects in people exposed to bromodichloromethane. Animal studies indicate that the liver, kidney, and central nervous system are affected by exposure to bromodichloromethane. The effects of high doses on the central nervous system include sleepiness and incoordination. Longer exposure to lower doses causes damage to the liver and kidneys. There is some evidence from animal studies that bromodichloromethane may cause birth defects at doses high enough to make the mother sick. It is not known if lower doses would cause birth defects.
There is evidence that eating or drinking bromodichloromethane causes liver, kidney, and intestinal cancer in rats and mice. The Department of Health and Human Services (DHHS) has determined that bromodichloromethane is reasonably anticipated to be a human carcinogen. Bromoform and Dibromochloromethane: Bromoform and dibromochloromethane are colorless to yellow, heavy, nonflammable, liquids with a sweet odor. Small amounts are formed naturally by plants in the ocean. Only small quantities of bromoform and dibromochloromethane currently are produced in the United States. Most of the bromoform and dibromochloromethane that enters the environment is formed as byproducts when chlorine is added to drinking water to kill bacteria.
When released to the environment, bromoform and dibromochloromethane are slowly broken down by bacteria and by reactions with other chemicals and sunlight. Bromoform
EPA Mossville SI Review
72
and dibromochloromethane do not build up in the food chain.The most likely way people are exposed to bromoform and dibromochloromethane is by drinking chlorinated water. Very small amounts of bromoform and dibromochloromethane may enter your body directly through your skin while bathing or swimming.
There is no conclusive evidence that bromoform or dibromochloromethane cause cancer in humans because no cancer studies of humans exposed exclusively to these chemicals are available. Studies in animals indicate that long-term intake of either bromoform or dibromochloromethane can cause liver and kidney cancer. The EPA classified bromoform as a probable human carcinogen and dibromochloromethane as a possible human carcinogen.
Cadmium: Cadmium is a natural element in the earth’s crust. It is usually found as a mineral combined with other elements. All soils and rocks, including coal and mineral fertilizers, contain some cadmium. Cadmium does not corrode easily and has many uses, including batteries, pigments, metal coatings, and plastics.
Cadmium enters soil, water, and air from mining, industry, and burning coal and household wastes. Cadmium does not break down in the environment, but can change forms. Fish, plants, and animals take up cadmium from the environment. Low levels of cadmium are found in all foods (the highest levels are found in shellfish, liver, and kidney meats). Cadmium exposures can also occur from smoking cigarettes or breathing cigarette smoke.
Breathing high levels of cadmium can severely damage the lungs. Eating food or drinking water with very high levels severely irritates the stomach, leading to vomiting and diarrhea. Long-term exposure to lower levels of cadmium in air, food, or water leads to a buildup of cadmium in the kidneys and possible kidney disease. Other long-term effects are lung damage and fragile bones. A few studies in animals indicate that younger animals absorb more cadmium than adults. Animal studies also indicate that the young are more susceptible than adults to a loss of bone and decreased bone strength from exposure to cadmium.
The Department of Health and Human Services (DHHS) has determined that cadmium and cadmium compounds are known human carcinogens.
Copper: Copper is a metal that occurs naturally throughout the environment, in rocks, soil, water, and air. Copper is an essential element in plants and animals (including humans), which means it is necessary for us to live.
Copper is used to make many different kinds of products and is also combined with other metals. Copper compounds are commonly used in agriculture to treat plant diseases like mildew, for water treatment and, as preservatives for wood, leather, and fabrics. Copper is released into the environment by mining, farming, and manufacturing operations and

EPA Mossville SI Review
73
through waste water releases into rivers and lakes. Copper is also released from natural sources, like volcanoes, windblown dusts, decaying vegetation, and forest fires. Copper does not break down in the environment. Copper compounds can break down and release free copper into the air, water, and foods.
You may be exposed to copper from breathing air, drinking water, eating foods, or having skin contact with copper, particulates attached to copper, or copper-containing compounds. Drinking water may have high levels of copper if your house has copper pipes and acidic water.
Breathing high levels of copper can cause irritation of your nose and throat. Ingesting high levels of copper can cause nausea, vomiting, and diarrhea. Very high doses of copper can cause damage to your liver and kidneys, and can even cause death. Studies in animals suggest that the young children may have more severe effects than adults, but we don't know if this would also be true in humans. A very small percentage of infants and children are unusually sensitive to copper.
The EPA has determined that copper is not classifiable as to human carcinogenicity. Dioxin (Chlorinated Dibenzo-p-dioxins (CDDs)): CDDs are a family of 75 chemically related compounds commonly known as chlorinated dioxins. In the pure form, CDDs are crystals or colorless solids. CDDs enter the environment as mixtures containing a number of individual components.
CDDs are not intentionally manufactured by industry except for research purposes. They (mainly 2,3,7,8-TCDD) may be formed during the chlorine bleaching process at pulp and paper mills. CDDs are also formed during chlorination by waste and drinking water treatment plants. They can occur as contaminants in the manufacture of certain organic chemicals. CDDs are released into the air in emissions from municipal solid waste and industrial incinerators. When released into the air, some CDDs may be transported long distances, even around the globe. When released in waste waters, some CDDs are broken down by sunlight, some evaporate to air, but most attach to soil and settle to the bottom sediment in water. CDD concentrations may build up in the food chain. Eating food, primarily meat, dairy products, and fish, makes up more than 90% of the intake of CDDs for the general population. Exposure can also come from skin contact with certain pesticides and herbicides.
The most noted health effect in people exposed to large amounts of 2,3,7,8-TCDD is chloracne. Chloracne is a severe skin disease with acne-like lesions that occur mainly on the face and upper body. Other skin effects noted in people exposed to high doses of 2,3,7,8-TCDD include skin rashes, discoloration, and excessive body hair. Changes in blood and urine that may indicate liver damage also are seen in people. Exposure to high concentrations of CDDs may induce long-term alterations in glucose metabolism and subtle changes in hormonal levels.

EPA Mossville SI Review
74
Several studies suggest that exposure to 2,3,7,8-TCDD increases the risk of several types of cancer in people. Animal studies have also shown an increased risk of cancer from exposure to 2,3,7,8-TCDD. The Department of Health and Human Services (DHHS) has determined that 2,3,7,8-TCDD may reasonably be anticipated to cause cancer.
Lead: Lead is a naturally occurring bluish-gray metal found in small amounts in the earth's crust. Lead can be found in all parts of our environment. Much of it comes from human activities including burning fossil fuels, mining, and manufacturing. Lead is used in the production of batteries, ammunition, metal products (solder and pipes), and devices to shield X-rays. Because of health concerns, lead from paints and ceramic products, caulking, and pipe solder has been dramatically reduced in recent years. The use of lead as an additive to gasoline was banned in 1996 in the United States.
Lead itself does not break down, but lead compounds are changed by sunlight, air, and water. Once lead falls onto soil, it usually sticks to soil particles. Movement of lead from soil into groundwater will depend on the type of lead compound and the characteristics of the soil.
Exposure to lead can occur through eating food or drinking water that contains lead. Water pipes in some older homes may contain lead solder. Lead can leach out into the water. Exposure to lead can also occur from spending time in areas where lead-based paints have been used and are deteriorating; working in a job where lead is used, or engaging in certain hobbies in which lead is used, such as making stained glass; and using health-care products or folk remedies that contain lead. Small children can be exposed by eating lead-based paint chips, chewing on objects painted with lead-based paint, or swallowing house dust or soil that contains lead.
Lead can affect almost every organ and system in your body. The main target for lead toxicity is the nervous system, both in adults and children. Long-term exposure of adults can result in decreased performance in some tests that measure functions of the nervous system. It may also cause weakness in fingers, wrists, or ankles. Lead exposure also causes small increases in blood pressure, particularly in middle-aged and older people and can cause anemia. Exposure to high lead levels can severely damage the brain and kidneys in adults or children and ultimately cause death. In pregnant women, high levels of exposure to lead may cause miscarriage. High level exposure in men can damage the organs responsible for sperm production.
Children are more vulnerable to lead poisoning than adults. A child who swallows large amounts of lead may develop blood anemia, severe stomachache, muscle weakness, and brain damage. If a child swallows smaller amounts of lead, much less severe effects on blood and brain function may occur. Even at much lower levels of exposure, lead can affect a child's mental and physical growth. Unborn children can be exposed to lead through their mothers. Harmful effects include premature births, smaller babies, decreased mental ability in the infant, learning difficulties, and reduced growth in young children. Some of these effects may persist beyond childhood.

EPA Mossville SI Review
75
We have no conclusive proof that lead causes cancer in humans. The Department of Health and Human Services (DHHS) has determined that lead and lead compounds are reasonably anticipated to be human carcinogens and the EPA has determined that lead is a probable human carcinogen. Polychlorinated Biphenyls (PCBs): Polychlorinated biphenyls are mixtures of up to 209 individual chlorinated compounds (known as congeners) that are often known in the U.S. by the trade name Aroclor. There are no known natural sources of PCBs. PCBs have no known smell or taste.
PCBs have been used as coolants and lubricants in transformers, capacitors, and other electrical equipment because they don't burn easily and are good insulators. Their manufacture was stopped in the U.S. in 1977. Products made before 1977 that may contain PCBs include old fluorescent lighting fixtures and electrical devices containing PCB capacitors, and old microscope and hydraulic oils.
PCBs enter the air, water, and soil from accidental spills, leaks, or fires in products containing PCBs. PCBs do not readily break down in the environment and thus may remain there for very long periods of time. In water, PCBs accumulate in fish and marine mammals. A small amount of PCBs may remain dissolved, but most stick to organic particles and bottom sediments. PCBs also bind strongly to soil.
The most commonly observed health effects in people exposed to large amounts of PCBs are skin conditions such as acne and rashes. Studies in exposed workers have suggested potential liver damage. PCB exposures in the general population are not likely to result in skin and liver effects.
Babies born to women who ate large amounts of PCB-contaminated fish weighed slightly less than babies from women who did not have these exposures and showed abnormal responses in tests of infant behavior. There are no reports of structural birth defects caused by exposure to PCBs or of health effects of PCBs in older children. The most likely way infants will be exposed to PCBs is from breast milk. In most cases, the benefits of breast-feeding outweigh any risks from exposure to PCBs in mother's milk.
The Department of Health and Human Services (DHHS) has concluded that PCBs may reasonably be anticipated to be carcinogens. The EPA and the International Agency for Research on Cancer (IARC) have determined that PCBs are probably carcinogenic to humans.
Polycyclic Aromatic Hydrocarbons (PAHs): Polycyclic aromatic hydrocarbons (PAHs) are a group of over 100 different chemicals that are formed during the incomplete burning of coal, oil and gas, garbage, or other organic substances like tobacco or charbroiled meat. PAHs are usually found as a mixture containing two or more of these compounds. Some PAHs are manufactured. These pure PAHs usually exist as colorless, white, or pale

EPA Mossville SI Review
76
yellow-green solids. PAHs are found in coal tar, crude oil, creosote, and roofing tar, but a few are used in medicines or to make dyes, plastics, and pesticides.
PAHs enter the air mostly as releases from volcanoes, forest fires, burning coal, and automobile exhaust. PAHs enter water through discharges from industrial and wastewater treatment plants. They stick to solid particles and settle to the bottoms of lakes or rivers. In soils, PAHs are most likely to stick tightly to particles; certain PAHs move through soil to contaminate groundwater.
PAHs can break down by reacting with sunlight and other chemicals in the air over a period of days to weeks. Microorganisms can break down PAHs in soil or water after a period of weeks to months. PAH contents of plants and animals may be much higher than PAH contents of soil or water in which they live.
You can be exposed to PAHs by breathing air containing PAHs in the workplace; from cigarette smoke, wood smoke, vehicle exhausts, asphalt roads, or agricultural burn smoke; eating grilled or charred meats, contaminated cereals,vegetables, fruits, meats, and processed or pickled foods; or by drinking contaminated water or cow's milk. Nursing infants of mothers living near hazardous waste sites may be exposed to PAHs through their mother's milk.
Some people who have breathed or touched mixtures of PAHs and other chemicals for long periods of time have developed cancer. The Department of Health and Human Services (DHHS) has determined that some PAHs may reasonably be expected to be carcinogens.
Zinc: Zinc is one of the most common elements in the earth's crust. It is found in air, soil, and water, and is present in all foods. Pure zinc is a bluish-white shiny metal. Zinc has many commercial uses as coatings to prevent rust, in dry cell batteries, and mixed with other metals to make alloys like brass, and bronze. Zinc compounds are widely used in industry to make paint, rubber, dyes, wood preservatives, and ointments.
Some zinc is released into the environment by natural processes, but most comes from human activities like mining, steel production, coal burning, and burning of waste. Depending on the type of soil, some zinc compounds can move into the groundwater and into lakes, streams, and rivers. Most of the zinc in soil stays bound to soil particles and does not dissolve in water. It builds up in fish and other organisms, but it does not build up in plants.
Zinc is an essential element in our diet. Too little zinc can cause problems, but too much zinc is also harmful. Harmful effects generally begin at levels 10-15 times higher than the amount needed for good health. Large doses taken by mouth even for a short time can cause stomach cramps, nausea, and vomiting. Taken longer, it can cause anemia and decrease the levels of your good cholesterol. Inhaling large amounts of zinc (as dusts or fumes) can cause a specific short-term disease called metal fume fever. Putting low levels

EPA Mossville SI Review
77
of zinc acetate and zinc chloride on the skin of rabbits, guinea pigs, and mice caused skin irritation. Skin irritation will probably occur in people.
Based on incomplete information from human and animal studies, the EPA has determined that zinc is not classifiable as to its human carcinogenicity.