public expenditure analysis in education - world bank · public expenditure analysis in education...
TRANSCRIPT
Public Expenditure Analysis in Education
Elizabeth M. KingDECRG
22 May 2002
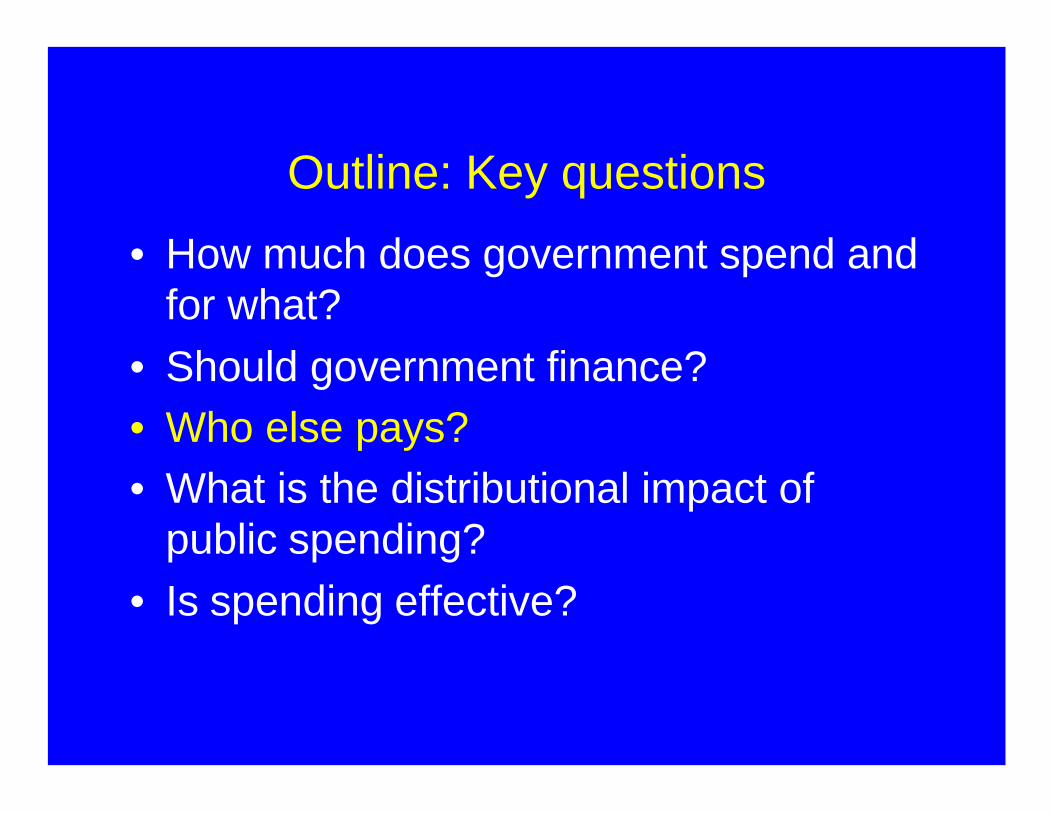
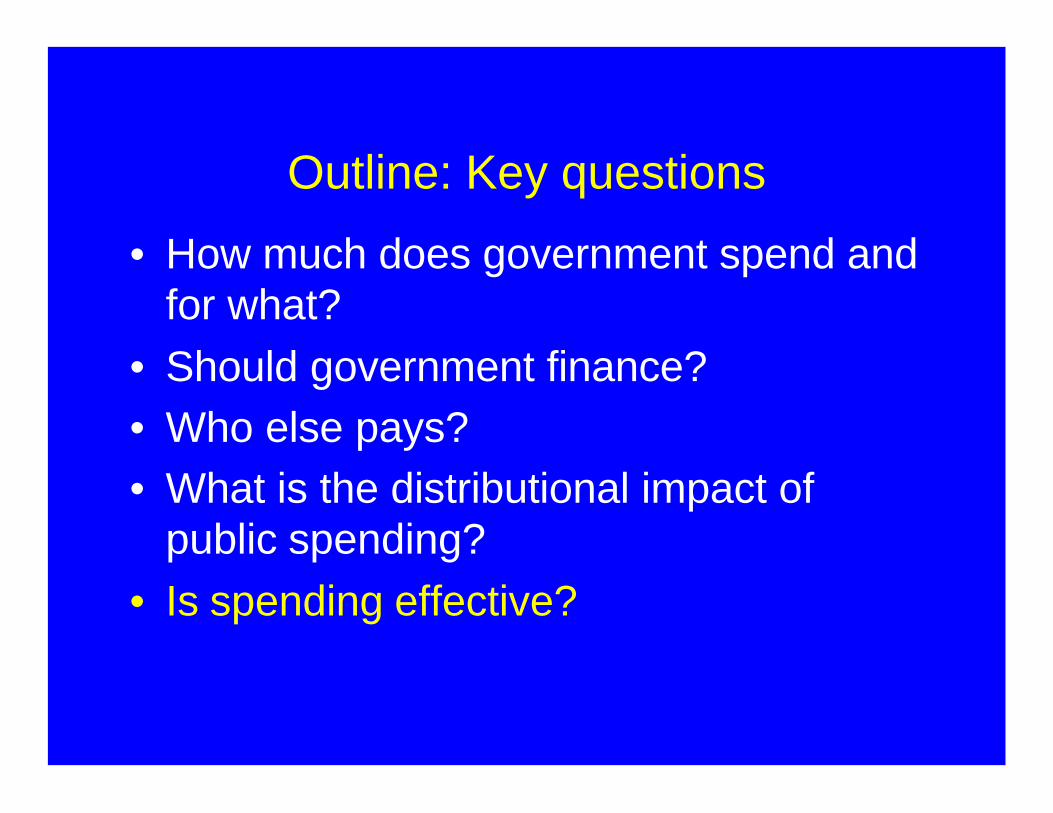
Outline: Key questions
• How much does government spend and for what?
• Should government finance?• Who else pays?• What is the distributional impact of
public spending?• Is spending effective?
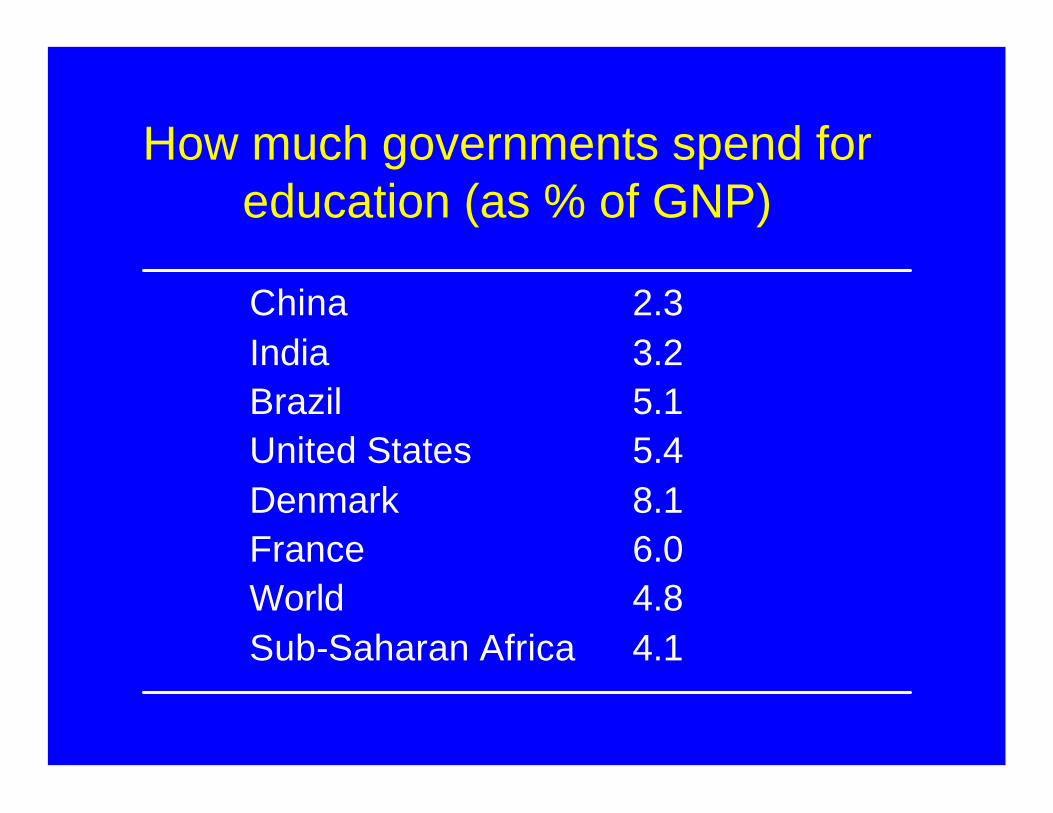
How much governments spend for education (as % of GNP)
China 2.3India 3.2Brazil 5.1United States 5.4Denmark 8.1France 6.0World 4.8Sub-Saharan Africa 4.1
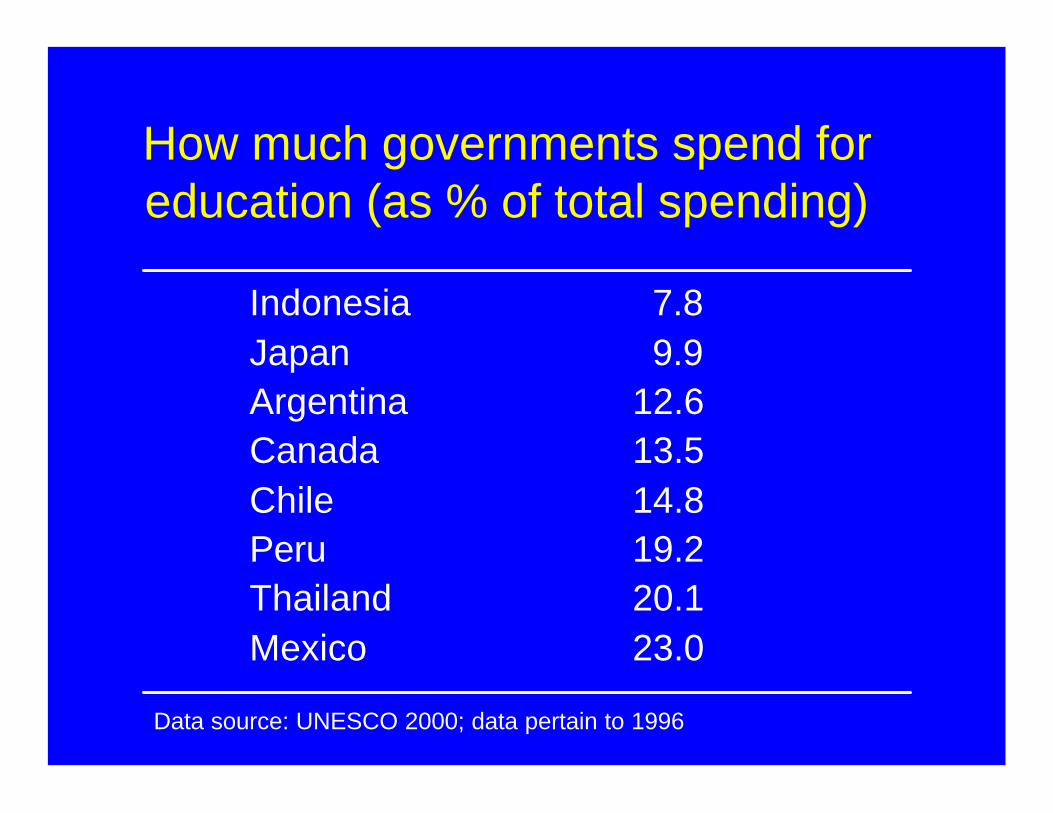
How much governments spend for education (as % of total spending)
Indonesia 7.8Japan 9.9Argentina 12.6Canada 13.5Chile 14.8Peru 19.2Thailand 20.1Mexico 23.0
Data source: UNESCO 2000; data pertain to 1996
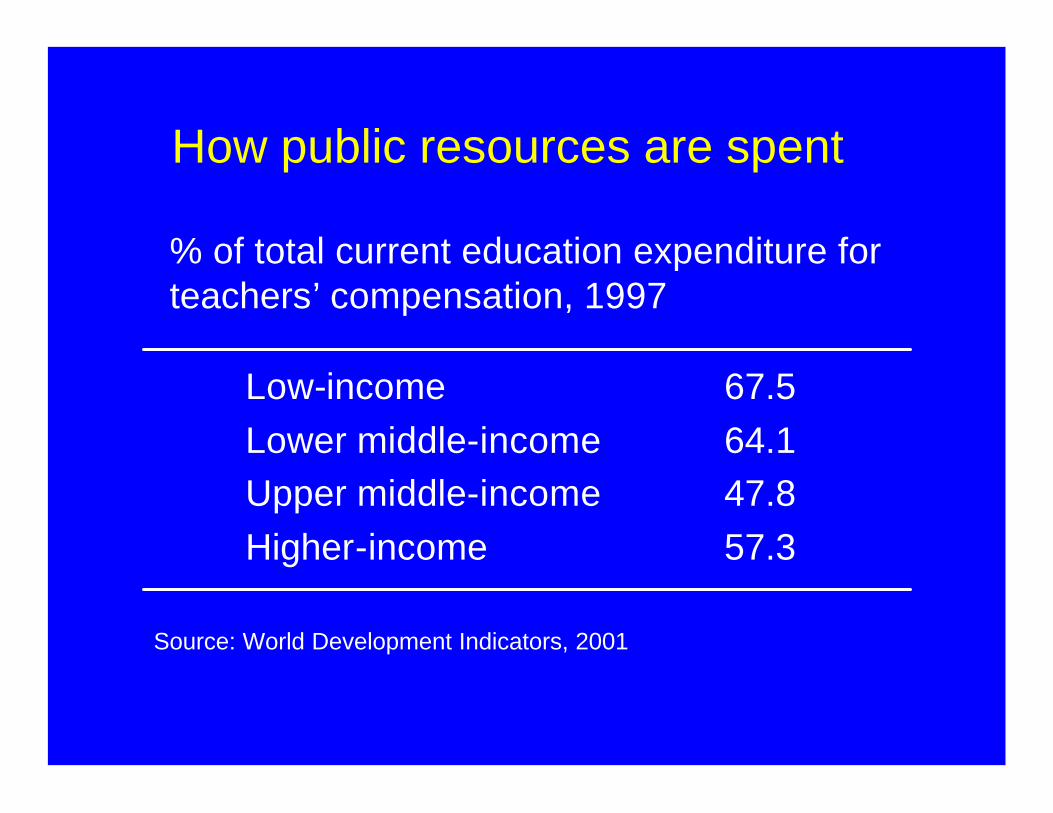
How public resources are spent
Low-income 67.5Lower middle-income 64.1Upper middle-income 47.8Higher-income 57.3
% of total current education expenditure for teachers’ compensation, 1997
Source: World Development Indicators, 2001

Should government intervene? Market failures in education
• Externalities• Productivity• Social outcomes• Nation-building
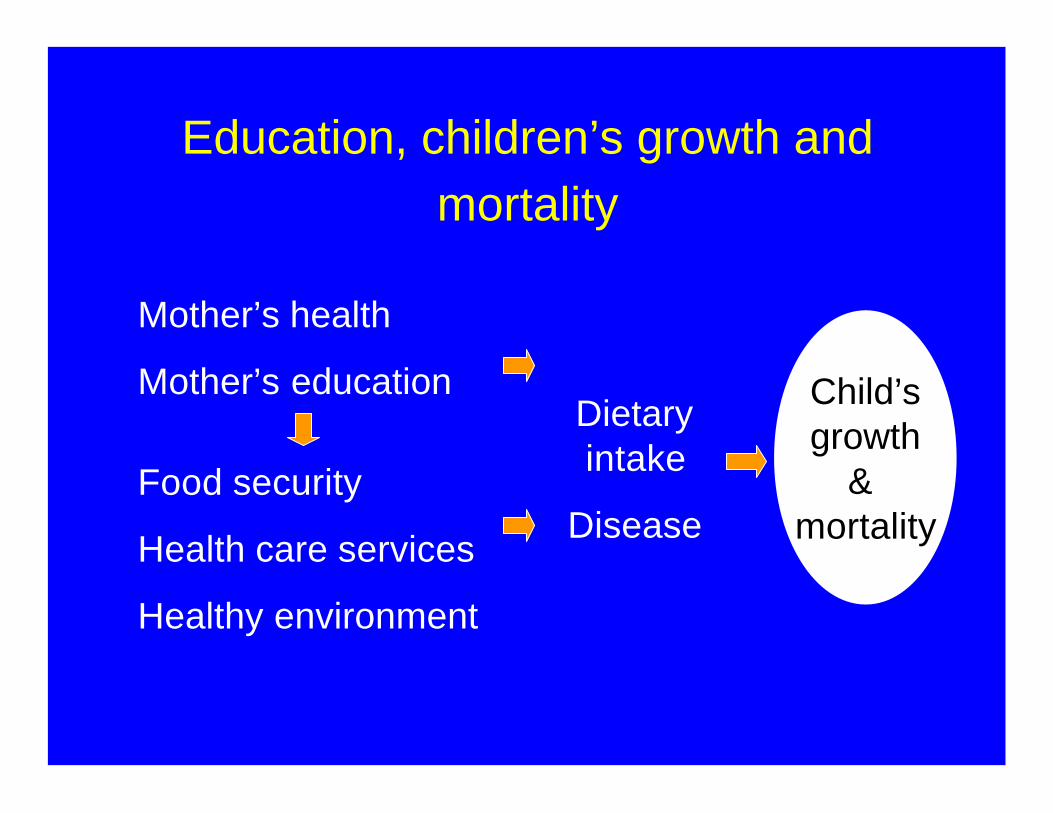
Education, children’s growth and mortality
Child’sgrowth
& mortality
Dietary intake
DiseaseFood security
Health care services
Healthy environment
Mother’s health
Mother’s education
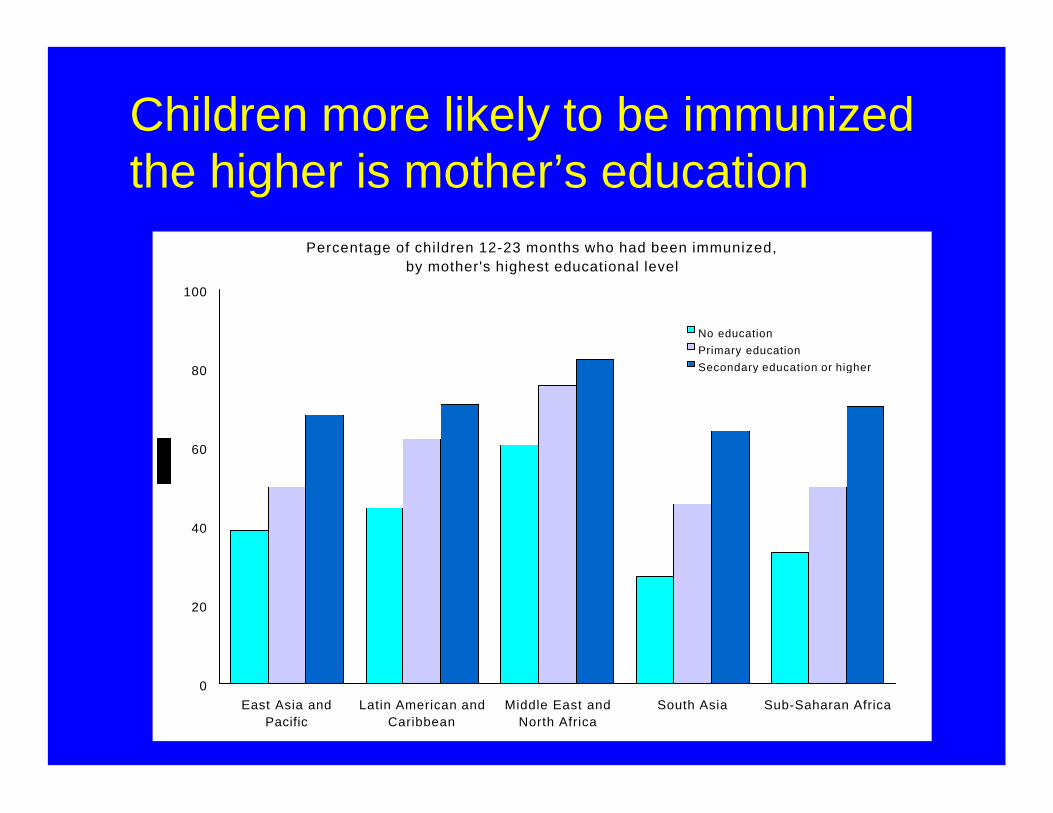
Mothers with more schooling tend to adopt health-promoting behaviors, such as having young children immunized.
Percentage of children 12-23 months who had been immunized, by mother's highest educational level
0
20
40
60
80
100
East Asia andPacific
Latin American andCaribbean
Middle East andNorth Africa
South Asia Sub-Saharan Africa
No education
Primary education
Secondary education or higher
Children more likely to be immunized the higher is mother’s education
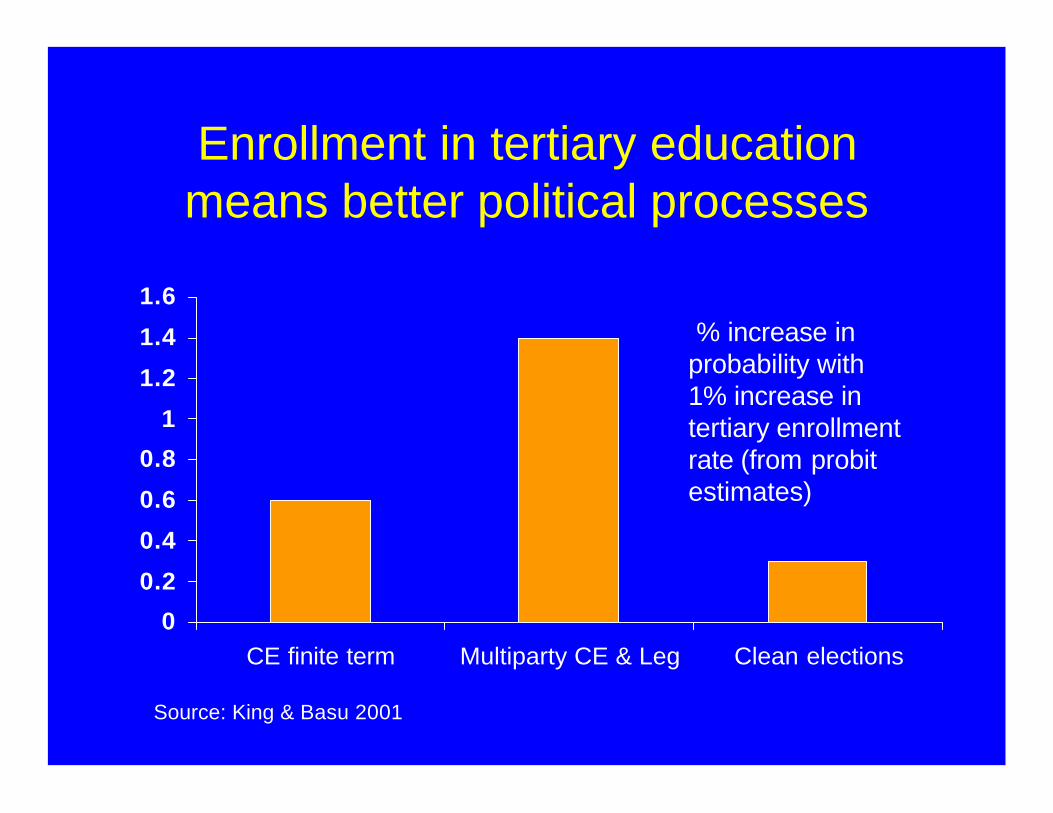
Enrollment in tertiary education means better political processes
00.2
0.4
0.6
0.81
1.2
1.4
1.6
CE finite term Multiparty CE & Leg Clean elections
% increase in probability with 1% increase in tertiary enrollment rate (from probit estimates)
Source: King & Basu 2001

Price
Quantity0
Market for education
PrivateMB
Private MC
SocialMB
Q* Q**

Market failures in education
• Externalities• Capital market failures & information
asymmetries– Education is long-term investment process, financial
institutions unwilling to take risk– Difficult for providers to borrow against future revenue
stream– Difficult for students to borrow against future income
stream– Providers have more information than students so
students may end up in worse institutions than they want
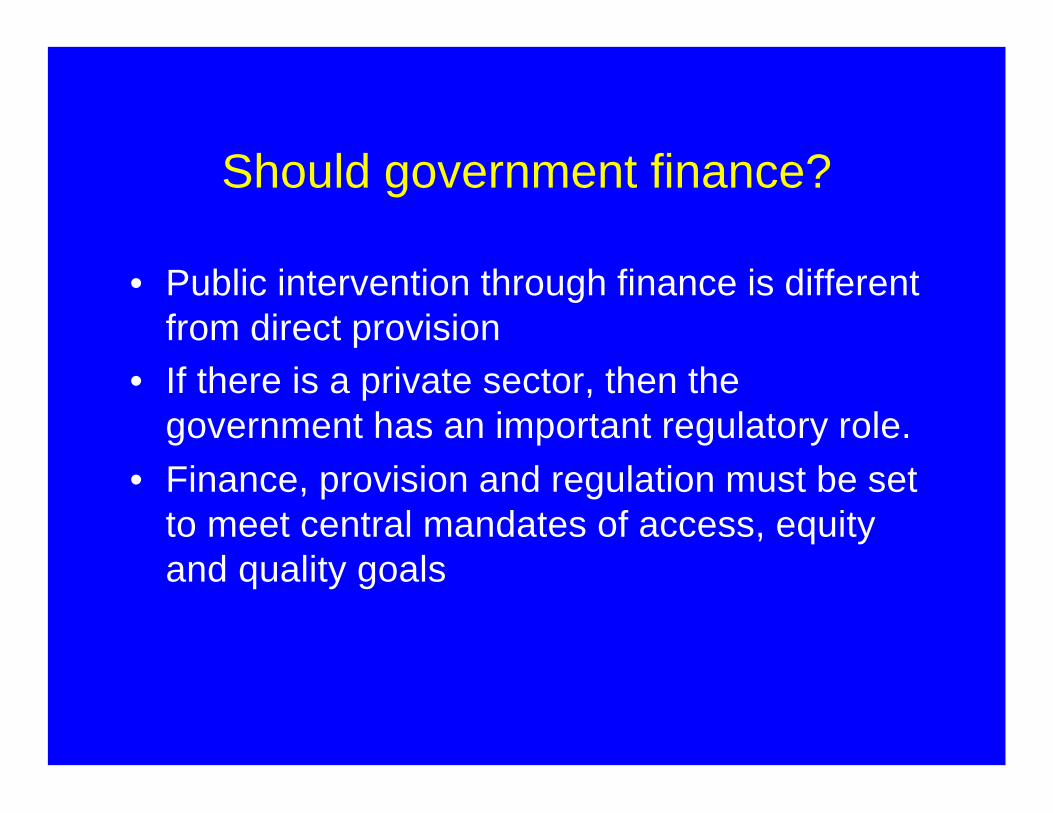
Should government finance?
• Public intervention through finance is different from direct provision
• If there is a private sector, then the government has an important regulatory role.
• Finance, provision and regulation must be set to meet central mandates of access, equity and quality goals
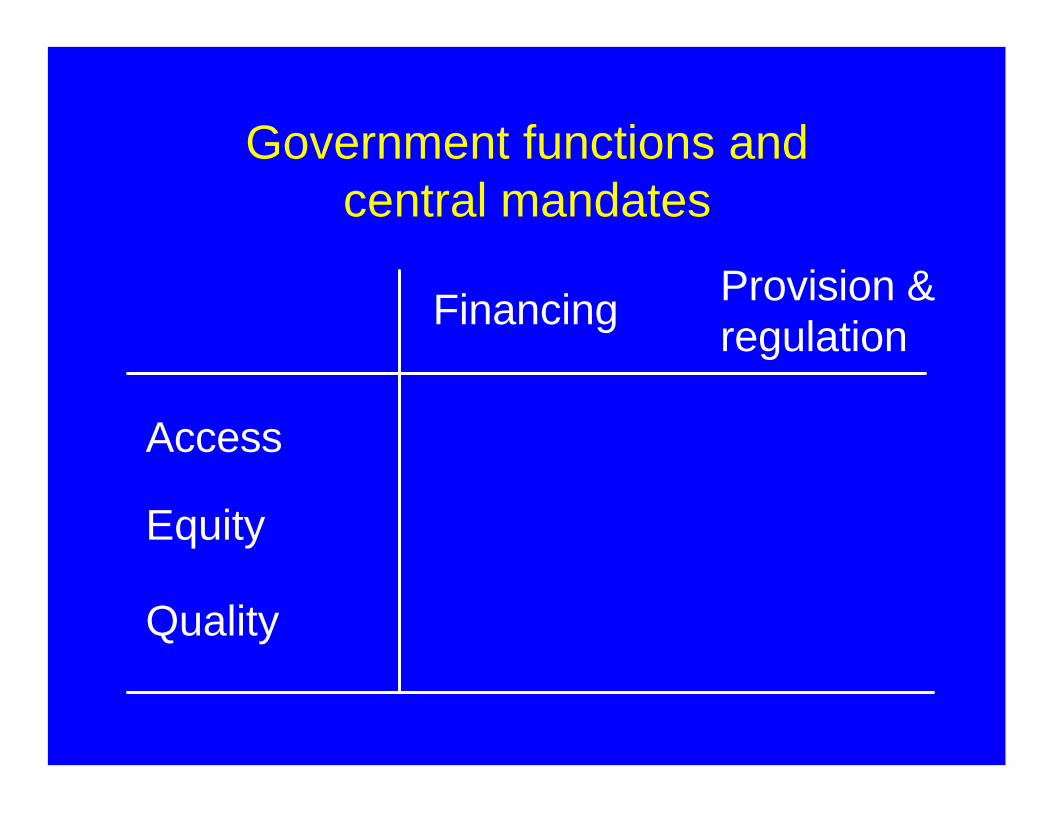
Government functions and central mandates
Financing Provision & regulation
Access
Equity
Quality

Options for state intervention
Degree of public financing
100%
0% 100%Degree of public provision
Unsubsidized privatesector (Philippine, tertiary level)
Voucher schools; regulated private schools (Chile basic, Netherlands, Belgium)
Public schools with little/no cost recovery (many)
Public facilitieswith cost recovery(US, Korea, Chile universities)
Outline: Key questions
• How much does government spend and for what?
• Should government finance?• Who else pays?• What is the distributional impact of
public spending?• Is spending effective?

Private expenditure as % of total education expenditure
0% 50% 100%
S. AfricaMalaysia
BoliviaFranceUK
VenezuelaGhanaUSA
IndonesiaGermany
PeruUgandaSierra Leone
Source: Psacharopoulos and Nguyen 1995 “Fighting Poverty: the role of government and the private sector” World Bank.
Netherlands
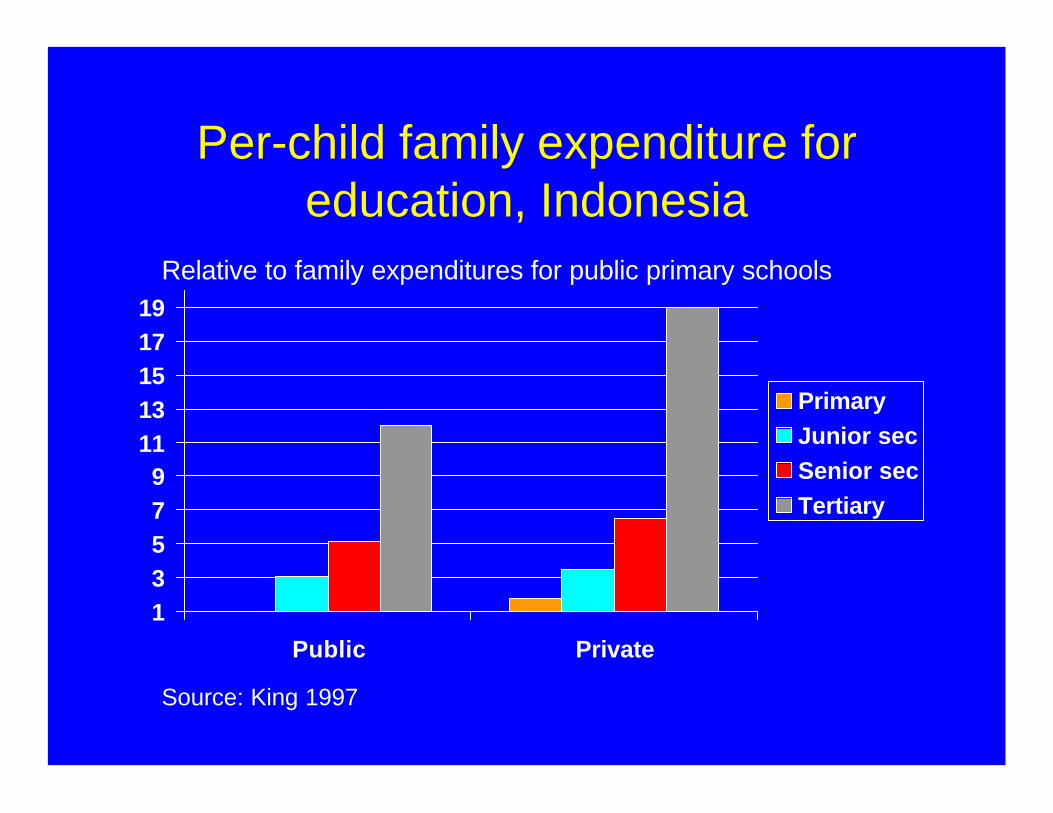
Per-child family expenditure for education, Indonesia
13579
1113151719
Public Private
PrimaryJunior secSenior secTertiary
Source: King 1997
Relative to family expenditures for public primary schools
Outline: Key questions
• How much does government spend and for what?
• Should government finance?• Who else pays?• What is the distributional impact of
public spending?• Is spending effective?
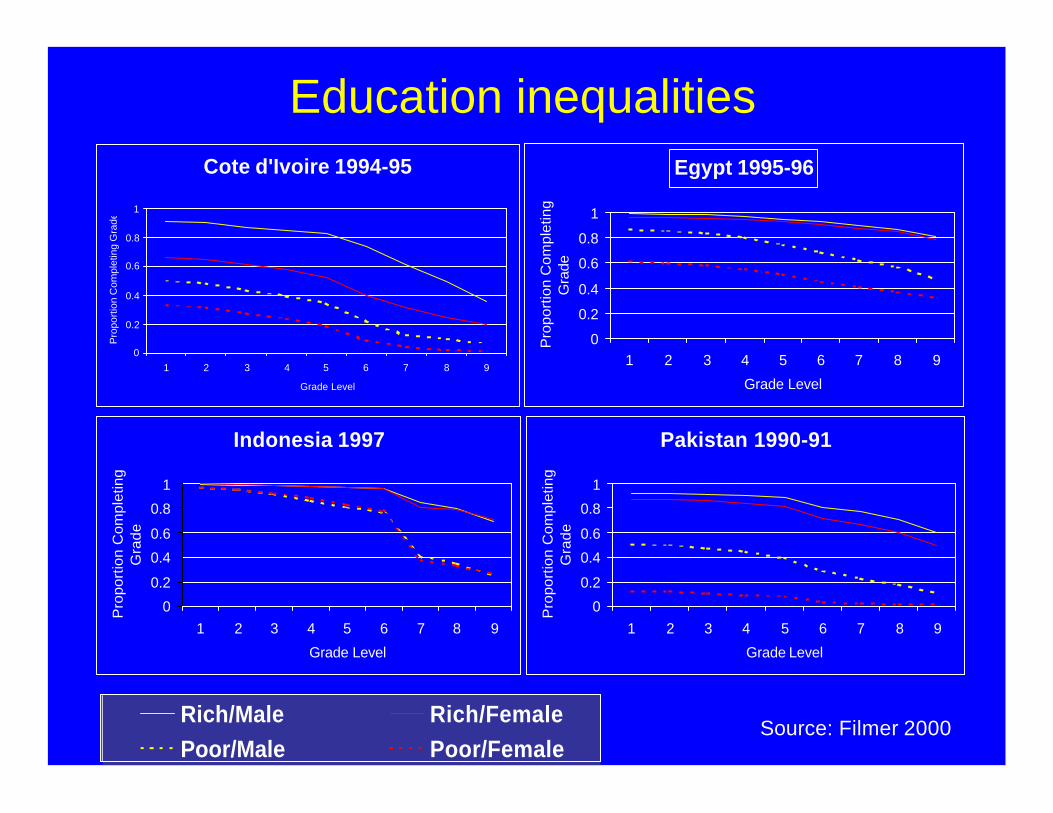
Education inequalities
Indonesia 1997
0
0.2
0.4
0.6
0.8
1
1 2 3 4 5 6 7 8 9
Grade Level
Pro
port
ion
Com
plet
ing
Gra
de
Cote d'Ivoire 1994-95
0
0.2
0.4
0.6
0.8
1
1 2 3 4 5 6 7 8 9
Grade Level
Pro
port
ion
Com
plet
ing
Gra
de
Pakistan 1990-91
0
0.2
0.4
0.6
0.8
1
1 2 3 4 5 6 7 8 9
Grade Level
Pro
port
ion
Com
plet
ing
Gra
de
Egypt 1995-96
0
0.2
0.4
0.6
0.8
1
1 2 3 4 5 6 7 8 9
Grade Level
Pro
port
ion
Com
plet
ing
Gra
de
P a k i s t a n 1 9 9 0 - 9 1
00 . 20 . 40 . 60 . 81
1 2 3 4 5 6 7 8 9
Grade Level
Rich/Male Rich/FemalePoor/Male Poor/Female
Source: Filmer 2000

Proportion of public subsidy received by poorest quintile
0
0.050.1
0.150.2
0.250.3
0.350.4
0.45
Colombia Kenya Ghana Indonesia Malaysia
PrimarySecondaryTertiary
Colombia: 92; Kenya: 92/3; Ghana 91/2; Indonesia, Malaysia 89
Benefit-incidence analysis
• Now-standard methodology for assessing the distributional impact of public spending; based on – Distribution of spending by type of service
or program– Average utilization by income groups
• But how about when participation rates of income groups change over time or across areas (unequal capture)?– Understand political economy of capture
Urban Pakistan: Girls’ Fellowship Program
• In Feb 1995, Quetta in Balochistan• Subsidies paid directly to private schools for 3
years:– Initial: Rs.100 ($3)/mo/girl to limit of Rs10K plus
Rs.200/girl– Reduced in 2nd and 3rd years; then zero. – Unsubsidized boys to be no more than 1/2 of
enrollment
• Randomized selection of neighborhoods
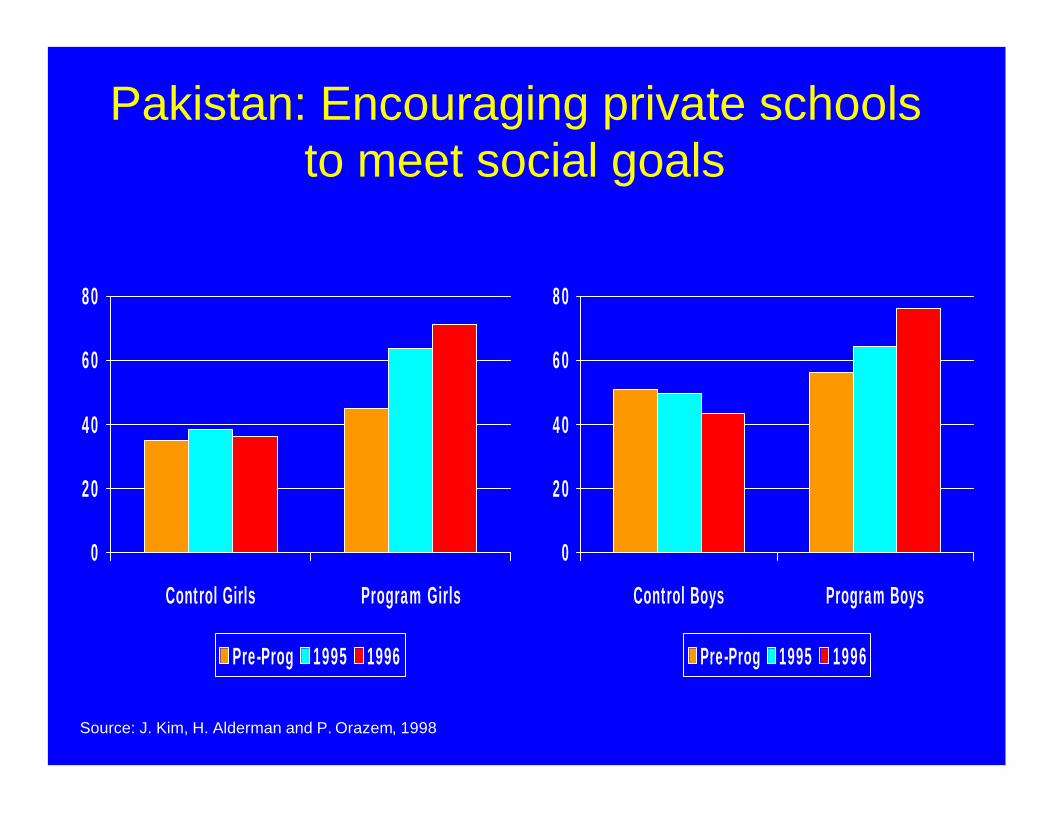
Pakistan: Encouraging private schools to meet social goals
0
20
40
60
80
Control Boys Program Boys
Pre-Prog 1995 1996
0
20
40
60
80
Control Girls Program Girls
Pre-Prog 1995 1996
Source: J. Kim, H. Alderman and P. Orazem, 1998
Colombia’s national voucher program
• Established in late 1991 to expand secondary school capacity
• Cost-sharing between central and local governments (80-20)
• Municipal and school participation voluntary• Targeted using poverty mapping• Grade 5 graduates qualify. Vouchers renewable
yearly up to grade 11• Variable value of voucher up to ceiling, with annual
inflation adjustment

Colombia: Expanding supply to the poor through vouchers
Outcome indicators Losers Winners %Impact
Currently in school* .831 .850 2.3
Currently in private school .539 .699 29.7
Finished 8th grade .632 .744 17.7
Highest grade completed 7.5 7.7 2.7
Ever repeated after lottery .224 .164 -26.8
Total repetitions since lottery .254 .181 -28.7
Sample size 562 1147Note: *Not statistically significant, with or without controls.Source: Angrist and others (2001)
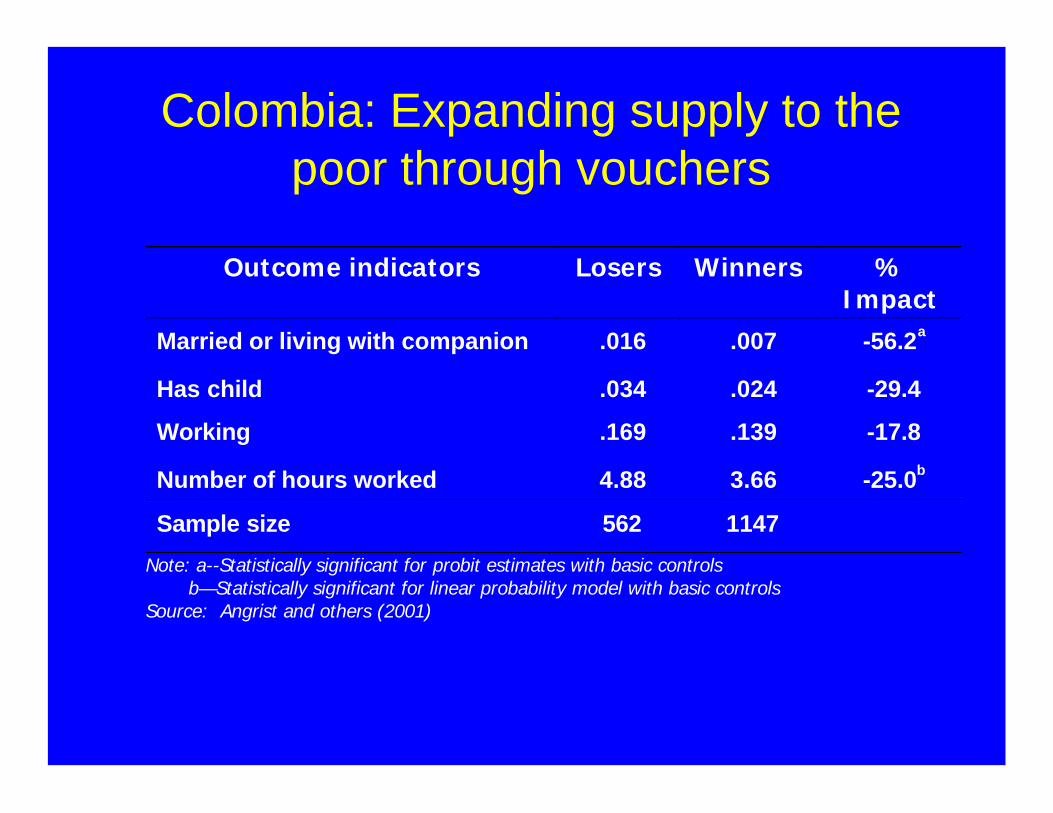
Colombia: Expanding supply to the poor through vouchers
Outcome indicators Losers Winners %Impact
Married or living with companion .016 .007 -56.2a
Has child .034 .024 -29.4
Working .169 .139 -17.8
Number of hours worked 4.88 3.66 -25.0b
Sample size 562 1147
Note: a--Statistically significant for probit estimates with basic controlsb—Statistically significant for linear probability model with basic controls
Source: Angrist and others (2001)
Outline: Key questions
• How much does government spend and for what?
• Should government finance?• Who else pays?• What is the distributional impact of
public spending?• Is spending effective?

Is public spending effective?
• Measuring educational outcomes
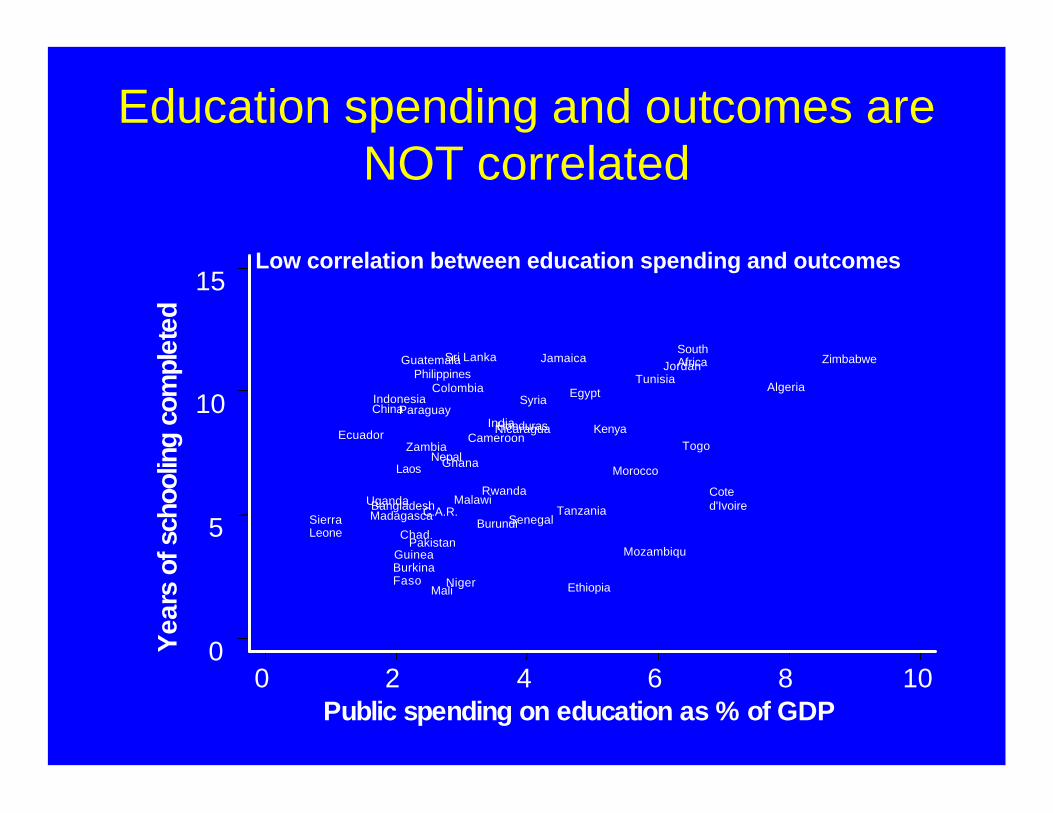
Education spending and outcomes are NOT correlated
Year
s of
sch
oolin
g co
mpl
eted
Public spending on education as % of GDP0 2 4 6 8 10
0
5
10
15
Burundi
BurkinaFaso
BangladeshC.A.R.
China
Coted'Ivoire
Cameroon
Colombia Algeria
Ecuador
Egypt
Ethiopia
Ghana
Guinea
Guatemala
Honduras
Indonesia
India
JamaicaJordan
Kenya
Laos
Sri Lanka
Morocco
Madagasca
Mali
Mozambiqu
Malawi
Niger
Nicaragua
Nepal
Pakistan
Philippines
Paraguay
Rwanda
SenegalSierraLeone
Syria
Chad
Togo
Tunisia
TanzaniaUganda
SouthAfrica
Zambia
Zimbabwe
Low correlation between education spending and outcomes
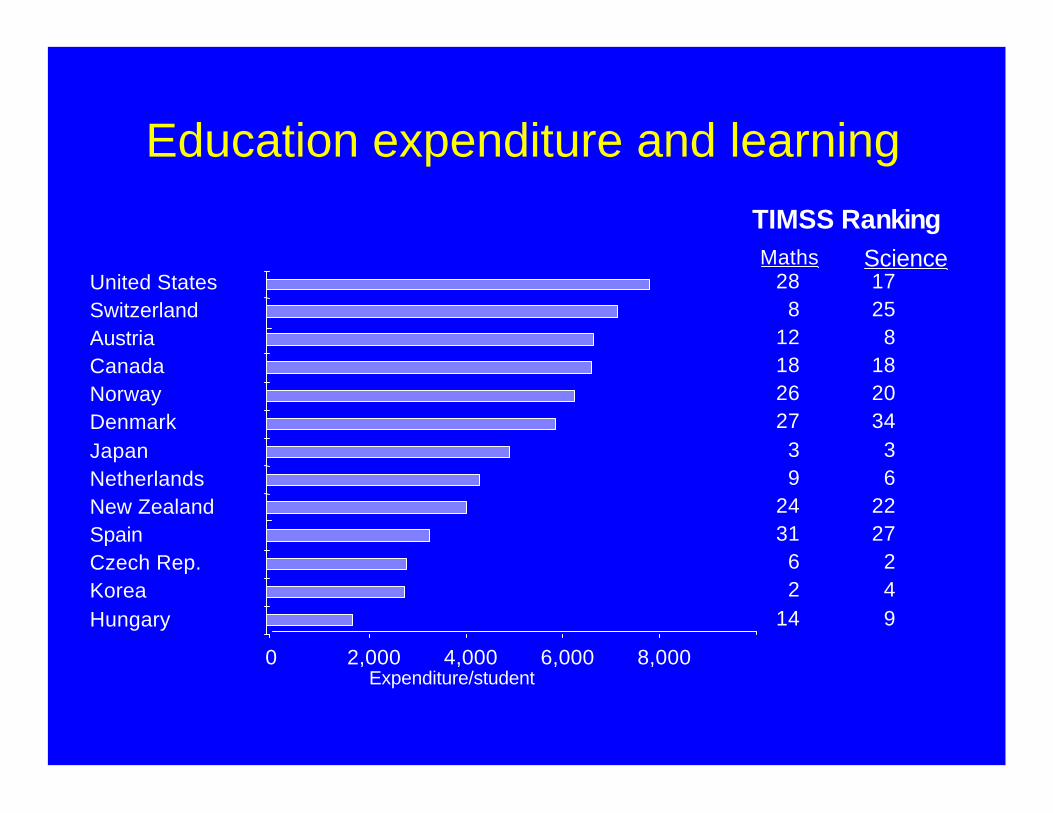
Education expenditure and learning
0 2,000 4,000 6,000 8,000
United StatesSwitzerlandAustriaCanadaNorwayDenmarkJapanNetherlandsNew ZealandSpainCzech Rep.KoreaHungary
TIMSS RankingMaths Science
28 178 25
12 818 1826 2027 34
3 39 6
24 2231 27
6 22 4
14 9
Expenditure/student

Is public spending effective?
• Measuring educational outcomes• Improving quality of public spending –
– Spending on the right thing• Correcting for market failures• Demand vs supply side interventions
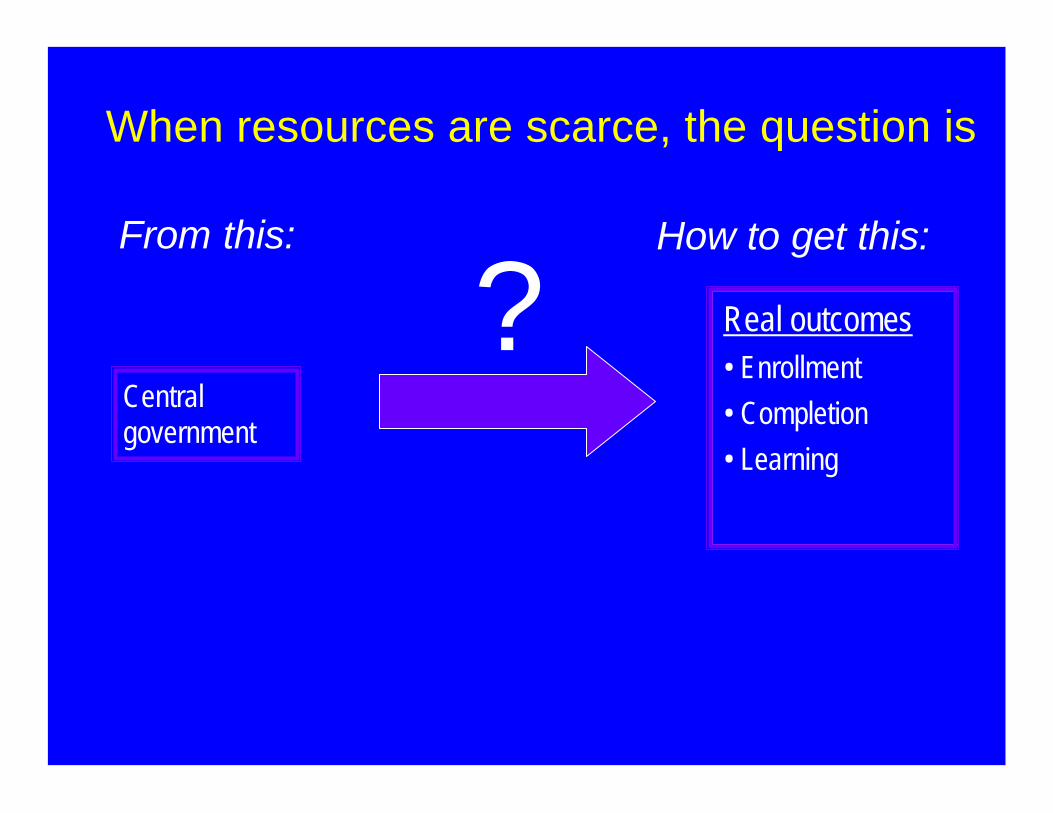
How to get this:
When resources are scarce, the question is
Real outcomes• Enrollment• Completion• Learning
From this:
?Central government

Government functions and tools
Financing Provision & regulation
Access
Equity
Quality
Invest… plus

Government functions and tools
Financing Provision & regulation
Access
Equity
Quality
… Incentives: Set rules & standardsStimulate competition
Establish accountabilityReward performance
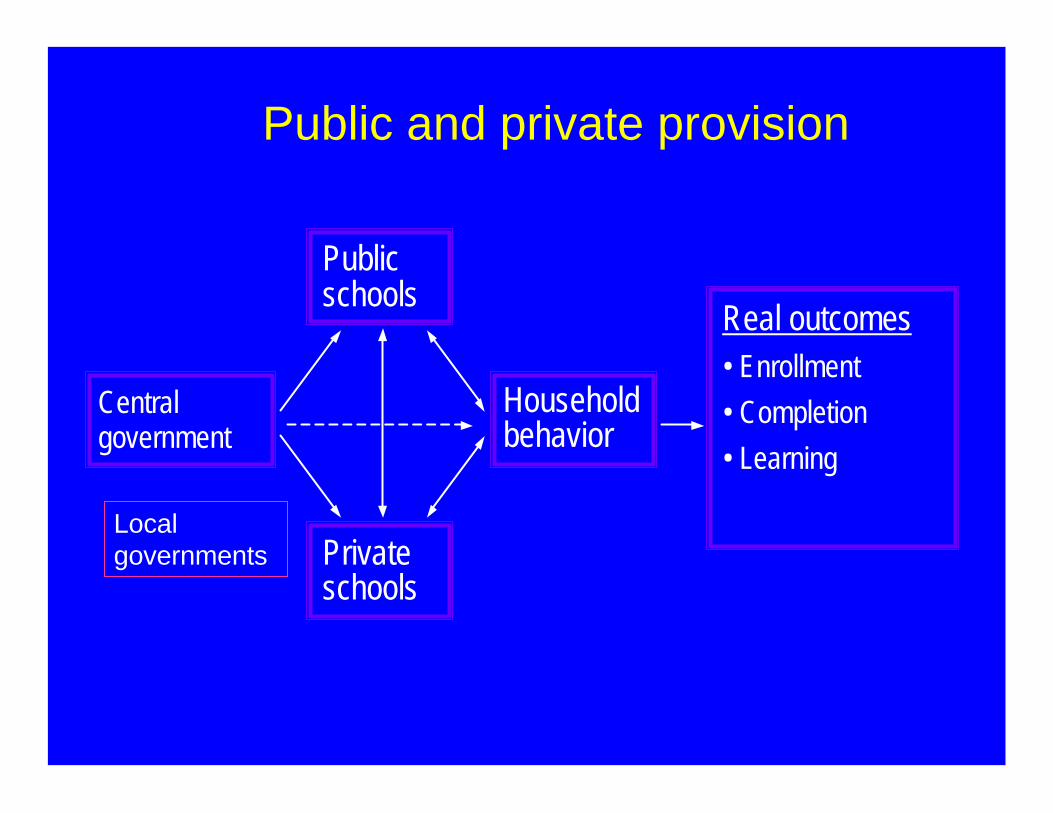
Central government
Household behavior
Public schools
Private schools
Public and private provision
Real outcomes• Enrollment• Completion• Learning
Local governments

Models of decentralized public schools
Lessparticipation
Less autonomy More autonomy
More participation

El Salvador’s community-managed schools or EDUCO
• Educacion con Participacion de la Communidad, 1991– Community education associations (ACEs): parents
and community members– Legally responsible for operating EDUCO schools– ACEs hire, fire, supervise teachers, administer fund
transfers from central government, raise additional resources
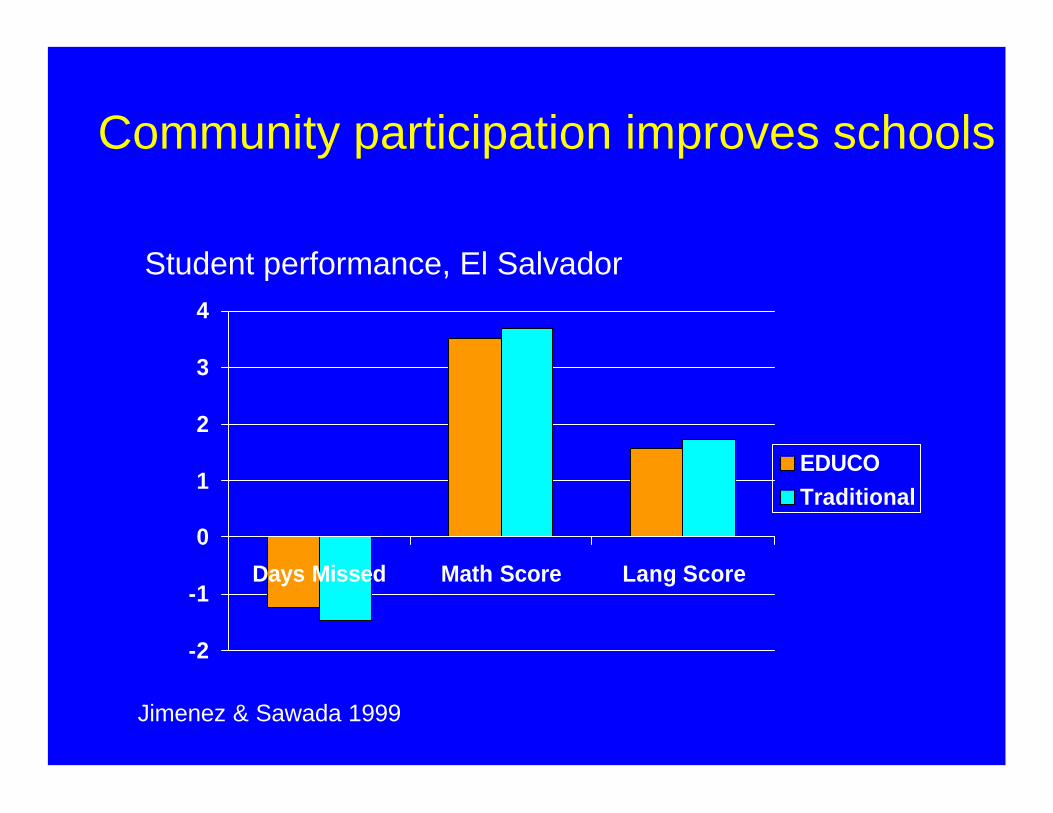
Community participation improves schools
-2
-1
0
1
2
3
4
Days Missed Math Score Lang Score
EDUCOTraditional
Student performance, El Salvador
Jimenez & Sawada 1999
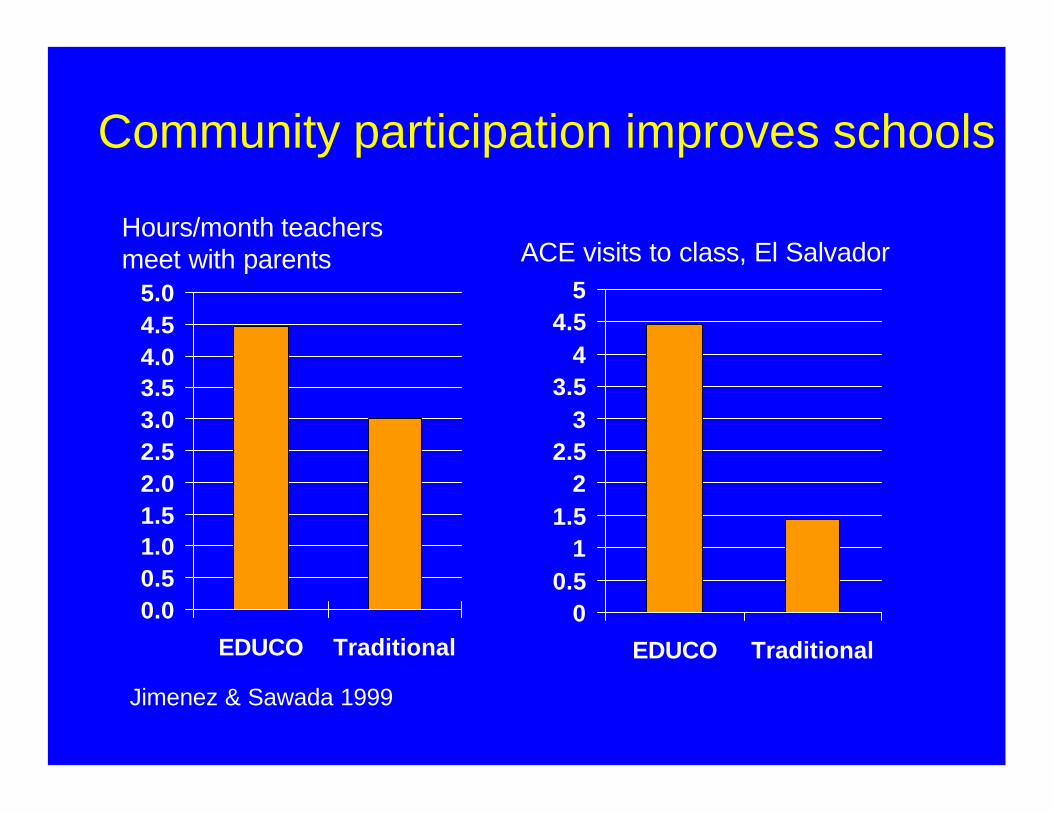
Community participation improves schools
00.5
11.5
22.5
33.5
44.5
5
EDUCO Traditional
0.00.51.01.52.02.53.03.54.04.55.0
EDUCO Traditional
Hours/month teachers meet with parents ACE visits to class, El Salvador
Jimenez & Sawada 1999
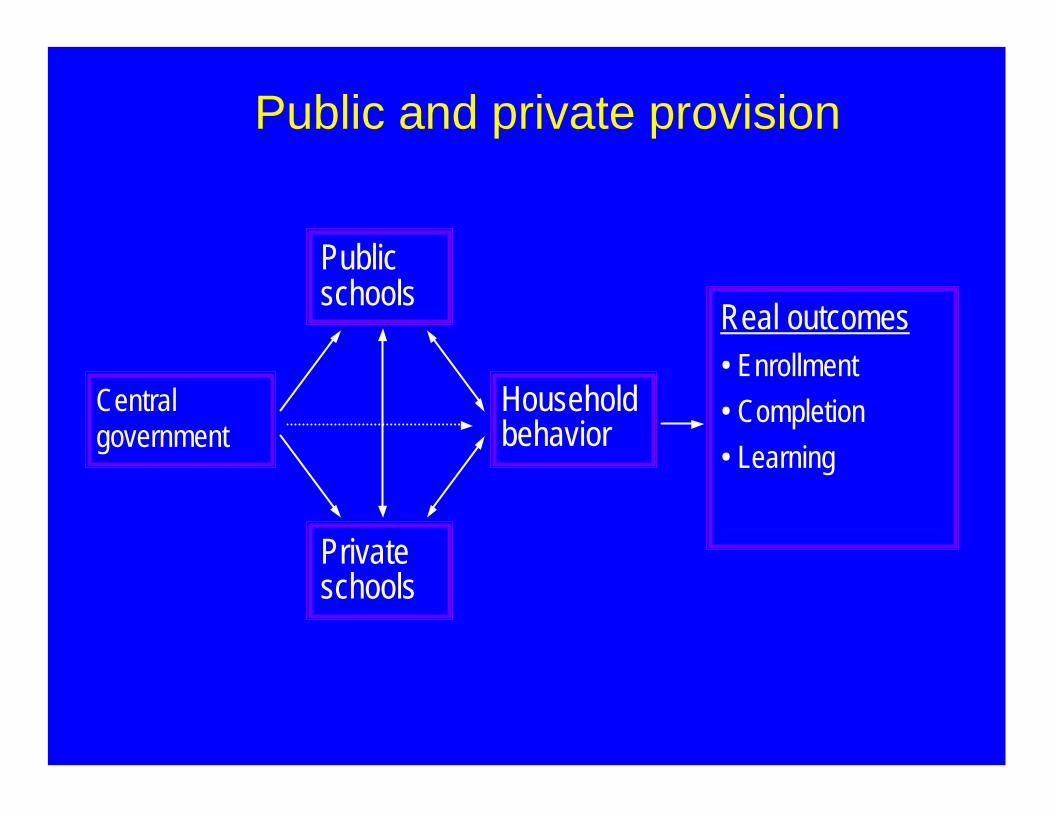
Public schools
Central government
Real outcomes• Enrollment• Completion• Learning
Private schools
Household behavior
Public and private provision

Private enrollment as % of total school enrollment
0% 50% 100%
MexicoUSANigerCyprus
KuwaitFrance
AustraliaKorea
Chile Belgium
NetherlandsMauritius
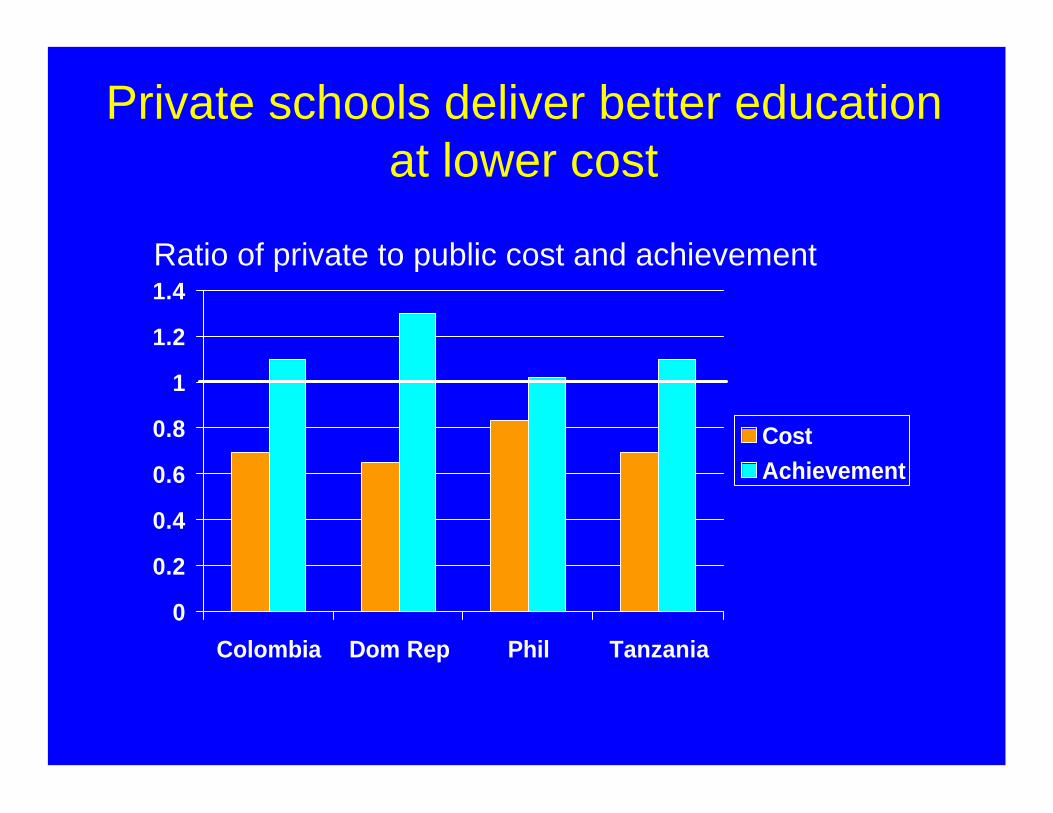
Private schools deliver better education at lower cost
0
0.2
0.4
0.6
0.8
1
1.2
1.4
Colombia Dom Rep Phil Tanzania
CostAchievement
Ratio of private to public cost and achievement
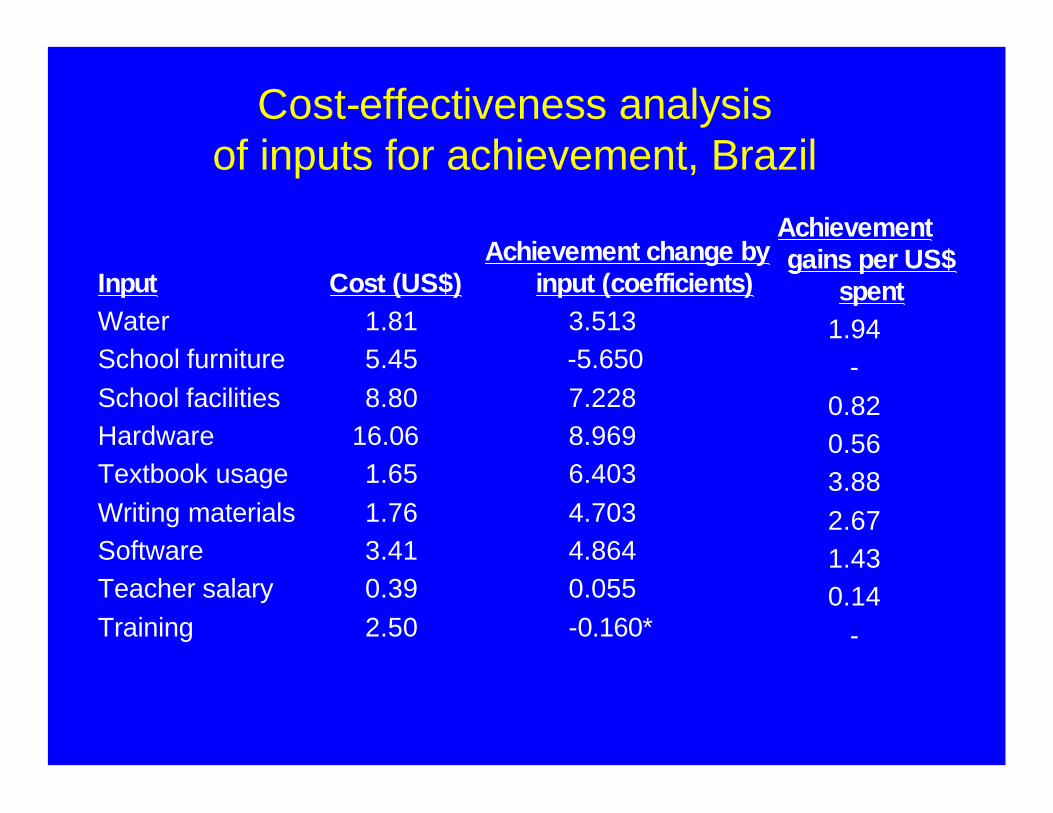
InputWaterSchool furnitureSchool facilitiesHardwareTextbook usageWriting materialsSoftwareTeacher salaryTraining
Cost (US$)1.815.458.80
16.061.651.763.410.392.50
Achievement change by input (coefficients)
3.513-5.6507.2288.9696.4034.7034.8640.055-0.160*
Achievement gains per US$
spent1.94
-0.820.563.882.671.430.14
-
Cost-effectiveness analysisof inputs for achievement, Brazil
Is public spending effective?
• Measuring educational outcomes• Improving quality of public spending –
– Spending on the right thing• Correcting for market failures• Demand vs supply side interventions
– Spending things right• Absorptive capacity• Leakages & need for M&E
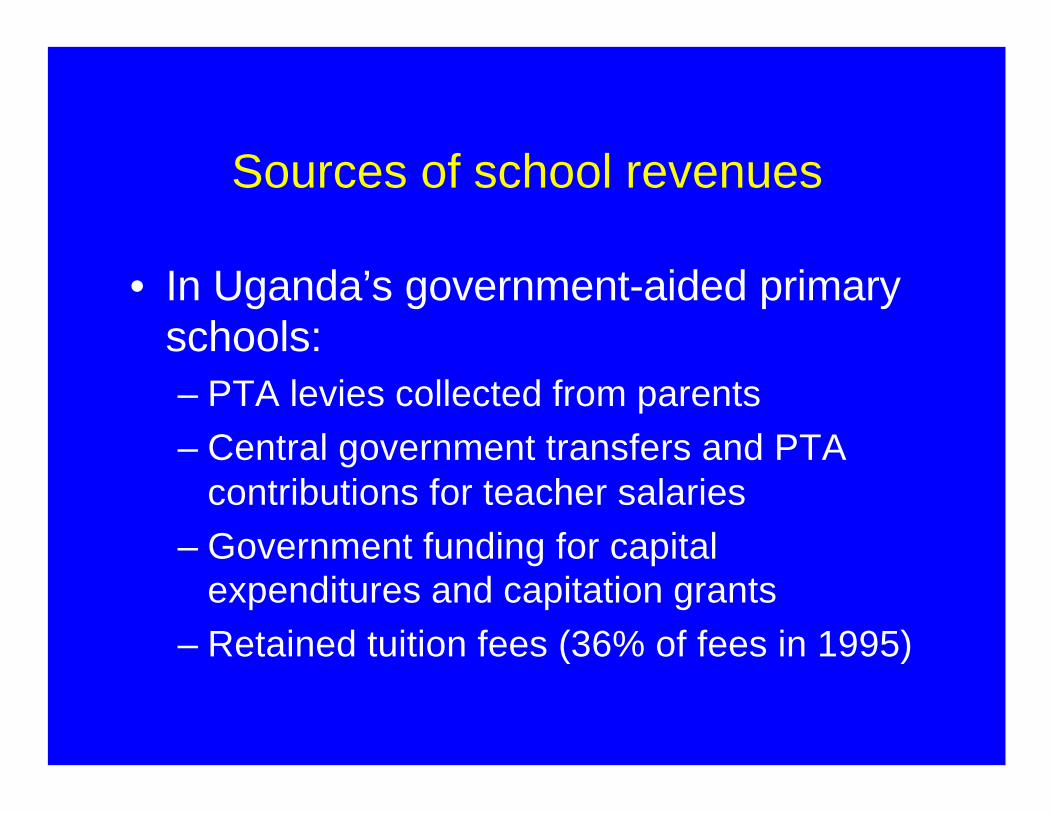
Sources of school revenues
• In Uganda’s government-aided primary schools:– PTA levies collected from parents– Central government transfers and PTA
contributions for teacher salaries– Government funding for capital
expenditures and capitation grants– Retained tuition fees (36% of fees in 1995)
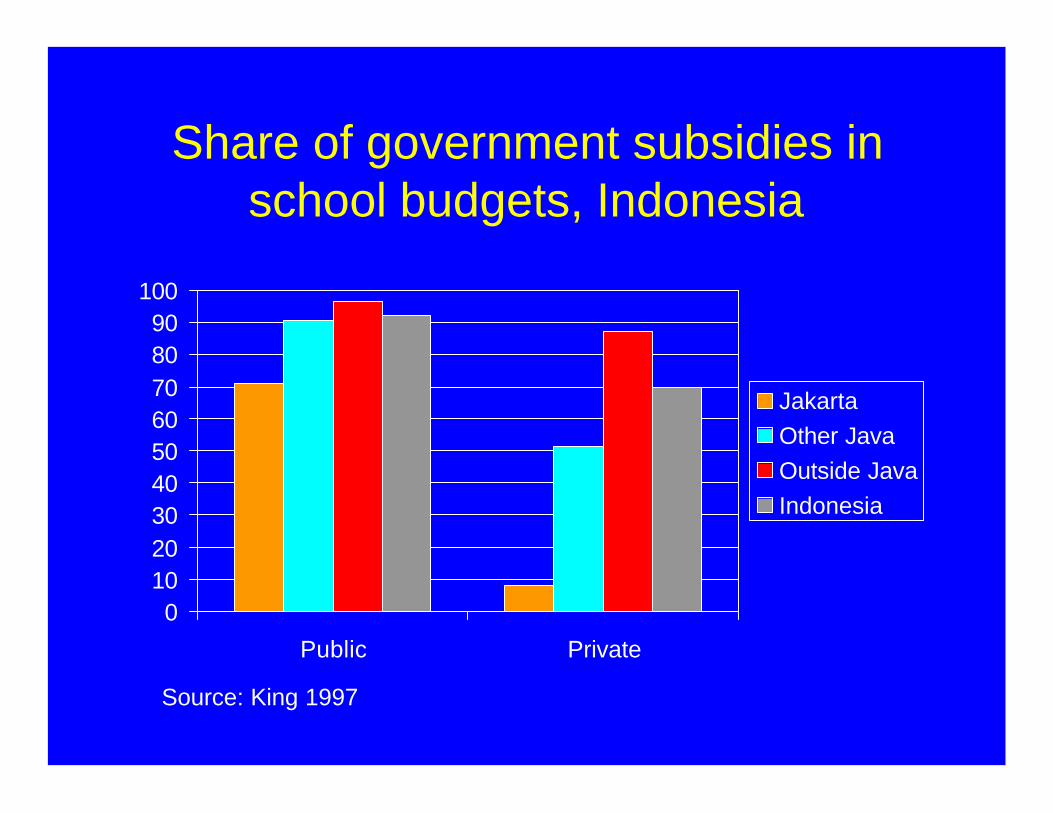
Share of government subsidies in school budgets, Indonesia
0102030405060708090
100
Public Private
JakartaOther JavaOutside JavaIndonesia
Source: King 1997

Data requirements
• Measures of outcomes: existence of assessment system, household surveys
• Measures of inputs & costs: school and household surveys with expenditure data, program data, administrative data on budget allocations and spending
• Impact evaluation data to estimate program effectiveness