public - escosa
TRANSCRIPT

Public – I2 – A2

Public—I2—A2 Inquiry into the South Australian bulk grain export supply chain costs 2
The Essential Services Commission invites written submissions on this paper by Monday, 17 September 2018.
It is the Commission’s policy to make all submissions publicly available via its website (www.escosa.sa.gov.au), except where a submission either wholly or partly contains confidential or commercially sensitive information provided on a confidential basis and appropriate prior notice has been given.
The Commission may also exercise its discretion not to publish any submission based on length or content (for example containing material that is defamatory, offensive or in breach of any law).
Responses to this paper should be directed to: Inquiry into the South Australian bulk grain export supply chain costs.
It is preferred that submissions are sent electronically to: [email protected].
Alternatively, submissions can be sent to: Essential Services Commission GPO Box 2605 Adelaide SA 5001 Telephone: (08) 8463 4444 Freecall: 1800 633 592 (SA and mobiles only) E-mail: [email protected] Web: www.escosa.sa.gov.au
The Essential Services Commission is an independent statutory authority with functions in a range of essential services including water, sewerage, electricity, gas, rail and maritime services, and also has a general advisory function on economic matters. For more information, please visit www.escosa.sa.gov.au.
Public—I2—A2 Inquiry into the South Australian bulk grain export supply chain costs i
Glossary of terms ......................................................................................................................................................... ii
1 Overview .................................................................................................................................................................1
1.1 Context .........................................................................................................................................................2
1.2 Draft findings ...............................................................................................................................................2
1.3 Purpose of the inquiry and this Draft Report ........................................................................................5
1.4 Report contents and structure.................................................................................................................6
1.5 Next steps ....................................................................................................................................................6
2 The approach to the Inquiry ...............................................................................................................................7
2.1 About the inquiry ........................................................................................................................................7
2.2 How the Commission assesses supply chain efficiency ...................................................................8
2.3 Inquiry process......................................................................................................................................... 12
3 Overview of the supply chain .......................................................................................................................... 14
3.1 South Australia’s place in the bulk grain export market .................................................................. 14
3.2 South Australian harvest trends ........................................................................................................... 16
3.3 South Australia’s bulk grain export supply chain .............................................................................. 18
3.4 Conclusion ................................................................................................................................................ 28
4 Whether the supply chain is efficient ............................................................................................................ 29
4.1 Segments of the supply chain .............................................................................................................. 30
4.2 Segments of the supply chain that warrant review .......................................................................... 30
4.3 Market structure for services that Viterra provides .......................................................................... 36
4.4 Investigating Viterra’s market behaviour ............................................................................................ 40
4.5 Conclusion ................................................................................................................................................ 72
5 Other issues ........................................................................................................................................................ 74
5.1 Grain pooling ............................................................................................................................................ 74
5.2 Grain stock information.......................................................................................................................... 75
5.3 The basis of road and rail cost recovery ............................................................................................. 77
5.4 Quality arbitrage ...................................................................................................................................... 78
5.5 Statewide transport access regime covering grain storage and handling .................................. 80
5.6 20-foot containers ................................................................................................................................... 81
6 Next steps ........................................................................................................................................................... 82
Appendix A—Terms of reference ............................................................................................................................ 83
Appendix B—Evidence to assess the efficiency of the supply chain ............................................................... 88
Appendix C—Data verification process ............................................................................................................... 106
Appendix D—Financial analysis ............................................................................................................................ 108
Appendix E—Breakdown of grain pathway fees ................................................................................................ 111
Appendix F—Market power analysis .................................................................................................................... 115

Public—I2—A2 Inquiry into the South Australian bulk grain export supply chain costs ii
ABB Grain Australian Barley Board (the bulk handler in South Australia before Viterra acquired it in 2009)
ACCC Australian Competition and Consumer Commission
AEGIC Australian Export Grains Innovation Centre
ARTC Australian Rail Track Corporation
Berth 29 A shipping berth within the Inner Harbour – Port Adelaide precinct, set up for the bulk loading of vessels
CAPM Capital asset pricing model
Cargill Cargill Australia Ltd (a grain handler and trader, and a subsidiary of multinational agribusiness Cargill Inc.)
CBH CBH Ltd, based in Western Australia
COAG Council of Australian Governments
Commission Essential Services Commission, established under the Essential Services Commission Act 2002 (SA)
CPI Australian Bureau of Statistics’ consumer price index
DAWR Department of Agriculture and Water Resources (Australian Government)
DPTI Department of Planning, Transport and Infrastructure, South Australia
DTF Department of Treasury and Finance, South Australia
EBIT Earnings before interest and tax
EP Eyre Peninsula
ESC Act Essential Services Commission Act 2002 (SA)
eastern South Australia The portion of the South Australian land mass east of the Spencer Gulf
economies of scale When cost per unit of output declines with increasing scale. Economies of scale are usually associated with a cost structure that has high fixed costs relative to variable costs.
Flinders Ports The owner and operator of prescribed ports, currently supplying services for all bulk grain exported through South Australia
Glencore Glencore Agriculture (affiliated company of Viterra)
GPSA Grain Producers South Australia
GWA Genesee and Wyoming Australia Pty Ltd

Public—I2—A2 Inquiry into the South Australian bulk grain export supply chain costs iii
market power A firm’s ability to raise price persistently above efficient cost, to exclude competitors or, more generally, to act in an unconstrained manner
MSA Act Maritime Services (Access) Act 2000 (SA)
NOPAT Net operating profit after tax
NTC National Transport Commission
on-farm storage Grain storage capacity on the farm
operating surplus Operating revenue less operating expense
PIRSA Department of Primary Industries and Regions, South Australia
port access regime A regime established under the MSA Act, allowing third party access to port facilities in South Australia
port terminal services Bulk loading facilities
PTAC Port Terminal Access (Bulk Wheat) Code of Conduct, designed to regulate the conduct of bulk wheat port terminal operators, and administered by the ACCC
rail access regime A regime established under the ROA Act, allowing third party access to intrastate rail in South Australia
RFI Request for Information
RoA Return on assets, which is a measure of financial return in relation to the value of the assets employed
ROA Act Railways (Operations and Access) Act 1997 (SA), legislation governing the operations of intrastate rail infrastructure in South Australia
RoE Return on equity, which is a measure of the ultimate return to shareholders on their investment
RoIC Return on invested capital, which is a measure of the underlying operating performance of a firm
SAFC South Australian Freight Council
supply chain South Australian bulk grain export supply chain (farm gate to vessel loading)
terms of reference This inquiry’s terms of reference (including subsequent variations), as provided by the Treasurer
Treasurer Treasurer of the South Australian Government
upcountry An inland site (that is, one not at port)
VAA Value Adviser Associates Pty Ltd
Viterra Viterra Operations Ltd (affiliated with Glencore Agriculture that operates mainly in Canada and Australia). In this report, ‘Viterra’ refers to the South Australian division.

Public—I2—A2 Inquiry into the South Australian bulk grain export supply chain costs 1
This is the Draft Report of the Essential Services Commission’s (Commission) inquiry into the efficiency of the South Australian bulk grain export supply chain (supply chain). The previous Treasurer referred the inquiry to the Commission in March 2017.
As established under the Terms of Reference, this Inquiry is into the cost efficiency of the bulk grain export supply chain, rather than into broader questions of pricing or equity in the grains sector. As is clear from the Terms of Reference, the Inquiry’s findings are intended to assist the Government in considering its policy position on three key State objectives, as follows:
provide transparency in regards to bulk grain export supply chain costs in South Australia
determine areas where future efficiencies may be achieved in the South Australian bulk grain export supply chain
review the appropriateness of mechanisms used for funding road and rail components of the bulk grain export supply chain costs.
In that context, it is important to emphasise that this Inquiry’s findings will not constitute a regulatory determination nor a binding decision – they are intended to and will inform broader public and policy debates on the cost efficiency of the grain export supply chain. It is also important to highlight that this draft Inquiry report is based on the best evidence currently available to the Commission. Consultation on the draft Inquiry report provides the opportunity for stakeholders to test, challenge and verify the evidence which has been presented to the Commission and the analysis utilised by the Commission (in accordance with the Terms of Reference). Testing, challenging and verifying will facilitate the preparation of the final Inquiry report, which will assist the Government’s consideration of the State objectives and inform a wider public debate on grain export issues.
The Commission’s draft finding is that the supply chain, at this time, is not demonstrably inefficient in terms of its costs. This finding is:
based on available facts and evidence
for the costs that the Commission investigated
from both an overall and individual supply chain segment perspective.
Whether, and for how long, this situation continues will depend on Viterra’s actions as a provider of export supply chain services, given its position of strength within the supply chain.
The Commission also reached a draft finding that potential changes to the supply chain’s functioning would likely improve supply chain efficiency and the prospect of supply chain users obtaining a greater share of any gains. Such changes include providing greater transparency around fee levels and Viterra’s financial performance, and ensuring the fee structure does not inhibit the development of third party competition. Further, if Viterra reconsiders its approach to sharing efficiency gains, grain industry goodwill could increase.

Public—I2—A2 Inquiry into the South Australian bulk grain export supply chain costs 2
1.1 Context
South Australia produces high quality grain and makes that grain available for export in a timely manner. But it is a very small player in the worldwide bulk grain export market. For this reason, the South Australian supply chain:
faces a continuing competitive threat from existing and emerging low cost producers
has little influence on the global market, and is vulnerable to global trends
operates under an imperative to reduce supply chain costs simply to maintain market share.
The supply chain can broadly be categorised into three segments: freight transport, port facilities, and storage and handling. There are many suppliers of road freight services, placing competitive pressure on rail transport services. The Commission’s regulatory oversight via its rail access regime complements this competition. Given these factors, the Commission considers the market for freight transport services is competitive. The Commission also considers various port services are subject to sufficient regulatory oversight to ensure a suitable proxy to competitive outcomes, an exception being port receival and outturn from storage services. So, this Inquiry focused on the performance and behaviour of Viterra, given its position of strength within the supply chain (upcountry storage and handling services, and port handling and loading services).
Viterra has successfully extracted efficiencies from its supply chain by carefully controlling and managing bulk grain accumulation and travel within its upcountry-to-port system. These efficiencies, plus a focus on reducing operating costs, have allowed Viterra to drive down real operating costs per tonne—a prerequisite for it to maintain market share in the highly competitive global market for grains. While South Australia’s grain growers may not perceive a direct tangible benefit, it has ensured that their product has remained competitive on the global stage. It is, however, also the case that the decline in Viterra’s real operating costs per tonne has not been accompanied by a similar drop in the fees charged for its services. The result has been that Viterra’s operating surpluses show a strong upward trend and the corresponding cash flow benefits have been retained to date by Viterra’s owners and its shareholders.
This situation has both an equity and an efficiency dimension. This inquiry’s terms of reference relate to supply chain cost efficiency. In that context, Viterra’s behaviour is socially and economically inefficient only if it results in Viterra sustaining a return that is demonstrably above what would be considered reasonable in a competitive market. For this to occur, Viterra would have to use its position of strength to protect and preserve its return from the eroding effects of competition.
Based on the available evidence, while Viterra appears to be earning healthy returns (on average across harvest years, but subject to significant year-on-year variations depending on yearly harvest yields), those returns are not demonstrably unreasonable. Viterra appears to have focused on extracting supply chain efficiencies, rather than protecting and preserving unduly high returns.
These draft findings arise from the available evidence and do not represent an assessment of how the market may evolve. One possibility is that Viterra’s operational efficiencies will continue, resulting in stronger returns if service fees are not reduced. In this case, Viterra might use its position of strength to exercise market power to protect these returns, or it might share some future gains with users of the supply chain.
1.2 Draft findings
The Commission welcomes evidence-based submissions on the extent to which stakeholders agree or disagree with the following draft findings (a consolidation of the specific findings noted throughout the report). Some of the findings include specific questions for stakeholders.

Public—I2—A2 Inquiry into the South Australian bulk grain export supply chain costs 3
Draft findings—overview of the supply chain
Australian grain benefits from being high quality, sustainable and clean. Production is counter-cyclical to the northern hemisphere, so Australian grain has a brief window of opportunity to maximise returns. (Draft Finding 3.1)
South Australia is a small player in the global grain market. It must continue to pursue efficiency in supply chain costs to enable the industry to maintain its global competitiveness. (Draft Finding 3.2)
Responding to the variability of harvests is an important aspect of the supply chain. Participants need to be able to manage costs in poor harvest years, while still having the capacity and capability to manage large harvests. Given the variability in grain production, high returns in good years may be necessary to offset poor returns from bad harvest years for participants to achieve a reasonable return on average. (Draft Finding 3.3)
The grain trading market in South Australia appears to be competitive, with 11 grain traders having booked shipping slot capacity with Viterra to export the 2016-17 grain harvest. (Draft Finding 3.4)
Viterra has a high market share of bulk grain storage in South Australia, operating 94 percent of commercial grain storage sites in South Australia. Total on-farm storage capacity appears to have been static over the 10 year period considered, and it is relatively small in South Australia. (Draft Finding 3.5)
Genesee and Wyoming Australia (GWA) is the primary provider of freight rail services for bulk grain in South Australia, although the relatively short distances to port means road transport successfully competes with rail. (Draft Finding 3.6)
Viterra has a high market share of supply chain port bulk grain loading services, with 91 percent of market share throughput in 2016-17. (Draft Finding 3.7)
Draft findings—whether the supply chain is efficient
Supply chain freight and port services fees are being set on a competitive basis, as a result of the relevant markets being either competitive or subject to sufficient regulatory oversight. A possible exception are the fees for port receival and outturn from storage services. In addition, Viterra’s upcountry storage and handling facilities are not covered by any industry-specific regulation. Consequently, it is important that the performance and behaviour of Viterra be assessed by the Commission, given its position of strength within the supply chain (upcountry storage and handling services, and port handling and loading services). (Draft Finding 4.1)
While Viterra faces some competition (actual and potential), the extent to which competition places effective and credible discipline on Viterra’s behaviour is not clear. The global market may place more effective discipline on Viterra’s behaviour than any local competition could. (Draft Finding 4.2)
Viterra seeks to measure its performance in meeting the customer service needs of growers, and it does so in a robust manner. It submitted evidence of its actions to improve customer service in response to customer feedback. These actions are consistent with a firm seeking to meet customer needs. (Draft Finding 4.3)
Viterra appears to be operating as a cost effective bulk grain accumulator that can meet peak harvest demand and compete in the global context. (Draft Finding 4.4)

Public—I2—A2 Inquiry into the South Australian bulk grain export supply chain costs 4
Based on a sample of fees and grain paths, total upcountry-to-vessel loading fees have been broadly stable in recent years, having moved at an average rate only slightly above inflation from 2013-14 to 2017-18. The Commission found no evidence that Viterra’s fees are excessive compared with the total fees charged by its eastern Australian counterparts as shown by the Australian Export Grains Innovation Centre’s (AEGIC) latest study of Australian supply chain costs. (Draft Finding 4.5)
Based on the available evidence, Viterra is earning returns towards the upper level of what may be considered reasonable. The Commission’s analysis of returns is consistent with the fee analysis, which showed Viterra to date has apparently not chosen to share efficiencies with industry through lower fees. However, the Commission did not conclude that Viterra’s returns are currently unreasonable.
Future concerns may arise if the trend in Viterra’s operating surpluses continues to the point at which returns exceed a reasonable level. This point may occur if Viterra continues to find efficiencies to reduce costs, without sharing the benefits with industry through lower fees. (Draft Finding 4.6)
In relation to pricing behaviour, the Commission found possible evidence of a pricing structure that potentially serves as a barrier to new competition or expansion by existing competitors (specifically, the Receival at Port Service Fee (from Approved Third Party Storage)). For many practices that may raise market power concerns, however, there are operational justifications. There is also a need to consider their cumulative impact. Given the draft finding that Viterra is currently earning reasonable financial returns, this fee, in isolation, does not provide conclusive evidence that Viterra is exercising market power.
Given the available evidence, the Commission considers Viterra’s behaviour in relation to the remaining fees and practices investigated (Export Select, grower direct deliveries to port, capacity booking fee, lost capacity fee, shrinkage and dust rates, and the impact of vertical integration) is not, on its own, detrimental to the efficiency of the supply chain.
Does the Receival at Port Service Fee (from Approved Third Party Storage) deter any stakeholder wanting access at a port? Do stakeholders have evidence that counters the Commission’s draft findings on the Viterra fees and practices investigated? (Draft Finding 4.7)
The Commission found evidence that the market is not sufficiently informed, in the case of both growers and traders, and potential competitors.
If this lack of information is an issue, to what extent does it have a material impact on the efficiency of the supply chain? What is the evidence? (Draft Finding 4.8)

Public—I2—A2 Inquiry into the South Australian bulk grain export supply chain costs 5
Draft findings—other issues
Grain pooling is one of many tools available to growers to manage risk. To the extent that individual growers cannot manage an issue, the grain industry should be able to manage such issues. (Draft Finding 5.1)
The public release of more grain stock information has both strong industry advocates and opponents. To the extent that the release of more stock information has net benefits, the grains industry should be able, by itself, to achieve the best outcome.
If this is an issue, what additional stock information should be released? To what extent would the information have a material impact on the efficiency of the supply chain? What is the evidence? (Draft Finding 5.2)
The freight cost component of the supply chain costs is efficient, within the current economy-wide framework for establishing road user charges and identifying road investment priorities. The competitive road freight industry underpins efficient road and rail freight rates. This competition is complemented by regulatory oversight through the rail access regime. (Draft Finding 5.3)
It is not clear that the practice of quality arbitrage is detrimental to the overall returns achieved by the grain industry. It does not seem to be an issue for growers, so long as they receive a price commensurate with the value of the grain on the global competitive market. (Draft Finding 5.4)
The Commission will consider further the merits of the Grain Producers South Australia (GPSA) proposal for a statewide transport access regime (including grain storage and handling) in the light of submissions to this inquiry Draft Report. It will also consider any position reached by the Department of Agriculture and Water Resources (DAWR) in its Port Terminal Access Code (PTAC) review final report. (Draft Finding 5.5)
1.3 Purpose of the inquiry and this Draft Report
The Inquiry is examining the costs underpinning the supply chain, which covers the process of moving grain from farms, storing and transporting it and loading it onto vessels for export. The previous Treasurer referred the inquiry to the Commission under Part 7 of the Essential Services Commission Act 2002 (SA) (ESC Act), by letter dated 16 March 2017. The inquiry terms of reference are split into two parts.
Part 1 is to examine supply chain costs (from farm gate to export vessel) over the 10 years to 2017-18, having regard to:
the components of the supply chain costs (including vessel loading fees) and their efficiency
harvest trends in South Australia for the 10 years to 2017-18
the basis for recovering the road and rail components of the bulk grain export supply chain costs.
If the Commission finds areas in which supply chain costs are inefficient, part 2 requires the Commission to provide options for addressing those inefficiencies.

Public—I2—A2 Inquiry into the South Australian bulk grain export supply chain costs 6
1.4 Report contents and structure
This Draft Report presents the Commission’s draft findings for part 1 of the inquiry terms of reference:
Chapter 2 sets out the Commission’s method for assessing the efficiency of the supply chain. It also explains various inquiry process matters.
Chapter 3 looks at how the South Australian grain export supply chain operates in the context of the world market. It also explains the roles of the major market participants.
Chapter 4 investigates the efficiency of the supply chain. It reports the Commission’s draft findings on whether any firms providing supply chain services are exercising market power. Viterra is the main focus, and the chapter examines Viterra’s cost controls, management of assets, responsiveness to customer requirements, and level of financial returns and fees.
Chapter 5 investigates issues relevant to the inquiry terms of reference that are not covered in chapter 4. It focuses on evidence presented to the Economic and Finance Committee’s primary producers’ inquiry.
Chapter 6 summarises the next steps for the inquiry.
Six appendices provide supporting detail.
1.5 Next steps
The Commission seeks comments on this Draft Report by Monday, 17 September 2018. For details on how to make submissions, please see the inside cover of this report.
The Commission would be pleased to meet with stakeholders, either individually or with representative organisations, to discuss the findings presented in this Draft Report. Such meetings could be held as public forums in Adelaide and/or regional centres if there is sufficient interest.1 If you or your organisation wishes to meet with Commission staff, please use the contact details on the inside cover of this report.
The Final Report, incorporating a part 2 if required, is due to the Treasurer no later than 31 October 2018.
1 It would still be important to receive submissions in the absence of a formal transcript (in some form) being taken of the
proceedings of such a meeting, to enable the Commission to rely on the transcript as evidence.

Public—I2—A2 Inquiry into the South Australian bulk grain export supply chain costs 7
2.1 About the inquiry
The inquiry was referred to the Essential Services Commission (Commission) under Part 7 of the Essential Services Commission Act 2002 (SA) (ESC Act).2,3 Its terms of reference have two parts:
a) In part 1 the Commission is to inquire into the South Australian bulk grain export supply chain (farm gate to export vessel) costs, including vessel loading charges over the past 10 years, having regard to:
(i) the components of the bulk grain export supply chain costs (including vessel loading charges) and their efficiency
(ii) harvest trends in South Australia over the past 10 years, and
(iii) the basis upon which road and rail components of the bulk grain export supply chain costs are recovered.
b) As part 2 of the Inquiry, should the Commission find areas where bulk grain supply chain costs are identified as inefficient, options should be provided for addressing those inefficiencies.
As established under the Terms of Reference, this Inquiry is into the cost efficiency of the bulk grain export supply chain, rather than into broader questions of pricing or equity in the grains sector. As is clear from the Terms of Reference, the Inquiry’s findings are intended to assist the Government in considering its policy position on three key State objectives, as follows:
provide transparency in regards to bulk grain export supply chain costs in South Australia
determine areas where future efficiencies may be achieved in the South Australian bulk grain export supply chain
review the appropriateness of mechanisms used for funding road and rail components of the bulk grain export supply chain costs.
In that context, it is important to emphasise that this Inquiry’s findings will not constitute a regulatory determination nor a binding decision – they are intended to and will inform broader public and policy debates on the cost efficiency of the grain export supply chain. It is also important to highlight that this draft Inquiry report is based on the best evidence currently available to the Commission. Consultation on the draft Inquiry report provides the opportunity for stakeholders to test, challenge and verify the evidence which has been presented to the Commission and the analysis utilised by the Commission (in accordance with the Terms of Reference). Testing, challenging and verifying will facilitate the preparation of the final Inquiry report, which will assist the Government’s consideration of the State objectives and inform a wider public debate on grain export issues.
In summary, for part 1 of the inquiry, the Commission must identify whether the South Australian bulk grain export supply chain (supply chain) is efficient, as a whole and by individual segment.4 If the Commission finds evidence of inefficiencies, then part 2 requires the Commission to provide options for addressing those inefficiencies.
2 Sections 36–38 of the ESC Act provide for certain requirements when conducting an inquiry. 3 Appendix A reproduces the referral letter and subsequent variation letters. 4 Inquiry term of reference (a)(i) requires the Commission to have regard to ‘the components of the bulk grain export supply
chain costs (including vessel loading fees) and their efficiency’.

Public—I2—A2 Inquiry into the South Australian bulk grain export supply chain costs 8
This Draft Report presents the Commission’s draft findings for part 1. The then Treasurer requested a variation to the inquiry terms of reference, so the timeframe for the Commission’s submission of the Draft Report to the Treasurer was extended beyond November 2017. The extension allowed the Commission to account for the evidence and findings of:
the Australian Export Grains Innovation Centre report into supply chain costs across Australia (expected to be released in mid-2018)
the South Australian Parliament’s Economic and Finance Committee Inquiry into Issues faced by Primary Producers final report (released 28 November 2017).
2.2 How the Commission assesses supply chain efficiency
The Commission assesses the efficiency of the supply chain by investigating whether there is any market structure or firm behaviour inhibiting a competitive outcome. Competitive markets generally deliver economic efficiency and, in turn, an efficient supply chain that provides and charges for goods and services at efficient cost. First, the Commission examines the structure of the relevant market, to consider a firm’s ability to possess market power (section 2.2.2). Then, by examining firm behaviour, it considers whether there is evidence that a firm may be exercising such power in a sustained manner that has a material detrimental effect on competition (section 2.2.3).
However, structural and behavioural factors are not independent of each other. Strategic behaviour can alter market structure by raising or creating entry barriers.5 It can also differ markedly among firms facing similar market structures.6 So, the Commission seeks factual evidence of actual behaviour in the market under investigation.
2.2.1 Market power
Market power is a firm’s ability to raise price persistently above efficient cost, to exclude competitors7 or, more generally, to act in an unconstrained manner.8 The firm may exercise market power by:9
raising or maintaining price persistently above the competitive level (efficient cost) by restraining its own output, and/or
preventing entry or otherwise raising the costs of more efficient potential competitors.10
However, an inefficient outcome results from the firm’s actual exercise of market power,11 not from its ability to exercise market power. Accordingly, the Commission seeks evidence that a firm is exercising market power in a sustained manner that detrimentally affects market outcomes.12
5 R. Smith and D. Round, ‘A strategic behaviour approach to evaluating competitive conduct’, Agenda, vol. 5, no. 1, 1998, p. 26,
available at http://press-files.anu.edu.au/downloads/press/p104931/pdf/article03.pdf. 6 R. Smith and D. Round, p. 26. 7 Essential Services Commission, 2017 Ports Access and Pricing Review, final report, September 2017, ‘Glossary of terms’, p. ii,
available at http://www.escosa.sa.gov.au/ArticleDocuments/1026/20170911-2017PortsAccessAndPricingReview-Final.pdf.aspx?Embed=Y.
8 Essential Services Commission, 2017 Ports Access and Pricing Review, Final Report, p. 5. 9 T. Krattenmaker, R. Lande and S. Salop, Monopoly power and market power in antitrust law, Airlie House Conference on the
Antitrust Alternative, The United States Department of Justice, 1987 (updated June 2015), viewed 4 June 2018, available at https://www.justice.gov/atr/monopoly-power-and-market-power-antitrust-law.
10 An example is an incumbent firm that owns infrastructure and raises competitor costs by charging higher access fees to the competitor to use the incumbent firm’s facilities.
11 A term synonymous with ‘market power’ is ‘monopoly power’ (see T. Krattenmaker, R. Lande and S. Salop). 12 Even firms in a competitive market might be expected to be able to exercise market power in the short term. Without this
ability, firms would have no incentive to innovate or seek efficiencies. But a competitive market, by encouraging competitors to enter (or existing firms to adopt the innovation or efficiencies), means any higher financial return achieved by the innovating firm is soon competed away.
Public—I2—A2 Inquiry into the South Australian bulk grain export supply chain costs 9
The Commission also seeks to understand the degree to which any market power is being exercised.13
Natural monopolies, for example, have the potential to exercise market power in a sustained manner. They occur when high costs from duplicating the infrastructure to deliver services (such as when economies of scale exist) significantly limit efficient competition in the provision of those services. The absence of competition can adversely affect the long-term interests of consumers if the firm possesses and exercises market power by, for example, imposing unreasonable access terms and conditions on the use of its infrastructure, or setting excessive prices.14
While there is a clearly accepted definition of market power, and understanding of what the term means, determining whether a firm is exercising market power in a sustained manner is not necessarily straightforward.
2.2.1.1 Efficiency
Evidence that market power is being exercised in a material and sustained manner would be evidence that the supply chain is not efficient. Efficient cost is the lowest sustainable cost of providing goods and services at a given service standard, noting that a competitive market will continue to pursue lower costs and improved service standards over time. Alongside efficient prices, it is an expected outcome of effective competition in the market for a good or service.15 For determining the efficient cost, the presence of any service standards and regulations (such as environmental and health requirements) are relevant.16
Various approaches can be used to assess the extent to which costs are efficient, and whether prices reflect efficient costs. These approaches include price (fee) and cost benchmarking, but benchmarking has the risk that some or all peer operators are inefficient. Another approach is to assess whether a firm’s financial returns are reasonable, on the basis that excessive returns may indicate prices are set well above costs. Efficient cost provides for a firm to earn a reasonable rate of (financial) return.17
2.2.2 Market structure
Market structure is examined to assess a firm’s ability to possess market power. Compared with assessing market behaviour (section 2.2.3), assessing market structure is generally more straightforward, and accounts for:
the level of market concentration (and whether an incumbent firm has a large market share)
the extent of supply side substitution (that is, the ability of alternative firms to increase their output in response to a relative price rise by the incumbent firm), which depends on the extent of any
13 As discussed elsewhere in this report, a tradeoff may occur between the efficiencies that a single firm can achieve by fully
exploiting scale economies for a given cost function (relationship between output and costs) and the efficiencies that multiple firms can achieve by competing (that is, by moving the cost function down). The presence of multiple firms could result in higher average costs for the overall industry if (notwithstanding the positive impact of competitive pressures) the sharing of industry output among more firms leads to higher unit costs due to the loss of economies of scale. For this reason, a monopolist (single firm) that can exploit economies of scale and that does not exercise market power (or does so only to a relatively low level) could achieve a superior outcome to a competitive market.
14 Essential Services Commission, 2017 Ports Access and Pricing Review, final report, p. 7. 15 Economic Regulatory Authority, The efficient costs and tariffs of the Water Corporation, Aqwest and Busselton Water, final report,
10 November 2017, p. 7, available at: https://www.erawa.com.au/cproot/18490/2/Inquiry%20into%20efficient%20costs%20and%20tariffs%20of%20the%20Water%20Corporation,%20Aqwest%20and%20Busselton%20Water%20-%20Final%20Report.pdf
16 Economic Regulatory Authority, The efficient costs and tariffs of the Water Corporation, Aqwest and Busselton Water, p. xxi. 17 An economic term for this is a ‘normal’ rate of return, or ‘normal profit’. A return in excess of this can be considered a
‘super-normal profit’, other similar terms being ‘excessive profit’, ‘economic rent’, or ‘monopoly rent’.

Public—I2—A2 Inquiry into the South Australian bulk grain export supply chain costs 10
barriers to entry, expansion, mobility or exit 18
the extent of demand side substitution (that is, the ease with which customers can switch from an incumbent firm to an alternative firm in response to a change in relative price). Put another way, this is the extent of countervailing power held by customers (which may include the ability to threaten other options to constrain the firm).19
A single operator (or small number of operators) having a high market share, in a market with low levels of substitutability, would not constitute conclusive evidence that one firm or a group of firms is exercising market power. But it would indicate the need to question how all firms in the market operate and interact, to check whether market power is being, or has been, exercised (section 2.2.3).
2.2.3 Market behaviour
Observing a firm’s market behaviour to assess whether the firm is exercising market power is difficult. It involves identifying that a firm’s action has the effect of excluding competitors or denying them an equality of opportunity to compete.
New entry (or the expansion of existing competition) drives market efficiency, but such entry has to be sustainable. For a market to be considered contestable (that is, at least open to competition), an incumbent firm needs to feel ongoing pressure from the realistic prospect of a competitor’s sustained entry (or from action by an existing competitor). Further, that prospect would have to pose a material threat to any attempt by the incumbent firm to exercise market power. (‘Hit and run’ or transient entry will not achieve this threat).20 Consequently, in a competitive market, any attempt to exercise market power will have only a transitory impact. Behavioural analysis thus needs to cover a period of time (and not be just a static analysis), consistent with competition being a process rather than a situation.
2.2.3.1 Evidence that the Commission seeks
The Commission seeks evidence (Table 2.1) that enables it to assess whether a supply chain firm is exercising market power in a systematic and sustained manner. A specific action or behaviour undertaken by a firm is likely, however, to have more than one interpretation—for example, for an action that might be interpreted as an exercise of market power, the incumbent firm may provide a credible operational efficiency justification. In this case, the Commission has to ‘weigh up’ the facts and come to an on-balance interpretation of the action or behaviour. Further, while a single specific strategy may appear anti-competitive in isolation, the Commission needs to consider whether the overall impact of a firm’s collective actions may result in a competitive outcome.21
18 Economies of scale can act as a barrier to entry, potentially deterring new entrants if they believe they need to sell large
volumes before they can be competitive with existing firm(s).Well established firms may respond to a new entrant by lowering prices in an attempt to raise barriers to entry by making a new entrant’s services less competitive. This response may be an easy option for an incumbent enjoying economies of scale and previously charging above efficient cost. Well established firms may respond in a similar fashion to existing competitors seeking to expand their production and/or level of services provided. Barriers to exit make it more difficult for a firm to get out of a particular business, and may make a new entrant reluctant to enter for fear of loss of investment (The Economist, ‘Barriers to entry, exit and mobility’, Online extra, 13 July 2009, viewed 4 June 2018, available at http://www.economist.com/node/14025576). Barriers to entry are a matter of degree; the issue is whether they are high enough to materially impact the efficacy of competition (S. Bishop, S. Meyrick and P. Williams, Expert joint statement, Application by Sea Swift Pty Ltd, Australian Competition Tribunal, 1 June 2016, p. 3, available at http://www.competitiontribunal.gov.au/current-matters/tribunal-documents/act-2-2016).
19 Australian Competition Tribunal, Application by Sea Swift Pty Limited [2016] ACompT 9, 28 July 2016, Reasons for Determination, paragraph 269, available at http://www.judgments.fedcourt.gov.au/judgments/Judgments/tribunals/acompt/2016/2016acompt0009.
20 S. Bishop, S. Meyrick and P. Williams, Expert joint statement, p. 5. 21 A point made in R. Smith and D. Round, p. 26.

Public—I2—A2 Inquiry into the South Australian bulk grain export supply chain costs 11
Table 2.1 Evidence to assess the efficiency of the supply chain
Behaviour Evidence
Barriers to supply side substitution Is there evidence that the firm is engaging, or has engaged, in the following types of strategic behaviour systematically and on a sustained basis, or in other behaviour that could be characterised as strategic conduct designed to deter new entry, or expansion by smaller firms?
Physical barriers at port
Pricing practices, and
Non-pricing practices.
Restriction of competition in upstream and downstream markets
Is there evidence that the firm is engaging, or has engaged, in strategic behaviour, or has engaged in similar types of conduct on a systematic and sustained basis as a result of being part of a vertically integrated entity?
Barriers to demand side substitution
Is there evidence that the firm is engaging, or has engaged, in the following strategic behaviour, or has engaged in similar types of conduct on a systematic and sustained basis?
Restricting or hindering customer access to alternative providers.
Prices above efficient cost Is there evidence that the firm, on a systematic and sustained basis, is:
setting prices (fees) above efficient cost?
earning in excess of a reasonable return?
failing to provide customers with a reasonable share of the benefits of any efficiencies achieved?
Lack of customer service and innovation
Is there evidence that the firm, on a systematic and sustained basis:
is failing to provide service that meets customer needs?
has a poor record in delivering innovation?
Behaviour of new entrants or existing small competitors
What can be learnt from the behaviour of new entrants or existing small competitors failing to expand—for example:
Are competitors small in number and satisfied with being niche players? If so, why?
Are new entrants operating at a loss for an extended period,22 which places into question the sustainability of the competition?
Are new entrants cherrypicking, with the risk that overall supply chain costs are higher?
Insufficiently informed market To what extent is there relevant information that is not publicly available and that materially impacts the efficiency of the supply chain?
22 In a competitive market, a new entrant might be expected to operate at a loss initially.
Public—I2—A2 Inquiry into the South Australian bulk grain export supply chain costs 12
2.2.4 Other sources of market failure
There are potential sources of market failure23 other than the exercise of market power. Information asymmetries, for example, can result in inefficient outcomes. In this case, one party holds information that is important to another party to a transaction, creating a power imbalance. Markets generally work best when all relevant parties, including potential market entrants, are well informed.
The inquiry seeks to identify whether these other sources of market failure exist and impact on the efficiency of the supply chain in a material way.
2.3 Inquiry process
The inquiry terms of reference (Appendix A) require the Commission to:
work collaboratively with Primary Industries and Regions SA (PIRSA), the South Australian Department of Planning, Transport and Infrastructure (DPTI) and the Department of Treasury and Finance (DTF)
investigate the potential to work with the Australian Export Grains Innovation Centre (AEGIC) as a consultant for the inquiry
conduct a public consultation, in a manner considered appropriate by the Commission.
The Commission established a reference group—comprised of representatives from PIRSA, the DPTI and the AEGIC—to provide expert advisory assistance. It has kept DTF officers informed (in their support role to the Treasurer as referring Minister) of the inquiry’s progress.
The Commission adopts a systematic approach to consultation to help identify and address all relevant issues, and to allow all stakeholders to provide input.24 It requested submissions on the inquiry terms of reference in April 2017, and received submissions from:25
PIRSA
Grain Producers SA (GPSA)
South Australian Freight Council (SAFC)
Viterra
two private individuals.
The Commission held meetings26 with:
growers
traders (buyers)
grain industry associations
other state and federal regulators
other government departments
23 In economic terms, a market failure is a situation in which the allocation of goods and services is not efficient.
Market failures are often associated with the exercise of monopoly power, information asymmetries, externalities, time-inconsistent preferences and principal-agent problems.
24 Essential Services Commission, Charter of Consultation and Regulatory Practice, September 2014, available at https://www.escosa.sa.gov.au/ArticleDocuments/567/20140910-Corp-CharterConsultationRegulato.pdf.aspx?Embed=Y.
25 All submissions to the inquiry terms of reference are available at http://bit.ly/InquirySABulkGrainSupplyChain. 26 Face-to-face in most cases, and by teleconference in the case of interstate agencies.

Public—I2—A2 Inquiry into the South Australian bulk grain export supply chain costs 13
supply chain service providers
Genesee and Wyoming Australia Pty Ltd (GWA)
Flinders Ports
Viterra.
This Draft Report represents the next stage in the public consultation process.
To maximise the benefit from the inquiry, the Commission sought to minimise information gaps (where information is not publicly available) by directly requesting information from the firms that provide supply chain services. The Commission also engaged an industry consultant to advise on technical aspects of the grain sector.
In accordance with the December 2017 variation to the inquiry terms of reference (Appendix A), the Commission considered:
the evidence provided to the Economic and Finance Committee, as detailed in chapter 12 of the Committee’s November 2017 report From the paddock to the plate—a fair return for producers27
an AEGIC study of grain supply chain costs across Australia.28 AEGIC provided detailed copies of its spreadsheets, draft versions of its report, and any other supporting material requested by the Commission. At the time of providing this Inquiry report to the Treasurer, AEGIC had yet to publish its report and this Draft Report uses the most up to date draft information provided by AEGIC to the Commission (and hence the references throughout this Draft Report to AEGIC, Australian export grains supply chains in 2017, forthcoming).
The Commission:
had access to grain export data supplied to the Australian Competition and Consumer Commission (ACCC) by Australian Crop Forecasters. The ACCC provided the Commission with a licence to use the data for this inquiry.
made nine requests for information to Viterra, to which Viterra responded in a timely manner. The Commission appreciates the assistance provided by Viterra management and staff.
The matters raised have been considered and, where relevant, arguments and submissions have been referred to in this report to assist stakeholders to understand the draft positions that have been reached. All submissions have been useful in helping to understand the factual underpinning of the industry, key relevant issues and the competing viewpoints. They have informed the Commission’s consideration of each of the relevant issues; a failure to reference an argument or submission does not mean that it has not been taken into account.
Through consultation the Commission has received information from stakeholders over which confidentiality has been claimed. As a result, at this time, the Commission has decided not to disclose information in this report, in part or in total, which is subject to such a claim. Appendix C outlines the Commission’s data verification process.
The Commission thanks all stakeholders that provided input into the inquiry to date, and it seeks further submissions on this Draft Report.
27 Economic and Finance Committee, From the paddock to the plate—a fair return for producers, 97th Report, 28 November 2017,
available at https://www.parliament.sa.gov.au/Committees/Pages/Committees.aspx?CTId=5&CId=173. 28 AEGIC, Australian export grains supply chains in 2017, forthcoming.

Public—I2—A2 Inquiry into the South Australian bulk grain export supply chain costs 14
Chapter summary
Australian grain benefits from being high quality, sustainable and clean. Production is counter-cyclical to the northern hemisphere, so Australian grain has a brief window of opportunity to maximise returns.
South Australia is a small player in the global grain market. It must continue to pursue efficiency in supply chain costs to enable the industry to maintain its global competitiveness.
Responding to the variability of harvests is an important aspect of the supply chain. Participants need to be able to manage costs in poor harvest years, while still having the capacity and capability to manage large harvests. This means good harvest years cover bad years.
Grain trading in South Australia appears to be competitive.
Viterra operates 94 percent of commercial grain storage sites in South Australia.
Genesee and Wyoming Australia Pty Ltd (GWA) is the primary provider of freight rail services for bulk grain in South Australia, although the relatively short distances to port mean road transport successfully competes with rail.
Viterra is the main provider of supply chain port bulk grain loading services, with 91 percent of market share throughput.
South Australia’s total on-farm storage capacity appears to have been static over the 10 year period and, compared with eastern Australian States, is relatively small (as a proportion of total state storage capacity).
This chapter provides an overview of how the supply chain operates in the context of the world market. It also explains the roles of the major market participants in South Australia. It highlights that the supply chain, while operating as a whole system, can be broadly categorised into three market segments (storage and handling, freight transport to port, and port services).
3.1 South Australia’s place in the bulk grain export market
South Australia is a relatively small player in the global market for bulk grain, with a less than 1 percent (by value) market share. Figure 3.1 illustrates how South Australia’s grain export (by volume) evolved over the past 10 years. South Australia’s presence on the global market is relatively static, despite growing demand from Asia. This characteristic largely reflects continued pressure from international low cost producers (Russia, the Ukraine and Argentina) that ensures South Australia has to remain competitive simply to retain market share.29 As the Department of Agriculture and Water Resources noted, future improvements in the quality and stability of Black Sea wheat exports could displace exports from higher cost producers, including Australia.30
South Australia exports much of its grain production into the global bulk grain export market, which is worth around US$200 billion per year.31 That market is highly competitive. South Australia competes
29 South Australia’s share of global exports (by volume) averaged 2.3 percent for the 10 year period, falling within a range of
1.0–3.6 percent (Figure 3.1). 30 Department of Agriculture and Water Resources (DAWR), Wheat Port Code Review, Interim report of the review of the
Competition and Consumer (Industry Code – Port Terminal Access (Bulk Wheat)) Regulation 2014, 10 April 2018, p. 13, available at https://haveyoursay.agriculture.gov.au/review-of-the-wheat-port-code.
31 Rabobank, ‘Grow with the flow’, Rabobank Industry Note 541, March 2016, viewed 4 June 2018, available at https://research.rabobank.com/far/en/sectors/grains-oilseeds/grow-with-the-flow.html.

Public—I2—A2 Inquiry into the South Australian bulk grain export supply chain costs 15
with other Australian states, Canada, the United States of America, France, Germany, Russia, the Ukraine and Argentina to supply grain (Figure 3.1). Its grain exports represent around $2.2 billion (value at the farm gate),32 which is 2 percent of the South Australian gross state product and around 15 percent of the value of total South Australian exports. Its share of total Australian grain exports averaged 23 percent (Figure 3.1) over the 10 year period covered by this inquiry.
Figure 3.1 Grain exports by country versus South Australia, by volume, 2007-08 to 2016-1733
Source: US Department of Agriculture.
Viterra and Grain Producers South Australia (GPSA) submitted South Australian grain is high quality, sustainable, traceable and clean.34 Another advantage (for the other Australian states too) is that South Australian grain production is counter-cyclical relative to the northern hemisphere. South Australian grain producers thus have a window of opportunity (December to May) to sell to international markets when there is less global supply. To maximise the value that can be obtained during that window, participants in the South Australian bulk grain export market need to move bulk tonnages quickly before northern hemisphere grain is available.35 The task of the supply chain is to maintain quality and efficient grain movement, which is why it is important to South Australia.
Also to maintain competitiveness in the global grain market, South Australian participants need to operate at scale in a cost-effective manner that gets the right amount of grain to the right place at the right time, and at the required quality. This complex logistical task challenges all operators competing in the global market for bulk grain. If South Australia fails to meet this challenge, end users will find alternative suppliers, to the detriment of the South Australian grain industry.
3.1.1 South Australian grain in a national context
In Australia, on average, Western Australia is the largest grain production state (about 13 million tonnes per year), followed by New South Wales (10 million tonnes), South Australia (7 million tonnes) and
32 $2.2 billion represents 2016-17 actual. Source: Viterra, Submission to the Inquiry into the South Australian Bulk Grain Export
Supply Chain Costs, May 2017, p. 2. 33 US Department of Agriculture, Dataset, viewed 24 October 2017, available at
https://apps.fas.usda.gov/psdonline/app/index.html#/app/downloads. 34 Viterra, Submission to the Inquiry into the South Australian Bulk Grain Export Supply Chain Costs, May 2017, p. 2;
GPSA, Submission to the Inquiry into the South Australian Bulk Grain Export Supply Chain Costs, 11 May 2017, p. 3. 35 GPSA submitted grain delivery in a timely, convenient and economical manner with segregation options is the main factor
during harvest. Source: GPSA, Submission to the Inquiry into the South Australian Bulk Grain Export Supply Chain Costs, 11 May 2017, p. 3.
0
20
40
60
80
100
120
140
2007-08 2008-09 2009-10 2010-11 2011-12 2012-13 2013-14 2014-15 2015-16 2016-17
Mill
ion
tonn
es
North America (US & Canada) Low cost producers (Russia, Ukraine & Argentina)
European Union Australia (total)
South Australia

Public—I2—A2 Inquiry into the South Australian bulk grain export supply chain costs 16
Victoria (5 million tonnes).36 South Australia and Western Australia are export focused markets, each exporting around 85 percent of their grain production (Figure 3.2).37 New South Wales and Victoria have larger domestic markets, on average exporting only around 50 percent of their grain production.
A significant portion of South Australia’s grain growing occurs close to the coast, with two sea gulfs dividing the growing regions. This arrangement resulted in railways being divided into the Eyre Peninsula and that portion of the South Australian land mass east of the Spencer Gulf (eastern South Australia) (section 3.3.3), and in a relatively high number of grain port terminals (section 3.3.4).
Figure 3.2 State grain production, by volume, 2008-09 to 2017-1838
Source: ABARES.
Draft Finding 3.1
Australian grain benefits from being high quality, sustainable and clean. Production is counter-cyclical to the northern hemisphere, so Australian grain has a brief window of opportunity to maximise returns.
Draft Finding 3.2
South Australia is a small player in the global grain market. It must continue to pursue efficiency in supply chain costs to enable the industry to maintain its global competitiveness.
3.2 South Australian harvest trends
The inquiry terms of reference require the Essential Services Commission (the Commission) to consider harvest trends in South Australia over the past 10 years.39 During that period, harvest totals varied from 4.9 million tonnes to 11.1 million tonnes (Figure 3.3). Given South Australian grain
36 PIRSA, Submission to the Inquiry into the South Australian Bulk Grain Export Supply Chain Costs, May 2017, p. 4. 37 PIRSA, Submission to the Inquiry into the South Australian Bulk Grain Export Supply Chain Costs, May 2017, p. 4. 38 ABARES, Agricultural commodities and trade data: Australian crop report, February 2018, viewed June 2018, available at
http://www.agriculture.gov.au/abares/research-topics/agricultural-commodities/agricultural-commodities-trade-data#crops.
39 At the start of the inquiry, 2007-08 represented the first year for a 10 year period. Given time passing in producing this report, the Commission chose to add 2017-18 as the results became available, effectively creating 11 years of data.
0
2
4
6
8
10
12
14
16
18
20
2007-08 2008-09 2009-10 2010-11 2011-12 2012-13 2013-14 2014-15 2015-16 2016-17 2017-18(forecast)
Mill
ion
tonn
es
New South Wales Queensland South Australia Victoria Western Australia

Public—I2—A2 Inquiry into the South Australian bulk grain export supply chain costs 17
production is entirely rain fed, this harvest variation is largely attributable to the climate and seasonal rain. Responding to this variability is an important aspect of the supply chain. To be viable, the supply chain participants should be able to manage costs in poor harvest years, while having the capacity and capability to manage large harvests.
South Australia has about 5000 grain producers, which sow around 4 million hectares of crop each year.40 The majority of crop is sown in April–May and harvested from late September. Wheat and barley are the largest crops, comprising around 59 and 20 percent respectively of the state’s total harvest. Other crops grown include pulses (such as lentils, peas, beans, chickpeas and lupins—9 percent in total), canola (7 percent) and other cereal crops (5 percent).41
Figure 3.3 South Australian harvest trends (tonnes)42
Source: PIRSA.
3.2.1 Production trends
Improved farming systems and new plant varieties have increased the reliability of the grain yields in South Australia over the past 10 years.43 Harvests increased as growers increased the proportion of farm area dedicated to crop, 44 and plant breeders continued to deliver higher yielding varieties. In addition, many growers adopted zero tillage techniques, enabled by chemical spraying of weeds, faster seeding equipment, and grain varieties that perform better with early sowing.45 Combined with the use of more nitrogen fertiliser, those changes increased yields in many regions despite drier conditions.46
40 GPSA, Grain facts, viewed 10 May 2018, available at http://grainproducerssa.com.au/about/grain-facts/. 41 PIRSA, Submission to the Inquiry into the South Australian Bulk Grain Export Supply Chain Costs, May 2017, p. 4. 42 Forecast for 2017-18 is from PIRSA, September 2017 Crop and Pasture Report available at
http://www.pir.sa.gov.au/__data/assets/pdf_file/0005/299120/PIRSA_Crop_and_Pasture_Report_Sept_17.pdf. PIRSA’s March 2018 PIRSA Crop and Pasture Report—South Australia (available from http://pir.sa.gov.au/__data/assets/pdf_file/0003/313788/Final_PIRSA_Crop_and_Pasture_Report_Final_Summary_Season_17-18_March_20....pdf) upgraded the 2017-18 total grain forecast from 6,685,950 tonnes (September 2017 estimate) to 6,921,400 tonnes.
43 AEGIC, Australian grain production—a snapshot, August 2016, viewed 10 May 2018, available at http://aegic.org.au/australian-grain-production-a-snapshot/.
44 R. Kingwell, ‘Changes in grain handling catchments in Australia: an historical perspective’, The Australian Journal of Agricultural and Resource Economics Society, March 2017, p. 11, available at http://onlinelibrary.wiley.com/doi/10.1111/1467-8489.12206/abstract.
45 GPSA submitted the long-term trend in harvest is due to not only timely rain events, but also improved agronomic practices by grain producers and the use of higher yield varieties: GPSA, Submission to the Inquiry into the South Australian Bulk Grain Export Supply Chain Costs, 11 May 2017, p. 6.
46 AEGIC, Australian growers are planting one month earlier than 30 years ago, February 2016, viewed 10 May 2018, available at http://aegic.org.au/australian-growers-are-planting-one-month-earlier-than-30-years-ago/.
0
2,000,000
4,000,000
6,000,000
8,000,000
10,000,000
12,000,000
2007-08 2008-09 2009-10 2010-11 2011-12 2012-13 2013-14 2014-15 2015-16 2016-17 2017-18

Public—I2—A2 Inquiry into the South Australian bulk grain export supply chain costs 18
3.2.2 Technology trends
Advances in technology also increased the rate of harvest. Larger harvesters can harvest greater volumes in less time; when combined with chaser bins and mobile field bins, they led to increased volumes of grain harvested per day over recent decades. Since the mid-1980s, for example, grain harvest rates increased by over three times.47 The increases in yield and harvesting capacity led to an increase in the size of grain transport trucks, as many farmers invested in larger trucks to reduce the time taken to remove harvested grain from the farm.
Draft Finding 3.3
Responding to the variability of harvests is an important aspect of the supply chain. Participants need to be able to manage costs in poor harvest years, while still having the capacity and capability to manage large harvests. Given the variability in grain production, high returns in good years may be necessary to offset poor returns from bad harvest years for participants to achieve a reasonable return on average.
3.3 South Australia’s bulk grain export supply chain
The South Australian bulk grain export supply chain can be split logistically and transactionally:
Logistically, its three main segments are upcountry handling and storage, freight transport to port, and port services (including export bulk loading facilities) (Table 3.1).
Transactionally, grain trading is undertaken via traders operating on the global market.
Table 3.1 Market segments of the supply chain
Source: Essential Services Commission
47 R. Kingwell, ‘Changes in grain handling catchments in Australia: an historical perspective’, p. 12.
Service category Description
Storage and handling Getting grain to an off-farm storage facility and storing the grain at that facility. This service covers:
receiving grain (inturning)
storing grain at receival sites and pest management
screening grain before storage to ensure it meets required quality standards
outturning grain.
Freight transport to port Freight transport of the grain from a storage facility to port. The grain can be freighted from an off-farm storage facility or the grower’s own storage facility.
Depending on where the grain has come from, this service can include screening the grain before its storage at the port.
Port Services Port services cover:
access to shipping berths and associated services to bring a vessel to port
access to specialist loading equipment to load grain onto the vessel.

Public—I2—A2 Inquiry into the South Australian bulk grain export supply chain costs 19
Figure 3.4 shows the logistical (physical) and transactional (financial) flows.48 The downward pointing blue arrows show the physical flows, which are either:
growers delivering to Viterra’s upcountry storage, with Viterra then handling the transport to port storage via Export Select (left-most blue arrow), or
growers delivering direct to port storage (right-most blue arrow).
From the port storage, the grain is outturned to vessels through the port terminal loading facilities (bottom two blue arrows). The upward pointing red arrows show the financial flows, which are:
traders paying Viterra for all the supply chain services that Viterra provides (right-most red arrow)
traders then making a net payment (wheat price less supply chain fees) to the grower (left-most red arrow).
Figure 3.4 Physical and financial flows on grain export supply chain
Farm
Storage
Port services
Shipping to international
market
Transport
Grower
Viterra
Trader
Money flow
Grain flow
Net grain payment
(less supply chain fees)
Supply chain fees
Source: Essential Services Commission.
In practice, however, bulk grain exports can get to port via a number of paths (Figure 3.5), and a number of grain types are involved. The Commission investigated the efficiency of the supply chain for the
48 The inquiry is not directly concerned with domestic use of bulk grain, or with containerised grain exports. The inquiry
terms of reference state ‘In part 1 [of the Inquiry] the Commission is to inquire into the South Australian bulk grain export supply chain (farm gate to export vessel) cost including vessel loading charges …’.

Public—I2—A2 Inquiry into the South Australian bulk grain export supply chain costs 20
predominant grain type49 traversing the predominant path.50 The main supply chain under investigation covers:
bulk wheat (because wheat is the largest grain crop produced in South Australia)51
bulk grain delivered by farmers to Viterra’s upcountry sites (because 75 percent of grain received by Viterra is delivered to an upcountry site)52
use of Export Select by export traders to deliver bulk grain to Viterra’s ports (because most bulk grain movement from Viterra upcountry sites to Viterra ports uses Export Select)53
loading of bulk wheat onto vessels using Viterra’s port terminal facilities (because these facilities service 100 percent of loading for the supply chain pathway adopted).54
Figure 3.5 Supply chain pathways55
Farm(can include
on farm storage)
Upcountrystorage
Containerpacking
Port storage
Port loading
Shipping
Port loadingof containers
Shipping of containers
Out ofscope
Source: Essential Services Commission.
49 Other grain types share similar processes and practices. 50 We discuss variations where they are material to the investigation of supply chain efficiency. 51 The five year average wheat (bread plus durum wheats) production for South Australia (2012–2017) was 4,954,400 tonnes
over the total of 8,282,300 tonnes for all grain crops, representing 60 percent of total crop production (source: PIRSA, Submission to the Inquiry into the South Australian Bulk Grain Export Supply Chain Costs, May 2017, p. 11).
52 Viterra submitted ‘direct delivery [to port] is provided as a service to nearby growers and represents 25% of total receivals’. 53 Viterra response to request for information, which Viterra has claimed as confidential. 54 That is, all users of Export Select must move grain from an upcountry Viterra site to a Viterra port facility. 55 Shaded area designates services out of the scope of the inquiry.

Public—I2—A2 Inquiry into the South Australian bulk grain export supply chain costs 21
3.3.1 How grain is traded
Grain traders are ‘buyers’ that purchase grain from growers for export or to sell to the domestic market. They arrange transport, logistics and shipping options. Grain trading appears competitive in South Australia, with 11 grain traders having booked shipping slot capacity with Viterra to export the 2016-17 grain harvest. The top three exporters in 2016-17 were Glencore, CHB Ltd (CBH) and ADM Trading Australia Pty Ltd (ADM)56.
Typically, growers that deliver grain to storage/warehouse sites retain ownership for a period. That is, title for the grain remains with the grower until the grain is committed, which (in the case of export grain) is when the grower sells the grain to an export trader. From one estimate, 80–90 percent of delivered grain is initially received as grower warehoused stock, with around 50 percent sold within 30 days and 90 percent sold within three months.57
The grower accepts a market price from a trader for a particular tonnage of grain. The contractual terms between the grower and the trader define the payment terms, and when title changes. Cargo passage by vessel is the trader’s responsibility; from that point, ownership of the grain depends on the contractual arrangements between the trader and shipping company.
As a bulk handler, Viterra does not own the grain that it handles, and it does not pay the grain grower for the grain. When ownership transfers from grower to trader through a ‘Transfer In-store,’ the trader agrees (in most cases) to accept responsibility for payment of all outstanding Viterra fees that the grower incurred to that time.58 The trader pays the grower for the product, netting off fees owing to Viterra and any other applicable fees owed to the trader. They then pay the fees owing to Viterra. The arrangement differs for grain handled by Cargill Australia Ltd (Cargill), however, because it is both a trader and a bulk handler. While Cargill executes some grain exports through Viterra, it also manages its own direct supply chain to export through Inner Harbour – Port Adelaide. Further detail on Cargill’s operations is provided in section 3.3.2.2.
Draft Finding 3.4
The grain trading market in South Australia appears to be competitive, with 11 grain traders having booked shipping slot capacity with Viterra to export the 2016-17 grain harvest.
3.3.2 How bulk grain is stored and handled
Grain storage sites span the state’s growing regions and can handle and store peak harvest volumes. Storage types include concrete cells, steel bins, sheds and bunkers, with site capacity ranging up to 750,000 tonnes. In addition to upcountry sites and ports, an estimated 1 million tonnes of grain storage is managed on-farm.59 Farms’ grain storage capacity (on-farm storage) in South Australia is generally used as short-term storage to manage the logistics of harvest. But some growers have invested in larger scale long-term storage to capitalise on direct grain marketing opportunities (box 3.1).
56 Source: Australian Crop Forecasters. 57 P. Reading, Information requirements for an effective bulk wheat export market: ensuring a ‘level playing field’, May 2012, p. 22,
available at http://www.agriculture.gov.au/Style%20Library/Images/DAFF/__data/assets/pdffile/0011/2157770/information-req-for-an-effective-bulk-wheat-export-market.pdf. AEGIC has assumed that 45 percent of grain delivered to warehouse storage is sold to traders after the first month, 70 percent after the second month and 80 percent after the third month (source: AEGIC, Australian export grains supply chains in 2017, forthcoming, p.41).
58 Viterra, Harvest Information 2017/18, clause 24.2, p. 30, viewed 4 June 2018, available at http://www.viterra.com.au/wp-content/themes/viterra/documents/Harvest%20Information%20Booklet%202017/index.html#4: ‘For most Transfers In-store Viterra acknowledges that the purchaser will agree to accept responsibility for payment of Charges (including freight expenses and costs that have accrued prior to the date of outturn), but which have not been paid. In that event Viterra will invoice the applicable purchaser’.
59 PIRSA, Submission to the Inquiry into the South Australian Bulk Grain Export Supply Chain Costs, May 2017, p. 4.

Public—I2—A2 Inquiry into the South Australian bulk grain export supply chain costs 22
Box 3.1 On-farm storage
On-farm storage can include temporary solutions (such as grain bags) and longer term storage (such as sheds, bunkers and silos). It provides the flexibility for growers to ‘add value’ to grain stocks, by increasing options through blending and segregating, or by allowing the grower to hold stocks to increase marketing options.
On-farm storage also increases efficiency, by allowing growers to store stocks temporarily when transport cannot keep up with the rate of harvest. In this case, the grain can be turned around faster and spends less time in silo queues.
Risks and costs are associated with on-farm storage, however. Longer term storage, for example, can be a significant investment. Also, the grower is responsible for managing the quality of the stored grain, so will need a proactive management plan to control for pests.
A small number of growers submitted to the Commission that South Australian grain growers are building an increasing amount of on-farm storage infrastructure in response to concerns about Viterra’s storage and handling services. But the Commission did not receive evidence of a material increase in on-farm storage in South Australia over the 10 year period of the inquiry.60
The trend to on-farm storage in South Australia has been a lot slower than in the eastern states. Eastern states have significant domestic consumption that has driven growers to invest in on-farm storage, giving them the option to enter the export supply chain.61 By contrast, Eyre Peninsula farmers are very unlikely to participate in the supply chain through on-farm storage, because they have only one option for market (export); they use such storage only to deal with the volume of grain coming off the field during harvest.62
3.3.2.1 Viterra’s operations
Viterra is a bulk handler and operates most of the grain storage capacity in South Australia (operating 94 percent of storage sites).63 Its storage capacity exceeds 10 million tonnes (almost double its average annual receival of 6.3 million tonnes).64
Viterra’s focus on cost effective scale operation has led to the rationalisation of Viterra’s storage sites from 116 (1998), to 114 (2010) and then 103 (2017), noting that 80 percent of the grain was received by around 30 sites in 2016.65 This results in less fragmentation, thereby improving scale effects. Scale and accumulation benefits may also have been enhanced through the use of Viterra’s fee structure, particularly the embedding of its Export Select product (section 4.4.3). While Export Select is optional for Viterra’s customers, it is used by nearly all export customers (that is, traders).
Viterra is not a buyer of grain. Viterra is affiliated with Glencore Agriculture (Glencore), which is a global player in the trading of grain and operates an Australian trading arm.
60 Given total on-farm storage capacity has not significantly changed since 2010, according to ABS and PIRSA. 61 Economic and Finance Committee, Hansard, 27 September 2017, pp. 161–2. 62 Economic and Finance Committee, Hansard, 27 September 2017, p. 162. 63 Based on Viterra’s 103 storage sites in 2017, Cargill’s four sites, and three other export operator sites (AEGIC, Australian
export grains supply chains in 2017, Figure 21, forthcoming). As previously noted, the AEGIC data on which this estimate is based has yet to be finalised. Other commercial operators also hold a small amount of storage capacity. The estimate excludes on-farm storage, because its predominant use in South Australia is to manage harvests rather than compete with Viterra.
64 Viterra, Submission to the Inquiry into the South Australian Bulk Grain Export Supply Chain Costs, May 2017, p. 9. 65 AEGIC, Australian export grains supply chains in 2017, forthcoming, p.40. Note that 2017 was a record harvest year. All
available storage sites would have been utilised to ensure delivery of the harvest. Indeed, Viterra invested in constructing 0.9 million metric tonnes of additional storage to cope with record harvest levels.

Public—I2—A2 Inquiry into the South Australian bulk grain export supply chain costs 23
3.3.2.2 Cargill Australia’s operations
Cargill is a bulk handler and grain trader. It trades and acquires grain, and it operates (through AWB Grainflow, owned by Cargill) grain receival and storage sites at Pinnaroo, Crystal Brook, Maitland and Mallala. Grain from those sites is transported to port and loaded directly from trucks onto vessels at Inner Harbour – Port Adelaide (Berth 29). Cargill represents fringe competition for Viterra, handling 420,000 tonnes (around 5 percent) of the 2016-17 grain harvest.66 Because it does not have storage facilities at port, it provides only a ‘just in time’ service.67 Cargill uses Viterra’s facilities for any exports not associated with Berth 29.
3.3.2.3 Other bulk handlers
Other bulk handlers operating in South Australia include:
Kangaroo Island Pure Grain (grain receival and storage site at Kingscote)
San Remo (grain receival sites at Balaklava and Kulpara)
Pilgrim Grain Storage (grain receival and storage site at Bordertown)
Tremlett Grain and Fertiliser (grain receival and storage site at Shea Oak Log)
AGT Food Australia (grain receival, processing and packing site at Bowmans)
Australian Grain Exports (grain receival, storage, cleaning and processing facility at Dublin)
Semaphore Container Services (Semaphore) (grain receival, packing and bulk export site at Osborne).
These bulk handlers are relatively small in scale. Many serve the domestic market and some provide container exports.
Draft Finding 3.5
Viterra has a high market share of bulk grain storage in South Australia, operating 94 percent of commercial grain storage sites in South Australia. Total on-farm storage capacity appears to have been static over the 10 year period considered, and it is relatively small in South Australia.
3.3.3 How bulk grain is transported
The freight transport-to-port sector is a competitive market, with a choice of road or rail transport in many cases.
Genesee and Wyoming Australia Pty Ltd (GWA) is the main supplier of intrastate freight rail services in South Australia, and the primary provider of rail haulage of the state’s export grain. It operates the rail transportation services that Viterra uses to transport grain across the Eyre Peninsula (from Kimba and Wudinna into Port Lincoln). Viterra submitted that the Eyre Peninsula rail service provides important capacity and is used effectively.68 Grain is the only commodity moved on the Eyre Peninsula lines, which are restricted in weight and speed due to their age and condition.
GWA also operates bulk grain services for Viterra on the Australian Rail Track Corporation (ARTC) owned interstate rail network. Viterra uses the ARTC lines to move grain into
66 Market share data derived from data supplied to the ACCC by Australian Crop Forecasters. The ACCC provided the
Commission with a licence to use the data for this inquiry. 67 A ‘just in time’ service delivers grain just in time to load onto the export vessel. In other words, the grain is not stored at port. 68 Viterra, Submission to the Inquiry into the South Australian Bulk Grain Export Supply Chain Costs, May 2017, p. 22.

Public—I2—A2 Inquiry into the South Australian bulk grain export supply chain costs 24
Inner Harbour – Port Adelaide, and Outer Harbor – Port Adelaide. The ARTC network has multiple users, and the trains can travel at higher speeds and carry greater weight than the intrastate lines.
Road transport in South Australia is very competitive with rail, given the relatively short distances between farm and port (Figure 3.6). Its cost to port is generally competitive with rail transport costs for distances of up to 200 kilometres.69 Distances from upcountry grain sites to port by road are generally shortest in South Australia (averaging about 144 kilometres) and longest in New South Wales (averaging about 418 kilometres).70 The short haul length—combined with volatile grain production and the absence of other users of the rail services—means the use of intrastate rail services is generally low. This low use has contributed to the cessation of some grain railway services (for example, rail services in the Murray–Mallee region).71
Figure 3.6 Road distance from upcountry receival site to closet export port, by state72
Source: AEGIC.
Draft Finding 3.6
GWA is the primary provider of freight rail services for bulk grain in South Australia, although the relatively short distances to port means road transport successfully competes with rail.
3.3.4 Grain throughput at port
With six ports handling grain exports,73 South Australia has more grain shipping terminals than have the other states. CBH in Western Australia, for example, uses four ports with an annual terminal capacity of 16 million metric tonnes, compared with Viterra’s 7 million metric tonne terminal capacity (across the six port terminals).74 Figure 3.7 compares average exports per port for Australian grain ports. This shows that aside from Port Adelaide and Port Lincoln, South Australian grain ports have relatively low throughput which would be expected to place pressure on costs. The relatively high 69 DAWR, Wheat Port Code Review, interim report, p. 10. 70 AEGIC, Australian export grains supply chains in 2017, forthcoming, p. 21. 71 Essential Services Commission, South Australian Rail Access Regime Review, final report, August 2015, p. 22. 72 AEGIC, Australian export grains supply chains in 2017, forthcoming, Figure 7. Mean distance is indicated by X; median distance
is indicated by horizontal line. The box indicates distances for 50 percent of all values bounded by the first and third quartiles. The upper and lower bars indicate the full range of distances.
73 Grain export port terminals are located at Flinders Ports owned sites (deep sea ports at Port Lincoln, Port Giles and Outer Harbor – Port Adelaide; shallow ports at Thevenard, Wallaroo and Inner Harbour – Port Adelaide).
74 AEGIC, Australian export grains supply chains in 2017, forthcoming, Figure 21.

Public—I2—A2 Inquiry into the South Australian bulk grain export supply chain costs 25
number of ports in South Australia is partly due to the grain growing regions being located along the coast, and the two geographic markets being separated by the Spencer Gulf.
Figure 3.7 Average grain throughput, by port, average over 2008-09 to 2016-1775
Source: AEGIC (Ports Australia)
Within South Australia, Viterra is the main provider of port bulk grain loading services. Before the 2015-16 grain season, Viterra’s market share of port terminal throughput was 100 percent, dropping to 96 percent (2015-16) and then 91 percent (2016-17) with the introduction of competition at Inner Harbour – Port Adelaide (Figure 3.8).76
Near-monopoly suppliers provide access to appropriate shipping berths, and loading and unloading facilities, and the related fees: Flinders Ports for shipping berths and associated services; and Viterra for bulk grain loading facilities. The ports can load various size vessels depending on exporters’ needs: deep seas ports can load vessels of sizes up to and including Panamax vessels (70,000 tonnes, up to 300 metres in length), while some smaller ports are constrained to smaller vessel sizes (for example, Thevenard is limited to vessels less than 180 metres in length). The ports’ loading rates range from 800 to 3000 tonnes per hour, with some ports able to offer 24 hour loading operations to ensure vessels are loaded as quickly as possible.77
The South Australian market for port bulk loading services has little excess capacity. Figure 3.9 shows estimated port capacity use for the peak period (February to May 2017) of the record 2016-17 harvest, by port and port operator. At all ports except Thevenard and Berth 29, exports exceeded estimated capacity.78 Figure 3.10 shows peak period port terminal use for 2015-16, when there was little excess capacity even for an average season.
75 AEGIC, Australian export grains supply chains in 2017, forthcoming, Figure 19. The figure shows the total mass of grain
exported from Australian ports, averaged from 2008-09 to 2016-17. Where multiple service providers operate at a port, figures indicate total mass of grain exported by all service providers.
76 That is, Cargill commenced operations in 2015-16, using loading facilities operated by Patrick and then LINX. Semaphore Container Services, which now also handles bulk grain exports, commenced during the 2016-17 harvest.
77 Viterra, Submission to the Inquiry into the South Australian Bulk Grain Export Supply Chain Costs, May 2017, p. 11. 78 The additional capacity to deal with the record harvest came from Viterra and Semaphore introducing operational
efficiencies at port and across relevant supply chains, extending operating hours, and employing additional staff (ACCC,
0.0
1.0
2.0
3.0
4.0
5.0
6.0
Gra
in e
xpo
rts
(mill
ion
to
nn
es)

Public—I2—A2 Inquiry into the South Australian bulk grain export supply chain costs 26
Figure 3.8 Market share of South Australian bulk grain loading port service providers79
Source: Australian Crop Forecasters.
Figure 3.9 Peak period port terminal capacity use, South Australia, 2016-1780
Source: ACCC.
Bulk wheat ports monitoring report 2016-17, December 2017, p. 42, available at https://www.accc.gov.au/publications/serial-publications/bulk-wheat-ports-monitoring-reports/bulk-wheat-ports-monitoring-report-2016-17).
79 Market share data derived from data supplied to the ACCC by Australian Crop Forecasters. The ACCC provided the Commission with a licence to use the data for this inquiry. It should be noted that Cargill/LINX has data for 2015-16 and 2016-17 and Semaphore has data for 2016-17 only; it is possible both shipped minor amounts of grain in earlier years.
80 ACCC, Bulk wheat ports monitoring report 2016-17, Figure 18, p. 41.
0%
10%
20%
30%
40%
50%
60%
70%
80%
90%
100%
2011-12 2012-13 2013-14 2014-15 2015-16 2016-17
Perc
ent
Viterra Cargill/LINX Semaphore
0.0
0.2
0.4
0.6
0.8
1.0
1.2
ViterraPort Adelaide
ViterraPort Giles
ViterraPort Lincoln
ViterraThevenard
ViterraWallaroo
LINXPort Adelaide
SemaphorePort Adelaide
Tonn
es (m
illio
ns)
2016-17 peak exports (all grains) Capacity

Public—I2—A2 Inquiry into the South Australian bulk grain export supply chain costs 27
Figure 3.10 Peak period port terminal capacity use, South Australia, 2015-1681
Source: ACCC – with Commission reformatting to match Figure 3.9.
In addition to tight capacity levels, long-term capacity agreements are in place. In 2008, port terminal capacity in South Australia was allocated on a ‘first in, first served’ basis. Then, in 2012, Viterra introduced an auction system, which allocated residual capacity on the ‘first in, first served’ basis. Following stakeholder concerns with the auction system, the ACCC approved the introduction of long term agreement capacity allocation, along with a system to allocate short term capacity.82 This system came into effect from the 2016-17 grain season.
Against this background, Viterra’s port operations are subject to regulation at both the federal and state level.83
Draft Finding 3.7
Viterra has a high market share of supply chain port bulk grain loading services, with 91 percent of market share throughput in 2016-17.
3.3.5 Other services in the supply chain
Apart from the services offered in each of the logistical segments, a number of ancillary services cut across market segments. Quality management, for example, is an important service relevant to all market segments. It is carried out to meet regulatory obligations and the importing countries’ requirements. Quality management starts at receival, where all grain is tested to meet specifications for
81 ACCC, Bulk wheat ports monitoring report 2015-16, December 2016, Figure 17, p. 38, available at
https://www.accc.gov.au/system/files/RAWP%20-%20Bulk%20wheat%20ports%20monitoring%20report%202015-16%20%5Bv2%5D.pdf.
82 The ACCC approval was provided under the Port Terminal Access (Bulk Wheat) Code of Conduct. This mandatory Code is prescribed under the Competition and Consumer Act 2010 (https://www.accc.gov.au/business/industry-codes/wheat-port-code-of-conduct). How much long term capacity can be allocated to an individual exporter at each port within a quarter is capped (ACCC, Bulk wheat ports monitoring report 2016-17, p. 56).
83 At the federal level, the Port Terminal Access (Bulk Wheat) Code of Conduct regulates access to port terminal capacity. At the state level, the Commission has a role under the Maritime Services (Access) Act 2000.
0.0
0.1
0.2
0.3
0.4
0.5
0.6
0.7
0.8
0.9
1.0
ViterraPort Adelaide
ViterraPort Giles
ViterraPort Lincoln
Viterra Thevenard ViterraWallaroo
LINXPort Adelaide
Tonn
es (m
illio
ns)
2015-16 peak exports (all grains) Capacity

Public—I2—A2 Inquiry into the South Australian bulk grain export supply chain costs 28
quality. For this reason, bulk handlers undertake processes such as fumigation, to minimise or remove the impacts of moisture, insects and pests.
The port terminals must be registered and certified by the Department of Agriculture and Water Resources (DAWR). Grain samples are taken continuously on vessel loading:
Officers authorised by the DAWR ensure the grain meets the relevant importing country’s phytosanitary requirements.
The bulk handler conducts further analysis to ensure each parcel of grain meets the customer’s contract quality specifications.
The customer may also appoint an independent, internationally accredited surveyor.
Segregation and blending are also key quality management services of the supply chain. Grain is segregated by type, grade and specification. To meet quality specifications required by end users, grades of grains are blended homogenously, ‘averaging’ the specifications across a cargo. This practice can create a market for lower grades if they can be blended at rates that maintain the required quality specifications.
3.4 Conclusion
South Australia exports much of its grain production into the global bulk grain export market, where it is a small player with a less than 1 percent (by value) market share (section 3.1). But Australian grain exports benefit from being high quality, sustainable and clean. Another advantage is that our grain production is counter-cyclical to the northern hemisphere, providing a brief window of opportunity to maximise export returns. However, the industry must pursue efficiency in supply chain costs to maintain its global competitiveness (section 3.1).
South Australian grain harvests are highly variable, ranging from 4.9 million tonnes (2007-08) to 11.1 million tonnes (2016-17). So, responding to harvest variability is an important aspect of the supply chain. Participants need to be able to manage costs in poor harvest years, while still having the capacity and capability to manage large harvests. In other words, high returns in good years may be necessary to offset poor returns from bad harvest years to achieve a reasonable return on average (section 3.2).
The South Australian bulk grain export supply chain can be split logistically and transactionally. Logistically, it has three main segments: upcountry handling and storage, freight transport to port, and port services (including export bulk loading facilities) (Table 3.1). From a transactional perspective, the grain trading market in South Australia appears to be competitive, with 11 grain traders having booked shipping slot capacity with Viterra to export the 2016-17 grain harvest (section 3.3.1).
Viterra has a high market share of service provision in key segments of South Australia’s supply chain. In 2016-17, it operated 94 percent of commercial grain storage sites (section 3.3.2.1) and was the main provider of port bulk grain loading services, with 91 percent of market share throughput (section 3.3.4).
GWA is the primary provider of freight rail services for bulk grain in South Australia, although the relatively short distances to port mean road transport successfully competes with rail (section 3.3.3).

Public—I2—A2 Inquiry into the South Australian bulk grain export supply chain costs 29
Chapter summary
To assess the efficiency of the grain export supply chain, the Essential Services Commission (the Commission) investigated whether anything is inhibiting a competitive outcome. It focused largely on the performance and behaviour of Viterra Pty Ltd (Viterra), given the market for freight and port services is either competitive or subject to suitable regulatory oversight.
While opportunities to improve the efficiency of the supply chain will always exist, the Commission’s draft finding is that the supply chain is not demonstrably inefficient:
in terms of the supply chain costs that the Commission investigated
from both an overall and individual supply chain segment perspective
based on available facts and evidence at this time.
The draft finding reflects the following conclusions:
While Viterra faces some competition (actual and potential), the extent to which that competition places effective and credible discipline on Viterra’s behaviour is not clear. Compared with local competition, the global market may place more effective discipline on Viterra’s behaviour.
The Commission found no conclusive evidence of Viterra exercising market power.
Viterra seeks to provide good customer service and, in recent years, proved highly capable of reducing the operating costs for the main grain export supply chain. But it does not appear to be passing on these efficiencies to growers through lower fees.
While Viterra’s operational performance is producing good financial returns, the Commission did not assess these returns as exceeding a reasonable return for a firm with Viterra’s risk profile. Having four good seasons in a row, as Viterra recently experienced, is unusual.
The level and trend in Viterra’s fees are consistent with financial analysis showing Viterra is choosing not to share efficiencies with industry through lower fees. However, Viterra’s fees are not considered excessive at this time, compared with the total fee levels charged by its eastern Australian counterparts.
This inquiry represents a snapshot. It is a little over five years since Viterra’s acquisition, which renewed the firm’s focus on achieving efficiencies. If Viterra continues to run an efficient operation and earns only a reasonable rate of return in the mid to long term, then the supply chain can continue to be considered efficient. But, if Viterra continues its trend of increasing operating surpluses, it may start to earn returns in excess of a reasonable level. In this situation, the competitiveness of the supply chain would become questionable if Viterra did not share its continuing efficiencies with industry through lower fees.
In relation to pricing behaviour, the Commission found possible evidence that Viterra’s pricing (specifically, the Receival at Port Service Fee (from Approved Third Party Storage)) serves as a barrier to new competition or expansion by existing competitors. But, as noted in section 2.2, there can be operational justifications for practices that may raise concerns about the exercise of market power. In any event, given Viterra is earning reasonable financial returns, the fee in isolation does not provide conclusive evidence that Viterra is exercising market power.
There is some evidence that growers, traders and potential competitors are not sufficiently informed.

Public—I2—A2 Inquiry into the South Australian bulk grain export supply chain costs 30
4.1 Segments of the supply chain
The Commission assessed the efficiency of the supply chain by investigating whether anything is inhibiting a competitive outcome within each segment of the supply chain.84 It undertook its investigation by first examining the market structure, to consider a firm’s ability to possess market power (section 2.2.2). Then, by examining the behaviour of the firm, the Commission considered whether it may be exercising such power in a sustained manner (section 2.2.3).
The supply chain can be split logistically into three main segments: upcountry handling and storage, freight transport to port, and port services (including export bulk loading facilities) (section 3.3). In turn, its structure is largely defined by three firms that each have high market share in providing services across one or more key segments: Viterra, Flinders Ports, and Genesee and Wyoming Australian Pty Ltd (GWA) (section 3.3). Each of these firms can be considered a near-monopoly supplier. Their high market share results from the large amount of fixed infrastructure that they operate: the high level of fixed costs associated with major infrastructure may make it difficult for a competitor to achieve costs as low, for the same service. In contrast, the road freight industry is highly competitive (so considered efficient in the provision of services) because minimal market entry barriers allow a large number of participants (section 4.2.2).
Each of these three firms (Viterra, Flinders Ports and GWA) has the potential to exercise market power. The fact that there are near-monopolies operating in the supply chain is not a problem for growers and traders per se. Growers and traders need only be concerned by the behaviour of these firms – whether market power is exercised persistently in any segment of the supply chain, to the detriment of growers and traders.
4.2 Segments of the supply chain that warrant review
The Commission previously assessed rail services provided by GWA, the general port services provided by Flinders Ports, and Viterra’s bulk loading facilities at port, in separate industry-specific reviews. The Commission’s findings are discussed in sections 4.2.1 (for rail) and 4.2.3 (for ports), including any matters raised during this inquiry that are relevant to these services.
4.2.1 Rail freight services
The South Australian rail access regime (rail access regime) is established under the Railways (Operations and Access) Act 1997 (ROA Act). The Commission did not find, and was not presented with, any new evidence to change the recommendations made in its 2015 Rail Access Regime Review. That is, there is no new evidence that market power is being (or has been) exercised in the rail services provided by GWA. Box 4.1 summarises the rail access regime and the results of the Commission’s most recent review.
84 It is the exercise of market power by a firm that leads to a non-competitive (and inefficient) outcome, not whether a firm has
the ability to exercise market power.

Public—I2—A2 Inquiry into the South Australian bulk grain export supply chain costs 31
Box 4.1 Rail access regime
A negotiate–arbitrate access regime exists for certain South Australian railway infrastructure services (below-rail services), established under the Railways (Operations and Access) Act 1997 (ROA Act).85 This rail access regime covers the infrastructure owned by GWA, covering lines in the Murray–Mallee region (services currently suspended), the Mid-North region (services no longer operating) and the Eyre Peninsula. In addition, GWA operates some bulk grain services for Viterra on eastern South Australia (the portion of the South Australian land mass east of Spencer Gulf), using Australian Rail Track Corporation (ARTC) owned mainlines.
The Commission conducted its last review of the rail access regime in 2015. The evidence before the Commission did not support a finding that market power had been exercised. Specifically, the Commission found, while the service operators could exercise market power, factors may offset that potential exercise. These factors include:86
the railway users being generally large firms, which can devote significant resources to negotiating access (including price)
there being few users of the South Australian intrastate rail infrastructure services, so railway use is relatively low. In this environment, railway operators have a strong incentive to increase railway use to recover fixed costs.
The Commission’s final recommendation to the Minister for Transport and Infrastructure was that the rail access regime should continue for a further five years, which the Minister accepted. This regime is now in place until 31 October 2020.87
Rail transport of grain in South Australia has some natural disadvantages due to the proximity of grain growing regions to ports. As noted in chapter 3, road transport is very competitive with rail for the three quarters of South Australian upcountry receival sites that are within 200 kilometres of an export port (section 3.3.3).
In its submission to the inquiry, Grain Producers South Australia (GPSA) raised concern about the operation of the rail access regime, stating ‘A declining amount of SA’s grain is transported by rail each season’ and ‘Reasonable maintenance levels and longevity of rail lines are in jeopardy’.88 Similar submissions were made to the Economic and Finance Committee’s primary producers’ inquiry,89 suggesting a deteriorating rail infrastructure is likely to lead to more grain transported by road, with adverse impacts on the community. That is, while the movement of grain onto road trains in the Mid-North and Mallee regions was considered appropriate, the higher road maintenance costs will have a cost impact.90 It was also submitted to the Economic and Finance Committee that the Eyre Peninsula rail infrastructure is depreciating to a point at which it will be more economic to remove the rail tracks, whereas the infrastructure has been maintained in Western Australia.91
85 Access regime established under the ROA Act. 86 Essential Services Commission, South Australian Rail Access Regime Review, final report, August 2015, p. 26, available at
http://www.escosa.sa.gov.au/ArticleDocuments/358/20150907-SARailAccessRegimeReview-FinalReport.pdf.aspx?Embed=Y.
87 South Australian Government Gazette, 29 September 2016, p. 3921, available at http://governmentgazette.sa.gov.au/sites/default/files/public/documents/gazette/2016/September/2016_058.pdf.
88 GPSA, Submission to the Inquiry into the South Australian Bulk Grain Export Supply Chain Costs, 11 May 2017, p. 8. 89 Economic and Finance Committee, Inquiry into Issues faced by Primary Producers, final report, 2017, Submissions. 90 Economic and Finance Committee, Inquiry into Issues faced by Primary Producers, final report , pp. 130–3. 91 Economic and Finance Committee, Hansard, 27 September 2017, p. 166, paras 282–3.

Public—I2—A2 Inquiry into the South Australian bulk grain export supply chain costs 32
In relation to the declining condition of rail infrastructure, the Commission noted that GWA is working with the Department of Planning, Transport and Infrastructure (DPTI) on an infrastructure review for the Eyre Peninsula. That review will consider the investment required to keep the region’s rail lines sustainable. The Commission does not intend to duplicate that assessment as part of this inquiry.
In its submission to the Inquiry, GPSA raised a concern that:92
Based on publicly available information it is not possible to prove road and rail cost components of the bulk grain export supply chain as cost inefficient or cost efficient.
The South Australian Freight Council (SAFC) submitted that rail’s share of the bulk grain freight task fell over the past 10 years (the period covered by the inquiry) due to deteriorating track conditions. It submitted that the inquiry should look for options to increase rail’s share.93 But Viterra’s submission noted its rail mode share has not declined.94 From an overall state perspective, however, some decline might have occurred from Cargill Australia Ltd and Semaphore Container Services (Semaphore) hauling grain solely by road. While Cargill and Semaphore have the option to contract rail, their relatively small grain volumes indicate road is the most likely economic option. This scenario is a potential example of a trade-off between a favourable development from competition (encouraging Viterra to operate more efficiently), but at the expense of lower volumes going to rail.
4.2.2 Road freight services
Little industry specific regulation covers road freight transport, and what exists is generally limited to road safety and route restrictions for over-mass vehicles. In addition, the road freight industry benefits from large numbers of participants, with minimal market entry barriers.95 Accordingly, the Commission accepts the road freight industry is competitive, and no further investigation is warranted for this Inquiry.
4.2.3 Port services
Two industry-specific regulatory regimes cover the export of bulk grain through South Australian sea ports, as summarised in sections 4.2.3.1 and 4.2.3.2.
4.2.3.1 Ports access and pricing regulatory regime
General port services and specialist grain loading equipment (port terminals) are covered by a ports access and pricing regime (port access regime) established by the Maritime Services (Access) Act 2000 (MSA Act) and administered by the Commission. Box 4.2 outlines this regime and the results of the Commission’s 2017 ports access and pricing review.
92 GPSA, Submission to the Inquiry into the South Australian Bulk Grain Export Supply Chain Costs, 11 May 2017, p. 9. 93 SAFC, Submission to the Inquiry into the South Australian Bulk Grain Export Supply Chain Costs, 12 May 2017, p. 2. 94 Averaging 50 percent over 10 years (inquiry timeline) and 52 percent for the most recent four years, across Viterra’s
operation. Source: Viterra, Response to public submissions, June 2017, unpublished and claimed as confidential. 95 Bureau of Infrastructure, Transport and Regional Economics, Road and rail freight: competitors or complements?, Information
sheet 34, 2009, p. 9, viewed 4 June 2018, available at https://bitre.gov.au/publications/2009/files/is_034.pdf; Bureau of Transport and Regional Economics, An overview of the Australian road freight transport industry, Working Paper 60, 2003, p. 5, available at https://bitre.gov.au/publications/2003/files/wp_060.pdf.

Public—I2—A2 Inquiry into the South Australian bulk grain export supply chain costs 33
Box 4.2 Ports access and pricing regimes
Two port services are relevant to the grain export supply chain, and they are covered by the South Australian access regime (port access regime) established by the Maritime Services (Access) Act 2000 (MSA Act):
access to shipping berths and associated services to bring a vessel to port (Flinders Ports)
access to specialist loading equipment to load grain onto the vessel (Viterra).
The MSA Act also provides the Commission with a price regulation function for certain prescribed fees charged by Flinders Ports (but not for Viterra’s bulk loading facilities). The Commission noted no customer raised the absence of regulatory price oversight of Viterra’s bulk grain loading operations as an issue (either under the port access regime or for this inquiry to date).
The Commission conducted its most recent review of the port access regime for proclaimed South Australian ports in 2017. It concluded ‘although there is the potential for market power to be exercised by port operators [Viterra and Flinders Ports], there is no evidence to suggest that port operators are exercising such market power’.96 It recommended the port access regime and the price regulation of Flinders Ports (which consists of annual price monitoring) continue for a further five years, to October 2022.97 The Minister accepted the recommendation, and the regime’s continuation was gazetted in October 2017.
The Commission considers the port services provided by Flinders Ports and the bulk loading services provided by Viterra are efficient, given it did not find, and was not presented with, any new evidence that the two firms have exercised market power since the 2017 review. The efficiency of Viterra’s grain receival and accumulation at port services is an exception: the Commission did not examine these services in the 2017 review, so investigated them as part of this inquiry (section 4.4).
4.2.3.2 Port Terminal Access Code
The Port Terminal Access Code (PTAC) is an Australia-wide mandatory industry code of conduct made under the Competition and Consumer Act 2010 (Cth) and administered by the Australian Competition and Consumer Commission (ACCC). Its purpose is to ensure exporters of bulk grain have fair and transparent access to bulk loading facilities (port terminal services).98 Box 4.3 outlines the key elements of the PTAC.
Since the PTAC commenced in 2014, a capacity auction system has been replaced with an allocation system providing for short- and long-term allocations of port terminal capacity (to provide access by traders to the bulk loaders to move the grain onto vessels). The new system emphasises long-term allocations through long-term agreements with traders. All sections of industry appear to generally support the move away from the auction system.99 However, one export trader submitted that the reduced operational flexibility imposed by the PTAC can make it difficult for the trader to have a good commercial relationship with Viterra.100 Nevertheless, no trader has yet raised a formal dispute over an allocation.101
96 Essential Services Commission, 2017 Ports Access and Pricing Review, final report, p. 2. 97 South Australian Government Gazette, 17 October 2017, p. 4326, available at
http://governmentgazette.sa.gov.au/sites/default/files/public/documents/gazette/2017/October/2017_072.pdf. 98 DAWR, Wheat Port Code Review, interim report, p. 5. 99 ACCC, Bulk wheat ports monitoring report 2016-17, 2017, p.56. AEGIC, Australian export grains supply chains in 2017,
forthcoming, p. 37. 100 Source: Commission staff discussion with a major trader, August 2017. 101 ACCC, Bulk wheat ports monitoring report 2016-17, 2017, p.16.

Public—I2—A2 Inquiry into the South Australian bulk grain export supply chain costs 34
Viterra also raised with the Commission some concerns about the PTAC. It submitted that the PTAC’s ‘disproportionate’ focus on South Australia places the state’s grain industry at a competitive disadvantage, because the PTAC affects the industry’s ability to meet export traders’ demands and increases industry costs.102 Viterra submitted that it could easily allocate more capacity through long-term agreements,103 but the PTAC requires Viterra to make available at least 500,000 tonnes of capacity per quarter as short-term allocations.
The Department of Agriculture and Water Resources (DAWR) is reviewing the PTAC. It released an interim report in April 2018 that found:
no strong evidence or arguments to justify substantive amendment to the PTAC
minor amendments that it may recommend, drawing on stakeholder experiences since the PTAC commenced three years ago
no clear justification for extending the PTAC to cover upcountry grain services and/or require enhanced grain stocks reporting (as advocated by the ACCC). To understand how extending the code’s operation upcountry would be a suitable response, the DAWR noted it needs evidence of deficiencies in the protections offered by general competition law, or the absence of commercial or industry solutions
PTAC should be reviewed again in 2020 to ensure it remains fit for purpose.
The DAWR intends to present its final report to the Australian Government in August 2018.104 The Commission proposes, therefore, to leave the DAWR review to investigate the merits of changing the PTAC’s operation.105
Viterra has not sought exemption for any of its ports, and neither has GrainCorp in the case of Mackay and Gladstone (which are the sole bulk grain terminals in those locations).106 In the case of Portland, no directly competing port terminal facility provides a significant competitive constraint.107
102 Viterra, Submission to the Inquiry into the South Australian Bulk Grain Export Supply Chain Costs, May 2017, p. 23. As noted
above, all Viterra’s grain export terminals are non-exempt from the full provisions of the Code. 103 Sourced from Viterra’s response to request for information. 104 Review of the Wheat Port Code webpage, viewed 7 June 2018, available at https://haveyoursay.agriculture.gov.au/review-of-
the-wheat-port-code 105 Submissions in response to the DAWR interim report are due by Monday, 25 June 2018. Source: Review of the Wheat Port
Code webpage, viewed 7 June 2018. 106 ACCC, Bulk wheat ports monitoring report 2016-17, p.30. 107 ACCC, Exemptions in respect of: Emerald’s Melbourne Port terminal facility; GrainCorp’s Geelong Port terminal facility; and
GrainCorp’s Portland Port terminal facility, final determinations, 25 June 2015, p. i, available at https://www.accc.gov.au/system/files/ACCC%20Final%20Determinations%20-%20Victorian%20wheat%20ports%20exemption%20assessments%20-%2025%20June%202015_0.pdf .

Public—I2—A2 Inquiry into the South Australian bulk grain export supply chain costs 35
Box 4.3 Port Terminal Access Code108
In addition to the ports access regime established under the MSA Act (South Australia), the Port Terminal Access (Bulk Wheat) Code of Conduct (PTAC) also covers Viterra’s port bulk loading facilities. The PTAC, which commenced in 2014, is a mandatory industry code of conduct made under the Competition and Consumer Act 2010 (Cth) and is administered by the ACCC.
The code’s purpose is to ensure exporters of bulk grain109 have fair and transparent access to port terminal services. Its key additional protections largely relate to ensuring port terminal capacity is allocated efficiently and fairly, from both long- and short-term perspectives.
If appropriate, the ACCC may reduce regulation at a port terminal, by exempting the relevant port terminal service provider from certain provisions of the PTAC. All of Viterra’s South Australian port facilities are non-exempt, and the only other non-exempt Australian grain ports are Mackay, Gladstone and Portland.110
Non-exempt operators must:
allocate available port terminal capacity through a mechanism that applies equally to all exporters (the capacity allocation system approved by the ACCC)
have an access agreement in place when providing services
publish certain information on their websites, such as the amount of capacity available on a weekly and annual basis, performance indicators, and grain stocks at each port terminal
undertake a process for amending port loading protocols, including the requirement to consult
comply with dispute resolution processes (including mediation and arbitration).
The PTAC does not provide the ACCC with a role in price setting or price negotiations for access to bulk wheat loading facilities. Rather, it assumes commercial negotiation will achieve a commercially advantageous result for both parties.111 This approach is similarly adopted under the South Australian ports access regime (for bulk handling facilities).
In addition to its regulatory protections, the PTAC operates within the context of the broader competition regime administered by the ACCC. Recent amendments to the Competition and Consumer Act 2010 have strengthened the misuse of market power prohibition provisions available under general competition law, although such changes are still to be fully tested.
108 Based on content from DAWR, Wheat Port Code Review, interim report; and ACCC, ACCC role in wheat export, viewed
4 June 2018, available at https://www.accc.gov.au/business/industry-codes/wheat-port-code-of-conduct. 109 While PTAC was established to cover bulk wheat, it involves the allocation of capacity for all grains. As the ACCC noted,
PTAC ‘plays an important role in promoting port access for the exporters that buy bulk wheat and other grains from Australian growers’ (source: ACCC, Bulk wheat ports monitoring report 2016-17, p. 5).
110 On 11 October 2017, the ACCC released a final determination granting exempt service provider status to LINX Cargo Care Group at its Berth 29, Port Adelaide facility, having previously exempted Patrick for its operations at Berth 29 (available at https://www.accc.gov.au/regulated-infrastructure/wheat-export/wheat-export-projects/linx-port-adelaide-exemption ). On 28 July 2017, the ACCC released a final determination granting exempt service provider status to Semaphore, at its port terminal facility at Osborne Berth 1, Inner Harbour – Port Adelaide (available at https://www.accc.gov.au/regulated-infrastructure/wheat-export/wheat-export-projects/semaphore-port-adelaide-wheat-port-exemption-assessment).
111 ACCC, Viterra application seeking capacity allocation system approval, final decision, 3 December 2015, p. 29, available at https://www.accc.gov.au/system/files/ACCC%20final%20decision%20on%20Viterra%27s%20application%20to%20vary%20its%20capacity%20allocation%20system%20-%203%20December%202015_0.pdf.

Public—I2—A2 Inquiry into the South Australian bulk grain export supply chain costs 36
4.2.4 Grain handling, storage and grain outturn to vessel services
Viterra’s upcountry storage and handling facilities are not covered by any industry-specific regulation. While Viterra’s vessel loading facilities are covered by an access regime, no industry-specific regulation covers Viterra’s integrated supply chain services. With Viterra operating 94 percent of storage capacity (section 3.3.2.1) and just over 90 percent of exports in 2016-17, the market for grain handling, storage and grain outturn to vessel services is highly concentrated. Given Viterra has high market shares across key elements of the supply chain, the Commission investigated whether Viterra is exercising market power and, if so, whether that behaviour is detrimental to grain export supply chain efficiency. Sections 4.3 and 4.4 report the results of this investigation, and section 4.5 presents an overall conclusion.
Based on the inquiry method for assessing the efficiency of the supply chain (section 2.2) and the evidence necessary to make this assessment (Table 2.1), the Commission developed a detailed set of questions (Table B.1, Appendix B) to examine Viterra’s market power. In practice, more than one interpretation is likely for a firm’s specific action or behaviour, as reflected in the positive and negative interpretation of each question. Table B.2 summarises the evidence obtained from the questions.
Draft Finding 4.1
Supply chain freight and port services fees are being set on a competitive basis, as a result of the relevant markets being either competitive or subject to sufficient regulatory oversight. A possible exception are the fees for port receival and outturn from storage services. In addition, Viterra’s upcountry storage and handling facilities are not covered by any industry-specific regulation. Consequently, it is important that the performance and behaviour of Viterra be assessed by the Commission, given its position of strength within the supply chain (upcountry storage and handling services, and port handling and loading services).
4.3 Market structure for services that Viterra provides
Viterra has a high market share in both grain storage and port terminal operations respectively (sections 3.3.2 and 3.3.4). Consistent with the inquiry method (section 2.2), the Commission investigated the extent to which these services offered by Viterra face competition that would constrain the firm’s ability to exercise market power (sections 4.3.3–4.3.5).
4.3.1 Global context in which Viterra operates
In investigating the degree of market power that Viterra may exercise, it is useful to consider the global context in which the firm operates (particularly given the Commission is investigating the supply chain for the movement of bulk grain for export). As discussed in section 3.1, the global bulk grain export market is highly competitive, and South Australia’s share is less than 1 percent (by value). The market is characterised by a small number of global traders (which includes Viterra’s affiliated company, Glencore Agriculture)112 operating across many countries.
The South Australian bulk grain industry is a price taker113 within the global market. Globally, Viterra faces pressure to be efficient in outturning bulk wheat to vessels, and to keep fees as low as possible, while maintaining the quality at required specification. To do so, Viterra should focus on the efficiency of its whole supply chain, from receiving bulk grain upcountry to transporting it to port and then loading it onto vessels. Otherwise, Viterra risks losing business to interstate and overseas competitors.
112 For more detail on Glencore Agriculture, see its website http://www.glencoreagriculture.com/. 113 Price taking is when the seller has no ability to affect the market price through their own actions, so has to accept the
prevailing prices in the market.

Public—I2—A2 Inquiry into the South Australian bulk grain export supply chain costs 37
4.3.2 Defining the market
For this inquiry, the (local) market for supply chain services is defined as the area bounded by the South Australian borders. Within that area, two separate geographic markets may be defined: the Eyre Peninsula and eastern South Australia (remainder of the South Australian land mass). Factors such as the geographic separation by the Spencer Gulf, the location of grain producing areas, the isolated Eyre Peninsula rail network, and the distance from the Eyre Peninsula to domestic markets means the potential for substitution between these two geographic areas is low. For practical purposes, therefore, they can be considered separate markets.114
While this inquiry focuses on assessing market behaviour within the Eyre Peninsula and eastern South Australia, the global context may be important in explaining market behaviour at the local level (section 4.3.1). If Viterra could be considered to be operating efficiently, despite a lack of credible and constraining entry by new local operators (or the expansion of existing competitors), then the competitive pressures exerted on Viterra by the global bulk grains market may be driving this efficiency.
4.3.3 Direct localised competition from other operators
In 2011, Cargill entered the South Australian bulk grain export market (with the purchase of AWB Grainflow). Cargill has exported wheat from Berth 29 at Port Adelaide since 2015-16.115 Viterra also competes with Semaphore, which exports bulk grain through Osborne Berth 1 at Port Adelaide.116 Based on the ACCC Australian Crop Forecasters’ data, Cargill and Semaphore had a combined 21 percent share of exports through Port Adelaide in 2016-17. Port Adelaide throughput represented 43 percent of total state grain exports in 2016-17.
Viterra faces potential competition on the Eyre Peninsula, particularly for its grain operations at Port Lincoln (Table 4.1).
114 Further, eastern South Australia has limited access to the domestic bulk grain market whereas the Eyre Peninsula, given its
location and an unconnected rail system, is largely confined to the export market. This confinement is notwithstanding the shipment of grain from the Eyre Peninsula ports to eastern state ports for domestic consumption when harvests in those states are insufficient to service domestic demand (Liz Wells, ‘Southern grain cruises into Brisbane market’, Grain Central, 29 January 2018, viewed 4 June 2018, available at www.graincentral.com).
115 For detail on Cargill’s grain operations at Port Adelaide, see ACCC, Patrick Stevedoring Pty Ltd, Port Adelaide—exemption assessment of a bulk wheat port terminal facility under the Port Terminal Access (Bulk Wheat) Code of Conduct, final determination, 1 April 2016, available at https://www.accc.gov.au/system/files/20160401%20Exemption%20assessment%20-%20Patrick%20%28Port%20Adelaide%29%20-%20final%20determination_0.pdf.
116 For detail on Semaphore grain operations at Port Adelaide, see ACCC, Semaphore Container Services Pty Ltd, Port Adelaide—exemption assessment of a bulk wheat port terminal facility under the Port Terminal Access (Bulk Wheat) Code of Conduct, final determination, 28 July 2017, available at https://www.accc.gov.au/system/files/FOR%20WEB%20-%20Semaphore%20final%20determination_0.pdf.

Public—I2—A2 Inquiry into the South Australian bulk grain export supply chain costs 38
Table 4.1 New port proposals, South Australia117
Location and proponent Elements of proposal
Port Bonython, Spencer Gulf
Spencer Gulf Port Link, led by Flinders Ports
Bulk commodity port
3 kilometre jetty with covered conveyor
Load cape-size vessels to 180,000 tonnes
Fully enclosed shed storage
Approximately 25 kilometre rail connection to national railway line
Capacity of 75 million tonnes per year
Lucky Bay, Eyre Peninsula
Spencer Gulf Trust
Bulk storage facility 1.5 kilometres inland
Transhipment (barge) operation to load Panamax and possible cape-size vessels
Capacity of 1.5 million tonnes per year
original proposal for exporting iron ore, currently being re-scoped as a grain transhipment port
Lucky Bay, Eyre Peninsula118
T-Ports
Bulk storage facility at port (430,000 tonnes) and upcountry storage at Lock (150,000 tonnes)
Transhipment (barge) operation (from shallow harbour) to load Panamax vessels
Capacity of 377,000 tonnes per year
Grain only
Cape Hardy, Eyre Peninsula
IronRoad and Emerald Grain
1.5 kilometre jetty with covered conveyor
load cape-size vessels to 220,000t
Open stockpile storage – 650,000t
150 kilometres of rail from mine to port
Grain capability
Capacity up to 25 million tonnes per year
Wallaroo, Yorke Peninsula
Sea Transport
Barging facility to service the grain industry
Capacity currently unknown
Indication from Sea Transport that it will seek sponsorship for a grain export facility
Smith Bay, Kangaroo Island
KI Plantation Timber
Deep water, multi-user, multi-cargo facility
Storage facilities for timber and containers
Source: DPTI.
117 Based on information provided by the DPTI, February 2017, for all but T-Ports’ Lucky Bay proposal. Source: Grain Central,
14 March 2018, viewed 14 March 2018 available at https://www.graincentral.com/. 118 In May 2018, T-Ports announced an 87 metre transshipment vessel capable of carrying 3500 tonnes had been officially
launched in China, and is expected to be available for 2018 grain harvest exports through Lucky Bay, starting in December 2018. Source: GrainCentral, 15 May 2018, viewed 15 May 2018 available at https://www.graincentral.com/trade/export-trade/t-ports-transhipment-vessel-launches-in-china/ .

Public—I2—A2 Inquiry into the South Australian bulk grain export supply chain costs 39
Some prospective mining operations are proposing new deep sea ports on the Eyre Peninsula. In time, these ports could compete for grain exports. There are also dedicated grain shallow port operations, requiring double-handling of grain via barge to deeper parts of the Spencer Gulf. Such competition could result in a material loss of throughput at Viterra’s Port Lincoln operation. It would also result in duplicated infrastructure and, while benefiting some geographically advantaged growers, might increase supply chain costs across the whole state (at least in the short to medium term). In the long term, however, such competition might result in lower supply chain costs if it is efficient.
More generally, third party access could potentially be achieved at all of Viterra’s bulk loading infrastructure under the ports access regime, subject to land availability. This potential competition would likely constrain the extent to which Viterra might exercise market power: that is, the higher the returns that Viterra earns, the greater the likelihood that it will attract new entrants to erode such returns. Yet, GPSA submitted to the Economic and Finance Committee’s primary producers’ inquiry that the grain supply chain is well positioned with ports and storage located in the right spots, making it difficult for a competitor to compete with the existing infrastructure.119
4.3.4 Competition from on-farm storage and grower cooperatives
The development of on-farm storage (which provides growers with greater choice and control) has been particularly slow in South Australia relative to other states.120 Section 3.3.2 noted reasons for the slow growth, which include growers having access to a smaller domestic market in South Australia.
Viterra’s service model is based on trying to handle, accumulate and move bulk grain as quickly and efficiently as possible. To support this model, Viterra segregates its storage according to grain type classifications, and accounts for the costs of doing so. At times, this segregation may not favour certain growers. In those instances, some growers decided to pursue markets demanding low volume, high quality grains.121 However, the impact on Viterra’s operations of growers pursuing such markets would be unlikely to be significant.
The potential competition on the Eyre Peninsula (section 4.3.3) also provides some evidence of growers’ willingness to consider the merits of forming their own cooperatives to compete with Viterra in storage and handling.122
4.3.5 Interstate bypass through traders
On occasion, some traders bypass Viterra port facilities by transporting grain interstate by rail. This behaviour is evidence that grain growers in eastern South Australia are not limited to using Viterra’s export facilities. But it is likely to be commercial only when poor eastern states’ harvests push up domestic grain prices.
119 Economic and Finance Committee, Inquiry into Issues faced by Primary Producers, final report, p. 134. 120 AEGIC understands more than 80 percent of an average harvest for the eastern states can now be placed in permanent on-
farm storage. On-farm storage in South Australia and Western Australia is much less, but continues to grow, albeit as at slower pace. (Source: AEGIC, Australian export grains supply chains in 2017, forthcoming, p. 8).
Current estimated South Australian on-farm grain storage is 1 million tonnes (Source: PIRSA, Submission to the Inquiry into the South Australian Bulk Grain Export Supply Chain Costs, May 2017, p. 6).
A 2009 estimate of South Australian on-farm storage, based on an ABS survey, was 1.2 million tonnes, suggesting little if any growth in South Australia (Source: Productivity Commission, Wheat export marketing arrangements, inquiry report, no. 51, 1 July 2010, p. 256, available at https://www.pc.gov.au/inquiries/completed/wheat-export).
121 One instance presented to the Commission involves Mr Mark Shilling, who grows high quality grains on the Yorke Peninsula, particularly lentils. Mr Schilling identified that the market is willing to pay a premium for the higher specifications that he can produce, but Viterra’s system does not cater for this willingness.
122 Australian Financial Review, ‘Aussies fight to stay cream of the crop’, 7–8 October 2017, p. 26, available at www.afr.com.

Public—I2—A2 Inquiry into the South Australian bulk grain export supply chain costs 40
Viterra also submitted that it faces competition from interstate grain handlers (in areas such as western Victoria and south west New South Wales) seeking to capture South Australian harvested grain.123 But, again, this competition would seem limited at best, given the proximity of most South Australian grain growing regions to South Australian ports.
Draft Finding 4.2
While Viterra faces some competition (actual and potential), the extent to which competition places effective and credible discipline on Viterra’s behaviour is not clear. The global market may place more effective discipline on Viterra’s behaviour than any local competition could.
4.4 Investigating Viterra’s market behaviour
Because Viterra has a high market share across a number of the supply chain segments, and faces only niche competition (section 4.3.3), the Commission investigated whether Viterra may exercise market power in a sustained manner:
First, it examined customer satisfaction with Viterra’s services (section 4.4.1) and how effectively Viterra is managing its costs and assets (section 4.4.2). If Viterra is not performing well in these areas, it might not be operating in a competitive market (given the expectation that in a competitive market it would be displaced by firms that can meet customers’ expectations and effectively manage their costs and assets).
Next, the Commission examined fee levels (section 4.4.3), because excessive fees might underpin excessive returns. It assessed Viterra’s financial returns to determine whether they are greater than might reasonably be expected for a firm with Viterra’s risk profile (section 4.4.4). Excessive returns or fees would not be sustainable in a competitive market.
The Commission also investigated a sample of Viterra fees and practices, to determine whether Viterra is engaging in any sustained behaviour that inhibits a competitive outcome, such as pricing to create a barrier to new competition or expansion by existing competitors (section 4.4.5).
Finally, the Commission looked at the market transparency of Viterra’s operations (section 4.4.6). A market failure resulting from lack of market information could mean competitors cannot make an informed decision on the returns available from entering the market (or expanding existing operations). Similarly, growers and traders need transparency to enable them to understand the basis and reasonableness of the fees being charged and enable them to assess the merits of alternatives. In this case, Viterra would not face the level of competition that it might otherwise.
Section 4.5 presents the Commission’s overall conclusion on Viterra’s market behaviour. In reaching a conclusion, the Commission noted the grain industry’s significant restructuring since 2008, and firms’ possible response to such a restructuring. Viterra, for example, has engaged in a range of pricing practices (meaning growers have moved from a single pool price through other pricing approaches), so some growers could feel the price structure changes have not been to their advantage. The Commission is seeking, however, to identify the efficiency of the overall supply chain, not the impact on individual growers.
123 Viterra, Response to Public Submissions, June 2017.

Public—I2—A2 Inquiry into the South Australian bulk grain export supply chain costs 41
4.4.1 Are customers satisfied with Viterra’s services?
Within and across the broad service categories of the supply chain, a range of activities define, or contribute to, service levels. Some services are easily observable to customers when they transact with Viterra, while others may be less apparent. (This section does not examine the regulatory standards that drive service levels and, therefore, supply chain costs.)
Viterra classifies its customers into three distinct customer groups:
growers (about 5000 trading entities in 2017)—section 4.4.1.1
export traders (11 in 2017)—section 4.4.1.2
end use customers, who are customers of Viterra’s bulk grain in receiving countries (exact number unknown). This Draft Report does not discuss these customers because they are not within scope of the supply chain market (as defined for this inquiry).
The service requirements within, and between, customer ‘groups’ are different.
4.4.1.1 Growers
Customer satisfaction varies from grower to grower, based on individual experiences with each service provided by Viterra, and these experiences may vary from year to year. Based on available facts and evidence, Viterra seeks to measure its performance in providing services to growers and it does so in a robust manner. It submitted evidence that it acted to improve customer service in response to customer feedback. The Commission considers Viterra, as a near-monopoly service provider, would not have taken these actions unless it is self-motivated to provide good customer service. This section reports the data and information from Viterra that supports this finding.
Viterra submitted that it uses both formal and informal (including ad hoc) methods to capture grower feedback, such as:
annual grower customer surveys,124 which seek to measure grower satisfaction with Viterra’s service levels
silo committees, which are established on a regional basis and used to disseminate information and negotiate optimal outcomes between Viterra and growers on harvest matters, and industry and supply chain matters
pre- and post-harvest meetings, which are attended by growers and silo committee chairs, and used to receive feedback on previous harvests and future harvests (including regional production trends)
complaint resolution procedures, which exist across many aspects of Viterra’s activities, including grain classification, warehousing and port services.
124 Viterra contracted a market research company to conduct its annual post harvest grower survey.

Public—I2—A2 Inquiry into the South Australian bulk grain export supply chain costs 42
(a) General customer satisfaction measures
Viterra’s overall customer satisfaction was 78 percent in 2016-17 compared with 80 percent in 2015-16.125 Having reviewed the customer feedback, the Commission noted:
there may not be one ‘customer voice’ among Viterra’s customers. The services that Viterra offers can vary regionally as well as from year to year, and customers may have differing requirements at different times. The Commission also recognised Viterra aims to optimise its supply chain on a network basis, which may lead to undesirable outcomes for individual growers.
based on annual grower surveys, Viterra’s overall level of customer satisfaction rose from 2013-14, which may be evidence of a greater focus by Viterra on addressing customers’ issues.
(b) Specific customer satisfaction measures
The Commission considered views and evidence on aspects of Viterra’s service provision that customers and Viterra raised. Table 4.2 lists the Commission’s observations.
Table 4.2 Customer satisfaction measures, Viterra
Area of service Commission’s observations
Opening hours for silos
Customer satisfaction information on this service is not consistent. Customer satisfaction for this measure fell between 2015-16 and 2016-17 in Viterra’s annual grower survey, but it increased in GPSA’s survey.
Viterra determines its opening hours after considering a range of factors, including expected grain deliveries, operating costs and safety issues (for example, staff fatigue).126 Viterra is best placed to consider the extent to which it offers fee for service.
Classification accuracy and consistency
Viterra recorded a relatively large fall in satisfaction from 2015-16 to 2016-17 in this measure. However, pressures in dealing with the record 2016-17 harvest might have influenced this outcome.
Viterra allows multiple opportunities for classification: if a grower is not happy with the classification, they can return as many times as they want for re-classification (at Viterra’s expense). If the grower is still not happy with the result, they can lodge a formal complaint with Viterra.
Viterra is working to introduce automatic classification technology, which should reduce any subjectivity (or perceived subjectivity) in grain classification.
Source: Viterra and customer representatives.
125 As measured in Viterra’s 2017 annual grower post harvest survey. The sample for 2016-17 was 289, out of approximately
3500 growers contacted. The question posed was ‘Overall, how well did Viterra meet your grain handling needs across all sites that received your grain – whether delivered by you or a carrier?’ Answers were based on a 1–5 scale. The average level of satisfaction for all regions was 3.9 in 2016-17 and 4.0 in 2015-16.
126 Viterra offers some flexibility in opening hours and times, with various fees as set out in its Pricing, procedures and protocols manual. A Domestic Outturn Surcharge, for example, applies if a client requests labour at a port terminal outside normal operating hours (Source:Viterra, Pricing, procedures and protocols manual, 2017, p. 22, viewed 14 May 2018, available at http://viterra.com.au/wp-content/uploads/Pricing-Procedures-and-Protocols-Manual-Schedule-A-L-2017_18.pdf.

Public—I2—A2 Inquiry into the South Australian bulk grain export supply chain costs 43
4.4.1.2 Export traders
There is an absence of survey information on export customer satisfaction. GPSA submitted to the Economic and Finance Committee’s primary producers’ inquiry that no grain marketing individual, grain marketing organisation or organisation representing marketers of grain made a submission to part 1 of the Commission’s inquiry.127
Viterra submitted that typical demands from its export customers include:
shipping capacity: higher demand for shipping capacity early in the season, certainty of shipping capacity and pricing in future years, and flexibility to move bookings for shipping capacity between ports, time periods and exporters
vessel sizes: ability to accommodate changing vessel sizes and configurations
vessel loading: timely loading of vessels with grain that meets exact specifications.
The Commission discussed these matters with some export traders. Section 4.2.3.2 covers one of the issues raised during these discussions (operational flexibility concerns with the operation of PTAC). The Commission welcomes submissions from traders on this matter, or from any stakeholders.
Draft Finding 4.3
Viterra seeks to measure its performance in meeting the customer service needs of growers, and it does so in a robust manner. It submitted evidence of its actions to improve customer service in response to customer feedback. These actions are consistent with a firm seeking to meet customer needs.
4.4.2 Is Viterra managing its costs and assets well?
Viterra needs to manage its costs in the context of highly volatile grain production. There is pressure on Viterra to work its assets hard for half of the year, during harvest and the peak export period. The evidence provided to the Commission is that Viterra seeks to maximise throughput and its operating surplus.128
In forming a view on Viterra’s behaviour in terms of its cost and asset management, the Commission investigated the firm’s:
capital expenditure and asset management—section 4.4.2.1
operating expenditure trends and drivers (with a focus on labour, and transport and logistics)129 – section 4.4.2.2
capital and operating efficiencies—section 4.4.2.3.
127 GPSA, Submission to Economics and Finance Committee, 21 July 2017, p. 4. 128 While maximising throughput leads to an efficient use of fixed infrastructure, the fees charged are not necessarily efficient.
That is, maximising profits is a function of quantity (throughput) and price. If no, or limited, substitutes exist, then a firm that can exercise market power will have greater ability to increase prices without any significant reduction in demand. For this reason, the Commission investigated Viterra’s fees (section 4.4.3) and financial returns (section 4.4.4).
129 These are the two highest operating expenditure categories for Viterra. Together, they accounted for 70 percent of the firm’s operating expenditure in 2016-17.

Public—I2—A2 Inquiry into the South Australian bulk grain export supply chain costs 44
4.4.2.1 Capital expenditure and asset management
Evidence to date supports Viterra’s capital expenditure and asset management practices being sound. In forming this view, the Commission relied on information provided by Viterra, including:130
recent examples of Viterra’s capital expenditure efficiencies—section 4.4.2.3
a submission from Viterra on its capital expenditure controls
a submission from Viterra that it maintains a ‘sustainable level of capital expenditure’, informed by external engineering and internal assessments
a submission from Viterra that it considers the overall efficiency of the supply chain when making expenditure decisions (for example, by temporarily or permanently closing inefficient supply chain sites, including silos,131 or by balancing vertical and horizontal storage capital assets132 to maximise network efficiency).
4.4.2.2 Operating expenditure trends and drivers
Evidence to date supports Viterra’s approach to managing labour costs, and its associated policies and procedures, being sound. The Commission examined Viterra’s labour force expenditure, including its recruitment practices, training and safety procedures and strategies,133 strategy for staffing during harvest, and other strategies for reducing labour costs. The firm’s labour is, on average, its largest operating cost driver (approximately 35 percent of Viterra’s annual operating expenditure in 2016-17). Table 4.3 summarises some labour cost data.
Table 4.3 Viterra’s management of labour costs
Labour cost consideration Results
Total labour costs Viterra’s labour costs per hour are above the consumer price index (CPI). But, as a result of implementing improved labour efficiencies (see labour portfolio mix below), labour costs per tonne of grain received have fallen (by around 7.0 percent per year in real terms) since 2013.134
Labour portfolio mix Viterra demonstrated it actively considers its mix of casual, part-time and full-time labour. In June 2017, for example, Viterra transferred 100 positions from casual and permanent part-time positions to permanent positions135 to reduce its total labour costs. In addition, it negotiated flexible arrangements within the Enterprise Agreements.
Managing wage increases Average annual Enterprise Agreement wage increases (costs per hour) fell between 2014 and 2017, from 3.17 percent to 2.39 percent.136 This increase remains, however, above CPI.
Source: Viterra.
130 The Commission undertook a limited form of review of Viterra’s capital and asset management practices, which was neither
a comprehensive audit nor an engineering review. 131 Viterra’s permanently closed sites progressively increased from 200,000 tonnes per year in 2007 to 500,000 tonnes per year
in 2017, due to lower grower use and/or ageing infrastructure (source: Viterra response to request for information). 132 The capital costs of these two asset types vary considerably. Viterra demonstrated it considers these costs when
determining the optimum mix of these assets within its business, and it has increased horizontal assets in recent years (source: Viterra response to request for information).
133 Viterra’s labour costs include training and safety costs (source Viterra response to request for information). 134 The Commission sought to benchmark Viterra’s labour costs against those of other grain handling firms. Except for CBH,
this information is not publicly available. CBH labour costs are available for 2013–2016 and are comparable, on a dollar per tonne basis, with those of Viterra. Care should be taken when comparing Viterra and CBH (section 4.4.3.3).
135 Viterra website, viewed 15 May 2018, available at http://viterra.com.au/index.php/2017/06/22/100-permanent-jobs-created/.
136 Equal to an average of 2.65 percent per year across the period.

Public—I2—A2 Inquiry into the South Australian bulk grain export supply chain costs 45
Transport and logistics, on average, are the second largest operating cost driver for Viterra (approximately 30 percent of Viterra’s annual operating expenditure in 2016-17). The majority of these costs are rail costs (mainly Viterra’s contracted costs with GWA) and road costs (mainly Viterra’s contracted costs with its road freight service providers). The freight segment of the supply chain is highly competitive, so the Commission expects these costs to be efficient (sections 4.2.1 and 4.2.2).
4.4.2.3 Capital and operating efficiencies
Viterra demonstrated it seeks to maximise tonnage handled in an effort to achieve its best possible operating surplus per tonne. Similarly, GPSA submitted ‘South Australia’s providential port infrastructure and port terminal service operators have a consolidated interest in maximising volume through bulk grain export terminals’.137 Viterra submitted that it has been able to capture the benefits of the competitive freight transport by regularly tendering for its road and rail services.138 In particular, it has:139
sought and achieved additional efficiency improvements in managing both rail and road costs in recent years
demonstrated a willingness to work with the rail operator (GWA) to achieve the best commercial outcome for both parties, and to the benefit of growers through reduced freight rates.140 Table 4.4 contains examples of efficiency initiatives.
Table 4.4 Examples of road and rail related efficiencies
Initiative Explanation and efficiency improvement
Cessation of inefficient rail services
Based on its financial assessment, Viterra did not renew their contract for rail services in the Pinnaroo and Loxton lines meaning that this service ceased in 2015.
Renegotiation of rail service pricing method
In 2015, Viterra renegotiated pricing arrangements with GWA. It submitted that this change resulted in a significant reduction in overall costs. A fixed price contract provided GWA with sufficient certainty to undertake necessary expenditures to achieve the standard of service that Viterra seeks.
Consolidation of road freight service providers
Before 2009, Viterra had over 300 road freight service providers. It submitted that the arrangements were ‘localised and fragmented.’ Since 2009, it has conducted several consolidations and now has only seven providers. Viterra submitted that this consolidation has resulted in efficiency benefits from reduced staffing levels, greater port capacity released to export markets, and greater confidence in meeting export, compliance and safety requirements.
Source: Viterra.
Figure 4.1 tracks movements in Viterra’s operating expenditure for 2007–2017. The real dollar per tonne financial figures provided by Viterra have been indexed in a manner that shows trend but does not identify the absolute values - termed ‘indexed real $ per tonne’.141 It shows a pronounced
137 GPSA, Submission to the Inquiry into the South Australian Bulk Grain Export Supply Chain Costs, 11 May 2017, p. 6. 138 The last tendering process for rail services occurred in 2013, and the last tendering process for road was in 2015. 139 Viterra response to request for information. 140 Noting freight rates are only one component of supply chain fees. 141 The Commission has received information from Viterra over which confidentiality has been claimed. As a result, at this time,
the Commission has decided not to disclose information in this report, in part or in total, which is subject to such a claim (section 2.3). Consequently, the Commission has converted this data into an index as Viterra has claimed it is commercial in confidence.

Public—I2—A2 Inquiry into the South Australian bulk grain export supply chain costs 46
downwards trend in costs. Viterra’s operational practices thus suggest an effective business from a logistical perspective.
Figure 4.1 Movement in operating expense, Viterra, 2007–2017
Source: Commission analysis of Viterra provided data.
Draft Finding 4.4
Viterra appears to be operating as a cost effective bulk grain accumulator that can meet peak harvest demand and compete in the global context.
4.4.3 Are Viterra’s fees excessive?
This section examines Viterra’s fees, by first discussing fee structure (section 4.4.3.1), then identifying fee trends (section 4.4.3.2), and comparing them with Viterra’s counterparts (section 4.4.3.3).
When the Commission examined specific supply chain fees for this inquiry, it was considering whether there was any exercise of market power. It was not seeking to verify whether each fee reflects the efficient cost of the specific service being provided.142 (That is, it did not undertake the bottom-up review of costs that a price determination would use.)143 However, the level of fees are only one consideration, with service quality also being important. As noted in section 4.4.1, Viterra submitted evidence of the manner in which it acted to improve customer service in response to customer feedback.
Further, a reliable and efficient grains operator is crucial in enabling the South Australian grain industry to retain a competitive position in the global market. To this end, Viterra submitted that the 2016-17 harvest proved the strength of its South Australian bulk grain supply chain. It managed record receivals, set records at many of its sites, and fully used its upcountry, logistics and terminal assets, including new storage added before harvest in response to grower feedback.144
142 Fees that reflect efficient costs are referred to as efficient fees (prices). Economic theory suggests efficient costs and prices
are an outcome of effective competition. Effective or workable competition exists when competitors (new or existing) constrain the market power of suppliers to raise price persistently. Workable competition limits the firm’s ability to extract excessive profits. Firms earn profits in a competitive market, but at levels (on a sustainable basis) just sufficient to encourage and reward investment, efficiency and innovations. For further discussion on this point, see Economic Regulatory Authority, The efficient costs and tariffs of the Water Corporation, Aqwest and Busselton Water, 2017, p. 7.
143 Such as the Commission might undertake when assessing efficient costs for a regulated firm such as SA Water. 144 Viterra, Submission to the Inquiry into the South Australia Bulk Grain Export Supply Chain Costs, May 2017, p. 2.
0
10
20
30
40
50
60
70
80
90
100
2006-07 2007-08 2008-09 2009-10 2010-11 2011-12 2012-13 2013-14 2014-15 2015-16 2016-17
Inde
xed
real
$ p
er to
nne
Operating expenditure

Public—I2—A2 Inquiry into the South Australian bulk grain export supply chain costs 47
4.4.3.1 Fee structure
Viterra submitted that it sets fees on a whole of supply chain (network) basis; it does so to maximise the use of its network and achieve efficiencies from scale, spreading network fixed costs across the supply chain. This approach means individual fees may not necessarily reflect costs for a specific service at any location or time. Viterra’s Export Select service is an example (box 4.4) of how it seeks to encourage greater use of its network. Section 4.4.5 considers the efficiency implications for the grain export supply chain of Viterra’s strategic approach to fee setting.
Box 4.4 Export Select
Export Select is a logistics service that Viterra offers to grain traders. The bundled service consists of an end-to-end process to move grain from a Viterra upcountry receival site to a Viterra port. It covers: grain accumulation; upcountry outturn of grain (but not receival or storage services); transport to port; and port inloading (but not storage at port or outloading onto vessels). According to Viterra, Export Select ‘allows Viterra to handle the handling and logistics task in the most efficient manner possible’.145
Users of Export Select transfer their grain stock into Viterra’s system.146 Traders can combine their accumulation with grain from other sources. On behalf of the trader, Viterra consolidates, accumulates and manages the logistics task from the upcountry sites to port.147 It classifies certain sites, or commodities or grades at sites, as Export Select only. Viterra submitted that this process facilitates its ability at certain sites to outturn in an efficient and cost-effective manner. It submitted that it will swap customers out of Export Select only sites to alternatives if those customers wish to organise their own transport, or outturn domestically. Alternatively, Viterra may allow the customer to outturn from an Export Select only site subject to the timing or the efficiency of the movement.148
Export Select is optional for Viterra’s customers, but it is the preferred method for export traders.149 Viterra submitted that potential Export Select benefits to traders include:
an increase probability, while not guaranteed, that an exporter’s grain is received at port on time and meets the required specifications
protection from adverse freight rate movements, because rates are fixed at the time of transfer150
known freight rates between upcountry sites and ports, with Export Select rates published every month
the adoption of Export Select rates by Grain Trade Australia as the location differentials 151 a rebate for using Export Select, which was introduced in 2009.152
145 Viterra, Pricing, procedures and protocols manual, p. 29, viewed 15 May 2018, available at http://viterra.com.au/wp-
content/themes/viterra/documents/Pricing,%20Procedures%20and%20Protocols%20Manual%202016_17%20(Schedule%20A-L)2.pdf.
146 That is, while Export Select does not cover receival and storage services, the grain must be in Viterra’s upcountry storage for the trader to use the Export Select service.
147 Viterra, Submission to the Inquiry into the South Australia Bulk Grain Export Supply Chain Costs, May 2017, p. 10. 148 Viterra, Response to public submissions, June 2017. 149 Viterra, Submission to the Inquiry into the South Australia Bulk Grain Export Supply Chain Costs, May 2017. Export Select covers
most deliveries from Viterra’s upcountry facilities to a Viterra port (source: Viterra response to request for information). 150 ACCC, Viterra application seeking capacity allocation system approval, draft decision, 16 July 2015, p. 44, available at
https://www.accc.gov.au/system/files/accc%20draft%20decision%20on%20viterra%20long%20term%20agreement%20proposal.pdf .
151 Buyers deduct location differentials from port prices to establish a grain price at each site. 152 This rebate has gradually been reduced over time, resulting in progressive increases in fees. For 2017-18 season grain, the
rebate was $0.60 per tonne for client transfers before 15 January 2018. Source: Viterra, Export supply chain fees 2017/18 explained, viewed 15 May 2018, available at http://viterra.com.au/wp-content/uploads/Export-supply-chain-fees-201718-explained.pdf.

Public—I2—A2 Inquiry into the South Australian bulk grain export supply chain costs 48
Two key aspects of Viterra’s Export Select product make it an effective tool for encouraging and managing the accumulation of grain:
First, Export Select provides traders with a straightforward option for getting grain onto a vessel, thereby reducing their transaction costs. If the trader has confidence that Viterra will deliver its grain as required, it has a strong incentive to use Export Select because the trader can choose whether the costs and rebate are passed through to growers.153 Any given transaction between a grower and a trader, therefore, can result in the use of the Export Select product, regardless of the grower’s preference.
Second, in the majority of cases, access to Viterra’s freight rates is conditional on the use of Export Select. Since Viterra was acquired (early 2013), the firm has focused on driving cost efficiencies from Viterra’s freight operations through numerous initiatives across the supply chain. As a result, Viterra reduced its reported transport and logistics costs by 43 percent between the 2013 and 2017 harvest years (based on change in real $ per tonne154). The overall effect of this is that, in order to be able to benefit from Viterra’s freight rates (Export Select), the trader must use Viterra’s upcountry storage and handling facilities.
A benefit–cost analysis of the merits of Export Select is not possible without knowing the cost of alternative transport paths. The Commission has not undertaken such a task for the Inquiry, because Export Select covers only a component of supply chain costs and there is no evidence that the freight component is not efficient.155
Subject to issues of detail, the Commission considers Viterra’s pricing to maximise network throughput is not an unreasonable method for setting fees (if it does not detrimentally affect supply chain efficiency), because:
maximising throughput is necessary to achieve cost competitiveness in a global market
this method allows Viterra to manage throughput efficiently and minimise congestion that may occur when demand is high (for example, at ports during the export intensive months). Viterra provided the Commission with an example of how cost-reflective supply chain fees at an individual site during harvest can lead to an inefficient use of network resources (box 4.5)
there is likely to be a trade-off between a theoretical pricing approach and one that can be cost-effectively administered. Setting fees for each individual site to reflect costs at a point in time, for example, could result in significant price differences between and within harvests and locations, which may be difficult to explain to growers and may be costly to administer.
However, the view that network based pricing is reasonable has limitations. Such pricing should not be conducted in a way that is anti-competitive. Section 4.4.5 reports on the Commission’s investigation of whether Viterra is engaging in any sustained behaviour that inhibits a competitive outcome.
153 The Commission understands that traders use locational differentials set by Grain Trade Australia in developing contracts
with growers. Grain Trade Australia sets the South Australia locational differentials using the freight charges published by Viterra. The Commission has taken Export Select to encompass the freight rates.
154 All references to per tonne calculations in this report are based on actual receival tonnage, unless otherwise stated. 155 Export Select covers Export Select freight rates, Viterra’s outturn fee and Viterra’s port inloading fee (and the rebate if
applicable). Source: Viterra website, viewed 4 June 2018, available at http://viterra.com.au/index.php/export-select-freight-rates/ .

Public—I2—A2 Inquiry into the South Australian bulk grain export supply chain costs 49
Box 4.5 Changing prices to encourage greater use of network—the Gladstone, Gulnare and Jamestown sites
Viterra’s Gladstone, Gulnare and Jamestown sites are located in the upper Central region. Its Yongala and Caltowie sites (in the same region) had already closed, due to low use and high capital requirements.
In 2015, Viterra’s post-harvest analysis identified reduced receivals and use at Gulnare and Jamestown would result in the closure of these sites. But both sites were in good condition and did not require significant capital expenditure.
For network efficiency, Gulnare and Jamestown sites needed to remain open to: reduce overall site labour and capital expenditure to meet deliveries segregate smaller volumes and/or less mainstream grains without interrupting higher volume
activities reduce expenditure on extra storage at Gladstone in 2016-17.
In response, Viterra lowered freight rates for these sites, which encouraged increased receivals and led to the better use of existing network assets.
4.4.3.2 Viterra fee trends
The Commission compared 2013-14 and 2017-18 supply chain fees156 for a sample of upcountry to port pathways (Table 4.5). Box 4.6 explains why the Commission chose the four pathways.
Table 4.5 Fees comparison, by sample grain pathway ($ nominal)
Pathway to port 2013-14 $/tonne
2017-18 $/tonne
Total increase over
period
Average annualised
increase
Cummins to Port Lincoln—rail $46.16 $50.82 +10.1% +2.4%
Warramboo to Thevenard—road $69.21 $74.75 +8.0% +1.9%
Roseworthy to Outer Harbor—road $48.50 $53.67 +10.7% +2.6%
Tailem Bend to Outer Harbor—rail $53.61 $58.42 +9.0% +2.1%
Average increase—sample grain pathways +9.4% +2.3%
Consumer price index157 +7.0% +1.7%
Simple average of producer price indexes158 +8.4% +2.0%
Source: Essential Services Commission, using publicly sourced Viterra fee schedules.
Appendix E contains a full breakdown of fees for each of the grain pathways. This breakdown shows fee movements from 2013-14 to 2017-18 for the following fee categories (annualised in parentheses):
upcountry storage and handling:159 simple average increase of 15.7 percent (+3.7 percent per year)
156 All fees were sourced from publicly available information: Viterra Wheat Reference Prices—Port Terminal Services; Viterra
Export Select Group Fees; and Viterra Schedule A – Storage and Handling Charges. Supply chain fees will vary depending on the month of shipping chosen for comparison. Viterra amended its shipping charging structure in 2014-15.
157 ABS, Consumer price index (CPI)—all groups—weighted average of eight capital cities. 158 ABS, Producer price indices, established to monitor price changes for inputs to specific industry groups. 159 Comprising the following fees: upcountry receival; upcountry outturn; storage at notional port (for three months) less rebate.
Excludes shrinkage and dust fees.

Public—I2—A2 Inquiry into the South Australian bulk grain export supply chain costs 50
freight transport to port:160 simple average decrease of 0.8 percent (-0.2 percent per year)
port services:161 simple average increase of 11.6 percent (+2.8 percent per year).
Box 4.6 Explanation of Viterra fee comparison
A sample of fees is necessary, given the multiple pathways and different times of the year for delivering grain to South Australia’s six ports, and the different lengths of time for which grain may be warehoused.
The four sample pathways adopted: are based on bulk wheat, using Export Select (given wheat is the primary crop, and Export Select
covers most deliveries from Viterra’s upcountry facilities to a Viterra port) have two grain pathways on the Eyre Peninsula and two on eastern South Australia (the two
chosen South Australian markets), to check whether fees vary by market, driven by factors such as varying levels of actual competition
include two grain pathways using rail transport and two using road transport, to check whether customers may be disadvantaged by their access to one freight mode over another
are based on receival in December, with three months storage, then outturn to vessel in March,162 so the fees reflect levels that customers face in a typical peak period.
Within the sample pathways, the Commission chose the following actual pathways to test a range of possible scenarios, and compare the two markets (the Eyre Peninsula and eastern South Australia): Cummins to Port Lincoln (Eyre Peninsula), as an example of an upcountry site located within a
Viterra Grower Delivery Zone, delivering to a port that is covered by a Grower Delivery Zone Warramboo to Thevenard (Eyre Peninsula), as an example of an upcountry site not located
within a Viterra Grower Delivery Zone, delivering to a port that is not covered by a Grower Delivery Zone
Roseworthy to Outer Harbor (eastern South Australia), as an example of an upcountry site located within a Viterra Grower Delivery Zone, delivering to a port that is covered by a Grower Delivery Zone (enabling comparison between Eyre Peninsula and eastern South Australia markets)
Tailem Bend to Outer Harbor (eastern South Australia), as an example to compare a Viterra Export Select pathway with a competitor third party operator not located within a Viterra Grower Delivery Zone delivering to a port that is covered by a Grower Delivery Zone, which is done in section 4.4.5.
These upcountry sites are all Viterra Tier 1 sites, which is where most grain is delivered.163 While receival fees vary between Tier 1 ($12.90 per tonne in 2017-18) and Tier 2 ($13.65 per tonne in 2017-18), the difference (6 percent) is not considered large enough to risk introducing distortions into the analysis. Warramboo and Roseworthy are two sites chosen by AEGIC for its analysis (offering a potential source of independent data if required). Tailem Bend is a major rail outturn site on eastern South Australia, as is Cummins on the Eyre Peninsula.
160 Export Select freight rate. 161 Comprising the following fees: port inloading; port handling and shipping; and capacity booking fee. Excludes miscellaneous
port/wharf fees or levies. 162 While Viterra submitted that the first month of storage is free, it charges a monthly storage fee for grain on hand as at the
first of each month (Pricing, procedures and protocols manual, Schedule A—Storage and Handling Charges 2017/18). Consequently, grain delivered mid-December would face its first monthly fee on 1 January, then 1 February and finally 1 March (three months in total) before export in March.
163 AEGIC, Australian export grains supply chains in 2017, forthcoming, p. 43.

Public—I2—A2 Inquiry into the South Australian bulk grain export supply chain costs 51
Table 4.5 shows total upcountry-to-vessel loading fees across the sample grain pathways are broadly stable, having moved at an average rate only slightly above inflation over 2013-14 to 2017-18. And across the four pathways, fees vary by only a few percentage points from the average. This result does not appear to support, one way or other, whether Viterra is engaging in pricing behaviour to respond to the actual competition that it faces on eastern South Australia.
However, it is worth noting how this fee structure supports Export Select. Freight rates are declining but can be accessed only via Export Select. For each of the sample pathways over the period, the absolute increases in the Export Select outturn and port inloading fees more than offset the decline in the freight rate component of Export Select (Appendix E).
4.4.3.3 Comparison with Viterra counterparts
The Commission sought to compare Viterra’s fees with those of its counterparts to see how fee movements in South Australia compare with other Australian states. To do so, it had access to the results of AEGIC’s most recent review of Australia’s export grain supply chains. The AEGIC review compared fee changes since 2013-14.
In submissions to the Commission’s inquiry and other reviews, growers compared Viterra and interstate counterpart fee levels as evidence that South Australian supply chain costs are too high. Mr Chris Heinjus, Agribusiness Consultant and Lower Mid North farmer, for example, submitted to the Economic and Finance Committee’s primary producers’ inquiry that there is some confusion as to why South Australia’s supply chain costs are more expensive. He argued that Western Australia and South Australia can be compared, given both have predominantly export markets.164
The Commission recognises analysis, such as AEGIC’s, needs to be used carefully for benchmarking Viterra’s fees against other grain firms. There can be differences in business and ownership models, fee structures, geographic characteristics, and grain volumes through each firm’s network. There is also often a range of assumptions (relating to grain type and the time of grain movement) behind the data used to make these comparisons.
As an example, CBH (Western Australia) operates under a cooperative structure, while the other operators are private shareholder owned entities that are primarily under foreign ownership.165 Accordingly, these entities have differing commercial drivers relative to CBH. CBH can concentrate on maximising value to its member grain farmers, whereas the privately owned companies need to earn an adequate return on the funds invested by their shareholders (the majority of which are unlikely to be Australian grain farmers). Further, as a result of its charity status as a cooperative, CBH is not liable to pay tax on returns generated by its storage and handling division, which accounts for three-quarters of its pre-tax profit.166 Particularly in recent years, Western Australian grain farmers (as CBH members) received sizeable rebates when using CBH services.167
Given the potential differences in definitions and fee methods, the Commission gave most weight to comparisons of total supply chain fees, and to trends over the period 2013-14 to 2017-18 (the period covered by the AEGIC review).168 However, the analysis in this section focuses on upcountry handling and storage fees, and port fees (Figures 4.2 and 4.3 respectively) and does not include freight costs
164 Economic and Finance Committee, Inquiry into Issues faced by Primary Producers, final report, p. 137. 165 Aside from CBH and GrainCorp, the remaining top four wheat exporting companies (Glencore Agriculture, Emerald Grain,
Cargill Australia and Plumgrove/Mitsui) are foreign owned. 166 AEGIC, Australian export grains supply chains in 2017, forthcoming, p. 8. 167 AEGIC, Australian export grains supply chains in 2017, forthcoming, p. 84. 168 AEGIC has adjusted the 2013-14 fee values (using a CPI index) to be equivalent with 2017-18 prices, so any differences
already account for the effects of inflation.

Public—I2—A2 Inquiry into the South Australian bulk grain export supply chain costs 52
covering transport to port given:
the lack of publicly reported freight rates for New South Wales, Victoria and Queensland 169
the varying pathways and grain haulage distances across different Australian states (Figure 3.6).
The AEGIC analysis shows a trend of increasing real fees. Such a trend is not inconsistent with the increasing trend found in the fee analysis of Viterra in section 4.4.3.2. Here again, CBH is an outlier with fees reducing, while most operators show fees either flat or increasing over the period.
AEGIC compared freight rates in South Australia and Western Australia.170 This comparison shows, for many locations of equivalent distance from port, rates in South Australia are higher than in Western Australia. Also, the trend lines indicate the difference increases with distance from port. Based on the trend lines, the largest difference is around $5 per tonne.171
Figure 4.2 Comparison of upcountry and receival fees, by major bulk grain handler, 2013-14 and 2017-18172
Note: AEGIC has adjusted the 2013-14 fees to be in 2017-18 equivalent prices.
Source: AEGIC data.
169 AEGIC does not present a single table comparison of total supply chain costs over this period of the form used in Figures 4.2
and 4.3. AEGIC noted it had to rely on Grain Trade Australia location differentials to estimate freight rates for New South Wales, Victoria and Queensland, which are not freight rates; in some cases, these differentials led to an inadequate estimate because freight rates can vary greatly in these states. AEGIC, Australian export grains supply chains in 2017, forthcoming, p. 71.
170 AEGIC reports total supply chain costs for a sample of pathways in each state, but for varying distances, which makes direct comparisons across all states difficult. Also, as noted in this report, actual freight rates are available for only Western Australia and South Australia.
171 AEGIC, Australian export grains supply chains in 2017, Figure 45. Shows the relationship between Grain Express rates (CBH) at primary receival sites (published by CBH for 2017-18) and Export Select rates (published by Viterra for 2017-18) for Viterra’s top 22 receival sites, and the distance to the closest port in Western Australia or South Australia.
172 AEGIC, Australian export grains supply chains in 2017, forthcoming, Figure 23. For South Australia, Viterra’s Tier 1 sites are used for outturn by rail.
0
5
10
15
20
25
2013-14 2017-18 2013-14 2017-18 2013-14 2017-18 2013-14 2017-18 2013-14 2017-18
CBH Viterra GrainCorp Cargill/AWBVic/NSW/Qld
Emerald
Char
ge ($
/t)
Discounts Receival at upcountry Three month storage Outturn fee

Public—I2—A2 Inquiry into the South Australian bulk grain export supply chain costs 53
Figure 4.3 Comparison of port fees, by major port service providers, 2013-14 and 2017-18173
Note: AEGIC has adjusted the 2013-14 fees to be in 2017-18 equivalent prices.
Source: AEGIC data.
Figure 4.4 Comparison of combined upcountry and receival fees for major bulk grain handlers, and port fees, 2013-14 and 2017-18
Note: AEGIC has adjusted the 2013-14 fees to be in 2017-18 equivalent prices.
Source: AEGIC data, combined Figures 4.2 and 4.3.
173 AEGIC, Australian export grains supply chains in 2017, Figure 49.
0.00
5.00
10.00
15.00
20.00
25.00
30.00
2013-14 2017-18 2013-14 2017-18 2013-14 2017-18 2013-14 2017-18
CBHKwinana WA
GrainCorpPort Kembla NSW
ViterraOuter Harbor SA
EmeraldPort Melbourne VIC
Fee
($/t
)
Intake Booking fee Loading/terminal shipping Port fees Inspection
18.59 18.30 17.67 18.95 17.55 18.06 20.25 19.35
15.30 14.91
25.3726.43
20.68 22.3621.49 24.15
33.89 33.21
43.0545.38
38.2340.42 41.74
43.50
0
5
10
15
20
25
30
35
40
45
50
2013-14 2017-18 2013-14 2017-18 2013-14 2017-18 2013-14 2017-18
CBHKwinana WA
ViterraOuter Harbor SA
GrainCorpPort Kembla NSW
EmeraldPort Melbourne VIC
$/to
nne
Combined receival and port costs
Receival costs Port costs

Public—I2—A2 Inquiry into the South Australian bulk grain export supply chain costs 54
Draft Finding 4.5
Based on a sample of fees and grain paths, total upcountry-to-vessel loading fees have been broadly stable in recent years, having moved at an average rate only slightly above inflation from 2013-14 to 2017-18. The Commission found no evidence that Viterra’s fees are excessive compared with the total fees charged by its eastern Australian counterparts as shown by AEGIC’s latest study of Australian supply chain costs.
4.4.4 Is Viterra earning excessive returns?
For its investigation of the reasonableness of Viterra’s financial returns, the Commission considered the results against the following three broad market scenarios (which have differing but significant implications for part 1 of the inquiry):
Scenario 1: Viterra faces sufficient competitive pressure (actual and/or potential) to ensure the supply chain is efficient.
Scenario 2: Viterra is actively pursuing operational efficiencies, but not necessarily passing them onto grain growers.
Scenario 3: The supply chain is not efficient, or the evidence raises serious questions about the level of efficiency.
Scenario 1 would support the supply chain being efficient. Competition is an ongoing process, so such an outcome would not rule out potential for the market to deliver further efficiencies.
Scenario 2 could be considered a sub-set of scenario 1—for example, costs may be trending down faster than fee levels (or against increasing fee levels). In this case, returns to Viterra may be increasing, while growers are not sharing sufficiently in any efficiencies that Viterra achieves. Evidence that Viterra is pursuing efficiencies would indicate the presence of efficiency drivers, and the potential for lower supply chain costs (reflected in lower fees to users). But, if fee levels are not following the downward trend in costs (or at least doing so at a much slower pace), perhaps Viterra is not facing sufficient competitive pressure to ensure the supply chain is efficient (unless Viterra is in a period of transition—that is, getting its operation on a more commercial footing before moving to share efficiencies with industry).
Scenario 3 could occur if evidence indicates the supply chain is a natural monopoly. In such a case, a single operator may achieve lower average costs for the industry as a whole, than if several operators were competing. This scenario is the one most likely to justify government intervention in some form, given no demonstrated sufficient competitive pressures (for example, global markets, as discussed in section 4.3.1) are being exerted.174
These scenarios will depend on the reasonableness of Viterra’s financial returns, with the following three potential outcomes:
Financial return outcome 1: Viterra is not earning above a reasonable rate of return.
Financial return outcome 2: Viterra is earning above a reasonable rate of return, but this situation is likely to be transitory.
Financial return outcome 3: Viterra is earning above a reasonable rate of return, and is likely to continue to do so.
If Viterra were shown to be operating efficiently, financial return outcome 1 would suggest Viterra is optimising the scale effects needed to compete effectively on the global market, and additional
174 To this extent, scenario 3 could be seen to co-exist with scenario 1.

Public—I2—A2 Inquiry into the South Australian bulk grain export supply chain costs 55
competition may fragment the end-to-end supply chain, resulting in a worsening outcome. But, if Viterra were shown to be earning an above reasonable rate of return, as per financial return outcomes 2 and 3, then the sustainability of those earnings is important because it suggests the extent to which Viterra’s actions may be an exercise of market power that detrimentally impacts on the efficiency of South Australia’s bulk grain export supply chain.
The Commission’s investigation into the reasonableness of Viterra’s financial returns involved three steps:
First, the Commission sought financial information from Viterra to determine the firm’s level of returns, given Viterra does not release publicly audited accounts in a form that is useful for this inquiry—section 4.4.4.1.
Second, the Commission engaged financial consultants Value Adviser Associates Pty Ltd (VAA) to advise on the rate of return that an investor would require to invest in a firm in a similar market and with similar characteristics to Viterra—section 4.4.4.2.
Finally, the Commission compared estimates of Viterra’s actual returns with VAA’s advised reasonable rates of return, and developed draft findings on the extent to which Viterra’s returns can be considered reasonable—section 4.4.4.3.
The Commission made its assessment across a suite of financial measures (as defined in Appendix D).
4.4.4.1 Viterra’s financial performance
Figure 4.5 shows movements in Viterra’s revenue, operating expense and operating surplus for 2006-07 to 2016-17. The real dollar per tonne financial figures provided by Viterra have been indexed in a manner that shows trend but does not identify the absolute values - termed ‘indexed real $ per tonne’:175
Operating revenue was relatively flat from 2013-14 (Figure 4.5). This result is consistent with Viterra’s fees increasing only marginally since 2013-14 and being essentially flat in real terms on a total fee basis (section 4.4.3.2).
By controlling how grain accumulates and travels within its system, Viterra extracted scale benefits from its supply chain. These scale efficiencies, coupled with a focus on reducing labour and freight costs, meant Viterra could drive down real operating costs on a per tonne basis (Figures 4.1 and 4.5). This result is a prerequisite for the firm to maintain competitiveness in the global market.
The decline in Viterra’s real operating cost per tonne was not accompanied by a corresponding drop in fees (section 4.4.3.2), resulting in Viterra’s operating surpluses consistently trending upwards from 2012-13.
175 The Commission has received information from Viterra over which confidentiality has been claimed. As a result, at this time,
the Commission has decided not to disclose information in this report, in part or in total, which is subject to such a claim (section 2.3). Consequently, the Commission has converted this data into an index as Viterra has claimed it is commercial in confidence.

Public—I2—A2 Inquiry into the South Australian bulk grain export supply chain costs 56
Figure 4.5 Movements in Viterra’s revenue, operating expenditure and operating surplus, 2007–2017
Source: Essential Services Commission analysis of Viterra data.
Appendix D explains the Commission’s approach to deriving Viterra’s asset values and comparable return values, so stakeholders have access to as much information as possible on the basis for the Commission’s findings.
4.4.4.2 The return that an investor might require
The Commission engaged VAA to provide independent advice on the rates of return that an investor would require to invest in a firm in a similar market and with similar characteristics to Viterra. It compared these investor-required rates with the Viterra returns (estimated by the Commission: section 4.4.4.1) to assess whether the financial returns being earned by Viterra are reasonable. Section 4.4.4.3 reports the Commission’s assessment.
This section summarises VAA’s approach and results.176 VAA estimated the return on assets (RoA), return on equity (RoE) and return on invested capital (RoIC) financial measures (as defined in Appendix D). It employed the following two approaches:
Comparable firms: Identify the financial returns from public data (Bloomberg) for a total of 24 firms, across two business segments considered to have similar operational and risk profiles to Viterra—namely, grains storage and handling, and ports and port service providers.
Reasonableness test: Use standard Capital Asset Pricing Model (CAPM) principles to derive rate of return estimates.
The Commission relied more heavily on VAA’s comparable firms’ results. Those results are based on a sample of actual firm returns being earned, and the objective is to determine the rate of return that an investor would require if the investor were to invest in a firm in a similar market and with similar characteristics to that of Viterra. The Commission considers this sample is more akin to the outcome required when competing for capital resources in the unregulated context on competitive global capital markets.
176 For further details of VAA’s approach, see VAA, Study of financial returns benchmarks—Inquiry into the South Australian Bulk
Grain Export Supply Chain Costs, Report prepared for the Essential Services Commission of South Australia, 26 April 2018, available on the Commission’s website at http://www.escosa.sa.gov.au/projects-and-publications/projects/inquiries/inquiry-into-the-south-australian-bulk-grain-supply-chain-costs/inquiry-into-the-south-australian-bulk-grain-supply-chain-costs.
0
20
40
60
80
100
120
2006-07 2007-08 2008-09 2009-10 2010-11 2011-12 2012-13 2013-14 2014-15 2015-16 2016-17
Inde
xed
real
$ p
er to
nne
Operating surplus Operating expenditure Operating revenue

Public—I2—A2 Inquiry into the South Australian bulk grain export supply chain costs 57
Nevertheless, the results identified for the sample comparable firms are broadly consistent with the results of the more theoretical CAPM approach (at least in a comparison of the comparable firm median results with the CAPM high results).177 Table 4.6 summarises the results of both approaches.
Table 4.6 Summary of VAA advice on a reasonable return
VAA results: all comparable firms178
VAA results: CAPM
Median 75th percentile Low High
Return on equity (30% gearing) 7.9% 10.6% 6.6% 7.5%
Return on equity (50% gearing) 11.1% 14.7% 8.3% 9.6%
Return on invested capital 6.2% 8.3% 5.4% 6.1%
Return on assets 6.7% 9.1% Not applicable
na Source: VAA.
4.4.4.3 Whether Viterra’s financial returns are excessive
Section 4.4.4.1 shows Viterra’s operating surpluses have consistently increased since its ownership change in early 2013. In this context, the question of whether Viterra’s operating surplus growth translates into a rate of return that is sustainably above a reasonable rate is important. The Commission thus needs to appropriately interpret Viterra’s actions to not share the benefits of its improving operational performance with growers and traders through lower fees.
While this behaviour is a point of contention with growers, it may be relevant from an economic efficiency perspective only if Viterra is sustainably earning above a reasonable rate of return. In that specific instance, the bulk grain export supply chain could be perceived as inefficient because, if there were at least workable competition, returns persistently above a reasonable rate would be competed away. In effect, competitive forces can be expected to drive a redistribution of excessive returns through lower fees and improved service levels. Viterra could earn above reasonable returns consistently only if it could exert market power to reduce the likelihood of market entry, thereby reducing competitive tensions and causing inefficient supply chain outcomes.
The Commission has compared the VAA-advised reasonable return (based on three measures of return) with Viterra’s actual estimated return based on the information that Viterra supplied. On the basis of the adopted approach to estimate Viterra’s actual returns, and having regard to normal estimation errors in the process of determining what a reasonable rate of return should be, Viterra is assessed by the Commission as currently earning returns towards the upper level of what might be considered reasonable, noting that actual returns vary materially from year to year, depending on the level of harvest. This analysis does not, however, suggest that, to date, Viterra’s returns are demonstrably beyond what might be considered reasonable.
This might suggest that, to date, Viterra’s operations may simply be effective—that is, it is optimising the scale effects needed to compete effectively on the global market, and additional competition might fragment the end-to-end supply chain, resulting in a worsening outcome. Viterra’s reward for driving 177 This is not a regulatory determination (section 2.1) and, consequently, Commission staff have not sought VAA adopt CAPM
parameter values in line with what the Commission would apply for a regulatory determination, such as for SA Water. The Commission deliberately sought not to bias VAA in its approach. The Commission has, however, adopted some of VAA’s parameter values in modelling Viterra’s returns (such as gearing levels) in order to produce results that can be compared with those of VAA.
178 VAA used Bloomberg financial results over five years (subject to data availability) to derive returns (Value Adviser Associates Pty Ltd, p.11). This approach takes account of the variability of outcomes that firms operating in these markets are likely to report between years.

Public—I2—A2 Inquiry into the South Australian bulk grain export supply chain costs 58
operational efficiencies has been a higher operating surplus per tonne. And South Australia is maintaining its competitiveness in the global bulk grain market, thereby ensuring the grain industry’s continued contribution to the South Australian economy.
But opportunities to improve the efficiency of the supply chain will always remain. In this context, it might be concerning if the trend in Viterra’s operating surpluses continues to the point at which returns exceed a reasonable level. This scenario might occur if Viterra continues to find efficiencies to reduce costs, without sharing the benefits with industry through lower fees. Evidence of profits exceeding a reasonable level on a sustained basis would suggest Viterra is exercising market power, or the market is not operating as it should (that is, competitors are not entering, or expanding existing operations, to compete away excessive returns).
Draft Finding 4.6
Based on the available evidence, Viterra is earning returns towards the upper level of what may be considered reasonable. The Commission’s analysis of returns is consistent with the fee analysis, which showed Viterra to date has apparently not chosen to share efficiencies with industry through lower fees. However, the Commission did not conclude that Viterra’s returns are currently unreasonable.
Future concerns may arise if the trend in Viterra’s operating surpluses continues to the point at which returns exceed a reasonable level. This point may occur if Viterra continues to find efficiencies to reduce costs, without sharing the benefits with industry through lower fees.
4.4.5 Is there evidence of Viterra exercising market power through its fee structure?
This section reports on the Commission’s investigation of whether Viterra is engaging in any sustained behaviour that inhibits a competitive outcome (section 2.2). In undertaking this investigation the Commission has examined the cost efficiency of the bulk grain export supply chain, rather than broader questions of pricing or equity in the grains sector, in accordance with the Inquiry’s Terms of Reference.
The Commission understands there is the potential for a firm’s behaviour or action (section 2.2) to be interpreted in more than one way. In particular, it considers a given behaviour or action (practices) is less likely to lessen competition when:
There are clear and practical operational reasons for the behaviour, which Viterra applies consistently.
The fee (and its level) or action is a response to a demonstrated opportunity cost and/or can be demonstrated to encourage an efficient user response.
The fee (and its level) or action is adopted by most, if not all, counterpart firms (that is, other commercial grain storage and handling operators in South Australia and interstate).179
For practical purposes, the Commission confined its investigation to a sample of fees and practices, individually or in combination. It chose the fees and practices for their potential to be used by Viterra as a means of exercising market power, and/or because stakeholders specifically raised them. The fee analysis which supports the market power analysis for Export Select (section 4.4.5.1), grower deliveries direct to port (section 4.4.5.2) and competitor direct deliveries to port (section 4.4.5.3) is presented in section F1, Appendix F.
179 In this sense, the Commission is seeking to determine the relative efficiency, rather than the absolute efficiency, of the
South Australian supply chain. That is, the risk for this exercise that all operators are inefficient (Viterra and its interstate counterparts) is less than if the Commission were undertaking a price determination for a regulated firm.
Public—I2—A2 Inquiry into the South Australian bulk grain export supply chain costs 59
Of the sample of Viterra fees and actions investigated, and based on the evidence available, the Commission is concerned with only the fees charged by Viterra to third party operators delivering direct to port (section 4.4.5.3).
4.4.5.1 Export Select
Export Select is a bundled service. A bundled price is inconsistent with efficient pricing when it is used to act as a barrier to entry or expansion (for example, by dissuading new entry and forcing the early exit of new entrants), potentially resulting in Viterra being able to maintain above reasonable returns. So, the Commission sought to identify whether Viterra’s Export Select service can be considered inconsistent with efficient supply chain pricing (see question 4, Appendix B).
(a) How does Export Select operate?
Export Select is a logistics service that Viterra offers to grain traders. This bundled service provides an end-to-end service to move grain from a Viterra upcountry receival site to a Viterra port (box 4.4). It covers:
outloading upcountry storage (but not receival into store or storage services)
freight transport to port
port inloading (but not storage at port or outloading onto vessels).
Users of Export Select are predominantly traders. Traders can combine their accumulation within Viterra’s system with grain from other sources. On behalf of the trader, Viterra then consolidates, accumulates and manages the logistics task from the upcountry sites to port.180
Viterra determines which sites, or commodities or grades at sites, are classified as Export Select. It submitted that the service’s benefits to grain traders include:
more chance that a trader’s grain is received at port on time and meets the required specifications (although not guaranteed)181
protection from adverse freight rate movements, because these rates are fixed at the time of transfer182
known freight rates between upcountry sites and ports, because Export Select rates are published every month.183
Most grain moved from upcountry Viterra sites to Viterra ports goes via Export Select. The financial incentives to use Export Select include a rebate (introduced in 2009). This rebate has gradually been reduced over time from a maximum of $2.45 per metric tonne in 2009-10, resulting in progressive fee increases (other factors being equal). The rebate is highest in the main harvesting months. For 2017-18 season grain, the rebate was $0.60 per tonne for transfers into Export Select before 16 January 2018, and nil thereafter.184
180 Viterra, Submission to the Inquiry into the South Australia Bulk Grain Export Supply Chain Costs, May 2017, p. 10. 181 Viterra, Submission to the Inquiry into the South Australian Bulk Grain Export Supply Chain Costs, May 2017, p. 17. 182 ACCC, Viterra application seeking capacity allocation system approval, draft decision, 16 July 2015, p. 44. 183 Viterra, Submission to the Inquiry into the South Australian Bulk Grain Export Supply Chain Costs, May 2017, p. 10. 184 Viterra, Export supply chain fees 2017/18 explained, viewed 6 March 2018, available at http://viterra.com.au/wp-
content/uploads/Export-supply-chain-fees-201718-explained.pdf. Viterra submitted that the rebate differential ‘reflects … the fact that the early nomination of grain to the Export Select pathway reduces Viterra Operations’ costs and also improves productivity due to efficiencies gained in respect of cargo accumulation’. Source: Viterra response to the ACCC’s request for information dated 15 April 2011, 5 May 2011, p. 12, available at https://www.accc.gov.au/system/files/20110505%20Viterra%20Operations%20response%20to%20ACCC%20RFI%2015%20April%202011.pdf .

Public—I2—A2 Inquiry into the South Australian bulk grain export supply chain costs 60
Two key aspects of Export Select make it an effective tool for encouraging and managing the accumulation of grain (section 4.4.3.1). First, it provides traders with a straightforward option for getting grain onto a ship, thereby reducing traders’ transaction costs. Second, in the majority of cases, access to Viterra’s freight rates is conditional on using the Export Select service. For this reason, Export Select could lock out competitors, particularly small start-up firms. That is, a trader needs to access all Viterra services to benefit from Export Select: the grain must be in Viterra’s upcountry storage for the trader to use the Export Select service.
(b) Is there a sound basis for Viterra’s behaviour?
Given Export Select could lock out competitors, the Commission examined Viterra’s behaviour in terms of the practices identified in section 4.4.5.
Are there clear and practical operational reasons for Viterra’s behaviour?
There appear to be sound operational reasons for Viterra’s behaviour:
Viterra submitted that Export Select facilitates its ability at certain sites to outturn in an efficient and cost-effective manner.185
Export Select is consistent with Viterra’s approach to pricing on a network basis.
Export Select is optional,186 which reduces the risk of competitors being locked out. Notwithstanding, the vast majority of traders elect to use it. Viterra also submitted that it will swap customers out of Export Select-only sites if they wish to organise their own transport or outturn domestically, and it may allow the customer to outturn from an Export Select-only site subject to the timing or the efficiency of the movement.187
Is Viterra using fees to encourage an efficient user response?
Without evidence to the contrary, Export Select appears to result in an efficient use of Viterra’s network. It is designed to help Viterra maximise throughput through its network—an outcome necessary to achieve cost competitiveness in a global market. Additionally, customers can opt out, although few choose to do so.
How do Viterra actions compare with those of its counterparts?
Viterra’s approach is not unique across Australia’s bulk grain export industry. Other grain accumulation firms also develop fee structures to encourage accumulation in a manner suited to their supply chain logistics. CBH’s Grain Express, for example, is a bundled service similar to Viterra’s Export Select, and anyone storing wheat in CBH’s upcountry storage must use it.188
4.4.5.2 Grower direct deliveries to port
Growers’ ability to deliver direct to port and bypass Viterra’s upcountry facilities could place an important competitive constraint on Viterra exercising market power upcountry. The Commission sought to identify the extent to which grower direct deliveries to port constrain Viterra (see question 3, Appendix B). If there is no competitive constraint, then the Commission must consider whether Viterra’s behaviour is consistent with the practices identified in section 4.4.5.
185 According to Viterra, Export Select ‘… allows Viterra to handle the handling and logistics task in the most efficient manner
possible. Viterra Pricing, procedures & protocols manual (2016/17), p.29, viewed 6 March 2018, available at http://viterra.com.au/wp-content/themes/viterra/documents/Pricing,%20Procedures%20and%20Protocols%20Manual%202016_17%20(Schedule%20A-L)2.pdf See also, Viterra, Response to the ACCC’s request for information Dated 15 April 2011, 5 May 2011, pp.12-13.
186 Viterra, Submission to the Inquiry into the South Australian Bulk Grain Export Supply Chain Costs, May 2017, p. 17. 187 Viterra, Response to public submissions, June 2017. 188 Productivity Commission, Wheat export marketing arrangements, 2010, p. 274. GrainCorp also has a logistics/freight offering.
Public—I2—A2 Inquiry into the South Australian bulk grain export supply chain costs 61
(a) Can growers deliver directly to port?
Viterra restricts grower direct deliveries to Port Lincoln, Port Adelaide and Wallaroo to Viterra defined Grower Delivery Zones (section F2, Appendix F). In 2016-17, 83 percent of grain exports were made through these ports. On first consideration, delivering direct to port might seem cheaper for growers, given it would eliminate one inturn and an outturn from an upcountry silo. Yet, the fee analysis189 in section F1 (Appendix F) shows, while growers delivering direct to the port of Thevenard (no delivery restriction) could save an estimated $2.80 per tonne over delivering upcountry and using Export Select, growers delivering direct to Port Lincoln and Port Adelaide are likely to breakeven relative to delivering direct to port, given the pricing structure of Export Select.
For this reason, Viterra’s pricing and operational behaviour might limit the potential for grower direct deliveries to port to constrain Viterra’s exercising of market power upcountry.
(b) Is there a sound basis for Viterra’s behaviour?
Given Viterra’s behaviour might limit the potential for grower direct deliveries to port, the Commission examined Viterra’s behaviour in terms of the practices identified in section 4.4.5.
Are there clear and practical operational reasons for Viterra’s behaviour?
Viterra accepts 25 percent of its total receivals from deliveries local to port, providing this service to growers located near the relevant port covered by a Grower Delivery Zone.190 By their location, these growers would not be expected to deliver upcountry. There appear to be sound logistical/operational reasons for Viterra’s behaviour in this regard. As an example, Viterra submitted that grain invariably ripens earlier at higher latitudes (northern):191 if growers at Waramboo (190 kilometres north of Port Lincoln)192 were permitted to deliver direct to Port Lincoln, then the silos could be full by the time the wheat of growers close to Port Lincoln had ripened. Given only 25 percent of Viterra’s storage capacity is located at port, growers close to port would be forced to either construct more on-farm storage or deliver to upcountry silos (in a direction away from the port). Either result would appear inefficient, unless the Commission receives a clear commercial case to the contrary.
In addition, Viterra submitted that accepting too much grain, or grain that is not in demand for immediate shipment, can result in the port ‘blocking’ (when the port has insufficient capacity to efficiently process grain for shipment). In this case, Viterra might invest in more storage capacity at port, assuming adequate land is available. But the resulting additional costs would be unlikely to represent an efficient investment for the supply chain, which already has total storage capacity sufficient to cope well with even the biggest harvest.
Consequently, considering Viterra’s behaviour against the assessment practices identified in section 4.4.5, it appears to have clear and practical operational reasons for behaving in these ways.
Is Viterra using fees to encourage an efficient user response?
The evidence shows Viterra is pricing (setting fees) to reinforce its logistical/operational requirements. There are not considered to be any issues with Viterra’s pricing approach in this instance.
189 Based on a fee comparison of a sample of grain pathways to port, excluding freight rates. 190 Viterra provides a direct service to nearby growers, which represents 25 percent of total receivals. Source: Viterra , Response
to public submissions, June 2017. Viterra attempts to provide growers from outside the local delivery zone an option to deliver to port on the basis of Viterra requiring the growers’ grain for shipping. Growers will be advised via SMS, if they are registered for SMS alerts.
191 Viterra response to request for information. 192 AEGIC spreadsheet for AEGIC, Australian export grains supply chains in 2017.

Public—I2—A2 Inquiry into the South Australian bulk grain export supply chain costs 62
How do Viterra actions compare with those of its counterparts?
The Commission did not review interstate operator practices in receiving grower direct deliveries to port, because Viterra’s behaviour appears to have sound logistical/operational reasons in the context of the South Australian supply chain.
On the issue of fee levels, section 4.4.3.3 compares Viterra’s total supply chain fees with those of its counterparts. Viterra’s fees do not appear to be excessive compared with the total fees charged by its eastern Australian counterparts, as shown by the fee comparison presented in Figure 4.4 (Draft Finding 4.5).
4.4.5.3 Competitor direct deliveries to port
Competitors’ ability to bypass part or all of Viterra’s facilities could place a competitive constraint on Viterra’s ability to exercise market power. The Commission sought to identify any fees charged only to competitors, and to investigate the extent to which such fees reflect actual costs incurred by Viterra (see question 5, Appendix B). If the fees do not reflect costs, then the Commission needs to consider whether Viterra’s behaviour is consistent with the practices identified in section 4.4.5.
(a) Does Viterra charge third party operators differential fees?
Viterra will accept grain for export at its ports from approved third party stores, subject to a Receival at Port Service Fee (from Approved Third Party Storage) (Receival at Port Service Fee).193 Viterra publicly justifies this fee on the basis that it:
… reflects the provision of services which are necessary to manage food quality risks in relation to grain delivered into Viterra’s network, and to protect both the integrity of the grain held on behalf of all clients and the efficient operation of Viterra facilities.194
For 2017-18, the Receival at Port Service Fee is $2.70 per tonne.195 There is a corresponding fee (Receival at Viterra Facility Fee (Ex Approved Third Party Stores)) if grain is delivered from an approved third party store to a Viterra upcountry site.
Analysis reported in section F1, Appendix F shows that the differential could increase to $6.41 per tonne, for a third party operator not permitted to access Viterra’s Outer Harbor facilities using rail.196
On the other hand, growers delivering direct to Port Adelaide appear to face a near neutral fee outcome (Table F.1).
(b) Is there a sound basis for Viterra’s behaviour?
Given Viterra’s pricing behaviour appears to disadvantage third party operators that deliver grain direct to port, the Commission examined Viterra’s behaviour in terms of the practices identified in section 4.4.5.
Are there clear and practical operational reasons for Viterra’s behaviour?
According to Viterra’s published wheat reference prices schedule, the Receival at Port Service Fee covers:
a review of grain treatment histories
193 Viterra, Wheat Reference Prices—Port Terminal Services 2017/2018, clause 2.2.3. 194 Viterra, Pricing, procedures and protocols manual, p. 15, viewed 14 May 2018. 195 Viterra, Wheat Reference Prices—Port Terminal Services 2017/2018, clause 2.2.3. 196 Viterra has advised the Commission that Outer Harbor can be accessed by rail by third party operators, but the Commission
is not aware of the extent or basis on which this occurs in practice.

Public—I2—A2 Inquiry into the South Australian bulk grain export supply chain costs 63
sampling and testing on delivery197
potential segregation and storage for risk mitigation, residue and fumigation periods
performance of road ‘chain of responsibility’ mass management procedures and requirements, including issuance of breach warnings and recording
potential fumigation to prevent cross-infestation of insects (as a precautionary measure, not for grain detected with insects).
Viterra submitted that it has no oversight or guarantee of the quality checks that third party handlers perform, so not performing its own checks would expose Viterra’s system and the grain within it to risk. Such checking should be required for all deliveries (by grower and third party operator) to any part of the supply chain, including upcountry sites. But the Receival at Port Service Fee applies only at port. Viterra’s approach thus might appear designed to direct traders using third party operators to use Viterra’s upcountry facilities and then Export Select to the port. However, it is not clear why this would be a commercial proposition under normal circumstances, as such grain could be liable for other standard Viterra fees (where delivered from third party operator facilities to Viterra’s upcountry facilities), with the potential for a duplication of fees given the grain would then be handled by two operators. In any case, it is understood that there is a similar third party fee operating upcountry.
Is Viterra using fees to encourage an efficient user response?
The Commission has yet to be able to establish that the $2.70 per tonne Receival at Port Service Fee is efficient. This fee was $2.50 per tonne in 2008-09 and increased by an average 0.8 percent per year over the past 10 years, which was an increase well below inflation for the period.198 The Commission made two formal requests of Viterra for evidence to support the Receival at Port Service Fee and its level. In response, Viterra submitted that little tonnage of grain has attracted the fee. But the Commission considers this situation, rather than demonstrating the fee’s lack of impact, might demonstrate the fee’s effectiveness in deterring competition. Viterra submitted that it is not aware of any formal complaints about the fee other than the complaint that resulted in an arbitration in 2006 (see discussion below).
How do Viterra’s actions compare with those of its counterparts?
The ACCC is monitoring the Receival at Port Service Fee for apparently the same reason that the Commission is interested in this fee.199 That is, it wants to check Viterra is not using the differential fee to third party receivals at port to advantage its own upcountry storage and handling facilities and transport services. In its bulk wheat ports monitoring report for 2015-16, the ACCC showed Viterra was charging a Receival at Port Service Fee of $2.65 per tonne for bulk wheat.200 This fee was marginally higher at the time than the amount charged by the only other two operators with such a fee that year (Emerald and Quattro, at $2.50 per tonne).201
Further, in its most recent monitoring report,202 the ACCC reported Viterra is now the only port terminal service provider charging this fee on grain received from an approved third party storage site.203
197 Grain from third party storages is charged a quality screen fee even if the third party bulk handler performed its own check
to legislative standards. 198 Viterra collected only a small amount of revenue from this fee in 2016-17. 199 ACCC, Bulk wheat ports monitoring report 2015-16, December 2016, p. 60. 200 Thee 2016-17 value for the Receival at Port Service Fee (source: Viterra, Wheat Reference Prices—Port Terminal Services
2016/17, clause 2.3.3). It increased to $2.70 per tonne for 2017-18. 201 ACCC, Bulk wheat ports monitoring report 2015-16, December 2016, p. 58. 202 ACCC, Bulk wheat ports monitoring report 2016-17, December 2017, p. 71. 203 Storage site as approved by the port terminal service provider. Quattro’s (operates in the eastern States) second tier fee
applies to third party non-approved storage without fumigation; at the time of publication, Quattro had received grain from only approved storage sites (source: ACCC, Bulk wheat ports monitoring report 2016-17, December 2017, p. 71).

Public—I2—A2 Inquiry into the South Australian bulk grain export supply chain costs 64
Quattro is the only other service provider charging such a fee, and it charges for only third party non-approved storage without adequate fumigation.
Viterra submitted to the Commission that it does not intend to remove this fee. So, in terms of the principles and factors used for this assessment (section 4.4.5), any exercise of market power would be sustained.
Is the level of fee or action broadly consistent with that adopted by Viterra’s counterparts?
As noted, Viterra is the only Australian terminal operator charging such a fee to competitors at port. Even if the Receival at Port Service Fee is considered in isolation, an additional fee of $2.70 per tonne is material. Viterra submitted that the Receival at Port Service Fee was subject to a confidential arbitration in 2006, which found in favour of Viterra. Viterra submitted that the fee has since increased by an average of less than 1 percent per year, including a freeze on the fee for six out of 10 years.204 The Commission is not privy to the detail of the 2006 arbitration, so cannot determine the extent to which it considered all the factors noted in this section.
Viterra also submitted that the published fee is a negotiable standard rate, and that it provides a discounted package to bring grain from third parties through the Viterra ports. But it offered no evidence on the level or extent to which it provides such packages.
There is some evidence, therefore, that the Receival at Port Service Fee might act as barrier to new competition or expansion by existing competitors. The Commission is not satisfied with Viterra’s response that this is not the case. The Commission’s concerns relate to the following matters:
While Viterra may have good reason to check all grain being received (even from Viterra third party approved facilities), the Commission has not received evidence that this fee is cost reflective.205
When the Commission asked Viterra why it is the only operator charging this fee (from approved storage), Viterra submitted that it had ‘no comment on why (or why not) other [port terminal operators] charge (or do not apply a fee) for this service and under what conditions’.206
Viterra submitted that it has ‘no current intention to remove this fee’,207 so any market power exercised through this fee will be sustained.
4.4.5.4 Capacity booking fee
Additional fees charged by Viterra may act as a barrier to entry or expansion if they increase the cost structure of competitors. The Commission thus sought to identify whether the terminal capacity booking fee reflects actual costs incurred by Viterra and applies to all users of Viterra’s port terminal facilities (see question 5, Appendix B), and whether Viterra’s behaviour is consistent with the practices identified in section 4.4.5.
(a) How does the fee operate?
This fee seeks to ensure overbooking of capacity does not occur. Export traders are subject to a capacity booking fee when they book Viterra’s port terminal services for loading bulk grain onto vessels for terminal capacity allocated under the PTAC arrangements. Viterra submitted that the booking fee is essentially a part payment of the total shipping fee. This fee is $5.50 per tonne from 1 October 2017.208
204 Viterra response to request for information. 205 As noted above, the Commission is not privy to the detail of the 2006 arbitration and so is not able to determine the extent
to which all the factors referred to in this section were considered in the arbitration.
206 Viterra response to request for information. 207 Viterra response to request for information. 208 Viterra, Pricing, procedures and protocols manual 2017/18, p. 5, and Wheat Reference Prices—Port Terminal Services
2017-18 fee schedule, p. 1, both viewed 16 May 2018. Viterra submitted that the 2017-18 fee is $5.00 per tonne for existing bookings and $5.50 per tonne for new bookings (source: Viterra response to request for information).

Public—I2—A2 Inquiry into the South Australian bulk grain export supply chain costs 65
(b) Is there a sound basis for Viterra’s behaviour?
The Commission examined Viterra’s behaviour in terms of the practices identified in section 4.4.5.
Are there clear and practical operational reasons for Viterra’s behaviour?
The Commission accepts the use of Viterra’s bulk grain vessel loaders has a clear opportunity cost, particularly in South Australia where there is limited spare capacity (at least at peak times). Viterra submitted that the fee reflects a cost associated with setting aside the capacity, and ensures a commitment from grain buyers. In other words, the fee reserves capacity for the trader, which creates obligations that Viterra must honour.
The ACCC approved the fee application and the method for refunds/part refunds, in consultation with stakeholders. The port loading protocols (part D, items 4–6) deal with moving, transferring and surrendering bookings. And Viterra’s Pricing procedures and protocols manual 2017/18 (clause C1, p. 17) explains how the booking fee applies. Viterra has not received any formal complaints about the capacity booking fee.
Is Viterra using the fee to encourage an efficient user response?
Viterra submitted that the fee shares the risk between traders and Viterra of traders overbooking capacity. In the case of Glencore, the fee may represent an intercompany transfer, but any overbooking of capacity would still represent a resource cost to Viterra, and thus to the combined Glencore–Viterra entity.
There may be concern that given the capacity booking fee (investigated in this section), the lost capacity fee investigated in the next section (section 4.4.5.5) duplicates the potential cost to the trader. However, the capacity booking fee seeks to ensure overbooking of capacity does not occur, whereas the lost capacity fee ($5 per tonne) seeks to ensure any capacity booked is used. In any event, the combined fees still appear to be less than the resource cost (based on Viterra’s submitted revenue forgone):209 if a trader fails to fill the capacity booked for 2017-18 in relation to Outer Harbor shipping, Viterra estimated the revenue forgone is:
the shipping fee of $12.07 to $14.65 per tonne (Port Adelaide – Outer Harbor, with fees varying across the season)
port inload fees of $3.40 to $4.70 per tonne (depending on the port, and whether road or rail delivery).
How do Viterra’s actions compare with those of its counterparts?
Interstate grain handlers charge an equivalent fee.
Is the level of fee or action broadly consistent with that adopted by Viterra’s counterparts?
The Viterra fee is below the average equivalent fee charged by similar organisations, with only CBH (Western Australia) charging a lower fee.
4.4.5.5 Lost capacity fee
Additional fees charged by Viterra may act as a barrier to entry or expansion when such fees increase the cost structure of competitors.
The Commission sought to identify whether the lost capacity booking fee reflects actual costs incurred by Viterra and applies to all users of Viterra’s port terminal facilities (see question 5, Appendix B), and whether Viterra’s behaviour is consistent with the principles identified in section 4.4.5.
209 Viterra response to request for information.

Public—I2—A2 Inquiry into the South Australian bulk grain export supply chain costs 66
(a) How does the fee operate?
This fee seeks to ensure any capacity booked is used. If a trader (including affiliated company Glencore) executes210 less than 90 percent of the terminal capacity that is the subject of a booking,211 a lost capacity fee of $5.00 per tonne applies. Viterra introduced the fee in 2014-15 at that rate, and it has remained unchanged.
The lost capacity fee is payable for capacity that is intended for execution on or after 1 October 2017 (for the 2017-18 season), regardless of when the capacity was booked. Traders can avoid this fee if they can transfer the allotted time and/or capacity to another trader. When applied, the fee is calculated on the difference between:
90 percent of the capacity that is the subject of the booking
the actual tonnes executed by the client under the booking.212
(b) Is there a sound basis for Viterra’s behaviour?
This section examines Viterra’s behaviour in terms of the practices identified in section 4.4.5.
Are there clear and practical operational reasons for Viterra’s behaviour?
The Commission accepts the use of Viterra’s bulk grain vessel loaders has a clear opportunity cost, particularly in South Australia where there is limited spare capacity (at least at peak times). The value of the lost capacity fee (this section) and capacity booking fee (section 4.4.5.4) combined is still less than the revenue forgone (section 4.4.5.4(b)).
Viterra submitted that it has not received any formal complaints about the lost capacity fee being levied.
Is Viterra using the fee to encourage an efficient user response?
Viterra submitted that it designed the fee to incentivise desired trader behaviour rather than penalise traders for non-compliance, and that:213
initial iterations of Viterra’s port loading protocols showed there is no incentive (over the forfeit of the booking fee) for clients to surrender capacity in an efficient manner (or at all)
it had identified instances when a client, with capacity they did not intend to use, was not motivated to surrender the unwanted capacity in a timely manner to allow access for a second client without capacity
under the conditions of the lost capacity fee, traders can divest themselves of capacity that they are not going to use, and thus avoid the fee or incur only part of the fee214
item 5 of Viterra’s port loading protocols under the PTAC (approved by the ACCC after consultation with the industry) sets the process for the transfer of bookings between clients
when a transfer is effected, the responsibilities associated with the slot transfer with the slot (that is, the capacity obligation is also transferred)
210 Capacity is executed if the client’s vessel arrives at the port terminal during the booking slot, or the relevant grace period,
and the tonnes are loaded onto the vessel (source: Viterra, Pricing, procedures and protocols manual, 2017/18, p. 17, viewed 14 May 2018.
211 Viterra, Pricing, procedures and protocols manual, 2017/18, p. 17, viewed 14 May 2018. 212 Viterra, Pricing, procedures and protocols manual, 2017/18, p. 18, viewed 14 May 2018. 213 Viterra response to request for information. 214 ‘Partial’ given the lost capacity fee is only levied on the specific booked capacity not used.

Public—I2—A2 Inquiry into the South Australian bulk grain export supply chain costs 67
where capacity is taken up, the lost capacity fee is reduced or removed
the lost capacity fee is used on a discretionary basis, and is not always levied in cases where communication between Viterra and the other party is transparent and a clear explanation as to unforeseen circumstances is given
the export tonnage affected by the lost capacity fee has declined significantly over the three years from 2014-15, representing less than 0.5 percent215 of exports in 2016-17.
How do Viterra’s actions compare with those of its counterparts?
Viterra’s counterparts charge an equivalent fee. ‘Take or pay’ fees are not uncommon in firms with high cost infrastructure assets (for example, rail).
Is the level of fee or action broadly consistent with that adopted by Viterra’s counterparts?
The lost capacity fee charged by Viterra has been consistently below CBH’s fee (Western Australia), with the equivalent CBH fee being $6–7 per tonne over the period 2011-12 to 2017-18.216
The Commission’s considerations in assessing this fee are the same as made for the capacity booking fee, namely that the:
use of Viterra’s loaders has a clear opportunity cost
level of fee would not appear excessive and is consistent with the level charged by industry counterparts
fee (if not the level) has been approved by the ACCC as an integral component of the PTAC.
4.4.5.6 Shrinkage and dust rates
The Commission examined Viterra’s shrinkage and dust rates as a result of stakeholder concern. In its submission to the Commission, GPSA asked:
what is the technical and financial basis for shrinkage and dust rates?
why should the grain grower making the first sale into the storage and handling system bear the cost for what growers consider to be an operational risk?217
(a) How are the rates determined?
Shrinkage refers to the ‘cost’ of the weight loss that occurs during the grain drying process in storage and handling. The shrinkage rate is this weight loss as a percentage of the original grain tonnage received. Applied to all grain delivered to a Viterra facility, the rate is 0.60 percent for wheat, barley, minor cereals and canola, and 0.85 percent for pulses.218 Viterra submitted that the shrinkage rate addresses grain volume and quality loss in normal storage and handling activities, including:
mass loss through change in moisture content
volume loss through handling and waste
quality loss while grain is stored (for example, pulses become more brittle with time)
costs associated with clean-up/removal.
215 Sourced from Viterra response to request for information. 216 Viterra response to request for information. Given that the AEGIC analysis generally shows CBH fees being the lowest, on
this occasion a comparison has not been made with eastern Australian counterparts. 217 GPSA, Submission to the Inquiry into the South Australian Bulk Grain Export Supply Chain Costs, 11 May 2017, p. 9. 218 Assuming a wheat price of $250 per tonne, shrinkage fee would be $1.50.

Public—I2—A2 Inquiry into the South Australian bulk grain export supply chain costs 68
Similar to the shrinkage rate, the dust rate accounts for changes in saleable grain volume.219 Dust is generated during grain handling. On one estimate, it comprises approximately 70 percent organic matter (which may include particles of grain kernels, spores of smuts and moulds, insect debris and field dust that becomes airborne during grain handling).220 Environmental requirements at port generally require dust capture, so at port it is feasible to measure the amount of dust generated.
An adjustment is also made to the price a grower receives for ‘dust’ losses which occur from the movement of grain to the point of vessel loading. This dust adjustment is 0.15 percent levied on all tonnes outturned by Viterra for export.221 Viterra submitted that this fee recovers the cost of extracting and disposing of dust (which arises from receiving, handling and loading grain) as per its EPA licence requirements.
(b) Is there a sound basis for Viterra’s behaviour?
This section examines Viterra’s behaviour in terms of the practices identified section 4.4.5.
Are there clear and practical operational reasons for Viterra’s behaviour?
Based on Viterra’s submission, shrinkage and dust are inevitable consequences of supply chain processes. Viterra submitted that:
its shrinkage and dust fees reflect losses, due to the nature of the commodity, that occur as the grain moves through the supply chain:
– Viterra’s shrinkage rate is based on system volume and quality losses
its shrinkage and dust fees are standard components of grain networks and represent a direct and unavoidable cost that would be incurred whether shown as a disaggregated fee (as currently occurs) or bundled into storage and handling fees
Viterra constantly reviews its practices to minimise losses, and is working towards best practice
its losses will vary each year depending on weather conditions and seasons, and other factors such as storage type:
– shrinkage rates are not directly measurable against an individual event, and shrinkage may take multiple years to be determined because grain may be in storage for multiple years222
– less capital intensive storage options (such as bunkers) have greater losses, as grain is handled more frequently and at a greater risk to weather
installing suitable measuring equipment across the network to measure actual losses would be cost prohibitive.
Is Viterra using the fees to encourage an efficient user response?
Given the nature of the ‘fee’, it is not clear that traders or growers can take any action to minimise the costs, and the shrinkage and dust rates are set independently of any action of traders or growers.
219 AEGIC, The Cost of Australia’s Bulk Grain Export Supply Chains, An Information Paper, January 2014, p.16, available at
https://aegic.org.au/wp-content/uploads/2016/04/The-cost-of-Australias-bulk-grain-export-supply-chains-Full-Report.pdf. 220 J. Boac, R. Maghirang, M. Casada, J. Wilson and Y. Jung, Size Distribution and Rate of Dust Generated During Grain Elevator
Handling, Applied Engineering in Agriculture, 2009, Vol. 25(4): pp. 533-541, available at https://www.ars.usda.gov/ARSUserFiles/30200525/417SizeDistrandRateofDust.pdf .
221 Viterra, Pricing, Procedures and Protocols Manual, p. 7, viewed 14 May 2018. This equates to 38 cents per tonne, assuming a grain price of $250 per tonne.
222 Viterra response to request for information. From conversations with Viterra, Commission understands it may take a number of years to fully clear a silo of grain, which is needed before a full reconciliation is possible to determine actual shrinkage.

Public—I2—A2 Inquiry into the South Australian bulk grain export supply chain costs 69
However, this is an instance where the fee applied by Viterra to receival from third party sites is lower, with Viterra charging a lower shrinkage rate for grain received from third party operators.223
Viterra also submitted that it is conscious of grower concerns and continually acting to minimise dust and shrinkage losses, through:224
implementing the objective of emptying grain at sites every three years
transferring knowledge across sites by moving key staff to assist other locations
ongoing cleaning as a task is performed
tarping bunkers faster (which has potential to lower waste levels but can increase labour costs)
addressing the overfilling of bunkers (and spillage), which may involve investment in automation technology
placing grid covers on overnight (which has potential to lower waste levels but can increase labour costs).
Viterra also submitted that as dust collection plants improve in removing dust from the operating environment, the extent of dust losses can increase as more dust is removed. As a result, dust rates may increase over time, even though Viterra may become more efficient in dealing with dust.
How do Viterra’s actions compare with those of its counterparts?
Viterra’s counterparts adopt similar shrinkage and dust rates.
Is the level of fee or action broadly consistent with that adopted by Viterra’s counterparts?
Viterra’s shrinkage rate is lower or equal to all of its interstate counterparts other than CBH, with CBH 0.1 percent lower. Viterra’s dust rate (0.15 percent) is lower than GrainCorp (0.30 percent) and CBH (0.25 percent).225
In relation to the practices identified in section 4.4.5:
operational factors appear to make some level of shrinkage and dust rates inevitable, with all operators applying shrinkage and dust rates
the rates adopted by Viterra are reasonable compared with those of its counterparts
the Commission accepts Viterra is actively pursuing ways to reduce shrinkage and dust, but is yet to pass on the benefits to customers (other than via lower shrinkage rates charged to receivals from third party operators).
In terms of GPSA’s submission:
the above first two points address the technical and financial basis for the rates
given all supply chain costs are ultimately passed back to growers, the grain grower selling within the storage and handling system will inevitably bear the cost.
223 Although, whether the total ‘fee’ to the customer would be lower is not clear. The fact that the grain has come from a
third party site means that it has been handled by another operator before being delivered to Viterra. That other operator might impose its own shrinkage rate on the customer. If so, the total shrinkage rate (lower Viterra shrinkage rate plus the third party operator shrinkage rate) might exceed the single Viterra shrinkage rate to other (than third party operator) customers.
224 Viterra response to request for information. 225 AEGIC, Australian export grains supply chains in 2017, forthcoming for GrainCorp. Remaining figures from operator
published information.
Public—I2—A2 Inquiry into the South Australian bulk grain export supply chain costs 70
4.4.5.7 Impact of vertical integration
The Commission investigated whether there is evidence that Viterra is using its vertical integration with Glencore to exercise market power in a sustained and material manner (see question 12, Appendix B). Glencore is the largest grain export trader operating in South Australia (by volume),226 and Viterra could benefit from the resulting scale and scope economies.
(a) Is there evidence of any behaviour issues?
Quality arbitrage
The Commission considered the potential for Viterra to take advantage of its position as a vertically integrated entity (incorporating Glencore) through quality arbitrage. This potential arises from Viterra’s knowledge of the stocks that it holds, and its ability to blend the grain under its control to extract value in addition to that paid to growers. However, the Commission understands this issue of quality arbitrage relates to the role of traders in general, so addresses this issue in section 5.4. That is, the issue is not specifically relevant to Viterra’s potential to exercise market power.
Scale and scope economies
Viterra submitted that it obtained some operational savings from having access to Glencore’s bulk buying power.227 It also submitted that, on one occasion, Glencore provided harvest shipping assistance when Viterra was finding it difficult to get traders to ship grain for the 2016-17 harvest season. On this occasion, Viterra was facing the prospect of its key sites filling to capacity. Viterra submitted that shipping assistance from Glencore kept the supply chain operating effectively, which meant it could continue to receive grain upcountry.
Draft Finding 4.7
In relation to pricing behaviour, the Commission found possible evidence of a pricing structure that potentially serves as a barrier to new competition or expansion by existing competitors (specifically, the Receival at Port Service Fee (from Approved Third Party Storage)). For many practices that may raise market power concerns, however, there are operational justifications. There is also a need to consider their cumulative impact. Given the draft finding that Viterra is currently earning reasonable financial returns, this fee, in isolation, does not provide conclusive evidence that Viterra is exercising market power.
Given the available evidence, the Commission considers Viterra’s behaviour in relation to the remaining fees and practices investigated (Export Select, grower direct deliveries to port, capacity booking fee, lost capacity fee, shrinkage and dust rates, and the impact of vertical integration) is not, on its own, detrimental to the efficiency of the supply chain.
Does the Receival at Port Service Fee (from Approved Third Party Storage) deter any stakeholder wanting access at a port? Do stakeholders have evidence that counters the Commission’s draft findings on the Viterra fees and practices investigated?
4.4.6 Whether market transparency is sufficient
Section 2.2 (Table 2.1) stated the need to investigate the extent to which the market is sufficiently informed (see question 14, Table B.1). This matter is important because markets generally work best
226 PIRSA, Submission to the Inquiry into the South Australian Bulk Grain Export Supply Chain Costs, May 2017, p. 9. 227 Viterra submitted that it secured, as a result of having access to Glencore’s bulk buying power, savings from the acquisition
of front end loaders and safety cost-related savings. It also submitted that it is pursuing other savings by leveraging off Glencore’s buying power, in areas such as the purchase of fumigant gases (which are one of the largest harvest consumable costs), future electrical infrastructure upgrades and tarpaulins.

Public—I2—A2 Inquiry into the South Australian bulk grain export supply chain costs 71
when participants are well informed. Specifically, the Commission wanted to know whether there is sufficient information available for:
growers and traders to understand the basis of the fees being charged, and to assess the merits of alternatives
growers and traders to check the reasonableness of financial returns being earned, as an indicator of the reasonableness of fee levels
competitors to make informed decisions on profitable opportunities.
Section 5.2 addresses the availability of grain stock information.
4.4.6.1 Fees
Potentially, growers face issues with fee transparency for two reasons:
First, although Viterra maintains a comprehensive list of current fees on its website, the Commission did not find it a simple exercise to determine (from that list) the total fees that would be charged for a specific grain movement. The Commission suspects growers too would not find it easy.
Second, growers generally transfer responsibility for the payment of fees to traders, on the sale of grain.228 The trader then pays Viterra and netts off the supply chain fees from the grain payment made to the grower.229 The Commission understands the trader’s payment statement to growers generally does not itemise the individual Viterra fees. As a result, even if growers understand Viterra’s published fees, they may not be able to reconcile these fees against the statement supplied by the trader.
Viterra submitted that communication and transparency of supply chain fees as part of the grain price is at the discretion of the trader.
While the export market appears highly competitive (given the number of globally significant traders operating in South Australia), it is not clear that traders consider Viterra fees as other than a simple pass through to growers. The DAWR review of the PTAC asked pertinent questions aimed at learning the extent to which traders simply pass costs back to farmers in full.230 Growers may not be able to rely on traders to act on their behalf to achieve the lowest possible Viterra fees. In such a situation, growers need to be able to monitor supply chain fees for themselves. Even if growers do not have an option to change supply chain service provider in a given season, access to transparent information is still important to enable an effective response over time. This in turn should place some pressure on Viterra to charge fees that only provide it with a reasonable financial return over time.
The Commission has no knowledge of the transparency on fees in the invoices that traders received from Viterra. However, Viterra submitted that its systems allow full tracking of grain through its system, and of fees incurred. So, it should be able to provide detailed invoices, even if it does not currently do so.
Further, some stakeholders stated more ‘transparent information’ for export traders would enhance efficiency. In particular, GPSA submitted ‘access arrangements designed to increase transparency of available capacity, pricing and stock information would be of benefit to any export marketer’.231
228 Viterra, Harvest Information 2017/18, clause 24.2. 229 Economic and Finance Committee, Hansard, 27 September 2017, pp. 157–8, and Inquiry into Issues faced by Primary
Producers, final report, p. 137. 230 DAWR, Wheat Port Code Review, interim report, p. viii. 231 GPSA, Submission to the Inquiry into the South Australian Bulk Grain Export Supply Chain Costs, 11 May 2017, p. 6.

Public—I2—A2 Inquiry into the South Australian bulk grain export supply chain costs 72
4.4.6.2 Financial information
Given the lack of financial information publicly available on Viterra’s performance (section 4.4.4.1), it is unclear whether a competitor of Viterra has sufficient information available to assess viable proposals. Further, consumers (growers and traders) do not have access to such information, as an indicator of the reasonableness of fee levels. By contrast, stakeholders in Western Australia and eastern Australia have access to the published accounts of CBH and GrainCorp respectively.
Draft Finding 4.8
The Commission found evidence that the market is not sufficiently informed, in the case of both growers and traders, and potential competitors.
If this lack of information is an issue, to what extent does it have a material impact on the efficiency of the supply chain? What is the evidence?
4.5 Conclusion
The market for freight and port services is either competitive or subject to regulatory oversight that ensures a suitable proxy to competitive outcomes. For these reasons, the inquiry focused largely on the performance and behaviour of Viterra (section 4.2). While opportunities to improve the efficiency of the supply chain will always remain, the Commission’s draft finding is that the supply chain is not demonstrably inefficient:
in terms of its costs that the Commission investigated
from both an overall and individual supply chain segment perspective
based on available facts and evidence, at this time.
While Viterra faces some competition (actual and potential), the extent to which it places effective and credible discipline on Viterra’s behaviour is not clear (section 4.3.3). The global market may place more effective discipline on Viterra’s behaviour than any local competition could (section 4.3.1).
Viterra generally seeks to provide good customer service (section 4.4.1) and, to its credit in recent years, has proven capable of reducing the operating costs of South Australia’s main grain export supply chain (section 4.4.2). Viterra also demonstrated to the Commission that it is an innovative firm with a strong focus on efficiency.
The level and trend in Viterra’s fees are consistent with the financial analysis that shows Viterra is choosing not to share efficiencies made with industry through lower fees. However, Viterra’s fees are not considered excessive (section 4.4.3).
In addition, while Viterra’s operational performance is producing good financial returns, the Commission did not assess these returns as exceeding a reasonable return for a firm with Viterra’s risk profile. The assessment of Viterra’s returns, along with advice from the Commission’s consultant (VAA), was a key input into the Commission’s investigation of whether Viterra is earning excessive returns (section 4.4.4).
Given the upward trend of Viterra’s operating surpluses, however, it is not clear whether the trend will flatten out (suggesting Viterra continues to earn reasonable returns) in the mid to long term, or continue to increase to the point that returns exceed a reasonable level. If the latter occurs, and Viterra does not adequately share its efficiency gains with its customers, then the competitiveness of the supply chain would come into question.
In relation to pricing practices, the Commission considers Viterra’s Receival at Port Service Fees (from Approved Third Party Storage) of $2.70 per tonne may serve as a barrier to new competition or

Public—I2—A2 Inquiry into the South Australian bulk grain export supply chain costs 73
expansion by existing competitors (section 4.4.5). But, as noted in section 2.2, many practices that may raise market power concerns have operational justifications. Given the conclusion that Viterra is earning reasonable financial returns, this fee does not (on its own) provide conclusive evidence that Viterra is exercising market power in this segment of the market.
There is some evidence that the market is not sufficiently informed, both for growers and traders, and potential competitors (section 4.4.6). There are potential changes to aspects of the supply chain’s functioning which, at the margin, are likely to improve efficiency and enhance the prospect of users of the supply chain obtaining a greater share of any gains made. Examples include providing greater transparency regarding fee levels and Viterra’s financial performance.
Table B.2 (Appendix B) summarises the evidence that the Commission obtained on whether Viterra is exercising market power.
The Commission would welcome evidence-based submissions on the extent to which stakeholders agree or disagree with the draft findings.

Public—I2—A2 Inquiry into the South Australian bulk grain export supply chain costs 74
Chapter summary
Grain pooling is one of many tools available to growers to manage risk. To the extent that individual growers cannot manage an issue, the grain industry should be able to manage such issues.
The public release of stock information has both strong advocates and strong opponents. To the extent that the release of more stock information has net benefits, the grain industry should be able, by itself, to achieve the best outcome.
The freight cost component of the supply chain costs should be efficient, within the current economy-wide framework for establishing road user charges and identifying road investment priorities.
It is not clear that the practice of quality arbitrage is detrimental to the overall returns achieved by the grain industry. It does not seem to be an issue for growers, so long as they receive a price commensurate to the value of their grain on the global market.
The Commission will consider further the merits of Grain Producers South Australia’s (GPSA) proposal for a statewide transport access regime (including grain storage and handling) in the light of submissions to this inquiry Draft Report. It will also consider any position reached by the Department of Agriculture and Water Resources (DAWR) in its Port Terminal Access Code (PTAC) review final report.
Chapter 4 focused on the efficiency of the supply chain in terms of the performance and behaviour of the key firms providing supply chain services. This chapter focuses on other issues.
From the Economic and Finance Committee’s primary producers’ inquiry, Recommendation 13 was:232
In the Treasurer’s consideration of the ESCOSA’s Inquiry into the South Australian Bulk Grain Export Supply Chain Costs, the Committee strongly recommends that he consider the evidence received by this Committee during this Inquiry in relation to the current issues that face primary producers in the State’s grain industry.
A variation to the inquiry terms of reference (Appendix A) requires the Essential Services Commission (the Commission) to consider the evidence provided to the Economic and Finance Committee (chapter 12 of the committee’s report). This consideration, to the extent not covered in chapter 4, covers grain pooling (section 5.1), grain stock information (section 5.2), the statewide transport access regime for grain storage and handling (section 5.5) and 20-foot containers (section 5.6).
The terms of reference also require the Commission to consider the basis on which road and rail components of supply chain costs are recovered (Appendix A), which section 5.3 addresses. Additionally, given submissions raised quality arbitrage, section 5.4 looks at this issue.
5.1 Grain pooling
Grain Producers South Australia (GPSA) submitted to the Economic and Finance Committee’s primary producers’ inquiry that growers choosing to sell to a grain pool are quoted only an estimated price, and the actual price received could be much lower. Pool providers are not obliged to pay the estimated returns, and GPSA submitted farmers thus have little or no negotiating power. GPSA suggested a
232 Economic and Finance Committee, Inquiry into Issues faced by Primary Producers, final report, 2017, p. 138.

Public—I2—A2 Inquiry into the South Australian bulk grain export supply chain costs 75
possible solution is for growers to be quoted a guaranteed pool return (net of all pool provider fees at a designated price basing point), as the minimum price paid to pool participants.233
In GPSA’s 2015-16 grower survey, 37 percent of respondents rated pool performance and transparency as having a moderate or large impact on the profitability of their grain producing business.234 Conversely, the majority of growers did not rate this matter as an issue.
The Productivity Commission considered grain pools in its 2010 wheat export marketing arrangement review. It found some merit in improving pool transparency, but it considered the change would be best undertaken by the industry (through a more detailed code of conduct), and there was no role for government.235
Some growers may be looking back to the former wheat single desk (removed in 2008), which had a compulsory wheat pooling scheme designed to protect growers from volatile wheat prices.236 In the deregulated era, pools are only one of many tools available for growers to manage risk (for example, other tools include use of the spot market and various forms of financial hedging237). Further, pools have commercial risks. Growers are still indirectly incurring cost for marketing and price risk management, through the management fees that the pool manager deducts from the pool return (which was also the case under the compulsory national pool).238
It appears fundamental to a harvest pool that the operator cannot provide the certainty that the growers seek when they do not have pre-harvest commitments (which would enable the pool operator to enter contracts with overseas customers, hedge etc.). But such a commitment would mean the grower effectively substitutes one risk (the risk that production is less than that committed) for another (the risk of less certainty in grain price received).
Draft Finding 5.1
Grain pooling is one of many tools available to growers to manage risk. To the extent that individual growers cannot manage an issue, the grain industry should be able to manage such issues.
5.2 Grain stock information
The public release of stock information has both strong advocates and strong opponents. An argument in support is that it could promote competition by encouraging a larger number of traders buying a range of grades and grain types (because traders would be more confident of sufficient supply to fill vessels). As an example, the SA Barley Advisory Committee submitted to the Economic and Finance Committee’s primary producers’ inquiry that a key problem for the barley industry is the lack of transparency around how much feed stock is being sold as malt.239 It submitted that competing traders, if they knew the quality of the feedstock, could compete and pay more, giving growers a ‘fairer price’.
An argument against is that the release of more stock information could undermine the South Australian grain industry’s global competitiveness. That is, most other countries do not release such information (or at least to the extent envisaged by advocates), so the release would benefit only global traders and end users that can react to stock information by switching their demand to other origins at short notice. South Australia is a small player in the global bulk grain export industry 233 Economic and Finance Committee, Inquiry into Issues faced by Primary Producers, final report, p. 126. 234 Economic and Finance Committee, Submission to GPSA inquiry, 21 July 2017, p. 3. 235 Productivity Commission, Wheat export marketing arrangements, 2010, p. 27. 236 Productivity Commission, Wheat export marketing arrangements, p. 46. 237 For a discussion of marketing and risk management tools, see Productivity Commission, Wheat export marketing
arrangements, Appendix B. 238 Productivity Commission, Wheat export marketing arrangements, p. 104. 239 Economic and Finance Committee, Inquiry into Issues faced by Primary Producers, final report, p. 127.

Public—I2—A2 Inquiry into the South Australian bulk grain export supply chain costs 76
(chapter 3), and its lack of scale may make it less able to recover from a lack of competitiveness resulting from asymmetrical stock information.
An initial task is to understand what specific stock information would be useful (given the information already routinely issued to the market) and what might be the benefit of its release. The Productivity Commission considered the availability of stock information in its 2010 wheat export marketing arrangement review. It characterised three tiers in the extent of data disaggregation:240
‘Tier 1’ information is stock information in its most aggregated form (namely national wheat stock information). This information is suggested to be most useful for international market participants and supports the competitiveness of the Australian wheat market in the global context.
‘Tier 2’ information further disaggregates the tier 1 information, to wheat stocks by state. This information is suggested to be useful for facilitating the operation of the Australian export and domestic wheat markets, and the interactions between those markets.
‘Tier 3’ information captures all subsequent disaggregation of stocks information (such as stock information by port zone or receival site). This information would predominantly influence the supply and demand decisions of particular economic agents in the wheat market.
Further, stock information needs to be current. Based on the Productivity Commission review, it would require the collection and release of the following information:241
grain volumes in the bulk handling and storage system, held by grain users and stored on-farm
committed (for export or domestic use) and uncommitted
new stock (carry-in) and old stock (carry-out).
The Productivity Commission considered the availability of tier 1 (national) stock information is critical for the success of Australia’s wheat export industry. But it also considered the grain industry should pay for its collection and release, given most of the benefits accrue to industry. The potential cost seems modest, with some estimates suggesting a cost of less than $1 million per year.242 Further, Viterra offers growers an ‘opt-in’ for the release of information on their warehoused stock to registered buyers.
Overall, the Commission finds for this Inquiry that no regulatory/institutional response is needed. Despite the free-rider risk (that growers that might support the information release fail to opt-in, hoping enough other growers do), regulation/institutional intervention would appear to be a blunt instrument to resolve this issue. As suggested by the Productivity Commission, growers already contribute to a number of levies that might be used as an efficient funding mechanism.
240 Productivity Commission, Wheat export marketing arrangements, p. 321. This Productivity Commission categorisation refers
only to wheat, given its inquiry was into wheat export marketing arrangements. However, it is considered that the categorisation should be applicable to all grain types.
241 Productivity Commission, Wheat export marketing arrangements, p. 296. 242 This estimate is based on the cost to industry (Australia-wide) of producing the Wheat Export Sales Survey and Grain
Handler Stock Survey, and a revamped Wheat use and stocks, Australia report through the Australian Bureau of Statistics. The cost was estimated to be around $0.85 million ($ 2012) per year (source: P. Reading, May 2012, p. 29).
Public—I2—A2 Inquiry into the South Australian bulk grain export supply chain costs 77
Draft Finding 5.2
The public release of more grain stock information has both strong industry advocates and opponents. To the extent that the release of more stock information has net benefits, the grain industry should be able, by itself, to achieve the best outcome.
If this is an issue, what additional stock information should be released? To what extent would it have a material impact on the efficiency of the supply chain? What is the evidence?
5.3 The basis of road and rail cost recovery
The Terms of Reference require the Commission to consider the basis on which road and rail components of the bulk grain export supply chain costs are recovered. This section seeks to address the following questions:
What is the current basis on which road and rail components of the supply chain are recovered?
What are the implications for the supply chain?
5.3.1 Current basis of cost recovery
Unlike other areas investigated by the inquiry, the presence of inefficient road charging would affect the efficient land transport of all commodities and services produced in the economy. The Commission did not undertake its own investigation of the basis on which road and rail components of the supply chain costs are recovered. Rather, it could rely on a considerable body of work undertaken by others with expertise in this field. In the recovery of road pavement costs, efficiency issues have been identified by the Council of Australian Governments (COAG), and assessed by agencies such as the Productivity Commission and the National Transport Commission (NTC). Solutions are being progressed at the state and national levels, to varying timelines.
Based on the literature reviewed by the Commission, there appears to be a broad consensus that heavy vehicles pay sufficient charges in aggregate to recover the cost of the infrastructure that they consume.243 However, whether recovery is achieved at the level of specific road types (particularly rural local roads and some rural arterial roads) is less certain.244 As a result, the cost of heavy vehicles using many rural local roads and lightly-used arterials may be well above the network average charge that they face.245 It is at the level of rural roads that heavy vehicles are most likely to compete with rail at the margin, given most grain farms are well away from urban centres (and thus from urban arterial and local roads). The competitive nature of the road transport industry means any under-charging of road user charges for heavy road transport would likely be fully reflected in lower than efficient road freight rates.
A fully commercial operation, such as GWA, might be expected to recover its own rail operational costs efficiently. However, because GWA has regard to road freight rates in developing its rail freight rates,246 the flow on effect of any inefficient road charges may be that GWA has difficulty fully recovering its infrastructure costs through the rail freight rates that it charges its customers.
243 National Transport Commission, Exploring the opportunities for reform: discussion paper—smart transport for a growing nation
project, 2011, p. 61, available at https://www.ntc.gov.au/Media/Reports/(8AE2B7CC-07CE-1C8B-72FD-53BCBEE67CAB).pdf. 244 Productivity Commission, Wheat export marketing arrangements, p. 292. 245 Productivity Commission, Road and rail freight infrastructure pricing, inquiry report, no.41, 22 December 2006, p. XXXVI,
available at http://www.pc.gov.au/inquiries/completed/freight/report/freight.pdf. 246 GWA has advised the Commission that its rail freight rates need to be competitive with those charged by road transport
(GWA letter to Commission dated 23 June 2017).

Public—I2—A2 Inquiry into the South Australian bulk grain export supply chain costs 78
5.3.2 Whether there are implications for the supply chain
As discussed in section 4.2.2, the road freight industry is competitive, and the freight rates charged by road transport operators to Viterra and other bulk grain customers would also be expected to be competitive. For this reason, those rates appear to be efficient from the viewpoint of the grain industry.
The Commission previously concluded that rail haulage rates for grain are constrained by the competitive rates set by road, noting GWA’s operations are also covered by the rail access regime (section 4.2.1). As a result, the Commission found the freight cost component of the supply chain costs should be efficient, within the current economy-wide framework for establishing road user charges and identifying road investment priorities.
Pending the development of a national integrated efficient pricing, funding and infrastructure investment system, initiatives are underway to improve the productivity of the road network through more responsive regulation of the road network. Road access prioritisation initiatives such as the Department of Primary Industries and Region’s (PIRSA) 90 Day Change @SA Project (Improving Road Transport for the Agriculture Industry) 247 appear to be useful approaches for addressing grain industry needs in the interim.
Draft Finding 5.3
The freight cost component of the supply chain costs is efficient, within the current economy-wide framework for establishing road user charges and identifying road investment priorities. The competitive road freight industry underpins efficient road and rail freight rates. This competition is complemented by regulatory oversight through the rail access regime.
5.4 Quality arbitrage
GPSA suggested to the Commission that Viterra takes advantage of its position to extract value for the vertically integrated entity (incorporating Glencore) through quality arbitrage.248 Such an advantage would arise from Viterra’s knowledge of the stock that it holds, and its ability to blend the grain under its control.
The Commission understands quality arbitrage to be standard practice of traders to extract the maximum value from their grain purchases. The trader would ask the operator, such as Viterra, to blend different grades of grain and prepare the blended product to a quality specification for shipment. In essence, traders combine inputs to produce a higher overall product, for which they create value and receive a commensurate return. Viterra provided the Commission with a detailed explanation of its approach to blending (box 5.1).249
247 A project status update (dated April 2017) is available at
http://pir.sa.gov.au/major_programs/improving_road_transport_for_primary_production_project_2. The project is a joint initiative of PIRSA, Primary Producers SA, and the Department of Planning, Transport and Infrastructure.
248 GPSA suggested: ‘By [Viterra] having control of vessel loading, the upstream storage and handling firms are responsible for the sampling and receival standards, controlling segregations, undertaking selected blending and reserving grains to meet customer specifications effectively making available a particular lot of grain to meet the required grade standards for a customer. There is the potential for the ‘devaluing’ of higher than specified grain by way of blending with or to lesser lower grades. It is unclear how the benefit of blending grain grades is shared amongst other holders of the same commodity in the supply chain who aspire to be sellers to international markets. The current grading system with blending benefits is impossible to quantify and any benefit may not be shared with other marketers or passed back to grain growers. There is no certainty a grain owner or warehouser will receive the same grain they paid for or harvested’. GPSA, Submission to the Inquiry into the South Australian Bulk Grain Export Supply Chain Costs, 11 May 2017, p. 5.
249 Viterra, Response to public submissions, June 2017.

Public—I2—A2 Inquiry into the South Australian bulk grain export supply chain costs 79
Box 5.1 Viterra’s explanation of its approach to blending
On receival, grain is classified by Viterra and segregated according to industry standards. Growers are issued with a record of their grade and tonnage, which has a market value based on that information and the location of the grain. Buyers bid for growers’ grain, taking ownership within the Viterra storage network.
Viterra’s bulk handling system is a co-mingled system, with multiple owners delivering like grades into the same silo, bunker or shed (cell). The benefits of a co-mingled system include the efficient use of storage and logistics that would otherwise involve significant asset duplication to perform the same volume task.
On delivery, individual loads are mixed with other loads that are within the quality specifications for an individual grade.
Co-mingling of more than one grade into a single cell occurs from time to time, for operational efficiency. It maximises the storage space by (when required):
– removing the need for the addition of another segregation
– receiving a grade that would otherwise be downgraded, delivered to another site, or not received.
These actions may increase receival efficiency and reduce turnaround times by effectively using plant and equipment, allowing more timely export to the world market.
Co-mingling does not affect the price received by the grower. Viterra must ensure stock is outturned to the grade owned by each trader.
Traders (marketers) make sales based on specific quality specifications rather than the industry standard receival grades or outturn specifications.
To meet quality specifications, grades are blended homogenously across a cargo. The ability to blend grades is reflected in the pricing to the grower of each grade. This practice creates a market for lower grades, if they can be blended at rates maintaining the required quality specifications.
Viterra argued that it and the trader (marketer) are incentivised to maximise the value of grain in the storage system. It must provide all customers (including growers who may outturn grain to themselves) with grain that meets the quality specifications of the grade in their ownership.
The co-mingled system makes it highly unlikely that a grain owner or warehouser will receive the same grain that they paid for or harvested. However, each owner will receive grain meeting the grade that they delivered or purchased.
The benefit to Viterra is limited to the fees paid to it for its services (blending and preparation for shipment). But the trader (Glencore or another trader) has created value through the blending process. As with any production process, the producer (trader), not the input supplier, gains from combining the inputs to produce the new product. Once the grower sells their grain to the trader, they forfeit the right to share in the future value created by the trader.
So, given the global trading market appears competitive, is there any evidence that growers do not receive an efficient (world) price for their grain for their trades? To date the Commission has not been provided with such evidence.

Public—I2—A2 Inquiry into the South Australian bulk grain export supply chain costs 80
The Commission is addressing this issue in Chapter 5 of the Draft Report, rather than Chapter 4, by reason of Viterra providing a service in this case. Viterra, by providing a service, does not have the opportunity to exercise market power. Glencore, or any other trader, is simply having its purchases processed in a manner that maximises the value to the trader.
While in the days of the single desk and the cooperative bulk handling model growers may have shared in the value created through the whole supply chain, it is not clear how this can be the case now. Growers have the option to form their own trading cooperatives if they consider the value creation sufficient to warrant the additional costs involved, which include locating overseas customers and supplying grain of the require specification and delivered at the time specified.
Draft Finding 5.4
It is not clear that the practice of quality arbitrage is detrimental to the overall returns achieved by the grain industry. It does not seem to be an issue for growers, so long as they receive a price commensurate with the value of the grain on the global competitive market.
5.5 Statewide transport access regime covering grain storage and handling
In submitting to the Economic and Finance Committee’s primary producers’ inquiry, GPSA advocated for exploring the merits of a statewide transport access regime:250
… the merits of a statewide transport access regime should be explored to include elements that are currently excluded from coverage in the existing regimes, such as the receival, storage and handling of our state’s grain commodities and that the interests of grain producers be recognised in any regime reviews that involve movement or sale of grain.
Streamlining/extending the regulation of aspects of the supply chain have been discussed for a number of years.251 The DAWR in its interim report responded to an ACCC submission proposing extension of the PTAC to cover upcountry grain services and/or require enhanced grain stocks reporting (section 4.2.3.2). The DAWR intends to present its final report to the Australian Government in August 2018. In its interim report, it concluded no strong evidence or arguments were presented on the need to amend substantially the PTAC, its operation or its coverage.252
Against this background, and at this stage, the Commission cannot recommend one way or another on the GPSA proposal, noting part 2 of this inquiry requires the Commission to provide options for addressing any inefficiencies identified. A key input into the Commission’s considerations will be stakeholder responses to the chapter 4 draft findings, and stakeholder views on the GPSA proposal and the DAWR’s position in its final report.
250 Economic and Finance Committee, Final Report, p. 129. 251 GPSA’s proposal is broadly consistent with a recommendation of the 2012 Select Committee on the Grain Handling
Industry, which called for a review to ‘clarify the interaction between Commonwealth and State regulations to eliminate possible duplication and simplify the procedures that are imposed on industry participants’. Source: South Australian Parliament, Final Report of the Select Committee on the Grain Handling Industry, 19 September 2012, p.8, available at https://www.livestocksa.org.au/media/Select%20Committee%20of%20the%20Grain%20Handling%20Industry%20Final%20Report%20-%20Sept%2019%202012.pdf
Similar proposals were raised by the South Australian Freight Council for the 2015 Rail Review and again for the 2017 Ports Review. In both the 2015 Rail Review and the 2017 Ports Review the Commission recommended that the Government examine the costs and benefits of greater integration of transport infrastructure access regimes in South Australia.
252 DAWR, Wheat Port Code Review, Interim Report, p.vi.

Public—I2—A2 Inquiry into the South Australian bulk grain export supply chain costs 81
Draft Finding 5.5
The Commission will consider further the merits of the GPSA proposal for a statewide transport access regime (including grain storage and handling) in the light of submissions to this inquiry Draft Report. It will also consider any position reached by the DAWR in its PTAC review final report.
5.6 20-foot containers
From the Economic and Finance Committee’s primary producers’ inquiry, Recommendation 12 was that the Minister for Transport and Infrastructure investigate the insufficient supply of 20-foot containers in the grain industry. This inquiry is not directly concerned with containerised grain exports, with the terms of reference establishing the inquiry to investigate bulk grain exports (which the Commission interprets to exclude containerised grain). Also, the Commission understands it is required to address only Recommendation 13 from the primary producers’ inquiry.
As in the case of road pricing, there appear to be forces at play outside the grain industry. In this case, grain export by containers may be economically viable only if enough containerised cargo is imported into Port Adelaide.
5.6.1 No draft finding
The Commission does not propose to comment or make a specific finding on the availability of 20-foot containers, because the issue is not directly relevant to the inquiry terms of reference.

Public—I2—A2 Inquiry into the South Australian bulk grain export supply chain costs 82
The Essential Services Commission (the Commission) seeks stakeholder views on its draft findings (consolidated in section 1.2), specific questions raised throughout this report, and any other matter related to the inquiry by Monday, 17 September 2018. The inside cover of this report explains how to make a submission. Stakeholders are reminded that in responding to the Commission’s draft findings, that this Inquiry is into the cost efficiency of the bulk grain export supply chain, rather than broader questions of pricing or equity in the grains sector, as established by the Inquiry’s Terms of Reference.
The Commission would also be pleased to meet with stakeholders, either individually or with representative organisations, to discuss the draft findings. Such meetings could be held as public forums, in Adelaide and/or regional centres, if sufficient interest is identified.253 If you or your organisation wish to meet with Commission staff, please use the contact details on the inside cover of this inquiry Draft Report.
If the Commission identifies any supply chain costs as inefficient, then part 2 of the inquiry terms of reference require the Commission to provide options to address those inefficiencies. For this reason, the Commission welcomes any suggestions for improving the efficiency of the supply chain. In making efficiency suggestions, stakeholders may wish to consider:
how to demonstrate any proposed regulatory/institutionally driven solution would achieve a net benefit, in terms of the costs of any intervention
how to ensure current third party access regimes are working effectively, which includes parties approaching regulators if they have issues (even if on a confidential basis if they do not wish to lodge a formal dispute). Any issues must be raised with clear, objective evidence.
The Commission is to provide its Final Report (including a part 2 if required) to the Treasurer by no later than 31 October 2018.
253 It would still be important to receive submissions in the absence of a formal transcript (in some form) being taken of the
proceedings of such a meeting, to enable the Commission to rely on the transcript as evidence

Public—I2—A2 Inquiry into the South Australian bulk grain export supply chain costs 83
Original terms of reference

Public—I2—A2 Inquiry into the South Australian bulk grain export supply chain costs 84

Public—I2—A2 Inquiry into the South Australian bulk grain export supply chain costs 85

Public—I2—A2 Inquiry into the South Australian bulk grain export supply chain costs 86
First variation
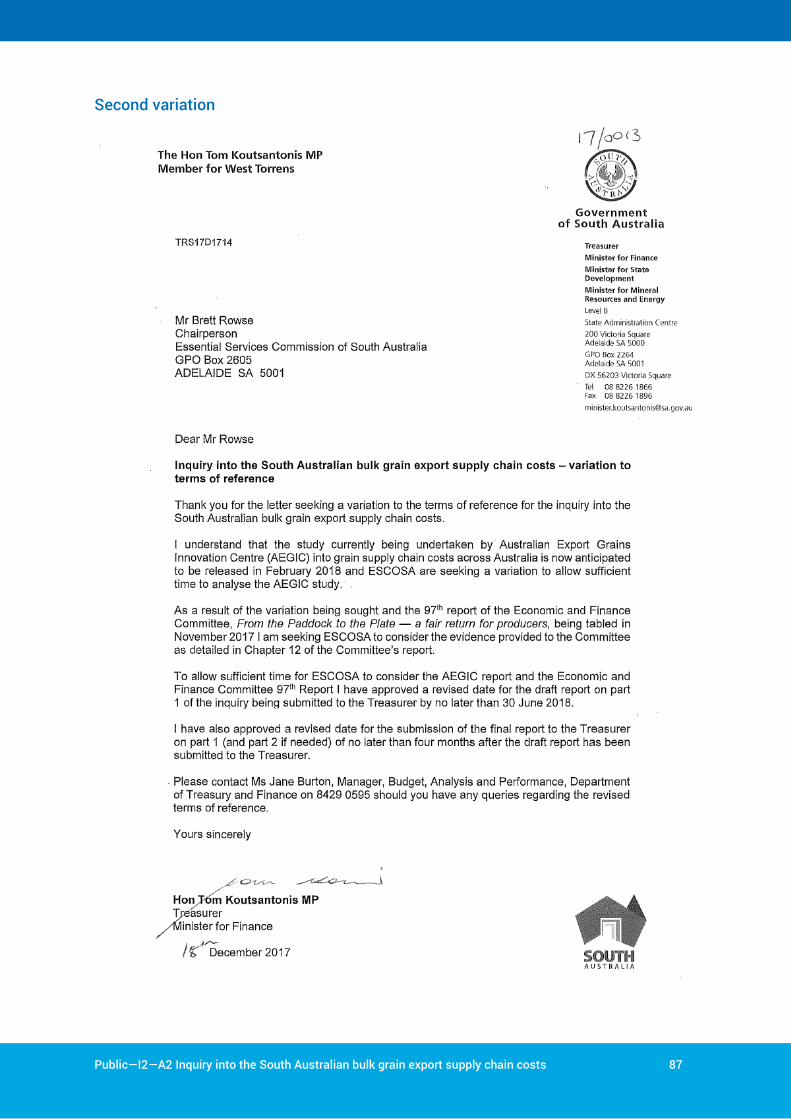
Public—I2—A2 Inquiry into the South Australian bulk grain export supply chain costs 87
Second variation

Public—I2—A2 Inquiry into the South Australian bulk grain export supply chain costs 88
Table B.1 Evidence required to assess efficiency and its interpretation
No. Question Positive Negative Evidence required
Market structure
1 To what extent does Viterra254 possess a significant market share across the supply chain?255
Positive: if Viterra possesses a significant market share across the supply chain due to falling average costs (due to scale economies)256 and the inquiry finds that a reasonable proportion of these lower costs are being passed on to customers through lower prices (fees) and/or improved service levels257
Negative: if the high market concentration results in inefficient supply chain costs
This outcome may arise if Viterra chooses to exercise market power through maintaining barriers to entry (or against expansion by existing operators) which leads to growers facing, on an on-going basis,258 prices that are higher and/or service levels that are lower than if the industry segment was competitive.259
For each major segment of the supply chain,260 for each of the defined South Australian geographic markets (Eyre Peninsula and eastern South Australia)261:
identify the number of firms operating and the trend in market share of each262
identify the level and pattern (trend) of new entrant (and exit) activity
investigate the extent of customer switching between service suppliers
investigate Viterra’s market behaviour to determine whether a reasonable proportion of any cost advantages achieved are being passed on to customers (section 4.4).
254 As discussed in chapter 4 (section 4.2), Viterra is the focus for evidence gathering for the inquiry given the Commission has previously found no evidence that market power is being exercised by
incumbent service providers of freight transport and port services. 255 The South Australian bulk grain export supply chain (supply chain), as defined for the inquiry, includes all shipments to overseas markets of commercial quantities of unpackaged (bulk) grain, but
excludes the export of containerised grain and grain sold to domestic Australian markets (Figure 3.5). The supply chain market is geographically defined to be contained within the South Australian state borders, further separated into ‘Eyre Peninsula’ and ‘‘eastern South Australia’ (section 4.3.2). While this definition does not extend to the international market (section 4.3), our analysis does not preclude consideration of the influence of the international (global) market.
256 Scale economies occur when cost per unit of output declines with increasing scale and is usually associated with a cost structure that has high fixed costs relative to variable costs. A firm with scale economies can have an incentive to attract even small parcels of additional grain providing the firm can charge fees above the variable cost associated with handling the parcels (enabling the firm to spread its fixed costs over an increased tonnage).
257 In the presence of scale economies, it is possible that splitting service delivery over a number of smaller competitive firms could result in higher overall industry supply chain costs, unless the resulting competitive pressures on costs were sufficient to offset the loss of scale economies.
258 A competitive market can experience prices above efficient cost for a period of time (section 2.2). But in a competitive market, new entrants are attracted (or existing competitors expand production) which competes away any excessive returns being earned by incumbent firms, with prices returning to efficient levels.
259 This outcome would be driven by Viterra not sharing benefits of scale effects with customers (see adjoining Positive entry) and new entrant firms struggling to compete on price if operating with higher average costs due to their smaller scale (barrier to entry).
260 The major segments here being: upcountry storage and handling; freight transport to port; and port services (Table 3.1). 261 Section 4.3.2 defines these markets. 262 Any references to ‘trend’ refer to the period covered by the inquiry. Trend is important to identify any barriers to expansion of existing operators, as well as assessing the history of any new entry.

Public—I2—A2 Inquiry into the South Australian bulk grain export supply chain costs 89
No. Question Positive Negative Evidence required
2 How competitive are upstream (e.g., growers), downstream (e.g., global grain market) and related263 markets?
Positive: even when Viterra possesses a significant market share in the bulk grain export supply chain, the level of competition existing in other markets may place some constraint (act as a countervailing power) on Viterra’s ability to exercise market power in the market as defined for the inquiry.264
Negative: if the constraint placed on Viterra by the operation of these other markets were to be so great that Viterra could not sufficiently recover costs (e.g., downstream pressures placed by global markets), then the sustainability of its operations may be placed at risk.265
Negative: to the extent that Viterra loses supply to competitors, it may result in increased average cost (due to the scale economies effect), which are not sufficiently offset by the competitive pressures acting to reduce overall industry supply chain costs.
Identify the number of firms operating, the tonnage of grain handled266 and trend, for each of the defined South Australian geographic markets (Eyre Peninsula and eastern South Australia) for the following:
upstream market: grain growers
related market: domestic trade and containerised grain exports267
downstream market: export grain traders.
Market behaviour268
3 Do competitors269 and/or customers encounter physical barriers to operating in the market?
Positive: when restrictions on access occur for sound operational reasons270
Negative: when restrictions are consciously imposed and form a barrier to entry or expansion of competitor operations (foreclosing activity), leading
Investigate the nature, extent and reasons for any restrictive activity (current and historical), including for the following areas:
263 The term ‘related’ as used here applies to the market for domestic use or containerised exports, given the same grain facilities (either owned by Viterra or a competitor) can be used to provide
services for bulk export, containerised export and domestic end use (in the case of storage facilities). 264 For example, a competitive global market may incentivise Viterra sufficiently to maintain an efficient operation or risk losing business to interstate and overseas competitors (see section 4.3.1).
As a further example, it would be expected that a vibrant domestic market would provide greater ability for growers to bypass Viterra’s upcountry storage and port facilities, reducing Viterra’s ability to exercise market power (monopoly price) in delivering these services.
265 A potential (non-Viterra) example is the Eyre Peninsula rail network; even though operated by a dominant incumbent firm, some concerns have been expressed over its sustainability. 266 From which market share can be derived. Tonnage evidence also required to assess the extent to which such markets represent a credible countervailing power (for example, a domestic market
with a 10 percent share of total grain handled would be expected to have much less influence than one representing a 50 percent share). 267 Noting Viterra supplies the domestic market from its upcountry and port storage facilities and also provides container filling services. 268 Any assessment of firm behaviour should have regard to the firm’s actions over time, not just at the time of investigation or a time in the past. 269 New or potential entrant competitors, or existing competitors seeking to expand their operations. 270 Some potential examples of sound operational reasons might include: (i) limiting direct farm to port deliveries to maximise the efficiency of port loading operations and avoid costly duplication of
storage infrastructure; and (ii) purchasing sufficient land for buffer zones, to minimise adverse impact on adjoining land use.

Public—I2—A2 Inquiry into the South Australian bulk grain export supply chain costs 90
No. Question Positive Negative Evidence required
to negative impact on supply chain efficiency
any restrictions imposed on competitors building storage facilities at or near existing Viterra upcountry sites and having access to transport facilities (such as rail sidings)
any restrictions imposed on competitors transferring grain from upcountry silos to end user (to port for export, or domestic end use)
any restrictions imposed on competitors building storage facilities and vessel loading facilities on Viterra sites at port
the extent to which Viterra owns all the strategic land at the ports (limiting ability for competitors to develop their own sites)
the outcome of any approach by competitors to access Viterra’s facilities (noting that an access regime exists covering facilities at port)
any restrictions on growers bypassing Viterra’s upcountry storage and delivering direct to port.
4 Are Viterra’s prices (fees) inconsistent with efficient cost–locational pricing principles?
Positive: if prices are instead set to maximise throughput over Viterra’s substantial fixed asset base and this can be demonstrated to result in lower overall industry supply chain costs
Negative: when pricing is used to act as a barrier to entry or expansion (for example, by dissuading new entry and forcing the early exit of new entrants), potentially resulting in Viterra being able to maintain above normal profits
Investigate the extent, if any, of Viterra’s fees exceeding efficient cost (point in time and trend), including:
extent to which Viterra adopts bundled pricing, and if so, whether such practice is consistent with efficient pricing
analysing any material differences in the level of Viterra’s fees and those of its counterparts and the reasons for any differences.
Investigate Viterra’s pricing response to new entrants and exits (or expansion) to the supply chain market, to identify any deviation in pricing approach over time.
5 Do Viterra’s competitors face any separate fees if they choose to use Viterra’s services?
Positive: if such fees reflect efficient cost incurred by Viterra to provide services to competitors
Negative: when the additional fees dissuade competition by increasing the cost structure of competitors
Identify any fees only charged to competitors and investigate the extent to which such fees reflect actual costs incurred by Viterra.

Public—I2—A2 Inquiry into the South Australian bulk grain export supply chain costs 91
No. Question Positive Negative Evidence required
6 Is Viterra earning above normal returns?
Positive: if transitory, because even competitive markets experience firms having short-term above normal returns that encourage innovation, but in time competitors act to compete away any super profits271
Negative: if above normal returns are sustained, which could indicate market power is being exercised in some form
Investigate and analyse whether Viterra’s financial returns are persistently above those that might be expected or are observed for a firm with a similar risk profile (as a potential indicator of whether prices are being set in excess of efficient cost).
Investigate the extent to which Viterra shares efficiencies achieved with its customers, including through:
lower prices
pass-through mechanisms or rebates.
7 Is Viterra a well-managed firm, receptive to customer needs and pursuing innovation?
Positive: because these are all the elements expected of an efficient competitive firm
Negative: if customers are being ‘over serviced’ leading to higher costs, to crowd out competition
Negative: running down assets to support an aggressive pricing strategy (to prop up profits in the short term)
Investigate the extent to which Viterra is:
actively pursuing lower cost solutions
investing sufficiently to maintain a sustainable asset base
providing good service to customers consistent with stated need
actively pursuing innovation, the encompassment of technological change and the achievement of product and service differentiation.
8 Has Viterra adopted a business growth strategy?
Positive: if seeking to maximise throughput to achieve lower costs and/or if meeting a service need and matching demand
Negative: if an aggressive strategy is adopted to crowd out competitors
Identify whether Viterra is adopting a business growth strategy and, if so, investigate the underlying motive, including:
the number of sites operating and trend
capacity levels and trend
level of capital expenditure, trend and forecast.
9 How does Viterra seek to retain customers?
Positive: if the strategy to retain customers involves seeking to meet their needs at a price that is reflective of cost, noting that the higher the throughput of
Negative: if restrictive practices are used to retain customers, such as Viterra subsequently refusing in some manner to service customers that are using competitors
Investigate the nature, extent and reasons for any restrictive activity by Viterra (current and historical), including for the following areas:
271 An efficient firm is entitled to a normal level of profit, commensurate with risks.

Public—I2—A2 Inquiry into the South Australian bulk grain export supply chain costs 92
No. Question Positive Negative Evidence required
grain the lower average costs should be
whether Viterra’s customers (growers and traders) are free to engage with competitors without fear of reprisal
whether services are being denied to competitors that operate their own supply chain facilities.
10 Does Viterra seek to lock customers into long-term agreements?
Positive: if Viterra is using it as a strategy to reduce risk and maximise throughput, to achieve lower costs—and the benefits of which are, at least in part, passed on to customers
Negative: if used as an aggressive strategy designed to crowd out competitors, particularly in the presence of tight capacity and were it to be targeted at particular traders272
Identify whether Viterra is pursuing long-term agreements and, if so, investigate the underlying motivations, through analysing factors such as:
trader share of port capacity against size of peak harvest.
11 Does Viterra engage in extensive product differentiation?
Positive: if the intent is to better meet the needs of its customers
Negative: if an aggressive strategy designed to crowd out competitors and results in higher costs for the supply chain
Identify the extent of product differentiation and investigate the extent to which it is driven by demonstrated customer need, including:
number of grain storage segregations and trend
how Viterra determines customer requirements.
12 Is Viterra operating in an integrated manner with its affiliate trader Glencore?
Positive: if maximises the value of the grain, noting the need for the supply chain to be efficient given South Australia is a small player in a global market
Negative: if Viterra was found to be favouring its parent trader firm to the detriment of downstream competition and value to growers
Investigate evidence of adverse market behaviour, including:
access by competitor traders to ports (identify number of firms operating, the tonnage of grain handled (market share) and trend, for each of the defined South Australian geographic markets (Eyre Peninsula and eastern South Australia))
whether Glencore gains more favourable access to grains that meet its specifications and/or access to vessel loading facilities.
272 For example, were Viterra to use long-term agreements as a device to favour its affilitate Glencore. A potential scenario might be one where: (i) Viterra encourages particular traders to use its
facilities during periods of low receivals (poor seasons) when it is keen to receive any additional grain to improve its financial returns; but (ii) blocks access in favour of Glencore during good harvests (most critical were infrastructure to be nearing full capacity) and when other traders are looking for good returns to offset low returns during poor seasons. If signalled in advance by Viterra (such as via its contracting terms), the result may act as a barrier to entry by dissuading new entrants looking to achieve reasonable returns over a full grain handling cycle.

Public—I2—A2 Inquiry into the South Australian bulk grain export supply chain costs 93
No. Question Positive Negative Evidence required
New entrant behaviour
13 What can the behaviour of competitors tell us about the competitiveness of the market?
Positive: when competitors provide a credible threat to the incumbent that spurs the incumbent to be more efficient and to share the resulting benefits with customers
Negative: when competitors lead to tonnage leakage from an incumbent operator without at least a commensurate positive impact on efficiency, overall resulting in higher cost per tonne for the industry
Investigate the extent to which:
competitors are niche-only players and, if so, why
new entrants are operating at a loss for an extended period (which would place into question the sustainability of the competition)273
new entrants ‘cherry-pick’ (with the risk that overall supply chain costs are higher).
Efficiency of market information
14 Is the market sufficiently informed?
Positive: markets generally work best when well informed.
Negative: for grain stocks an argument has been put that being too transparent may place grain growers at a global competitive disadvantage. It may prove of most benefit to overseas buyers and those bidding for grain from growers to understand how long or short Australian grain growers are.274 For example, in Western Australia following harvest growers are normally long (ample amount of grain on-hand) and hence the supply of greater detail on stocks could enable buyers to exert downward pressure on prices.
Investigate the extent to which relevant information is publicly available and, if not, the resultant impact on the efficiency of the supply chain, covering:
information available to growers and traders to enable them to understand the basis of the fees being charged and enable them to assess the merits of alternatives, and the reasonableness of the levels of such fees
information available to competitors to enable informed decisions on profitable opportunities
stock information on grain held at port terminals.
273 Noting that in a competitive market it might be expected that a new entrant operates at a loss initially. 274 Australian Senate, Rural and Regional Affairs and Transport Legislation Committee—Wheat Export Marketing Amendment Bill 2012 [Provisions], June 2012, pp. 49–50, available at
https://www.aph.gov.au/Parliamentary_Business/Committees/Senate/Rural_and_Regional_Affairs_and_Transport/Completed_inquiries/2012-13/wheatexport2012/report/index.

Public—I2—A2 Inquiry into the South Australian bulk grain export supply chain costs 94
Table B.2 Evidence obtained through the inquiry
No. Question Evidence required Evidence/inferences
Market structure
1 To what extent does Viterra possess a significant market share across the supply chain?
For each major segment of the supply chain, for each of the defined South Australian geographic markets (Eyre Peninsula and eastern South Australia):
identify the number of firms operating and the trend in market share of each
identify the level and pattern (trend) of new entrant (and exit) activity
investigate the extent of customer switching between service suppliers
investigate Viterra’s market behaviour to determine whether a reasonable proportion of any cost advantages achieved are being passed on to customers (see section 4.4).
On the evidence available to the Commission, Viterra possesses significant market share across key elements of the supply chain.
Market share Road transport—large number of operators, no material aggregate change in operator numbers over the 10 year inquiry period (section 4.2.2)
Rail—primary provider is Gensesee and Wyoming Australia Pty Ltd (GWA) for both Eyre Peninsula (EP) and eastern South Australia, with some likely loss in market share to road over the 10 year period (section 4.2.1)
General port services—current sole provider is Flinders Ports for both EP and eastern South Australia, with no change over the 10 year period (section 4.2.3)
Viterra has high market share for both EP and eastern South Australia bulk grain markets. Limited material change over the 10 year period (albeit two changes of ownership). Details as follows:
Storage market share Viterra has 103 sites (2017), down from 114 (2010) and 116 (1998). Cargill has 4 storage sites (section 3.3.2.2), all on eastern South Australia. Using the number of sites as the basis for calculating market share, Viterra’s market share is currently 94 percent.
There is also some minor upcountry storage held by other commercial entities not included in this market share calculation (section 3.3.2.3). There are no details of tonnages handled (and trends) but these other bulk handlers are understood to be small in scale, with many serving the domestic market and some providing container exports (both of which are outside the scope of this inquiry).
Total on-farm storage appears to have been static over the 10 year period and is relatively small in South Australia.
Port terminals market share From 2011-12 to 2014-15, Viterra had 100 percent of export terminal throughput, which dropped to 96 per cent (2015-16) and then 91 percent (2016-17) (section 3.3.4)—statewide figures (source: Australian Crop Forecasters). Competitors Cargill and Semaphore Container Services operate only on eastern South Australia.

Public—I2—A2 Inquiry into the South Australian bulk grain export supply chain costs 95
No. Question Evidence required Evidence/inferences
Trader market share
Glencore export trader market share (Viterra’s parent) averaged 40 percent statewide by volume over 2011-12 to 2016-17, with regional market shares of 39 percent EP and 40 percent eastern South Australia. Statewide market share for Glencore fluctuated over this period from a low of 30 percent (2014-15) to a high of 45 percent (2012-13), with an average of 40 percent statewide over the period (source: Australian Crop Forecasters).
New entrant and exit activity
Impact of new entrants reflected in market share change figures in previous section. No exits identified for storage and port terminal operators, but the number of traders fluctuates (see response to question 9).
Extent of customer switching between service suppliers Limited data. But Cargill still uses Viterra for EP exports, even though it has set up in direct competition with Viterra on eastern South Australia.
Are customers sharing in efficiencies achieved? Refer to section 4.4.
2 How competitive are upstream (e.g., growers), downstream (e.g., global grain market) and related markets?
Identify the number of firms operating, the tonnage of grain handled, and trend, for each of the defined South Australian geographic markets (Eyre Peninsula and eastern South Australia) for the following:
upstream market: grain growers
related market: domestic trade and containerised grain exports
downstream market: export grain traders.
On the evidence available to the Commission, the grain trading market appears competitive, but Viterra faces only limited competition from related markets and direct competitors.
Upstream
There were about 5000 grower trading entities in 2017 (section 4.4.1). South Australian harvest trend data is provided in Figure 3.3.
Related market
South Australia is export-focused, exporting around 85 percent of grain production (section 3.1.1). Conversely, the South Australian domestic market is small (15 percent).
Containers make up a small proportion of grain exports from South Australia, when compared with interstate. The Department of Primary Industries and Regions, South Australia (PIRSA) estimates 300,000 tonnes of grain is exported in shipping containers, compared with around 5.5 million tonnes exported annually as bulk dry cargoes.275
275 Department of Primary Industries and Regions, South Australia (PIRSA), Submission to the Inquiry into the South Australian Bulk Grain Export Supply Chain Costs, May 2017, p. 6.

Public—I2—A2 Inquiry into the South Australian bulk grain export supply chain costs 96
No. Question Evidence required Evidence/inferences
Downstream market Eleven grain traders booked shipping slot capacity with Viterra to export the 2016-17 grain harvest (section 3.3.1).
Market behaviour
3 Do competitors and/or customers encounter physical barriers to operating in the market?
Investigate the nature, extent and reasons for any restrictive activity (current and historical), including for the following areas:
any restrictions imposed on competitors building storage facilities at or near existing Viterra upcountry sites and having access to transport facilities (such as rail sidings)
any restrictions imposed on competitors transferring grain from upcountry silos to end user (to port for export, or domestic end use)
any restrictions imposed on competitors building storage facilities and vessel loading facilities on Viterra sites at port
the extent to which Viterra owns all the strategic land at the ports (limiting ability for competitors to develop their own sites)
the outcome of any approach by competitors to access Viterra’s facilities (noting that an access regime exists covering facilities at port)
any restrictions on growers bypassing Viterra’s upcountry storage and delivering direct to port.
On the evidence available to the Commission, to the extent that competitors and/or customers encounter physical barriers to operating in the market, such barriers appear to be justifiable on operational grounds. However, some pricing practices have been assessed in section 4.4.5.
Any restrictions on competitors building infrastructure upcountry?
The Commission is not aware of evidence of any restrictions imposed by Viterra on competitors building storage facilities at or near existing Viterra upcountry sites and having access to transport facilities (such as rail sidings).
Any restrictions on competitors transferring grain from upcountry to end user?
GWA is the primary provider of rail haulage of grain for export from South Australia, supplying such services solely to Viterra. The Commission has not found, or been presented with, any new evidence that market power is being (or has been) exercised in respect of the rail services provided by GWA (section 4.2.1).
The Commission is not aware of evidence of physical restrictions being imposed on competitors transferring grain from their upcountry silos. But some pricing practices are assessed in section 4.4.5, with the Commission retaining some concern that Viterra may be charging fees that potentially act to inhibit the development of third-party competition, specifically the ‘Receival at Port Service Fee (from Approved Third Party Storage)’.
Any restrictions on growers bypassing Viterra’s upcountry facilities?
Some growers are restricted in their ability to bypass Viterra’s upcountry storage and deliver direct to port. Viterra has established Grower Delivery Zones for Port Adelaide, Port Lincoln and Wallaroo (section F2, Appendix F). This matter is discussed in detail in section 4.4.5.2.
Any restrictions on competitors building infrastructure at port? The Commission is not aware of evidence that Viterra owns all the strategic land at the ports (which could limit the ability for competitors to develop their own sites). While yet to be tested through a formal dispute or complaint, competitors seeking to build

Public—I2—A2 Inquiry into the South Australian bulk grain export supply chain costs 97
No. Question Evidence required Evidence/inferences
storage facilities or vessel loading facilities on Viterra’s sites at port should be covered by the ports access regime, established by the Maritime Services (Access) Act 2000 (MSA Act) and administered by the Commission. Table 4.1 lists many new port proposals, in areas away from Viterra’s facilities, suggesting that Viterra’s current ownership of land at port, of itself, is not restricting some forms of new entry.
4 Are Viterra’s prices (fees) inconsistent with efficient cost–locational pricing principles?
Investigate the extent, if any, of Viterra’s fees exceeding efficient cost (point in time and trend), including:
extent to which Viterra adopts bundled pricing, and if so, whether such practice is consistent with efficient pricing
analysing any material differences in the level of Viterra’s fees and those of its counterparts and the reasons for any differences.
Investigate Viterra’s pricing response to new entrants and exits (or expansion) to the supply chain market, to identify any deviation in pricing approach over time.
On the evidence available to the Commission, Viterra’s pricing practices appear efficient. However, rather than locational pricing, Viterra sets fees on a whole of supply chain (network) basis, in seeking to maximise use of its network and achieve efficiencies from scale, spreading network fixed costs across the supply chain.
Extent of bundled pricing being adopted
Viterra’s Export Select is a bundled service. An analysis of Export Select is reported in section 4.4.3.1, with market behavioural aspects considered in detail in section 4.4.5.1. The Commission’s draft finding is that Viterra’s behaviour relating to Export Select is not serving to lessen the efficiency of the supply chain in and of itself (section 4.4.5.1(b)). Viterra submitted that it sets fees on a whole of supply chain (network) basis, and in doing so seeks to maximise the use of its network and achieve efficiencies from scale. This means that individual fees may not necessarily reflect costs for a specific service at any location or time (section 4.4.3.1). The Commission has not found any evidence that this results in a less efficient outcome in practice, compared with the adoption of locational pricing. Viterra submitted an example of network pricing resulting in a superior outcome (box 4.5).
To fully test the efficiency implications of Viterra’s approach, a comprehensive modelling exercise of Viterra’s fee structure relative to other hypothetical alternatives might be required. Based on the evidence available at this time, the Commission has not conducted such a study. In any event, it not clear that such an exercise would provide significant benefit, given the underlying complexity and the number and range of assumptions that would be required.
Comparing Viterra’s fees with fee levels of counterparts
Viterra’s fees are compared with its counterparts in section 4.4.3.3. Viterra’s fees do not appear excessive when compared with its eastern Australian counterparts. They are generally high when compared with CBH (Western Australia). But some reasons for this are that CBH operates under a cooperative structure, with the other operators being private shareholder-owned entities, primarily under foreign ownership. Accordingly,

Public—I2—A2 Inquiry into the South Australian bulk grain export supply chain costs 98
No. Question Evidence required Evidence/inferences
these other entities (including Viterra) have differing commercial drivers relative to CBH. As a charity, CBH also enjoys tax-exempt status for much of its operations.
Viterra’s response to new entrants Based on an investigation of fees undertaken by the Commission for a sample of grain pathways, the evidence is that over the period 2013-14 to 2017-18 Viterra’s fees in total have been relatively flat. On average, fees increased at a rate only marginally above inflation. It was over this period that Viterra faced competition commencing at Port Adelaide.
The fee sample chosen covers grain pathways on EP and eastern South Australia. The average annualised increase for Port Adelaide fees (+2.1 percent) over the period is similar to the rate of increase at Port Lincoln (+2.3 percent), both based on rail delivery to port (Table 4.5).
It might be expected that were Viterra to exercise market power against new entrants in this case, it would reduce fees at Port Adelaide (to reduce potential returns to competitors to dissuade them operating) and maintain overall Viterra revenue by increasing fees at Port Lincoln where it faced no direct competition. Consequently, flat fee movements over time at both ports does not provide direct evidence of Viterra using pricing in this manner as a strategic response export terminal competition at Port Adelaide, which was introduced in 2015-16.
5 Do Viterra’s competitors face any separate fees if they choose to use Viterra’s services?
Identify any fees charged only to competitors and investigate the extent to which such fees reflect actual costs incurred by Viterra.
Viterra’s $2.70 per tonne Receival at Port Service Fee (from Approved Third Party Storage) is the only fee identified as being charged only to competitors. This fee is discussed in section 4.4.5.3. The Commission’s draft finding is that this fee might act as a barrier to new third party operator competition or expansion by existing third party competitors.
6 Is Viterra earning above normal returns?
Investigate and analyse whether Viterra’s financial returns are persistently above those that might be expected or are observed for a firm with a similar risk profile (as a potential indicator of whether prices are being set in excess of efficient cost).
Investigate the extent to which Viterra shares efficiencies achieved with its customers, including through:
The results for this question are reported in section 4.4.4. Viterra’s returns were compared with the returns investors might require if they were to invest in a firm in a similar market and with similar characteristics to that of Viterra. The Commission’s draft finding is that Viterra’s returns, while healthy, are currently not unreasonable.
The financial analysis shows Viterra choosing not to share efficiencies with industry through lower fees. However, this would only become an efficiency concern if Viterra persistently earned above reasonable returns (section 4.4.4.3).

Public—I2—A2 Inquiry into the South Australian bulk grain export supply chain costs 99
No. Question Evidence required Evidence/inferences
lower prices
pass-through mechanisms or rebates.
7 Is Viterra a well-managed firm, receptive to customer needs and pursuing innovation?
Investigate the extent to which Viterra is:
actively pursuing lower cost solutions
investing sufficiently to maintain a sustainable asset base
providing good service to customers consistent with stated need
actively pursuing innovation, the encompassment of technological change and the achievement of product and service differentiation.
On the evidence available to the Commission, Viterra is a well-managed firm, receptive to customer needs and pursuing innovation.
Actively pursuing lower cost solutions
Viterra appears to be operating effectively as a cost-effective accumulator of bulk grain that can meet peak harvest demand and compete in the global context Viterra has achieved a consistent downward trend in real $/tonne operating costs (Figure 4.1).
Investing sufficiently to maintain sustainable asset base
Viterra submitted that it continues to invest in its existing asset base, to maintain functionality and ensure compliance with changing legislation (e.g., the provision of additional guarding in response to safe work requirements), while seeking to maximise opportunities to drive incremental efficiency through these investments. The Commission did not carry out an engineering review of the current condition of Viterra’s grain supply chain assets. But, it received financial data on annual capital expenditure and depreciation over recent years. This information, and the supporting representations from Viterra management about managing assets and planning investments, gave the Commission no cause for concern about the current levels of investment in sustaining the asset base.
Providing good customer service
The Commission’s draft finding is that Viterra generally seeks to provide good customer service, informed by the processes it has in place to capture grower customer feedback. Viterra submitted evidence about when it acted to improve customer service in responding to customer feedback. These actions are consistent with a firm seeking to meet customer needs (section 4.4.1).
In response to the record 2016-17 harvest, Viterra demonstrated itself receptive to customer needs by investing to construct 0.9 million tonnes of additional storage at short notice, to ensure timely handling and processing of grain.
In practice, it would be unlikely that Viterra could meet all customer expectations and also achieve a cost-effective supply chain capable of competing in the global market.

Public—I2—A2 Inquiry into the South Australian bulk grain export supply chain costs 100
No. Question Evidence required Evidence/inferences
Actively pursuing innovation Viterra’s submission to the inquiry provides some examples of it actively pursuing innovation, such as drive over hoppers for bunker loading and adopting leading electronic sampling and quality control devices.276
8 Has Viterra adopted a business growth strategy?
Identify whether Viterra is adopting a business growth strategy and, if so, investigate the underlying motive, including:
the number of sites operating and trend
capacity levels and trend
level of capital expenditure, trend and forecast.
On the evidence available to the Commission, Viterra is not engaging in a business growth strategy. Viterra’s business strategy appears to be one of maximising throughput to achieve lowest possible average costs per tonne, with minimal capital outlay to sustain the existing infrastructure, coupled with an ability to respond to harvest trends if needed (through the addition of low cost horizontal bunkers if, and where, seasonal demand requires).
Sites
As noted in the evidence to question 1, rather than expanding its operation, Viterra has been rationalising its storage sites from 116 (1998), to 114 (2010) and then 103 (2017). Eighty percent of the grain was received by around 30 sites in 2016 (section 3.3.2.1).
Capacity Viterra submitted that incremental storage capacity has been added over the 10 year inquiry period. Storage capacity over this period has trended up as follows:
open sites: 8.4 million tonnes (2006-07) to 10.2 million tonnes (2016-17)
total sites (including mothballed and permanently closed): 9.1 million tonnes (2006-07) to 10.8 million tonnes (2016-17).
It would appear to be a reasonable observation that the additional 2016-17 capacity was a prerequisite to maintain South Australia’s global market position.
Capital expenditure Over the 10 year period of the inquiry, Viterra submitted that it focussed on sustainment capital expenditures, with augmentation capital expenditure occurring in two phases: (i) a significant capital investment earlier in the period predominantly to fund the Outer Harbor development; and (ii) additional storage capacity added in 2010-11 and 2016-17 to meet storage requirements in large harvest seasons.
276 Viterra, Submission to the Inquiry into the South Australian Bulk Grain Exports Supply Chain Costs, May 2017, p. 16.

Public—I2—A2 Inquiry into the South Australian bulk grain export supply chain costs 101
No. Question Evidence required Evidence/inferences
9 How does Viterra seek to retain customers?
Investigate the nature, extent and reasons for any restrictive activity by Viterra (current and historical), including for the following areas:
whether Viterra’s customers (growers and traders) are free to engage with competitors without fear of reprisal
whether services are being denied to competitors that operate their own supply chain facilities.
On the evidence available to the Commission, there are no issues with how Viterra seeks to attract and retain customers.
Attracting customers Viterra submitted that it actively sought to maximise the number of traders using its port terminal facilities, to maximise throughput and as a risk mitigation measure.
Using Australian Crop Forecasters data, the number of traders using Viterra’s facilities peaked at 18 in 2014-15, dropping to 10 in 2016-17. Including all South Australian port terminal operators produces only a marginal change, with the number of traders dropping to 11 in 2016-17. It might be expected that trader numbers would fluctuate from time to time, as new operators seek to test the market. What is important is that a sufficient number of active traders are available to achieve a competitive outcome.
Freedom to engage with competitors On the evidence available, Viterra does not appear to engage in any form of reprisal activity. For example, Cargill still uses Viterra’s services on EP, even though it is in direct competition at Port Adelaide. The Commission welcomes any contrary evidence from stakeholders, if it exists.
10 Does Viterra seek to lock customers into long-term agreements?
Identify whether Viterra is pursuing long-term agreements and, if so, investigate the underlying motivations, through analysing factors such as:
trader share of port capacity against size of peak harvest.
On the evidence available to the Commission, while Viterra seeks to implement long-term agreements in a number of areas, its actions appear consistent with sound business practice or in accordance with regulatory requirements.
Pursuit of long-term agreements for rail freight
Viterra has pursued long-term agreements with GWA for rail services (section 4.4.2.3). The available evidence is that Viterra’s motivation is to achieve a good business outcome, rather than this representing evidence of an exercise of any market power. To support this claim, Viterra submitted that this long-term agreement with GWA significantly reduced Viterra’s overall freight costs, and provided GWA with sufficient certainty for it to undertake necessary expenditures to achieve the standard of service sought by Viterra.
Pursuit of long-term agreements for port terminal capacity Viterra enters into long-term agreements (LTAs) with traders for access to port terminal loading capacity. Such arrangements are consistent with protocols approved by the Australian Competition and Consumer Commission (ACCC) under the Port Terminal Access (Bulk Wheat) Code of Conduct (PTAC) (section 4.2.3.2).

Public—I2—A2 Inquiry into the South Australian bulk grain export supply chain costs 102
No. Question Evidence required Evidence/inferences
Viterra submitted that the benefits of LTAs include:277
known demand for services in the future
ability to invest in infrastructure, knowing confirmed demand
confidence to growers, knowing demand exists for their product
multiple buyers allow for competitive marketplace for grain
certainty of origin for clients
certainty of execution for clients
ability to enter multi-year supply agreements.
Under ACCC approved Viterra Port Loading Protocols, Viterra must hold back at least 2 million tonnes per year (500,000 tonnes per quarter) for short-term capacity, against a 7 million tonnes per year terminal capacity, across six port terminals (section 3.3.4).
Viterra’s long-term capacity allocations commenced from 1 October 2016,278 so the current arrangements have been in operation only for a short period. In addition, the PTAC is currently under review by the responsible Australian Government department (section 4.2.3.2).
Fees associated with these agreements, the Capacity booking fee and Lost capacity fee, have been investigated with the findings provided in sections 4.4.5.4 and 4.4.5.5 respectively. The Commission’s draft findings are that Viterra’s behaviour relating to these fees is not serving to lessen the efficiency of the supply chain. The lost capacity fee can be avoided where the unused capacity is transferred in time.
Trader share of port capacity against size of peak harvest
Trader share of port capacity was mapped against size of peak harvest, with the results showing no discernible relationship.
11 Does Viterra engage in extensive product differentiation?
Identify the extent of product differentiation and investigate the extent to which it is driven by demonstrated customer need, including:
number of grain storage segregations and trend
On the evidence available to the Commission, Viterra is not engaging in extensive/excessive product differentiation. To the extent Viterra engages in product differentiation, it appears to be in response to, or consistent with, customer demand. Viterra is unlikely to be able to meet every customer’s expectation. It is likely growers will never be fully satisfied with the level of segregation if they perceive it undervalues their specific product. So, Viterra is limited to the extent that it can meet customer expectations in a cost-effective manner.
277 Viterra response to request for information. 278 Viterra, Submission to Review of the Port Terminal Access (Bulk Wheat) Code, 29 January 2017, p. 8, available at https://haveyoursay.agriculture.gov.au/review-of-the-wheat-port-code.

Public—I2—A2 Inquiry into the South Australian bulk grain export supply chain costs 103
No. Question Evidence required Evidence/inferences
how Viterra determines customer requirements.
Product differentiation For a firm such as Viterra, product differentiation can be at the level of an individual service or differentiation for a whole package of services. Export Select is an example of Viterra seeking to achieve differentiation in an overall package of services and in doing so, make it an effective tool for encouraging and managing grain accumulation (section 4.4.3.1). Pitched at traders, it provides traders with a straightforward option for getting grain reliably onto a vessel, thereby reducing their transaction costs. The Commission’s draft finding on Export Select is that it is not serving to lessen the efficiency of the supply chain in and of itself (section 4.4.5.1).
Storage segregations and trend
Viterra submitted that for the 2016-17 harvest it provided 57 segregations.279 Viterra submitted information on the number of segregations by commodity and grade for the 10 year period of the inquiry.280 This data shows a downward trend from a high of 90 segregations in 2008-09 to 69 in 2017-18. Much of this decline can be explained by the elimination of segregations for Minor cereals (11 in 2008-09) and a reduction in the number of Malting barley segregations (reduction of 12 from 2008-09 level).
Growers gain access to information on available site segregations through Viterra’s online Ezigrain service. Viterra submitted that the segregation plan, outlining which commodities and grades will be received at each site, is structured to maximise the port terminal capacity for growers, minimise overall turnaround times and increase receivals over time.281
Further, Viterra submitted that it consults with growers in deciding on segregations, with the objective of maximising grower and export trader value.282 Viterra submitted evidence of the detailed segregation planning and setting process that occurs based on an annual cycle of activities, using grower surveys and feedback from strategic site committees and the chairs of these committees.
Determining customer requirements
Viterra submitted that it uses a combination of formal and informal (including ad hoc) methods to capture grower feedback (section 4.4.1.1).
279 Viterra response to request for information. 280 Viterra response to request for information. 281 Viterra, Submission to the Inquiry into the South Australian Bulk Grain Exports Supply Costs, May 2017, p. 16. 282 Viterra, Submission to the Inquiry into the South Australian Bulk Grain Exports Supply Costs, May 2017, p. 17.

Public—I2—A2 Inquiry into the South Australian bulk grain export supply chain costs 104
No. Question Evidence required Evidence/inferences
12 Is Viterra operating in an integrated manner with its affiliate trader Glencore?
Investigate evidence of adverse market behaviour, including:
access by competitor traders to ports (identify number of firms operating, the tonnage of grain handled (market share) and trend, for each of the defined South Australian geographic markets (Eyre Peninsula and eastern South Australia))
whether Glencore gains more favourable access to grains that meet its specifications and/or access to vessel loading facilities.
Evidence the Commission obtained to date does not support a finding that Viterra seeks to favour Glencore to the disadvantage of other traders in a material and sustained manner (section 4.4.5.7). The Commission does not currently have evidence to suggest Viterra actively discriminates against other traders; indeed Viterra submitted that it actively seeks traders as a means of mitigating operational risk (to support maximising throughput). However, noting the decline in trader numbers (question 9), the Commission welcomes any contrary evidence from stakeholders, if it exists.
Market share information was provided in response to question 1, above.
New entrant behaviour
13 What can the behaviour of competitors tell us about the competitiveness of the market?
Investigate the extent to which:
competitors are niche-only players and, if so, why
new entrants are operating at a loss for an extended period (which would place into question the sustainability of the competition)
new entrants ‘cherry-pick’ (with the risk that overall supply chain costs are higher).
On the evidence available to the Commission, Viterra faces only niche competition, but the reasons for this are not clear. In the absence of further evidence, the Commission may conclude that there are no specific actions required to improve the current situation for competitors, other than those findings detailed in the report. These findings include providing greater transparency regarding fee levels and Viterra’s financial performance, and removing fees that may inhibit the development of third party competition.
So far, the Commission has obtained only limited evidence to respond to the questions posed in the adjoining column. The Commission received no submissions from Viterra’s competitors, and discussions with some traders provided only limited insight on their motivation and future direction.
As noted in the response to question 9, there is no evidence that competitors face any threat of reprisal from Viterra. In the absence of any evidence to the contrary, it appears that existing competitors are content to undertake niche operations.

Public—I2—A2 Inquiry into the South Australian bulk grain export supply chain costs 105
No. Question Evidence required Evidence/inferences
Efficiency of market information
14 Is the market sufficiently informed?
Investigate the extent to which relevant information is publicly available and, if not, the resultant impact on the efficiency of the supply chain, covering:
information available to growers and traders to enable them to understand the basis of the fees being charged and enable them to assess the merits of alternatives, and the reasonableness of the levels of such fees
information available to competitors to enable informed decisions on profitable opportunities
stock information on grain held at port terminals.
The Commission found some evidence that the market is not sufficiently informed, for growers, traders and potential competitors (section 4.4.6).
Information on fees Even though Viterra maintains a current comprehensive list of fees on its website (though limited historical information), it is not a simple exercise to determine the costs a customer will face for a specific grain movement. Also, growers generally transfer responsibility for payment of fees to traders on sale of grain. It is not clear to the Commission that the payment notices growers receive from traders contain sufficient information to explain to growers the basis of the fees deducted for both Viterra’s supply chain services and those of the trader (section 4.4.6.1).
Financial information
Given the lack of financial information publicly available on Viterra’s performance, it is not clear that a potential market entrant (or an existing market participant) has sufficient information to assess viable proposals. Further, consumers (growers and traders) do not have access to such information, as an indicator of the reasonableness of fee levels. This situation contrasts with competitors in Western Australia and eastern Australia, who have access to the published accounts of CBH and GrainCorp respectively (section 4.4.6.2).
Stock information
The grain industry has a range of views about public release of stock information, with some strong advocates and some strong opponents. Arguments in support include that it would promote competition; arguments against include that the release of more stock information would undermine the South Australian grain industry’s global competitiveness (section 5.2).

Public—I2—A2 Inquiry into the South Australian bulk grain export supply chain costs 106
C1 Information collection
The Essential Services Commission (the Commission) sought information from Viterra and Genesee and Wyoming Australia Pty Ltd (GWA) on a number of matters through a request for information process. That information was supplied as requested.
Viterra was prepared to engage with the Commission in a cooperative manner, providing the Commission was prepared to respect the confidentiality of Viterra’s information. As a result, at this time, the Commission has decided not to disclose information in this report, in part or in total, which is subject to such a claim.
As a matter of course, the Commission does not disclose information when it is satisfied that information is confidential, unless compelled to by law (for example, by the Freedom of Information Act 1991 or the Data Sharing Act 2016) or when it decides it is clearly in the public interest to do so.
C2 Process for verification of information
The Commission sought to verify the accuracy of data submitted by Viterra and used for the purposes of the inquiry, as follows:
(1) Operating revenues and costs of Viterra
Viterra provided details of the operating revenue and operating expenses for its grain storage and handling business. These were based on internal reports run against Viterra financial systems to compile relevant revenues and costs, and recast from calendar years to harvest years (1 October to 30 September). Commission staff substantiated the level of costs and revenues by sighting internal management accounting reports, through further discussions with Viterra, and via written Request for Information (RFI) queries, to ensure costs were comprehensive (for example, to understand the level of business overheads included).
(2) Other information received from Viterra
All information received from Viterra in response to RFIs was cross-checked with existing information previously received, both from Viterra and from other sources. Any inconsistencies were then rechecked with Viterra, to ensure accuracy.
(3) Fees analysis
The analysis of Viterra fees was based on information published by Viterra on an annual basis, as part of its grain handling and storage operations (for example, Viterra’s Pricing, procedures and protocols manual (schedule A), and Wheat Reference Prices—Port Terminal Services).
(4) Written assurance
Viterra provided the Commission with written assurance that the data and information Viterra provided to the Commission (both through the RFI process, and in meetings and discussions), for the purposes of the Commission’s Inquiry into the South Australian bulk grain export supply chain costs, is accurate, and that Viterra has not subsequently become aware of any material inaccuracies in any of the data and information provided. Further, Viterra advised the Commission that if, after providing this assurance, it became aware that anything it has provided is inaccurate, it would advise the Commission, and provide the correct updated data or information.

Public—I2—A2 Inquiry into the South Australian bulk grain export supply chain costs 107
(5) VAA financial returns benchmarks
The base financial returns information for the comparator firms was sourced by Value Adviser Associates Pty Ltd (VAA) from Bloomberg financial and capital market data service. Commission staff then carried out checks on the VAA financial analysis modelling.

Public—I2—A2 Inquiry into the South Australian bulk grain export supply chain costs 108
D1 Estimation of Viterra asset values
Asset values were estimated using a combination of publicly available information, and information provided by Viterra. The following text explains the approach taken.
The Essential Services Commission (the Commission) used two methods to establish a lower and upper bound range for the value of Viterra’s assets.
Method 1—Roll forward from 2009 sale
Australian Barley Board (ABB Grain) was sold to Viterra in September 2009, in an open market transaction, for $1655 million. The Commission derived an asset value at 2017 by rolling forward this value, accounting for all subsequent capex and depreciation, and the one significant asset sale (Joe White Maltings, $420 million, August 2013).
This value is consistent with the asset value held on Viterra’s books. Viterra contends, however, that this is not an appropriate base to assess returns, due to the acquisition accounting impacts on these values. In Viterra’s view, these accounting impacts deflated the book value of the remaining assets. The Commission accepts that the sales values, and the accounting treatment of these values, have the potential to deflate the asset value held in Viterra’s books.
The Commission used this method to establish a lower bound asset value.
Method 2—Remaining useful life of assets
As an alternative method, the Commission considered the remaining useful life of the assets to establish a fair asset value.
The Commission compared the sale price in September 2009 of $1655 million with the estimated replacement value of assets at that time. This comparison provided an indicative view of the remaining useful life of the assets at 2009. The Commission then rolled this asset life forward to 2017, accounting for the assets continuing to age, offset by capital investment in new and replacement assets across this period.
Applying this derived 2017 remaining useful life to the current indicative asset gross replacement value, as provided by Viterra, provides an alternate asset valuation.
The Commission recognises this method relies on an indicative asset replacement value provided by Viterra, and is based on its estimates of current construction costs. Therefore, a revaluation of assets to 2017 prices is implicit in this method.
The Commission used this method to establish an upper bound asset value.
Mid-range asset value
To calculate Viterra’s returns, the Commission used a mid-point asset value between these lower and upper bound values.
The Commission’s considers this estimate is a prudent approach that makes best use of the available information, to derive an asset value on which to estimate Viterra’s returns.

Public—I2—A2 Inquiry into the South Australian bulk grain export supply chain costs 109
D2 Derivation of returns
The Commission derived Viterra’s returns for the 2010–2017 period using the following method:
Inputs
The following input information was used to calculate Viterra’s returns:
Operating revenue and operating expenses were provided to the Commission by Viterra.
Asset values were derived as explained in section D1.
Interest rates were based on Reserve Bank of Australia cash rates, with a risk premium added (based on advice received from Value Adviser Associates Pty Ltd (VAA)).
Depreciation was based on information provided by Viterra.
Corporation tax was assumed to be constant at 30 percent.
Calculation of net profit after tax
The above inputs were used to calculate notional net profit after tax, as follows:
$
Operating revenue a
less Operating expense b
Operating surplus/deficit c=a–b
less Depreciation d
less implied Interest e
Net profit before tax f=c–d–e
less Corporation tax g
Net profit after tax h=f–g
Gearing
The return on equity (RoE) calculation depends on the level of gearing of the firm.
The Commission used 30 percent and 50 percent gearing scenarios to estimate values for RoE. Discussions with VAA confirmed this range forms a conservative estimate of the levels of debt that a firm in a similar market, and with similar characteristics to that of Viterra, could carry, were it operating as a stand-alone firm.

Public—I2—A2 Inquiry into the South Australian bulk grain export supply chain costs 110
D3 Financial analysis measures
The key financial measures were then calculated based on the above information, as follows:
1) Return on equity (RoE)—defined as:
Net profit after tax (NPAT)
Shareholder equity (average for year)
This ratio provides a measure of the ultimate return to shareholders on their investment. It is widely used in comparing performance, both over time and between entities.
2) Return on assets (RoA)—defined as:
Earnings before interest and tax (EBIT)
Total assets (average for year)
This ratio provides a measure of how well a firm is using its assets to generate returns. It is also widely used in comparing performance, both over time and between entities.
3) Return on invested capital (RoIC)—defined as:
Net operating profit after tax (NOPAT)
Invested capital (Debt +Equity)
The numerator is based on operating profit (that is, it excludes abnormal items, such as adjustments for gains/losses on currency exchange/hedges). For this reason, this ratio provides a measure of the underlying operating performance of a firm.
While RoIC is less widely used than RoE or RoA, it is arguably more useful in comparable firm analysis, because one-off items that have the potential to skew the results are removed from the ratio.

Public—I2—A2 Inquiry into the South Australian bulk grain export supply chain costs 111
The following tables provide a detailed breakdown of fees for each of the four grain pathways in Table 4.5.
Table E.1 Cummins to Port Lincoln, by rail
Fee category 2013-14 $/tonne
2017-18 $/tonne
Total increase over period
Average annualised
Increase
Upcountry storage and handling
Upcountry receival $11.85 $12.90
Upcountry outturn $2.60 $2.95
Export Select rebate –$1.10 –$0.60
Storage (3 months) $3.15 $3.61
Total $16.50 $18.86 +14.3% +3.4%
Freight
Freight to port $8.46 $8.25 –2.5% –0.6%
Port services
Port inloading $3.00 $3.40
Port handling and shipping fee $13.20 $14.81
Capacity booking fee $5.00 $5.50
Total $21.20 $23.71 +11.8% +2.8%
Total fees $46.16 $50.82 +10.1% +2.4%
Source: Commission estimates using publicly sourced Viterra fee schedules.

Public—I2—A2 Inquiry into the South Australian bulk grain export supply chain costs 112
Table E.2 Warramboo to Thevenard, by road
Fee category 2013-14 $/tonne
2017-18 $/tonne
Total increase over period
Average annualised
Increase
Upcountry storage and handling
Upcountry receival $11.85 $12.90
Upcountry outturn $2.60 $3.40
Export Select rebate –$1.10 –$0.60
Storage (3 months) $3.15 $3.61
Total $16.50 $19.31 +17.0% +4.0%
Freight
Freight to port $28.11 $27.75 –1.3% –0.3%
Port services
Port inloading $4.25 $4.70
Port handling and shipping fee $15.35 $17.49
Capacity booking fee $5.00 $5.50
Total $24.60 $27.69 +12.6% 3.0%
Total fees $69.21 $74.75 +8.0% 1.9%
Source: Commission estimates using publicly sourced Viterra fee schedules.

Public—I2—A2 Inquiry into the South Australian bulk grain export supply chain costs 113
Table E.3 Roseworthy to Outer Harbor – Port Adelaide, by road
Fee category 2013-14 $/tonne
2017-18 $/tonne
Total increase over period
Average annualised
Increase
Upcountry storage and handling
Upcountry receival $11.85 $12.90
Upcountry outturn $2.60 $3.40
Export Select rebate –$1.10 –$0.60
Storage (3 months) $3.15 $3.61
Total $16.50 $19.31 +17.0% +4.0%
Freight
Freight to port $9.55 $9.51 -0.4% -0.1%
Port services
Port inloading $4.25 $4.70
Port handling and shipping fee $13.20 $14.65
Capacity booking fee $5.00 $5.50
Total $22.45 $24.85 +10.7% +2.6%
Total Fees $48.50 $53.67 +10.7% +2.6%
Source: Commission estimates using publicly sourced Viterra fee schedules.

Public—I2—A2 Inquiry into the South Australian bulk grain export supply chain costs 114
Table E.4 Tailem Bend to Outer Harbor – Port Adelaide, by rail
Fee category 2013-14 $/tonne
2017-18 $/tonne
Total increase over period
Average Annualised
Increase
Upcountry storage and handling
Upcountry receival $11.85 $12.90
Upcountry outturn $2.60 $2.95
Export Select rebate –$1.10 –$0.60
Storage (3 months) $3.15 $3.61
Total $16.50 $18.86 +14.3% +3.4%
Freight
Freight to port $15.91 $16.01 +0.6% +0.1%
Port services
Port inloading $3.00 $3.40
Port handling and shipping fee $13.20 $14.65
Capacity booking fee $5.00 $5.50
Total $21.20 $23.55 +11.1% +2.7%
Total Fees $53.61 $58.42 +9.0% +2.1%
Source: Commission estimates using publicly sourced Viterra fee schedules.

Public—I2—A2 Inquiry into the South Australian bulk grain export supply chain costs 115
F1 Fee analysis
This fee analysis supports the market power analysis presented in section 4.4.5 for the following three Viterra fees/practices:
Export Select (section 4.4.5.1)—does this bundled service and its pricing present any adverse competition concerns?
growers’ direct deliveries to port (section 4.4.5.2)—is it viable for growers to bypass Viterra’s upcountry storage services and, therefore, provide competition to Viterra’s upcountry services?
competitors’ direct deliveries to port (section 4.4.5.3)—is it viable for commercial third party operators to bypass Viterra’s upcountry storage services and, therefore, provide competition to the Viterra’s upcountry services?
The Commission used a sample of four grain pathways to port (box 4.6), for two reasons. First, this sample is the minimum necessary to provide sufficient breadth of analysis, given the two adopted local markets (the Eyre Peninsula and eastern South Australia), the two transport modes of delivery to port (road and rail), and the existence of Viterra Grower Delivery Zones covering some ports (section F2). Second, the sampling accounts for the multiple pathways and different times of the year for delivering grain to the state’s six ports, and for the different warehousing times. Further, some Viterra fees vary with the time of the year when Viterra provided the service.
Table F.1 presents the fee comparison of the four supply chain pathways, with each pathway comparing an Export Select service with a non-Export Select service. The Export Select fee is only a component of the fees in Table F.1, which covers upcountry outturn, port inloading and the Export Select rebate. However, for ease of expression, table columns 2, 4, 6 and 8 are called the Export Select option.

Public—I2—A2 Inquiry into the South Australian bulk grain export supply chain costs 116
Table F.1 Comparison of fees across four sample supply chain pathways, for Export Select and non-Export Select—major wheat season, 2017-18 ($ per metric tonne)
Fee category (column 1)
Cummins to Port Lincoln
Rail
Export Select
(column 2)
Cummins to Port Lincoln
Road
Grower direct
(column 3)
Waramboo to Thevenard
Road
Export Select
(column 4)
Waramboo to Thevanard
Road
Grower direct
(column 5)
Roseworthy to Outer Harbor
Road
Export Select
(column 6)
Roseworthy to Port Adelaide -Inner Harbour
Road
Grower direct
(column 7)
Tailem Bend to Outer Harbor
Rail
Export Select
(column 8)
Tailem Bend to Port Adelaide -Inner Harbour
Road
Third party operator283
(column 9)
Upcountry receival $12.90 – $12.90 – $12.90 – $12.90 $9.75
Upcountry outturn $2.95 – $3.40 – $3.40 – $2.95 $6.55
Port inloading $3.40 $16.65 $4.70 $16.65 $4.70 $16.65 $3.40 $7.40
Export Select rebate –$0.60 $0.00 -$0.60 $0.00 –$0.60 $0.00 –$0.60 $0.00
Storage (three months)284 $3.61 $5.18 $3.61 $4.56 $3.61 $5.18 $3.61 $3.61
Port handling and shipping
$14.81 $14.81 $17.49 $17.49 $14.65 $16.46 $14.65 $16.46
Capacity booking $5.50 $5.50 $5.50 $5.50 $5.50 $5.50 $5.50 $5.50
Total $42.57 $42.14 $47.00 $44.20 $44.16 $43.79 $42.41 $49.27
Difference –$0.43 –$2.80 –$0.37 $6.86
Source: Viterra published fees285 and GrainFlow published fees286
283 For a trader using a third party operator permitted to export from the Outer Harbor terminal, the difference would be $3.75 rather than $6.86 per tonne. 284 The storage fee of $3.61 for Export Select is the three month fee covering storage at the Notional Port, with grain potentially stored at an upcountry site (to be transported to port for just in time
loading). For grower direct to port, the storage fee is the relevant storage at port fee. For the third party operator pathway (as discussed in section F1 (d)), limited storage time at port is assumed, so the storage fee relates to the upcountry storage fee charged by the third party operator.
285 Viterra, Pricing, procedures & protocols manual, 2017/18 and Wheat Reference Prices—Port Terminal Services 2017/18 (published) 286 For third party operator fees in column 9 covering upcountry receival, upcountry outturn and three months storage (January to March), available at
https://www.grainflow.com.au/doc/1432087722643/gfpricebook-sa.pdf.

Public—I2—A2 Inquiry into the South Australian bulk grain export supply chain costs 117
Box F.1 further details the assumptions used to develop the fees in Table F.1. It also explains why this analysis, as opposed to the fee analysis in section 4.4.3.2, does not include freight rates.
Box F.1 Assumptions underpinning the fees in Table F.1
The fees are based on grain receival in December, with three months storage, then outturn to vessels in March.287 They reflect, therefore, the fees that customers face in a typical peak period. Further, adoption of a three month storage period is consistent with the storage period that AEGIC used. Such a period would appear conservative, noting that it can be up to three months before 90 percent of grain is sold by a grower to a trader (section 3.3.1), after which a trader must then organise export through a terminal.
Table F.1 does not include freight rates because: a direct comparison of fees across the four grain pathways (comparing Viterra’s fees other than
Export Select Freight Rates) would be more difficult if fees also varied across the pathways as a result of different distances to port
the cost of freight for the grower and third party operator direct deliveries to port are not known, whereas the other fees are known or can be reliably estimated
sections 4.4.3.2 and 4.4.3.3 contain the Commission’s analysis of total upcountry-to-vessel loading fees.
Here is an explanation of the basis of, and results for, each of the four grain pathways:
(a) Grower direct—Cummins to Port Lincoln (Table F.1, columns 2 and 3)
This pathway seeks to compare (i) the supply chain cost for a grower on the Eyre Peninsula, located within Viterra’s Port Lincoln Grower Delivery Zone, delivering by road direct to Port Lincoln (column 3), with (ii) the equivalent cost for the grower delivering to a Viterra silo located at Cummins, and the grain then being delivered to Port Lincoln by rail using Export Select (column 2). The Commission selected this pathway to understand the extent to which Viterra might use Export Select as a device to capture grain into its network. On first consideration, direct delivery to port seems to be cheaper than the double handling when a grower delivers upcountry and then the grain is outturned for delivery to port.
In addition, comparing column 2 fees (Export Select) with equivalent Export Select fees for the other pathways helps identify the extent to which fees differ according to:
the market, by comparing column 2 (Eyre Peninsula) with column 8 (eastern South Australia)
the mode of transport delivery to port, by comparing column 2 (rail delivery) with column 6 (road delivery).
Notably, in the absence of freight rates, there is very little difference in the overall fee incurred by a grower delivering direct to Port Lincoln compared with the Export Select equivalent (around $0.40 per tonne lower). This suggests that the avoidance of double handling is not as material as might be expected. Viterra submitted that many ports cannot avoid double handling, because grain received from the grower is placed in a non-shipping position and then requires some movement to a shipping position before being loaded onto a vessel.
As noted, this analysis excludes freight costs. However, given the finding that Viterra is an efficient contractor of freight services (section 4.4.2), Viterra’s Export Select freight rates would likely be
287 Viterra submitted that March is the peak shipping month based on a 10 year average (source: Viterra response to request
for information).

Public—I2—A2 Inquiry into the South Australian bulk grain export supply chain costs 118
cheaper than those for a grower located close to Cummins choosing to deliver direct to Port Lincoln.288 The Export Select product (which likely includes lower freight rates and higher service reliability) is discussed in more detail in section 4.4.3.1. So, rather than a small positive differential to the grower in this instance (comparing column 2 with column 3), it may be negative or zero when accounting for freight rates.
Further, Table F.1 does not factor in any on-farm storage costs. So, when considering those costs plus freight rates, it is not clear whether any grower benefits, in terms of supply chain cost, from delivering direct to port. Indeed, a grower is likely to benefit only if delivering straight from harvest (and, therefore, not incurring on-farm storage costs) and/or the grower freight costs are much lower than those charged under Export Select.289
(b) Grower direct—Warramboo to Thevenard (Table F.1, columns 4 and 5)
This pathway seeks to compare (i) the supply chain cost for a grower on the Eyre Peninsula, delivering by road direct to Thevenard (column 5), with (ii) the equivalent cost for the grower delivering to a Viterra silo located at Warramboo,290 and the grain then being delivered to Thevenard by road using Export Select (column 4). Thevenard is not covered by a Viterra Grower Delivery Zone (section F2).
Notably, growers delivering to a port that is not covered by a Viterra Grower Delivery Zone may save around $3.00 per tonne ($2.80) on Viterra fees, when excluding on-farm storage costs and freight rates. Once on-farm storage costs and freight rates are included, this (absolute) differential might be eroded, but the fee relativities should still hold. That is, a grower delivering direct to a port not covered by a grower delivery zone should face materially lower fees.291
(c) Grower direct—Roseworthy to Port Adelaide (Table F.1, columns 6 and 7)
This pathway seeks to compare (i) the supply chain cost for a grower on eastern South Australia, located within Viterra’s Port Adelaide Grower Delivery Zone, delivering by road direct to Port Adelaide (column 7), with (ii) the equivalent cost for the grower delivering to a Viterra silo located at Roseworthy, and the grain then being delivered to Port Adelaide by road using Export Select (column 6). This scenario assumes Viterra would use Export Select to deliver to Outer Harbor, whereas a grower could deliver direct to only Inner Harbour (because Outer Harbor has no warehouse storage). Viterra submitted that Outer Harbor has no storage, with just in time 60,000 tonne capacity.292
Similar to sample pathway (a), the result for pathway (c) is a small differential in total Viterra fees, excluding freight and on-farm storage costs.
(d) Competitor direct—Tailem Bend to Port Adelaide (Table F.1, columns 8 and 9)
This pathway seeks to compare (i) the supply chain cost for a competitor third party operator on eastern South Australia, located outside Viterra’s Port Adelaide Grower Delivery Zone, delivering by road direct to Port Adelaide (column 9), with (ii) the equivalent cost for a competitor delivering to a Viterra silo located at Tailem Bend, and the grain then being delivered to Outer Harbor by rail using
288 This result does not mean the efficiencies achieved have been fully passed on to customers, as this inquiry found
(Draft Finding 4.6). However, Viterra submitted that Export Select delivers efficiency across the industry, with road and rail operators gaining access to larger volumes than provided by each individual trader. The benefits are then reflected in pricing and service offerings. Source: Viterra, Submission to the Inquiry into the South Australian Bulk Grain Export Supply Chain Costs, May 2017, p. 17.
289 AEGIC estimated the cost of three month on-farm storage to be $18.81 per tonne (Source: AEGIC, Australian export grains supply chains in 2017, forthcoming, Figure 5). Viterra submitted that some growers prefer local sites even though the fee is higher than for other sites, on the basis that they can create more value.
290 Warramboo is located 190 kilometres north, north west of Port Lincoln and 240 kilometres north west of Thevenard. 291 Given road freight rates for an equivalent distance should not vary by type of port, the $2.80 per tonne differential between
pathways (a) and (b) should reflect the underlying differences in fees (for delivering to a port covered by a Grower Delivery Zone and delivering to one that is not covered). Also, on-farm storage costs should be similar across growers for a given storage and handling specification, so should not influence any comparison of grain pathways.
292 From notes of a meeting between Commission and Viterra staff on 6 February 2018.

Public—I2—A2 Inquiry into the South Australian bulk grain export supply chain costs 119
Export Select (column 8). It seeks to address the case where a third party operator was not permitted to access Viterra’s Outer Harbor facilities using rail. An action potentially in Viterra’s discretion were it to exercise market power. Viterra has advised the Commission that Outer Harbor can be accessed by rail by third party operators, but the Commission is not aware of the extent or basis on which this occurs in practice.
The costing for the competitor third party operator pathway (Tailem Bend to Port Adelaide – Inner Harbour) is the only pathway that does not incorporate a Viterra three month storage fee; instead, it includes a GrainFlow storage fee (Table F.1, column 9).293 This scenario assumes grain received by Viterra at port from a third party operator does not attract a Viterra storage fee, consistent with Viterra submitting294 that grain from an approved third party storage would normally be transferred in a short time to the vessel nominated.295 But, because the total fees incurred are relevant in this fee comparison (excluding freight rates for both Export Select and the third party operator path), it is important to include a storage fee for the cost that would be incurred upcountry and charged by the competitor third party operator (namely, the GrainFlow $3.61 per tonne fee in Table F.1, column 9).
Notably, the comparison (column 9 compared with column 8) shows a trader using a third party operator paying nearly $7.00 per tonne ($6.86) more than the alternative Export Select pathway.
However, the total of GrainFlow’s upcountry receival fees, upcountry outturn and three month storage fees ($19.91) is more than the equivalent charged by Viterra ($19.46), by a difference of $0.45 per tonne. So, if only Viterra fees are considered, in this example the trader pays $6.41 per tonne more for the services received from Viterra.296 This difference is calculated by comparing only the fees for port inloading, the Export Select rebate, port handling and shipping fees, and the capacity booking fee, which totalled $29.36 in column 9 and $22.95 in column 8. This result is a better reflection of the impact of Viterra’s pricing practices for this scenario.
293 Viterra charges a monthly storage fee for bulk wheat on hand at the first of each month, with no additional storage costs
charged during the first calendar month. The equivalent Viterra storage fee for three months would be $5.18 per tonne. The fees used are GrainFlow’s, taken to be at Pinnaroo, because Cargill does not have facilities at Tailem Bend (the site used for Viterra fees).
294 From notes of a meeting between Commission and Viterra staff on 6 February 2018. 295 Whereas a grower could intend to store grain (warehouse) for some time if delivering direct to port. Given the storage
component, Viterra expects the typical grower’s total Viterra fee would be higher than the Viterra fee incurred by an approved third party storage operator. Table F.1 confirms this expectation: the total grower direct to Port Adelaide – Inner Harbour fee of $43.79 per tonne is higher than the Viterra fee of $29.36 per tonne paid by a trader using a third party operator (derived by subtracting the total of the GrainFlow substituted fees [$19.91] from the total fee of $49.27 per tonne).
296 The additional $6.41 per tonne comprises: receival at port fee ($2.70 per tonne); additional port inloading fee due to use of road rather than rail ($1.30 per tonne); no Export Select rebate ($0.60 per tonne); and higher port handling and shipping fee due to operating out of Port Adelaide – Inner Harbour rather than Outer Harbor ($1.81 per tonne). Even if rail were an option for third party operators, clause 2.2 of Viterra’s Wheat Reference Prices Explanatory Notes states any third party rail access may incur additional fees. Viterra advises that it performs rail services from third party sites, but the Commission is not aware of the extent or basis on which this occurs in practice.
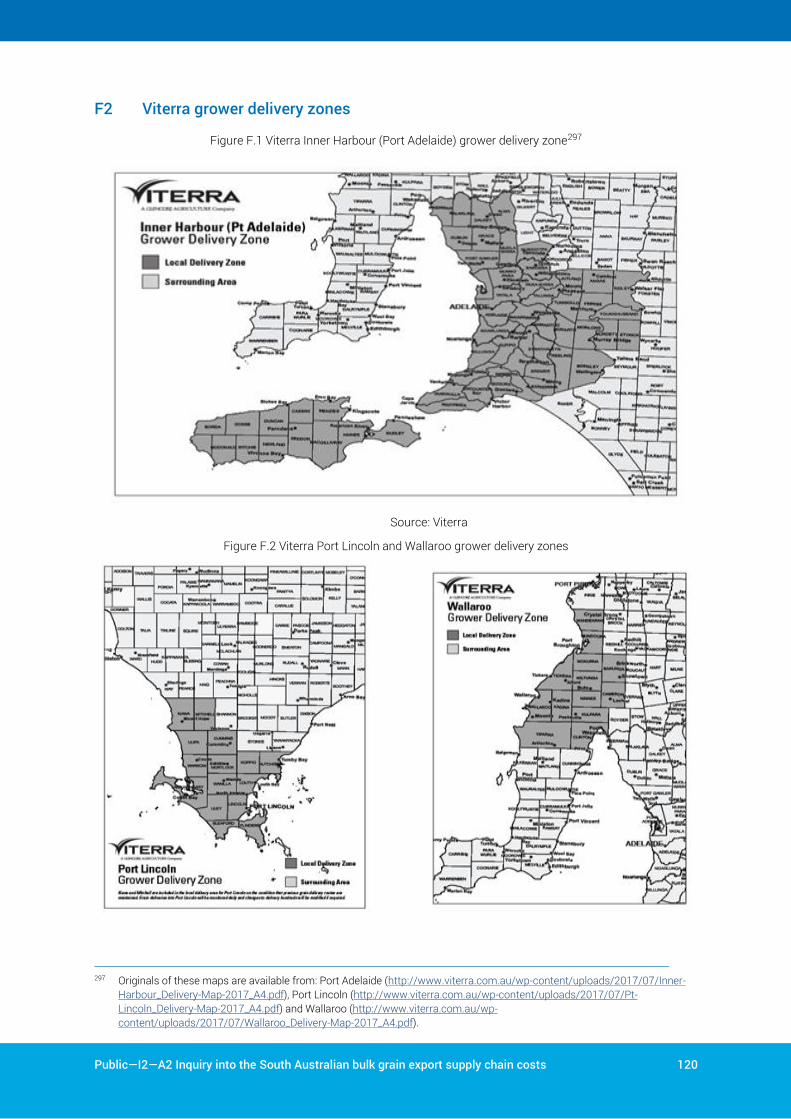
Public—I2—A2 Inquiry into the South Australian bulk grain export supply chain costs 120
F2 Viterra grower delivery zones
Figure F.1 Viterra Inner Harbour (Port Adelaide) grower delivery zone297
Source: Viterra
Figure F.2 Viterra Port Lincoln and Wallaroo grower delivery zones
297 Originals of these maps are available from: Port Adelaide (http://www.viterra.com.au/wp-content/uploads/2017/07/Inner-
Harbour_Delivery-Map-2017_A4.pdf), Port Lincoln (http://www.viterra.com.au/wp-content/uploads/2017/07/Pt-Lincoln_Delivery-Map-2017_A4.pdf) and Wallaroo (http://www.viterra.com.au/wp-content/uploads/2017/07/Wallaroo_Delivery-Map-2017_A4.pdf).

The Essential Services Commission
Level 1, 151 Pirie Street Adelaide SA 5000
GPO Box 2605 Adelaide SA 5001
T 08 8463 4444
E [email protected] | W www.escosa.sa.gov.au