public disclosure authorizeddocuments.worldbank.org/curated/en/643471520429223428/pdf/121480... ·...
TRANSCRIPT

1
Pub
lic D
iscl
osur
e A
utho
rized
Pub
lic D
iscl
osur
e A
utho
rized
Pub
lic D
iscl
osur
e A
utho
rized
Pub
lic D
iscl
osur
e A
utho
rized

2

3
A Fair Adjustment:
Efficiency and Equity of Public Spending in Brazil
BRAZIL
PUBLIC EXPENDITURE REVIEW
Volume I: Overview
November, 2017

4

1
Preface
After a period of economic stability, high growth rates and a substantial poverty reduction, Brazil now faces major challenges to deal with its public spending. The growth of primary spending outpaced that of GDP even during the favorable phase of the commodity super-cycle. Spending has become increasingly inflexible due to constitutional rigidity in categories such as payroll and social security, leaving almost no room for discretionary and investment spending.
Considering the change in the economic environment, this expenditure review was requested by the Brazilian government with the objective to conduct an in-depth analysis of government spending, to develop options for Brazil to reduce its fiscal deficit to a sustainable level while consolidating the social gains achieved over previous decades. The main finding of our analysis is that some government programs benefit the rich more than the poor, in addition to not achieving their goals effectively. As a result, it would be possible to save part of the budget without reducing access to or the quality of public services that benefit the poorest sections of the population.
The analysis is based on the best international practices and evaluation of the efficiency of spending by different entities and government programs. The report pretends to encourage the debate about the allocation of public resources and the principles that guide public spending, with a view to promote greater equity and efficiency.
Designing and enacting a “just adjustment” which puts Brazil’s fiscal accounts back on a sustainable trajectory, while protecting the poor and making public spending more equitable, is a great challenge. It will span more than one government and will require an extensive dialogue far beyond the federal government, including subnational governments, social movements, labor unions, business associations and many other groups. We believe that the sooner the country begins this debate and faces its problems, the sooner it will be possible to transform its current reality and return to the path towards shared prosperity for all.

2

3
Acknowledgements
This report was prepared by a World Bank team led by Antonio Nucifora (Lead Economist for Brazil, World Bank), Cornelius Fleischhaker (Economist, Macroeconomics and Fiscal Management Global Practice, World Bank), and Fritzi Koehler-Geib (Program Leader and Lead Economist for Central America, World Bank), under the guidance of Martin Raiser (Country Director for Brazil, World Bank) and Pablo Saavedra (Manager for Latin America and the Caribbean, Macroeconomics and Fiscal Management Global Practice, World Bank). The core team included: Fernando Andres Blanco Cossio (Fiscal Policy); Rafael Amaral Ornelas and Fabiano Colbano (Wage Bill); Alexandre Borges de Oliveira (Public Procurement); Heinz P. Rudolph and Asta Zviniene (Pension); Pedro Olinto, Andre Loureiro and Vivian De Fatima Amorim (Education); Kathy A. Lindert (Social Assistance Programs); Edson Correia Araujo (Health); Truman G. Packard and Matteo Morgandi (Labor Market Programs); Emmanuel Skoufias and Renata Mayer Gukovas (Incidence Analysis); Mark Dutz (Business Support Programs); and Flavia Nahmias da Silva Gomes (Team Coordination). Other experts from the World Bank Group also participated in several aspects of the study: Candyce Da Cruz Rocha, Claudia Baddini, Dandan Chen, Daniela Pena de Lima, David Oliveira De Souza, Andres Estrada, Ezau Pontes, Fabiano Colbano, Fabio Sola Bittar, Frode Davanger, Hans Anand Beck, Igor Andre Carneiro, Joao Bevilaqua Teixeira Basto, Juliana Braga Machado, Julio Velasco, Leandro Costa, Lorena Vinuela, Maria Concepcion Steta Gandara, Mariana Vijil, Maria Elisa Diniz Costa, Mariana Vijil, Massimo Mastruzzi, Michael Drabble, Michael Weber, Miguel-Santiago da Silva Oliveira, Monica Porcidonio, Paul Procee, Rafael Barroso, Rafael Munoz Moreno, Raquel Tsukada Lehmann, Roland N. Clarke, Rong Qian, Rovane Battaglin Schwengber, Thiago Scott, Tomas Damerau, Uriel Kejsefman, Vanessa Moreira da Silva, Vivian Malta and Xavier Cirera. A number of experts and academics from Brazil and beyond also participated in the study: Andre Portela, Daniel Santin, Eduardo Pontual Ribeiro, Gabriel Ulyssea, Justin Barnes, Leonardo Lima Chagas, Stephen O'Connell, Ricardo Pais de Barros, Sergio Perelman, Stella Lobo and Tim Sturgeon. Although each of them has contributed to specific parts of the report, they do not necessarily agree with the entire study and its conclusions, and of course they hold no responsibility for any errors or omissions, which remain the authors’ own. Invaluable comments and guidance were provided by Ana Paula Vescovi (National Treasury Secretary, Ministry of Finance), Mansueto Almeida (SEAE Secretary, Ministry of Finance), João Manoel Pinho de Mello (Secretary for Microeconomic Reforms, Ministry of Finance), Fabio Kanczuk (Secretary of Economic Policy, Ministry of Finance), Marcelo Caetano (Secretary of Social Security, Ministry of Finance), Marcos Mendes (Chief Economic Adviser to the Minister, Ministry of Finance), Otavio Ladeira de Medeiros (Deputy Secretary of the National Treasury, Ministry of Finance), Waldery Rodrigues Júnior (General Coordinator for Special Affairs, Ministry of Finance), Pedro Calhman de Miranda (Under Secretary for Infrastructure and Regulation, SEAE, Ministry of Finance), Alexandre Manoel Angelo da Silva (Under Secretary for International Competition, SEAE, Ministry of Finance), Angelo José Mont Alverne Duarte (Under Secretary of Economic Analysis and Competition Law, SEAE, Ministry of Finance) Felipe Bittencourt (Coordinator-General, General Coordination of Economic-Fiscal Studies, National Treasury, Ministry of Finance), Pedro Jucá Maciel (Under Secretary

4
of Strategic Planning for Fiscal Policy, National Treasury, Ministry of Finance), Felipe Palmeira Bardella (General Coordinator of Fiscal and Economic Studies, National Treasury, Ministry of Finance), Jefferson Bittencourt (Under Secretary of Fiscal and Tax Policy, Secretariat of Economic Policy, Ministry of Finance), Rafael Cavalcanti de Araújo (Under Secretary of Economic Policy, Secretariat of Economic Policy, Ministry of Finance), Rodrigo Cota (Deputy Executive Secretary, Ministry of Planning), Jorge Arbache (Secretary of SEAIN, Ministry of Planning), Arnaldo Lima (Chief Economic Adviser to the Minister, Ministry of Planning), Wilsimara Maciel Rocha (General Coordination of Social Policies, Ministry of Planning), Lorena Ferreira (Special Adviser to the Minister, Ministry of Planning), Martha Seillier (Head of Special Advisory Unit, Office of the Chief of Staff of the President), Bruno Silva Dalcolmo (Special Adviser, Office of the Chief of Staff of the President), Marcelo Pacheco dos Guaranys (Deputy Chief, Analysis and Monitoring Department of Government Policies, Office of the Chief of Staff of the President), Fabiana Magalhães Almeida Rodopoulos (Deputy Chief of Public Finance, Office of the Chief of Staff of the President), Janete Duarte (Deputy for Analysis and Monitoring Department of Government Policies, Office of the Chief of Staff of the President), Rogerio Boueri Miranda (Director of Institutional Development, IPEA) Alexandre Ywata (Director of Policies and Regional, Urban and Environmental Studies, IPEA), Lucas Ferreira Mation (Chief of Technical Assistance, IPEA), Ricardo Alberto Volpe (Director of the Budget Consulting and Financial Inspection, Chamber of Deputies) and Helio Martins Tollini (Budget and Financial Inspection Consultant, Chamber of Deputies). We are also grateful for the comments by Carlos Alberto Vegh Gramont (Chief Economist for Latin America and the Caribbean, World Bank), Daniel Lederman (Deputy Chief Economist for Latin America and the Caribbean, World Bank), Deborah Wetzel (Senior Director, Governance Global Practice, World Bank), Ceyla Pazarbasioglu (Senior Director, Finance and Markets Global Practice, World Bank), Carlos Felipe Jaramillo (Senior Director, Macroeconomics and Fiscal Management Global Practice, World Bank), Paloma Anos Casero (Director for Latin America and the Caribbean, Europe and Africa, Macroeconomics and Fiscal Management Global Practice, World Bank), Marialisa Motta (Manager for Latin America and the Caribbean, Trade and Competitiveness Global Practice, World Bank), Reema Nayar (Manager for Latin America and the Caribbean, Education Global Practice, World Bank), Margaret Ellen Grosh (Senior Advisor, Social Protection and Labor Global Practice, World Bank), Pablo Gottret (Manager for Latin America and the Caribbean, Social Protection and Labor Global Practice, World Bank), Daniel Dulitzky (Manager for Latin America and the Caribbean, Health and Nutrition Global Practice, World Bank), Oscar Calvo-Gonzalez (Manager for Latin America and the Caribbean, Poverty Global Practice, World Bank). Special thanks to the peer reviewers: Teresa Ter Minassian (Consultant, former Director of the Fiscal Affairs Department, IMF), Jesko Hentschel (Country Director for Argentina, Paraguay and Uruguay, World Bank), Jorge A. of Thompson R. Araujo (Economic Advisor to the Vice President for Latin America and the Caribbean, World Bank), José Guilherme Reis (Manager, Trade and Competitiveness Global Practice, World Bank) and Emily Sinnott (Program Leader, Human Development for Argentina, Paraguay and Uruguay, World Bank). In addition, the report benefited greatly from the views and comments received in formal and informal consultations during its preparatory phase. In particular, we would like to thank the many representatives of the Office of the Chief of Staff of the President, the Ministry of Finance, and the Ministry of Planning who participated in two workshops on the preliminary analysis in March 2017;

5
the members of the Committee for the Monitoring and Evaluation of Federal Public Policies (CMAP) who participated in a presentation of the preliminary analysis in June 2017; and the participants in the special session organized during the 38th Meeting of the Brazilian Econometrics Society (SBE) in December 2016.

6

7
Table of Contents
Preface ..................................................................................................................................................... 1 Acknowledgements .................................................................................................................................. 3 Table of Contents ..................................................................................................................................... 7 Executive Summary ................................................................................................................................. 9 Introduction ........................................................................................................................................... 18 Challenges for Fiscal Sustainability in Brazil ......................................................................................... 21
Fiscal trends and sustainability ....................................................................................................................... 21 Incidence of fiscal policy ................................................................................................................................ 28 The adoption of the expenditure ceiling (“Teto dos Gastos”) ......................................................................... 30 Complementing spending adjustment: The role of tax policy and “below the line” expenditures ................. 34
Public Sector Wage Bill ......................................................................................................................... 39 International benchmarking of the public sector wage bill ............................................................................. 39 Spending trends and composition of the public sector wage bill .................................................................... 42 Estimating the public-private wage gap .......................................................................................................... 44 Incidence and productivity impact of public wage bill spending ................................................................... 51 Wage bill and human resources management: Opportunities for reform ....................................................... 53
Public Procurement: Planning and Bidding Strategies for Fiscal Efficiency .......................................... 55 Pensions: An Unaffordable Bill .............................................................................................................. 67
Review of Brazil’s pension systems in international context ......................................................................... 67 Reforming Brazil’s public pensions: The Government’s proposal ................................................................. 77 Reform of subnational civil service pension systems (RPPS) ........................................................................ 80 Options for reform and fiscal savings ............................................................................................................. 81
Labor Market and Social Assistance Programs: Integrate to Improve .................................................. 85 Levels of expenditure for Social Assistance and Labor Programs.................................................................. 85 Efficiency and incidence of Social Assistance and Labor Market Programs ................................................. 88 Improving the design of social assistance and labor market programs ........................................................... 94
Options for consolidating social assistance: Bolsa Família, Salário Família, BPC and rural pensions ...... 94 Options for improving support for the unemployed: FGTS and Seguro Desemprego ............................... 97 Options for reshaping wage supplements: Salário Família and Abono Salarial ......................................... 98 Simulations of the Reforms FGTS, Seguro Desemprego, Salário Família and Abono Salarial ................. 99
Social Assistance and Labor Programs: Savings and efficiency from an integrated systemic approach...... 102 Health: Alternatives to Offer More and Better Services ...................................................................... 105
Benchmarking the level of expenditures in the health sector ....................................................................... 105 Efficiency and incidence of health spending ................................................................................................ 107 Health sector reforms for greater efficiency, equity and fiscal savings ........................................................ 114
Spending More or Better? Efficiency and Equity in Public Education ................................................. 117 Levels of expenditure for education sector ................................................................................................... 117 Efficiency of education spending .................................................................................................................. 120

8
Primary and secondary education ............................................................................................................. 120 Higher education ....................................................................................................................................... 127
Incidence of public spending on education ................................................................................................... 130 Education sector reforms for greater efficiency, equity and fiscal savings .................................................. 132
Primary and secondary education ............................................................................................................. 132 Higher education ....................................................................................................................................... 133
Do Policies to Support the Private Sector Provide Returns to Society? ................................................ 135 Level of expenditures on policies to support business .................................................................................. 135 Efficiency and incidence of policies to support business .............................................................................. 136 Reforms to business support policies to achieve greater efficiency, equity and fiscal savings .................... 143
References ........................................................................................................................................... 146

9
Executive Summary 1. Brazil spends a lot more than the country can afford and on top of this spends poorly. This is the key conclusion of this study, which analyses the roots of Brazil’s recurrent fiscal problems and presents options for their resolution. 2. For the past two decades, Brazil has experienced a consistent increase in current spending which is now putting fiscal sustainability at risk. In recent years, the impact of this steady increase in expenditures was aggravated by the drop in revenues resulting from a deep recession and by the increase in tax expenditures. This has resulted in annual fiscal deficits of above 8 percent of GDP in 2015-2016 and an increase in public debt from 51.5 percent of GDP in 2012 to more than 73 percent in 2017. The fiscal adjustment needed to stabilize public debt in the medium terms is large—about 5 percent of GDP in the primary fiscal balance. Failure to stop this trend would result in a loss of investor confidence (domestic and international), exchange rate depreciation, and high inflation, bringing Brazil back to the type of macroeconomic crisis it experienced in the 1980s and early 1990s. Further, beyond fiscal stabilization, Brazil needs to create additional fiscal space to increase investment in infrastructure. Currently, public spending is not only above what Brazil can afford, but it also does very little to support growth as public investment was almost completely eliminated in recent years. 3. The constitutional expenditure limit (“teto dos gastos”) adopted in December 2016 introduced a gradual adjustment path for government spending over the next ten years. Its implementation requires a reduction in spending of around 0.6 percent of GDP every year relative to the current trend for the next decade. This corresponds to a nearly 25 percent cumulative reduction in federal primary expenditures (as a share of GDP), which would reduce the size federal budget (as a share of GDP) to the levels of the early 2000s. Finding these savings will be challenging as budgetary rigidities, ample spending mandates and budget cuts in the past few years have already greatly reduced

10
discretionary spending. In other words, the “teto” can only be met through rigorous prioritization of expenditures. 4. This report aims to demonstrate how such prioritization can be achieved in a way that protects the poor and vulnerable and minimizes negative impacts on employment and the provision of public services. To do so, the study takes a deep look at existing programs and spending allocations and identifies reforms that would make public spending more effective, efficient and equitable. 5. Reduced spending is not the only strategy to restore fiscal balance but it is a necessary condition. Some have suggested that instead of cutting spending, Brazil should increase tax revenues and reduce the high interest payments on its public debt. Certainly there is scope to expand the taxation of high income groups (e.g. through income, property, and capital gains taxes) and to reduce the reliance on indirect taxes which places a heavy burden on the poor. Additional gains in the fiscal balance could be made by reducing quasi-fiscal operations via public banks, and addressing costs related to the management of public debt and foreign reserves. Such measures are not discussed in detail in this report but should still be part of the fiscal adjustment strategy. However, these additional measures can be no substitute to tackling the fundamental causes of the increase in current spending and reviewing the associated excessive responsibilities and mandates of the Brazilian state. The failure to do so will inevitably lead to new fiscal crises and painful adjustment down the road. 6. The single most important source of long-term fiscal savings is pension reform. The large and increasing deficits of the pension system constitute a key source of fiscal pressure. It is essential to adjust the pension system to the reality of rapid demographic change and to bring it in line with international standards. Further the current pension system is inequitable in that 35 percent of pension subsidies (i.e., the deficit of the pension system) benefit the richest 20 percent of the population, while only 18 percent of this subsidy benefit the poorest 40 percent of the population. Approval of the reform proposal currently in Congress would be a significant step towards correcting this imbalance. World Bank projections indicate that the reform negotiated in Congress in May 2017 would halve the projected deficit of the RGPS pension system (for private sector workers) over the next few decades—from 16 percent of GDP to 7.5 percent by 2067. Over the next ten years, the reform would bring approximately one-third of the required fiscal savings under the “teto” (reaching 1.8 percent of GDP in 2026). The reform is socially fair as it would mostly reduce the subsidies to workers who earn above 3 minimum wages. 7. Additional measures will be required to make the pension system financially sustainable and more equitable. Even with the reform, large pension deficits are projected to remain. The proposed reform also does not sufficiently address the deficit in the federal RPPS pensions system (for federal civil servants), which results from the extremely generous—and highly inequitable—benefits awarded to civil servants who joined before 2003. Similarly, the reform does not solve the deficits of the RPPS pensions systems of subnational governments, which are projected to increase sharply in the next 5 to 10 years as many pre-2003 civil servants retire. This will jeopardize many states’ fiscal solvency. Therefore, additional measures will be required to align the benefits of the RPGS and RPPS to the level of contributions. 8. To address the remaining deficits in the RGPS, the following measures should be considered:
- Further reducing replacement rates, since even with the adoption of the current reform replacement rates will still be high by international standards. Reducing the replacement rate

11
by another 20 percentage points would reduce RGPS deficits by 1.8 percent of GDP in the medium term;
- Delinking the minimum pension from the minimum wage (and correcting only for cost of living increases) would have the most significant impact to reduce the fiscal deficit compared to other policy actions. Keeping minimum pensions constant in real terms, would achieve an additional reduction in the RGPS deficit (urban and rural) of 0.5 percent of GDP by 2027 and 2.3 percent by 2067.
9. Deficits in the RPPS and the fairness of the pension system overall should be addressed by removing the privileges awarded to pre-2003 civil servants. Civil servants who joined before 2003 are currently entitled to an extremely generous pension package, in which the value of benefits far exceeds their level of contributions.1 The result is that, while the RPPS post-2003 will balance in the future, in the short term there is a large deficit remaining due to the pre-2003 system. This deficit will weigh on taxpayers for the next couple of decades. In 2015, the estimated cost for the tax payer was 1.2 percent of GDP at the federal level and a further 0.8 percent of GDP at subnational level. Since the majority of civil servants are among the richest 40 percent of the population, their pension benefits imply a large transfer from current tax payers, the majority of whom are much poorer than then RPPS beneficiaries. Further, the benefits of the pre-2003 cohort of civil servants imply a generous transfer from the young to the older generation. In other words, there is an inherent social injustice in the concept of acquired rights (direitos aquiridos) as applied to these benefits. Given the depth of Brazil’s fiscal problems and the huge size of its current and expected future pension deficits, all generations should contribute to the necessary adjustment. This could be achieved, for instance, by taxing the pensions of existing high income retirees and recipients of survivor pensions. 10. A further reform which should be considered is to recognize that the RGPS rural pensions and social pensions (BPC) are in fact social programs, and to reform them accordingly. Both of these pension systems are de-facto non-contributory, and their objective is to prevent the elderly from falling into poverty. However, unlike the Bolsa Família, program which is well targeted to the poor, rural retirement benefits and social pensions are not well targeted to the poor. In fact, 70 percent of the beneficiaries of BPC and 76 percent of beneficiaries of rural pensions do not belong to the poorest 40 percent of the population. This is largely because the level of benefits provided by these programs is so much higher than that of other social assistance programs—the maximum benefit provided by Bolsa Família, is about one-third of that provided by BPC and rural pensions. A reform to consolidate social pensions with other social assistance programs (by aligning their targeting and levels of benefits, as discussed below) could generate significant savings through better targeting and potentially free up resources to spend on urgent social needs such as access to water and sanitation, early childhood education, or old age care. 11. The civil service wage bill can be significantly reduced. While the size of the Brazilian civil service is not large by international standards, the level of wages of federal civil servants is on average 67 percent higher than in the private sector, even after controlling for education and other relevant factors such as age and experience. The remuneration of state level civil servants is also very high, and on average more than 30 percent above the relevant private sector equivalent. In relative terms, the wage gap appears especially large in the judiciary and legislative branches, as well as at lower levels of the executive branch.
1 For instance, for teachers the net benefit (expected pension payments minus total lifetime contributions) is roughly equivalent to 300 minimum wages for a pre-2003 contract and around 30 minimum wages for a post-2003 contract.

12
12. The reduction of these exceptionally high wage premiums for federal civil servants would also be desirable from an equity standpoint. The vast majority (83 percent) of federal civil servants are among the richest quintile of the population. Estimates suggest that halving the wage premium with respect to the private sector would provide savings of 0.9 percent of GDP. These initial findings suggest the need for an in-depth study to compare the remuneration in the public sector with that in the private sector. However, the evidence is sufficient to recommend a freeze in nominal wages of federal civil servants in the short term while a more detailed study is carried out on the adequate level of remuneration for the diverse set of public service careers. 13. Improving methods for public procurement of goods and services would produce savings across the government. Public procurement is a critical step in the provision of public services to the population, be it in health care, education, infrastructure, etc. An analysis of public procurement by the federal government over three years (2012 to 2014), covering about R$155 billion (or about 5 percent of the annual federal government budget on average) indicates that the federal government could save between R$24 billion and R$35 billion in three years (or 0.15 to 0.2 percent of GDP annually; approximately 1 percent of the federal budget) through the introduction of customized strategies for public procurement. The lower bound (of R$24 billion) is under a conservative scenario based on the development of better purchasing strategies to achieve economies of scale, greater competitiveness, diversification of suppliers, minimization of the effects of seasonality on prices, among other strategies that can be implemented in the purchasing phase. The higher figure (of R$35 billion) corresponds to an aggressive scenario that would also require demand management, reducing waste, replacing materials and services, and standardization of products of lower complexity. All proposed savings do not require modifications to the laws of bidding and contracts or the drafting of new laws. All proposals are based solely on procurement planning and strategy following the existing policy framework.
14. Spending on policies to support businesses has grown rapidly, reaching 4.5 percent of GDP in 2015; yet there is no evidence that the existing programs have been effective and efficient in their objective to boost productivity and sustainable job creation. On the contrary, these programs are likely to have negative consequences on competition and productivity in Brazil. Much of this spending is off-budget, resulting from tax exemptions and provision of subsidized credit through public banks. It would be crucial to conduct robust evaluations of these programs to inform the public debate and redesign policies. Preliminary analysis suggests that up to 2.0 percent of GDP in federal spending could be saved (or reallocated) over the next decade by eliminating (or reformulating) the least efficient programs:
- The largest program in this area, SIMPLES, accounts for about 1.2 percent of GDP in lost tax revenues. It would benefit from reform to make it less costly and more effective in encouraging the formalization and growth of the most productive firms, and greater job creation.
- Government proposals to roll back payroll tax exemptions (Deshoneracao da Folha) would generate savings of up to 0.4 percent of GDP. Several studies indicate that this program has had little to no impact on employment, and that the cost of the few jobs created (or protected) was very high, at more than 3 times the workers’ salary.
- The Inovar-Auto program does not appear to be effective, it costs a lot to domestic consumers, and has been found to violate WTO rules. The program should be reformed, focusing on removing anti-export bias and building the capabilities of suppliers (instead of focusing primarily on the internal market and the final assembly by large automotive companies). This

13
would generate large benefits to consumers, and a possible additional 0.03 percent of GDP in fiscal savings.
- The tax exemptions provided to the Zona Franca of Manaus, which costs the equivalent of 0.38 percent of GDP, also appear to be inefficient and should at least be reformulated to effectively support the local economy.
- Some savings are already being realized on subsidized credit, since the PSI program was stopped in 2015. Studies have found that the PSI subsidized credit program has had little effect in supporting investment and productivity growth. Instead the program appears to have introduced distortions, since it largely benefited old and unproductive firms. The costs of the PSI (associated with existing loans at subsidized rates) will continue to weigh on public finances for years to come—it is expected to cost approximately 0.4 percent of GDP in 2018, gradually tailing off to 0.1 percent of GDP by 2026.
15. Social protection and labor programs would benefit from reforms that better align incentives and focus on the most vulnerable populations. The social protection system in Brazil encompasses almost the full gamut of programs that are offered in high income countries to help households manage risks across the life cycle. However, this study finds that similar or even better results could be achieved with lower spending: many programs with similar functions are deployed as if in isolation, which result in millions of families being entitled to multiple benefits. Better policy coordination and more integrated administration and delivery could reduce overlaps, save resources and realign incentives to increase productivity of the labor force. The overall recommendation is to redesign and integrate social protection programs (labor market programs, social assistance, and social pensions) into a coherent system that better leverages Brazil’s capacity to target households in need and thereby achieves fiscal savings. The study recommends to reshape all social programs into three complementary parts, generating savings of up to 1.3 percent of GDP over the next decade:
(a) Consolidated social assistance: This would entail redesigning and integrating all de-facto non-contributory cash transfer benefits—including social pensions (BPC and rural pensions), social assistance, and Salário Familia—into a consolidated program modelled along best practice examples from OECD countries. Building on the well performing Bolsa Família program, a consolidated social assistance benefit could ensure progressive spending, internally coherent eligibility criteria, and incentive-compatible benefit withdrawal rules that stimulate formal labor market participation. Under such a program, all poor individuals would be eligible to no more than one means-tested transfer. The potential fiscal savings would depend on eligibility and benefit levels (and the government’s ability to detect errors by ensuring the interoperability of administrative data), but could reach up to 0.7 percent of GDP without raising the poverty rate. A short-term measure compatible with this broader reform objective would transform Salário Família, into a means-tested benefit at the household level (leveraging the capacity of Cadastro Unico) in order to incentivize Bolsa Família, beneficiaries to transition into formal jobs. While not generating short-term fiscal savings, the expected positive effects on labor supply and the productivity of formal workers would generate long-term economic and social benefits. (b) Targeted wage subsidies: Abono Salarial could be transformed into a proper wage subsidy paid to the employer as an incentive to hire (i) the long-term unemployed, or (ii) first-time job seekers in the formal labor market (mostly young people). This reform would reduce the number of beneficiaries of the wage subsidies. Some of the fiscal savings could be reinvested to other, currently-underfunded active labor market programs, such as training programs and labor market

14
intermediation that are more effective at improving matches and thus foster productivity. Overall no significant fiscal savings are expected from this measure. However, resources would be spent more effectively and better target the most vulnerable workers. Also, the reform would augment Brazil’s capacity to provide labor market intermediation services and job search support, which could result in productivity gains from employing labor that was otherwise unengaged. (c) Integrated income support for the unemployed: Integrating FGTS and Seguro Desemprego into a sequenced set of income support instruments for the unemployed could reduce public expenditures on unemployment insurance by more than 95 percent. Following international best practices, the unemployed would become eligible to Seguro Desemprego only once their FGTS account balance is exhausted, while payments of the latter would be capped to a monthly maximum that is aligned with reasonable replacement rates (for instance 70 percent of the past wage). This reform would also generate the fiscal space to lengthen the maximum payment period of seguro desemprego (e.g. up to 7 months) for the minority of workers that really need it, especially during economic downturns. The reform would eliminate much of the moral hazard currently leading to excessive turnover, which is created by how the two programs interact. An increase in remuneration of the FGTS balance to market rates should be part of this reform. The reform would also stimulate employment and bring fiscal savings of approximately 0.6 percent of GDP. Moreover, the fines that employers pay for involuntary separations could be used to increase the funding for labor market intermediation and job search support services.
16. Public spending on primary and secondary education suffers from significant inefficiencies, such that the same level of services could be provided while saving 1 percent of GDP at the local level. Inter-municipal efficiency analysis shows that the current performance in education services could be maintained with 37 percent less resources spent on primary and 47 percent less spent on secondary education, corresponding to savings of approximately 1 percent of GDP. Low student-teacher ratios drive a large part of the inefficiency (39 percent). Increasing the number of students per teacher by 33 percent in primary and 41 percent in secondary schools would save R$22bn (0.3 percent of GDP) per year. This could be achieved simply by natural attrition: not replacing every teacher who retires in the future until reaching an efficient student-teacher ratio. Further improvements can be achieved by reducing teachers’ absenteeism and increasing the share of teachers’ time spent teaching. While reducing inefficiencies will generate savings in aggregate, the analysis also shows that for some municipalities large gains in quality could be achieved with small increments in spending, while in many others more spending would only imply even greater waste. 17. The constitutional linkage of education spending to 25 percent of municipal tax revenues may be one of the main causes of expenditure inefficiency. Richer municipalities, with high fiscal revenues per student, tend to be far less efficient than poorer municipalities. Thus, it is likely that in order to comply with constitutional rules, many wealthy municipalities are forced to spend resources that do not necessarily increase learning. This is worrying given the drastic demographic transition the country is undergoing. With the rapid decline in the fertility rate to below 1.8, the number of students has been falling rapidly in many municipalities, especially in elementary school. As this fall in the number of students is not necessarily associated with a fall in fiscal revenues, this implies that to comply with the law, many municipalities are obliged to spend more per student, even if this additional expenditure is not necessary. If this additional expenditure per student does not result in improved learning, this would explain the greater inefficiency of richer municipalities. 18. Spending on higher education is both inefficient and very regressive—a reform of the system could save 0.5 percent of GDP in the federal budget. The federal government spends

15
approximately 0.7 percent of GDP on federal universities. Efficiency analysis suggests that approximately one fourth of this money is wasteful. This is also reflected in the fact that the level of spending per student in public universities is two to five times higher than that spent in private universities. Limiting the funding allocated to each university based on the number of students would enable savings of approximately 0.3 percent of GDP. Further, while students do not pay any tuition fees to attend federal universities, more than 65 percent of the students in these universities come from families among the richest 40 percent of the population. Hence spending on federal universities constitutes a subsidy for the richer part of Brazilian society. Since there are high private returns from obtaining a university degree (in terms of higher future salaries), most countries charge students for attending public universities and offer public loans which can be repaid out of the students’ future income. Brazil already provides student loans for attendance of private universities, under the FIES program. There is no clear rationale why the same model is not applied to public universities. Extending the FIES to federal universities could be combined with providing free tuition scholarships for the students from the poorest 40 percent of the population (currently 20 percent of all students in federal universities, and 16 percent of all university students), by expanding the PROUNI program. Together, these reforms would improve equity and would save at least 0.5 percent of GDP in the federal budget. 19. In the health sector, approximately 0.3 percent of GDP could be saved by efficiency improvements at the local level, while maintaining the same level of health services, and another 0.3 percent with the end of income tax deductions for private health expenditures. Comparing efficiency levels across municipalities, the analysis in this study identifies possible efficiency gains of 37 percent in primary care (potential to save R$9 billion) and 71 percent in secondary and tertiary care (potential to save an additional R$12 billion). In total, this amounts to potential savings of 0.3 percent of GDP. The observed inefficiency is mainly due to the fragmentation of the public health system, and notably the high number of small-sized hospitals, which does not allow for economies of scale in service provision. There is also a lack of system integration and inadequate incentives for providers and patients to choose the most cost-effective treatment. Much could be gained, for instance, by identifying and treating non-communicable diseases before they become hospital cases. In addition, tax expenditures are large and highly regressive, notably the tax expenditures on income tax (IRPF) deductions for the cost of private health insurance could be removed leading to revenue gains of 0.3 percent of GDP. Efficiency improvements in health care will be critical to ensure the sector can absorb the expected increases in cost associated with demographic change. 20. In sum, based on in-depth analysis of sectoral policies, this study identifies at least 7 percent of GDP in potential fiscal savings at the federal level by 2026 (Table 1). This includes 1.8 percent of GDP from the pension reform proposal (as negotiated in Congress in May, 2017), 0.9 percent of GDP from reductions in the wage bill of federal public servants, 0.2 percent of GDP from efficiency gains in public procurement, 1.3 percent of GDP from rationalization of social assistance and labor market programs, 2 percent of GDP from reductions in subsidized credit and in tax expenditures to support business, 0.3 percent in tax credits for health, 0.5 percent from reforms in financing for higher education; and a further 1.3 percent of GDP from reforms to improve efficiency in health and education, which however accrue to subnational governments. The available data allowed us to quantify potential savings from the implementation of selected policy reforms, but these are by no means exhaustive. These savings can support fiscal consolidation or be re-allocated (within the same sectors, or across sectors). 21. Realizing the savings identified in this study will require changes to current budget rules and rigidities. The reforms outlined in this report assume that these rules and associated institutional

16
arrangements can be changed. Indeed, unless they are, Brazil will not comply with the expenditure ceiling and risks jeopardizing the current incipient recovery and instead return to macroeconomic and fiscal crisis. Some of the proposed measures can be achieved without changes in legislation, while others require more complex and comprehensive reforms. All of them are feasible over the medium-term, but some may require additional technical work to determine policy details and sequencing of their implementation. 22. Finally, beyond the current fiscal adjustment, improving the quality of public spending requires the institutionalization of a system of regular and rigorous policy monitoring and evaluation. Monitoring should provide focus on results and connect outcomes to budgetary inputs. Evaluation can provide evidence for choosing the most efficient policy solutions to achieve objectives and therefore should guide decisions on which programs to cut and which to maintain or expand. The evaluation of spending efficiency cannot be a one-time exercise but needs to become an institutionalized process that guides policy making. Many countries have adopted an institutional framework to ensure the ex-ante screening of new program proposals and the regular monitoring and evaluation of existing programs (see Boueri Miranda et al., 2015). Beyond the institutional framework, the regular monitoring and evaluation of spending efficiency will require greater availability of administrative data. Currently, limited access to data, especially on tax expenditures (from the Ministry of Finance) and social programs’ incidence (from IBGE and the Ministry of Social Development), limits the availability of rigorous evidence that is needed to make informed policy decisions. Providing access to researchers outside of government—which is standard practice in most OECD countries—could enhance credibility and the quest for efficiency.

17
Table 1: Summary of policy options and their impact on efficiency, equity, and potential fiscal savings (*) Sector Measures Efficiency Equity Potential
savings by 2026 (% of GDP)
Pensions Reform of pension system (as negotiated in congress in May 2017)
+ + 1.8%
Wage bill of the Federal Government
Halve the wage premium of federal civil servants compared to private sector
+ + 0.9%
Public Procurement
Optimize procedures for selected goods and services + Neutral Up to 0.2%
Social Assistance
New integrated social assistance program (merging BPC & rural pensions & Salário Família, into Bolsa Familia).
+ + Up to 0.7%
Labor markets
Reform of Abono Salarial and Salário Família + Neutral 0.01% Reform to FGTS and Seguro Desemprego + + 0.6%
Health
Improve the efficiency of health care workers + Neutral 0.09% Expand primary healthcare coverage (from 65% to 100%)
+ + 0.03%
Improve integration between basic and advanced healthcare
+ Neutral 0.12%
Improve hospital efficiency + Neutral 0.05% Removing federal tax subsidies for private health insurance
+ + 0.33%
Education
Eliminate inefficiency in municipal primary education
+ Neutral 0.5%
Eliminate inefficiency in state primary education + Neutral 0.3% Eliminate inefficiency in state secondary education + Neutral 0.2% Federal tertiary Education + + 0.5%
Programs for private sector development
Reforming SIMPLES (ideally as part of broader tax reform)
+ Unclear Up to 1.2%
Eliminating Deshoneracao da Folha + Unclear 0.4% Reforming Inovar-Auto + Unclear 0.03% Reform of Zona Franca of Manaus (to a less distortive and less costly alternative)
+ Unclear Up to 0.4%
Total savings from subnational expenditures 1.29% Total savings from federal tax expenditures 2.33% Total savings from federal expenditures 4.74% Total 8.36% Source: World Bank staff estimates.

18
Introduction 1. The Brazilian government spends more than the country can afford and on top of this spends poorly. Brazil’s fiscal deficits are high and its debt level is on an unsustainable path. Current public spending has followed an increasing trend over the past two decades and evidence is mounting that much of it is inefficient and regressive. This Public Expenditure Review (PER) analyzes the roots of Brazil’s fiscal challenges and offers recommendations for action.2
2. This study is mainly focused primarily on the federal budget, but it also deals with specific aspects of subnational finances. Brazil’s intergovernmental framework contains three administrative levels: Federal Government, States and Municipalities. The constitution determines the allocation of taxation powers, expenditure responsibilities and transfer mechanisms between levels of government. Federal fiscal policy affects subnational governments’ finances, which in turn constitute an important fiscal risk for the federal government.3 While this report looks at specific aspects of the public finances of subnational entities, particularly with regard to pensions and spending on health and education, its main focus is on the federal level. The federal budget accounts for about 60 percent of total government spending in Brazil. In addition, federal rules determine a significant proportion of the compulsory expenditures of subnational entities through federal legislation.
3. Brazil is facing a fiscal sustainability crisis due to a long-standing structural trend of increasing current expenditures. While the steady increase in current expenditures has been ongoing for the past two decades, its unsustainability was masked by the steadily increasing revenues during the economic boom between 2004 and 2010. But outside of this period spending increases were not accompanied by sufficient revenue growth. In recent years, the fiscal shortfall increased sharply as a result of the significant drop in revenues due to the economic recession. These dynamics resulted in annual fiscal deficits of more than 8 percent of GDP in 2015-2016, and public debt increasing from 51.5 percent of GDP in 2012 to more than 73 percent of GDP in 2017.4 The fiscal adjustment needed to stabilize public debt in the medium terms is large - approximately 5 percent of GDP in the primary fiscal balance.
4. The PER is informed by the “New Fiscal Regime” enacted through Constitutional Amendment 95 in December 2016, which introduced a limit on the growth of federal primary expenditures over the next 20 years. The adoption of this expenditure ceiling (“teto dos gastos”) is the 2 This report will be published in two volumes. Volume I summarizes the results of a series of specific studies for each of the 9 areas covered. These studies will be published in full in Volume II. 3 States and municipalities are responsible for the provision and associated cost of education, health, and public safety, and the relevant salaries and pensions. Yet federal rules on pensions, health, and education dictate much of subnational spending. A good example is the salary floor for teachers, which is set annually by the federal government and obliges all states to pay the teachers in their public school systems an annually adjusted minimum salary, without providing the resources to do so. Federal tax policy, such as tax exemptions granted between 2011 and 2014, also have consequences for subnational finances, as these taxes are subject to revenue sharing schemes such that tax breaks awarded by the federal government reduce the budget transfers that subnationals receive. On the other hand, solvency risks of the subnationals (such as the ongoing fiscal crisis in the State of Rio de Janeiro) present a contingent liability to the federal government as states might default on their debt to the federal government or require bailouts to avoid shutting down essential services, such as policing, hospitals and schools. 4 The fiscal data used in this study follows the GFS 2014 methodology and may differ slightly from the data published by the Brazilian government which uses the GFS 2001 methodology.

19
government’s strategy to achieve the required fiscal adjustment, and this report focuses on recommendations that would allow the government to comply with the expenditure ceiling. It should be noted, however, that complementary additional steps can and should be considered as part of a balanced fiscal adjustment strategy, both on the revenues side and in controlling “below the line” costs.5 However, such additional measures are not discussed in depth in this report.
5. Compliance with the new “teto dos gastos” will be challenging, highlighting the importance of preparing (and enacting) a program of fiscal reforms. To understand the extent of the adjustment required over the next decade to comply with the “teto”, it useful to note that a 5 percent of GDP reduction in federal spending would reduce federal primary expenditure as a share of GDP by one quarter, and bring it back to the level of the early 2000. This will be very challenging in the context of the widespread budgetary rigidities and growing spending pressures related to a rapidly aging population. Further, the “teto” does not ensure the quality of fiscal adjustment. The extent of the needed fiscal adjustment underscores the need to carefully assess which expenditures can be reduced without hurting the poor or jeopardizing future economic growth. The analysis in this report aims to inform this discussion.
6. Past fiscal adjustments have often been to the detriment of the poor—it is critical that future efforts mitigate this risk. Hence, the PER analyses in detail which expenditures provide essential services and protection to the poor and vulnerable and which benefit primarily the well-off. Covering most key areas of public spending, this report shows how reforms can achieve savings while improving public services and improving equity. The recommendations are not quick fixes, but rather starting points for the design of far-reaching reforms that will allow Brazil to conduct the needed fiscal adjustment minimizing any negative impact on the poor.
7. The report consists of nine chapters; the first chapter frames the extent of the overall fiscal challenge facing Brazil. The chapter examines revenue and expenditure trends, provides public debt projections and an assessment of contingent liabilities. It discusses relevant cross-cutting fiscal issues such as expenditure rigidities, revenue challenges, and areas to improve the fiscal rules. It does not discuss ways to strengthen the budget process and Medium-Term Fiscal Framework (MTFF). A highly complementary recent analysis of Brazil’s medium-term fiscal planning has been provided by the International Monetary Fund (IMF, 2017).
8. The following eight chapters focus on scope for efficiency and equity gains, and potential fiscal savings in specific areas. The pension chapter evaluates the regime for civil servants and for private sector employees in an international context, looking at the sustainability and the equity of the system. It also assesses the expected fiscal and equity impacts of the current reform proposal being discussed in the congress. The chapter on the public sector wage bill assesses the remuneration of federal civil servants against domestic and international standards. The public procurement chapter explores the scope to optimize purchasing strategies and demand management with a view to reduce the cost of government’s purchase of goods and services. The final five chapters assess scope for efficiency gains and potential fiscal savings in selected sectors: policies for private sector development; social assistance programs; labor market programs; education; and health.
5 “Below the line” refers to costs resulting from government financing needs, measures related to capitalization of public companies (including public banks), and the costs related to central bank operations.

20
9. Jointly these eight areas account for over 80 percent of the federal government’s primary spending and most of the growth in primary spending over the past 15 years—and they cover a substantial share of public service delivery. The report provides several approaches and perspectives with the objective of identifying potential savings and technical and allocative efficiency gains. For example, part of the analysis of social assistance and labor market programs is based on an analysis of incidence and overlaps across the multiple programs that allows to infer the scope for efficiency and equity gains. The analysis of public spending in education and health is based on productivity curves that allow to infer the scope for efficiency gains. The chapter on business support programs relies on a number of studies which assess the costs and effectiveness of specific programs.
Box 1: Fiscal consolidation provides opportunities for Brazil Traditionally, fiscal adjustment in Brazil is associated with a reduction of well-being for ordinary people. However, as this report showcases in detail, the urgent need to address Brazil's fiscal imbalances offers an opportunity to correct long-term structural biases that have hampered economic growth, generated rent seeking and corruption, and cemented economic inequalities. Four areas in particular that directly link fiscal adjustment with more sustainable and more socially inclusive economic growth can be highlighted:
• Restore fiscal sustainability and rebuild fiscal buffers. This includes addressing the root causes of fiscal pressures, enabling a reduction in real interest rates, stabilizing public debt and then placing it on a decreasing trajectory, rebuilding fiscal buffers and actively managing and mitigating risks from contingent liabilities. The reform of the public pension system is critical to contain spending pressures and restore long-term fiscal sustainability. Rationalizing the public sector wage bill is also important given its large size in the federal budget.
• Deliver public services more efficiently. Brazil could improve the volume and quality of public services by using current resources more efficiently. Eliminating inefficiencies would create additional space to face future spending pressures and generate resources that can be reallocated to programs which have shown positive impact. Notably, in priority areas such as health and education, spending inefficiencies imply that the same or even better results could be achieved with fewer resources.
• Redesign policies to support business to foster investment, employment and productivity growth. Current projections indicate that growth will remain modest over the medium term, requiring Brazil to boost productivity growth while generating efficiency gains in its fiscal structure. Brazil spends significant amounts supporting the private sector with little impact on productivity and jobs creation. By redirecting spending on wasteful subsidies to finance improvements in infrastructure or well-targeted interventions to boost innovation and technology adoption, Brazil could lay the foundation for a return to sustainable higher growth rates and the creation of quality jobs.
• Make public spending and taxation more equitable. The incidence of federal primary spending is very heterogeneous. Brazil currently spends significant resources on public programs that are ineffective in achieving their objectives and mostly benefit the well-off. While some programs play an important role in alleviating poverty, others are regressive. Thus, a well-designed fiscal adjustment would not need to reduce support for the poor and vulnerable, and it could even improve equity by reducing regressive spending and increasing the progressivity of taxation.

21
Challenges for Fiscal Sustainability in Brazil Deep and comprehensive expenditure and tax policy reforms are needed for Brazil to be able to comply with the new expenditure rule. The 6 percent adjustment required over a decade corresponds to 25 percent of the federal budget. This in itself is extremely challenging. The challenge is compounded by the fact that over 90 percent of the budget is rigid. Removing a few programs and marginal reforms will not be sufficient. Further, fiscal policy currently has little impact on reducing inequality and poverty relative to the amount of public spending. There is a need to develop a comprehensive plan to maximize the quality (in terms of efficiency and equity) of the fiscal adjustment and to remove budgetary rigidities.
Fiscal trends and sustainability
10. Brazil’s fiscal balances have deteriorated dramatically in recent years, highlighting the unsustainability of fiscal trends. Relative to other countries in Latin America, Brazil has high rates of taxation and large social spending. Rapidly increasing revenues during the 2000s masked an equally rapid increase in expenditures, driven by structural factors. As revenues stopped increasing and eventually contracted, while expenditures kept rising, the primary balance declined from an average surplus of 2.9 percent of GDP from 2004 to 2013 to deficits of over 2 percent of GDP in 2015 and 2016. The nominal deficit surpassed 8 percent of GDP in 2015 and 2016. As a result, the General Government’s gross public debt expanded from 51.5 percent of GDP in 2013 to over 73 percent in 2017. While falling revenues and high interest rates between 2014 and 2016 played a role, rapid growth in primary expenditures has been the structural driver of fiscal deterioration. Without reforms, the growth of primary spending will result in even larger structural deficits in the future. To reverse this trend, a fiscal adjustment of about 5 percent of GDP is needed to achieve a debt stabilizing primary balance of about 2 percent of GDP.

22
11. The main driver of fiscal pressure is growth in mandatory primary expenditures, although debt interest costs have also contributed.6 Primary expenditures grew on average by 6.5 percent per year in real terms between 2006 and 2014, before falling slightly in 2015. More than half of the increase in primary spending was due to increased social programs (53 percent), especially pensions (the three major federal pensions programs -RGPS, RPPS and BPC).7 Transfers to other levels of government also contributed (35 percent). The federal government more than doubled its spending on education in real terms between 2006 and 2014, though it remains moderate at 1.3 percent of GDP, as most education spending is in the sphere of state and local governments.
12. While interest costs and other below the line operations are very large in Brazil, it would be misplaced to center the fiscal adjustment strategy on these costs. Beyond the primary deficits, Brazil’s large interest bill on the public debt has contributed to the increase in overall fiscal deficits. Interest costs increased moderately from 2006 to 2014 (from 6.4 to 7.4 percent of GDP). However, as interest rates rose to over 14 percent, the interest costs jumped to 8.7 percent of GDP in 2015, driving the deterioration in the overall fiscal deficit that year. Indeed, interest payments have played a major role in Brazil’s fiscal imbalance contributing 62 percent of the increase in the overall fiscal deficit between 2011-14 and 2015-16. However, attributing too much importance to the “below the line” accounts is misleading from an economic policy perspective. In fact, it is important to distinguish between the calculation of the contribution of each component of the fiscal result (which is just an accounting exercise), an assessment of the sources of fiscal disequilibria. From a fiscal policy standpoint, debt service expenditure is generally considered to be endogenous because it is determined by the stock of debt (accumulation of past deficits) and the interest rate, which in turn is determined in the financial markets, influenced among other factors by monetary policy and the absorption of aggregate savings through fiscal deficits and the public debt risk premium. It would be incorrect; therefore, to seek to address the fiscal imbalance by focusing on “below the line” costs. Instead, the government’s policy focus should be on reducing the primary deficit (which in turn will enable a reduction of the interest rate, interest payments, and overall deficits).8
13. Fiscal pressure originates from the indexation of large parts of federal primary expenditure to GDP, revenues or the minimum wage, as well as widespread earmarking of revenues and mandated minimum spending levels. Notably, the indexation of pensions’ floor and key social programs to the minimum wage—which itself is indexed to (positive) growth and inflation— 6 Almeida, Lisboa, and Pessoa (2015) highlight the long-standing nature of the structural fiscal challenges facing Brazil and the political economy that prevents meaningful reform. Their calculations suggest that, driven by the costs of social security costs, the federal government expenditures on social sectors and programs has been steadily increasing by around 0.39 percent of GDP annually during 1991 to 2014. The unsustainability of these trends has become evident because of the recent deep recession. While revenues are cyclical and have declined during the recession, spending is rigid and continued to grow, driven by constitutionally guaranteed social commitments, in particular on generous pension benefits. 7 Social policy transfers to individuals such as pensions, conditional cash transfers and unemployment protection make up most of the Federal Governments primary spending. Three functions (pensions, social assistance and labor) make up 55 percent in 2015 of the Federal Government’s primary expenditure. Almost all of this is spent in the form of cash transfers to individuals thorough a variety of programs, targeting diverse populations and social objectives. 8 As outlined in World Bank (2017a), this derives from the interaction between fiscal and monetary policy. In countries with a weak underlying fiscal position, any attempt to lower interests and thus address the debt financing burden directly would lead inevitably to pressure on the exchange rate. To regain monetary policy credibility, the central bank has to abandon its lower rate policy. The fiscal gains of such a strategy are thus temporary. Contrast this to Brazil’s recent experience: by committing to a tough fiscal rule over the medium term, Brazil has allowed the monetary policy to gradually shift to an accommodative stance, while the exchange rate has even slightly appreciated. Of course, should the “teto” be abandoned in the face of the difficulty to adjust spending, these gains too would be temporary.

23
results in a steady increase in social security expenditures. It is estimated that a one percent increase in the minimum wage results in a 0.11 percent increase of general government primary spending (and 0.17 percent in central government primary spending). Given that the average annual real increase of the minimum wage between the 2000 and 2016 was 4.8 percent, this raised primary spending of the General Government by about 0.5 percent per year (0.8 percent for Central Government). Further there is widespread earmarking of revenues to specific expenditures, and mandated minimum levels of spending for health and education (in fact the latter are not presently binding, especially for education, see Box 2 and Box 3). Beyond being at the root of the unsustainable fiscal trends, all these rules and restrictions reduce budget flexibility and result in inefficient increases in spending.
14. Revenues have also contributed to the deterioration in the fiscal accounts since 2012, initially due to discretionary tax cuts and later due to the economic recession. In the five years, up to 2011, revenues grew at an average real rate of 6 percent (9.3 percent when excluding the crisis year of 2009). From 2012 to 2014 revenues declined slightly (-0.2 percent average real rate), even though the economy was still experiencing modest growth, due to attempts at stimulating growth though targeted tax cuts.9 By 2016, following two years of deep recession, tax revenues contracted by another 7.3 percent compared to 2014 and contributions to the pension system (RGPS) declined by 7.1 percent, even as the government undid some of the tax cuts enacted in prior years.
9 Corporate income taxes (IRPJ and CCSL) which accounted for 25 percent of federal tax revenues in 2011, declined by 6.4 percent in real terms by 2014. The fuel tax (CIDE) was all but eliminated in 2014.
Box 2: Spending rules for health and education under the spending cap The Constitutional amendment introducing the ceiling on federal primary expenditures (EC 95/2016) also changed the indexation of the federal minimum spending requirements on health and education. Health and education spending used to be set as a share of revenues but will now depend on inflation adjustment, freezing spending in real terms in line with the overall spending cap. This means that there is no pressure from these minimums to demand greater shares of capped spending. However, as health and especially education expenditures have been above the ceiling in recent years, there is space for real spending cuts in these areas under the new rules, especially in education the floor is almost half of the current education budget.
Figure B2.1: Spending floors Vs actual spending in health and education
Source: Simulation using World Bank fiscal model
0
0.2
0.4
0.6
0.8
1
1.2
1.4
1.6
1.8
2010
2012
2014
2016
2018
2020
2022
2024
2026
2028
2030
% o
f G
DP
Health
Actual Spending Old Floor New Floor
-
0.2
0.4
0.6
0.8
1.0
1.2
1.4
1.6
2010
2012
2014
2016
2018
2020
2022
2024
2026
2028
2030
% o
f G
DP
Education
Actual Spending Old Floor New Floor

24
Box 3: Drivers of expenditure growth, budget rigidities and inefficiency A major reason for the steady fiscal pressure is the indexation of large parts of federal primary expenditure to GDP, revenues or the minimum wage. Expenditure is subject to automatic increases due to indexation. For instance, the minimum wage determines a large part of pension benefits (due to the minimum pension being set equal to the minimum wage) as well as social programs (benefits under the largest social assistance program, BPC, are also set to the minimum wage).
Table B3.1: Revenue linkage rules Federal Revenues Rules IR (income tax) 3.47% of GDP in 2015
21.5% for the States' Participation Fund (FPE), 10% for exporting states, 24.5% for the municipalities' participation fund (FPM). Of the remainder, 18% for education (MDE), the rest (about 36% of total) becomes ordinary federal revenue.
IPI (tax on industrial products) 0.80%
21.5% for the States' Participation Fund (FPE), 10% for exporting states, 24.5% for the municipalities' participation fund (FPM). Of the remainder, 18% for education (MDE), the rest (about 36% of total) becomes ordinary federal revenue.
IOF-ouro (tax on financial operation on gold)
30% returned to the state of origin, 70% to the municipality of origin
IOF (tax on financial operations, excluding gold) 0.58% of GDP in 2015
18% earmarked for education (MDE).
Imposto de Importação (Import tax) 0.65% of GDP in 2015
18% earmarked for education (MDE).
ITR (tax on rural properties) 0.02% of GDP in 2015
Most of this is returned to the municipalities where the tax is raised. Of the remainder, 18% is destined for the MDE, the rest becomes ordinary federal revenue.
COFINS and CSLL (taxes on corporate profits) 4.32% of GDP in 2015
20% delinked (DRU). The remainder is destined to the social security budget.
CIDE-Combustíveis (fuel tax) 0.05% of GDP in 2015
20% delinked (DRU). Of the remainder, 71% is used by the Federal Government to pay subsidies for ethanol fuel and natural gas as well as environmental projects related to the oil and gas industry and transport infrastructure. 21.75% are transferred to states for transport infrastructure and 7.25% to the municipalities for the same purpose.
Pis/Pasep (payroll tax) 0.73% of GDP in 2015
20% delinked (DRU). 80% to the workers' support fund (Fundo Amparo ao Trabalhador, FAT) which pays unemployment insurance (Seguro Desemprego) and wage subsidies (Abono Salarial). The FAT is also used as investment capital for BNDES.
Salário Educação (payroll tax for education) 0.32% of GDP in 2015
100% to the National Education Fund (FNDE, Fundo Nacional de Desenvolvimento da Educação, do Ministero da Educação).
CPSS (public sector payroll tax)
100% for public sector pensions
Royalties and special participation for oil and gas
Resources from areas commercialized before December of 2012: 50% for the Social Fund (health and education); resources form areas commercialized after December of 2012: 75% for education 25% for healt
Social Security Contributions 5.34% of GDP in 2015
100% to social security fund (Fundo do Regime Geral de Previdência Social)
Minimum spending requirements impose further rigidity. Beyond indexation of individual benefits, rigidities and structural spending pressures also originate from minimum spending requirements. In particular, before the adoption of the new fiscal regime (EC 95/2016), minimum spending on health and education was defined as a share of tax revenues. Since revenues tend to increase with economic growth and have grown significantly as a share of GDP in recent decades, this implied a structurally increasing and pro-cyclical spending mandate, unrelated to drivers of spending needs, such as the number of students in public schools. These spending minimums have now been adjusted as part of the new fiscal regime and future adjustment in the minimums will be by inflation only, in line with the overall expenditure ceiling.

25
15. The fiscal deterioration has obliged the Federal Government to make use of extraordinary financing to comply with the “Golden Rule”. A so-called “Golden Rule”, limiting new borrowing to financing of investment rather than current expenditures, is one of the most common fiscal rules adopted by countries around the world and has been part of Brazil’s fiscal framework since 1988 through Article 167 of the Federal Constitution. Specifically, the Brazil’s “Golden Rule” states that total borrowing cannot exceed capital expenditures, which are defined as the sum of debt amortization, financial and real investment. Any borrowing beyond this would require special parliamentary approval. Since 2015, fiscal deficits (net-borrowing) have exceeded federal investment spending, suggesting non-compliance with the “Golden Rule”. In fact, the Government complied with the rule by making use of some forms of exceptional financing10. Therefore, in the absence of significant adjustment in fiscal balances, compliance with the “Golden Rule” will be another challenge facing fiscal policy in Brazil in the coming years.
10 The law allows exceptional forms of financing, for instance, re-evaluation of international reserves held by the Central Bank to be accounted for as capital revenues, even if no reserves are sold (equivalent to R$116.7bn in 2016). Further, credit extended by the National Treasury to BNDES is accounted as financial investment and repayment of these loans in 2017 was used to amortize federal debt, generating increased capital expenditures, allowing compliance with the “Golden Rule.
Table 3 (cont.): Drivers of expenditure growth, budget rigidities and inefficiency
Constitutional transfers to states and municipalities as well as earmarking to special funds and spending purposes greatly reduces the Federal Governments discretion over its resources. Ordinary taxes (impostos) leveled by the Federal Government are subject to revenue sharing with States and Municipalities. To raise revenues for exclusive federal use, the Federal Government has introduced several “contributions” (contribuições, de-facto taxes). However, these are destined for specific purposes, such as social security or transport infrastructure. To gain more budgetary flexibility, the government in 1994 introduced the delinking of federal revenues (Desvinculação de Receitas da União, DRU) which frees up 20 percent of revenue from contributions (as well as some smaller revenues) for general budget use.
Fragmentation across programs, levels of government, budget and non-budget sources results in efficiency loss from overlaps and lack of coordination. As shown in the sectoral chapters, spending in key areas is spread over three levels of government, many programs and often comes from various (on and off budget) funding sources, without those elements being coordinated. This fragmentation makes effective monitoring and policy evaluation difficult and in many cases results in inefficiency and overlap. Public expenditures in several areas would benefit from fundamental reform aimed at better aligning programs and expenditures with policy objectives.
Federal and subnational fiscal policy interact in important ways. Federal fiscal policy affects subnational governments’ finances, which in turn constitute an important fiscal risk for the federal government. Federal rules on pensions, health, and education dictate much of subnational spending. A good example is the salary floor for teachers, which is set annually by the federal government and obliges all states to pay the teachers in their public school system a specific wage, without providing the resources to do so. Federal tax policy, such as tax exemptions granted between 2011 and 2014, also have consequences for subnational finances, as these taxes are subject to revenue sharing and tax breaks awarded by the federal government reduce the budget transfers that subnationals receive. On the other hand, solvency risks of the subnationals, such as the fiscal crisis in Rio de Janeiro, present a contingent liability to the federal government as states might default on their debt to the federal government or receive bailouts.

26
Box 4: Brief description of the fiscal model and assumptions The fiscal projections included in this spending review were created using a complex fiscal model. The model projects all the main elements of revenue and expenditure for all three levels of government (federal, state and municipal) by linking them to a set of economic variables. The projections for economic variables draws on World Bank growth and commodity price forecasts, United Nations population forecasts and market consensus on financial variables. They reflect expectations as of early March 2017.
Broadly, the projections assume a recovery of the Brazilian economy between 2017 and 2019, with real GDP growth rising to 2.3 percent. Inflation is assumed to remain at the target of 4.5 percent over the projection period. Interest rates are expected to fall, but remains relatively high in real terms (at 4.5 percent) under the base case, consistent with experience. The minimum wage is expected to continue to be adjusted by the current formula (past year inflation and real GDP growth of the year before that).
Table B4.1: Modeling of Fiscal Variables
Fiscal variables Explanatory Variables
Revenues
RGPS, Other Contributions, IRPF, Salário Educação Payroll of the private sector IRPJ, CSLL, Cofins, PIS/PASEP, IOF, CIDE, Dividends GDP growth Subnational VAT (ICMS) Payroll of private sector payroll and GDP growth Property Taxes (Ex: ITR) Inflation and population growth
Expenditures
Personnel Payroll of Federal Government Goods and Services Inflation (IPCA) and population growth Subsidies GDP growth Transfers to State and Municipalities Earmarking rules on tax revenues Private Sector Social Security benefits Inflation, minimum wage, growth of the elderly population
(>60) Unemployment insurance, Abono Salarial, social pensions (BPC)
Minimum wage and Population growth
Bolsa Família Inflation (IPCA) Public Sector Social security Payroll of the federal government and growth of the
elderly population (>60) Interest payments Debt stock, exchange, interest rate, spreads
Table B4.2: Key economic assumptions underlying the fiscal model
Variable 2017 2018 2019 2020 2021
Real GDP growth 0.3% 2.0% 2.3% 2.3% 2.3% Inflation (IPCA, EOP) 3.6% 4.2% 4.2% 4.0% 4.0% Interest rate (SELIC, average) 10.20% 8.00% 8.75% 9.00% 9.00% Exchange Rate (R$/US$, average) 3.18 3.30 3.48 3.65 3.80 Minimum Wage (R$, nominal) 937 970 1014 1077 1144 Payroll Federal Government 6.0% 6.0% 6.0% 5.0% 5.0% Payroll Private Sector 3.9% 6.4% 6.4% 6.5% 6.4% Oil Price (US$ / barrel, Brent, average) 55 60 61.5 62.9 64.5 Non-Oil Imports (US$ Billions) 156 175 197 219 242 Population Growth 0.77% 0.73% 0.70% 0.67% 0.64% Population >60 4.14% 4.12% 4.10% 4.08% 4.04%
Source: World Bank staff projections/assumptions

27
Without the spending cap the primary balance, overall balance and public debt would all be on an unsustainable path, eventually resulting in a macroeconomic crisis
Figure 1: Primary Balance Projection (with and without cap), 2016-2030
Figure 2: Overall Balance projection (with and without cap), 2016-2030
Source: Simulation using World Bank fiscal model Source: Simulation using World Bank fiscal model
The adjustment required under the expenditure cap is back-loaded: 0.2% in 2017, 0.5% in 2018 and 0.6% in all subsequent years. Most of the challenge is left to the government after the 2018 elections.
Figure 3: Public debt projections (with and without cap), 2016-2030
Figure 4: Cumulated fiscal adjustment in primary spending required under the cap, 2016-2030
Source: Simulation using World Bank fiscal model Source: Simulation using World Bank fiscal model
-7%
-5%
-3%
-1%
1%
3%
5%
2016
2017
2018
2019
2020
2021
2022
2023
2024
2025
2026
2027
2028
2029
2030
With cap
Without
-20%
-15%
-10%
-5%
0%
5%
2016
2017
2018
2019
2020
2021
2022
2023
2024
2025
2026
2027
2028
2029
2030
With cap Without
60%
70%
80%
90%
100%
110%
120%
130%
140%
150%
160%
With cap
Without
0.1%0.5%1.1%
1.7%2.4%
3.0%3.7%
4.3%4.9%
5.5%6.0%6.6%7.1%7.6%
-5%
0%
5%
10%
15%
2016
2017
2018
2019
2020
2021
2022
2023
2024
2025
2026
2027
2028
2029
2030
% o
f GDP
Difference - savings needed to achievethe spending rulePrimary with cap
Primary without cap

28
16. Fiscal projections indicate that, in the absence of reform, Brazil is on an unsustainable fiscal path. Using a detailed fiscal model of the path of the individual expenditure and revenue lines, under a set of reasonable macro assumptions (Box 4), this study simulated the sustainability of fiscal trends. The model shows that in the absence of reform the primary deficit would increase continuously, approaching 5 percent by 2030 (Figure 1). The nominal fiscal deficit would approach 18 percent of GDP by 2030, and debt would approach 150 percent by 2030 (Figure 2 and Figure 3). Such levels of fiscal imbalance would not be acceptable to private investors, and would much sooner generate an outflow of capital, resulting in a macroeconomic crisis.
17. The fiscal outlook is also vulnerable to significant contingent liabilities, mainly related to subnational fiscal distress. Several State governments in Brazil are currently facing severe financial distress. Three states (Rio de Janeiro, Rio Grande do Sul and Minas Gerais) have declared a state of financial calamity in 2016, and Rio de Janeiro stopped repaying creditors. Further, in 2017, the State of Piauí declared default on its obligations, annulling payments due to suppliers. The debt of the three states in declared calamity amounts to R$270bn (4.2 percent of GDP). The debt of all states amounts to about 12 percent of GDP. Since much of this debt is owed directly to the federal government and the remainder is owed to public banks or external creditors with a federal guarantee, the federal government is directly affected by subnational defaults. In 2016 the federal government provided debt relief to states by extending debt maturities and agreeing to a moratorium on debt repayments in the amount of R$50bn until 2018. Subsequently, in 2017 the congress approved a law which will enable the federal government to support states in fiscal distress by deferring all debt repayments to the Union for three years and allowing these states to borrow with a federal guarantee. These measures were conditional on the adoption of reforms to restore fiscal sustainability, including increasing social security contributions, reducing tax exemptions, and privatizing selected state-owned enterprises. The fiscal outlook for subnationals remains very difficult, however, because most states are burdened by a large wage bill and pension deficit, which are relatively rigid because they are partially determined by federal legislation, and furthermore actuarial projections suggest that the subnational pension deficits will increase sharply over the next decade (see section on pensions below).
18. State companies are also a source of significant fiscal risk. The state-owned oil company Petrobras is highly leveraged. Its debt of US$118bn, 80 percent of which is in foreign currency, represents a contingent liability for the federal government. However, the cash flow and liquidity position of Petrobras has improved since 2015, due to increased oil production, higher domestic fuel prices, a US$35bn divestment program and successful bond issuance. Three large public banks (Banco do Brasil, Caixa Econômica Federal and BNDES) have liabilities equivalent to about 60 percent of GDP. These banks could face solvency problems in case of a prolonged economic recession (Central Bank of Brazil, Financial Stability Report, April 2016). In the case of BNDES, most of the debt is owed to the federal government. In 2014, Caixa Econômica Federal received support of R$7bn (or 0.1 percent of GDP) through a government-owned “bad bank” (Empresa Gestora de Ativos, EMGEA). In the second half of 2016 Caixa began a program of voluntary dismissals aimed at reducing operating costs.
Incidence of fiscal policy
19. Despite the large amount of public spending, fiscal policy in Brazil has had only limited success in reducing inequality and poverty. Higgings and Pereira (2013) estimate the redistributive effect of fiscal policy on income distribution and poverty in Brazil. They use the PNAD household

29
survey to consider information about many labor and non-labor income sources, direct taxes paid, contributions to the pension system, transfers received, use of public education and health services, and consumption (Figure 5). They show that through direct taxes and transfers, Brazil reduces inequality by 6 percent, which is impressive by Latin American (but not Western European) standards.11 When considering all taxes and transfers (direct and indirect taxes and direct and in-kind transfers, i.e. including the access to public services), Brazil reduces inequality by 19 percent. Considering the high level of spending, however, Higgins and Pereira (2013) consider that this reduction indicates that fiscal policy is not very effective in reducing inequality in Brazil.12
The strong use of indirect taxes in Brazil increases inequality Figure 5: Concentration curves for tax and spending categories (Benchmark case), Brazil 2009
Source: Higgings et al. (2014), Figure 1, page 21. Elaboration using POF and PNAD 2008-2009.
20. While fiscal policy is successful in reducing extreme poverty, it actually results in an increase in moderate poverty. To measure the impact of fiscal policy on poverty, Higgins and Pereira (2013) use the international poverty lines proposed by the World Bank of US$1.25 PPP per day (extreme poverty), US$2.50 PPP per day (poverty), and US$4.00 PPP per day (moderate poverty). Extreme poverty is reduced by 55 percent by direct transfers (net of any direct taxes paid), poverty by 28 percent, and moderate poverty by just 14 percent. However, when indirect taxes are considered, the reduction in extreme poverty is significantly tempered, the reduction in poverty nearly disappears, and 11 Direct taxes and transfers reduce inequality by about one-third on average in Europe (Immervoll et al. 2006). 12 These results are consistent with Immervoll et. al. (2009), who also demonstrate the limited redistributive effects of fiscal policy in Brazil (using a different data set and microsimulations), despite the high level of taxation and high spending on social programs.

30
moderate poverty actually increases when one compares market income with post-fiscal income. In other words, the number of near-poor who are pushed into moderate poverty by paying more in taxes than they receive in benefits is higher than the number of poor who escape poverty by receiving more in transfers than they pay in taxes. In addition to the deleterious effect of indirect taxes, the fact that poverty is not reduced further despite Brazil’s high spending on direct transfers is also due to the high leakages to the non-poor. Higgings and Pereira (2013) estimate that on average at least 74 percent of total direct transfer benefits the non-poor. As a result, the amount remaining to transfer to the poor is spread thinly.
The adoption of the expenditure ceiling (“Teto dos Gastos”)
21. In December 2016, Congress approved a constitutional amendment introducing a ceiling on federal primary expenditures (“teto dos gastos”), which will force Brazil to continuously choose priorities within federal public spending. The new fiscal regime limits the growth of federal primary expenditures (net of transfers to other levels of government) to the previous year’s inflation (as observed in the 12 months to June), therefore maintaining constant these expenditures in real terms.13 Assuming growth of the economy and revenues close to long term historical trends, this rule would gradually reduce spending as a share of GDP and generate a fiscal adjustment sufficient to stabilize public debt in about 10 years. Projections using the fiscal model (Box 4), and assuming that GDP will grow at about 2.3 percent per year, with inflation stabilizing at about 4 percent, indicate that, with the expenditure ceiling, the primary balance would return to a surplus only in 2024 and reach 2 percent of GDP by 2029 (Figure 1). In line with this, public debt is projected to stabilize around 2028 and then start to fall very gradually (Figure 3). Of course, higher growth and lower real interest rates could facilitate a more rapid stabilization of debt. This would create fiscal space to restore the federal government’s investment capacity and thereby support more sustainable growth in the future.
22. The “teto dos gastos” embodies the government’s strategy to achieve the required fiscal adjustment, which is focused on controlling federal primary spending. The adoption of the “teto” constitutes a pivotal first step towards restoring fiscal sustainability. It directly targets the main structural source of fiscal imbalance that is the growth in primary spending. It will also help limit the pro-cyclical spending policies of the past.14 Further, the rule is simple which makes it easy to explain
13 The reform includes provisions that trigger a series of corrective measures in case of rule breach. Specifically, power exceeding the limit will be prohibited in the coming years: (i) to grant increases or adjustments in the remuneration of its public servants (except those derived from a judicial decision or determination of legal acts prior to the publication of the PEC); (ii) create new positions, jobs or functions that imply an increase in expenses; (iii) make changes to the career structure that imply an increase in expenses; (iv) to hire personnel in any capacity (except for replacement or vacancy of positions that by law are for life – e.g. Supreme Court Ministers - and the replacement of managerial positions that do not increase expenses); (v) conduct any public tender for the hiring of public servants, except for replacements in the positions mentioned in item (iv); (vi) create any type of bonus or payments not classified as wages for civil servants; (vii) create new compulsory expenses; (viii) increase existing mandatory expenditures at rates higher than the inflation rate. In addition, if the executive branch is not in compliance, it is prohibited in the following year: (i) to increase nominal expenditure with economic subsidies higher than those incurred in the previous year; (ii) to give concession or extension of incentives or tax benefits (resulting in a reduction of tax revenues). 14 Several studies have highlighted that the lack of medium term fiscal policy in Brazil contributes to cyclical expansions and short-sighted adjustments. The focus on year-to-year primary balances left little impetus for spending constraint in times of strong revenue, resulting in pro-cyclical expansions. The practices of targeting a constant primary surplus and the abundance of expenditure indexation to revenue, GDP or the minimum wage reinforced this tendency. In times of falling revenues, the fiscal adjustment typically fell heavily on public investment or was achieved through ad-hoc revenue

31
and to monitor. That said, other countries have adopted different types of fiscal rules which each presenting advantages and disadvantages (Box 5). Notably, many countries have rules which focus on the fiscal balance, thus allowing for the contribution of revenues to fiscal adjustment, or put a ceiling on the level of public debt. Some countries have rules that distinguish between different types of public expenditures (current versus investment), or more sophisticated rules which consider the economic cycle. A few have opted for a more comprehensive strategy that includes multiple rules, for instance combining an expenditure rule with a debt ceiling. And many countries have incorporated an escape clause, to allow for flexibility at times of economic crisis or to cope with exogenous shocks. This report does not consider these alternatives, and instead focuses on recommendations that will allow Brazilian the government to comply with its expenditure rule, by focusing on measures to reduce federal primary spending. As will be discussed briefly below, however, there are complementary additional measures that can and should be considered as part of a balanced fiscal adjustment strategy, both on the revenue side and in controlling “below the line” costs.
23. Implementing the expenditure rule will be extremely challenging, as in practical terms it implies a reduction of the federal budget by 25 percent (over a decade). The expenditure ceiling implies that federal primary expenditures as a share of GDP would need to be reduced by about 0.6 percentage points every year (compared to the baseline projection of what expenditures would have been in the absence of reform, i.e. accounting for existing pressure for expenditure growth) (Figure 4). Over a period of ten years this corresponds to a reduction of over one fourth in federal primary spending. This is an enormous adjustment, and highlights the need for careful planning to ensure a quality adjustment.
24. The fiscal adjustment will be especially difficult given the high degree of rigidity in the Federal Budget and demographic pressures. Under current laws, over 90 percent of the federal government’s primary spending is considered mandatory (Figure 6). Most of this is made up by rules-based transfers to other levels of government, civil servants’ salaries, social entitlements and minimum spending requirements (Box 3). Further, the small, discretionary budget contains important priorities such as public investment in infrastructure and the flagship anti-poverty program Bolsa Família (Figure 7). In addition, Brazil is undergoing a rapid demographic transition, which will lead to substantial additional fiscal pressure on publicly financed health care (World Bank, 2011).15 Since important rigid measures. In this context, the expenditure ceiling will serve to define the long-term spending envelope and to prevent pro-cyclical expansions. By introducing a limit on spending growth which is delinked from revenue performance or economic activity, the new fiscal regime would preclude such pro-cyclical expansions. It also serves to reduce macroeconomic uncertainty since the maximum level of federal expenditures (adjusted for inflation) will be predetermined, increasing the predictability of fiscal policy. However, the implementation of the expenditure rule would benefit from multi-year budgeting. The current system of revenue earmarking and indexation is a relic from a hyperinflationary past and also an effort by the legislative to establish spending priorities beyond the annual budget cycle and protect them from executive discretion in execution. A medium-term expenditure framework (MTEF), which includes macro-fiscal forecasts with bottom-up projections of the expenditure baseline, would enhance expenditure prioritization under the expenditure ceiling. A multi–year budgeting process in which executive and legislative agree on medium term spending priorities should also reduce the need for indexing of expenditures to specific revenue streams. 15 The speed of population aging in Brazil will be significantly faster than that experienced by more affluent societies over the last century. The elderly population will more than triple within the next four decades, from less than 20 million in 2010 to approximately 65 million in 2050. The elderly population will increase from about 11 percent of the working-age population in 2005 to 49 percent by 2050, while the school-age population will decline from about 50 percent of the working-age population in 2005 to 29 percent by 2050. These shifts in population age structure will lead to substantial additional fiscal pressure on publicly financed health care and pensions, along with substantial reductions in fiscal pressures for publicly financed education (World Bank, 2011).

32
spending components, especially old-age entitlements, are bound to grow, total mandatory spending under current rules is expected to rapidly exceed the envelope set by the spending cap. Therefore, to enable implementation of the spending cap and ensure that the adjustment does not fall exclusively on the small discretionary portion of the budget, changes will need to be made to mandatory spending programs.
Box 5: International experience with fiscal rules: Options for Brazil The expenditure rule adopted in Brazil is not the only type of rule, or even the most common adopted internationally. Other types of rules focus on debt control, budget deficit, and revenues. A study published by the IMF in March 2017 (“Fiscal rules at glance”) compared these rules in 96 countries since 1985 (Figure B2). Models that limit the budget outcome (primary and/or overall) and those that restrict public debt are clearly dominant. A minority of countries chose to limit the increase in the level of expenditures. Of the 96 countries surveyed by the IMF, only 14 of them (less than 16 percent of the total) adopted a rule which limits the real growth of public expenditures. Further about 79 percent of these countries also apply a ceiling on public debt. The practice of combining the two rules is common among emerging economies. Studies have already concluded that this improves the effectiveness of controls aimed at the sustainability of public accounts in the short and long term. In the few cases where it is sought to limit the expansion of expenditure in real terms, it is possible to note different methodologies to define the control system.
Figure Q5.1: Fiscal rules adopted in 96 countries since 1985, by type of rule (2015 data)
Some rules consider the economic cycle, others differentiate the nature of the expenditures (current versus investment), others focus on the fiscal balance, and several allow for escape clauses. In Australia, since 2009, real expenditure growth cannot exceed 2 percent, but if economic growth is above potential GDP, and the fiscal surplus is above 1 percent of GDP, the rule is relaxed. Potential GDP is also a benchmark in Croatia, where since 2014 real expenditure growth is limited to the same rate as potential GDP (unless the excess is financed by specific measures). The rules also often have a relatively short life span: For instance, France, Finland and the Netherlands revise the rule every four years. Incidentally, the Netherlands also illustrates how the scope of the rule changes over time: unemployment insurance benefits and social assistance were excluded from the ceiling in the 2009/2010 biennium. Denmark, Iceland, Kosovo, Peru and Mexico opted to limit only the expansion of current spending. Studies also point out that such rules can undermine public investment. Escape clauses have been shown to reinforce the stability of the rules. The Peruvian case is interesting: the increase in current expenditures has been limited since the year 2000, but the rule can be suspended for three years if there is low growth or Congress decrees emergency. Thus, in 2013-2014, Peru applied only the rule limiting the fiscal deficit.
Source: IMF, Fiscal Rules at Glance, 2017; available at: http://bit.ly/2cNFwIU .

33
25. While the spending rule (“teto dos gastos”) defines the quantity of spending adjustment over time, it does not ensure the design, quality, and enactment of fiscal reforms needed to comply with the adjustment path established by the rule. Since the limit on expenditure growth applies only to aggregate primary spending, not to its components or specific programs, it does not provide guidance as to where to reduce spending. In this context, it is crucial to determine which expenditures should be reduced due to their limited effectiveness, their regressive incidence, and their negative impact on productivity, rather than concentrating reductions on those items that can be cut most easily. The quality of the fiscal adjustment will have repercussions for the provision of public services, equity and economic growth.
26. The remainder of this PER will motivate and elaborate reform proposals that would ensure a quality adjustment in line with the “teto”. The remainder of this Section briefly summarizes the scope for complementary reforms to the tax system and to deal with so-called “below the line” expenditures (related to the management of Brazil’s public debt, measures related to capitalization of state owned companies, and the costs related to central bank operations). It is important to see these measures not as substitutes for the adjustment in public spending. As will become clear throughout this study, Brazil’s public spending is out of line with international comparison, inefficient in many areas, and, in addition to this, overall fails to reduce the very high level of inequality of wealth and income. Public spending should be reformed for reasons of fairness and efficiency alone. Brazil’s lurking risk of fiscal crisis only provides an additional urgency to this agenda.
The needed adjustment cannot be accomplished without reducing the rigidity of expenditures, and necessarily needs to address the large spending on pensions Figure 6: Rigid portion of total non-financial expenditures of central government
Figure 7: Federal primary spending (including transfers), 2015 (in percent of GDP)
Source: World Bank, various reports
Country and year Rigid Spending (as % of budget)
Argentina (2003) 85
Brazil (2017) 92
Bulgaria (2011) 80
Chile (2014) 65
Colombia (2000) 84
Ecuador (2003) 79
Mexico (2015) 82
Moldova (2011) 86
USA (1999) 80
Source: Brazil BOOST database Federal-level, based on data from
SIOP (Sistema Integrado de Planejamento e Orçamento)
Pensions, 8.54
Health, 1.65
Labor , 1.25Education ,
1.38
Social Assistance,
1.39
Indust. Policies,
0.54
Agriculture, 0.45
Other , 5.33

34
Complementing spending adjustment: The role of tax policy and “below the line” expenditures
27. Due to the relatively high aggregate tax burden, the space for further increasing tax revenue is limited. Among emerging markets Brazil already has one of the highest tax burdens. Over the past 25 years the tax burden has risen significantly to accommodate for spending increases which resulted from the 1988 constitution and to replace inflationary financing following the Real plan in 1994. General government revenue reached 38 percent of GDP in 2016, raising the marginal cost to the economy of further tax increases. Nonetheless, tax reform could yield big dividends in terms of growth and fairness and thus complement the spending adjustment.
28. Reforming the tax system would support Brazil’s growth prospects as the Brazilian tax system is excessively complex, entails high compliance costs and generates significant distortions and inefficiency. Brazil levies as many as 85 different taxes. The complexity of the tax system is compounded by the fact that tax authority and regulation is divided between the federal government, 26 states and the federal district as well as over 5,000 municipalities. As a result, Brazil ranked 181st out of 190 countries for paying taxes in the World Bank’s 2017 Doing Business survey. High statutory tax rates are in place for the corporate tax, the labor tax and cascading indirect taxes levied on goods and services. However, an abundance of special regimes and other tax exemptions has reduced the efficiency of the tax system and created an array of economic distortions. Comprehensive tax reform aimed at rationalizing the tax system, closing loopholes and possibly reducing some tax rates would likely be both productivity enhancing and revenue positive.
29. Reforming the tax system could also improve fairness, as the Brazilian tax system is regressive. Indirect taxes, which tend to disproportionately affect the poor, represent 55 percent of tax revenue. Despite reduced rates, the effective rate of taxation on basic food items is 13.1 percent. As mentioned above, the regressive effect of indirect taxation works to largely offset the positive effect of transfers to the poor (Higgins and Pereira, 2013). Personal income taxation plays a relatively small role in Brazil (18 percent of tax revenue, 6 percent of GDP). Due to abundant exceptions of income sources, such as capital gains and dividends, from taxable income, the personal income tax does not adequately tax the rich. Those earning more than 40 times the minimum wage pay only 6.4 percent in income tax on their total income, while those earning between 20 and 40 minimum wages pay slightly more (11.7 percent) (Gobetti and Orair, 2016).
30. Comprehensive tax reform will require ample preparation.16 However, removing expensive and distortive tax expenditures is straightforward and would bring significant benefits. While not required under the spending cap, removing tax exemptions which have proven inefficient as instruments of industrial policy and mostly benefit the richest segments of society, would contribute to making fiscal policy more efficient and equitable. More efficient public spending and fewer distortions through tax exemptions and subsidized credit can be expected to have positive effects on growth and productivity. Leveling the playing field by removing tax exemptions would facilitate the allocation of
16 This study does not include a detailed assessment of the tax system and does not discuss options for a comprehensive tax reform. Several proposals have been made which would substantially improve the current tax system. For instance, the proposal by the Centro de Cidadania Fiscal (CCiF; Center for Fiscal Citizenship) suggests replacing five indirect taxes (PIS, Cofins, IPI, ICMS and ISS) with a single VAT (value added tax), named Imposto sobre Bens e Serviços (IBS; Tax on Goods and Services), whose revenue would be shared between the Federal Government, states and municipalities, which is closer to best international practices. A separate and ambitious Tax Reform Bill is currently being discussed by the Brazilian Congress.
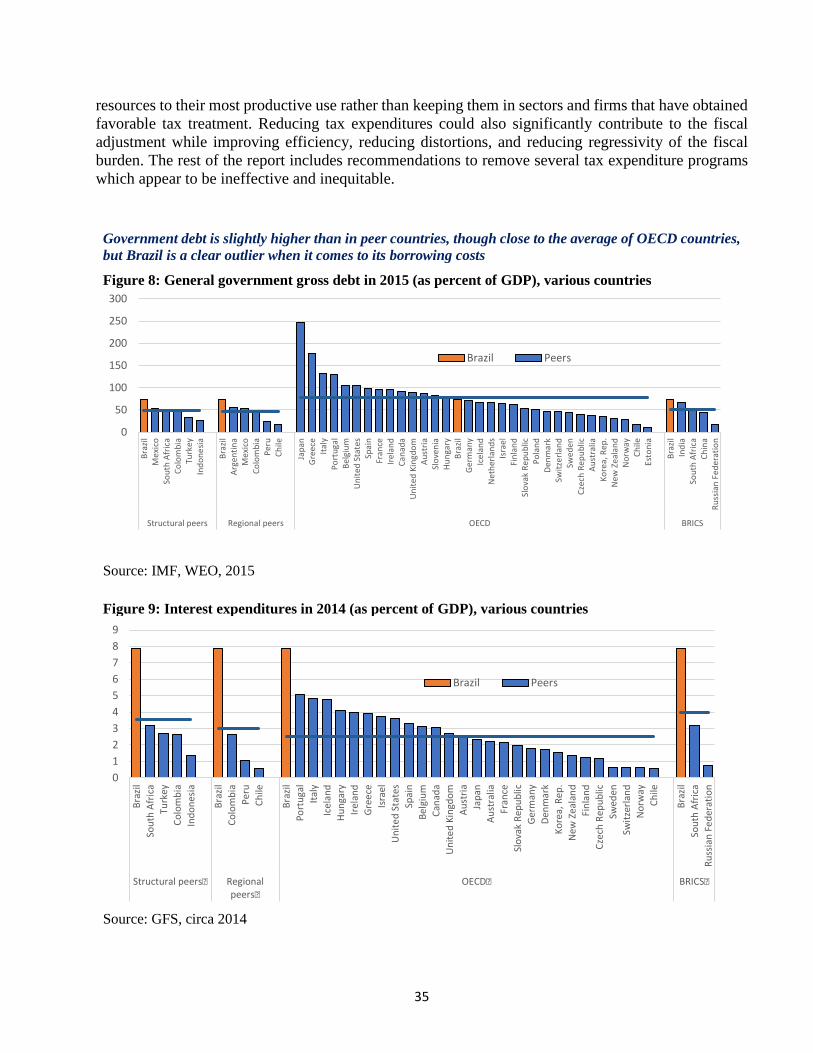
35
resources to their most productive use rather than keeping them in sectors and firms that have obtained favorable tax treatment. Reducing tax expenditures could also significantly contribute to the fiscal adjustment while improving efficiency, reducing distortions, and reducing regressivity of the fiscal burden. The rest of the report includes recommendations to remove several tax expenditure programs which appear to be ineffective and inequitable.
Government debt is slightly higher than in peer countries, though close to the average of OECD countries, but Brazil is a clear outlier when it comes to its borrowing costs
Figure 8: General government gross debt in 2015 (as percent of GDP), various countries
Source: IMF, WEO, 2015 Figure 9: Interest expenditures in 2014 (as percent of GDP), various countries
Source: GFS, circa 2014
0
50
100
150
200
250
300
Braz
ilM
exic
oSo
uth
Afric
aCo
lom
bia
Turk
eyIn
done
sia
Braz
ilAr
gent
ina
Mex
ico
Colo
mbi
aPe
ruCh
ile
Japa
nG
reec
eIta
lyPo
rtug
alBe
lgiu
mU
nite
d St
ates
Spai
nFr
ance
Irela
ndCa
nada
Uni
ted
King
dom
Aust
riaSl
oven
iaHu
ngar
yBr
azil
Ger
man
yIc
elan
dN
ethe
rland
sIs
rael
Finl
and
Slov
ak R
epub
licPo
land
Denm
ark
Switz
erla
ndSw
eden
Czec
h Re
publ
icAu
stra
liaKo
rea,
Rep
.N
ew Z
eala
ndN
orw
ayCh
ileEs
toni
a
Braz
ilIn
dia
Sout
h Af
rica
Chin
aRu
ssia
n Fe
dera
tion
Structural peers Regional peers OECD BRICS
Brazil Peers
0123456789
Braz
ilSo
uth
Afric
aTu
rkey
Colo
mbi
aIn
done
sia
Braz
ilCo
lom
bia
Peru
Chile
Braz
ilPo
rtug
alIta
lyIc
elan
dHu
ngar
yIre
land
Gree
ceIs
rael
Uni
ted
Stat
esSp
ain
Belg
ium
Cana
daU
nite
d Ki
ngdo
mAu
stria
Japa
nAu
stra
liaFr
ance
Slov
ak R
epub
licGe
rman
yDe
nmar
kKo
rea,
Rep
.N
ew Z
eala
ndFi
nlan
dCz
ech
Repu
blic
Swed
enSw
itzer
land
Nor
way
Chile
Braz
ilSo
uth
Afric
aRu
ssia
n Fe
dera
tion
Structural peers� Regionalpeers�
OECD� BRICS�
Brazil Peers

36
31. Better management of “below the line” costs could also contribute to fiscal adjustment. Brazil pays a large interest bill on the public debt which has contributed to the overall fiscal deficit rising to above 8 percent of GDP in 2015 and 2016. The level of public debt is above the level of peer countries and has been rapidly increasing, but remains in line with the OECD average (Figure 8). What is noteworthy, however, is that Brazil is an outlier in terms of its interest bill (Figure 9). This bill is inflated by quasi-fiscal operations and the high costs of monetary policy. Hence, in parallel to reductions in primary spending, and to increases in revenues, it is important to reduce the costs of “below the line” operations. A few key proposals are summarized below:
• First, almost the entire public debt is domestic and Brazil has some of the highest real interest rates in the world.17 After Brazil underwent several foreign debt and balance of payment crises in the 1970s, 80s and 90s, the National Treasury moved to reduce public debt in foreign currency, which is currently less than 5 percent of total public debt. Despite the foreign exposure risks, however, in consideration of Brazil’s high real interest rates, it is plausible that the optimum share of external debt might be higher. This deserves an in-depth study.
• Second, the interest bill includes several items peculiar to Brazil, notably the cost of lending to BNDES, the cost of monetary policy operations; the cost of the large stock of foreign-exchange reserves at the Central Bank, and the cost of Central Bank foreign currency swaps: a. In the context of the 2008 global financial crisis, Brazil dramatically expanded lending through
public sector banks at subsidized rates. This lending was financed through the placement of government bonds. The (negative) difference between subsidized lending (at the TJLP rate)18 and government bond rates was recorded as government interest expenditure.19 In 2016, the outstanding stock of government debt with BNDES of R$500bn amounted to an annual loss of approximately R$29bn (or 0.5 percent of GDP).20
b. The level of foreign-exchange reserves is also quite high by international standards and entails a significant fiscal cost (estimated as the difference between the SELIC rate less the one-year US Treasury Bill rate, multiplied by the stock of reserves) at about R$150bn or 2.6 percent of GDP. It would be important to study carefully whether there is scope to reduce these reserves.
c. In addition, limiting Central Bank interventions through foreign-currency swap operations could also help reduce the interest bill. Exchange rate swaps have entailed net losses of 0.2
17 Several explanations have been put forward to explain the high real interest rates: Low savings rates, possibly due to the generous pensions; segmented financial market, which force higher interest rate in the free market; persistent budget rigidities and fiscal shocks, which increase risk premia; widespread indexation (see Seguro 2012, for a synthesis). 18 Until 2017 the long-term interest rate (Taxa de Juros de Longo Prazo or TJLP) was set quarterly by the National Monetary Council and used as the benchmark rate for loans from the Brazilian Development Bank to companies. The government has adopted a new market-based long term rate, the TLP (Taxa de Longo Prazo), which will serve as the benchmark rate for loans from the Development Bank, starting in 2018. 19 Most of the cost of these measures was “below the line”. However, in the case of the PSI program an additional subsidy between the TJLP and the lending rate under the program was accounted for as part of the government budget (above the line); See Pazarbasioglu et al (2017). 20 In addition, 30 percent of BNDES funding originates from the Workers' Assistance Fund (Fundo Amparo do Trabalhador, FAT), which also entails a loss (to the workers) due to the differential in interest rates, amounting to R$15.9 billion in 2016. A further R$2.8 billion was the loss from a similar subsidy to the Merchant Marine Fund (Fundo Marina mercantile, FMM). In total, this brings the total costs associated with the TJLP to R$47.8 billion, only in 2016.

37
percent of GDP during 2013-2016 on average (with a peak at 2.2 percent of GDP in 2015).21 Since the peak of US$110 billion in March 2016, however, the stock of outstanding swaps has been reduced rapidly over the past year to US$27 billion as of August 2017.
32. Finally, one-off financing measures can also help reduce the level of debt. The privatization or concession of public infrastructure and other services can yield one-off resources, or royalties, which can be channeled to reduce the public debt22. Similarly, beyond reducing financing losses, early repayment of BNDES loans owed to the federal government would also lower the government’s gross debt. One such repayment of R$100bn (US$29 billion) was carried out in 2016, a second one of R$50bn (US$15 billion) is expected in late 2017, and an additional repayment is being considered for 2018.
21 The central bank of Brazil started the intervention program in August 2013 to limit volatility after the real neared a five-year low on indications the US Federal Reserve was preparing to taper the monetary stimulus. The monetary authority changed tack in March 2016, switching to reverse swap contracts—equivalent to buying dollars in the futures market—as the real soared amid prospects of a government change. While the swaps don’t change the supply of physical dollars in Brazil, they support the real by meeting demand from investors who want to hedge against the risk of the decline in the Brazilian currency. 22 However, international experience suggests that the main objective of privatizations should be to achieve better quality and efficient management, not revenue growth.

38

39
Public Sector Wage Bill
Even though only 12 percent of the federal government’s primary spending goes to payroll, the aggregate public sector wage bill of all levels of government in Brazil is high by international standards. High spending is driven by high salaries of public officials rather than an excessive number of public employees. This is particularly the case for the federal government whose servants receive significantly higher salaries than those of subnational governments or in comparable private sector careers. The high wages received by federal government workers put them at the top of the national income distribution, contributing to high inequality in Brazil. Hence there is space to realize significant savings by reducing the wage premium enjoyed by federal civil servants compared to the private sector. Bringing entry salaries closer to those of the private sector and allowing for more merit-based salary increases could reduce costs and increase the productivity of the public sector.
International benchmarking of the public sector wage bill
33. The Brazilian general government wage bill is large by international standards. International benchmarking of Brazil’s wage bill as a percent of GDP, of public expenditures, and of revenues, highlights that Brazil exceeds the average of all income groups (Figure 10 and 12). As a share of GDP, Brazil’s wage bill is higher than that of any regional average of countries. As a share of fiscal revenue and spending, it is slightly lower than in Latin America and MENA, about the same as in Africa but significantly higher than the average of countries in Asia and Europe (Figure 11).
34. Brazil’s wage bill as a share of GDP has increased, exceeding that of high income countries. The Brazilian public sector wage bill increased from 11.6 percent of GDP in 2006 to 13.1 percent, in 2015, leaving behind even Portugal and France, which had larger wage bills than Brazil a decade ago (Figure 12 and 13). Other developed countries such as Australia and the United States have

40
consistently smaller wage bills at about 9 percent of GDP, while Chile, a middle-income Latin American country, spent only 6.4 percent of GDP in 2015.
35. The number of civil servants in Brazil is not unusually high, and similarly, the relative size of the federal government does not appear excessive. Using data from the International Labor Organization (ILO), the share of public sector employees in the population in Brazil at 5.6 percent is higher than the Latin American average of 4.4 percent. However, it is much lower than in OECD, European and African countries (Figure 14). Similarly, public employment as a share of wage employment in Brazil appears to be relatively small at 18 percent (or 24 percent as a share of formal employment) (Figure 15). This suggests that the driver of Brazil’s large public sector wage bill is high cost of public servants (high salaries), rather than an excessive number of public sector employees. The share of public servants employed by the Federal Government in Brazil is only about 10 percent, which is below that of other federal countries (such as the U.S., Canada and Australia), where most personnel intensive public services are also provided by state or local governments (Figures 16 and 17).23 States and municipalities have the primary responsibility for health, education and policing, and these labor intensive public functions explain why they have many more employees than the federal government.
Brazil spends a high share of GDP on the government wage bill; this is largely due to the high salaries in the federal government, as the total number of civil servants is not particularly large
Figure 10: Wage bill by income level (General government)
Figure 11: Wage bill by region (General government)
Source: IMF's Government Finance Statistics (GFS) database
Source: IMF's Government Finance Statistics (GFS) database
23 Data on the number of state and municipal employees is not readily available. The data in Figure 14 is constructed by subtracting the published number of federal public servants (civil and military) from the total number of public sector employees observed in the PNAD household survey (which includes public sector workers at all levels). While this combination of administrative and survey data is not perfect, it should give a close approximation of the true number.
-5%
5%
15%
25%
35%
45%
High Income MiddleIncome
Low Income Brazil
2000
-20
15 A
vera
ge
Wage Bill %GDPWage Bill %ExpenditureWage Bill %Revenue
0%
10%
20%
30%
40%
50%
OECD(n=30)
LAC(n=12)
ECA (n=20)
MNA(n=9)
AFR(n=6)
SAR(n=4)
EAP(n=8)
Brazil
2000
-20
15 A
vera
ge
Wage Bill %GDPWage Bill %ExpenditureWage Bill %Revenue

41
Figure 12: Salary mass as a percentage of GDP per country
Source: Worldwide Bureaucracy Indicators, World Bank Bureaucracy Lab
Figure 15: Public employment as share of formal wage employment by country
Source: Worldwide Bureaucracy Indicators, World Bank Bureaucracy Lab Note: Various years between 2009 to 2015, depending on the country. Data for Brazil refers to 2014.
BRAZIL
0
2
4
6
8
10
12
14
16
18
20
6 7 8 9 10 11 12
Sala
ry M
ass (
% o
f GDP
)
Log of GDP per capita, 2015East Asia & Pacific Europe & Central Asia Latin America & Caribbean Middle East & North AfricaNorth America South Asia Sub-Saharan Africa Brazil
BRAZIL
0%
10%
20%
30%
40%
50%
60%
6 7 8 9 10 11 12
Publ
ic E
mpl
oym
ent a
s %
of W
age
Empl
oym
ent
Log of GDP per capita, 2015East Asia & Pacific Europe & Central AsiaLatin America & Caribbean Middle East & North AfricaNorth America South AsiaSub-Saharan Africa Brazil

42
Figure 13: Wage bill (General government) Figure 14: Employment of public sector as % of population, by region
Source: IMF's Government Finance Statistics (GFS) database
Source: International Labor Organization (ILO)
Figure 16: Share of government employees by level of government in federal countries, 2003
Figure 17: Share of civil servants by level of government, 2012-2015 average
Source: OECD and World Bank (2011) Source: Boletim Estatístico de Pessoal e Informações Organizacionais, MPOG, and PNAD
Spending trends and composition of the public sector wage bill
36. Spending on public sector wages in Brazil is roughly equally divided between federal, state and municipal governments. States and municipalities are in charge of most expenditure in public safety, education and health, and these areas are responsible for most of their wage bill. Since 2010, personnel spending by state governments has increase in real terms, exceeding that of the federal government, while spending by municipal governments has also increased to the same level spent by the federal government (Figures 18). However, in terms of number of civil servants, the federal government accounts for only 10 percent (Figure 17), which implies that the federal government spends more than twice as much per servant as subnational governments. While the functions performed by the federal government are quite different from those of subnational governments, this very large gap hints at generous remuneration of federal civil servants. A more detailed analysis comparing employees with similar functions across levels of government would be instructive, but has not yet been performed due to lack of data availability.
3%
5%
7%
9%
11%
13%
15%
2006200720082009201020112012201320142015
Wag
e Bi
ll %
GDP
Australia
Chile
France
Portugal
UnitedStatesBrazil
0%
2%
4%
6%
8%
10%
12%
OECD(n=30)
LAC(n=12)
ECA (n=20)
MNA(n=9)
AFR(n=6)
SAR(n=4)
EAP(n=8)
Brazil
2000
-20
10 A
vera
ge
18% 17%47%
13%33%
15%10%
51%
48%
24%
46%
36%
73%
32%5%
64%
22%49%
0%
20%
40%
60%
80%
100%
Central Government State GovernmentMunicipal Government
10.4%
89.6%
Federal Government Subnational Government
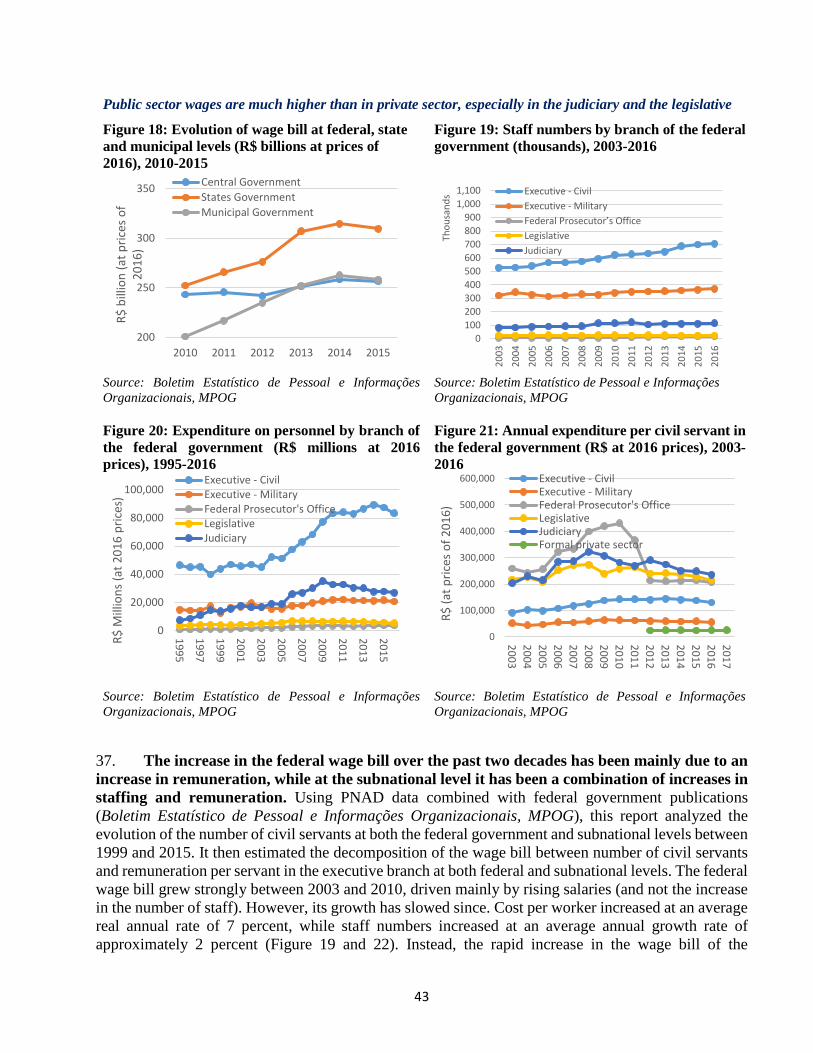
43
Public sector wages are much higher than in private sector, especially in the judiciary and the legislative
Figure 18: Evolution of wage bill at federal, state and municipal levels (R$ billions at prices of 2016), 2010-2015
Figure 19: Staff numbers by branch of the federal government (thousands), 2003-2016
Source: Boletim Estatístico de Pessoal e Informações Organizacionais, MPOG
Source: Boletim Estatístico de Pessoal e Informações Organizacionais, MPOG
Figure 20: Expenditure on personnel by branch of the federal government (R$ millions at 2016 prices), 1995-2016
Figure 21: Annual expenditure per civil servant in the federal government (R$ at 2016 prices), 2003-2016
Source: Boletim Estatístico de Pessoal e Informações Organizacionais, MPOG
Source: Boletim Estatístico de Pessoal e Informações Organizacionais, MPOG
37. The increase in the federal wage bill over the past two decades has been mainly due to an increase in remuneration, while at the subnational level it has been a combination of increases in staffing and remuneration. Using PNAD data combined with federal government publications (Boletim Estatístico de Pessoal e Informações Organizacionais, MPOG), this report analyzed the evolution of the number of civil servants at both the federal government and subnational levels between 1999 and 2015. It then estimated the decomposition of the wage bill between number of civil servants and remuneration per servant in the executive branch at both federal and subnational levels. The federal wage bill grew strongly between 2003 and 2010, driven mainly by rising salaries (and not the increase in the number of staff). However, its growth has slowed since. Cost per worker increased at an average real annual rate of 7 percent, while staff numbers increased at an average annual growth rate of approximately 2 percent (Figure 19 and 22). Instead, the rapid increase in the wage bill of the
200
250
300
350
2010 2011 2012 2013 2014 2015
R$ b
illio
n (a
t pric
es o
f 20
16)
Central GovernmentStates GovernmentMunicipal Government
0100200300400500600700800900
1,0001,100
2003
2004
2005
2006
2007
2008
2009
2010
2011
2012
2013
2014
2015
2016
Thou
sand
s Executive - CivilExecutive - MilitaryFederal Prosecutor’s Office LegislativeJudiciary
0
20,000
40,000
60,000
80,000
100,000
1995
1997
1999
2001
2003
2005
2007
2009
2011
2013
2015
R$ M
illio
ns (a
t 201
6 pr
ices
)
Executive - CivilExecutive - MilitaryFederal Prosecutor's OfficeLegislativeJudiciary
0
100,000
200,000
300,000
400,000
500,000
600,000
200320042005200620072008200920102011201220132014201520162017
R$ (a
t pric
es o
f 201
6)
Executive - CivilExecutive - MilitaryFederal Prosecutor's OfficeLegislativeJudiciaryFormal private sector

44
subnational governments was driven equally by rising salaries and increases in the number of staff. Cost per worker increased at an average real annual rate of 2.5 percent, while staff numbers increased at an average annual growth rate of approximately 3 percent (Figure 23). The rapid expansion in access to public services experienced in Brazil over the past two decades explains why the number of civil servants at subnational level has grown faster, to exceed that of the federal government.
Figure 22: Decomposition of wage bill between number of civil servants and remuneration per servant in the federal executive branch
Figure 23: Decomposition of wage bill between number of civil servants and remuneration per servant in the subnational governments
Source: Boletim Estatístico de Pessoal e Informações Organizacionais, MPOG
Source: Boletim Estatístico de Pessoal e Informações Organizacionais, MPOG and PNAD
Estimating the public-private wage gap
38. On average, public sector wages are much higher than those in the private sector. The aggregate public sector (federal as well as subnational) in the PNAD pays salaries about 70 percent higher on average (R$44,000 per year) than the formal private sector (R$26,000 per year) and close to three times the salary of informal workers (R$ 16,000 per year) (Figures 21 and 24). The federal government pays even higher salaries: As of 2016, the military pays on average more than twice the average private sector wage (R$55,000 per year) and in the federal civil service (executive branch) salaries are five times those of the private sector (R$130,000 per year). Average remuneration per employee is exceptionally high in the federal prosecutor’s office (R$ 205,000 per year), the federal legislative branch (R$ 216,000 per year), and the federal judicial branch (R$ 236,000 per year, figure 21), despite the fact that salaries have fallen in real terms in recent years. Of course, these averages cover large and heterogeneous populations and many public-sector positions are not easily comparable to any occupations in the private sector. Also, it is important to note that the data do not capture non-salary benefits, such as bonuses received by some private sector employees and the generous pension plans and other benefits provided to public sector workers.
39. Civil servants in Brazil are increasingly highly educated. High wages in the federal civil service may be in part explained by the increasingly high education of civil servants (Figure 25). By 2016, the share of civil servants who had completed university education reached 47 percent (disregarding servants for which this information was not available), up from 35 percent in 2003.
-20%0%
20%40%60%80%
100%120%140%
1999
2000
2001
2002
2003
2004
2005
2006
2007
2008
2009
2010
2011
2012
2013
2014
2015
2016
staffwageTotal
-20%
0%
20%
40%
60%
80%
100%
120%
140%
1999
2000
2001
2002
2003
2004
2005
2006
2007
2008
2009
2010
2011
2012
2013
2014
2015
staffwageTotal

45
High salaries in the public sector reflect, in part, an increasing level of education among federal civil servants.
Figure 24: Average annual remuneration in public sector (PNADc)
Figure 25: Educational level of federal civil servants in the executive branch
Source: PNAD continua Source: Boletim Estatístico de Pessoal e Informações
Organizacionais, MPOG
Figure 26: Distribution by salaries bands - federal public servant (executive only, percent of total)
Source: Boletim Estatístico de Pessoal e Informações Organizacionais
40. However, it appears that even less skilled civil servants are highly paid. A detailed breakdown of salaries by position and skills was not available. However, the Boletim Estatístico de Pessoal e Informações Organizacionais (August 2016 edition) provides information on the distribution of federal civil servants in the executive branch by their monthly salary (as of 2016, Figure 26). More than 25 percent of the civil servants earn more than R$10,000 per month and more than 17 percent are in the highest salary bracket provided, with salaries of over R$13,000.24 Close to half of the distribution is clustered around R$ 5,000 (between R$ 2,500 and R$ 7,500), with very few falling below R$ 2,500
24 Unfortunately, the breakdown of the highest category is not available. This would be useful since monthly salaries can reach more than R$33,000.
-
10,000
20,000
30,000
40,000
50,000
60,000
70,000
2012 2013 2014 2015 2016 2017
R$ (a
t pric
es o
f 201
6)
Formal private sector
Informal private sector
Public sector
0
100000
200000
300000
400000
500000 SuperiorIntermediaryAssistantNo information
0.9 1.03.3
8.2
11.7
14.6
10.2
6.75.0
7.25.0 5.6
2.50.8
17.3
02468
101214161820

46
(Figure 26). It is reasonable to assume that these salaries, around R$5,000, are received by the relatively less educated civil servants. Yet this is a very high salary by Brazilian standards, since the average monthly wage of all formal private sector workers is only R$ 1,924, with a majority of workers earning no more than 2 minimum wages (R$ 1,760 in 2016).
41. After controlling for level of education and other worker characteristics, the wage premium for federal civil servants remains extremely high. Regression analysis comparing public sector wages to those in the formal and informal private sector while controlling for education, age and experience, location, race and gender, reveals that there is a significant public sector wage premium, of 17 percent on average. However, the premium is much higher for federal employees at 67 percent and State employees at 31 percent. For municipal employees, there is no wage premium (municipal workers earn 1 percent less on average than their private sector peers). The full description and output of the regressions is reported in Volume II.
Table 2: Summary of regression results on wage premium for civil servants Coefficient Robust Std. Error Dependent Variable: log of wage All public sector 0.176*** (0.007) Federal 0.674*** (0.020) State 0.308*** (0.012) Municipal -0.0148** (0.008) *** p<0.01, ** p<0.05, * p<0.1
Source: Authors’ estimation using PNAD 2015. Note: Full regression results are presented in Volume II of this report.
42. The wage premium enjoyed by federal civil servants in Brazil is an outlier internationally, and the wage premium enjoyed by state civil servants is amongst the highest internationally, much above OECD levels. In a comparison of public sector wage premiums (controlling for education) among 53 countries, the public wage premium of the federal government in Brazil at 67 percent is the highest in the sample (Figure 27). Most countries observe a positive wage premium for the public sector, though the average premium is only 16 percent, and only in very few countries does it exceed 40 percent. The premium of Brazilian state level employees at 31 percent is still very high compared to Brazil’s peers in the region and level of per capita income (and much above OECD levels). The small negative premium of municipal governments is at the lower end of the distribution but not unique in international comparison.25
25 A recent article by Correio Brasiliense provides a comparison of the remuneration of some federal public service careers in Brazil with the United States. The data suggest that public servants in Brazil are extremely well paid by international standards. Evidence of the salaries of some selected careers shows that in Brazil, public servants are paid between 20% and 200% more than in the United States. (Source: Aline do Valle, 2017, Public service - international comparison, published in Correio Brasiliense 10/26/2017)

47
The salary premium of federal servants in Brazil is the highest when compared to most countries. Figure 27: Brazil’s wage premium between public and private sector (controlling for education level, professional experience, gender, location, etc.), compared internationally
Source: Worldwide Bureaucracy Indicators, World Bank Bureaucracy Lab
43. A comparison of the remuneration for specific careers confirms the existence of a large wage premium in the entry salaries enjoyed by federal civil servants. To compare the salaries of some careers of the public sector with the salaries in the equivalent area of the private sector we use the Robert Half salary guide (2017 edition), which provides data about the salary range for a number of careers in the private sector. We focus on the legal and financial sectors (financial analysis, audit and accounting), where employees are generally highly skilled and private sector salaries are among the highest among all occupations. The salary ranges for different occupations in the legal and financial areas for the private sector and similar positions in the public sector confirm the existence of significant wage mark-ups (Figures 28 and 29). The careers selected in the public sector are in the federal executive, rather than in the legislative, the judiciary or the federal prosecutor’s office, where salaries tend to be even higher. The wage gaps in these sectors are so large, that an entry level position in the public sector (e.g., junior analyst) receives salaries above those of senior professionals in the private sector. In the legal profession, newly graduated lawyers can expect to earn a monthly entry salary of about R$ 3,100 in the private sector. In the public executive (e.g. Attorney’s Office of the National Treasury) the entry salary is R$ 18,283. In the legislative and judicial branches the initial salaries for legal professionals are even higher at about R$ 30,000 a month (complete tables of positions and their salaries are provided in Volume II). Naturally, this type of comparison between the compensation structures of private and public sector employees has limitations, mainly because pay in the private
CHN
MNG
PHL
VNMEST
FIN
DEUGRCIRLITA
KAZ
RUS
TJKGBR
BOL
CHL
COLCRI
DOM
ECUSLV
GTM
HND
MEXPAN
PRY
PER
URY
EGY
CAN
USA
BGD
MDV
PAKBWA
ETHGMB
GHAMLIRWA TZA
TGO UGA
Brazil - Federal
Brazil - State
Brazil - Municipal
-20%
0%
20%
40%
60%
80%
7 8 9 10 11
Publ
ic se
ctor
wag
e pr
emiu
m
(with
con
trol
s)
Log of GDP per capita, 2015East Asia & Pacific Europe & Central Asia Latin America & CaribbeanMiddle East & North Africa North America South AsiaSub-Saharan Africa Brazil

48
sector is significantly boosted by performance bonuses (which are very limited in the public sector). On the other hand, the public sector enjoys significant non-wage benefits (notably job security, higher pension benefits, and many other smaller benefits for housing, transport, food, etc.)26. Nevertheless, the results are consistent with our overall findings from the regression analysis.27
The high salary premium of the federal civil service is evident in the wages of highly qualified careers.
Figure 28: Private and public salaries in legal careers
Figure 29: Private and public salaries in finance related careers
Sources: Ministry of Planning Boletim Estatístico de Pessoal e Informações Organizacionais and Robert Half Salary Guide 2017
Sources: Ministry of Planning Boletim Estatístico de Pessoal e Informações Organizacionais and Robert Half Salary Guide 2017
44. Due to very high entry salaries, high-skilled civil servants experience less wage growth over time compared to professional in the private sector. The civil service wage scale is capped at the salary of Supreme Court Justices (R$ 33,763 per months in 2016). High entry level salaries awarded to many federal civil servants (over R$ 20,000 in some careers) limit room for salary growth. In general, jobs in the public sector typically offer a narrow wage range, with significant salary increases only possible through transfer to a different role or political appointment to additional functions. This contrasts with the private sector, where lower initial salaries are combined with more opportunity for wage progression and bonus payments. For careers in the legal field in the executive, entry-level salaries are more than twice those of private sector attorneys. Law professionals in the judiciary and
26 Much of the expenditure on "housing assistance" is paid to civil servants of the Judiciary and Ministerio Publico (through judicial injunction). In relation to the Executive Power, the majority is due to expenses with diplomacy and military servants, in this case, justified by the nature of the assignments with frequent displacements (ex-office). The legislative, on the other hand, has a relatively small share of housing assistance, because this benefit is paid mainly to parliamentarians. 27 Private sector employees in the legal and financial area typically receive variable salaries, with a bonus that depends on their performance. The Robert Half salary guide considers only the fixed salary. The bonus increases when the employee acquires more experience and proves his value to the firm. This is usually accompanied by an increase in responsibility. In case of poor performance, private sector professionals risk not just their bonus but also dismissal. Most public servants do not receive significant performance pay, but they benefit from full job security. They also earn bonus payments based on the area that they work in or if they increase their educational level. Another advantage of the public sector is the pension system which is more generous that of the private sector.
0
5000
10000
15000
20000
25000
30000
35000
40000
Senior Lawyer LegalCoordinator
Head LegalOfficer
Private Public
- 2,000 4,000 6,000 8,000
10,000 12,000 14,000 16,000 18,000
Private Public

49
legislative branch earn initial salaries more than three times those of private sector lawyers. For finance professionals (e.g. analysts at the Central Bank or Ministry of Finance) the entry level salaries are also two to three times those of comparable private sector careers (analysts or associates in private financial institutions). However, while entry-level salaries are a lot lower in the private sector in all three careers, private sector salaries at the top end are about equal to those in the public sector in the legal field and are significantly higher in finance for the best paid professionals.
45. Federal civil servants are also entitled to several additional benefits. In addition to the participation in the RPPS pension system, federal civil servants in all three branches of government (Executive, Legislative, Judiciary, the Attorney General’s Office, the Comptroller General’s Office and the Ombudsman) have access to nine additional types of benefits, such as food, transport, housing and
Box 6: Benefits package for federal civil servants
Benefits: • Auxílio alimentação • Assistência medica e odontológica • Auxílio transporte: compensation for the use of own vehicle for duty travel. • Diária: to compensate costs of missions and business travel (tickets and daily expenses). • Auxílio moradia: to reimburse expenses with rental of dwelling. Housing assistance will be granted
to civil servants subject to defined criteria. • Auxílio-creche • Ajuda de custo: to compensate the expenses of installing the civil servants in a new location. • Auxilio funeral: Funeral aid • Auxilio natividade: Birth allowance • RPPS pension program
Bonuses:
• Remuneration for the exercise of management, leadership and advisory functions; • Christmas bonus: • Additional bonus for the exercise of unhealthy, dangerous or painful activities; • Additional bonus for the provision of extraordinary service; • Additional bonus for night work; • Additional vacations; • Others, relating to the place or nature of the work. • Bonuses for a course or competition.
Note: Some of these additional bonuses are constitutionally mandated and they are also envisaged for private sector workers, such as the extra for nighttime work, the extra for unhealthy, dangerous or stressful activity, and the Christmas bonus (aka as 13th salary). Sources: https://www.em.com.br/app/noticia/economia/2017/07/30/internas_economia,887718/auxilios-a-servidores-publicos-proximo-alvo-de-cortes-governo.shtml http://servidorpblicofederal.blogspot.com.br/2017/07/funcionalismo-beneficios-inflam-despesas.html http://www.valor.com.br/brasil/5069848/uniao-quer-reduzir-auxilio-moradia-de-servidor http://www.ambitojuridico.com.br/site/?n_link=revista_artigos_leitura&artigo_id=13519 http://www.planalto.gov.br/ccivil_03/leis/L8112cons.htm https://www.servidor.gov.br/gestao-de-pessoas/lei-8112-anotada

50
medical care, and several other bonuses (see Box 6). The total expenditure on benefits for civil servants was R$ 16.6 billion in 2016, which is just under 11 percent of the federal government’s payroll. The benefits of the executive branch constitute about 11 percent of the executive's payroll (R$ 12.9 billion in 2016)28. The benefits of the Judiciary, Legislative and Attorney General’s Office were 9 percent, 12 percent and 13 percent of their respective payroll costs.
46. Potential savings in the federal government wage bill are significant. A more comprehensive analysis of the salaries structures in the federal government’s many different career streams would be needed to measure the extent to which civil servants are overpaid and estimate potential savings. Yet the preliminary analysis here suggests that many civil service functions are paid well above market rates and potential savings from realigning public sector salaries could save substantial resources. For instance, reducing the wage premium for federal civil servants (of 67 percent) by half, to align it to the level of the civil servants at the state level (with a wage premium of 31 percent), would result in annual savings of 0.9 percent of GDP (R$ 53 billion). Alternatively bringing the wage premium among federal civil servants down to the international average of approximately 16 percent, would reduce the federal wage bill by 1.3 percent of GDP (R$ 79 billion) per year. A simulation using the fiscal model (see Box 4) indicates that a nominal wage freeze would lower the wage premium from 67 percent to 36 percent by 2021, and to 16 percent by 2024. A freeze only in real wages (i.e. increasing salaries in line with inflation) would lower the premium more slowly, reaching 36 percent by 2029, and 16 percent by 2036.
47. Considering the need for continued expansion in public services provision by state governments, it is also critical to reduce civil servants wage premium at state level. Personnel costs have been increasing rapidly at subnational level, and are the main source of the fiscal distress experienced by these governments. As of 2015, already 17 states were spending more than 55 percent of their net-current revenues on civil service wages and pensions.29 Increases in subnational staffing levels in line with those of the past decade (3.2 percent increase per year on average), will not be financially viable at current wage levels. If state governments were to reduce the average wage premium of their civil servants from 31 percent to the international level (of approximately 16 percent), they could realize savings of 0.6 percent of GDP (R$ 37 billion in aggregate) per year. Alternatively, given fiscal constraints, state governments will need to find ways to reduce staffing levels, for instance by outsourcing the provision of education and health services to private providers who tend to pay lower salaries and operate more efficiently. The reform of subnational pension systems is also critical to stem the unsustainable expansion of current spending. Finally, as discussed below, significant efficiency gains are possible in both health and education and thus reductions in staffing and remuneration would not necessarily affect the quality public service provided.
48. Lower entry-level salaries combined with increased wage progression linked to experience and performance could provide savings and improve incentives. Currently, the public sector is paying high entry-level salaries to attract qualified candidates, but has little room to reward high performers or attract experienced professionals from outside the government. A salary structure that combines lower entry level pay with greater flexibility to pay higher salaries based on performance or 28 The most important of these benefits are the auxílio-saúde and auxílio-alimentação. In 2016, out of a total of R$12.9 billion, R$10 billion were directed to these two. 29 The legal limit under the Fiscal Responsibility Law is 60 percent). Data is based on the Ministry of Finance’s Boletim de Finanças Públicas de Estados e municípios.

51
experience could allow the public sector to retain strong performers and attract mid-career professionals, while reducing the very large wage gaps at entry level. Lower entry salaries would need to be combined with performance-based wage increases throughout the career.30 Salaries for new entrants would need to reflect not only candidates’ education but also their experience and skills (see OECD and World Bank 2010). However, this would require not only a review of salaries but also more rigorous performance evaluation and possibly the creation of more ranks within a given public sector career.
Incidence and productivity impact of public wage bill spending
49. Civil servants are comparatively well-off in Brazil. According to the national household survey (PNAD 2015) 54 percent of civil servants (at all levels of government) are in the top quintile of the national income distribution and 77 percent in the top 40 percent (Figure 30). Civil servants of the federal government are particularly well-off, with two-thirds of them in the top decile of the income distribution, 83 percent in the top 20 percent and almost all (94 percent) in the top 40 percent. Servants in the military and in state governments (which includes the military police) are somewhat less concentrated at the top of the income distribution with 49 and 67 percent in the top 20 percent respectively. However, 75 percent of national military and 89 percent of state government servants are in the top 40 percent. Municipal level employees (which includes a lot of workers in primary education and health care) are relatively less well-off, with 39 percent in the top 20 and 66 percent in the top 40 percent of the national income distribution.
50. High public sector wages contribute to inequality. Since public sector workers are mostly at the higher end of the income distribution, their high salaries and salary premiums over comparable private sector workers contribute to Brazil’s high income inequality. An analysis of income tax declarations by Afonso (2016) shows that out of the 10 occupations with the highest declared incomes, 6 are in the public sector — highly unusual finding among OECD and emerging market peers. Since the salaries of public sector employees are financed though taxation, which in Brazil is not very progressive (mostly consumption taxes), high public sector wages constitute a form of income redistribution from the poor and the middle class to the well-off.
51. Income inequality within in the public sector declined much less over the last decade than that in the private sector (Figure 31). The past decade saw a sharp decline in returns to education in the private sector, which was a key driver of the fall in income inequality Brazil experienced over this period. However, returns to education did not fall nearly at all in the public sector. The difference in the evolution of returns to education together with the educational differences between the two sectors explains why the salary dispersion is larger in the public sector than the private sector. Firpo and Pieri (2016) simulate the "counterfactual" income distribution in the private sector which would prevail if private sector workers had the same distribution of education as the public sector, but were remunerated as in the private sector (Figure 31). Their exercise shows that these differences explain why by 2013 the Gini of the private sector was seven points lower than the Gini of the public sector. The fact that high returns to education in the public sector where not reduced in the same way as they were in the private sector, slowed the overall reduction in inequality during the 2000s (Firpo and Pieri, 2016).
30 Lowering salaries combined with the current limited wage progression in the public sector could create an adverse selection problem as public employment would be unattractive for experienced professionals and those expecting strong salary growth in the private sector based on strong performance.

52
Figure 31: Evolution of inequality (Gini coefficient) between groups (Public and Private) – 2015 salaries
Source: Firpo and Pieri (2016) using PNAD.
52. Reforms that reduce the gap between public and private sector wages and benefits could not only reduce inequality but also increase productivity in Brazil. The large wage gap, especially at entry level, combined with job stability and superior benefits serve as a magnet for well-qualified graduates. Many graduates prefer government jobs even if they do not make the best use of their qualifications. It is not uncommon for university graduates to spend significant time and money preparing for public sector entrance exams (concursos publicos) rather than entering productive employment in the private sector. The magnitude of this effect is not well understood but it could create
0.36
0.38
0.40
0.42
0.44
0.46
0.48
0.50
2001 2003 2005 2007 2009 2011 2013
Gin
i Ind
ex
Gini (Público) Gini (Privado)
Federal public servants are at the top of the national income distribution, therefore high wages perpetuate inequality in Brazilian society.
Figure 30: Distribution of civil servants in the national income distribution
Source: World Bank estimates using PNAD data.
0
20
40
60
80
100
All public Sector federal (excl.military)
military state municipal
top 10 top 20 top 30 top 40

53
distortions which negatively affect labor market outcomes and firms’ ability to recruit skilled labor. Using a life-cycle model with endogenous occupational choice, heterogeneous agents and imperfect enforcement Cavalcanti and Santos (2015) simulate (i) a reduction in public sector wage premiums; (ii) alignment of the public and private sector pension regimes; and (iii) a reduction in the stability of employment in the public sector. Their results show that reducing the government wage premium increases output as the government spends less resources on payroll, public sector jobs are less attractive and, hence, the economy saves on transaction costs associated with the excess demand for jobs in the public sector.
Wage bill and human resources management: Opportunities for reform
53. Civil service reform should aim at reducing wage premia, including in the non-executive branches. Reducing this gap should be the focus of future reforms. While more detailed analysis is required, some preliminary recommendations can be made. One option would be to reduce entry level salaries for all new entrants and thus gradually shift remuneration levels down and increase returns to experience as older cohorts of civil servants retire. The demographics of current civil servants suggest that savings could accumulate quickly as large cohorts are expected to retire in the coming decade (38 percent of federal civil servants are over 50 years old).31 This should be complemented by the introduction of more rigorous performance evaluation and greater performance related pay. The advantage of this solution is that it may create performance incentives as junior civil servants strive for promotions. Another option would be to restrict wage increases for the civil service, until wages are more in line with international benchmarks and with the private sector. For instance, limiting wage increases would reduce the wage premium for federal civil servants by half by 2021, resulting in annual savings of 0.9 percent of GDP (R$53 billion). Maintaining wages at constant nominal levels would halve the federal wage premium by 2029. The legislative, the judiciary and the federal prosecutor’s office, while relatively small in terms of staff numbers, pay particularly large premiums and should be included in any reform of salary policies. Additional measure could be taken to reduce the very high number of political and other discretionary appointees (“cargos comissionados”) and to strengthen the screening of new staff during their probationary period.32
54. A previous World Bank study, in partnership with the OECD, provides detailed recommendation to improve the management of human resources in Brazil’s federal civil service (OECD and World Bank 2010):
- Rationalizing compensation. Salary adjustments are often based on the lobbying power of different groups, producing unnecessary costs, opacity and complexity in the compensation framework. Performance bonuses have largely become part of regular salaries, thus losing their original purpose of rewarding high performers. The methodology for salary increases should be based on criteria of affordability, integrity and attractiveness. Salaries should be set based on an overall budget envelope for the whole of government.
31 Source: Ministry of Planning (https://pep.planejamento.gov.br/) 32 There are about 20,000 “positions of trust” in the government (executive branch), which cost approximately R$1 billion per year. This number has been decreasing in the past few years, but remains 10 percent above its level in the early 2000s. A 10 percent reduction could bring savings of about R$100 million (or 0.15 percent of GDP). A further possibility would be to tighten confirmation for staff currently on probation (during the initial three years). Considering that the government has hired on average 18,000 new staff per year over the past 3 years, if the government adopted a policy of only confirming 90 percent of them, this could generate additional savings.

54
- Prioritizing strategic workforce planning. Workforce planning should be based on an analysis of changing government needs, the possibilities for staff reallocation and outsourcing, as well as of technological changes. Flexibility in the management of government capacity could be developed by increasing staff mobility through a thorough reform of job categories and careers. The ongoing large wave of staff retirements provides an opportunity to adjust workforce size and competencies.
- Reforming the career system. Currently, staff enter the public service through a competitive selection into a specific, narrow career and cannot change to another career without passing another entry-level examination. Horizontal and vertical career opportunities are limited, and performance requirements are minimal for staff to move up within job categories. A reform of the job category system should eliminate the differentiation between similar job categories across government organizations and reduce the number of job categories by widening their scope, creating more possibilities for mobility. Job categories should encompass broader responsibility and pay bands and career progression should be based on the acquisition of competences and performance.
- Recruitment based on competencies. The Federal Government should move beyond recruiting staff by only testing academic skills and basic knowledge, especially for high-skilled and managerial positions. The introduction of modern recruitment methods requires focusing on competencies and past experiences without undermining transparency and merit.

55
Public Procurement: Planning and Bidding Strategies for Fiscal Efficiency
Public procurement is a critical step in the provision of public services. A “strategic sourcing” analysis of public procurement by the federal government over three years (2012-2015), covering about R$ 155 billion (or about 5 percent of the annual federal government budget) indicates that through the introduction of customized strategies for public procurement, the federal government could save between R$ 24 billion and R$ 35 billion in three years (or 0.15 to 0.2 percent of GDP annually; approximately 1 percent of the federal budget). The lower bound estimate (of R$ 24 billion) is under a conservative scenario based on the development of better purchasing strategies to achieve economies of scale, greater competitiveness, diversification of suppliers, minimization of the effects of seasonality on prices, among other strategies that can be implemented in the procurement phase. The higher figure (R$ 35 billion) corresponds to an aggressive scenario that would also require demand management, to reduce waste, replace materials and services currently purchased, and standardize products of lower complexity. All proposed savings do not require modifications to current laws regulating bidding and public contracts or the drafting of any new laws. All proposals are based solely on procurement planning and strategy under the existing policy framework.
Potential savings in public procurement
55. Procurement of goods and services carried out by the Federal Government of Brazil added up to more than R$155 billion between 2012 and 2014, which accounts for 5 per cent of government spending during this period (Figure 32). Compared with other countries in Latin America, public procurement by the federal government represented a significantly lower percentage of the budget, but this is largely due to most public procurement in Brazil being executed by states and municipalities. As the mandate for public service delivery by local governments varies significantly between countries, it is difficult to make a precise comparison.

56
56. Contracting of services accounted for the large majority of public purchases by the federal government in the years 2012 to 2014, and about 60 percent of the total value of purchases when considering the three levels of government. Following services, materials were the second largest category of expenditure, accounting for about 26 percent, while construction works reached 14 percent of the total contracted value.
57. A detailed analysis of public procurement data reveals potential savings of between R$ 24 and R$35 billion over a three-year period (Figure 33). These savings could be materialized through better procurement strategies and policies, without the need to change existing bidding and contract laws. These estimates were calculated based on bidding data and procurement contracts from the Government Procurement system’s data warehouse (DW SIASG/Comprasnet) for the years 2014-2016 and only for the General Service System (SISG) agencies.33 These estimates provide a conservative scenario, where the economies would be generated in contracting prices and conditions, and an aggressive scenario, which would require action on the demand side, such as reduction of quantities, substitution of products, among others. Both options would be under the control of the government officials following the current legal framework, without need for new laws or modifications of existing laws.
Figure 32: Share of public purchases of federal government expenditures Public budget execution 2011-2014, in R$ billion
Public purchases accounted for 5% of expenses
Source: BOOST dataset at federal level.
58. The model developed to estimate potential savings can explain more than 60 percent of the variance of unit prices—a fairly robust result for procurement data. The model identified the following elements with significant impact on prices: (1) quantity purchased in each bidding, (2) open bidding compared to restricted processes, (3) seasonality, (4) use of framework agreements (locally known as “registro de precos”), (6) buyers and suppliers from different states, (7) number of bidders. Among these variables, the quantity purchased in a bidding process proved to be the most relevant in terms of impact on prices. We estimate that better leveraging of the federal government demand could result in average savings of 8 percent in contracted prices. Of the seven variables with price impact 33 The DW SIASG / Comprasnet data do not include the works contracted by the Differentiated Contracting Regime (RDC).

57
presented above, the first five variables can be directly influenced by decision of government officials, through purchasing policies or strategies. Although the last two variables (number of bidders and buyers and suppliers from different states) cannot be directly altered by government officials, they can be influenced by procurement policies and strategies indirectly. For example, larger-scale bids would be much more likely to interest a national supplier market than several small-volume bids, which are likely to be of more interest to local suppliers.
Figure 33: Savings potential in public procurement in R$ billion, base years 2012-2014
Source: World Bank staff analysis
Figure 34: Quantification of variables’ impact on purchasing prices
Source: DW SIASG/Comprasnet and World Bank staff analysis
59. Greater consolidation of federal government demand is the main opportunity to generate savings in public procurement (Figure 34). In this sense, the suggestion would be to make one main purchase to meet most of the demand. Purchases parallel to the main one should only take place as justified exceptions. This strategy would not only improve contracted prices but also standardize the quality of products purchased, which could lead to an improvement in average quality. There is ample

58
space to leverage the demand of the federal government, since for the main products purchased by the government, in half of them the largest purchase that did not even reach 20 percent of the total demand for this product in the corresponding year (Figure 35).34
There is room to leverage federal government demand, as for most products, the largest government purchase accounted for less than 20 percent of total annual demand.
Figure 35: Savings opportunities through demand consolidation Purchased volumes and contracted price forecast
Larger purchase did not reach 20% of demand for most products
Source: DW SIASG/Comprasnet and World Bank staff analysis
Most of the value purchased comes at the end of the year when prices are more expensive. Figure 36: Effect of seasonality on prices
Source: DW SIASG/Comprasnet and World Bank Analysis.
34 DW SIASG / Comprasnet, years 2014-2016, only SISG bodies. All analysis presented in this document were prepared with these parameters.
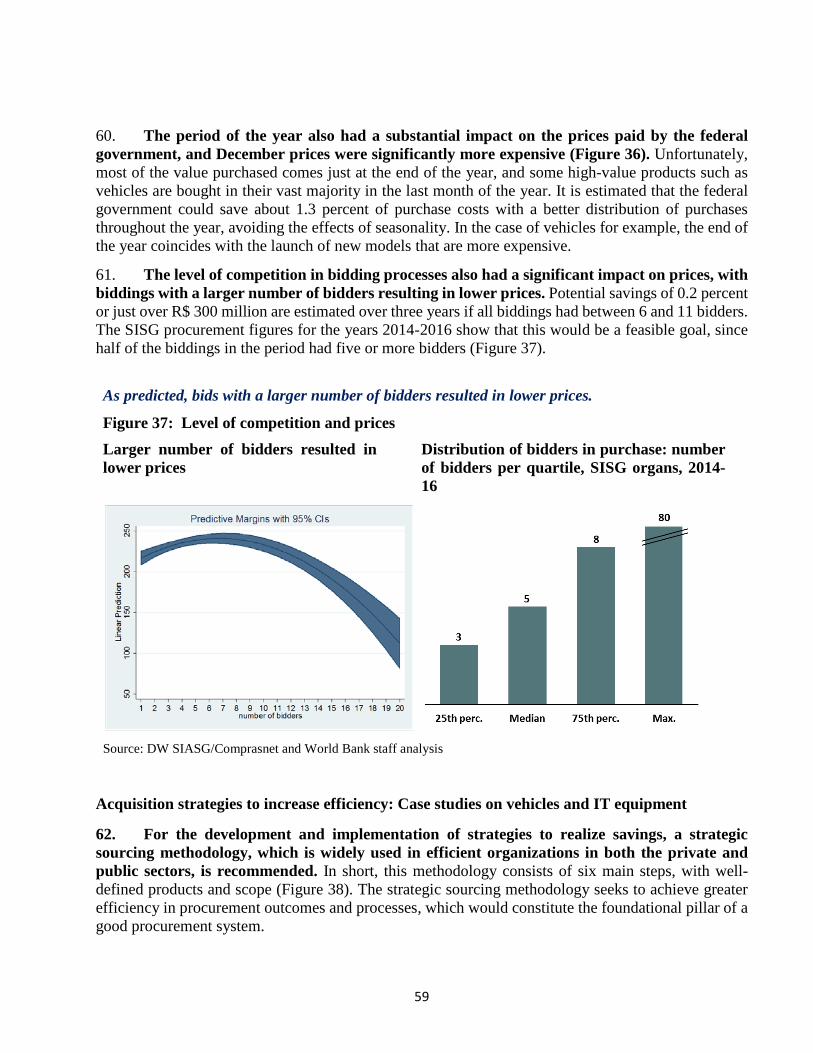
59
60. The period of the year also had a substantial impact on the prices paid by the federal government, and December prices were significantly more expensive (Figure 36). Unfortunately, most of the value purchased comes just at the end of the year, and some high-value products such as vehicles are bought in their vast majority in the last month of the year. It is estimated that the federal government could save about 1.3 percent of purchase costs with a better distribution of purchases throughout the year, avoiding the effects of seasonality. In the case of vehicles for example, the end of the year coincides with the launch of new models that are more expensive.
61. The level of competition in bidding processes also had a significant impact on prices, with biddings with a larger number of bidders resulting in lower prices. Potential savings of 0.2 percent or just over R$ 300 million are estimated over three years if all biddings had between 6 and 11 bidders. The SISG procurement figures for the years 2014-2016 show that this would be a feasible goal, since half of the biddings in the period had five or more bidders (Figure 37).
As predicted, bids with a larger number of bidders resulted in lower prices.
Figure 37: Level of competition and prices Larger number of bidders resulted in lower prices
Distribution of bidders in purchase: number of bidders per quartile, SISG organs, 2014-16
Source: DW SIASG/Comprasnet and World Bank staff analysis
Acquisition strategies to increase efficiency: Case studies on vehicles and IT equipment
62. For the development and implementation of strategies to realize savings, a strategic sourcing methodology, which is widely used in efficient organizations in both the private and public sectors, is recommended. In short, this methodology consists of six main steps, with well-defined products and scope (Figure 38). The strategic sourcing methodology seeks to achieve greater efficiency in procurement outcomes and processes, which would constitute the foundational pillar of a good procurement system.

60
Figure 38: Methodology used for procurement strategies implementation
Strategy Sourcing Model
Source: World Bank
63. Based on the analysis of federal government expenditures in 2014, we selected two product categories—vehicles and IT equipment—for strategic sourcing. These categories were chosen for cost/benefit considerations, taking into account the cost and complexity of developing a procurement project as well as the potential benefit that these projects would bring to the government in terms of savings and improvement in average quality. They represent a significant value and volume of purchases, totaling approximately R$ 6.8 billion in the years 2014-2016. In addition, these categories are composed of a relatively small and homogeneous group of products, which facilitates the development of purchasing strategies. They are also easily standardized, with well-defined specifications which are well-known in the market. The fact that these products are bought by various government agencies in a fragmented way represents great potential for savings. Purchasing data for 2014 to 2016 also show that prices in these categories respond to competition and demand consolidation, increasing the chances of success of the strategic sourcing projects.
64. These two categories present an estimated savings potential of between R$ 1.1 and R$ 1.6 billion over three years. Estimates are presented in a conservative scenario, easier to achieve and based only on better strategies and purchasing processes, and an aggressive, more ambitious scenario that requires changes in the pattern of consumption in addition to the best possible contract prices.
Vehicles
65. Vehicles purchases present a very attractive opportunity for strategic sourcing as they are easily standardized products with well-defined market segments, the purchasing value is large, and many different Federal Government agencies buy vehicles. Therefore, it is a category that can generate savings in a simple and fast way. Between 2014 and 2016, the Federal Government purchased 33 distinct products in the vehicles category, four of which - buses, trucks, cars and ambulances - accounted for 80 percent of the total value purchased during the period. Additionally, 90 percent of the demand for cars in 2014 originated from institutions located in the Federal District. These are conducive characteristics for the design of purchasing strategies.
66. While demand is concentrated in a few markets, half of all vehicle purchases covered only one or two units, thus dispersing demand among many government agencies. The largest car purchase in 2014 did not reach 16 percent of total demand for cars that year. Moreover, even though 103 different agencies have purchased vehicles, just seven of them accounted for 90 percent of the total value purchased. Equally relevant is the fact that 75 percent of the agencies that bought vehicles between 2014 and 2016, bought no more than 11 units over three years. This reveals the dispersion of demand and the impossibility of most agencies to obtain lower prices through economies of scale if they conduct purchases individually.
Spend analysis
Market analysis
Strategy for savings
Suppliers / Bidding
documents
Communication program Implementation

61
67. The fragmentation of demand for vehicles resulted in large differences in the prices paid by the Federal Government (Figure 39). For example, for a sedan-type car that has capacity for five passengers, prices ranged from R$ 55,000 to R$ 120,000, even considering only prices between the 25th and 75th percentiles. The discretion of the car specification is one of the reasons for this difference, which in some cases may result in the purchase of a product that exceeds its functionality and utility to the government. The data also show that price outliers occurred almost exclusively on very small purchases, of a few units.
Fragmentation of demand results in great dispersion of prices. Figure 39: Fragmentation of demand resulted in great dispersion of prices
Source: DW SIASG/Comprasnet and World Bank staff analysis
68. Data on car purchases from the years 2014 to 2016 show that suppliers offered different prices for the same product, depending on the buyer, the quantity demanded, the time of the year, among other factors. In one case, the price for the same car had a 40 percent difference. A centralized purchasing strategy could generate savings and also minimize the asymmetry of information between different government agencies, which results in substantial price variation for similar products.
69. Almost 80 percent of the value of vehicles purchased occurred in the last quarter of the year, precisely the period when vehicle prices are the highest. Possibly, the launch of new models may have contributed to the seasonality of prices. But execution so concentrated at the end of the year for a high value-added item raises the question of whether demand has been suppressed throughout the year or whether it is a result of budget unfreeze at the end of the year. Either option represents a significant opportunity for improving efficiency.
70. Moreover, almost 90 percent of vehicle purchases through framework agreements occurred in the last quarter, which seems to indicate that there is some dissatisfaction with the offers in the agreements, since the agencies seem to use this instrument only when there is not enough time to conduct an individual bidding. On the other hand, purchases through other procedures that did not use framework agreements, accounted for only 35 percent of the total over the same period. These numbers seem to suggest that it would be important to evaluate the offers provided

62
through framework agreements to ensure that they meet the demands of the various purchasing agencies.
71. Data on vehicle purchases during the years 2014 to 2016 do not allow a conclusion about the growth trend of the government’s vehicle fleet, but almost 54,000 new vehicles were purchased over this period. The introduction of new vehicles to the government’s fleet brings operating costs, in addition to acquisition costs. On average, the costs of operating a vehicle can represent between 15 and 33 percent of the total lifetime cost of the vehicle (Automotive Feet 2016)35. Federal government procurement data show that at least R$ 969 million was spent in the years 2014 to 2016 on the operation of vehicles - excluding acquisition costs. For this reason, the introduction of a new vehicle to the fleet is an important decision and one that should follow rules and policies.
72. Purchases of new vehicles use the lowest purchasing price as the criterion for choosing the winning bid; however, as mentioned above, the acquisition cost may only represent 67 percent of the total cost of a vehicle. It is suggested to adopt a more relevant metric to choose the winning proposals, which would be the price per kilometer. This metric includes not only the purchase price but also the operating costs of the vehicle, such as maintenance and fuel consumption. The lowest purchase price may not represent the lowest price when the expenses needed to keep the vehicle in operation are included (Figure 40).
The purchase price may represent only 67% of the total cost of living of a vehicle; price per kilometer would be a better fit for purchases of new vehicles.
Figure 40: Price per kilometer of a vehicle
Source: Automotive Fleet Magazine
35 Automotive Fleet Magazine.

63
73. In summary, regarding the purchase of vehicles, the following suggestions are presented for a procurement strategy:36
• Consolidation of demand in a main contract, with justified exceptions; • Limit to specifications and requirements of products according to functionality; • Adoption of a criterion for evaluating proposals for the acquisition of new vehicles based on
the price per kilometer or other metric that takes into account operating costs; • Standardization of specifications according to functionality; • Development and implementation of a fleet management policy for government vehicles; • Demand control in the last quarter of the year, in order to avoid purchases in the last month and
better distribute demand throughout the year.
IT equipment
74. The category of IT equipment is more heterogeneous than vehicles, with a total of 235 different products, 961 purchasing agencies, more than 5,300 biddings and a total purchase value of almost R$ 4 billion in the period of 2014 to 2016. Despite the diversity of products and markets in this category, a more detailed analysis of purchases reveals that in fact complexity is low and the potential for savings is high. For example, of the more than 200 products in the category, only four reach almost 70 percent of the total value purchased; and even more importantly, these four products are simple ones: laptop and desktop computers, computer networking equipment, personal computer software, and server software.
75. The category of IT equipment was one of the most competitive ones in the period of 2014 to 2016, with half of the biddings having nine or more bidders. Equally important, this category showed the behavior typical of competitive markets, with prices having a strong correlation with the level of competition and the quantities purchased. Considering that purchases of laptop and desktop computers totaled R$ 1.5 billion over the period – only trailing books - it can be concluded that this category presents a high cost/benefit ratio, since computers are easy to specify and purchase, and the potential for savings and improvement in average quality is quite high.
76. Data on purchases of laptop and desktop computers in 2014 show that purchases were widely dispersed: while more than 371,000 computers were purchased, half of the biddings included no more than six units, which reveals a great opportunity for economies of scale. By way of illustration, a survey of large organizations conducted by the Corporate Executive Board showed that 80 percent of organizations manage computer purchases on the largest possible scale, whether global, for multinational companies, or national, for companies with businesses in one country.37 The fragmentation of demand for computers by the Federal Government resulted in a great variation of prices paid for equipment that meets a very similar need (Figure 41).
36 It is important to mention that there are already initiatives in the Federal Government to rationalize expenses with the purchase of vehicles: for example, the servants’ mobility service established by the Ministry of Planning (Taxi-GOV). In addition to improving the efficiency of public spending, estimated savings of R $ 20 million per year, the TáxiGov will allow greater control and transparency on the transportation service, with more precise information on the use of vehicles. (http://www.planejamento.gov.br/taxigov) 37 Gartner Group, Corporate Executive Board, 2014. Category Manager Survey.

64
The large dispersion of unit prices contracted in the purchase of computer equipment reveals a large opportunity for economies of scale.
Figure 41: Contracted prices of main IT equipment
Source: DW SIASG/Comprasnet and World Bank staff analysis
77. The purchase of IT equipment by the Federal Government was distributed among several agencies but a particularity of this category was that many agencies had a very large demand: 66 agencies bought products at a value of over R$ 10 million over the period, and 10 agencies made up half of the total value purchased. The large number of buyers in this category means that the work on preparing a central purchasing strategy needs to be more detailed, seeking to understand the needs of the various users. However, it should be borne in mind that most purchases are of laptop and desktop computers and that it is relatively simple to specify these devices based on their desired functionality.
78. The behavior of the IT equipment market reveals that the potential for savings is high in this category since it behaves as a typical competitive market. Biddings with the highest number of bidders consistently pushed down contracted prices and prices reacted positively to biddings that consolidated demand. Moreover, the constant presence of many manufacturers in Federal Government biddings demonstrates that demand is attractive and that the government has credibility with manufacturers.
79. Purchases between 2014 and 2016 do not allow a conclusion about the trend in demand for IT equipment, but the amount spent is significant: R$ 143 million in 2014, R $27 million in 2015 and R$ 57 million in 2016. As software licensing is permanent and the need to upgrade the infrastructure is constant, it is not difficult to imagine that these expenses will continue to be high in the future.
80. The Federal Government maintains its own IT infrastructure, but many organizations are migrating some systems to cloud computing technology, with the primary goal of reducing costs. A Gartner Group survey found that organizations that embraced the "cloud" saved an average of

65
14 percent.38 These savings were derived from a reduction in expenses with infrastructure, software licensing, salaries, and flexibility made possible by the "cloud", since the service can be easily terminated when it is no longer needed. Figure 42 presents a breakdown of the key findings of the Gartner Group survey.
Figure 42: Use of cloud computing technology to reduce expenses with IT infrastructure
Source: Gartner Group 2016.
81. While a full migration of government systems to "cloud computing" is not recommended or desirable, the use of this technology for less critical systems can materially reduce the costs not only of investment but, more importantly, maintenance and infrastructure upgrading. Deciding which systems would be best kept in the "cloud" requires detailed analysis and consultation with various stakeholders that are outside the scope of this work.
82. In summary, these would be the main suggestions for generating savings in the purchase of IT equipment:
• For products of higher purchase value, consolidate the demand in one main contract; • Standardize technical specifications and requirements for products based on functionality and
end-user needs, with justified exceptions; • Gradually reduce the government's IT infrastructure, maintaining systems critical to its own
infrastructure as a priority, and migrating non-critical systems to cloud computing technology.
Opportunities for savings in federal government public procurement
83. With a total amount spent of nearly R$ 155 billion between 2012 and 2014, the Federal Government's public procurement market is quite large and presents eminent opportunities for
38 “Cost optimization secrets: plan and managed cloud services for 14% savings, on average”. (Garner Group, Corporate Executive Board, 2014).

66
savings. We estimate that in three years it would be able to save between R$ 24 billion through better purchasing strategies and R$35 billion if better purchases are accompanied by rationalization and demand management.
84. Greater consolidation of the Federal Government's demand prior to the purchasing process presents the best opportunity to derive savings through economies of scale. We estimate that this strategy if implemented properly could result in cost savings of 8 percent. Purchasing data shows a high degree of fragmentation of demand by the Federal Government, since purchases are planned and executed at the agency level, although many strategic products are purchased in large volume when the demands of all agencies are added.
85. Seasonality had a substantial effect on prices paid by the government, with December consistently being the most expensive month for purchases, and coinciding precisely with the period of the year when a substantial amount of purchases took place. In the case of vehicles, one of the highest value categories contracted, most purchases were made at the end of the year. Better procurement planning combined with a strategy that seeks to avoid the effects of seasonality could result in substantial savings for the government.
86. The data seem to indicate that offers trough framework agreements need to be emphatically improved: framework agreements not only resulted in higher prices, contrary to the original purpose of the instrument, but also a large part of the agencies preferred individual purchases unless close to the end of the year when time was insufficient. More than seven thousand products were offered through framework agreements, an exponentially higher number than found in organizations where the instrument brings positive results. This seems to indicate that framework agreements were used for purchases where the instrument would not be the best option. A reformulation of framework agreements with the objective of improving results and product offers will be a key element in increasing the efficiency of public procurement.

67
Pensions: An Unaffordable Bill
By international standards Brazil spends a lot on pension benefits, even though it still has a relatively young population. This amount is going to increase further over the coming decades as the number of old people increases rapidly. Estimates suggest that in the absence of reform by 2030 the entire federal primary spending allowed under the new expenditure rule (“teto”) would have to be used just for pension payments. The government’s proposed pension reform would reduce the deficit of the RGPS pension system by half over the next 50 years and save around 2 percent of GDP over the coming decade. These savings are a critical component of any credible fiscal adjustment strategy. The pension reform is necessary not only to reduce fiscal costs, but also to make the pension system more equitable. Per capita subsidies in the system for private sector workers (RGPS) are much higher for those earning three minimum wages or more. The proposed reform would impose higher adjustment costs on richer workers and thus make the system more equitable. The most inequitable part of Brazil’s pension system, however, are civil servant pensions which are extremely generous, particularly for those who entered before the 2003 reform. The federal civil servants pension system (RPPS) already runs a deficit of 1.2 percent of GDP. In addition, the deficits of subnational governments’ pension systems are expected to increase dramatically over the next decade bringing several state governments to the brink of bankruptcy. The large subsidies embodied in civil service pensions are highly inequitable since they are amongst the better off in the population. Civil servants must therefore contribute to pension reform for reasons of equity and sustainability. The concept of “acquired rights” needs to be revisited.
Review of Brazil’s pension systems in international context
87. Brazil maintains several public pension schemes at different levels of government. The federal government is responsible for two contributory pensions systems which work as defined benefits programs: The general pensions system for private sector workers (RGPS) and the pension

68
system for civil servants (RPPS). The largest system, the RGPS with about 59 million contributors and 30 million beneficiaries is administered by the National Institute for Social Security (INSS). Within the RGPS, most contributors and beneficiaries (54 and 20 million respectively) are part of the urban system, which collects contributions from formal sector workers and their employers. The RGPS also maintains a rural pensions program, which provides pensions to those who have worked in agriculture (even if without a formal contract) and which only requires minimal contributions. The INSS also administers the social pension program for the poor elderly and disabled (Beneficio de Prestaçao Continuada, PBC).39 Federal civil servants are part of the federal government’s own pension system (RPPS), which operates under conditions significantly different from those of the RGPS. States and the larger municipalities also maintain their own, separate RPPS systems, which are however subject to rules established in the federal constitution and federal laws. The public servants of smaller municipalities, which do not have their own RPPS, are enrolled in the RGPS.
88. The current pensions system is generous by international standards. Both pension systems (RGPS and RPPS) allow for contributors to retire by length of service with relatively generous parameters, which allowing workers to retire early and with high benefits. Many workers, especially those with higher wages in their mid-50s take advantage of this benefit. These pensions are fiscally costly, as they involve 100 percent replacement rates and horizon payments of 25 to 30 years. At the At this moment no OECD country offers pensions by length of service, as all pensions are granted by age. Currently, retirement ages in Brazil for those who retire by age are 65 and 60 for men and women respectively in the urban RGPS scheme; 60/55 for men and women in the rural one; 60/55 for male and female civil servants (RPPS); and 55/50 for male and female teachers and other special groups of civil servants, including the military police. These compare favorably with OECD standards, since even the OECD countries with the most generous pension system require a minimum retirement age of 65 or 67 years for both men and women (Figure 43). Replacement rates are also very high in Brazil as most workers at the end of their working years receive a pension equivalent to their final salary (aposentadoria integral),40 compared with replacement ratios of around 70 percent in most OECD countries (Figure 43).
89. While Brazil is still at an early stage of its demographic transition, pension expenditures are already higher than in many advanced economies with much older populations. Expenditures in the pension system for private sector workers (RGPS) were broadly stable until 2013 at about 6 percent of GDP but increased to 8 percent in 2016. The deficit of the RGPS system (urban and rural combined) reached 2.4 percent of GDP in 2016, of which the rural pensions accounts for about 1.6 percent. Expenditures of the various pension systems for public sector workers (RPPS) also increased, reaching 4.1 percent of GDP in 2015 (Figure 45). The federal RPPS system, which provides benefits to about one million retirees, had a cost of 1.8 percent of GDP in 2015, with a deficit of 1.2 percent of GDP. Spending on RPPS pensions systems for civil servants at the subnational level amounted to 2.4 as percent of GDP in 2015, and the deficit of the RPPS was estimated at around 0.84 percent of GDP (TCU 2016). Comparing total pension expenditure (RPPS and RGPS) as a share of GDP with the old age dependency ratio across countries reveals how much of an outlier Brazil is by international standards (Figure 46).
39 Since BPC is a non-contributory social program it will be discussed in detail in the social protection chapter. 40 In fact, the minimum pension is tied to the minimum wage and guarantees a 100 percent replacement rate for low-wage workers in the formal sector as well as rural workers.

69
Brazil’s pensions would remain very generous by international standards even after the reform
Figure 43: Retirement age (expected, 2040)
Source: European Commission (2015) and World Bank Figure 44: Theoretical Replacement Rate (for a male worker with 40 years of contribution)
Source: European Commission (2015) and World Bank
54
56
58
60
62
64
66
68
70
72
year
s
Men Women
0%
20%
40%
60%
80%
100%
120%
BE
BG CZ
DK DE EE IE ES FR HR IT CY LV LT LU HU
MT NL
AT PL PT RO SI SK FI SE UK
Bra
zil w
itho
ut r
efor
m
Bra
zil w
ith
adju
sted
ref
orm
% La
st s
alar
y

70
Brazil’s spending with pensions in the public sector is very high.
Figure 45: Pension expenditures with public servants: selected countries from OECD and Brazil (% of GDP)
Source: Whitehouse (2016) and World Bank estimates based on federal and state sources for Brazil.
Brazil already spends more than older countries and without reform, pension will make up all capped spending by 2030
Figure 46: Total pension expenditure (RPPS and RGPS) as a share of GDP and dependency ratio
Source: World Bank
0.0%
0.5%
1.0%
1.5%
2.0%
2.5%
3.0%
3.5%
4.0%
4.5%G
réci
a
Fran
cia
Áus
tria
Port
ugal
Finl
ândi
a
Chi
le
EUA
Rei
no U
nido
Isra
el
Ale
man
ha
Aus
trál
ia
Japo
n
Din
amar
ca
Hol
anda
Cor
eia
Irla
nda
Espa
nha
Can
ada
Polô
nia
Suéc
ia
Méx
ico
Eslo
vêni
a
Bél
gica
Suíç
a
Turq
uia
Bra
sil
% G
DP
Brazil
Australia
Austria
Belgium
CanadaChile
Czech Republic
DenmarkEstonia
Finland
France
Germany
Greece
Hungary
Iceland
IrelandIsrael
Italy
Japan
Korea
Luxembourg
Mexico
NetherlandsNew Zealand
Norway
Poland
Portugal
Slovak Republic
SloveniaSpain
SwedenSwitzerland
Turkey
United KingdomUnited States
0
2
4
6
8
10
12
14
16
18
0 5 10 15 20 25 30 35 40 45 50
Soci
al s
ecur
ity
spen
ding
(% o
f GD
P)
Dependency Ratio (% 65 years old population/working-age population)

71
Without reform, pension spending will absorb the entire space under the cap until 2030.
Figure 47: Projected pension expenditure and spending rule (% of GDP)
Figure 48: Present Value of projected RGPS deficit up to 2080 (% of GDP 2017)
Source: Simulation using World Bank fiscal model Source: World Bank estimates.
Note: The NPV is the sum of future projected deficit for RGPS up to 2080, discounted to a 5 percent rate.
The reform does not affect the unsustainable increases in States’ RPPS deficits in the next 3-5 years. The fiscal implications are large and systemic, and the solution requires leadership by the federal government.
Figure 49: Present value of estimated future deficits of states RPPS as a percentage of their GDP
Source: World Bank staff calculations using data from Ministerio da Fazenda. http://www1.previdencia.gov.br/sps/app/draa/draa_default.asp Notes: 1. The NPV is the sum of projected future RPPS pension deficits up to 2088 discounted at a 5 percent rate. 2. The data for MT, PB, SC and SP are not available.
0%
2%
4%
6%
8%
10%
12%
14%
16%
18%
20%
22%RGPS RPPS Teto
0%
20%
40%
60%
80%
100%
120%
140%
160%
Public Debt NPV of projectedRGPS deficits
% o
f GDP
(201
7)
0%
20%
40%
60%
80%
100%
120%
140%
AC RN PI SE AL CE DF AP RS MA PA GO PE AM MG MS BA PR RJ TO RR ES RO PB* SC* SP* MT
perc
ent
of S
tate
GD
P
NPV of pension deficits Explicit Debt

72
92. Brazil is approaching a crisis of the pension system at the subnational level. The deficits of the subnational civil service systems (RPPS) are projected to increase rapidly in the coming decade as many public servants will retire under the generous pre-2003 benefit rules. Simulations of the RPPS schemes suggest that following this deterioration, pension deficits will stabilize and then gradually start decreasing after around 2035 as the effects of the 2003 reform kick-in (Figure 50). According to published actuarial data self-reported by 23 states, subnational RPPS deficits are projected to increase from 1.6 percent of GDP in 2014 to 2.1 percent by 2020, before moderating to 2.0 percent in 2027, 1.7 percent in 2036 and 0.4 percent by 2066.41 In the absence of reform, by 2030 several states and municipalities will need to spend up to a third of their net current revenues (receita corrente liquida) to finance pension deficits. Simulations in three states (Bahia, São Paulo and Rio de Janeiro) suggest that in the baseline scenario, RPPS pension deficits will rise to 20-30 percent of net current revenues in the next 15 years (Figure 50).42 The present value of projected future deficits of state governments’ RPPS systems is estimated at 30 percent of their GDP on average, much higher than states’ explicit debt (12 percent of state GDP on average) (Figure 49).43
Figure 50: Projected RPPS spending (as percent of current net revenues) in the states of Bahia, Sau Paulo and Rio de Janeiro
Source: Simulations using World Bank PROST model
41 Calculations are based on projected pension deficits self-reported by 23 states (excluding Mato Grosso, Paraiba, Santa Catarina and São Paulo), available at: http://www1.previdencia.gov.br/sps/app/draa/draa_default.asp, relative to their GDP. It should be noted that the quality of these data is likely to be low. 42 Our calculations focus on Bahia, Rio de Janeiro and São Paulo, but these states are likely to be representative of many more states, especially in the south and south east of the country. 43 This estimate is based on data on actuarial RPPS deficits reported by the individual states available at: http://www1.previdencia.gov.br/sps/app/draa/draa_default.asp. The deficits were discounted to NPV using a 5 percent discount rate, and then accumulated until 2088. The data for MT, PB, SC and SP are not available and these 4 states were excluded from the calculation. It should be noted that the quality of these data is likely to be low.
0%
5%
10%
15%
20%
25%
30%
35%
2014
2016
2018
2020
2022
2024
2026
2028
2030
2032
2034
2036
2038
2040
2042
2044
2046
2048
2050
2052
2054
2056
2058
2060
2062
2064
2066
Bahia
São Paulo
Rio de Janeiro (exc. royalties)

73
Incidence of pension subsidies
93. Most of the subsidies implicit in current generous pensions benefit the richest half of the population. The deficit of the pension system implies a transfer from taxpayers to retirees under the RGPS and RPPS, who are already relatively well-off. Incidence analysis highlights that 82 percent of current pension subsidies benefit the top 60 percent of society, and 35 percent accrue to the top quintile alone. The next section provides more details on the incidence of pension subsidies.
94. The vast majority of the elderly in Brazil receive some form of pension. The coverage rate varies among states but is on average 82 percent. As a result, poverty among the elderly population in Brazil is below 5 percent, which is a great achievement for a developing country. These low levels of poverty are achieved by a significant amount of resources transferred to that segment of the population, through different programs including rural pensions and BPC social pensions. This resource allocation to the elderly contrasts with higher poverty levels and among the younger population and fewer resources spent on them (Figure 51).
Expenditures and pension benefits are regressive and only benefit the poor slightly
Figure 51: Cumulative distribution of pensioners by decile, 2014
Figure 52: Lorenz curves of per capita income, per capita pensions/retirement benefits, and subsidies to the per capita pensions in Brazil, 2015
Source: World Bank estimates using PNAD 2014
95. Despite high coverage of the old age population, pensions in Brazil benefit primarily the richest in society. Using the PNAD data it is possible to calculate the distribution of pensioners by decile of per-capita income. The cumulative distribution shows that they are particularly concentrated at the 6th decile (20 percent of them), since the upper cutoff of this quintile (R$ 776) was slightly above the minimum wage in 2014. Notice that less than 20 percent of individuals receiving a pension of some kind are in the bottom 40 percent of the population, and 30 percent of them are in the top 20 percent (Figure 51). A similar result is observed from the Lorenz curves of per capita income and per capita retirement benefits (Figure 52). This result shows that pensions and total income have a very similar
0
20
40
60
80
100
1 2 3 4 5 6 7 8 9 10
cum
ulat
ive
% o
f the
su
bpop
ulat
ion
in d
ecile
Per capita income decile
Receive pensions
45-degree line

74
(unequal) distribution. Pensions are more unequally distributed than total income for the bottom half of the population; since most pensioners are concentrated around the sixth decile, there’s a “bump” in the distribution at that point, and from them on the concentration follows closely total income.
96. Pensions are so generous that even a significant reduction in their amount would still maintain retirees well above the poverty line. Those receiving pension benefits generally rely on it as their primary source of income. Conditional on receiving a pension, this income accounts for over 70 percent of total income for all ages, and above 80 percent for those aged over 60. As a percentage of total household income, this share is smaller, ranging from half among those in their 40-50s and increasing to around 70-75 percent for those aged 60+. Poverty rates (here measured as the share of individuals living in households with per capita income below R$140 per month in 2012 prices) would shoot up for older individuals if we excluded pension income (Figure 53). Such an exercise, nevertheless, ignores the fact that (i) reforming pensions does not imply completely erasing pensions but adjusting them; and (ii) median pensions are significantly above the poverty line. For individuals aged 60+, median household per-capita income is around 4 times the poverty line (140*4.5 = R$ 630, the minimum wage in 2012 prices) and the average income is around 6-7 times the poverty line. This means that significant reductions in pension income would still keep these individuals well above the poverty line.
Without the pension income, poverty among the elderly would be much higher; this exercise, however, ignores the fact that the median of pensions is significantly higher than the poverty line.
Figure 53: Estimates of poverty rates (R$ 140 per capita) with and without pensions income
Source: World Bank estimates using PNAD
97. The Brazilian pension system entails an element of social transfers which varies across the population. Intuitively, if a pension system is self-funded, there is no public expenditure involved: we can treat all pensions income as a deferred market income or forced savings. However, when pension systems run deficits, a transfer of public resources to individuals covers the difference between revenues and disbursements. Consider, furthermore, that different groups of individuals receive different “net transfers”: rural workers, for example, are in practice (if not de jure) exempt from
0%
10%
20%
30%
40%
50%
60%
0 3 6 9 12 15 18 21 24 27 30 33 36 39 42 45 48 51 54 57 60 63 66 69 72 75 78 81 84 87 90
Original
No pensions

75
contribution. For them, pensions are a pure public transfer. Some redistribution from higher to lower earners is common across pay-as-you-go defined benefit pension systems. In Brazil, however, the redistribution is the other way around—net transfers per capita are much higher for the rich.
98. The results of pension subsidies by quintile shows that the current pension system is regressive as it mostly benefits the middle class and well-off.44 For the sake of illustration, the distribution is also compared to the benefits of Brazil’s flagship conditional cash transfer program (Bolsa Família), social pensions (Benefício de Prestação Continuada, BPC) and RGPS rural pensions (which are de facto non-contributory) (Figure 54). Around half of all pension subsidies accrue to the top two income quintiles.45 Only 4 percent of pension subsidies accrues to the bottom 20 percent. 44 Public “pension subsidies” are defined as the difference under prevailing pension system rules between average benefits and average contributions by each income quintile of the population covered by the PNAD household survey. The calculation includes the benefits under the RGPS (urban and rural) and the RPPS. 45 To calculate this, we estimate average contributions and average benefits received by each quintile from PNAD data using prevalent pension system rules. Even though the share of contributions in total benefits is smaller for lower quintiles (i.e. the percentage subsidy is higher), because lower quintiles receive a much smaller share of total benefits, the incidence of total pension system subsidies is skewed to the better off.
The pension deficits constitute a social transfer which is highly regressive compared to other social assistance program Figure 54: Distributional analysis of public pension subsidies, Bolsa Familia and BPC
Source: World Bank estimates, using PNAD. Note: 1. Results should be treated with caution as the inability to distinguish between key benefit types in the PNAD (after 2006) requires strong assumptions. 2. “Public pension subsidies” are defined as the difference under prevailing pension system rules between average benefits and average contributions by each income quintile of the population covered by the PNAD household survey. It includes the benefits under the RGPS (urban + rural) and the RPPS. 3. The incidence is calculated using total per-capita income. Thus, the results also reflect the fact that the benefits received by BPC and rural pensions recipients are high compared to the income distribution.
4% 2%
57%
12%14%
22%26%
19%
35%
44%
10%
26%
12%
22%
3%
24%
35%
10%
3%
19%
0%
10%
20%
30%
40%
50%
60%
Public Pensions - Subsidies Rural pensions Bolsa Familia BPC
Q1 Q2 Q3 Q4 Q5

76
Similarly, 76 percent of beneficiaries of rural pensions are in the top three quintiles, and only 2 percent are in the bottom quintile. By contrast, 57 percent of Bolsa Família, benefits accrue to the poorest 20 percent of households. The BPC lies somewhere in the middle, with around 43 percent of benefits accruing to the top two quintiles and 12 percent to the bottom 20 percent (Figure 54; see also chapter on Social Assistance Programs). Another way to make this point is that there are few contributors and few beneficiaries of the pension system in the bottom quintile as the poorest Brazilians rarely hold formal sector jobs. Hence when the system runs deficits, this constitutes a transfer from society at large to the better off. By implication, the reform of the RGPS and RPPS would not have any impact on the poorest (and indeed may generate resources to increase allocations to pro-poor programs such as Bolsa Familia).
Brazil’s pensions system is highly inequitable, with the richer workers receiving the greatest subsidies to their pensions
Figure 55: Net Present Value over the lifetime of RGPS membership and Net Present Value over the lifetime of RPPS pensions in the State of Rio de Janeiro (in number of minimum wages)
Source: World Bank calculations. Note: The “Military” category here includes military and civilian police as well as fire brigades.
99. Another way to look at the incidence of pension spending is to calculate the net present value of transfers for typical cohorts of workers. Using contributor data for the RGPS, it is possible to calculate the expected lifetime benefits accruing to different cohorts of workers. RGPS contributors are grouped in three profiles based on their expected contribution history at the time of retirement: (i) those on track to achieve 35 years currently needed for length of service pensions before reaching regular retirement age and earn around 3 minimum wages on average; (ii) those on track to achieve the 25-34 contribution years by age 60/65 for women and men respectively and earn on average 2 minimum wages; (iii) those who will only achieve between 15-24 years of contribution and earn around 1.5 minimum wages. The first group accounts for around 50 percent of all RGPS contributors, the second for 20 percent and the third for 30 percent. For each profile, the net benefit of they obtain under the
-200-150-100
-500
50100150200250300350400450
Contribution pension survivor pension NPV

77
current and the reformed pension rules is calculated as the difference between the net present value (NPV) of benefits minus contributions (whereby the expected value of a survivor pension is added to the NPV). We also compare the benefits accruing to these three groups to that of non-contributory pensions (BPC and rural pension), where the benefit is simply the NPV of future benefits.46 The key result is that the highest net benefits of the current system accrue to workers with the first profile, whose net benefit is estimated at about 22 monthly minimum wages (Figure 55). Similarly, rural workers also receive a relatively high level of net benefits.
100. A similar analysis for contributors to the RPPS pension system shows how extraordinarily large the net-transfers to pre-2003 civil servants are. For illustration purposes, here we present calculations for state of Rio de Janeiro (Figure 55). Civil servants of this state are among the best paid in the country, so the case may not be fully representative, but the qualitative results are the same, as the vast majority of civil servants belong to the top 60 percent of the national income distribution (see chapter on civil service wage bill).47 The net present value of RPPS benefits differs enormously for contributors belonging to the pre-2003 or post-2003 system. The 2003 reform significantly reduced the actuarial deficit of the RPPS, except for the special regimes maintained for teachers and the military police. The implicit RPPS subsidy is enormous, however, for all those in the pre-2003 system: above 80 monthly minimum wages for teachers hired before 2003, above 100 monthly minimum wages for executive civil servants hired before 2003, and above 200 monthly minimum wages for the military police. For the judiciary and the legislature, the net pension subsidies are above 250 monthly minimum wages.48 Since these civil servants are almost all in the richest 40 percent of the population, it is clear that Brazil’s civil service pensions system is highly inequitable.
Reforming Brazil’s public pensions: The Government’s proposal
101. The pension reform proposed by the government in December 2016, and subsequently adjusted by the Special Commission in Congress in May 2017, would constitute an important first step towards rationalizing benefits, improving incentives and recovering fiscal sustainability. To improve the financial sustainability of the pensions system, the government presented a pension reform proposal (PEC-287/2017) to Congress in December 2016. The proposed reform seeks to even out difference between various public pension regimes and reduce incentives for early retirement. The proposal approved by the Special Commission in the Lower House envisages an increase in the retirement age to 65 years for men and 62 for women. Together with the increase in the retirement age, the reform proposes the elimination of pensions by length of service (or by years of contribution) and an increase from 15 to 25 years for the minimum contribution necessary to qualify for an old age pension. Contributors with less than the minimum of 25 years of contribution will be eligible for a social pension, currently equivalent to the minimum wage. Further, the reform would change the benefit formula from 70 percent of the highest salary with an extra 1 percent for each year of contribution (which currently results in a near 100 percent replacement for many workers) to 70
46 The discount rate used to calculate NPV benefits is the real wage growth rate, which in our model is calibrated to equal labor productivity growth. Because rural pensions are paid from age 60 for men and 55 for women 13 times a year, whereas BPC is received only at age 65 and paid 12 months a year, the net present value of rural pensions is much higher, even though the nominal benefit value is the same. 47 Over 90 percent of civil servants in Rio de Janeiro are in the top two income quintiles, compared to 79 percent of federal civil servants. 48 Similarly, the NVP subsidies for the military in the RPPS are 200 minimum wages, versus 10 minimum wages for group 3 contributors to the RGPS.

78
percent of the average salary plus 1.5 percent for each year above 25 years of contributions, plus 2 percent for each year above 30 years of contribution, and plus 2.5 percent for each year above 35 years of contribution. In practice this means that it will now take 40 years of contribution to have a 100 percent replacement rate. Subnational entities would have a period of 6 months to approve their own reform of the subnational RPPS systems, or would have to adopt the federal reform. Further, the reform reduces the possibility of one person to receive pension benefits of longevity and survivor, imposing a limit of two minimum wages in cumulative benefits. The new rules will be gradually introduced, with transition rules being applied to men above the age of 45 and women above 44 (see below). It is estimated that the original reform would have reduced pension spending by 2.1 percent of GDP by 2026 relative to the baseline (no-reform) scenario. The revisions agreed in Congress have reduced this amount to about 1.8 percent of GDP by 2026 (Figure 56)49.
102. The proposed reform would not affect current retirees and includes transition rules for those near retirement. Those already retired or eligible for retirement under current rules would maintain their benefits and entitlements (since those are considered legally protected acquired rights, “direitos adquiridos”). The minimum retirement age will be phased-in, beginning with 53 years for women and 55 years for men, and rising one additional year every two years until reaching 62 for women in 2036 and 65 for men in 2038. Older contributors, men at least 45 and women at least 44 years of age, would be subject to a transition rule which applies a 30 percent penalty over the time needed for reaching the retirement age beyond the current requirements for a length of service pension.
103. The pension reform is a necessary step for stabilizing the fiscal situation but even if it were fully enacted, additional amendments to the pension system will be needed within a short timeframe. Due to demographic pressures, pension deficits will continue to increase even with the proposed reform. The reform proposal would only halve the deficit, such that even with its implementation pension expenditures are still projected to grow significantly with the deficit reaching 8.6 percent of GDP by 2067 (Figure 56). While this would be a significant step forward, it would not eliminate the need for further substantial reform in future. Part of this deficit (increasing from 1.6 percent of GDP in 2015 to 1.8 percent by 2067), however, is related to RGPS rural pensions (Figure 56). Rural pensions are de facto non-contributory, and therefore the RGPS rural pensions scheme will naturally entail a deficit. It would be appropriate to assess the rural RGPS system separately from the rest of the RGPS system, and to compare it instead with the BPC social pensions and other social programs in terms of their fiscal cost, targeting and generosity.50
104. Overall, the proposed reform would make the pension system more progressive. The reform reduces benefits mostly for those workers who currently would retire early and with high pensions. To see why, it is useful to return to the calculation of net present values of pension benefits in the RGPS and RPPS and compare the value of net transfers before and after reform. As shown in Figure 57, the biggest reduction in net benefits is experienced by contributors in the first group, with 35 years of contribution and an average salary of about 3 minimum wages. Workers in the third category, with only 15-24 years of contribution and a salary around one minimum wage experience the smallest reduction in net transfers. Overall, 78 percent of the total NPV savings achieved by the reform
49 The current proposal for pension reform does not change the pensions of the military. 50 Focusing only on the urban RPPS, the reform proposal would decrease the deficit from 14.5 percent of GDP in 2067 without reform to 6.8 percent after the proposed reform.

79
are obtained by reducing benefits to workers in groups 1 and 2. As a result, the reform would make the pension system more equitable than it currently is.
The pension reform will be insufficient to bring the RGPS into equilibrium: Due to demographic pressures, pension deficits will continue to increase even with the proposed reform. The reform will largely be progressive, as the benefits of the poorest groups will be protected.
Figure 56: Projected RGPS deficit (% of GDP): Baseline Scenario and Adjusted Reform proposal (of May 2017)
Figure 57: Net-present value benefits enjoyed by different groups of retirees, Baseline Scenario and Adjusted Reform proposal (of May 2017)
Source: Simulation using World Bank PROST model
105. The decision to uphold the “acquired rights” (direitos aquiridos) of current retirees introduces a significant intergenerational inequity to the reform of the pensions system. In Brazil, the Constitution protects the pension rights of those that are already retired, and court rulings have established the principle that benefits cannot be revised ex-post. However, in the current situation it can be argued that upholding this concept makes the pension system less fair than it should be. In fact, current workers are paying for the very generous benefits of current pensioners, while they themselves will not enjoy the same level of benefits because the system was unsustainable in the first place. In other words, the total cost of the necessary adjustment is being shouldered by the younger generations. A reconsideration of the direitos aquiridos, with a view to equalize (or at least approximate more closely) the package of benefits across different generations of workers would ensure intergenerational fairness. One option that would address the current inequities is to increase taxes on existing pension income.51 A further possibility would be to make more intensive use of income taxation (where there are no acquired rights) to solve this distortion.
51 Currently, the RPPS employee contributions for the federal government and most states is 11 percent (for current workers as well as for retirees on their income above the RGPS maximum of R$ 5,531), but the government has proposed to increase this to 14 percent. Some states have raised contribution rates, but decisions by the Federal Supreme Court (STF) have so far limited RPPS employee contributions to a maximum rate of 14 percent. Considering that many existing pensioners retired with a replacement rate close to 100 percent but that future replacement rates may on average decline to between 70-80 percent, a higher rate of contribution, around 20-30 percent on pension income may be justified.
0%
2%
4%
6%
8%
10%
12%
14%
16%
18%
2017 2027 2037 2047 2057 2067
RGPS urban base RGPS rural base
RGPS urban reform RGPS rural reform
-50-30-1010305070
-50-30-1010305070
Contribution pension survivor pension NPV

80
Reform of subnational civil service pension systems (RPPS)
106. The unfolding crisis of the subnational pensions system requires urgent action. The current reform proposal does not significantly alter the rights of pre-2003 civil servants which are at the heart of the subnational RPPS solvency crisis. Civil servants do not tend to retire early, their contribution density is high, and they do not benefit from minimum pension subsidy, which are the issues on which the current reform efforts are focused. Instead, the short- and medium-term problems of the RPPS are caused by integralidade and paridade,52 which were eliminated for post-, but not for pre-2003 workers. Hence, the 2003 reform already largely resolved the long-term deficits of the RPPS three-four decades from now (except for the military police, which was exempted from the 2003 reform). However, the RPPS fiscal imbalance is expected to grow rapidly in the short and medium term, which the proposed reform does not address (Figure 42).53 In fact, simulations for the State of Rio de Janeiro suggest that the proposed reform would not substantially improve the state’s projected RPPS pension deficit.54 The challenge therefore is how to deal with the deficit hump over the next 15 years, which is related with the pre-2003 benefits. In addition, the deficit associated with pensions of the military police (and related units such as fire brigades) is will grow rapidly and continue to be large in the long term. Reforming these military pensions, therefore, also needs to be part of the agenda.
107. It is necessary to change federal rules to allow subnational governments to control the cost of their RPPS systems. Federal legislation limits the room for RPPS reform at the subnational level. Hence it is urgent that pension reform proposals are complemented with a change in federal rules to allow subnational governments to control the cost of their RPPS systems. Subnational governments that do so, for instance by raising tax rates on retirement income, increasing the retirement age for civil servants or lowering the replacement rates by changing pension indexation, could be offered liquidity support from the federal government to smooth the transition. The failure to achieve a cooperative solution could result in a widespread crisis—as many subnational governments would become insolvent and unable to pay their civil servants—ultimately resulting in much higher fiscal and social costs.
108. The federal government needs to take the lead in negotiating a solution. While the problem will affect subnational governments’ public finances, it is a systemic issue which requires leadership by the federal government. In fact, unsustainable subnational pension obligations constitute a large contingent liability for the federal government. Further, it is critical for the federal government to work with the judiciary to arrive at a solution which will not be undermined by subsequent court rulings.
52 Integralidade (“Integrality”) refers to the 100 percent replacement ratio at the level of the final salary of the worker; Paridade (“Parity”) consist in granting the pensioners the same salary increases granted to active civil servants. 53 The proposed reform affects the pre-2003 civil servants who are yet to retire in that they will need to reach the new retirement age of 62/65 for women/men to gain the benefits of paridade (pension adjustment in line with active servants). If they choose to retire early, they still receive a pension with a 100 percent replacement rate (integralidade) but it will only be adjusted by inflation going forward. For those in the post-2003 cohort, who do not enjoy paridade, the replacement rate would change to be calculated in the same way as for the RGPS: 70 percent plus bonus for contribution years beyond 25, with 40 years of contribution needed to achieve 100 replacement (integralidade). These changes would affect the federal RPPS and subnational RPPS of entities that do not pass a reform of their own within 6 months. 54 There is one provision of the proposed reform which would have some impact. Around 55 percent of civil servants hired before 2003 would lose the paridade unless they delay retirement. Modeling the impacts of this change is complex, however.

81
For the states the pension deficit is mainly due to pre-2003 cut and the military police.
Figure 58: Composition of projected RPPS deficit (as percent of current net revenues) in the State of Rio de Janeiro
Source: Simulations using World Bank PROST model.
Options for reform and fiscal savings
109. The current pension reform proposal (as revised by the Congress in May 2017) would bring fiscal savings of about 1.8 percent of GDP by 2026 and it is socially balanced, and its approval is therefore paramount. The generous pension benefits offered in Brazil are an outlier compared to the rest of the world and, also given the rapid demographic aging, Brazil can no longer afford the pension benefits it is currently offering. The proposed reform would not eliminate spending pressure from pensions which are driven by rapid aging, but it would slow them down, preserving resources for other spending priorities. It does so by mostly eliminating subsidies received under the current rules by formal sector workers and civil servants who belong to the top 60 percent of households by income distribution. The proposed pension reform in Brazil thus does not only make a significant contribution to overall fiscal adjustment, but it also makes the pension system less regressive than it was. The result is not at all unfair to richer workers. The reform merely reduces the unjustified subsidies that this group of workers retrieves from the system, so that their benefits are comparable to their contributions. Importantly, the poorer workers, with fewer years of contribution, are relatively better off after the reform than the higher income workers, whereas the opposite is true in the current system.
110. While the proposed reform represents an important adjustment, looking ahead it is clear that additional reforms will be required to strengthen the fiscal sustainability of the RGPS pension system and make it more equitable. Based on model simulations (presented in Volume II) some detailed recommendations include:
0%
5%
10%
15%
20%
25%
30%
35%
Non-Military, pre-2003 Non-Military, 2003-2012 Military

82
- To contain long-term deficits, it will be necessary to further reduce replacement rates, since even with the adoption of the current reform replacement rates will still be high by international standards. Specifically, reducing the base replacement rate by another 20 percentage points would reduce RGPS deficits by 1.8 percent of GDP in the medium term;
- Delinking the minimum pension benefit from the minimum wage (correcting only for inflation) would also provide considerable savings over time. This measure would have the most significant impact to reduce the fiscal deficit compared to other policy actions for stabilizing the implicit debt of the RGPS (e.g. compared to further raising the retirement age and reducing the replacement rate). Freezing minimum pensions in real terms, would achieve an additional reduction in the RGPS deficit (urban and rural) of 0.5 percent of GDP by 2027 and 2.3 percent by 2067.
111. It is also recommended to recognize social pensions (BPC) and rural pensions as non-contributory social programs, and to consolidate them in the context of the social assistance system. The revenues from contributions to the rural pension program are too insignificant to designate it as a contributory program. By moving the rural pension program into a non-contributory scheme, the program could become more manageable, as benefits might be better targeted to individuals that need the support, and it would also reduce the multiplicity of benefits, including the derived survivor pensions and 13th monthly pension payment. While the objective of both these pension programs is to prevent different groups of elderly from falling into poverty, they are not well targeted to poor individuals. While perhaps counterintuitive, therefore, a reform to consolidate social pensions with other social assistance programs (by aligning their targeting and levels of benefits) would contribute to improve equity and protection of the poor (see section on social assistance programs below). 112. For the RPPS systems, there is an urgent need to increase contributions and to introduce a tax on retirees’ income to defuse the expected rapid increase in subnational pension deficits over the next few years. Much of the increases in subnational pension deficits expected over the next decade is explained by the large benefits granted to individuals that entered the civil service before 2003. There is a need to reduce these benefits since the system is unable to support such a generous level of benefits as was promised. Moreover, the large subsidies inherent in the pre-2003 pensions are highly inequitable since civil servants are amongst the better-off in the population. Looking at the longer term, there is also a need to reform the pension system of the national military and military police (at subnational level).
113. Since the required adjustment is very large, the pension reform should share the burden among all generations, including current retirees. Future reforms need to share the burden within generations, as certain groups of the population, including women, rural workers, teachers and the military have special pension benefits that are difficult to justify and are no longer affordable. One option that would address the current inequities is to increases taxes on existing pension income. Since this is a systemic issue which constitutes a large contingent liability for the federal government, there is a need for the federal government, in coordination with the judiciary, to negotiate a solution which will not be undermined by subsequent decisions of the courts, with a view to equalize (or at least approximate more closely) the package of benefits across different generations of workers.
114. Conservative human resources policies for the federal and subnational governments are also essential to stabilizing future pension expenditures. Prudent human resources policies entail allowing for modest wage increases (since civil servants are already paid significantly more than private

83
sector workers—see chapter on wage bill), but also hiring policies that minimize the actuarial impact, and revisions of the structure of remunerations of civil servants in accordance with lower pension expenditures in the future. By adopting a conservative indexation policy regarding the minimum wage for teachers (piso salarial), the federal government can contribute significantly to alleviate the pension deficits of the states, as typically the whole remuneration structure is built over the floor, even in more wealthy states.

84

85
Labor Market and Social Assistance Programs: Integrate to Improve
Social protection is an integrated system of social assistance, labor market programs and pensions systems. These interact to protect the individuals at times of need and they influence people’s choices and labor productivity. In Brazil, there are many programs, which are insufficiently coordinated, creating duplication and inefficiencies by targeting transfers to the non-poor. Programs are largely designed in isolation, without considering their interaction. Overlaps are large, with millions of families entitled to several benefits that have the same objectives, while gaps in coverage leave other households in poverty. The multiplicity and incoherence of instruments raises risks of overspending and may weaken incentives for poor households to help themselves by joining the labor market.
Levels of expenditure for Social Assistance and Labor Programs
115. Brazil has many social protection and labor programs but they are insufficiently coordinated, creating duplication and regressive spending. Brazil’s social protection system is a complex construct comprised of many programs, with varying yet overlapping objectives and target populations. These programs are largely designed in isolation, without considering their interaction. As a result, there are large overlaps in programs with millions of families entitled to multiple benefits. The multiplicity and incoherence of instruments also raises risks of overspending and perverse incentives due to unintended interaction or duplication of programs.
116. Brazil’s social protection system is biased in favor of the elderly, who receive large per-capita benefits through the various pension regimes (Figure 59). Spending on pensions, social assistance and labor programs has been rising, driven by demographics (aging), structural changes (formalization during the high-growth years) and policy choices (the level of the minimum wage). The largest share of spending is on social security regimes (RGPS and RPPS), which, as discussed in the

86
previous section, entail a significant subsidy component, since their growing deficit is financed from general taxation (Figure 60). Some programs, such as the one for rural pensions and the social pensions program for the poor elderly and disabled (BPC) provide a cash transfer benefit which is relatively large and which rises automatically as it is set to the minimum wage. Overall, Brazil already spends more on pensions than demographically advanced (old) countries, even though Brazil is still relatively young and only on the cusp of rapid population aging.
117. Brazil’s overall spending on social assistance programs at 1.5 percent of GDP is in line with peer countries. Spending social assistance for the poor or vulnerable in Brazil has grown over the past decade as coverage and benefit levels increased. As of 2015, Federal Government spending on social assistance programs claimed about 1.5 percent of GDP or 7 percent of total federal primary spending (Figure 60).55 This represents an increase from about 1 percent of GDP spent on social assistance a decade earlier.
In comparison with other countries, Brazil spends a lot with the elderly and very little with other groups.
Figure 59: Share of Old Age Expenditures Compared to Share of Population Older than 65 Years
Source: World Bank, WDI
118. Social assistance spending is dominated by BPC non-contributory, or ‘social’ pensions. Two programs account for 75 percent of federal spending on social assistance: the social pensions program for the poor elderly and disabled (BPC) and the Bolsa Família program of conditional cash transfers. These two programs account for 0.7 and 0.5 percent of GDP, respectively (Figure 61). The BPC provides a relatively high level of benefit per person, equal to one minimum wage (R$ 937 in 2017). This amount is more than three times the maximum benefit a family can receive under the Bolsa
55 If one considers rural pensions as a welfare benefit, that percentage would more than double from 1.5% to approximately 3.5%.
DNK
FRAFIN
AUT
BEL
ITA
SWEESP
GRC
DEU
PRT
CHE
LUXNOR
HUNSVN
IRL
JPN
NLDGBR
POLCZE
ISL
AUSSVK
NZL
EST
Brazil (2011)
ISR
USA
CANCHL*
TUR
KOR
MEX*
Brazil (2014)
0%
10%
20%
30%
40%
50%
60%
70%
80%
90%
5 10 15 20 25
Spen
ding
on
Old
Age
as
shar
e of
Tot
al
SPL
(Sou
rce:
SO
CX
or A
spir
e)
Pop. 65 + (% of total)

87
Família program (R$ 280 in 2017). BPC has seen a significant increase in beneficiaries (reaching 4.4 million) as well as a real increase in benefit levels, since benefits are set equal to the minimum wage which has been increasing steadily over time. Bolsa Família also saw increasing coverage, reaching 14 million families, however benefit levels have remained fairly flat in real terms.
Subsidies associated with the pension deficits are as high as the entire social assistance and labor market programs
Figure 60: Spending on pensions, social assistance and labor programs (percent of GDP)
Source: World Bank staff estimates using Brazil BOOST database Federal-level, based on data from SIOP (Sistema Integrado de Planejamento e Orçamento) Note: This figure does not account for subnational expenditures, and therefore the numbers on the pension deficit are smaller than those discussed in the section on pensions above. It should also be noted that, as discussed above, the RGPS deficit increased significantly in 2016.
119. Budgetary spending on labor programs accounts for 1.2 percent of GDP, but rises to 2.9 percent of GDP when considering off-budget programs (Figure 62). Important labor market programs are off-budget, such as withdrawals from employer financed mandatory individual savings accounts (FGTS, 1.65 percent of GDP), the wage allowance under Salário Família (0.05 percent of GDP) and training programs provided by the Sistema S (0.13 percent of GDP). Including these programs, total spending on labor market programs in 2015 reached 2.9 percent of GDP, above the OECD median. Labor market spending increased in the decade up to 2015, driven by growth in the labor force, formalization and rising real wages.
120. Spending on labor market programs (on budget) is dominated by unemployment insurance (Seguro Desemprego). Spending on Seguro Desemprego reached 0.64 percent of GDP in 2015 (Figure 62). The second largest segment of labor program spending is government contributions to the FGTS accounts of some categories of workers due to specific compensatory legislation (0.29 percent of GDP). The third largest program is the “salary bonus” (Abono Salarial), a wage subsidy program meant to incentivize formal sector employment (0.16 percent of GDP).
2.6%
8.5%
1.1%
1.5%
13.8%
0%
2%
4%
6%
8%
10%
12%
14%
16%
Per
cent
of
GD
P
Pensions deficit Pensions Labor Market Social Assistance Total SPL

88
There are many social and labor programs, but a few large programs dominate in terms of spending. Social assistance spending is dominated by BPC social pensions. Labor spending (on budget) is dominated by Seguro Desemprego.
Figure 61: Budget expenditures on main social assistance programs, 2015
Figure 62: Budget expenditures on main labor market programs, 2015
Source: World Bank staff estimates using Brazil BOOST database Federal-level, based on data from SIOP (Sistema Integrado de Planejamento e Orçamento)
121. Spending on labor market programs is unbalanced towards passive (income support) programs, and not well designed to incentivize stable, formal sector employment. Brazil spends 0.9 percent of GDP on passive programs for the unemployed, which increases to 2.4 percent of GDP when off-budget programs such as FGTS are included (Figure 62). The way these programs are designed (access to Seguro Desemprego and the full balance on the FGTS account) may encourage high labor force turnover with short durations, rather than stable employment (see below). The country also spends significant resources on wage subsidies, amounting to 0.21 percent of GDP (Abono Salarial at 0.16 percent and Salário Família at 0.05 percent of GDP), however these programs appear to be ineffective in moving workers out of unemployment or from the informal into the formal sector (as workers only receive Abono after 5 years of formal employment). On the other hand, Brazil spends only 0.2 percent of GDP (including the off-budget Sistema-S) on active labor market programs such as job search assistance and skills training. This compares to a level of spending of about 1.0 percent of GDP on average in OECD countries.
Efficiency and incidence of Social Assistance and Labor Market Programs
122. The “social protection system” in Brazil is not really a system, as it is composed of a series of overlapping and weakly coordinated programs. The chart below shows the main Labor Market programs and Social Assistance programs in terms of budget size and the number of beneficiaries (Figure 63). It highlights that costs bear little relation to the number of beneficiaries, and in fact there is no consistency in the level of benefits of each program.
123. Out of all social assistance programs only Bolsa Família is well targeted and cost effective. Bolsa Família constitutes to be the only significant safety net for the non-elderly poor, especially
0.01%
0.01%
0.02%
0.03%
0.06%
0.17%
0.45%
0.30% 0.39% 0.04%
0.00% 0.50%
Garantia-safra
PAA (food…
Defesa Civil
SUAS
Pnae
PMCMV
Bolsa Familia…
Social pension…
Percent of GDP
Elderly Disabled EPU
0.73%
0.001%0.001%
0.002%0.003%0.005%0.043%
0.157%
0.002%
0.29%0.64%
0.0% 0.2% 0.4% 0.6% 0.8%
Mais EmpregoEconomia Solidaria
Seguro-DefesoATER
FomentoPNATER
PRONATECAbono Salarial
FGTS…Seguro-Desemprego
Percent of GDP
Active Passive

89
families with children. Spending on Bolsa Família approached 0.45 percent of GDP in 2015, which is relatively low, considering that the program reaches nearly 14 million families (about 40 million people). This is due to low benefit levels (R$ 53 per person and month in 2015). The program is well targeted with 57 percent of beneficiaries in the bottom 20 percent of the income distribution (Figure 64). Estimates of the impact of the economic recession on unemployment and poverty suggest a need to expand the program by around R$ 1.8 billion to protect the livelihood of those falling below the poverty line (Skoufias et al., 2017).
Brazil’s “social protection system” is not really a system, as it is composed of a series of overlapping programs which are not coordinated in terms of target populations and levels of benefits
Figure 63: Diversity of Social Assistance programs by benefit levels, beneficiaries, and cost, 2015
Source: World Bank – Authors’ analysis of BOOST (federal level); SPL Program Inventory Note: Size of bubble shows total cost of the program (in percent of GDP) Note: Minha Casa Minha Vida program is not shown for reasons of scale: in 2015 it reached 153,282 households (or about 450,000 individuals), and transferred an average of R$3,140 per person per month. Note: Vertical axis is average monthly benefit per beneficiary
124. Comparing the incidence of the various social protection programs highlights that spending is not only fragmented, but is also not well targeted overall.56 While the Bolsa Família program is very progressive, in contrast the BPC is not well targeted with 70 percent of the benefits accruing to the richest 60 percent and only 12 percent of the benefits accrue to the poorest 20 percent of the population (Figure 64). In fact, the richest quintile receives much more in pension subsidies and
56 These estimates should be treated with caution. The inability to distinguish between key benefit types in the PNAD since 2006 requires strong assumptions. To improve the reliability of this type of analysis it would be important for future PNAD surveys to include questions on the receipt by households of the various social benefits.

90
BPC than those in the poorest quintile receive in Bolsa Família. Abono Salarial is also not progressive, with 67 percent of benefits accruing to the richest 60 percent.
125. The cost of BPC social pensions is expected to triple by 2035 due to a mix of factors. The expenditure on BPC is projected to increase rapidly due to the indexation of benefits to the level and changes in the minimum wage, demographic projections, and an increasing trend towards “judicialization”, or court-granted benefits57 (MPOG 2016). A simple simulation of the fiscal pressure expected under the BPC program highlights that expenditure in the program under current rules is projected to increase from 0.7 percent of GDP in 2015 to 1.1 percent by 2025 and 1.6 percent of GDP by 2035.
Bolsa Família is very progressive, but subsidies for pension deficits are very regressive
Figure 64: Incidence of Spending on Pensions, Social Protection and Labor Programs
Source: World Bank estimates, using PNAD. Note: 1. Results should be treated with caution as the inability to distinguish between key benefit types in the PNAD (after 2006) requires strong assumptions. 2. “Public pension subsidies” are defined as the difference under prevailing pension system rules between average benefits and average contributions by each income quintile of the population covered by the PNAD survey. It includes the benefits under the RGPS (urban + rural) and the RPPS. 3. The incidence is calculated using total per-capita income. Thus, the results also reflect the fact that the benefits received by BPC and rural pensions recipients are high compared to the income distribution.
126. The number of people accessing BPC may increase even further, if access to RGPS pensions is restricted, for instance as a result of the requirement to attain at least 25 years of contributions under the pensions reform proposal. Many Brazilians from lower income household (at the margin of the formal economy) are unlikely to attain the 25 years of contribution. Many of these workers may fall back on the non-contributory social pensions (BPC) instead. The increasing share of
57 An increasing share of, benefits are award in response to court decisions rather than through the regular administrative process as courts have shown a tendency to find claimants entitled to benefits even if they have been found ineligible according to the criteria used in the administrative process.
17%
4% 2%
18%
32%
20%
10%
34%
57%
12%
20%14%
22% 24%
37%
23% 24% 23%26%
19%22%
35%
44%
25%22%
24%28%
18%10%
26%21%
12%
22% 20%
7%
20%25%
14%
3%
24%20%
35%
10% 13%
2%
14% 14%11%
3%
19%
0%
10%
20%
30%
40%
50%
60%
Q1 Q2 Q3 Q4 Q5
Pensions Labor Market Programs Social Assistance Programs

91
BPC benefits awarded through the judicial system suggests that courts might find many of these claims to be justified. The net increase in budgetary costs is likely to be limited since contributions to the RGPS from this group of workers are small and, unlike the RGPS, the BPC requires proof or necessity and does not pay a 13th monthly benefit or entitle survivors to a pension. However, the lack of incentives to contribute to the RGPS may result in greater informality. Addressing this issue may require offering workers with less than 25 years of contribution an annuity reflecting the value of their contributions to reduce early exits, or lowering the value of disability benefits.
127. An analysis of the recipients of the various programs highlights the existence of widespread overlaps. Most people receive just one benefit, but many families receive benefits from more than one program (Figure 65). Most “double-dippers” are in the 3rd and 4th and 5th income quintiles of the Brazilian society (Figure 48). In fact, almost half of the households in the second to fifth decile benefit from two or three programs. And more than 30 percent of households in the 6th to 8th deciles benefit from two programs. A portion of the overlap of benefit programs can be explained by error or fraud. For instance, using the PNAD data we estimate that 24.1 percent of BPC beneficiaries also receive Bolsa Família (approximately 1 million beneficiaries). BPC benefits to these beneficiaries amount to 0.2 percent of GDP (R$ 12 billion), while Bolsa Família spending on these double dippers is estimated at approximately 0.03 percent of GDP (R$ 2 billion) (Table 3). This is an example of fraud since the BPC legislation prevents BPC recipients to cumulate it with "another social security benefit". But most other overlaps simply reflect a lack of coherence in program design and administration, as cumulation of benefits is often not regulated. Better integration and coordination of social assistance and labor market programs could provide savings, better protect poor and vulnerable households, and improve incentives and labor market outcomes.
Many families in the upper half of the income distribution benefit from more than one program
Figure 65: Receipt of benefits (numbers of people, by the number of benefits received by their household)
Figure 66: Share of the population in each decile according to the number of benefits received by their household
Source: Staff estimates using PNAD survey. Note: Results should be treated with caution as the inability to distinguish between key benefit types in the PNAD (after 2006) requires strong assumptions
-
10
20
30
40
50
60
70
80
90
0 1 2 3 4 5
Mill
ions
Number of programs received by the household
23% 18% 18% 21% 20% 21% 24%32%
41%55%
59%
37% 39% 37% 36%
50% 42%
43%
44%
40%
11%
25%27% 30% 33%
23% 28%21%
14%5%7%
18% 14% 11% 10%5% 5% 3% 1% 0%0% 2% 2% 2% 1% 1% 0% 0% 0% 0%
0%
10%
20%
30%
40%
50%
60%
70%
80%
90%
100%
D1 D2 D3 D4 D5 D6 D7 D8 D9 D10
0 programs 1 program 2 programs
3 programs 4 programs 5 programs

92
Table 3: Overlap in social protection programs by household
Beneficiaries of program listed in each row that also receive program listed in column:
Pensions Subsidies
Salario Familia
Unemploy. Insurance
Abono Salarial
Bolsa Familia BPC
Pensions subsidies 100.0 8.1 4.9 25.3 12.8 4.7 Salario Familia 15.7 100.0 8.2 87.9 33.3 1.5 Unemployment Insurance 20.2 17.3 100.0 45.0 20.7 3.2 Abono Salarial 21.4 38.2 9.3 100.0 20.7 2.4 Bolsa Familia 16.4 21.9 6.4 31.3 100.0 4.0 BPC 36.3 6.0 6.0 22.2 24.1 100.0
Source: Staff estimates using PNAD 2014 survey. Notes: 1. “Pension subsidies” refers to the pensions benefits net of contributions. 2. Results should be treated with caution as the inability to distinguish between key benefit types in the PNAD (after
2006) requires strong assumptions 3. Share of households who had received other programs. Specifically, overlap is: Number of households receiving
transfer from program X given that they have received transfers from program Y. Households are weighted using household weights multiplied by the household size.
128. The multiplicity and incoherence of programs, leads to inconsistency, duplication and overspending; from a “system”-wide perspective, several problems are apparent:
(i) The co-existence of multiple “social pension” regimes entails substantial functional overlap. The BPC social pension for the poor elderly and disabled overlaps with the rural pension, which are also de facto non-contributory. In fact, the urban-rural distinctions is blurred because of large population mobility and the only real difference is that BPC requires proof of income poverty, whereas rural pensions are not just for the poor but for anybody who proves a history of rural activity. Further, the high benefit levels from non-contributory pensions (BPC for the elderly and rural pensions) introduce a disincentive to contribute to gain eligibility for contributory pensions.
(ii) There is also a lack of coordination across income support programs: Bolsa Família, the Salário Família and the Abono Salarial. For instance, Abono Salarial and Salário Família basically have the same objectives as both provide wage subsidies for low-wage formal workers. Indeed, there is a large overlap in beneficiaries, most of which are from the richest 60 percent of the population (Figure 67 and Figure 68). Salário Família is the old-fashioned response to the concern for the working poor, but modern policy solutions integrate social assistance (Bolsa Familia) and labor market programs to enable a smooth transition from social assistance to reintegration into the labor force with minimal distortions. The Abono Salarial benefits mostly workers from the 2nd, 3rd and 4th income quintiles (Figure 64 and Figure 67), and therefore mostly misses its objective of supporting the incomes of poor workers. It also fails to incentivize formal employment because recipients only receive it after working 5 years in the formal sector.
(iii) There is also incoherence and consequent overlap across labor programs with unemployment income support functions: Seguro Desemprego (unemployment insurance) and the FGTS (unemployment saving accounts), while very different in their funding mechanism, both serve to provide income support to formal workers who have become unemployed. As analyzed in

93
more depth below, the current set-up seems to encourage excessive turnover, fails to protect the unemployed during a prolonged recession and has led to rising spending even during times of record low unemployment and booming labor markets.
Wage subsidy programs (Abono Salarial & Salario Família) have almost complete overlap of recipients, mostly in richer households, which suggests scope for fiscal savings
Figure 67: Number of Beneficiaries of Abono Salarial and Salário Família (millions) by income group
Figure 68: Overlap between Abono Salarial and Salário Família raises opportunity
Source: Staff estimates using PNAD survey. Note: The figure does not show quintiles of the income distribution. The quintiles are defined as follows: Extreme poor: from R$ 0 to R$ 92 per day (2015 equivalent to R$ 70); Poor: from R$ 92 to R$ 185 (2015 equivalent to R$ 140); Vulnerable: from R$ 185 to R$ 384 (2015 equivalent to R$ 291); Middle class: from R$ 384 to R$ 680; and Upper middle class and rich: over R$ 680. This figure uses pre-transfer incomes and national poverty lines and income classifications. Results should be treated with caution as the inability to distinguish between key benefit types in the PNAD (after 2006) requires strong assumptions
129. There is broad consensus that current labor market programs introduce perverse incentives which result in lower productivity. Notably, the peculiar design features of Seguro Desemprego could help explain the high level of rotation from employment to unemployment observed in Brazil.58 The relatively high replacement rates, the lack of stringent requirements to search for and accept job offers, and the relatively low vesting periods to access Seguro Desemprego, could explain
58 Brazil’s labor market stands out for its high level of labor turnover or ‘churn’. This phenomenon is often cited as having contributed to the stagnant level of labor productivity over the last three decades. About 23 percent of working Brazilians have been in the same firm or institution for only a year or less; 38 percent for up to two years and over half of working Brazilians (58 percent) have been working in the same establishment for less than five years (CNI 2016). In fact, the average job tenure in Brazil is lower than all countries in the OECD except for the United States (World Bank, 2015). Explanations for the high level of churn in the labor market have been actively debated for years (World Bank 2002, World Bank, 2015), but there is common concern that high job turnover compromises productivity. Given that multiple benefits are triggered when entering unemployment (Seguro Desemprego, FGTS savings and the share of the “multas” paid to the unemployed), turnover is also contributing to the fiscal costs of labor programs.
0102030405060708090
100NoneOnly AbonoOnly SalarioBoth
Abono Salarial (24 million)
Salario Familia (8.5 million)
Overlap: 8.2 million

94
the very high turnover that has been observed in Brazil’s labor market (Portela et al., 2016; Corseuil et al., 2014).
130. The perverse incentives towards seeking frequent job separations are enhanced by the regulations of FGTS and its poor coordination with Seguro Desemprego. First, eligibility requirements for the Seguro are low relative to similar programs among Brazil’s peers. And although the maximum period over which a benefit is paid out is shorter, the benefit amount is relatively generous. Second, FGTS accounts managed by Caixa Econômica Federal earn only a statutory—and below market—rate of interest. In an economy with a history of high inflation and prone to inflation spurts, relatively low returns on compulsory savings can raise the financial repression felt by households and create an incentive to access these savings. And while the FGTS design deters employers from laying workers off by requiring payment of a penalty (or ‘multa’), most of this penalty is paid to workers directly rather than to the risk-pooling fund for Seguro Desemprego (Fundo de Amparo ao Trabalhador, FAT). Workers thus have enormous incentives to get laid-off and access the substantial benefits this entails, while the inflexibility of labor contracting and the high incidence of labor disputes than end in court means that employers have an incentive to settle for redundancy and rehire workers under altered conditions rather than enter into contract renegotiations.59
Improving the design of social assistance and labor market programs
131. Social protection and labor programs would benefit from reforms that better align incentives, target the most vulnerable populations and integrate delivery systems. The analysis above highlight scope to improve the design of social programs into three complementary areas: (i) consolidating social assistance programs; (ii) improving support for the unemployed; (iii) and reshaping wage supplements.
Options for consolidating social assistance: Bolsa Família, Salário Família, BPC and rural pensions 132. The various social pensions (BPC, rural pensions) and social assistance (Bolsa Família, Salário Familia) programs could be fused into a single program, modeled after Bolsa Família. Redesigning and integrating all current de facto non-contributory cash benefits into a carefully consolidated program could ensure progressive spending, internally coherent eligibility conditions, and incentive-compatible benefit withdrawal rules that stimulate formal labor market participation.60 A new consolidated social assistance program could be built on the well-performing Bolsa Família program, and the best-practice examples from OECD countries. Under such a program, all poor individuals would be eligible to only one means-tested transfer. An integrated administrative (eligibility determination and delivery) system could also eliminate unwarranted duplication.
133. The range of potential fiscal savings from a consolidation would depend on eligibility and benefit levels, but if carefully designed the reform could bring savings without increasing poverty. If the benefits were set at the current average benefit level of Bolsa Família (R$ 157 per month and family as per PNAD 2015), this would reduce spending on the BPC program by about 0.6
59 The reform of Brazil’s labor code approved in May 2017 reduces some of this contracting inflexibility but does not address the perverse incentives inherent in the design of unemployment benefits. 60 These reforms would require a change in the Constitution.

95
percent of GDP and spending on rural pensions benefits by about 1.4 percent of GDP.61 Under this scenario, the poverty rate (according to the R$ 140 poverty line) would increase from 8 percent to 11 of the population (and from 24 percent to 27 percent under the US$ 5.5 per day international poverty line).62 Alternatively, a more desirable scenario could envisage setting the level of benefits across the programs at 60 percent of the current level of BPC benefits (corresponding to about R$ 473 in 2015 per month, per family)63. Under this scenario spending on Bolsa Família, would increase to 1.3 percent of GDP, but spending on BPC and rural pensions would decrease to 0.4 and 0.9 percent of GDP, respectively. Overall, this would create savings of 0.7 percent of GDP, and of this, 0.6 percent of GDP would be generated by removing overlaps (“double-dippers”). This program would have no impact on poverty reduction, with the share of population below the R$140 poverty line staying constant at 8 percent (and at 24 percent under the US$5.5 per day international poverty line). Overall the results indicate that poverty would not increase much as a result of the simulated reductions in the level of benefits of BPC and rural pensions, while there would be a large reduction in poverty resulting from the increase in the level of BFP benefit.
134. At a minimum, reforms to benefit levels and eligibility of BPC social pensions would be needed to contain the expected rise in its cost and make it more progressive. If full integration of rural pensions and BPC with other social programs is not possible, at a minimum it will be important to control the level of spending on the BPC, which is projected to increased significantly (Figure 69). Simulating potential measures for cost containment under the BPC highlights that introducing tighter eligibility rules and delinking BPC benefits from the minimum wage could reduce long-term spending in the program by about 20 percent or 0.2 percent of GDP, keeping it to 0.9 percent of GDP in 2025 (Figure 69). Moreover, there is a strong rationale to reduce the level of benefits. The average ratio of social pension benefits to minimum wages for most OECD countries is around 45 percent for the elderly (and the maximum is 65 percent), and 26 percent for the disabled (and the maximum is 45 percent), whereas in Brazil the BPC benefits are fixed at 100 percent of the minimum wage. Reducing BPC benefits to OECD-average level for social pensions could save 0.7 percent of GDP by 2025 compared to baseline forecasts (Figure 69). However, this would imply an increase in national poverty rate from 8 percent to 9 percent of households below the R$ 140 per day poverty line (and from 24 percent to 25 percent of households under the US$ 5.5 per day international poverty line), with higher increases in poverty amongst individuals above 65 years of age. However, a reduction of the BPC benefit to a level equivalent to 60 percent of the present value would save about 0.43 percent of GDP by 2025 and would not have a significant impact on the level of poverty.
135. Another short-term measure compatible with this broader reform objective could entail the transformation of Salário Familía into a means-tested benefit at the household level to incentivize Bolsa Familía recipients to transition into formal jobs. Bolsa Familía and Salário 61 This initiative would also remove the current double dippers of BPC and Bolsa Familia which accounts for approximately 0.2 percent of GDP. 62 A further scenario could be to set the benefits for all programs at twice the average level of Bolsa Família (R$ 315 per month and family in 2015; which corresponds to about 40 percent of the level of BPC). This would double the spending on Bolsa Familia, bringing it to 0.9 percent of GDP, but reduce spending on BPC by about 0.4 percent of GDP, and on rural pensions by about 1 percent of GDP. This would amount to net savings of 1.0 percent of GDP. These estimates do not take into account the savings that would be obtained by removal of double dippers, which amount to approximately a further 0.2 percent of GDP. Under this scenario, the poverty headcount would be reduced by a quarter, with the share of the population below the R$140 poverty line increasing from 8 percent to 10 percent (and from 24 percent to 25 percent of households under the US$5.5 international poverty line). 63 This is equivalent to a transfer of R$127 per person in beneficiary household.

96
Familía are de-facto noncontributory allowances for households mostly composed by working-age adults and children. The former benefit focuses on households that are reliant on informal work (since the Bolsa Familía benefit is insufficient to support a family), while Salário Familía targets families with low-paid formal workers. Since Salário Familía is currently targeted in an outdated fashion, considering Brazil’s administrative capacity in targeting, this program could be explicitly coordinated, and eventually made part of Bolsa Família. Salário Familía could be means-tested at the household level for the existing beneficiaries, while explicitly incentivizing Bolsa Familía beneficiaries to transition into the formal labor market, by allowing them to maintain the benefit also while working in the formal sector up to a certain wage and per capita family income. Consistent with best practice in OECD countries, the benefit withdrawal would be gradual as income increases, in order to avoid steep marginal tax rates on additional labor earnings. The benefit structure could remain in line with Bolsa Família to emphasize the behavioral effect given by the continuity in receipt of the program after a change in work status. This reform would entail significant administrative changes, and require an enhanced Cadastro Unico that is inter-operable with RAIS and INSS data. The value of the reform would especially be in terms of the long-term gains in labor productivity of formalized workers. A transitory measure entailing reduced administrative cost could be to align (or raise slightly) the Salário Familía payment per child to match those in Bolsa Familía, while also increasing awareness among Bolsa Familía beneficiaries that an equivalent benefit is available to them if they take up a formal job paying up to 1.4 minimum wages.
Cost of BPC social pensions will triple by 2035 but reforms to benefit levels and coverage could reduce costs
Figure 69: Simulating fiscal spending under the BPC social pension and potential for cost containment
Source: World Bank staff calculations
0.7%
0.9%
1.1%
1.3%
1.7%
0.7%0.8%
0.9%0.9%
1.1%
0.3% 0.4%0.4%
0.6%0.7%
0.3%0.3% 0.3%
0.4%
0.7%
0.5%0.6%
0.8%
1.0%
0.0%
0.2%
0.4%
0.6%
0.8%
1.0%
1.2%
1.4%
1.6%
1.8%
2015 2020 2025 2030 2035
Fisc
al o
utla
ys a
s % o
f GDP
Scenario 1: Continue Status QuoScenario 2: Raise eligibility age from 65 to 70 for elderly and adjust benefits by inflation onlyScenario 3: Adjust benefits to OECD average benchmarksScenario 4: Reduce benefit levels to the BF maximumScenario 5: Reduce benefits to 60% of minimum wage

97
Options for improving support for the unemployed: FGTS and Seguro Desemprego 136. Changes could be made to the parameters of FGTS and Seguro Desemprego to lower perverse incentives and improve their effectiveness. The most urgent and important measure that could be taken is to sequence workers’ access to the two programs. Rather than being entitled to simultaneously access their individual savings (FGTS) and the risk-pooling benefit (Seguro) upon involuntary separation, workers could be required to exhaust their savings before accessing their rights to Seguro. A limit on how much of their savings could be withdrawn for every month of the unemployment period could be imposed, and this maximum could decline over time. Most unemployment insurance programs feature a declining rate of replacement over total pay-out period. Requiring workers to draw-down their own savings creates urgency that can counter the ‘moral hazard’ of income support during unemployment.
137. Seguro Desemprego could underpin the FGTS and provide more support to lower-earners. The proposal also has the merit of reserving resources from the risk pool (i.e. the FAT, which like most social insurance can run ‘deficits’ between contributions and payments, which are underpinned by budget transfers) for those more likely to run down their savings before finding a job. These are the people with fewer sought-after skills, lower-income earners who are not able to accumulate large balances in an individual account, or people who have suffered repeated employment shocks. As is done in countries that combine individual savings with risk pooling, the number of times an individual can get access to benefits from the risk-pool could be limited in a given period; could be conditioned on the intensity of job search, accepting job offers, and take up of training, counseling or other support services, or a combination of these public employment services.
138. Coordinating FTGS and Seguro Desemprego would offer households a more resilient set of tools to manage a diverse set of risks to employment. In any country—even in times of economic stability and growth—there is an efficient level of turnover as workers move from one job to another, and as firms go out of and come into existence. But in Brazil turnover may be excessively high, lowering incentives for investing in on-the-job training and thus hampering productivity growth. Sequencing access to FTGS and Seguro Desemprego could contribute to productivity by providing support for individuals in case of idiosyncratic shocks, and augmenting this support further when unemployment spells are longer, or the shock to the economy is systemic, as is the case in the wake of a crisis or a long recession. Chile’s mixed unemployment protection system, for instance, includes triggers that can lengthen the total pay-out period when the country’s unemployment rate rises above a certain level.
139. The expected incentive and efficiency benefits from sequencing FTGS and Seguro Desemprego need to be augmented with administrative reforms. The penalties that employers pay for dismissals sem justa causa, could be paid in their entirety into the FAT, increasing the pool of resources available to finance both Seguro Desemprego and stronger labor market intermediation services. To eliminate motivations for employers and employees to game the system to access their FGTS savings, the government could consider gradually raising the rate of return paid on FGTS savings to market levels.

98
Options for reshaping wage supplements: Salário Família and Abono Salarial 140. Fiscal savings, greater equity and stronger incentive to formalize work could be achieved by consolidating Salário Família and Abono Salarial into a single progressive wage supplement. As currently designed Abono Salarial and Salário Família target the same population—formal workers earning less than two minimum wages. The two wage supplements could be consolidated into one and redesigned to better fulfil their original, common objectives: incentivizing participation in the formal labor market and reducing the risk of in-work poverty.
141. First, the eligibility requirements for this new, consolidated wage supplement could be revisited to improve targeting of this benefit towards the working poor. There are multiple ways in which the reform of wage supplements could achieve this overall objective. An optimal, yet administratively demanding, eligibility requirement would be to offer the supplement only to workers that remain below or close to the poverty line even when working in a formal job. Such an approach would require using the overall income of the household, rather than only the individual worker’s wage, as a means test: in this way, the Brazilian wage allowances would become akin to the in-work benefits that are increasingly common in the OECD (e.g. Universal Credit in the UK, earned income tax credit in the USA). An alternative, administratively simpler method to target wage supplements better would be to eliminate Abono Salarial altogether as an entitlement, since it is more regressive, and preserve Salário Família, which is more progressive given that the benefit level is driven by the number of dependents in the household. This second approach would be less effective to alleviate in-work poverty in households without children, although households with non-child dependents (such as the elderly and disabled) are already protected by pension and disability benefits (covered in the social assistance and pensions chapters of this report).
142. Second, the wage supplement should be designed to reward people who take up formal jobs. Structuring the consolidated wage supplement like the current Salário Família, rather than the Abono, would support achieving this objective. First, the long, prior formal employment period required for eligibility of the current Abono could be eliminated. In this way, the wage supplement would act as an immediate incentive for currently informal workers to formalize. Second, the wage subsidy could be more visibly linked to the monthly salary of the worker to act as a behavioral incentive: the wage supplement should form part of the worker’s regular salary payment rather than being paid in a lump sum at the end of the calendar year.
143. Finally, the rate at which the supplement is withdrawn could be made more gradual to avoid low-wage incentive ‘traps’. As they are currently designed, both Abono and Salário Família, have sharp eligibility cut-off points and fixed benefit amounts. These design features make salary progression just above the eligibility line undesirable to covered workers, since the value of the lost benefit is greater than the additional earned salary (at small levels of wage increases). The risk is that workers are ‘trapped’ in low-wage jobs because employers cannot offer to provide significant wage increases one year to the next. Other countries have solved this incentive problem by setting a rate of gradual withdrawal—of benefits so that the lost benefit is maintained at a fraction of the gains from a higher earned wage net of taxes.
144. The reform of wage supplements would help free up resources to finance currently under-funded public employment services. The application of the reforms proposed above would reduce the number of beneficiaries of the wage subsidies (currently they are paid to 25 million workers in Brazil). Some of the fiscal savings that derive from the reforms proposed here could be reinvested to

99
other, currently-underfunded active labor market programs, such as training programs and labor market intermediation that are more effective at improving matches and thus better foster productivity.
145. Alternatively, Abono Salarial could be reformed to incentivize firms to take on first-time job seekers or those who otherwise find it difficult to get a job. Brazil’s system of labor market programs is missing an instrument employed by most OECD-member and peer countries: incentives paid to employers to compensate them for taking on likely lower-productivity workers. To improve the prospects of younger job seekers -particularly those transitioning out of full time education—Brazil mandates firms to offer apprenticeships through its Lei Aprendiz. However, if it is paid to employers rather than to workers, a wage subsidy can increase incentives for firms to take on the most difficult to place, even if the accompanying non-wage labor costs of offering formal employment remain a formidable deterrent. Hence, Abono Salarial could be transformed into a proper wage subsidy paid to the employer as an incentive to hire (i) long-term unemployed, or (ii) first-time job seekers in the formal labor market (which would be mostly young people and the informal working poor). The subsidy could be extended flexibly also to other categories of vulnerable workers based on labor market conditions (for instance, less educated youth, unemployed over 50, single mothers).
Simulations of the Reforms FGTS, Seguro Desemprego, Salário Família and Abono Salarial 146. Simulations of the reform proposals demonstrate positive impacts on labor market and fiscal outcomes. To demonstrate the impact that the proposed reforms could have on labor markets and public spending, the World Bank’s Simulations of policies in Labor Economics (SimPLE) model was calibrated using Brazilian labor market data (see box above for details on the SimPLE methodology).64 Four reform scenarios are simulated (as detailed in Table 4). While the model can be particularly useful to understand the predicted direction of different labor market outcomes as a result of reforms in labor market programs, quantitative results should be read with caution, particularly because they are based on a labor force survey that is not fully representative of the Brazilian labor force.
147. The reform of FGTS and Seguro Desemprego could reduce substantially the number of beneficiaries and the benefits paid under the program, with fiscal savings of approximately 0.6 percent of GDP. Reform Scenario A simulates that workers who become unemployed first must draw down their FGTS savings before accessing Seguro Desemprego, which would then be extended for additional months. Specifically, the Seguro Desemprego program would provide benefits for up to 7 months (compared to up to 5 months currently), in order to better reflect lengthening unemployment spells during the crisis and to align duration with other middle income countries. Replacement rates for Seguro Desemprego as well as for FGTS withdrawals are reduced to 70 percent of the past wage and capped at two minimum wages, while the floor of 1 minimum wage is relaxed. In addition, after 3 months of unemployment the benefit is subject to further reduction to 52 percent of the past wage.65 64 A detailed discussion of the main problems with Brazil’s labor market programs, options for reforms to these programs that would reflect leading practices from other countries, and the impact that policy makers can reasonably expect from reforms is included in the Volume II. Details of the SimPLE model and details of the simulation results are also provided in Volume II. 65 A variable scale of benefits, with the replacement rate declining every month, would also be desirable in order to strengthen incentives to find new jobs. This is already practiced in some countries (e.g. Chile). However, it should be noted that under current rules the lower bound of unemployment benefits is the minimum wage, which would preclude lower replacement rates for many workers. Considering its impact on the reservation wage, removing this restriction seems advisable.

100
The severance payment (multa) which was previously received by the dismissed employee is paid in its entirety to the unemployment insurance pool (FAT).66 Finally, the maximum number of months an employer can contribute to FGTS is capped to 50, in order to prevent the accumulation of high idle balance. The results of the simulation suggest that this reform could reduce by more than 90 percent the number of monthly beneficiaries of the program, with large resulting fiscal savings (Figure 70). Since the unemployed would first withdraw from their individual FGTS accounts the monthly benefit, and many would find another job before exhausting their savings, the budget would need to provide financial support only for a small share of the unemployed. Second, the reform of the benefit generosity in terms of replacement rates as well as declining value after 3 months would lead to a reduction in the average benefit amount by almost 40 percent and a fall in total payouts by 95 percent.67 Finally, the payment of all severance fines (multas) into the reserve fund for unemployment (FAT), rather than to the dismissed worker directly, could almost entirely finance the fiscal cost of the Seguro Desemprego program. At the same time, the caps on maximum withdrawal amounts of FGTS would half the total monthly payouts and the average payout. The cap in the number of monthly contributions leads to a very small (7 percent) decline in the balance of individual FGTS accounts, and to a more important 30 percent decline in the total number of monthly contributions that employers must make to FGTS, which could stimulate employment further. In the long run, reduced contributions to FGTS and a slight reduction in severance payments could also reduce non-wage cost of labor faced by employers.
148. Aligning Salário Família, with Bolsa Família, in terms of generosity could mitigate the impact of the removal of Abono Salarial as proposed above. Reform Scenario B simulates the reform of Salário Família, (Table 4). The original objective of this program to support low-paid working families in the formal sector, would be particularly important if other benefits (such as Abono Salarial) were to be curtailed. Under the simulation, the program would be still paid to the current target group, but the benefit amounts would be aligned to Bolsa Familia’s variable benefit per child. In this way, the continuity between the two programs would become more explicit and informal workers would have more trust in the benefits of moving towards the formal sector. The simulations show that the total payouts for Salário Família, would decrease by about 3 percent (Figure 70).
149. Converting Abono Salarial into a wage subsidy could have a small but positive impact on unemployment. Reform Scenario C simulates a possible reform of Abono Salarial and Salário Família, (Table 4). Specifically, Abono Salarial is reconfigured to become a wage subsidy paid to the employer for hiring individuals without prior experience in the formal sector, or the long-term unemployed (7 months or more). We assume that this subsidy is set at a modest 10 percent of the worker’s salary (which is close to Abono Salarial’s current cost at minimum wage) and paid for up to 12 months. Its rationale is to provide the employer a much stronger incentive for the creation of formal employment than the current benefit for disadvantaged workers.68 The results of the simulation show a reduction in unemployment duration, and an increase in spending on the reformed wage subsidy
66 There are other changes which should be considered, such as raising the return on FGTS accounts to a market based interest rate, to reduce the financial repression of this forced savings instrument and possibly reducing the rate of contribution, which at 8 percent is high for an unemployment savings instrument. 67 Note that SimPLE does not capture the additional incentive faced by the unemployed to take up work when relying on individual savings accounts rather than on unemployment insurance payouts for the first months of unemployment, or the reduction in incentive to seek non-disciplinary dismissal in order to cash-in their individual FGTS since this is constrained. Thus, the model may be underestimating the benefits of the reform. 68 Due to limitations in the PME dataset, we cannot use the model to simulate further proposed changes for Salario Familia, such as the use of household income (rather than individual wages), as a criterion to improve the targeting of the program.

101
(Figure 70). Many of the currently informal workers would become eligible and take advantage of the new program thereby increasing formalization. Hence the savings derived from the discontinuation of Abono for a large number of workers would be offset by the take up of the wage subsidy by relatively more vulnerable workers, so no significant fiscal savings are expected from this reform (estimated at 0.01 percent of GDP, which corresponds to 3 percent of the combined Abono Salarial and Salário Família, spending)
150. In aggregate, these reforms would stimulate a small fall in the average duration of unemployment spells and a reduction in long-term unemployment. The combined changes in labor market programs (Reform Scenario D) have noticeable effect on long-term labor market dynamics, for instance a slight reduction in total unemployment and a significant reduction in long-term unemployment. These effects result from the combination of the new wage subsidy for vulnerable workers and from the reform of the unemployment support system (Figure 70). The simulated impacts of these reforms are also expected to boost labor productivity.
Table 4. SimPLE simulations: Reform scenarios for the principal labor programs
Policy Parameters
Reform Scenario A: Unemployment support system reform (FGTS & Seguro Desemprego)
Reform Scenario B: Reform of Salário Familia
Reform Scenario C: Substitute Abono Salarial with Wage Subsidy
Reform Scenario D: (A+B+C)
FGTS Initial withdrawal limited to 70% of last salary per month, and only while unemployment status continues.
No change No change As in Scenario A
Seguro Desemprego
Access to Seguro only after FGTS savings are depleted. Benefit is 70% of the last wage for the first three months, and it is reduced to 52% of the last wage for up to 4 additional months. The absolute value of the benefit is capped at two Minimum Wages.
No change No change As in Scenario A
Multa Equivalent of 40% of FGTS contributions paid to FAT
No change No change As in Scenario A
Salário Família,
No change
Eligibility threshold and conditionality unchanged (1.4 minimum wage) Salário Familia’s amount is increased to match Bolsa Familia’s payment of R$ 39 per child < 18 per month.
No change
As in Scenario B
Abono Salarial
No change No change Replaced by new wage subsidy paid to employers who hire first time job seekers or unemployed for 7+ months Subsidy of 10% of worker’s earnings and lasting 12 months
As in Scenario C

102
Reforming labor programs would bring reductions in unemployment, improvements in productivity and significant fiscal savings
Figure 70: Simulated impact of the reform of FGTS, and wage supplements with SimPLE a) Seguro Desemprego (UI) benefits under simulated reform scenarios
b) FGTS Individual Savings and Payouts under simulated reform scenarios
c) Spending on and number of beneficiaries of wage supplements under simulated reform scenarios
d) Monthly flows into unemployment and duration of unemployment under simulated reform scenarios
Source: SimPLE Simulation based on PME 2015. Note: The data used to construct SimPLE is not representative of the entire labor market of Brazil: aggreage results in terms of spending and coverage of a program are not accurate in nominal terms. These figures are indicative of likely trends under different reform scenarios, ralative to the baseline.
Social Assistance and Labor Programs: Savings and efficiency from an integrated systemic approach
151. The overall recommendation is to redesign and integrate social protection programs (labor programs, social assistance and social pensions) into a coherent system. Similar or even better results could be achieved with lower spending: many programs with similar functions are
-
50,000
100,000
150,000
200,000
$0
$200
$400
$600
$800
$1,000
$1,200
Average Monthly BenefitAverage Monthly Beneficiaries (RHS)
R$0
R$2,000
R$4,000
R$6,000
R$8,000
Average Monthly Contribution Average balance in FGTS accountAverage Monthly Benefit
- 0.2 0.4 0.6 0.8 1.0 1.2 1.4
R$1.12
R$1.14
R$1.16
R$1.18
R$1.20
R$1.22
R$1.24
Bene
ficie
ries
(mill
ion)
Billi
ons
Fiscal cost Beneficiaries total (RHS)
5.0
5.1
5.2
5.3
5.4
5.5
5.6
-
100
200
300
400
Mon
ths
Thou
sand
s
Monthly flow into unemployed Monthly flow into unemployment seven+ months Average duration of unemployment (RHS)

103
deployed as if in isolation, creating duplication, regressive spending, as well as large overlaps which result in millions of families being entitled to multiple benefits. Reform of social protection programs should focus on rationalization, integration and coordination to scale back overly generous benefits in some programs, reduce overlaps and improve incentives. There is also a need to smooth the transition between social assistance and wage supplements to labor supply distortions, as well as to refocus labor market programs towards more active forms of job search assistance. This type of reform should consolidate programs, improve their targeting and align the incentives to graduate from social programs into formal labor market. It should proceed hand-in-hand with greater inter-operability of administration and delivery systems. This report recommends reshaping all existing social assistance and labor market programs into three consistent programs, generating savings of up to 1.3 percent of GDP over the next decade:
(a) Consolidated social assistance: This would entail redesigning and integrating all de-facto non-contributory cash benefits—including social pensions, social assistance, and Salário Familia—into a consolidated program modelled along best practices and building on the well-performing Bolsa Família program. The new program would ensure progressive spending, internally coherent eligibility criteria, and incentive-compatible benefit withdrawal rules that stimulate formal labor market participation. The potential fiscal savings would depend on eligibility and benefit levels, but could reach up to 0.7 percent of GDP, without increasing the poverty rate. If a full integration of social programs is not feasible in the near term, at a minimum it will be important to review the benefit level and eligibility for BPC social pensions to contain the expected rise in its cost and make it more progressive. Another short-term measure compatible with this broader reform objective would transform Salário Família, into a means-tested benefit at the household level in order to incentivize Bolsa Família, beneficiaries to transition into formal jobs. While not generating short-term fiscal savings, the expected positive effects on labor supply and labor productivity would generate long-term economic and social benefits
(b) Targeted wage subsidies: Slightly increasing the generosity of Salário Família, while removing the more regressive Abono Salarial would present an opportunity for savings without significant distributional impacts. In exchange, Abono Salarial could be transformed into a proper wage subsidy paid to the employer as an incentive to hire (i) long-term unemployed, or (ii) first-time job seekers in the formal labor market. The benefit would go to the employer to offset some of the labor costs, and be paid for a limited period (e.g. 12 months) and for a maximum number of times per worker. The take up of the wage subsidy by relatively more vulnerable workers implies that no significant fiscal savings are expected from this reform. However, resources would be spent more effectively and better target the most vulnerable workers.
(c) Integrated income support for the unemployed: Integrating FGTS and Seguro Desemprego into a sequenced set of income support instruments for job seekers would improve incentives and stimulate employment, and bring fiscal savings of approximately 0.6 percent of GDP. The unemployed would become eligible to Seguro Desemprego only once their FTGS account balance is exhausted, while payments on the latter would be capped to a monthly maximum that is aligned with reasonable replacement rates (for instance 70 percent) of the past wage. This reform would also generate the fiscal space to lengthen the maximum payment period of Seguro Desemprego (e.g. up to 7 months) for the minority of workers that really need it, especially during economic downturns. Simulations suggest that the reform could reduce the average length of unemployment spells, substantially reduce spending on unemployment insurance, and improve incentives for

104
formal employment. The fines that employers pay for involuntary separations could be used to increase the funding for labor market intermediation and job search support services.
152. Greater integration and interoperability of administrative delivery systems could improve social assistance programs while saving costs. At present, the administrative systems between programs covering formal workers and the one for the mostly informal poor (Cadastro Unico) are completely separate. Integration of social programs would require inter-operability of administration and delivery systems. Improvements in coordination and administration could enhance efficiency and equity. Enhanced system-interoperability would allow for cross-checking between social programs and other databases and would therefore help to further improve targeting, eliminate overlaps, and raise the likelihood of progressive spending outcomes.

105
Health: Alternatives to Offer More and Better Services
Potential savings in health spending are significant and mostly related to an inefficient scale of service provision, particularly for hospitals. In order to cope with the likely expansion in demand for health services, due to the demographic transition and the rising burden of non-communicable diseases, Brazil’s health system needs some strategic reforms. First, there are too many small hospitals (which are not cost-efficient), reflecting a need to balance access to hospital services with optimal hospital size and scale of services. Second, there is a need to better integrate the various levels of services provision and improve coordination among health care providers. And, third there is a need to introduce incentives to boost the productivity of health sector personnel and to align providers’ payment mechanisms with actual costs.
Benchmarking the level of expenditures in the health sector
153. The expansion of the public health system over the past decade has led to spending increases. Brazil made significant investments in expanding the coverage of its unified health system (SUS) aiming to achieve expansion of service delivery network. In the decade to 2014, public spending on health grew at an average real rate of 7 percent increasing public health spending as a share of GDP by 0.5 percentage points. However, most of this increase in public spending was in the sphere of subnational governments. The Federal Government’s health expenditures increased only slightly, from 1.6 to 1.7 percent of GDP between 2004 and 2014.
154. Relative to its GDP, health spending in Brazil is comparable with OECD countries and other peers, but much of it is outside the public sector. Total health spending in Brazil (9.2 percent of GDP) is comparable to the average of the OECD member countries (8.9 percent) and higher than

106
the average of its structural and regional partners (5.8 and 7.4 percent, respectively) (Figure 71)69. In the last two decades, health spending as a share of GDP increased by 1.8 percentage points in Brazil, while among the OECD countries the average increase was 2.3 percent. Unlike most of Brazil’s economic partners, more than half of total health expenditures in Brazil are privately funded (individually and through private health plans). Public health spending as a share of total health expenditure (48.2 percent) is significantly lower than the average among OECD countries (73.4 percent) and of its middle-income partners; it is only above the average among BRICS countries (46.5 percent)70.
Brazil spends in health (relative to GDP) values similar to its OECD partners, however, the majority of the spending is on the private sector
Figure 71: Public and private health spending (% of GDP), Brazil and partners, 2013
Source: OECD, 2013. Note: It does not consider “tax expenditures”.
155. In addition, Brazil spends 0.5 percent of GDP (in 2013) on tax expenditures for the health sector, which has increased over time. The public sector also spends significant resources through tax expenditures, mainly to subsidize private health insurance (0.5 percent of GDP). Individuals can deduct health expenses from taxable expenses; the same applies to legal entities that provide health care for their employees. The government also exempts taxes and contributions from the
69 This is according to OECD data. Data from the Ministry of Health's satellite accounts indicate that total health expenditures in Brazil reached 8.3% of GDP in recent years. According to the World Health Organization (WHO), in 2013 total health expenditures in Brazil were 8.5 percent of GDP and fell to 8.3 percent of GDP in 2014. 70 In per capita terms, Brazil spends much less than the average among OECD countries, but more than its regional and structural partners. Total health expenditure per capita in Brazil (US $ 1,334) is 35 percent of the average among OECD countries (US $ 3,817), 153 percent of its structural partners (US $ 873), 127 percent of regional partners (US $ 1,054), and 141percent higher than the average among the BRICS countries (US $ 949).
0%2%4%6%8%
10%12%14%16%18%
Bras
ilAf
rica
do S
ulFe
d. R
ussa
Chin
aTu
rqui
aÍn
dia
Indo
nésia
Cost
a Ri
caCh
ileCo
lôm
bia
Méx
ico
Esta
dos U
nido
sSu
écia
Alem
anha
Suíç
aHo
land
aFr
ança
Cana
dáBé
lgic
aDi
nam
arca
Áust
riaJa
pão
Nov
a Ze
lând
iaG
réci
aPo
rtug
alO
ECD
Espa
nha
Nor
uega
Islâ
ndia
Itália
Eslo
vêni
aAu
strá
liaFi
nlân
dia
Rein
o U
nido
Irlan
daRe
p. d
a Es
lová
quia
Isra
elHu
ngria
Coré
iaRe
p. C
heca
Polô
nia
Litu
ânia
Estô
nia
Letô
nia
Luxe
mbu
rgo
Parceiros structurais Parceirosregionais
OECD
Public Private

107
pharmaceutical industry and philanthropic hospitals. Tax expenditures represent 31 percent of federal spending in the health sector. They are concentrated in tax credits on the personal income tax (38 percent) and tax exemptions for philanthropic hospitals (29 percent) (IPEA, 2006). As a result, despite the growth of the public health sector, spending on private health insurance (usually provided by employers) increased and accounted for 40 percent of all private health expenditure.
Efficiency and incidence of health spending
156. Significant inefficiencies exist in Brazilian health spending when comparing to the performance of other countries. Using a cross-country Data Envelopment Analysis (DEA) on total health expenditures (public and private) we benchmarked Brazil’s health systems to the efficiency frontier and estimated inefficiencies as distance from this frontier.71 We calculated both an output and an input oriented DEA using four selected health systems indicators, namely: Age-standardized disability-adjusted life years; the probability of dying between 30 and 70 years old from cardiovascular, cancer, diabetes, or chronic respiratory diseases; the percentage of out-of-pocket in total health expenditure (as an indicator of financial protection); and an indicator of equity in health, which included child immunization against measles, infant mortality rate and lifetime risk of maternal death (Perelman et al., 2016). Using the output-oriented DEA approach, Brazil reaches a score of 0.91 in 2012, which means that with the same amount of funding Brazil should be able to improve health outcomes by 9 percentage points (see the main report for details).72 Equivalently, Brazil could have provided the same level of services using 34 percent less resources.73
157. Large inefficiencies can also be identified within Brazil by comparing spending and performance across municipalities. To do this, this study also carried out a DEA analysis across all municipalities in Brazil.74 The inputs used in the inter-municipal DEA are the amount of public health expenditures at each level of care, and two non-discretionary non-health sector specific variables that account for socio-demographic heterogeneity and influence (and are influenced by) health care performance. The outputs include intermediate outputs (health service delivery indicators, such as number of outpatient procedures and coverage of the Family Health Plan) and health outcomes such as avoidable mortality for different age groups (see details in Volume II). If all municipalities were to 71 Data envelopment analysis (DEA) is a nonparametric method for the estimation of production frontiers. In the DEA methodology, formally developed by Charnes, Cooper and Rhodes (1978), efficiency is defined as a ratio outputs to inputs and the frontier represents the maximum level of outputs that can be produced given the inputs and the technology available. The most efficient data points establish the frontier, without a need to specify a functional form. It allows to estimate efficiency gaps (inefficiencies) as the distance from the frontier, the closing of which would allow units to either achieve greater outputs with the same inputs or the same outputs with fewer inputs. The methodology was applied to public sector efficiency by Afonso, António; Schuknecht, Ludger; Tanzi, Vito (2003). Public sector efficiency: an international comparison, ECB Working Paper, No. 242. See also Charnes A, WW Cooper and EL Rhodes (1978). Measuring the Efficiency of Decision Making Units. EJOR 2: 429-444. 72 Outcomes are represented by the four indicators mentioned above. 73 In the input-orientated DEA, Brazil obtains a low score (0.41 in 2012). This means Brazil spends almost two and a half times as much as other countries in the sample with comparable health outcomes. These results indicate that if Brazil was as efficient as the most efficient countries in the sample, it could spend less than half of the current resources to achieve the same outcomes. The results of the input-oriented analysis however are influenced by the private sector providers (which spend large amounts on a small share of the population). 74 In addition to looking at Brazil health care system and comparing its efficiency to other countries, we also looked at the large variation in performance across municipalities within Brazil (depending on location and size by population) to identify where resources are being used most efficiently and where there is room for improvement.

108
match the most efficient ones, Brazil could save about R$ 22 billion or 0.3 percent of GDP in the public health system (SUS) without any loss in the level of services delivery, nor in health outcomes. The average efficiency of primary health care is estimated at of 63 percent (i.e. inefficiency of 37 percent), while for secondary and tertiary care (“hospital care”) average efficiency is very low at 29 percent (i.e. inefficiency of 71 percent). This implies that there is scope to increase services provision substantially using the same level of resources. Alternatively, these results imply that it would be possible to reduce spending by 23 percent for primary care while achieving the same level of results (which implies a potential for savings of R$ 9.3 billion) and by 34 percent for hospital care (which implies a potential for savings of R$ 12.7 billion).75
158. In primary care, most municipalities are characterized by high productivity and low performance, while in secondary and tertiary care most present low productivity and low performance. Performance here is the comparative measure of products and outcomes across municipalities without considering resource constraints, while productivity is calculated by comparing performance to spending. In primary care, most municipalities are relatively efficient in their use of resources (high productivity) and could benefit from greater resources to improve their performance (Figure 72). This is particularly true for municipalities in the relatively poor regions (North and North-East) that are the most resource constrained. When it comes to more complex healthcare, performance of most municipalities is equally low, however greater resource allocations are unlikely to improve performance as most municipalities also display low productivity, which points to management issues such as inefficient scale of hospitals. Regionally, municipalities in the South, Southeast and Center-West, which spent the most per capita on primary care, are the least efficient, while the once in the North and North-East that spend less are more efficient.
159. Overall, municipalities are substantially more efficient in the provision of primary care services than secondary and tertiary care services, and this pattern is observed across regions and regardless of municipality size (Figure 72 and 73). Additionally, the within groups variation is much larger in the secondary and tertiary care than within primary care, again suggesting large potential efficiency gains from copying practices from the best performing municipalities. In terms of regions, in both primary care and in-hospital care the North and Northeast regions appear to be the most efficient as they have higher average efficiency than the other regions (and above the national average) (Figure 72). These regions also have lower per capita expenditures. However, these regions also have larger variation in the performance across municipalities (particularly for secondary and tertiary care), suggesting that there are some inefficient municipalities, most likely in remote areas (and likely related to the existence of small size hospitals in those areas).
160. Municipality size influences the efficiency at all levels; however, the effect is slightly stronger in secondary and tertiary care. Average efficiency is much lower in the group of municipalities with less than 5,000 inhabitants than in other groups (Figure 73). This may reflect the fact that scale is a strong determinant of efficiency. In secondary and tertiary care, the tendency for larger municipalities to be more efficient is stronger than in the primary health care. In hospital care, 75 The apparent discrepancy between the large level of inefficiency and the relatively low savings is due to the different weights of municipalities in spending and efficiency. The average efficiency scores are simple averages of all municipalities, but as discussed below the inefficiency is concentrated in smaller municipalities, and therefore the inefficiency applies to a relatively small share of the health expenditures. In fact, spending is concentrated in the large municipalities (where most people live), which are more efficient, and therefore the potential savings from removing inefficiencies are less than proportional.

109
the average efficiency scores for the largest municipalities (over 100,000 inhabitants) is almost four times higher than the average among municipalities with less than 5,000 inhabitants (Figure 73).
Inefficiencies in primary care and advanced care present opportunities for large savings. Efficiency is related to scale (including size of the municipality, number of beds and size of the hospitals)
Figure 72: Efficiency by region Figure 73: Efficiency by size of the municipality
Source: World Bank staff calculations Note: The graphs show distribution of inefficiency—the colors include the first and fourth quartile, divided by the median.
161. Nationally, there is large potential to increase primary health service delivery without increasing expenditures. The DEA technique allows the computation of the necessary increase (or decrease) in the production of outputs (or in the use of inputs) for the production unit (say the hospital) to achieve maximum efficiency (reach the production frontier). Figure 74 presents average projections to catch up to the frontier nationally and across regions for various standard health system outputs. For instance, at primary care level, the number of non-physician consultations could increase by approximately 98 percent on average if all municipalities operated at the efficiency frontier, and even more in the Southeast region (at 110 percent), in the Center-West (130 percent) and in the South (133 percent). Procedures performed by primary care physicians could rise by 64 percent, with the Center-West (at 73 percent) and the South (at 76 percent) having the largest potential increases. These results highlight the necessity to improve the performance of the health sector workforce at the primary care level.
0.000
0.100
0.200
0.300
0.400
0.500
0.600
0.700
0.800
0.900
1.000
N NE SE S CW
PHC
SEC-TER
0.000
0.100
0.200
0.300
0.400
0.500
0.600
0.700
0.800
0.900
1.000
<5,000
5,000 -10,000
10,000 - 20,000
20,000 - 50,000
>=50,000
PHCSEC-TER

110
If Brazil was more efficient it could offer more health services with the same amount of resources.
Figure 74: Estimated potential increase in primary health care services provision at constant expenditure levels, by region, 2013
Source: World Bank staff calculations Figure 75: Estimated potential increase in secondary and tertiary health care services provision at constant expenditure levels, by region, 2013
Source: World Bank staff calculations
162. Similarly, there is ample scope to increase the provision of hospital care services keeping expenditures constant. Nationally outpatient (ambulatory) and inpatient (admissions) services could increase by 140 percent and 79 percent, respectively, if efficiency was maximized (Figure 75). In all regions, the potential to increase outpatient procedures is over 100 percent, with the highest potential in the Center-West region (169 percent) and the South region (168 percent). The same regions have the largest potential increase of inpatient procedures, 85 percent in the Center-West region and 83 percent in the South (Figure 75).
163. Much of the inefficiency is driven by too many small hospitals and the small size of many municipalities (that are too small to produce health services at an efficient scale). Efficiency varies
-23% -16% -15%-23% -30% -31%
38% 31%24%
40%
60%47%
98%
68% 72%
110%
133% 130%
64%
44%56%
64%76% 73%
Brazil North Northeast Southeast South Center-West
PHC Expenditure Avoidable Deaths 0-4 Avoidable Deaths 5-74 HFP Coverage
Vaccine Coverage Non Medical Consults PHC Medical Consults
-34% -17% -33% -35% -35% -29%
140%120%
165%
121%
168% 169%
79%65%
79% 79% 83% 85%
Brazil North Northeast Southeast South Center-West
STC Expenditures Avoidable Deaths 0-4 (Hospital) Avoidable Deaths 5-74 (Hospital)
Adjusted Ambulatory Procedures Adjusted Admissions

111
greatly depending on location and population size, as much of the inefficiency is due to hospitals which are too small (under 100 beds) to operate efficiently. In fact, the Brazilian health system is characterized by a large number of very small hospitals, which have been built to provide services in less urbanized areas. Most Brazilian hospitals operate on a small scale, and 61 percent have less than 50 beds—compared to an optimal estimated size of between 150 and 250 beds to achieve economies of scale. Bed occupancy rates are very low as well, at an average of 45 percent for all SUS hospitals and only 37 percent for acute care beds. This is much lower than the average for OECD (71 percent) and much below the desirable occupancy rate, between 75 percent and 85 percent.
164. In addition to size, a number of other factors affect municipalities’ efficiency scores.76 The lack of system integration also generates inefficiencies. For example, the more efficient a municipality is at primary care, the more efficient will be hospital (secondary-tertiary) care. In fact, strong primary health care, functioning as the point of entry into the system, contributes to rationalize demand and improve outcomes throughout the system. There is a need to increase the coordination of care by integrating diagnostic, specialist and hospital services, and referral and counter-referral systems. In peer countries, more basic procedures are performed by nurses, who are less costly, freeing up doctors for more complex treatments. In Brazil, systems are not designed to keep lower complexity procedures with lower level facilities. There is also a need to improve integration between public and private systems, to avoid duplication of efforts, competition for scarce human resources, cost escalation, and increased inequalities.
165. Further, efficiency is affected by the scarcity of skilled health workers, particularly doctors, who are relatively high paid, and a lack of incentives to increase doctors’ performance. Much can be done to improve the availability, distribution, and performance of the health workforce. The available health workforce, particularly doctors, is smaller than in countries of a similar level of development and well below the average among OECD countries. The salary of health sector professionals in Brazil are relatively high, especially in primary care, reaching several multiples of income per capita of the richest decile of the population (Figure 76). Yet the productivity of doctors (as measured by the number of consultations per doctor) is substantially below the average of OECD countries, even though the density of doctors is relatively low and concentrated in urban centers (Figure 77). By increasing the number of consultations and admissions and shifting more routine tasks to lower level health personnel (e.g. nurses) significant gains could be achieved in the efficiency and quality of care. National regulations could be adjusted to authorize nurses to conduct consultations and prescribe certain drugs and exams in primary care units. In fact, such practices are standard in most developed countries (to maximize the use of the scarce medical workforce).
76 Specifically, we run regressions of the DEA score against a set of independent variables that represent exogenous factors which might influence the technical efficiency across health care provision units. This set of exogenous factors are classified in five groups: (i) proxies of health care demand, to reflect the fact that higher demand (for example due to an older population), may influence efficiency; (ii) proxies for the supply of health services; (iii) proxies for quality of care, as DEA scores do not capture the quality dimension; (iv) proxies for municipality capacity to provide public services; and (v) health policy variables.

112
Salaries of health professionals are relatively high, especially in primary care, but the productivity (consultations per doctor) is fairly low Figure 76: Salary of health sector professionals as multiple of the average income per capita of the richest decile of the population, various countries
Source: OECD Figure 77: Number of consultations per doctor in Brazil and OECD countries, 2013
Source: OECD

113
166. There is also a need to contain spending on prescription drugs. Drug prices in Brazil are high by international comparison and increases in drug prices are driving up public expenditures on public purchases of prescription drugs. Drug prices are partially due to high mark-ups and a high tax burden on pharmaceuticals which reaches on average 36 percent of the final sales price. Decentralization in drug management imposes challenges related to procurement, storage, and distribution, as many local governments have insufficient technical, legal, administrative, and financial capacity (World Bank, 2012). In addition, an increasing number of patients have resorted to the courts to seek access to expensive drugs or treatments, resulting in judicial mandates that pose an increasing burden on public health finances. The judicialization of access to drugs and treatments also tends to reinforce inequality, as rich patients are more likely to be aware of new procedures and treatments that are available internationally and to go to court to obtain them. Most of these costs are borne by subnational governments, but a relatively small (but increasing) share is born by the federal government (which funds federal hospitals).77
Health expenditure is progressive – though the tax expenditures are highly regressive
Figure 78: Share of education spending by quintile
Figure 79: Concentration coefficients of health public expenditures
In-
patient Out-
patient Tax
expenditures
Total public health
spending
Quintile 1 28% 22% 3% 23%
Quintile 2 227 26% 8% 23%
Quintile 3 22% 25% 16% 21%
Quintile 4 16% 18% 27% 18%
Quintile 5 7% 9% 46% 15%
Source: World Bank calculation based on PNAD Note: The concentration coefficient (or “quasi-Gini coefficient”) can be calculated from the Concentration Curve (or also known as Lorenz curve), as C/(C+D), where C is the area between the Concentration Curve and the Line of Perfect Equity, and D is the area under the Concentration Curve.
167. Budgetary spending on health is progressive, but exemptions granted to private hospitals and income tax deductions for private health plans are regressive and large. The public health system (SUS) guarantees access to healthcare for the poor. In the poorest quintile, 60 depend on the SUS for primary healthcare and more than 90 percent for more complex care. More than half of all public health spending benefits the poorest 40 percent of the income distribution, and only 23 percent accrue to the richest two quintiles (Figure 78 and 79). However, wealthy Brazilians disproportionately
77 The share of federal spending on drugs increased from 8.1 percent to approximately 11 percent from 2007 to 2014. Court orders accounted to over R$250 million in drug purchases in 2011, only at the federal level (OECD 2015. Economic Surveys: Brazil. http://dx.doi.org/10.1787/eco_surveys-bra-2015-en )
-0.5-0.4-0.3-0.2-0.1
00.10.20.30.40.5
Inpatientsubsidies
Outpatientsubsidies
Tax subsidies
Total public health spending

114
benefit from tax deductions for private health insurance on their personal income tax (IRPF), which constitutes a subsidy for private health expenditures (Figure 78 and 79). Only 11 percent of the IRPF tax exemptions benefits the poorest 40 percent of the population, and only 27 percent benefit the bottom 60 percent. As a result, when considering the tax exemptions, public spending on health services is less progressive with 33 percent of the benefits accruing to the two richest quintiles of the population and 46 percent accruing to the bottom 40 percent.
Health sector reforms for greater efficiency, equity and fiscal savings
168. The SUS could produce more health services and better health outcomes with the same level of resources if it were more efficient. The SUS faces challenges that require the profound reforms of the system. Reforms will need to address the existing challenges (quality, effectiveness and inefficiencies) and prepare the system for future challenges (aging population and increasing burden of chronic diseases). Five areas which require attention:
(i) Rationalize the service delivery network, in particular the hospital network, to achieve a better balance between access and scale (efficiency). Notably this will require reducing the number of small hospitals (most Brazilian hospitals have less than 50 beds, and about 80 percent have fewer than 100 beds - when the estimated optimal size varies 150 and 250 beds to reach economies of scale). The study estimates R$1.3 billion per year in inefficiencies in MAC only in municipalities with 100 percent of small hospitals. In addition, more efficient management models would have to be adopted. Studies point to efficiency gains achieved by hospital management model based on Social Organizations. These studies point to a reduction of the average cost per bed, increase of the hospital occupation rates, and expansion of access to health services.78
(ii) Incentivize the increase of productivity of health professionals. This would require implementing remuneration policies linked to quality and performance, such as performance pay. The study estimates efficiency gains of R$ 2.9 billion if the average productivity of health professionals in Brazil reaches the average of the OECD countries. At primary care, increasing productivity will also require an increase in the workforce, not just of doctors. Previous evidence shows that Brazil could increase its level of prenatal coverage, with the same level of spending, if a more intensive production process is adopted relying on nurse practitioners rather than in physicians. In addition, it will be important to promote the standardization of medical practice through the adoption of clinical protocols as a way to reduce variation in diagnosis and treatment (to facilitate cost control and increase the effectiveness of treatments).
(iii) Reform the way providers are paid to better reflect the costs of services and incentivize them to focus on health outcomes. The payment system for the Diagnostic-Related Group (DRG) has resulted in efficiency gains and cost control in other countries. In Brazil, the AIH / SIA system could be gradually converted into a DRG system.
78 Average occupancy rate of hospitals administered by OS was 81 percent compared to 72 percent in direct administration hospitals. The average cost of an ICU bed was on average R $ 220 higher in direct administration hospitals (World Bank, 2008 & 2010). In primary care, evidence shows that OSs increase in at least one primary health care per capita per year (Greve and Schattan, 2017).

115
(iv) Improve the coordination of the system by integrating diagnostic, specialist and hospital services, and referral and counter-referral systems. Strengthen and expand primary health care coverage, with the establishment of primary care as gate-keeper. This would reduce the number of hospitalizations (by approximately 30 percent) and reduce expenses - we estimate by R$ 1.2 billion through reduced cost of hospitalization for sensitive reasons, in primary care, for cardiovascular diseases alone. In addition, there is a need to improve integration between the public and private systems, to avoid duplication of efforts, competition for scarce human resources, cost escalation, and increased inequalities.
(v) Reduce tax expenditures related to healthcare: Tax expenditures represent 30.5 percent of federal health expenditures, concentrated in income tax (IRPF) discounts (R$ 9.6 billion per year) and philanthropic hospitals (R$ 7.4 billion per year). Tax expenditures are highly regressive, and there appears to be no justification for the government to have to pay for the private health care enjoyed by the richest segments of society.

116

117
Spending More or Better? Efficiency and Equity in Public Education
Steadily increasing public spending combined with falling public enrollment results in higher spending per student and lower student-teacher ratios, which drive inefficiency. For richer municipalities efficiency is even lower given the faster demographic transition, resulting in a faster reduction in the number of students in the public network. The constitutional obligation to spend 25 percent of tax revenues on education contributes to such municipalities increasing expenses per student more quickly. This additional spending does not always translate into more learning, it actually generates inefficiencies. Beyond low student-teacher ratios, the public education system in Brazil is characterized by low quality of teachers and high repetition rates. All these factors lead to significant inefficiencies. If all municipalities and states were able to emulate the most efficient ones, it would be possible to increase performance (in terms of passing rate and student achievement) by 40 percent at the primary and lower secondary and 18 percent at the upper secondary level with the same level of public spending. Conversely, Brazil is spending 62 percent more than it would need to achieve the same performance in public schools, which corresponds to nearly 1 percent of GDP. Public spending on higher education is highly inefficient, such that almost 50 percent of resources could be saved. Public spending on primary and secondary education is progressive, but spending on tertiary education is highly regressive. This suggest the need to introduce fees to make students from richer families pay for public universities and to better target access to subsidized student loans for higher education (FIES program).
Levels of expenditure for education sector
169. Public spending on education is divided between three levels of government, with the Federal Government playing a leading role only in higher education. In Brazil, municipalities are in charge of most public primary and lower secondary schools (grades 1 to 9), while the primary

118
responsibility for upper secondary education is with the states (Figure 80). However, the Federal Government transfers resources for subnational school systems through budget transfers. The Federal Government also finances public universities and technical and vocational education programs (Figure 81). An increasing share of federal education spending has been in the form of financial assistance to students who attend private institutions of tertiary education.
As % of GDP, Brazil now spends more than the OECD average and its peers, as well as surpassing OECD in share of total government spending in pre-primary and secondary
Figure 80: Spending by level of government, 2015 Figure 81: Federal spending by category, 2015
Source: Ministry of Finance Source: Ministry of Finance
Figure 82: Government expenditure on education, Brazil and comparators (percent of GDP), 2000-2013
Figure 83: Government expenditure on education, Brazil and comparators (percent of total expenditure), 2000-2013
Source: Unesco Institute for Statistics, World Education Indicators Note: Financial services refers to the FIES program of student loans for higher education.
170. Public spending on education has grown rapidly in recent years, above the level observed in peer countries. As of 2014, education expenditure stood at 6 percent of GDP, after increasing rapidly over the past decade. Already by 2012 education expenditure in Brazil was higher than the OECD average of 5.5 percent, the average of BRICS countries of 5.1 percent, and Latin America’s
28.8%
33.9%
37.4%
Federal State Municipal
1%
8%
10%
8%
12%
16%
14%
31%
-5% 5% 15% 25% 35%
Tertiary Education
Transfers to Primary andUpper-Secondary EducationFinancial Services
TVET
Primary and Upper-Secondary EducationHealth & Nutrition
Administrative
Others
6.0
5.05.3
4.7
5.5
3.54.04.55.05.56.06.5
% o
f GDP
Brazil Structural peersBRICS Regional peersOECD
16.0
17.3
16.416.9
12.7
81012141618
% o
f gov
ernm
ent e
xp.
Brazil Structural peersBRICS Regional peersOECD

119
average of 4.6 percent (Figure 82 and Figure 83). Public expenditure on all levels of education increased at a real rate of 5.3 percent per annum between 2000 and 2014. Expenditure growth occurred in all areas, but early childhood and upper-secondary education saw the fastest growth rates. Expenditure per student has grown even faster—10.1 percent per year in real terms—as the number of students in public primary and secondary schools declined in the 2000s due to demographic change and migration to private schools. Measured as a percentage of GDP per capita, spending per student in primary and lower secondary education almost doubled from 11.9 percent of per capita GDP in 2002 to 21.8 percent in 2014.79
171. Spending on higher education has increased rapidly over the past decade. Enrollment in higher education has tripled in Brazil over the past 15 years, with private higher education institutions playing a major role. Public universities account for 25 percent of enrollment, of which federal universities account for 15 percent of the tertiary education enrollments. As of 2015 the federal government spent approximately 0.7 percent of GDP on higher education, mainly for transfers to federal universities and for student loans (mainly FIES program) (Figure 81). The federal funding allocated to the 63 federal universities amounted to approximately 0.5 percent of GDP as of 2015. Since 2010, the federal budget allocated to the federal universities has seen an annual average growth of 12 percent in nominal terms, or 7 percent in real terms. Considering the annual 2 percent enrollment growth, this represents a 5 percent real annual growth in per-student spending in federal universities.
172. Spending per student in higher education is not high on average, but it is considerably high in federal universities and institutes. As of 2012 spending per tertiary student was approximately 38 percent of the OECD average, which is somewhat higher than regional and structural peers (Figure 84). The level of spending per student is comparable with other countries when controlling for GDP per capita (Figure 85). When considering only public institutions, however, the level of spending per student is close to that of countries which have twice the GDP per capita of Brazil, and much higher than several OECD countries, such as Italy and Spain (Figure 86). Moreover, students in Brazilian public universities cost on average two to five times more than students enrolled in private universities (Figure 97). Despite this much
higher cost per student, on average the added value of public universities is similar to that of private universities (see efficiency analysis below).
79 As revenue increased between 2002 and 2014, the minimum compulsory expenditure per student also increased, as a result of the mandatory linkage of revenues with education spending.
Spending per student in higher education reached high levels compared to the last few years.
Figure 84: Spending per tertiary student as percentage of OECD level
Source: Unesco Institute for Statistics and OECD
38%
28%31%32%
10%
20%
30%
40%
50%
60%
2000 2002 2004 2006 2008 2010 2012
Brazil
Structural Peers
Regional Peers
BRICS

120
Figure 85: Spending per tertiary student by GDP per capita (US$ PPP, 2012)
Figure 86: Spending per tertiary student in public universities, by GDP per capita (US$ PPP, 2012)
Source: Unesco Institute for Statistics Source: Unesco Institute for Statistics
Efficiency of education spending
Primary and secondary education 173. Education outcomes have improved in Brazil but remain disappointing considering the dramatic increase in spending. Despite the substantial gains in access, completion, and learning in Brazilian education in the last two decades, low levels of education quality persist. Brazil improved significantly in the PISA (Program for International Student Assessment) math exam from 68 percent of the OECD average to 79 percent between 2002 and 2012, but has since fallen back to 77 percent in 2015 (the 2009 level). When controlling for the level of spending per student, the PISA results are still disappointing. Brazil’s performance measured by the PISA math score in 2012 was only 83 percent of the level expected given its level of spending per student (Figure 87). For instance, countries like Indonesia and Colombia achieved similar PISA scores with much lower levels of spending. Countries like Chile, Mexico and Turkey spend similar values to Brazil and obtain better results.
174. Brazil’s inefficiencies in primary and secondary education are large and have increased. A data envelopment analysis (DEA)80 using OECD’s PISA scores at the school level in Brazil and other Latin American countries shows that Brazilian schools are relatively inefficient in their use of resources (input oriented DEA). Moreover, the average inefficiency increased from about 45 percent in 2006 to 55 percent in 2012.81 While spending per student increased, most schools failed to improve their performance, resulting in lower productivity overall. Efficiency and performance are correlated: the schools with the best results are also the most efficient. The top quarter of highest performing schools are on average almost 20 percent more efficient than the second best performing quarter. While the factors driving school performance are largely idiosyncratic and related to school management, larger schools, urban schools, and private schools, tend to do better on performance as well as efficiency (Perelman et al., 2016).
80 See Footnote 74 for a brief explanation of the DEA methodology. 81 Detailed results are reported in Volume II.

121
The educational results of Brazil are below the expected given the level of expenditure.
Figure 87: Quadratic regression of log of accumulated public/private investment against PISA math scores in 2012
Note: PISA math score for public schools in analyses with public expenditure data. The spending data is deflated by CPI-U (Consumer Price Index for All Urban Consumers, 2013=100) Sources: World Bank estimations with UNESCO Indicators, PISA and Education at a Glance (OECD).
175. The poor performance of Brazil’s education system is reflected in high repetition and drop-out rates, despite of low and falling student-teacher ratios. More than 35 percent of the students repeated at least one grade in primary, lower secondary of upper secondary education, compared to under 15 percent in the OECD and structural peers like Turkey and Russia (Figure 88). Dropout rates are also very high at 26 percent, compared to 4 percent in the OECD and 14 percent among regional peers (Figure 89). This is despite Brazil having relatively low student to teacher ratios. In fact, the average student-teacher ratio has been decreasing because the student population in public schools has been falling. As of 2014, the student teacher ratio stood at 23 in primary and 19 in lower-secondary school. This is above the OECD average of 15 and 13, but slightly below that average of structural peers (25 and 22 for primary and lower-secondary school, respectively, OECD 2014).
176. The low completion rate of upper secondary education is another indicator of poor performance of the education system. Students complete upper secondary education at 19 years of age on average, slightly above the age in several structural and regional peers (Figure 90). However, high levels of repetition and dropout result in a surprisingly large percentage of students that do not complete upper secondary education before 25 years of age (Figure 91). This seems to be the main driver of high costs per graduate in upper secondary and higher education in Brazil, which are higher than in any other country in Latin America. 177. High age-grade distortion starts in primary education and continues through higher education, resulting in high average cost of producing a graduate. Brazil has a gross enrollment rate in higher education of 42 percent, well above the corresponding net rates of 16 percent. This
Australia private
Chile private
Denmark privateEngland private
Japan private
Mexico private
New Zealand privatePoland private
Spain privateSwitzerland private
US private
Argentina
AustraliaAustria
BrazilChile
Colombia
Czech RepublicFinlandGermany
Indonesia
JapanKorea
Luxembourg
Mexico
Portugal
Switzerland
Turkey
350
400
450
500
550
600
8 9 10 11 12 13 14
PISA
mat
h -p
ublic
and
priv
ate
netw
orks
Log of accumulated expenditure per student from 2004-2012 (2012 USD PPP)

122
indicates that more than half of Brazilian students in higher education should already have completed the course. Grade repetition is not only costly but also reflects the lack of targeted support to lower performing students, often from disadvantaged backgrounds. High repetition rates constrain public education efficiency
Figure 88: Percentage of students who have repeated a grade in primary, lower secondary or upper secondary education, 2015
Figure 89: Dropout rates in primary and lower secondary education, various countries, 2010
Source: UNESCO Source: UNESCO
Figure 90: Average age of students completing upper secondary education in selected countries, 2015
Figure 91: Completion rates at secondary level for people below 25 years old, selected countries (2015)
Source: UNESCO Source: UNESCO
Note: Graduation rates are the percentage of people estimated to graduate a certain education level at least once in their lifetime.
178. The low quality of teachers is the most important factor constraining education quality. Teaching remains a low prestige profession, with low standards for entry into teacher training schools, low quality programs, little selectivity at entry into state and municipal school systems, and salaries de-linked from performance. In addition to the low selectivity in hiring teachers for state and municipal education systems, wages are not tied to performance. Changing this paradigm will require coordinated policy reforms at the federal, state and municipal levels. Demographic trends, however, will provide a major opportunity to raise teacher standards and education quality over the next decade, as the size of
0 20 40
BrazilColombiaUruguay
PeruChile
IndonesiaMexicoOECD
United StatesTurkey
United KingtomRussia
% 0 5 10 15 20 25 30
BRICS
OECD
Structural peers
Regional peers
Brazil
17.317.8
18.118.2
18.418.5
18.618.9
16 17 18 19
United…Indonesia
KoreaMexico
Costa RicaChile
TurkeyBrazil
%
92.586.1
82.979.1
66.766.0
55.258.9
0 20 40 60 80 100
KoreaChile
United StatesOECD
LACStructural peers
MexicoBrazil

123
the school aged population in basic education is expected to fall by 25 percent from 2010 to 2025. This, tied to a large number of teachers who will retire in the coming years, will allow for greater selectivity in the hiring of a smaller number teachers who will be needed to replace those who are retiring.
Entry level teacher salaries for basic education are in line with international levels (as a share of GDP per capita), but increase rapidly above international levels due to automatic promotions. University professors are paid much above international benchmarks.
Figure 92: Average actual annual teachers’ salaries in lower secondary education in 2014
Figure 93: Average actual annual teachers’ salaries in tertiary education in 2014
Source: Education At a Glance 2016, OECD. Note: USD equivalent converted using PPPs.
Source: Education At a Glance 2016, OECD. Note: USD equivalent converted using PPPs.
179. The national minimum salary for Brazilian teachers is in line with what is paid in other countries with similar income per capita (Figure 92)82. However, teacher salaries in Brazil increase very rapidly due to automatic promotions based on years of service and attendance of training courses such that in 15 years they are more than 3 times the starting salary in real terms. This evolution significantly surpasses most countries in the world. In addition, it should be noted that teachers in Brazil are entitled to relatively generous pension plans when compared to other OECD countries (see chapter on pensions). While primary school teachers receive equivalent salaries in line with similar income countries, the salaries of university teachers appear to be above those in several countries with higher income per capita (Figure 93).
82 It is worth mentioning that the salary floor of teachers is determined annually by the Federal Government. Nonetheless, salary matrices for promotions (and therefore for teachers' salaries) vary greatly depending on the region and the specific functions performed by these professionals.
0
20000
40000
60000
80000
100000
120000
140000
Switz
erlan
dGe
rman
ySp
ainAu
strali
aUn
ited S
tates
1Po
rtuga
lOE
CD av
erag
eIre
land
Turke
yMe
xico
Chile
Colom
biaBr
azil
Slov
ak R
epub
lic
Starting salary/minimum qualificationsSalary after 15 years of experience/typical qualificationsSalary at top of scale/maximum qualifications
0
25000
50000
75000
100000
125000
150000
Unite
d Stat
es Italy
Austr
alia
Chile
Norw
ayUn
ited K
ingdo
mFr
ance
Swed
enFin
land
Braz
ilPo
land
Icelan
dHu
ngar
yCz
ech R
epub
licSl
ovak
Rep
ublic
FTE faculty: All tertiary academic instructional facultyFull-time faculty: Full professors (or country equivalent)

124
Variance in spending across municipalities and states only explains 11% of IDEB performance, which suggests large potential for improving efficiency—and specifically scope to increase performance in the North and North-East and scope for savings in the South, Southeast and Center-West.
Figure 94: Accumulated Expenditure per Student from 2009 to 2013 on IDEB of primary and lower secondary education (municipal and state networks)
Source: World bank estimations with SIOPE and Prova Brasil.
Figure 95: Accumulated Expenditure per Student from 2009 to 2013 on IDEB of primary and lower secondary education (municipal and state networks): Ceara municipalities
Source: World bank estimations with SIOPE and Prova Brasil.
0.0
2.0
4.0
6.0
8.0
10,000.00 15,000.00 20,000.00 25,000.00 30,000.00 35,000.00 40,000.00 45,000.00 50,000.00
IDEB
of p
rimar
y an
d lo
wer
seco
ndar
y ed
ucat
ion
(201
3)
Accumulated expenditure per student from 2009-2013 (in 2013 BRL)
Other municipalities Ceará

125
180. Comparing performance across Brazilian municipalities suggests potential savings from moving all municipalities to the Brazilian performance frontier of approximately 1 percent of GDP.83 The high variance in performance across municipalities in part reflects the diversity of Brazil, but also signals the existence of significant inefficiencies. A DEA analysis was carried out comparing performance using the Basic Education Development Index (IDEB) scores with education spending at municipal and state level. On average the variance in spending across municipalities and states only explains 11 percent of IDEB performance which suggests that good management practices play a critical role. If all schools were able to catch up to the most efficient ones, performance would increase by 40 percent at the primary and lower secondary education and 18 percent at the upper secondary level. Conversely, Brazil is spending 62 percent more than it should to obtain the desired performance. This corresponds to R$ 56 billion (nearly 1 percent of GDP). Of this amount, R$ 27 billion and R$ 15 billion could be realized at municipal and state primary and lower secondary education, respectively, and R$ 15 billion in state upper secondary education.
181. There is scope to increase performance by increasing spending in the North and North-East, while scope for savings is largest in the South, Southeast and Center-West. The municipalities and states in the country’s North and Northeast tend to be more efficient, and additional resources would have the greatest impact here (Figure 94). Indeed, reducing spending in these areas could in fact impact performance negatively. For the schools in the states and municipalities of the South, Southeast and Center-West regions that currently spend more per student, reducing costs do not appear to put performance at risk. These schools tend to be less efficient and could benefit more from better management.
182. Inefficiency in primary and secondary education is related primarily to an excessive number of teachers. Approximately 39 percent of the inefficiency in education spending in Brazil is associated with low pupil-per-teacher ratios (PTRs). If all schools were to move to the performance frontier, Brazil could increase the number of students per teacher by 33 percent in primary and lower secondary public schools and by 41 percent in upper secondary schools. Alternatively, reducing the number of teachers in line with the existing numbers of students would represent savings of approximately R$ 22 billion (or 0.33 percent of GDP), of which R$ 17 billion in primary and R$ 5 billion in secondary education. Low student teacher ratios are a particularly significant problem in the primary and lower secondary school systems of the South, Southeast, and Center-West where changing demographics have resulted in a fall in student numbers in the public system. In large part this problem could be solved by attrition, that is not replacing teachers when they retire. Attrition due to retirement may bring ratios to efficient levels in 2027 for primary and lower secondary education, and in 2026 for upper secondary education.84
183. Efficiency could also be increased by ensuring that teachers spend more time teaching and by reducing teacher absenteeism. Teachers in Brazil spend part of their time on unproductive activities. On average, teachers spend only 65 percent of their time teaching, against an international
83 Being on the border of performance does not mean having a high performance. It means having the highest performance observed given the level of expenditure per student. That is, municipality A may perform better than B, but B is at the border and A is not. This is because at B’s level of expenditure per student, no municipality performs better, which does not happen with A. 84 Note that given generous retirement rules for teachers, retired teachers still impose budget costs on states and municipalities through the pension system. Immediate fiscal gains would only accrue if teacher attrition goes hand in hand with a reform of the local RPPS systems.

126
best performance benchmark of 85 percent. There is also a need to reduce teacher absenteeism. In São Paulo for instance absenteeism reaches 16 percent and in Pernambuco 10 percent (compared with only 5 percent in the U.S.). Absences are due to environmental factors (traffic, violence, heat, stress) but are also caused due to permissive legislation, that allows for leave without verifiable reasons. In addition, job stability and remuneration largely unrelated to performance, and weak monitoring and control give teachers little incentive to maintain proper attendance. The international literature offers some possible solutions: introducing a bonus for teacher attendance; improving mechanisms for reporting absences or recording presence; introducing and enforcing the threat of dismissal for excessive absenteeism; introducing benefits linked to retirement; and publishing average absenteeism rates in school performance bulletins.
The revenue linkages that result in high compulsory education expenditures are associated with lower efficiency
Figure 96: Efficiency versus net current revenue – municipal per student
Source: World Bank estimates based on SIOPE data and Prova Brasil.
184. The constitutional earmarking of 25 percent of state and municipal tax revenues to education also contributes to inefficiency of expenditure. Richer municipalities, with high net current revenue per student, tend to be far less efficient than poorer municipalities (Figure 96). Thus, it is likely that in order to comply with constitutional rules, many wealthy municipalities are forced to spend resources beyond what is useful to increase learning. This is all the more worrying given the drastic demographic transition the country is undergoing. With the rapid decline in the fertility rate to below 1.8, the number of students has been falling rapidly in many municipalities, especially in elementary school. Given that this decline in the number of students is not necessarily associated with a fall in tax revenues, this implies that to comply with the law, many municipalities are obligated to
Campo Grande
Maceió
GoiâniaSão Luís
Belo Horizonte
Aracaju
Manaus
Recife
Florianópolis
São Paulo
Rio de Janeiro
Boa Vista
Teresina
Fortaleza
Vitória
NatalCuiabá
Rio BrancoCuritiba
Macapá
Palmas
Vilhena
João PessoaBelém
Salvador
0.2
0.3
0.4
0.5
0.6
0.7
0.8
0.9
1
8.9 9.4 9.9 10.4 10.9 11.4
Inou
t-or
ient
ed co
st e
ffici
ency
scor
e
Log of the net current revenue per student - in R$ of 2013
North and NortheastSouth, Southest and MidwestCapitalsEfficiency on net current revenueLog. (Efficiency on net current revenue)

127
spend more per student, even when revenues remain constant. In addition, this additional expense is often not necessary, and therefore does not result in better learning outcomes. The consequence is an even greater increase in inefficiency.
185. Brazil does not lack positive and innovative experiences on how to improve education quality with limited resources. Innovations in school management in the state of Ceará have shown how to significantly improve learning outcomes with the use of performance incentives (Figure 95). In Ceará the distribution of state tax (ICMS) revenue is based on the municipality’s index of education quality. Ceará has also introduced student learning interventions, such as early grade reading skills program (PAIC), and equipped teachers with scripted training and literacy materials. In Amazonas teachers are tested early in their tenure and only the best newly contracted teachers are kept on. A mandatory two-hour online training course and final evaluation are prerequisites for all teachers in the probationary stage. Rio de Janeiro and Pernambuco have introduced bonus-pay for teachers and school administrators based on school performance. Rio de Janeiro has also ended political appointment of school district managers and school directors, and introduced an annual performance evaluation for regional coordinators and school directors, as well as regular meetings to disseminate the results and highlight high performing schools. All of these experiences proved to be cost-effective, not only improving student performance but also increasing the efficiency of public spending on education.
Higher education 186. The large majority of Brazilians pursuing a tertiary degree do so in private universities. In 2015, of the approximately eight million tertiary students, only about two million were in public universities. The minority of students that attend public universities in Brazil tend to be from well-off families and graduate from private primary and secondary schools. Yet spending per student in public universities in Brazil is considerably higher than in countries with similar GDP per capita (Figure 86).
187. Students in public universities in Brazil cost annually two to three times more than students in private universities. Between 2013 and 2015 the average annual cost per student in private not-for-profit and for-profit universities was approximately R$ 12,600 and R$ 14,850 per year respectively (Figure 97). For federal universities, the average was about R$40,900. State public universities cost less than federal universities, but are still twice as expensive as private ones, averaging approximately R$32,200. The cost per students in the recently established federal institutes, most of them founded since 200885 is approximately R$ 27,850 per year on average.86
85 The Federal Institutes of Education, Science and Technology (IFETs) were created in December 2008 through Law 11.892. This new model of institution brought together the Federal Agrotechnical Schools (EAF), the Technical Schools linked to the Federal Universities, the Federal Technical Schools (ETF) and the Federal Centers of Technological Education (CEFETS). After the promulgation of the Law, these intuitions started to offer, in addition to technical education at the secondary level, higher education courses. 86 The computed cost per undergraduate student does not include cost of research and university hospitals. We also excluded investment since many federal institutes were recently built and therefore this would wrongly increase their costs per students even more.

128
The cost per student at federal universities is two to three times higher than the cost in private institutions
Figure 97: Annual cost per student (in 2016 BRL), by type of university
Source: World Bank estimation based on ENADE and Censo da Educação Superior (2013-2015)
188. While students in public universities tend to perform better in standardized assessments, private universities appear to add similar value. The average ENADE scores for public universities is higher than for private ones (Figure 98).87 However, students that enter public universities tend to already have achieved higher levels of learning beforehand. Therefore, the most relevant metric to assess added value is to compare the obtained scores to the pre-university expected scores.88 For the math and physical science majors, private universities tend to add as much value as public universities (Figure 98). For the humanities, private universities appear to add more value, except for the federal institutes. For the biological sciences, federal institutes and state universities add higher value, but federal universities add about the same per student than private universities. However, they cost almost three times more.
87 ENADE assesses the performance of undergraduates in undergraduate courses in relation to the syllabus content and the skills and competences acquired in their training: specific component and general component, respectively. The first has a weight of 75 percent and the second has a weight of 25 percent. Specific training questions assess the mastery of the knowledge necessary for the exercise of the profession; and the general curriculum presents questions about globalization, citizenship, contemporary problems, biodiversity and sociodiversity. The examination is compulsory to obtain the diploma in federal and private universities, and has been applied since 2004. Each area of knowledge (biological sciences, stem, and human sciences) must be evaluated at the most every 3 years. 88 The value added, that is, the indicator of the difference between observed and expected performance, seeks to measure what specifically concerns the value added by the course in the development of the passing students. The indicator is calculated based on performance in ENADE and on the developmental characteristics of the student upon entering the undergraduate course. These characteristics are measured by the grades obtained by these students in the National High School Examination (ENEM).
12,62514,837
27,84432,199
40,893
0
5,000
10,000
15,000
20,000
25,000
30,000
35,000
40,000
45,000
Privadas - SFL Privadas Institutos Federais Estaduais Federais

129
The high cost per student of federal public universities is not reflected in a higher added value for graduates compared to graduates of other universities.
Figure 98: Performance observed in ENADE versus value added by type of higher education institution - (2013-2015)
Social sciences and humanities
Math and Physical Sciences
Agriculture and biological sciences
ENADE Value Added ENADE Value
Added ENADE Value Added
Private 2.08 2.46 1.84 2.34 1.93 2.06
Private – NPO 2.3 2.45 2.13 2.39 2.21 2.35
State 2.8 2.4 2.28 2.22 3.11 2.66
Federal – Universities 3.42 2.25 2.79 2.37 3.18 2.4
Federal – Institutes 3.23 2.59 2.49 2.38 2.99 2.61
Source: ENADE (2013-2015). Note: NPO: Not For Profits.
A formal DEA efficiency analysis confirms the existence of large inefficiency, such that the same output could be produced with half the level of spending; federal universities are especially inefficient: their value added is low compared to their costs
Figure 99a: Input-oriented DEA efficiency score of higher education
Figure 99b: Accumulated expenditure on higher education (2013-2015, in 2016 R$ billion)
Source: Secretaria Executiva/MEC (report on the expenditure per student in federal universities and institutes) and Censo da Educação Superior/INEP-MEC (for accumulated expenditure on private and state universities). Note: The chart presents the accumulated expenditure of the universities considered in the efficiency analysis, that is, the universities with reported performance in ENADE (2013, 2014 and 2015).
189. Brazilian private universities tend to be more cost efficient than public ones. A DEA analysis comparing spending per student to the ENADE Valued Added index across all universities estimates that public universities are only about 79 percent cost-efficient on average (Figure 99 and
0.860.88
0.8 0.79
0.84 0.83
0.740.760.78
0.80.820.840.860.88
0.9
64 7440
139
21
339
050
100150200250300350400

130
Figure 100).89 That is, they could be adding the same value with about 20 percent less resources per student. In comparison, not-for-profit and for-profit private universities are on average 88 and 86 percent efficient respectively. Our estimates indicate that by becoming more efficient, federal universities and institutes could save approximately R$ 10.5 billion per year and still add the same value. State universities could be saving an addition R$ 2.7 billion per year.
Despite the high cost, federal universities are less efficient.
Figure 100: Results of the DEA efficiency analysis of higher education
Source: World Bank estimation based on ENADE and Censo da Educação Superior (2013-2015)
Incidence of public spending on education
190. Public spending in primary and secondary education benefits the poor more than the rich. Since the poor rely on the public school network, public spending on education, especially primary education is progressive. More than 60 percent of the spending on primary education benefits the bottom 40 percent of the income distribution (Table 5 and Figure 101). Public spending on secondary and pre-schools is also progressive though less so since the poorest access these less frequently. Here, the bottom 40 percent receive around 50 percent of total spending.
89 See Footnote 74 for an explanation of the DEA methodology.

131
Education expenditure is progressive – though spending on public universities is regressive
Table 5: Share of education spending by quintile Figure 101: Concentration coefficients of education expenditures
Prim+Sec+PS
education Tertiary
education
Total education spending
Quintile 1 33% 6% 28%
Quintile 2 29% 8% 26%
Quintile 3 17% 13% 16%
Quintile 4 14% 24% 17%
Quintile 5 7% 49% 13%
Source: World Bank calculation based on PNAD Note: The concentration coefficient (or “quasi-Gini coefficient”) can be calculated from the Concentration Curve (or also known as Lorenz curve), as C/(C+D), where C is the area between the Concentration Curve and the Line of Perfect Equity, and D is the area under the Concentration Curve.
Public spending on federal universities largely benefits the rich, both by paying for their higher education and by increasing their future earnings potential
Figure 102: Incidence of tertiary education, 2000-2012
Figure 103: Incidence of higher education enrollment in 2015 by type of institution
Source: World Bank (2017), At a Crossroads: Higher Education in Latin America and the Caribbean. Washington DC
Source: World bank calculation based on PNAD Note: Percentage of 18 to 24-year-olds in higher education by quintile of per capita income and type of institution. Percentages do not add to 100 because we focus on 18 to 24 years old students only.
-0.5
-0.4
-0.3
-0.2
-0.1
0
0.1
0.2
0.3
0.4
0.5
Pre-School Primary Secondary Tertiary
<--
redu
ce in
eqau
lity
inc
reas
e in
equl
aity
-->
Total Education
1.3 2.1 2.5 3.6 7.80.9 1.1 1.6 2.03.6
3.26.3
10.617.6
29.9
0
20
40
60
1 2 3 4 5
% o
f 18
to 2
4-ye
ar o
lds e
nrol
led
in h
ighe
r edu
catio
n
Quintile of per capita income (2015)
Private universitiesState or municipal universitiesFederal universities

132
191. However, spending in tertiary education is very regressive. Public tertiary education receives the most public funding per student (approximately US$5,000 PPP). While enrollment in higher education has been increasing rapidly in Brazil, access to higher education remains highly inequitable (Figure 102). In 2002 virtually no university students came from the poorest 20 percent of Brazilian households and only 4 percent of students came from the bottom 40 percent. As of 2015 approximately 15 percent of students in higher education came from the bottom 40 percent (Figure
102). Public spending on tertiary education benefits overwhelmingly students from better-off households. In particular, federal universities are fully paid for by the federal government and they charge no tuition fees, yet only 20 percent of students come from the poorest 40 percent of the population, while 65 percent come from the richest 40 percent (Figure 103). This inequity is compounded by the fact that access to public universities is regulated through a high-stakes entrance exam. Students from better-off families have the means to pay for private tuition, or private primary and secondary education to prepare them for this exam, whereas students from poorer households have a much lower chance to getting admitted to public universities.
192. Returns to higher education are high in Brazil, which would justify charging students for their higher education. Although returns to tertiary education have declined a little in recent years, they remain high in Brazil (Figure 104). Students from richer families receive free higher education, which increases their future income. Free higher education may thus be perpetuating inequality in the country.
Education sector reforms for greater efficiency, equity and fiscal savings
Primary and secondary education 193. It is possible to save almost 1 percent of GDP by improving efficiency in primary and secondary education, without compromising the current level of services. Possible reform options to increase efficiency in primary and secondary education can be summarized as follows:
(i) Allow student-teacher ratios in the more inefficient schools to gradually rise to efficient levels through teacher attrition. On average, frontier levels of efficiency would be reached by 2027 for primary and lower secondary education if retiring teachers are not replaced and by 2026 in upper secondary. This step alone could save up to 0.33 percent of GDP. A further recommendation for those municipalities who need to replace retiring teachers, is to limit the hiring of new “professores concursados”, whose dismissal is extremely difficult (and who create significant costs as they can retire early with a full pension).
(ii) Scale-up and share positive experiences in school management that have already demonstrated strong results across various states and municipalities. Some interventions as the appointment of school directors by performance and experience (not political
Figure 104: Internal returns to a higher education degree in Brazil 1981-2011
Fonte: Barbosa Filho e Pessoa (2013).
24.1 25.122.7
26.5
33.3 32.830.1
18.3
0
5
10
15
20
25
30
35
1981 1985 1990 1996 2001 2004 2009 2011

133
indications), bonus-pay to teachers and school staff based on school performance, tailoring policies at the state level to specific local needs, sharing experiences and best practices to highlight high performing schools are some of the good examples that could be emulated. Contracting the provision of education services to private providers might also enhance performance and efficiency in public education spending. Charter schools are likely to have more flexibility in human resource management. Because they can be penalized for bad performance, they will make hiring, firing and teachers ‘promotion and salary decisions based on performance and not tenure or seniority. However, new federal, state and municipality legislation may be needed to allow for PPPs in primary education.
Higher education The results of the analysis suggest two lines of reform:
(i) Capping spending per student at the level of the most efficient universities would enable immediate savings of 0.26 percent of GDP. Universities receiving reduced funding as a result would need to reconsider their cost structure or raise funding from third parties, as is already the norm in the best performing academic systems.
(ii) One option to increase funding for federal universities without burdening the budget is to introduce tuition fees. These are justified as higher education offers large private returns to students and as enrolment to date is still predominantly from the richer parts of society. In parallel, there is a need to facilitate access to financing for students that cannot afford to pay tuition fees. Fortunately, Brazil already has the FIES program which provides student loans to enable access to private universities and this system should be extended to also provide loans to attend federal universities. Extending the FIES to federal universities could be combined with providing free tuition scholarships for the students from the poorest 40 percent of the population by expanding the PROUNI program. Altogether, these steps would improve equity and would save at least 0.5 percent of GDP from the federal budget.

134

135
Do Policies to Support the Private Sector Provide Returns to Society?
Federal government expenditures on policies and programs to support business are large at 4.5 percent of GDP, but most programs are ineffective, benefitting inefficient incumbent firms to the detriment of productivity and jobs. Support to businesses in Brazil is a significant drain on public resources but most available studies suggest that the majority of programs are ineffective and distortive. Hence, it is possible to remove them with no negative impact on economy-wide employment or productivity. At the very least, these expenditures should be reallocated to redesigned programs which effectively support productive firms and private sector competitiveness, investment and job creation, in line with international best practice. There is also a need for more systematic evaluation, which in turn requires granting researchers access to data on all existing support programs including the very substantial range of tax exemptions.
Level of expenditures on policies to support business
194. Brazil has spent a significant and increasing share of its federal public expenditures on policies to support business. Between 2006 and 2015 total spending on policies and programs to support the private sector increased from 3.0 percent of GDP to 4.5 percent (Figure 105). However most of this expenditure is off-budget. Direct expenditures accounted for only 0.5 percent of GDP in 2015 with most of the support to businesses taking the form of tax expenditures and subsidized credit through public banks.90 Tax expenditures, which are particularly high by comparison with Brazil’s peers, accounted for 61 percent of the total (Figure 105). The SIMPLES program by itself represented one-half of business-friendly tax expenditures (at 1.2 percent of GDP), followed by payroll-tax
90 One significant on-budget program is the Deshoneração da Folha program, a payroll tax exemption which is accounted for as a budgetary expenditure.

136
exemptions (0.44 percent of GDP) and the Zona Franca de Manaus special economic zone (0.38 percent of GDP). Subsidized credit accounted for a further 1.2 percent of GDP in 2015.
195. The efficiency of the existing programs and policies is insufficiently documented; largely due to limitations on data access, notably tax data held by the Receita Federal do Brasil. There are very few rigorous evaluations, and many programs have not been evaluated at all. Given the large amount of resources spent on these programs, there is an urgent need for their systematic evaluation.
Spending on policies to support business is large and has been growing despite concerns about its effectiveness & efficiency
Figure 105: Public expenditures on policies to support business
Source: Federal Revenue Service of Brazil; BNDES; FAT; Ministry of S&T (MCTI); Ministry of Industry (MDIC) Note: Values in R$ MM 2015 base year Note2: Credit estimated before 2008
Efficiency and incidence of policies to support business
196. Available evidence shows poor efficiency of policies and programs to support business. At the macro-level, the scaling up of programs aiming to support private sector growth until 2015 was instead accompanied by faltering growth, stagnant productivity and a sharp decline in investment. At the micro-level, several evaluations have been carried out that confirm the overall conclusion that Brazil’s spending on policies to support business is highly ineffective. What follows is a brief summary of the most important micro-evaluations:
- The SIMPLES is expensive and potentially distortionary. The SIMPLES is a simpler tax regime for small firms, with the objective to encourage formalization of SMEs by easing their fiscal and administrative tax burdens. Using industrial survey data (PIA), Corseuil and Moura (2017) focus on companies close to the eligibility threshold and find no positive effect of SIMPLES on labor market and firm performance indicators. Other available studies suggest that it failed to increase formalization (Piza, 2016), while it introduced distortions in the choice
1.5%
2.0%
2.5%
3.0%
3.5%
4.0%
4.5%
5.0%
0
50,000
100,000
150,000
200,000
250,000
300,000
200
6
200
7
200
8
200
9
2010
2011
2012
2013
2014
2015
Perc
ent
of G
DP
R$
mill
ion
Tax Expenditures Subsidized Credit Direct Spending Total % GDP

137
of intermediary inputs which results in productivity losses (Caprettini, 2015).91 This is in line with international evidence which suggests that most formalization programs have limited impact (and enforcement efforts have better results). The program also appears to be inefficient since it has the unintended productivity consequence of keeping firms small. Another concern is that preferential treatment of small businesses in combination with low effective tax rates for large businesses may result in an inverted U‐shaped pattern of the tax burden, potentially placing medium‐sized businesses at a competitive disadvantage.
- The Programa de Sustenção do Investimento (PSI) has not induced additional investment or employment, and has had no positive impact on productivity. The objective of the PSI programs was to stimulate investment in capital goods by providing access to subsidized credit. The program was halted in 2015, but there continue to be calls by the private sector to reintroduce it. The fiscal cost reached 0.5 percent of GDP in 2015. However, the fiscal costs are much higher because they extend over many years, in line with repayments of the subsidized loans (Figure 106).92 Several studies have looked at the impact of the PSI subsidized credit programs, almost all studies have found that the PSI has had little effect in supporting investment93, and instead introduced distortions which lowered productivity growth (Pazarbasioglu et al., 2016).94 Bonomo et al., (2015) find no effect of the program on the real investments of listed firms, which are generally the larger firms in the economy. Their findings also suggest that subsidized funding replaced other funding, or was invested in financial assets, such that subsidized credit appears to simply have increased firm profits with no social benefit. Further, they find that program introduced distortions since it largely benefited old and unproductive firms. Ribeiro and Nucifora (2017) also find no evidence of any sustained positive impact on firms’ investment or productivity95. While there are no studies which assess the social
91 This is because a tax on turnover, such as SIMPLES, distorts production decisions every time inputs are exchanged along the production chain, because inputs can always be substituted with labor. Thus, the aggregate deadweight loss created by the tax grows with the number of times sectors exchange inputs—the number of stages of production. More interestingly, a tax on turnover also affects prices, because it increases the cost of one of the inputs of production (Caprettini, 2015). 92 Until 2017 the long-term interest rate (Taxa de Juros de Longo Prazo or TJLP) was set quarterly by the National Monetary Council and used as the benchmark rate for loans from the Brazilian Development Bank to companies. Starting in 2018 the government has adopted a new market-based long-term rate, the TLP (Taxa de Longo Prazo), as the benchmark rate for loans from the Development Bank. Most of the cost of the PSI program was “implicit” in the financing of BNDES through the TJLP, which was recorded as government interest expenditure (“below the line”). In the case of the PSI an additional “explicit” subsidy was provided in the budget to lower the program lending rate below the TJLP (“above the line”; see Pazarbasioglu et al., 2017). 93 However, some studies find a positive impact of subsidized credit programs on investment and, in particular, employment. See also Ribeiro and De Negri (2009) and Coelho and De Negri (2010). 94 See also Ottaviano and Sousa (2008) and (2016) on FINEM; Ribeiro and De Negri (2009) on FINAME and innovative firms; and Lazzarini et al. 2015 on equity and loans in listed firms. De Bolle (2015) finds some evidence that BNDES lending is associated with lower aggregate TFP. 95IDB / OVE (2017) analyze the impact of business support programs and their results suggest that some credit access programs for small and medium-sized enterprises (SMEs) in Brazil have had positive impacts. Bazzi et al. (2017) explore the effects of a large-scale expansion of credit for small and medium-sized enterprises with the BNDES Card program. Their findings suggest that expansions of credit supply to SMEs have resulted in major shifts in the composition of firms that have led to the entry of marginal companies otherwise unable to survive in more competitive environments. The results suggest that it is important to allocate credit to potentially productive companies that are more subject to credit rationing. The expected redirection of BNDES loans in this direction can bring positive impacts.

138
return on projects funded by the PSI, the incidence of these credit subsidies is likely to be regressive as it mostly supports larger and older firms.
- The Payroll Tax Exemptions (Desoneração da Folha) maintain jobs, but at a very high cost. The objective of this program is to lower social security contributions in specific sectors to generate, or at least to protect jobs. It had a fiscal cost of 0.4 percent of GDP in 2015. There are various studies which have looked at these programs (Afonso and Diniz, 2014; Afonso and Leal de Barros, 2013ª; Afonso and Leal de Barros 2013b; Silva et al., 2014; Scherer, 2015; Garcia et al., 2017). The results indicate that the programs have little or no impact on employment and that the cost of the few jobs created (or protected) is very high, at more than 3 times the workers’ salary. Indeed, international experiences on the effect of payroll tax exemptions indicate that employment generation is not automatic. Such programs can lead to an increase in wages or to the formalization of labor contracts with limited impact on job creation (for examples from Argentina, Chile, Finland and Sweden,
The fiscal costs of the PSI subsidized credit program, which was terminated in 2015, will extend until after 2040.
Figure 106: PSI Subsidized Credit Cost: Historical data to 2015 and projections to 2060 (R$ million)
Sources: BNDES Note: Most of the cost of the PSI program was “implicit” because the BNDES PSI lending was financed through capital raised by the placement of government bonds. The (negative) difference the government bond rates and the subsidized rate at which the National Treasury lent to the BNDES (the Taxa de Juros de Longo Prazo or TJLP rate) and was recorded as government interest expenditure (“below the line”). Further, in the case of the PSI program an additional subsidy was provided to lower the interest rate charged on PSI loans below the TJLP. This additional subsidy was “explicit” and accounted for in the government budget (“above the line”) (see Pazarbasioglu et al., 2017).

139
see Gruber 1997; Cruces et al., 2010; Bennmarker et al., 2009; Korkeamäki and Uusitalo, 2009). Payroll tax exemptions in Colombia translated into lower labor informality (Fernandez and Villar, 2016). The government is considering removing this program for most sectors, which would make a substantial and immediate contribution to fiscal adjustment.
- Inovar-Auto protects the local industry from imports with questionable effects on output, productivity and jobs. The objective of this program is to protect the local auto industry against imports and to support technology upgrading. While the program has been effective in limiting imports, as a result of the high tariffs applied to the import of vehicles, it seems to have failed to make the Brazilian car industry competitive, as it appears to have had no impact on production and employment levels. In fact, a simple comparison with the agricultural machinery industry, which does not enjoy the same type of protection, shows that the expansion of the two sectors has been very similar. The Inovar-auto program did not alter industry competitiveness enough to allow output and jobs to grow (Figures 107 and 108). Moreover, it resulted in small scale production and higher consumer prices. The fiscal cost of the program is relatively limited, at 0.03 percent of GDP (or 3 percent of manufacturing GDP). Most of the protection, however is in the form of trade barriers. As such most of the cost is borne by consumers through higher domestic sales prices. As an example, the price in Brazil of a Toyota Corolla was US$ 22,000 in 2017, which is nearly double the price in Canada at US $12,500 (Figure 109). The inefficient scale of Brazil’s car industry and its failure to integrate into global value chains are the main reason for higher costs, lower productivity and higher consumer prices.
The need to formulate a new policy following the WTO ruling against Inovar-Auto in 2017 provides a welcome opportunity to rethink Brazil’s approach to the car sector. Automotive policies should become less protectionist and support technological upgrading96. Tariffs on knowledge intensive inputs should be reduced to allow Brazilian producers to reach global standards. Any future policy support should reduce anti-export bias instead of allowing domestic producers to rely on a protected market at home. More attention should be paid to suppliers, including smaller firms, rather than just final assembly by large car producers. Tax incentives could also be tied to performance on fuel economy and safety, encouraging higher quality car production in Brazil (Sturgeon et al., 2017).
96 This does not necessarily need to be a specific policy for the sector, since there is already a horizontal policy of stimulating innovation (Lei do Bem).

140
A comparison with the performance in the (unsupported) agricultural machinery sector suggests that Inovar-Auto had little effect on output and jobs in the automobile sector
Figure 107: Comparison in output in agricultural machinery sector and automobile sector, 2007-2016
Figure 108: Comparison in employment in agricultural machinery sector and automobile sector, 2007-2016
*Number of workers (vehicle production and agricultural machines production)Source: Anfavea
0
5,000
10,000
15,000
20,000
25,000
30,000
0
20,000
40,000
60,000
80,000
100,000
120,000
140,000
160,000
1957
1959
1961
1963
1965
1967
1969
1971
1973
1975
1977
1979
1981
1983
1985
1987
1989
1991
1993
1995
1997
1999
2001
2003
2005
2007
2009
2011
2013
2015
EMPLOYMENT*
Vehicles
Agricultural MachinesInovar-Auto
Source: Anfavea
0
2,000
4,000
6,000
8,000
10,000
12,000
0
50,000
100,000
150,000
200,000
250,000
300,000
350,000
400,000
Jan-
07
May
-07
Sep-
07
Jan-
08
May
-08
Sep-
08
Jan-
09
May
-09
Sep-
09
Jan-
10
May
-10
Sep-
10
Jan-
11
May
-11
Sep-
11
Jan-
12
May
-12
Sep-
12
Jan-
13
May
-13
Sep-
13
Jan-
14
May
-14
Sep-
14
Jan-
15
May
-15
Sep-
15
Jan-
16
May
-16
Sep-
16
UNITS PRODUCED
Vehicle production
Agricultural machinesDecree 7819 (Inovar-Auto)
MP 540 ("regiminho")

141
Incentives for innovation, research & development (Lei do Bem) underperform Figure 110: Level of R&D realized up to 2005, and comparison between level predicted after 2005 (introduction of Lei do Bem) and actual level of R&D intensity
Source: Devereux et al. 2015
Inovar-Auto resulted in small scale production and higher consumer prices Figure 109: Comparison in the advertised sales price for base 2017 Toyota Corolla, various countries
Source: Sturgeon et al. (2017)
$0
$5,000
$10,000
$15,000
$20,000
$25,000
$30,000
$35,000
$40,000Ve
nezu
ela
Viet
nam
Isra
elIn
done
siaM
alay
siaFi
nlan
dHo
ng K
ong
Thai
land
Port
ugal
Irela
ndBr
azil
Belg
ium
New
Zea
land
Indi
aAr
gent
ina
Luxe
mbo
urg
Ger
man
yM
oroc
coCo
lom
bia
Chin
aSo
uth
Afric
aTa
iwan
Croa
tiaU
SAG
reec
eLa
tvia
Japa
nBu
lgar
iaCy
prus
Pola
ndLi
thua
nia
Hung
ary
Mac
edon
iaSl
ovak
iaCh
ileEs
toni
aAu
stra
liaPa
kist
anCz
ech
Rep.
Turk
eyRu
ssia
Kaza
khst
anSl
oven
iaBo
snia
& H
erz.
Cana
daM
exic
o
CANADA
Sales only, cars importedHigh volume assembly plant (480,000 – 602,000 annual units*) Medium volume assembly plant (126,000 – 182,000 annual units*)Low volume assembly plant (1,000 – 61,000 annual units*)
Brazil
USD 22,022
USD 12,510Canada is a big exporter

142
- The incentives for innovation, research & development provided by the Lei do Bem result in underperformance. This program aims to support business Research and Development (R&D). While it has had a positive impact, its performance in boosting R&D intensity is significantly below what would have been expected for such a program (Devereux et al. 2015) (Figure 110). Largely this is because its design favors the incumbent, older and larger firms, it does not reach most small or new companies, and the overall business environment does not sufficiently reward private investment in innovation.
- The Pronatec-MDIC was effective in helping workers upgrade their skills and find new jobs, but at relatively high cost. The objective of the program is to train workers based on employer-identified needs. O’Connell et al. (2017) find that trainees who completed the courses show a significantly higher probability of employment by 8 percentage points corresponding to higher monthly earnings of 75 Reais (in 2012 real values). The effect is significant for both, participants who enter the program as a requirement for accessing unemployment insurance (UI) benefits and those entering voluntarily (Figures 111 and 112). Private sector input better aligned skill training with future occupational growth, and the administrative input from MDIC appears to have played a role in further increasing program effectiveness by targeting resources towards competitive labor markets with strong subsequent growth. The program has only a moderate benefit-cost ratio, as the results indicate it would take at least three years after the completion of training to generate job income equal to the fiscal cost of the course (assuming persistence of employment, and without accounting for displacement of informal employment). The results of the study show that the PRONATEC-MDIC has a positive impact, since input from employers directed the selection of courses for the skills that subsequently presented greater demand growth.
Pronatec-MDIC helps workers upgrade skills & find jobs, but at relatively high cost
Figure 111: Change in employment relative to course start for course offer recipients and non-recipients (registrants receiving Unemployment Insurance)
Figure 112: Change in employment relative to course start for course offer recipients and non-recipients (all other registrants)
Source: O’Connell et al, 2017 Source: O’Connell et al, 2017
0%
20%
40%
60%
80%
100%
-17
-15
-13
-11 -9 -7 -5 -3 -1 1 3 5 7 9 11 13 15 17
Empl
oym
ent
prob
abili
ty (%
)
Months relative to start of course
Non-offered Offered
40%
45%
50%
55%
60%
65%
-17
-15
-13
-11 -9 -7 -5 -3 -1 1 3 5 7 9 11 13 15 17
Empl
oym
ent
prob
abili
ty (%
)
Months relative to start of course
Non-offered Offered

143
197. Overall policies to support business in Brazil are likely to have adverse impacts on aggregate productivity and jobs growth. Current spending programs can be seen to hold back productivity and jobs growth in several ways. By favoring incumbent firms and protecting against imports, industrial policies reduce the intensity of competition in output and input markets. By allowing unproductive incumbent firms to maintain market share, they also hold back resource reallocation and within-firm productivity upgrading that would be the result of more intense competition and new market entrants, and that would allow new and existing more efficient firms to expand output and employment growth.
198. Further, spending on policies to support business is thought to be mostly regressive. The largest policy programs, with the exception the SIMPLES tax program, benefit overwhelmingly large, established firms. Since their impact on job creation and wages is limited at best, they appear to be a regressive allocation of government resources. And even the SIMPLES program is regressive, to the extent that it allows existing inefficient smaller firms that don’t grow and pay relatively higher wages to better-off (RFB 2015)97 workers to survive, at the expense of firms that otherwise could grow and generate more jobs for currently unemployed or under-employed less well-off workers.
Reforms to business support policies to achieve greater efficiency, equity and fiscal savings
199. Eliminating ineffective programs could save up to 2 percent of GDP over the next decade. Available analyses from the existing literature and from World Bank studies suggest that there is up to 2 percent of GDP that could be saved or reallocated by eliminating ineffective programs. This is an estimated upper limit based on the evaluation of programs that are of dubious effectiveness and therefore may have no negative impact if they are eliminated. However, the elimination of business support programs could be unrealistic and unwanted: unrealistic, as the interest groups that currently benefit from the support of these programs are powerful; unwanted because through improved policies, part of the public resources allocated to support businesses could be reprogrammed to help Brazil's private sector adjust and become more competitive. Current support policies fail with respect to this objective - but this does not mean that more effective support policies are impossible design.98
200. Programs that appear to have low effectiveness include: SIMPLES, Desoneração da Folha, Inovar-Auto and Zona Franca de Manaus. The largest program in this area, SIMPLES, which accounts for about 1.2 percent of GDP in lost tax revenues, would benefit from reform to make it less costly and more effective in encouraging formalization, rapid growth of the most productive firms, and greater job creation. The payroll tax exemptions program has little impact on job creation and has a high cost. The government has proposed eliminating payroll tax exemptions for most sectors from 2018 onwards. This would generate savings of up to 0.4 percent of GDP compared to 2015 levels. International experience suggests that it would be more effective to focus on programs in active labor market policies (see the chapter on labor market programs). The Inovar-Auto does not appear to be effective, costs a lot to domestic consumers, and has been found to violate WTO principles. It should be reformed with a view to reducing anti-export bias and paying more attention to suppliers (rather than just final assembly by large car producers). This would generate large benefits to the consumers, and a 97 A good part of SIMPLES is composed of companies that are, in fact, high-income, self-employed professionals. 98IDB / OVE (2017) analyze the impact of business support programs. The study's findings suggest that only some types of programs were associated with statistically significant increases in company productivity and even fewer programs with large magnitude. The scarcity of positive impacts suggests the need to revise the scope, design and monitoring of business support programs in Brazil.

144
possible additional 0.03 percent of GDP in fiscal savings. The Zona Franca de Manaus, which cost 0.38 percent of GDP in tax exemptions in 2015, also appears to be ineffective and ought to be at least redesigned to effectively contribute to the local economy (Miranda 2013).
201. Some savings are already being realized as industrial policies have been scaled back since 2015. The PSI subsidized credit scheme was discontinued in 2015, which is consistent with the fact that this program proved to have had little effect in supporting investment and productivity growth. Since its costs (associated with existing loans at subsidized rates) will continue to weigh on public finances for years to come, it is expected to generate expenditures of approximately 0.4 percent of GDP in 2018, and gradually decreasing to reach 0.1 percent of GDP by 2026 (and then slowly tailing off to zero). The adoption of the new BNDES interest rate, TLP, which is market based, in 2017 (to replace the TJLP—see section on fiscal challenges above) further reduces distortions in financial markets, removing the hidden subsidies previously implicit in BNDES financing, and generating additional “below the line” savings beyond the removal of the PSI program.
202. Other programs seem to be effective, but their design can be improved. The design of the Lei do Bem (an R&D support policy) mainly favors the largest, well-established companies in the country, and does not reach most small or new companies. A weakness of the Lei do Bem is the exclusion of companies that make income tax returns based on their presumed profit. This, at least, explains why most of the recipient companies were large well-established companies. Young companies will not benefit from such incentives unless tax spending programs contain provisions for immediate cash repayments for R&D expenses or allow them to carry losses associated with future tax deductions. Likewise, the results of the PRONATEC-MDIC program confirm international evidence in favor of close collaboration among the private sector in the creation of job training programs. This principle could be used more widely in technical higher education programs.
203. Additional analysis is needed to inform public debate and redesign policies. Even if existing programs are not effective at achieving productivity-related economic objectives, they have economic and political constituencies and their removal would create losers among the sectors and firms currently benefiting. Phasing out or replacing programs will likely require a mitigation strategy to address localized impacts on workers employed in industries that lose protection.99
204. The need for more evaluation of existing programs highlights the urgency to facilitate access to data by researchers, notably tax data held by the Receita Federal do Brasil (RFB). The RFB limits the access to this data because of the strict legal requirements protecting confidentiality. While the law already seems to allow for access to anonymized individual data, as is the case in most countries, it is urgent to revise the legislation to clarify these aspects in line international best practice.100
99 A recent study of Brazil’s 1990s trade liberalization demonstrates that localized effects on labor markets from reduced protection can persist for a long time. This suggests limited mobility of workers and the need to complement changes in state level support to businesses with policies to facilitate retraining and avoid long-term structural unemployment. (Dix, Carneiro, 2016). 100 Brazil is an outlier in this respect since most developed countries provide researchers access to tax microdata (see Main Report).

145
146
References
Afonso, António; Schuknecht, Ludger; Tanzi, Vito (2003): Public sector efficiency: an international comparison. ECB Working Paper, No. 242.
Afonso, José Roberto and Érica Diniz (2014): Benefícios Fiscais Concedidos (e Mensurados) pelo Governo Federal. Economia do Setor Público. Texto para discussão. FGV.
José Roberto R. Afonso (20176). IRPF de 2015: Ocupações Profissionais: Alguns Rankings Do Declarado Pelos Contribuinte. Escola de Direito de Brasilia, IDP, Centro de Pesquisa CEPES.
Afonso, José Roberto and Gabriel Leal de Barros (2013a): Evolução Inicial da Desoneração da Folha Salarial. Nota Técnica. FGV.
Afonso, José Roberto and Gabriel Leal de Barros (2013b): Desoneração da Folha: Renúncia Revisitada. Nota Técnica. FGV.
Almeida, Mansueto Jr., Marcos de Barros Lisboa and Samuel Pessoa (2015). O Ajuste Inevitável: ou o país que ficou velho antes de se tornar desenvolvido. Mimeo. Julho de 2015.
Barbosa Filho, Fernando de Holanda e Samuel Pessôa (2013). Retorno da educação no Brasil. IBRE - Textos para discussão.
Bazzi, Samuel; Marc-Andreas Muendler and James Rauch (2017). Firm Entry Barriers, Growth Constraints, and Job Creation. PEDL Research Note ERG project #3738. Available online at: http://pedl.cepr.org/sites/default/files/Research%20Note%20-%20Firm%20Entry%20Barriers%2C%20Growth%20Constraints%2C%20and%20Job%20Creation.pdf
Bennmarker, H., Mellander, E. and Öckert, B. (2009): Do regional payroll tax reductions boost employment? Labour Economics 16, 480–489
Bonomo, M., R. Brito and B. Martins (2015): The after crisis government-driven credit expansion in Brazil: A firm level analysis. Journal of International Money and Finance 55: 111-134.
Boueri Miranda, Rogerio; Rocha, Fabiana; and Rodopoulos, Fabiana (2015). Avaliação da qualidade do gasto público e mensuração da eficiência. Tesouro Nacional, Brasilia.
Caprettini, B. (2015): Turnover taxes and Productivity, Evidence from a Brazilian Tax Reform. Universitat Pompeu Fabra.
Cavalcanti, Thiago e Marcelo Rodrigues dos Santos (2015). (Miss)Allocation Effects of an Overpaid Public Sector. Rede de Economia Aplicada (REAP). Working Paper 82.
Central Bank of Brazil (2016). Financial Stability Report, April 2016. Brasilia.
Charnes A, WW Cooper and EL Rhodes (1978): Measuring the Efficiency of Decision Making Units. EJOR 2: 429-444.
Coelho, D.; De Negri, J. (2010) Impacto do financiamento do BNDES sobre a produtividade das empresas: uma aplicação do efeito quantílico do tratamento. In: Encontro Nacional de Economia - Os efeitos do BNDES PSI sobre o investimento 121 corrente e futuro das firmas industriais ANPEC, 38., 2010, Salvador. Anais eletrônicos. Availible at: <http://www.anpec.org.br/encontro2010/inscricao/arquivos/000-62cf725608576526071dfbbed02385cf.pdf>. Acesso em: 16 out. 2015.

147
Corseuil, C., Foguel, M., Gonzaga, G., & Ribeiro, E. (2014). Youth Turnover in Brazil: Job and Worker Flows and an Evaluation of a Youth-Targeted Training Program. La Plata: Universidad Nacional de La Plata.
Corseuil, Carlos Henrique L. and Rodrigo Leandro Moura (2017). O impacto do Simples no nível de emprego da indústria Brasileira. IPEA, Mimeo.
Cruces, G., Galiani, S. and Kidyba, S. (2010): Payroll taxes, wages and employment: identification through policy changes. Labour Economics 17, 743–749.
Da Silva, Antônio Cavalcante Artur Monteiro Prado Fernandes, Fernando Brandão Carreira, Filipe Nogueira da Gama, Kátia Gomez de Matos, Marcos Alexandre Alves de Melo, Mylke Takada, Rodrigo Borges Hemerly (2014): Desoneração da Folha de Pagamento Estimativa de Renúncia e Metodologia de Cálculo. Receita Federal. Brasilia.
de Bolle (2015) Do Public Development Banks Hurt Growth? Evidence from Brazil, Petersen Institute for International Economics Policy Brief, September 2015.
Devereux, M. and I. Guceri (2015) An impact Study of: Isenção Fiscal em pesquisa de Desenvolvimento "The Good Law". Centre for Business Taxation, University of Oxford.
Dix, Carneiro, Rafael e Brian Kovak (2017). Trade Liberalization and Regional Dynamics. American Economic Review, Vol. 107 Issue 10.
European Commission (2015). The 2015 Pension Adequacy Report: current and future income adequacy in old age in the EU. Volume I & Volume II. Luxembourg.
Fernandez, C. and L. Villar (2016): The Impact of Lowering the payroll Tax in Informality in Colombia, Fedesarrollo Working Paper No. 72.
Firpo, Sergio and Renan Pieri (2016) Prêmio à educação afeta desigualdade salarial no setor público. Available at: http://noticias.uol.com.br/opiniao/coluna/2016/07/03/premio-a-educacao-explica-desigualdade-salarial-do-setor-publico.htm
Garcia, Felipe; Adolfo Sachisda e Alexandre Xavier Ywata de Carvalho (2017). Impacto da Desoneração da Folha de Pagamentos Sobre o Emprego: Novas Evidências. IPEA Working Paper.
Gartner group, Corporate Executive Board (2014). Category Manager Survey: Investigation into most commonly used and impactful value creation techniques by category – Information Technology Category. August 2014.
Gobetti, Sérgio Wulff and Rodrigo Octávio Orair (2016): Progressividade tributária: A agenda negligenciada. Texto para discusSão 2190. Instituto de Pesquisa Econômica Aplicada.
Gruber, Jonathan (1997): The incidence of payroll taxation, evidence from Chile. Journal of Labor Economics. Vol. 15. No. 3.
Higgins, Sean and Claudiney Pereira (2013): The Effects of Brazil’s Taxation and Social Spending on the Distribution of Household Income. Public Finance Review. Vol 42, Issue 3, pp. 346 – 367.
Higgins, Sean; Nora Lustig; Whitney Ruble; and Timothy Smeeding (2014). Comparing the Incidence of Taxes and Social Spending in Brazil and the United States. CEQ Working Paper No 16. November 2013, Revised October 2014.
IDB/OVE (2017). Assessing Firm-Support Programs in Brazil. Office of Evaluation and Oversight. Inter-American Development Bank, Washington DC.

148
IMF (2015). Fiscal Rules at a Glance, 2015; Available at: http://bit.ly/2cNFwIU.
IMF (2017). Technical Assistance Report— What fiscal and public financial management reforms are necessary to effectively implement the spending cap? IMF Country Report No. 17/29, Washington D.C.
Immervoll, Herwig, Horacio Levy, Christine Lietz, Daniela Mantovani, Cathal O’Donoghue, Holly Sutherland, and Gerlinde Verbist (2006). Household incomes and redistribution in the European Union: Quantifying the equalizing properties of taxes and benefits. In: The Distributional Effects of Government Spending and Taxation, Dimitri B. Papadimitriou, ed., 135-165. New York: Palgrave MacMillan.
Korkeamäki, Ossi and Roope Uusitalo (2009): Employment and wage effects of a payroll-tax cut—evidence from a regional experiment. International Tax and Public Finance, vol. 16, issue 6, 753-772.
Lazzarini, S. G. et al. (2015). What Do State-Owned Development Banks Do? Evidence from BNDES, 2002–09. World Development 66: 237-253.
Miranda, Ricardo Nunes (2013). Zona Franca de Manaus: Desafios e Vulnerabilidades. Núcleo de Estudos e Pesquisas do Senado. Consultoria Legislativa, Senado Federal. Texto para discussão N.126.
MPOG (2016): Diagnóstico das regras de acesso ao Benefício de Prestação Continuada (BPC) e simulações dos gastos futuros com o programa. Ministério do Planejamento, Orçamento e Gestão. Assessoria Econômica, Nota Técnica nº 5135/2016-MP.
Negri, F. et al. (2009). Perfil das empresas integradas ao sistema federal de C,T&I no Brasil e aos fundos setoriais: uma análise exploratória. Brasília Ipea.
OECD, (2014), Education at a Glance 2014: OECD Indicators, OECD Publishing. http://dx.doi.org/10.1787/eag-2014-en
OECD (2015): Economic Surveys: Brazil. http://dx.doi.org/10.1787/eco_surveys-bra-2015-en
OECD (2016): Education at a glance.
OECD and World Bank (2010) OECD Reviews of Human Resource Management in Government: Brazil 2010, Federal Government. OECD 2010.
O'Connell, Stephen D., Joao Bevilaqua T. Basto, Mark A. Dutz, and Lucas Ferreira Mation (2017): Can business input improve the effectiveness of worker training? Evidence from Brazil's Pronatec-MDIC, May 2017, mimeo, The World Bank Group, Washington, DC
Ottaviano, G. and Lage de Sousa, F. (2008) “O efeito do BNDES na Produtividade das Empresas” in Políticas de Incentivo à Inovação Tecnológica”. Edited by: De Negri, J. and Kubota, L., IPEA, Brasília.
Ottaviano, G. and Lage de Sousa, F. (2014) “Relaxing Credit Constraints in Emerging Economies: The impact of public loans on the performance of Brazilian firms” Centre for Economic Performance Discussion Paper, No. 1309, LSE.
Pazarbasioglu, Ceyla, Steen Byskov, Marco Bonomo, Igor Carneiro, and Bruno Martins and Adriana Perez (2017). Brazil Financial Intermediation Costs and Credit Allocation. World Bank, Washington DC.
Perelman, S., Perelman J., and Santín, D. (2016) Performance and productivity in education and health Brazil in the international context. Mimeo report for the World Bank, 2016.

149
Perelman, S., Perelman J., and Santín, D. (2016) Performance and productivity in education and health Brazil in the international context. Mimeo report for the World Bank, 2016.
Piza, C. (2016): Revisiting the impact of the Brazilian SIMPLES program on firm's formalization rates. Policy Research Working Paper Series 7605, The World Bank.
Portela, A., G. Ulyssea, R. Paes de Barros, D. Coutinho, L. Finamor and L. Lima (2016) “Rede de Proteção ao Trabalhador no Brasil: Avaliação Ex-Ante e Proposta de Redesenho”, FGV-EESP Centro de Estudos de Microeconomia Aplicada & CLEAR Centers for Learning on Evolution and Results, Brazil and Luciphone Africa
RFB (2015). Arrecadação do Simples Nacional em 2015 – Inclusão de novos setores, efeitos no Lucro Presumido/Lucro Real e Impactos do PLP 25/2007. Receita Federal do Brasil, Ministério da Fazenda. Brasília, 24 de agosto de 2015. Availible at: http://idg.receita.fazenda.gov.br/noticias/ascom/2015/agosto/receita-federal-publica-estudo-que-demonstra-os-impactos-negativos-na-arrecadacao-tributaria-com-o-plp-25-2007
Ribeiro, Eduardo and Nucifora Antonio (2018). “The impact of subsidized credit on firms’ investment and productivity in Brazil: An evaluation of the BNDES FINAME-PSI program”. World Bank Working Paper, Washington DC.
Ribeiro, Eduardo. (2016): Brazil Financial Intermediation Cost and Credit Allocation Finance & Markets Global Practice, Discussion Paper (draft), The World Bank Group.
Robert Half (2017), Robert Half Guia Salarial 2017, Brazil. Robert Half International Inc. https://www.roberthalf.com.br/downloads/guia-salarial
Scherer, C.R. (2015): Payroll tax reduction in Brazil: Effects on employment and wages. ISS Working Paper Series / General Series. Vol. 602, pp. 1–64.
Segura-Ubriego, Alex (2012): The Puzzle of Brazil's High Interest Rates. IMF Working Paper WP/12/62.
Perelman, Sergio; Julián Perelman, Daniel Santín (2016): Performance and productivity in education and health Brazil in the international context. Mimeo report for the World Bank.
Skoufias, Emmanuel; Nakamura, Shohei and Gukovas, Renata (2017): Safeguarding Against a Reversal in Social Gains During the Economic Crisis in Brazil. World Bank, Washington, DC
Sturgeon, T., L. L.Chagas and J. Barnes (2017). Rota 2030: Updating Brazil’s Automotive Industrial Policy to Meet the Challenges of Global Value Chains and the New Digital Economy. World Bank Working Paper, Washington DC.
TCU (2016). Relatório de Auditoria: Ministério do Trabalho e Previdência Social (MTPS). Tribunal de Contas da União, TC 008.368/2016-3.
Wilmoth (2009): The lifetime risk of maternal mortality: concept and measurement. Bulletin of the World Health Organization; 87:256-262.
World Bank (2011): Growing Old in an Older Brazil: Implications of Population Ageing on Growth, Poverty, Public Finance, and Service Delivery. World Bank, Washington DC.
World Bank (2012). Government Health Spending in Brazil: Issues and Analytic Approaches. Manuscript, World Bank, Brasilia, DF.

150
World Bank (2017a). Between a Rock and a Hard Place: The Monetary Policy Dilemma in Latin America and the Caribbean. World Bank, Washington DC.
World Bank (2017b). At a Crossroads: Higher Education in Latin America and the Caribbean. Washington DC