public disclosure authorized intra-industry trade,...
TRANSCRIPT

_) PS / c S
POLICY RESEARCH WORKING PAPER 1652
Intra-Industry Trade, Towhatextentdoesgrowthin exports in Central and
Foreign Direct Investment, EasternnEuropereflect
_ * * ~~~~~~~~~~~ecornmi restrcturing andand the Reorientation changeinthecompostion
of Eastern European Exports Oftradeasopposedtoredirection' of traditional
CMAA exports to the West?
Bernard Hoekman
Sirn eon Djankov
T he World Bank
Europe and Central Asia,
and Middle East and North Africa Technical Department
Private Sector and Finance Team
September 1996
Pub
lic D
iscl
osur
e A
utho
rized
Pub
lic D
iscl
osur
e A
utho
rized
Pub
lic D
iscl
osur
e A
utho
rized
Pub
lic D
iscl
osur
e A
utho
rized
Pub
lic D
iscl
osur
e A
utho
rized
Pub
lic D
iscl
osur
e A
utho
rized
Pub
lic D
iscl
osur
e A
utho
rized
Pub
lic D
iscl
osur
e A
utho
rized

POLICY RESEARCH WORKING PAPER 1652
Summary findingsIn the first half of the 1990s, after the demise of central undergone the least change in composition of exports.planning, exports to OECD countries from many Central But substantial changes have occurred in the compositionand Eastern European countries grew rapidly. Hoekman of exports within traditional export categories. Thisand Djankov explore what trade data suggest about the suggests that Czech and Slovak firms pursued a strategyextent to which growth in exports reflect economic of upgrading and differentiating "traditional" exports,restructuring and changes in the composition of trade as relying on EU firms for new machinery, components,opposed to "redirection" of traditional CMEA exports to and know-how.the West. Simple redirection of goods that were traditionally
They also investigate the role of vertical intra-industry exported to CMEA markets does not appear to haveexchange in the expansion of trade with Western Europe played an important role in the growth of exports to- that is, getting inputs from European Union (EU) Western Europe. Export growth is in products that weresuppliers that are then used in the production of goods not exported to the CMEA or in "traditional" exportexported to the EU. items that have been substantially upgraded or
They find a strong relationship between export differentiated.performance and growth in vertical intra-industry trade Inflows of foreign direct investment - limited beforewith the EU. The Czech and Slovak Republics, Hungary, 1994 - correlate highly with levels of intra-industryPoland, and Slovenia all rely heavily on the EU for inputs trade. But if large investments in the automobile sector- more so than Austria, Portugal, and Spain, for are excluded, foreign direct investment seems unlikely toexample. As their per capita exports to the EU have also have been a major force driving the growth of intra-grown the fastest, this appears to be a characteristic of industry trade. These exchanges and the underlyingsuccessful transition. integration into the world economy (Western Europe)
The Czech and Slovak Republics registered the highest mostly reflect arm's-length transactions between Centralgrowth in exports and the greatest reorientation in the and Eastern European firms and their Europeanpattern of trade. They have the highest level and rate of counterparts.growth in intra-industry trade with the EU, but have
This paper-a product of the Private Sector and Finance Team, Europe and Central Asia, and Middle East and North AfricaTechnical Department - is part of a larger effort in the department to monitor economic developments in Central andEastern Europe. Copies of the paper are available free from the World Bank, 1818 H Street NW, Washington, DC 20433.Please contact Faten Hatab, room H8-087, telephone 202-473-5853, fax 202-477-8772, Internet [email protected]. September 1996. (29 pages)
The Policy Research Working Paper Series disseminates the findings of work in progress to encourage the exchange of ideas aboutdevelopment issues. An objective of the series is to get the findings out quickly, even if the presentations are less than fully polished. Thepapers carry the names of the authors and should be used and cited accordingly. The findings, interpretations, and conclusions are theauthors' own and should not be attributed to the World Bank, its Executive Board of Directors, or any of its member countries.
Produced by the Policy Research Dissemination Center

Intra-Industry Trade, Foreign Direct Investmentand the Reorientation of Eastern European Exports
Bernard Hoekman Simeon DjankovWorld Bank & CEPR University of Michigan
Keywords: Intra-industry trade, foreign direct investment, Central and Eastern Europe, economicintegration
JEL codes: F14, F15, F23
We are very grateful to Ying Lin for his excellent research assistance in compiling andextracting the data used in this paper. Our thanks as well to Alan Deardorff, Simon Evenett, BartKaminski and Zhen Kun Wang for constructive suggestions. The views expressed are personal andshould not be attributed to the World Bank. Address for correspondence: B. Hoekman, The WorldBank 1818 H St. N.W., Washington D.C. 20433 USA. Tel 202 473 1185; S. Djankov, Dept. ofEconomics, University of Michigan, Ann Arbor MI 48109, USA. Tel: 313 763 9110.


1. Introduction
Following the demise of central planning and the associated collapse of the Council of Mutual
Economic Assistance (CMEA), countries in Central and Eastern Europe and the former Soviet Union
(FSU) experienced massive economic shocks. The greater the distortions in the pattern of
specialization that existed under the CMEA, the greater the restructuring required at the level of the
firm/industry. Clearly such restructuring takes time, and has not been completed. This paper
explores what trade data suggest regarding the extent to which countries have restructured their
economies to compete on world markets. The incentives confronting managers of firms in former
centrally-planned economies (CPEs) vary significantly, and it is difficult to establish direct measures
of existing policy regimes. Trade performance provides an objective, comparable source of
information on the impact of differences in policy regimes.
It is helpful to think about the transition to a market economy as a move away from autarky
towards free trade. Import competition, price liberalization, allowing entry and exit of firms, and the
imposition of harder budget constraints confront producers with market disciplines. As a result,
resources are used more efficiently, and firms specialize in activities and products in which they have
a competitive advantage. Opening up to international trade promotes economic growth by establishing
linkages with--and integration into--the world economy and by forcing governments to take
complementary actions as well. Sachs and Warner (1995) have shown that countries that have done
the most to integrate into the world economy have been most successful in attaining above average
rates of economic growth. The literature tends to focus on measures of openness (trade to GDP
ratios) to define integration; little attention is devoted to the type of trade that occurs. This paper
hypothesizes that in the CEEC context vertical intra-industry trade with OECD countries (Western
Europe in particular) is likely to be a major mechanism fostering integration.
The pattern of production and trade that emerges after opening the economy is driven in part
by relative factor prices (endowments), and in part by economies of scale and scope. Much depends
on history--the initial conditions determined by investment decisions under central planning. The first
determinant will give rise to inter-industry trade: for example, the exchange of unskilled labor-
intensive goods for human capital-intensive products. The more dissimilar are countries'
endowments, the greater the volume of trade will be. The second factor will generate intra-industry
trade: the exchange of similar manufactured products, with firms specializing in different varieties of
similar goods, and relying increasingly on foreign suppliers to provide intermediate inputs and
components used in their production process. The more similar are countries, the more important the
1

latter type of exchange becomes (Helpman and Krugman, 1985). Distance is also important in
explaining intra-industry trade (Helpman, 1987).
The relative importance of intra- versus inter-industry trade for the Central and Eastern
European countries (CEECs) or the FSU is difficult to predict ex ante. Some of the countries
involved are well endowed with natural resources--minerals, oil, gas, agricultural land. Many are
also relatively well endowed with human and physical capital. Real wage costs are significantly lower
than in Western Europe. Such factors will result in trade patterns predicted by the standard
Heckscher-Ohlin theory, with countries exporting goods and services that use (embody) relatively
abundant production factors. Given that many CEECs, especially in Central Europe, are
industrialized nations with a relatively diversified manufacturing base and a well-educated labor force,
intra-industry trade should also be important. There are two types of intra-industry trade, horizontal
(the exchange of similar goods) and vertical (the exchange of inputs for more processed outputs).
A characteristic of central planning was extensive vertical integration of production and
standardization of products, both inputs and final goods. The transition to a market economy involves
vertical disintegration, with firms specializing in a limited number of activities. The collapse of the
CMEA meant that shifting exports to hard currency markets was crucial to many firms. A lack of
knowledge of how to produce for export to OECD markets existed, however. Information on quality
standards, packaging requirements, tastes (design of goods), and distribution channels was needed.
Upgrading of production techniques frequently required new machinery and/or access to high quality
intermediate goods from abroad. European firms were an obvious source of know-how and finance
for CEEC enterprises seeking to export to Western Europe. The weaknesses in both in-house
capacities and absence of independent providers of market services in the early stage of transition
should stimulate intra-industry trade. Such trade is primarily vertical in nature, as opposed to the
horizontal exchange in close substitutes.'
Successful export reorientation requires that managers of CEEC firms have incentives to
pursue these linkages. There are two avenues through which intra-industry exchange might occur: via
foreign direct investment (FDI) and via non-equity-based relationships. FDI flows into Eastern
Europe after 1989 were limited, and heavily concentrated in a few sectors such as automobiles
1/ For restructuring to occur, market institutions must exist (such as legal regimes establishing andenforcing private property rights). In most CEECs these were in place relatively rapidly (WorldBank, 1996). While state-owned firms remained dominant in many countries in the early transitionperiod, the hardening of budget constraints put all firms, including state-owned, under pressure toimprove productivity and quality of output.
2

(EBRD, 1995). Under non-equity based linkages Western partner firms provide intermediate inputs
and equipment to ex-CPE partners, as well as a variety of services ranging from design, to production
and management techniques, to distribution/marketing. Once the impact of FDI is controlled for, the
magnitude and growth rate of intra-industry trade and vertical specialization is a measure of the extent
of managerial efforts to pursue restructuring efforts. The associated increase in integration can be
regarded as an indirect measure of the success of the policy stance of individual countries.
The paper is organized as follows. Section 2 describes the changes in the pattern and
composition of trade of European former CPEs. Section 3 investigates the extent to which shifts in
exports to non-CMEA markets involves the same or very similar products that traditionally were
traded within the CMEA, and the relative importance of arbitrage-driven re-export of goods produced
in other ex-CMEA nations, especially Russia. Section 4 analyzes the role of intra-industry trade in
the export performance of the CEECs, and the importance of integration/cooperation with EU
suppliers and distributors in penetrating European markets. Section 5 returns to the issue of how
much change in the structure of exports has occurred once intra-industry trade growth is controlled
for. The role of FDI is discussed in Section 6. Section 7 concludes.
2. Changes in the Volume and Pattern of Trade2
Total per capita exports of a number of ex-CPEs are reported in Figure 1. Two points stand
out.3 First, the value of total trade in 1994 is roughly the same as in 1988. Second, the geographic
pattern of trade changes significantly, the share of Western Europe increasing dramatically. It is, of
course, not the case that there has been a simple redirection of trade, with aggregate volumes
2/ See Kaminski et al. (1996) for a more comprehensive discussion of the determinants of themagnitude of re-orientation of trade flows of transition economies.
3/ Data for Baltic countries are only available starting in 1992, while trade statistics for countriessuch as Croatia, Macedonia and Slovenia commence in 1993. Time series comparisons of trade flowsare therefore restricted to the CEECs. There are some measurement problems with respect toabsolute value of exports in 1988. The trade data used in Figure 1 are drawn from the IMF Directionof Trade database, and have been adjusted for the overvaluation that results if official 'exchange rates'for convertible rubles are used. Total population data were used in the denominator. Aggregate datafor the Czech and Slovak Republics are used in most of what follows in order to maintaincomparability across time. Separate trade data for the Czech Republic and Slovakia are availablestarting in 1993. The Czech Republic accounts for some 80 percent of total exports of formerCzechoslovakia. Throughout, reported imports by partner countries are used to measure exports offormer CPEs. Because reported imports include freight and insurance this imparts a small upwardbias to the level of imputed exports.
3
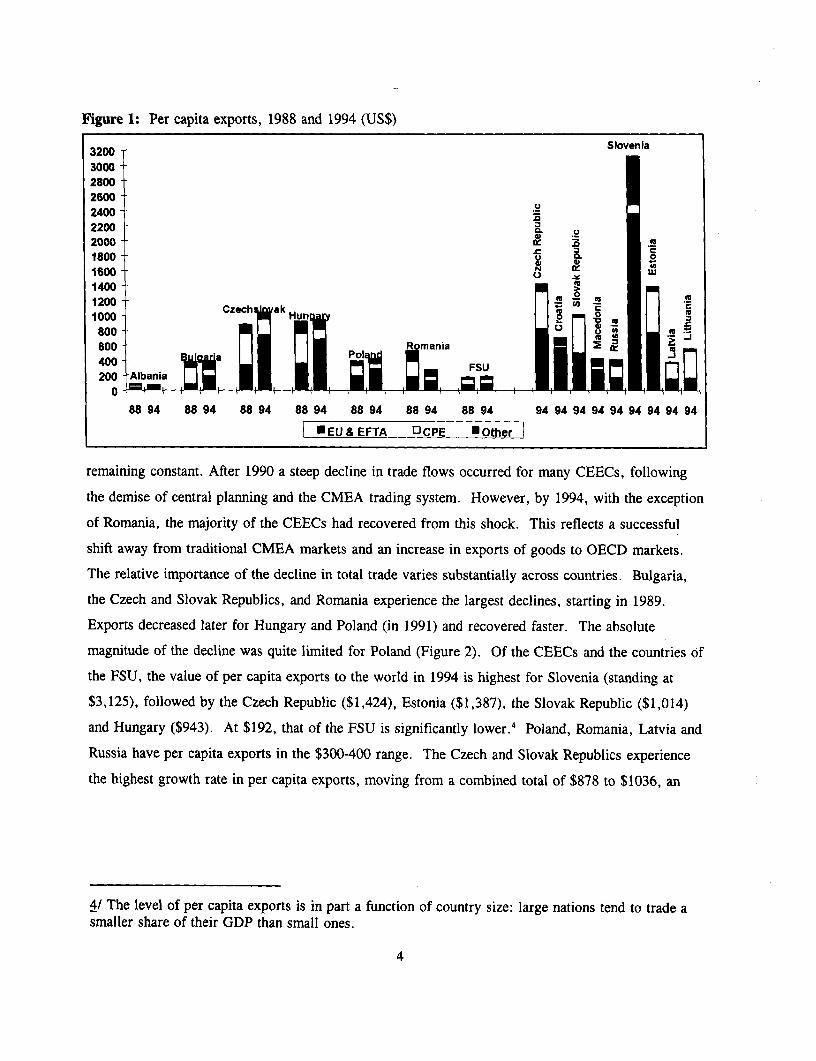
Figure 1: Per capita exports, 1988 and 1994 (US$)
3200 Slovenia3000280026002400 2200 C.
2000 o .c1800 .O C
N w1600 0 H1400
1200 * EU & EFTA CPE * Other1200 ~~~CZec ak Hu 0C1I0000
800 600 rmania
FSU~~~~~~~~~~~~~~~~E
200 -Albania
88 94 88 94 88 94 88 94 88 94 88 94 88 94 94 94 9494 9494 9494 94
*EU&EFTA 0ICIE *te
remaining constant. After 1990 a steep decline in trade flows occurred for many CEECs, following
the demise of central planning and the CMEA trading system. However, by 1994, with the exception
of Romania, the majority of the CEECs had recovered from this shock. This reflects a successful
shift away from traditional CMEA markets and an increase in exports of goods to OECD markets.
The relative importance of the decline in total trade varies substantially across countries. Bulgaria,
the Czech and Slovak Republics, and Romania experience the largest declines, starting in 1989.
Exports decreased later for Hungary and Poland (in 1991) and recovered faster. The absolute
magnitude of the decline was quite limited for Poland (Figure 2). Of the CEECs and the countries of
the FSU, the value of per capita exports to the world in 1994 is highest for Slovenia (standing at
$3,125), followed by the Czech Republic ($1,424), Estonia ($1,387), the Slovak Republic ($1,014)
and Hungary ($943). At $192, that of the FSU is significantly lower.4 Poland, Romania, Latvia and
Russia have per capita exports in the $300-400 range. The Czech and Slovak Republics experience
the highest growth rate in per capita exports, moving from a combined total of $878 to $1036, an
4/ The level of per capita exports is in part a function of country size: large nations tend to trade asmaller share of their GDP than small ones.
4

Figure 2: Per capita exports, 1988-94
3900
3800
3700
3600
3500- ~ /Slovenla
3400
3300
3200
3100
3000 ,
1800Estoni
1700
1600
1500
1400
1300
1200 /,
1100 Czech Reppublc
1000 1000 _ ~~Hungary \/ r;
900In goo - t* - \ w ; ithuania
800 - ' / a
700
600
Soo Romania
400
200- _ _
100
1988 1989 1990 1991 1992 1993 1994 1996
5

increase of 18 percent.'
In 1988, most CMEA countries traded extensively with each other. However, in many cases
trade with Western European countries accounted for over one-third of total exports (Table 1). Of the
CEECs, Bulgaria was the most dependent on CMEA markets, almost 60 percent of total exports
going to CPEs.6 Czechoslovakia came second in terms of dependence on CPEs, followed by
Hungary. Both countries still shipped about 40 percent of total exports to Europe--in contrast to
Bulgaria, where the figure was only 20 percent. Between 1988 and 1994 the share of total exports
going to Western Europe increased significantly for all CEECs. As of 1994, some 70 percent of all
exports of the Visegrad countries--the Czech Republic, Hungary, Poland, and the Slovak Republic--
went to Western Europe. The European share for Bulgaria, Romania, and the FSU as a whole was
about 50 percent. In 1994, just 15 to 20 percent of total CEEC exports went to CPEs (including
intra-CEEC trade flows, but excluding intra-Czech-Slovak trade). For some countries that were
highly integrated into the CMEA the share of exports going to ex-CPEs has increased since 1992
(e.g., Bulgaria, Hungary, Estonia and Lithuania). The growth rate of exports to the EU is the highest
for the Czech and Slovak Republics, followed by Bulgaria and Poland (Figure 3). Total exports to the
EU rose by 16.6 per cent per year on average between 1989 and 1994 (from ECU 12 billion in 1989
Figure 3: Exports to EU, 1989-1994
10 18.7
8 i 6.3o ~~~~~~~~~Polarld_...- -
6 g a--- _ _-Ila ---- -(LS..-1.
.2
198 Hungary192 99 1394
4 - -. - -ImEI - - - - -......
L) - - -aW_ - - -O
2 ~ i laR --- - - --- - R -man - -- --
0 ii i I
1989 1990 1991 1992 1993 1994
Average annual growth rates in shaded boxes
5/ For purposes of comparison, countries such as Spain, South Korea, Portugal and Malaysia reachedper capita export levels in the $1,500 range in 1990.
6/ CPEs in this paper are defined as the FSU and the CEECs. German Democratic Republic tradehas been added to those of the Federal Republic in order to maintain comparability of data over time.
6

to 26 billion in 1994). In this period, total EU imports rose by only 3.8 per cent per year. The
CEEC share in total EU imports rose from 2.7 per cent in 1989 to 4.7 per cent in 1994.
Table 1: Share of Exports to FormerCentrally Planned Economies and Western Europe, 1988-94
CPE Western EuropeCountry
1988 1992 1994 1988 1992 1994
Bulgaria 58.0 9.6 22.8 21.8 45.6 47.2Czechoslovakia' 47.7 19.7 20.4 38.4 61.8 71.5Hungary 43.6 7.7 14.4 39.1 75.1 72.1Poland 35.7 15.7 14.9 49.2 62.3 69.3Romania 37.7 25.3 21.4 35.1 37.8 47.3
USSR2 35.6 23.8 27.9 46.6 54.5 49.1
Estonia 29.2 39.0 68.5 56.1Latvia 58.0 54.1 38.5 41.5Lithuania 57.8 64.1 39.1 30.4Russia 35.4 37.2 45.6 43.2
Excludes intra Czech-Slovak trade. Shares for the Czech Republic and the Slovak Republic of totaltrade with CPE were 18.5 and 8.5 percent in 1994.
2 1992-94 excludes intra-FSU trade to maintain comparability.CPE is defined as FSU (including Baltics), Bulgaria, Czech Republic, Slovak Republic, Hungary,Poland and Romania. The German Democratic Republic is excluded; its trade has been added to thatof the Federal Republic of Germany (i.e., is included in Westem Europe).
Source: IMF Direction of Trade Statistics.
Two measures of the contribution of "pure" redirection to export growth to OECD countries
suggest that the reorientation of CEEC exports mostly comprises goods that did not figure importantly
in CMEA trade. The first consists of a direct comparison of export volumes using the following
procedure. For all product categories where total exports in 1994 are below 1988 levels, if 1994
exports to non-CPE markets are above 1988 levels, diversion is defined to equal to the difference
between the two values. For product categories where total 1994 exports are greater than 1988
exports, the amount of "diverted" exports equals the change in the share of exports going to CPE
countries between 1989 and 1994, times the value of 1988 exports. In both cases, if the absolute
value of exports to non-CPEs of an item is lower in 1994 than in 1988, diversion is set at zero. On
the basis of this measure no more that 20 percent of total exports to non-CPE markets comprises
7

"diversion," with Hungary having the highest number (20 percent), and Bulgaria the lowest (12
percent) (Table 2).
Table 2: Reorientation of Exports, 1988-1994
"Diversion" as Index of similarity**Country share of total
exports (%)* 1988 1994
Bulgaria 12 -0.12 -0.47Czechoslovakia 17 -0.16 -0.55Poland 15 -0.34 -0.68Hungary 20 -0.26 -0.63Romania 16 -0.28 -0.43
FSU 13 0.03 -0.18
For definition see text. Calculated at the 2-digit level of the Standard Intemational Trade Classification(SITC).
The index is defined as l 2 (S5cpE - SjROh ), where n is the number of 2-digit SITC categories (63), andn
Si is the share of exports of a category i to centrally planned economies and the rest of the world,respectively. The index ranges from -1 to +1. The closer to -1 (+1) the greater the dependence onROW (CPE) markets.
Source: UN Comtrade database.
A second measure of redirection is a variant of the index of similarity, which suggests that all
the CEECs were already oriented towards Western markets in 1988 (Table 2). In terms of
diversification across markets, exports in a majority of 2-digit SITC items tended to go predominantly
to non-CPE markets.' By 1994 this tendency had grown much stronger. Of the CEECs, Poland has
the lowest share of exports going to former CPEs in both years, Romania and Bulgaria the highest.
The FSU as a whole turns out to be balanced in 1988--about the same proportion of products went to
CPE and non-CPE markets. By 1994, its trade had begun to be oriented towards non-CPE markets,
but the extent of the dependence on such markets remained far below that of the CEECs. This
measure also suggests that the relative importance of simple re-direction in export growth to non-CPE
markets was limited.
7/ As the focus is on the share of each tariff category shipped to different markets, no account istaken of the value of exports of each category. As noted earlier, in volume terms CMEA countrieswere the major market before 1988.
8

An analogous issue for the Baltic states is to what extent exports reflect arbitrage activities--
the trans-shipment of goods originating in FSU countries. In addition to "pure" arbitrage, exports
may also comprise processed commodities that are largely based on inputs obtained from the FSU.
Given the close linkages between the Baltic countries and the rest of the FSU, such dependence is
likely to have been high in the early transition period. Accurate estimates of arbitrage activity are
difficult to obtain as detailed production and bilateral trade data are unreliable or not available. One
approach to this issue is to look for natural resource exports by Baltic states that are not found in
these countries. Nonferrous metals are an example. Another approach is to use data on traditional
imports from Russia and relate these to exports by the Baltic states. To the extent that Baltic states
are exporting commodities that in the past were imported from the FSU, this may reflect arbitrage.
In general, given that the degree of price distortions in Russia making arbitrage profitable decline
over the 1992-94 period, and recognizing that government control of exports of subsidized goods
gradually increased, arbitrage is expected to decline over time.
Using these criteria, a number of 2-digit SITC items were identified where exports may to a
greater or lesser extent consist of trans-shipment. These include non-metallic minerals and metals,
crude fertilizers and metalliferous ores and scrap (headings 27-28), petroleum and products (heading
33), non-metallic mineral products (heading 66, which includes diamonds and precious stones), non-
ferrous metals (68), transport equipment (78-79), and gold (97).8 All of these commodities together
accounted for a large share of total Baltic exports to the EU and EFTA in 1992, ranging from 45
percent for Estonia to 70 percent for Latvia (Table 3). By 1994, the share of these commodities in
total exports had fallen for all three countries, dropping to 22 percent for Estonia, 58 percent for
Latvia and 47 percent for Lithuania. To a large extent this does not reflect a decline in the absolute
value of such exports. Much of the exports in the case of Latvia and Lithuania consists of oil and oil
products, imports of which by 1994 were largely priced at world market levels.
8/ Iron and steel and metal products (headings 67 and 69) do not figure importantly in exports of theBaltics.
9

Table 3: Arbitrage and Baltic Exports to the EU and EFTA
Estonia Latvia Lithuania
1992 994 1992 1994 1992 1994
Share of possible arbitrage goods in exports 44.9 21.7 70.5 57.8 68.5 47.3
Share of arbitrage goods excluding oil 39.2 16.6 14.8 7.2 28.7 15.1
Value of non-oil arbitrage exports (US$million) 139 129 77 93 178 162
Value of arbitrage goods(US$ million) 159 168 367 748 425 506
Source: UN Comtrade database.
3. Changes in Export Structure
The foregoing suggests that simple re-direction of trade played a limited role in export growth
to Western Europe. Thus, trade with OECD nations consists largely of "new" goods or "traditional"
goods that were upgraded/transformed sufficiently to satisfy export market requirements. Such
changes in the product composition of trade reflect restructuring and economic adjustment. Changes
in the product composition of trade will be reflected in trade statistics in various ways. One is in an
increase in product differentiation. Under central planning the extent of product differentiation was
limited, both to facilitate the planning process, and because the absence of competition did not
provide an incentive for producers to differentiate goods. An indicator of increasing product
differentiation is the number of tariff lines exported to OECD markets. The number of 6 digit tariff
items where exports to the EU emerged during the 1989-94 period is significant in all CEECs,
ranging from a low of 15 percent for Hungary to a high of 29 percent for the Czech and Slovak
Republics (Table 4).9 In terms of the contribution of such "new" items to total exports, Bulgaria
stands out. Some 25 percent of 1994 exports comprises nontraditional products.
9/ Such detailed data is not available from UN sources. However, the EU should be representative inthis regard. New exports were defined as 6-digit categories of the EU's Combined Nomenclature(CN) where exports to the EU were ECU 50,000 or less in 1989, and exceeded ECU 100,000 in1994. There are 5,010 product categories at the 6-digit level. Although 8-digit level data areavailable, changes in classifications at this level during the early 1990s may affect comparisons acrosstime. Hoekman and Pohl (1995) use 8-digit data.
10

Table 4: "New" Commodities in CEEC Exports to the EU, 1994
Country Number of Share in total Share in total value of6-digit items items exported exports
Bulgaria 370 17.3 25.6Czechoslovakia 1106 28.7 16.2Hungary 493 15.1 13.0Poland 716 19.7 7.1Romania 353 16.5 9.5
CEECs 794 17.7 3.3
FSU 858 26.2 7.3
Source: EUROSTAT, COMEXT database.
In general, a shift occurs away from the production of machinery and equipment towards
labor-intensive goods. For the CEECs as a whole, the share of clothing, footwear, travel goods and
furniture (SITC items 82-85) in total exports to the EU and EFTA increased from 11 percent in 1989
to 20 percent in 1994. The Czech Republic is the least dependent on these goods (11 percent of total
exports in 1994), Romania the most (47 percent). For Bulgaria, Hungary and Poland the share of
these goods in total exports is about 20 percent, up from 6-8 percent in 1989. The same phenomenon
occurs in the Baltic countries, especially Estonia and Lithuania. These products account for 21
percent of Estonian exports to the EU, 7 percent for Latvia, and 14 percent for Lithuania, as
compared to some 4 percent for all three countries in 1992.
The change in relative specialization of CEECs over the 1988-94 period is perhaps the most
straightforward measure of change in the composition of exports. Relative specialization is often
measured as a country's revealed comparative advantage (RCA) in a given year.'° Two indicators of
the change in the composition of exports were constructed using RCAs. The first is the relative
importance of exports of items where a "sign change" occurred--the RCA for an item that was greater
(less) than one in 1988, had become less than (greater) than one in 1994; the second is the rank order
10/ This measure is due to Balassa and is defined as: ij - where x,j are exports of
commodity i by country j, Xj are country j's total exports, and N is the number of countries. In thispaper RCA calculations are at the 2-digit or 4-digit SITC level (63 or 797 categories). A country isrelatively specialized in goods where the RCA > 1.
11

correlation between RCAs for items in 1988 and 1994. The higher this correlation, the less change
occurs."I
Bulgaria appears to have experienced much more change than any of the other CEECs if the
first measure is used (Table 5). Items in which it was relatively specialized in 1988 (RCA> 1) but
where exports fell enough for the RCA in 1994 to become less than one accounted for 6 percent of
total exports in 1994, down from 33 percent in 1988 (Table 5). Conversely, items in which it
became relatively specialized over the 1988-94 period accounted for only 26 percent of total trade in
1994, up from 5 percent in 1988. Noteworthy is the virtual absence of new export items in which the
Czech and Slovak Republics became specialized. Much of the change in RCAs occurs in items in
which they were already specialized. Often a shift occurred away from the products concerned, as
reflected in a fall of the RCA to less than one in 1994 and large declines in exports. Items in which
the Czech and Slovak Republics had been relatively specialized, but for which RCAs had fallen below
one in 1994 accounted for just 19 percent of exports in 1994, down from 51 percent in 1988. For all
the CEECs except Romania, significant movement occurs away from traditional specialization
patterns. The FSU differs from the CEECs in that it neither "gains" nor "loses" comparative
advantage in many items.
Table 5: Changes in Specialization, 1988-1994
Items where RCA88 < 1 and Items where RCA,,> 1 andRCA9,> I (2-digit SITC) RCA9, <1 (2-digit SITC)
Country Share in 1988 Share in Share in 1988 Share in
exports 1994 exports 1994exports exports
Bulgaria 5 26 33 6Czechoslovakia 0 0 51 19Hungary 5 6 24 13Poland 4 11 26 13Romania 2 18 26 27
FSU 0 1 2
Source: UN Comtrade database.
11/ The first measure is perhaps the most "pure," given that RCAs are binary, not ordinal or cardinalvariables. That is, a RCA of 5 for one good does not necessarily imply the country has a greatercomparative advantage in it than for a good whose RCA is 2. All the RCA does is give informationon whether a country is or is not relatively specialized in a product (see Yeats, 1985).
12

Another measure of change in export composition is the correlation between RCAs for items
in 1988 and 1994. At the 2-digit SITC level this correlation is the highest for Poland, Hungary and
Romania, and the lowest for Czechoslovakia (Table 6), suggesting the latter experienced large
changes in the composition of exports. Comparator countries such as Morocco, Turkey, Spain,
Mexico and Indonesia tend to have correlation coefficients in the 0.7-0.8 range, equivalent to Poland,
Hungary and Romania. There are large differences in correlation coefficients between RCAs
depending on whether they are calculated relative to global trade or relative to all imports into the EU
market. In terms of exports to the EU Bulgaria has by far the lowest correlation, indicating the
greatest change in the composition of exports to the EU. Hungary again has the least change.
Figure 4: Re-orientation of exports and change in specialization
100
90
Czechoslovakia
u 80 Bulaaria
70
Hungary
~'60
t
WI 50 *oaiPoland * Rmai
Albania
40 FSU
30 l l l l l l l l l l l
0.00 0.05 0.10 0.15 0.20 0.25 0.30 0.35 0.40 0.45 0.50 O.S5 0.60 0.65 0.70 0.75Reciprocal of Correlation Between RCAs, 1988-1994
13

Table 6: Correlation Between RCAs (2-digit)
Eastern European Countries Comparators1988 - 1994 1980 - 1988
RCAs vis-a-vis World
Albania 0.81 Morocco 0.84Bulgaria 0.49 Turkey 0.74Czech and Slovak 0.31 Spain 0.83Hungary 0.74 Mexico 0.73Poland 0.86 Indonesia 0.69Romania 0.76 Chile 0.96
Egypt 0.93FSU 0.52
RCAs in the EU market
Bulgaria 0.13 Morocco 0.86Czech and Slovak 0.53 Turkey 0.74Hungary 0.74 Spain 0.83Poland 0.47 Mexico n.aRomania 0.56 Indonesia n.a.
Chile n.a.FSU 0.77 Egypt n.a.
Note: RCAs in the EU market are defined relative to total EU imports rather than world trade.
Source: UN Comtrade and EU Comext databases.
The discussion on the re-orientation of trade and changes in the composition of exports is
summarized in Figure 4.12 This plots the magnitude of the change in exports going to OECD instead
of former CPE markets against the correlation between 2-digit RCAs for product categories in 1988
and 1994. There appears to be an unambiguous relationship between the two variables. The greater
the change in the composition of exports (relative specialization), the greater the extent of re-
orientation across markets that occurs. Because the RCA correlations in Figure 4 are at the 2-digit
SITC level, large increases in exports of a particular category may be driven by large increases in
imports of goods in the same category (i.e., intra-industry trade). The extent to which changes in
export composition reflect changes in imported input flows rather than reorientation of final
production activities is investigated below.
12/ Reorientation in Figure 4 is defined as [ X88,CPE - X94,CPE I + I X88,ROW - X94,ROW I]/X 88, where X isexports in 1988 or 1994 to the former CPEs or the rest of the world (ROW).
14

Figure 5: Intra-industry trade with the EU, 1989-1994
0.60* - .- .-*a-- -. .a.--.Austriia
0.50
0.45 ,, So
0.40 Hungary
0.35 L
0.30 Pln
0.25
0 20 ~~~~~~~~~~~~~~RomaOa _ Turke
0.10 FSU
0.05
0.00 I
1989 1990 1991 1992 1993 1994
4. Intra-Industry Trade
Intra-industry trade has expanded substantially since 1989 for all the CEECs. The Czech
Republic stands out in this regard.'3 Using 4-digit SITC data, the Czech and Slovak intra-industry
trade index stood at 0.47 in 1994, up from 0.24 in 1989.'4 Levels of intra-industry trade are also
high for Slovenia (0.41) and Hungary (0.39). While still below the levels registered for advanced
13/The index of intra-industry trade used is the Grubel-Lloyd measure, defined as: 1 _ Ei K -iME (X +M.
where Xi and Mi are a country's exports to--and imports from--a trading partner of commodity i,respectively.
14/ Most of this is accounted for by the Czech Republic. 1994 data give an intra-industry trade indexwith the EU of 0.47, as compared to 0.32 for the Slovak Republic. There are 797 product categoriesat the 4-digit level. The value of intra-industry trade indices depends in part on the level ofaggregation of the data used. The less aggregated, the higher the index. At the 2-digit level, forexample, the index is 0.6 for the Czech Republic. However, at this level of aggregation less of thetrade flows will involve similar products.
15

industrial countries in the region (4-digit level indices for Austria and Switzerland were 0.58 in
1993), intra-industry trade levels have been growing rapidly (Figure 5). Slovenia, the Czech
Republic and Hungary currently have indices that exceed those of Portugal and Greece (where intra-
industry trade indices for intra-EU exchange were 0.34 and 0.18, respectively, in 1993). The rapid
Figure 6: Growth in per capita exports and imports of inputs from EU, 1988-94
750 1 * Swltzerlan
700
-650 -
a600
c) 550 | Austria0)a 500
:^450a)= 400 } Czechoslovakia
a 350 r * Slovenla
° 30 00) 2S0I+ * Hungary
250 IPortugal TunisiaX 200 Sp *Saln
o.150 r.c I Bulqaria
100 Croatia * Poland* Morocco
50X SO FSU Macedoni *Turkey
o l # l l d *Albanla l l l
-50 - ~ Greece * Romanla
-100-50 -40 -30 -20 -10 0 10 20 30 40 50 60 70 80
Correlation between changes in exports and imported inputs from EU
growth in intra-industry trade again suggests substantial change--indices for comparator countries over
5 to 10 year periods are much more stable, increasing slowly, if at all.
There are various dimensions that may underlie such intra-industry exchange. The first is the
textbook explanation, where it is the result of firms specializing in differentiated products, driven by
the need to realize economies of scale or scope. A second factor was mentioned in the Introduction:
in the early stages of the transition to a market economy CEEC firms are likely to have incentives to
16

establish linkages with West European counterparts, thereby obtaining access to know-how, working
capital, and distribution channels. Intra-industry trade is a mechanism through which transfers of
technology occur. As discussed earlier, transitional incentives lead one to expect that vertical intra-
industry trade will be more important than horizontal exchanges.
Information on input use across industries drawn from an input-output table can be used to
calculate the extent to which the intra-industry trade consists of imports of intermediate inputs and
capital goods from the EU that are used in processing activities and (re-)export. Rank order
correlation coefficients between the change in exports to the EU during 1988-94 and the change in
imports of inputs from the EU on an industry by industry basis reveal large differences across
CEECs. Bulgarian exports to the EU appear to be largely unrelated to imports from the EU, while
the dependence of Czech and Slovak Republic exports on imports from the EU is quite high (Figure
6). The data plotted in Figure 6 suggests there is a strong relationship between changes in per capita
exports to the EU and dependence on intermediates sourced from the EU used in the production of
the exported goods, one that is not idiosyncratic to the CEECs. 5 The intensity of use of EU inputs
by the Czech and Slovak Republics, Slovenia, Hungary and Poland exceeds that of countries such as
Switzerland, Austria, Spain and Portugal. For high-income countries such as Switzerland or Austria
this is due in part to similarities in average production costs, reducing the incentives to engage in
vertical specialization. The fact that the CEECs' "EU-intensity" is also higher than for countries such
as Portugal or Spain illustrates not only that the need to upgrade production quality and obtain
embodied transfers of know-how and access to distribution was compelling, but that there may also be
some "overshooting. "
Although there are good economic reasons to expect high levels of CEEC-EU intra-industry
trade, trade policy may provide an additional explanation for the observed increase. The EU grants
more liberal entry conditions for goods that embody a significant amount of inputs that originated
with EU firms. Under so-called outward processing customs regimes, duties on goods that are re-
imported after processing are usually based on the value added abroad, not on the gross value of the
goods. In the case of the CEECs, the Europe Agreements eliminated tariffs on such trade altogether
15/ As detailed input output tables for all of the CEECs were not available, the 1992 table for Polandwas employed to calculate the use by each of 32 industries of inputs from all other industries. Dataon import dependence for non-CEEC comparator countries reported in Figure 6 are based on national1990-91 input-output tables for each of these countries, obtained from the Michigan Model of GlobalProduction and Trade. Each of the latter input-output tables contains 29 sectors.
17
for goods that satisfy the agreement's rules of origin (Naujoks and Schmidt, 1994).26 Often a local
content requirement applies, i.e., a specified proportion of the value of the good must have been
added in either the EU or the CEEC concerned. Outward processing incentives and rules of origin
are likely to stimulate sourcing of intermediates and components from the EU, and thus intra-industry
trade. It is unfortunately not possible to determine the impact of the rules of origin in fostering intra-
industry exchange from trade data alone. This is because the economic incentives mentioned earlier
for CEEC firms to establish links with EU firms makes it difficult to distinguish between these two
forces. The economic rationale for integration with the EU is likely to outweigh trade policy- based
considerations. In large part this is because the EU's MFN tariffs are generally low enough to ensure
that even if no preferential regimes existed the cost to CEEC exporters would be limited.
In 1994, goods entering the EU under outward processing customs regimes accounted for
about 17 percent of total CEEC exports to the EU, up from 10 percent in 1989. Similarly, imports
from the EU for inward processing grew from 7 to 12 percent of the total. Processing activities
generated 28 percent of Romania's exports to the EU in 1994, up from 13 percent in 1989. Outward
processing trade (OPT) for the other CEECs accounts for 10-18 percent of total exports. In Baltic
countries OPT is most important for Lithuania, accounting for 10.5 percent of total of exports to the
EU in 1994, compared to only 2 percent in 1992. In Estonia and Latvia they account for 4.5 percent
of exports to the EU, starting from a lower base of some 0.5 percent in 1992.
Most of the processing occurs in leather/footwear (20-30 percent of total exports) and
textiles/clothing (60-80 percent), both "sensitive" product categories. Other industries where it is
significant include electrical machinery (10-16 percent), precision instruments (16-18 percent) and
furniture (15-20 percent). Most of the latter activities are concentrated in the Czech and Slovak
Republics, Hungary and Poland."7 Although the total share of OPT in exports has increased
significantly since 1988, its importance has declined for certain product groups. The most prominent
in this connection is furniture. Hungary, Poland, and Romania had relatively high levels of
processing trade in this area in 1989; by 1994 this had declined by 50 percent or more. This does not
imply that exports of this product to the EU fell. To the contrary, they expanded very substantially.
16/ For in-depth discussions of the Association Agreements, see Winters (1992) and Kaminski (1994).
17/ Processing trade has also expanded in agricultural goods. Almost 5 percent of Poland'sagricultural exports to the EU enter under the outward processing regime. This is due in part toprocessing of raw crustaceans and other fish in Poland (Naujoks and Schmidt, 1994).
18

Instead, the incentive to use OPT as a way of contesting EU markets declined following the
implementation of the Interim Agreements. It also does not mean that the use of EU inputs declined.
The increase in intra-industry trade discussed earlier suggests the opposite.
The magnitude of--and rapid increase in--intra-industry trade is likely to have implications for
adjustment costs and market access opportunities in the future. The relative importance of intra-
industry trade is often regarded as an indicator of the extent to which significant adjustment pressures
are likely to arise as a result of liberalization. Adjustment costs may be lower if intra-industry trade
is high because the jobs lost due to customers shifting to more efficient foreign suppliers will be offset
to a greater or lesser extent by the job-enhancing expansion in demand for imports from the foreign
partner for similar goods. The political opposition to liberalizing and expanding intra-industry trade
is generally expected to be more muted than in instances where trade flows are predominantly of the
inter-industry type. In the latter case industries that are less competitive than those abroad will
generally be forced to contract substantially.'8
5. Intra-Industry Trade and Change in Export Structure Revisited
The high levels and growth rates of intra-industry trade for some of the CEECs suggest that
the measures of change in export composition calculated earlier may be biased upward. That is, low
correlations between 2-digit RCAs in 1988 and 1994 may simply reflect high growth in intra-industry
trade. A measure of relative specialization that (implicitly) controls for intra-industry trade is x,/X-
m,/M, where xi and mi are exports and imports of a specific commodity i by a country, and X and M
are the country's total exports and imports. '9 This measure ranges from -1 to + 1. If it is positive,
the country is relatively specialized in a good, and vice versa. The closer it is to zero, the more
important intra-industry trade is likely to be. If correlations are calculated between the value of this
indicator in 1988 and 1994 (again at the 2-digit SITC level), Czechoslovakia demonstrates the least
change in export composition of all the CEECs (Table 7). Indeed, Bulgaria becomes the only CEEC
18/ See Greenaway and Hine (1991) for a survey of the theory and evidence in the EU context. Thisis not to say that intra-industry trade will not lead to adjustment and thus pressure for protection. Tothe extent that there are specific and relatively immobile factors of production that are injured byimport competition, they can be expected to seek protection. But the factors that are hurt will be atthe firm-level. Other firms in the industry will expand. This makes it more difficult to obtainprotection, as there will be conflicting interests within industries.
19/ This index has been used by Neven (1995).
19

demonstrating significant change in the structure of exports. As noted earlier, it also has one of the
lowest levels of intra-industry trade, so this result should not be surprising.
Table 7: Further Measures of Change in Export Structure
Country Change in relative p(RCA)88,94 p(RCA)88,94specialization Exports to world, 4-digit Exports to EU, 6-digit
p(x/X-rMM)88,9 SITC (n=797) CN (n=5,010)2-digit SITC (n=69) l
Bulgaria 0.27 0.52 0.37
Czechoslovakia 0.73 0.88 0.41
Hungary 0.73 0.71 0.63
Poland 0.72 0.47 0.50
Romania 0.67 0.67 0.53
FSU 0.78 0.66 0.39
Source: UN COMTRADE.
Greater insight into the relative importance of intra-industry trade for the CEECs can be
obtained from re-calculating the RCAs used in Section 3 at more disaggregated levels. If RCA
correlations are calculated at the 4-digit SITC level (797 categories), the Czech and Slovak Republics
again have the least change in the composition of exports (the highest correlation between RCAs)
(Table 7). Czech and Slovak export growth is therefore concentrated in sectors that were exported in
the late 1980s, and to a large extent the low correlation across 2-digit RCAs noted earlier is driven by
the increase in intra-industry trade. Using 4-digit level RCA data, Bulgaria and Poland experience
the greatest change in the composition of their exports. If attention is restricted to changes in exports
to the EU a somewhat different picture emerges. The third column of Table 7 reports the correlation
between RCAs in the EU market, calculated at the 6-digit level of the EU's Common Nomenclature.
Noteworthy is that the export composition of the Czech and Slovak Republics changes more than that
of the other Visegrad countries. In conjunction with the limited change in 4-digit RCAs for exports
to the world, this suggests that although "redirection" of exports from CMEA to Western markets is
significant, in the sense that much of the export growth is concentrated in "traditional" export items,
this does not mean an absence of a supply response. It is clear from the 6-digit RCA data that a
20

substantial amount of product differentiation and vertical specialization has occurred. As noted
earlier, at the 6-digit level many of the exports to the EU are "new." The 6-digit data on Bulgarian
and Polish exports to the EU also imply significant change in the product mix, although less than for
Czechoslovakia. Together with the relatively high degree of change implied by 4-digit SITC RCAs,
this suggests less "redirection-cum-upgrading" of traditional exports and more change across sectors.
One consequence of high levels of intra-industry trade and a high reliance on OPT is likely to
be relatively low value added. If so, this may be reflected in the unit values of exports. Trends in
export unit values also embody information on the ability of firms to improve the quality of export
production over time. Unit values of CEEC exports are lower than those of dynamic industrializing
countries such as South Korea, but are not significantly below the average unit value of EU imports
of many commodities. Average unit values increased for the majority of CEEC exports to the EU
during 1989-94.' Although for some sectors/countries unit values decline--e.g., organic chemicals,
plastics, iron and steel, copper products, motor vehicles--such declines are not very large (Table 8).
Most sectors have either flat or increasing unit values. In growth terms ("quality upgrading"), the
Czech and Slovak Republics and Hungary appear to have the best performance. Between 1988 and
1994 unit values of garments, footwear, copper articles, and electrical machinery increase
significantly. To a large extent this constitutes a process of catching up with the world average,
which in clothing and footwear had been more than achieved by 1994. The absolute levels of unit
values for Czech and Slovak products are often significantly below those of Hungary, which has had
the highest "quality" exports of all the CEECs throughout the period.2' Hungary also had the greatest
increase in unit values of exports of machinery and electrical equipment, although the unit value of
such exports remains significantly below the EU's average import value. Israel, for example, has
export unit values for electrical machinery that are almost four times the Hungarian level. While this
is not surprising--these are sectors where the competition from both industrialized and industrializing
countries is intense--it illustrates the quality gap that still needs to be overcome.
20/ This contradicts the conclusions drawn by Drabek and Smith (1995).
21/ This may be a reflection of initial conditions. Hungary initiated reforms to central planning wellin advance of the other CEECs.
21

Table 8: Unit Value Comparisons for Major CEEC Exports to the EU, 1988 and 1994 (ECU/kg)
CN Bulgaria Czechoslovak Hungary Poland Romania Israel Korea Total EUDescription Imports
Item 88 94 88 94 88 94 88 94 88 94 88 94 88 94 88 94
29 Organic chemicals 0.6 0.6 0.6 0.7 0.6 0.7 0.6 0.6 0.4 0.4 0.9 1.4 1.6 1.9 1.2 1.5
39 Plastics and plastic products 0.6 0.6 0.7 0.8 0.8 0.7 0.6 1.0 0.8 0.5 1.9 1.6 1.9 1.5 1.9 1.7
44 Wood and articles of wood; wood charcoal 0.1 0.1 0.2 0.2 0.1 0.1 0.2 0.2 0.3 0.4 1.3 1.5 1.3 2.6 0.3 0.4
61 Articles of apparel and clothing accessories, 9.1 9.8 11.1 19.2 17.6 19.9 11.4 15.5 11.0 11.4 26.4 30.1 14.8 16.2 15.6 14.6
knitted or crocheted
62 Articles of apparel and clothing accessories, not 15.7 18.4 16.0 22.7 28.0 32.5 23.4 27.1 18.4 19.1 38.3 50.0 19.6 25.8 18.5 19.0
knitted or crocheted
64 Footwear, gaiters and the like: parts of such 6.6 10.2 5.7 10.8 18.3 19.1 10.7 11.2 11.1 11.3 6.4 9.7 10.6 15.5 10.6 10.9
articles
72 Iron and steel 0.3 0.2 0.3 0.2 0.2 0.2 0.2 0.2 0.3 0.3 0.3 0.5 0.6 0.7 0.4 0.4
73 Articles of iron or steel 0.5 0.5 0.5 0.7 0.5 1.0 0.6 0.7 0.6 0.6 1.9 3.1 2.1 4.1 1.4 1.4
74 Copper and articles thereof 2.0 1.8 0.4 1.5 1.6 1.6 2.1 1.9 1.6 1.3 1.4 1.5 10.3 6.3 2.2 1.9
84 Nuclear reactors, boilers, machinery and 2.4 3.8 3.1 3.0 2.7 4.7 2.0 2.3 2.6 2.7 14.5 19.0 13.6 9.4 15.7 16.8
mechanical appliances; parts thereof
85 Electrical machinery and equipment and parts 3.4 4.4 2.3 6.6 4.9 10.0 2.2 4.4 2.6 4.0 30.6 38.7 10.4 21.6 18.6 22.7
thereof; sound recorders and reproducers,television image and sound recorders andreproducers, and parts and accessories of sucharticles
87 Vehicles other than railway or tramway rolling- 3.2 1.7 2.1 3.4 2.6 4.2 2.3 3.5 2.4 1.7 3.2 6.5 4.0 5.7 5.7 7.2
stock, and parts and accessones thereof
94 Furniture; medical and surgical furniture; 1.3 1.5 1.4 1.5 1.6 2.7 1.2 1.6 1.3 1.4 2.9 2.8 5.7 3.4 2.3 2.6
bedding, mattresses, mattress supports, cushionsand similar stuffed furnishings; lamps and lightingfittings, not elsewhere specified; illuminated signsand name-plates
43.3 57.0 54.1 62.2 48.1 64.9 45.8 62.2 49.2 74.5 17.9 36.7 67.2 74.7 40.6 46.4
Memo: Share of these items in total exports (%)
Source: EU COMEXT.
22

6. Foreign Direct Investment and Export Performance
Intra-industry trade is often associated with FDI (Greenaway and Milner, 1987). To what
extent is the growth in intra-industry trade in the CEECs driven by inward FDI from Western Europe
as opposed to arms-length cooperation and exchange? It is well known that Visegrad countries
attracted substantial investment in the automobile sector, and it is conventional wisdom that much of
the export growth in this sector is associated with these investments. But the importance of FDI more
generally has not been determined. The absolute level of inward FDI flows has not been very high,
and there are significant differences across CEECs. Hungary attracted by far the most FDI during
1990-1994, Bulgaria the least. Total (cumulative) FDI in Hungary stood at $6.5 billion in 1994, as
compared to $3.9 billion in the Czech Republic; $4.7 billion in Poland; $400 million in the Slovak
Republic; and $552 and $262 million in Romania and Bulgaria. FDI flows have tended to be
dominated by very large investment in particular sectors. Automobiles account for 18, 21, and 18
percent of the total in Poland, Hungary and the Czech and Slovak Republics, respectively. A $1.4
billion investment by Philips in Hungary in 1991 accounts for another 20 percent of the total. If
investments in service sectors are also taken into account (e.g., hotels, telecommunications) the
significance of FDI in tradables is quite limited (EBRD, 1995).
Figure 7: Log of FDI and Intra-industry trade volume in the CEECs
Et 6
4 4
3~ ~ ~ ~~~~~~2
UO 2 ~ ~ ~ ~ ~ ~
0)2 3 4 7
02 -~~~~~~~~~~~nr-Id sr Trade
IL~ ~ ~~~~~~~~2

The relationship between the log level of FDI and the log level of the volume of intra-industry
trade for 12 tradable industries is plotted in Figure 7 for the 5 CEECs (including the Czech and
Slovak Republics as one entity). The plot suggests there is a strong correlation between the absolute
amount of sectoral FDI and the level of intra-industry trade in 1994. This is confirmed by regression
analysis. Economic theory predicts that the volume of intra-industry trade is a function of the
similarity and the level of GDP of countries, and of distance (Helpman. 1987). Empirical analyses
do not unambiguously support the theory (Humrnels and Levinsohn, 1995), arguably because the
theory is not well specified--many theories are consistent with the result that the more similar are two
nation's GDP, the higher is the volume of trade (Deardorff, 1995). In attempting to determine the
relative importance of FDI in explaining intra-industry trade, it is nonetheless helpful to control for
these two factors, as they figure prominently in any theory of trade volumes. If the log of intra-
industry trade in a sector is regressed on FDI, a standard size dispersion index, and the distance
between each CEEC capital and Frankfurt, all parameters have the expected signs, but only FDI is a
statistically significant explanatory variable (Table 9).22
Table 9: FDI and the Volume of Intra-Industry Trade, 1990-94
Variable Parameter Estimate (t-statistic in parentheses)
Intercept (a) 6.3 (2.1)
FDI (b,) 0.40 (4.4)
,Size dispersion (b2) 0.19 (0.7)Distance (b3) -0.47 (-1.6)
Source: FDI data from World Bank (1996) and EBRD (1995). Trade data from EU COMEXT, concorded byauthors to FDI classification.
22/ The equation that was estimated was:
log IIT, = a, + b, log FD4I + b2 log [GDPjEU(1-(sj)2-(sEU)2 )] + b3 log Dj + Eip
where FDlj is cumulative 1990-94 total inward FDI for CEEC j (j= 1-5) in sector i (i= 1-12);GDPiEU(Y -_Sj)2-(SEU)2 ) is the Helpman (1987) country size dispersion index (where GDPjEU is the jointGDP of CEEC j and the EU and s is the share of each partner in joint GDP) and Dj is the distancebetween each CEEC's capital and Frankfurt. The volume of intra-industry trade (IIT) is defined onthe basis of the Grubel-Lloyd index as HTij=2 min(XjjEu,XiEuj)/(XijEu+XEui), where X is exports ofsector i from the EU to CEEC j, or vice versa. The twelve tradable industries for which FDI dataare available are automobiles, other transport equipment, beverages, construction materials,chemicals, electronic products, engineering and heavy machinery, food processing, furniture, textilesand clothing, footwear, and tobacco.
24

While these results are suggestive, they cannot be interpreted to imply that FDI is driving the
growth in the volume of intra-industry trade. Causality cannot be inferred. The firm level data
required to determine the contribution of foreign-owned or controlled firms to the volume of intra-
industry trade is not available. However, a sense for the relative importance of FDI can be obtained
by plotting absolute values of FDI against the value of the intra-industry trade index for each of the
12 sectors (Figure 8). It can be seen that the greatest amounts of FDI are concentrated in cars
(Poland, Hungary and Czechoslovakia). The Philips investment in electric equipment (light bulbs) is
another outlier, being associated with very high levels of intra-industry trade. Excluding these 4
observations, the relationship between FDI and intra-industry trade appears very weak. Noteworthy
is the fact that in engineering and heavy machinery such trade is not associated with significant
amounts of FDI. This suggests that exports are mostly "home grown" and that intra-industry trade is
substantially arms-length in nature.
Figure 8: Value of FDI by sector and volume of Intra-industry trade
e13C0= Hungr.cars I Huna, electronic
_1200 _
E 1100- _-___
1000- ._____ __ ____
.s 900 ~ * Czechoslo akia, cars ___
o 800 Po and, cars * ____
700- _ _ _
600 Polan , electronics PoIani, mach inerv 500 __1
400 _ _ - __ -
@ 200 -* * * * * Czec oslovakia, mac hiery
a 100 * Czechoslovak a, chemicalsLa o --- !"---.______ahinery _____
0 - _ I
0 500 1000 1500 2000 2500 3000 3500 4000
Intra-Industry Trade (in USS million)
7. Conclusions
This paper has investigated the export performance of European former centrally-planned
economies. A strong relationship was found to exist between the relative importance of intra-industry
trade and export growth performance in EU markets. The Czech and Slovak Republics register the
25

highest growth in exports, the greatest re-orientation in the pattern of trade, and also stand out in
terms of the number and importance of 'new' products in total exports. They also have the highest
level and rate of growth in intra-industry trade with the EU. Although great changes occur in the
commodity composition of exports measured at the 2-digit SITC level, this is mostly a reflection of
the rise of intra-industry trade. Calculations of the change in RCAs at more disaggregated levels
suggest that the Czech and Slovak Republics have undergone the least change in the overall
composition of total exports. However, the relatively great change in the composition of exports to
the EU within these sectors reveals that Czech and Slovak firms pursued a strategy of upgrading and
differentiating "traditional" exports. The strong relationship between the increase in vertical intra-
industry trade and export performance reveals an extensive reliance upon EU firms for new
machinery, components, and know-how. This reliance on the EU for inputs is also high for
Slovenia, Hungary and Poland. All these countries are currently more dependent on (or integrated
with) the EU than countries such as Portugal, Spain, or Austria. As they also experience the highest
growth rates in exports to the EU (on a per capita basis), this appears to be a characteristic of
successful transition.
Simple re-direction of goods that were traditionally exported to CMEA markets does not
appear to have played an important role in the growth in exports to Western Europe. At most 20
percent of the export volume comprises "diverted" CMEA goods. Instead, export growth is either in
products that were not exported at all to the CMEA, or, comprise "traditional" export items that have
been substantially upgraded or differentiated. Countries that follow the latter "strategy"--the Czech
and Slovak Republics and Hungary--rely more heavily on intra-industry trade and vertical
specialization. Bulgaria and Poland experience greater change in the broad composition of exports
and have lower levels of intra-industry trade with the EU. Hungary differs from the Czech and
Slovak Republics in a number of ways. It experiences less change in the composition of exports, has
lower export growth rates, has higher unit values, and has attracted more FDI. To some extent the
fact that Hungary initiated reforms much earlier than Czechoslovakia explains these differences.
FDI inflows are highly correlated with export performance and intra-industry trade levels.
Existing data do not allow an investigation of the direction of causality or the relative contribution of
foreign affiliates or joint ventures to the volume of trade. However, the volume of FDI flows was
quite limited up to 1994. If large investments in the automobile sector are excluded, it appears that
FDI is unlikely to have been a major force driving the growth of intra-industry trade. These
26

exchanges and the underlying integration into the world economy mostly reflect arms-length
transactions between CEEC firms and Western European counterparts.
27

References
Deardorff, Alan. 1995. "Determinats of Bilateral Trade: Does Gravity Work in a NeoclassicalWorld?," Research Forum on International Economics Discussion Paper No. 382, University ofMichigan.
Djankov, Simeon and Bernard Hoekman. 1995. "Trade Liberalization and Enterprise Restructuringin Bulgaria, 1992-94," World Bank, mimeo.
Drabek, Zdenek and Alasdair Smith. 1995. "Trade Performance and Trade Policy in Central andEastern Europe," CEPR Discussion Paper No. 1182.
European Bank for Reconstruction and Development. 1995. Transition Report. London: EBRD.
Greenaway, David and Chris Milner. 1987. "Intra-Industry Trade: Current Perspectives andUnresolved Issues," Weltwirtschaftliches Archiv, 123, 39-48.
Greenaway, David and Robert Hine. 1991. "Intra-Industry Specialization, Trade Expansion andAdjustment in the European Economic Space," Journal of Common Market Studies, 29, 603-22.
Helpman, Elhanan. 1987. "Imperfect Competition and International Trade: Evidence From FourteenIndustrial Countries," Journal of the Japanese and International Economies, 1, 62-81.
Helpman, Elhanan and Paul Krugman. 1985. Market Structure and Foreign Trade. Cambridge:MIT Press.
Hoekman, Bernard and Gerhard Pohl. 1995. "Enterprise Restructuring in Eastern Europe; HowMuch? How Fast? Where? Preliminary Evidence from Trade Data," World Bank Policy ResearchPaper 1433.
Hummels, David and James Levinsohn. 1995. "Monopolistic Competition and International Trade:Reconsidering the Evidence," Quarterly Journal of Economics, 110, 799-836.
Kaminski, Bartlomiej. 1994. "The Significance of the 'Europe Agreements' for Central EuropeanIndustrial Exports," Policy Research Working Paper 1314, The World Bank.
Kaminski, Bartlomiej, Zhen Kun Wang and L. Alan Winters. 1996. "Explaining TradeReorientation in Transition Economies," mimeo, World Bank.
Naujoks, Petra and Klaus-Dieter Schmidt. 1994. "Outward Processing in Central and East EuropeanTransition Countries," Kiel Working Paper 631 (May).
Neven, Damien. 1990. "Gains and Losses from '1992'," Economic Policy, 10:13-62.
Neven, Damien. 1994. "Trade Liberalization with Eastern Nations: How Sensitive?," CEPRDiscussion Paper 1000.
Sachs, Jeffrey and Andrew Warner. 1995. "Economic reform and the Process of GlobalIntegration," Brookings Papers on Economic Acvtivity:l, 1-118.
28

World Bank. 1996. World Development Report, 1996. Washington D.C.: The World Bank.
Winters, L. Alan. 1992. "The Europe Agreements: With a Little Help from Our Friends," in TheAssociation Process: Making it Work. London: Center for Economic and Policy Research.
Yeats, Alexander. 1985. "On the Appropriate Interpretation of the revealed Comparative AdvantageIndex," Weltwirtschaftliches Archiv, 121, 61-73.
29


Policy Research Working Paper Series
ContactTitle Author Date for paper
WPS1638 Private Pension Funds in Hungary: Dimitri Vittas August 1996 P. InfanteEarly Performance and Regulatory 37642Issues
WPS1639 Income Insecurity and Franck Wiebe August 1996 J. IsraelUnderemployment in Indonesia's 85117Informal Sector
WPS1640 Labor Regulations and Industrial Alejandra Cox Edwards August 1996 M. McIntosh-AlbertsRelations in Indonesia 33750
WPS1641 Poverty and Inequality During M. Luisa Ferreira August 1996 H. TaddeseStructural Adjustment in Rural 31086Tanzania
WPS1642 Banking Reform in Transition Stijn Claessens August 1996 R. VelasquezCountries 39290
WPS1643 The Consequences of Doubling Martin Rama September 1996 S. Fallonthe Minimum Wage: The Case of 38009Indonesia
WPS1644 Pricing Industrial Pollution in China: Hua Wang September 1996 H. WangAn Econometric Analysis of the David Wheeler 33255Levy System
WPS1645 How Prices and Macroeconomic Nlandu Mamingi September 1996 A. WilliamsPolicies Affect Agricultural Supply 37176and the Environment
WPS1646 Budgetary Institutions and Ed Campos September 1996 C. BernardoExpenditure Outcomes: Binding Sanjay Pradhan 31148Governments to Fiscal Performance
WPS1647 The Baltics-Banking Crises Alex Fleming September 1996 S. CoffeyObserved Lily Chu 32635
Marie-Renee Bakker
WPS1648 The Lender of Last Resort Function Gerard Caprio, Jr. September 1996 B. MooreUnder a Currency Board: The Case Michael Dooley 38526of Argentina Danny Leipziger
Carl Walsh
WPS1649 Economic Regulation of Water Michael Klein September 1996 S. VivasCompanies 82809
WPS1650 Bank-Led Restructuring in Poland Cheryl W. Gray September 1996 B. MooreAn Empirical Look at the Bank Arnold Holle 38526Conciliation Process

Policy Research Working Paper Series
ContactTitle Author Date for paper
WPS1651 Bank-Led Restructuring in Poland: Cheryl W. Gray September 1996 B. MooreBankruptcy and Its Alternatives Arnold Holle 38526
WPS1652 Intra-Industry Trade, Foreign Direct Bernard Hoekman September 1996 F. HatabInvestment, and the Reorientation Simeon Djankov 35853of Eastern European Exports
WPS1653 Grants and Debt Forgiveness in Leonardo HernandezAfrica: A Descriptive Analysis
WPS1654 Indonesia's Palm Oil Subsector Donald F. Larson September 1996 P. Kokila33716
WPS1655 Uncertainty and the Price for Crude Timothy J. Considine September 1996 P. KokilaOil Reserves Donald F. Larson 33716