public disclosure authorized -...
TRANSCRIPT
Pub
lic D
iscl
osur
e A
utho
rized
Pub
lic D
iscl
osur
e A
utho
rized
Pub
lic D
iscl
osur
e A
utho
rized
Pub
lic D
iscl
osur
e A
utho
rized
PAPUA PUBLIC EXPENDITURE ANALYSIS OVERVIEW REPORT REGIONAL FINANCE AND SERVICE DELIVERY IN INDONESIA’S MOST REMOTE REGION

Regional Finance and Service Delivery in Indonesia’s most Remote Region ________________________________________________________________________________________
ii

Papua Public Expenditure Analysis | Overview Report _________________________________________________________________________________________
iii
ABBREVIATIONS AND ACRONYMS
Bahasa Indonesia English Equivalent
APBD Anggaran Pendapatan Belanja Daerah Regional Government Budget Bappeda
Badan Perencanaan Pembangunan Daerah
Regional Development Planning Agency
Bappenas
Badan Perencanaan Pembangunan Nasional
State Ministry for National Development Planning
Bawasda Badan Pengawas Daerah Regional Audit Agency BKN Badan Kepegawaian Negara National Civil Service Agency BP3D
Badan Perencanaan dan Pengendalian Pembangunan Daerah
Agency for Planning and Coordination of Regional Development
BPK Badan Pengawas Keuangan Supreme Audit Authority BPS Badan Pusat Statistik Central Bureau of Statistics BUMD
Badan Usaha Milik Daerah Regional Government Owned
Enterprise DAK Dana Alokasi Khusus Special Allocation Grant Dana Otsus Dana Otonomi Khusus Special Autonomy Fund DASK Dokumen Anggaran Satuan Kerja Work Unit Budget Document DAU Dana Alokasi Umum General Allocation Grant DIK-DA
Daftar Isian Kegiatan Daerah Warrant for Regional Government
Routine Expenditures Dinas
Regional Government Functional Office
DIP-DA
Daftar Isian Proyek Daerah Warrant for Regional Government Development Expenditures
DPRD Dewan Perwakilan Rakyat Daerah Regional Parliament GDP Gross Domestic Product GRDP Gross Regional Domestic Product HDI Human Development Index IFES
International Foundation for Election System
IKK Indeks Kemahalan Konstruksi Construction Price Index INPRES
Instruksi Presiden Presidential Instruction
Kab/Kota Kabupaten/Kota Regencies/Cities Kepmen Keputusan Menteri Ministerial Decree KMESDM
Keputusan Menteri Energi dan Sumber Daya Mineral
Decree of Minister of Energy and Mineral Resources
KMK Keputusan Menteri Keuangan Minister of Finance Decree MoF Ministry of Finance

Regional Finance and Service Delivery in Indonesia’s most Remote Region ________________________________________________________________________________________
iv
MoHA Ministry of Home Affairs MPR Majelis Permusyawaratan Rakyat People’s Consultative Assembly MRP Majelis Rakyat Papua Papua People's Assembly OSR Own Source Revenue PC Per Capita PDAM Perusahaan Daerah Air Minum Regional Drinking Water Enterprise PEA Public Expenditure Analysis Perda Peraturan Daerah Regional Regulation Perdasus Peraturan Daerah Khusus Special Regional Regulation PILKADA Pemilihan Kepala Daerah Direct Election of Heads of Region PODES Potensi Desa Village Potential Census Posyandu Pos Pelayanan Terpadu Integrated Health Services Unit PP Peraturan Pemerintah Government Regulation Propeda Program Pembangunan Daerah Regional Development Program Puskesmas Pusat Kesehatan Masyarakat Local Health Center Pustu Puskesmas Pembantu Secondary Health Center Renja-SKPD
Rencana Kerja - Satuan Kerja Perangkat Daerah
Working Plan of Work Unit
Renstra Rencana Strategis Strategic Plan Renstra-SKPD
Rencana Strategis - Satuan Kerja Perangkat Daerah
Medium Term Development Plan of Work Unit
Repetada Rencana Pembangunan Tahunan Daerah Annual Regional Development Plan RKPD Rencana Kerja Pemerintah Daerah Regional Government Work Plan RPJMD
Rencana Pembangunan Jangka Menengah Daerah
Regional Medium Term Development Plan
RPJPD
Rencana Pembangunan Jangka Panjang Daerah
Regional Long Term Development Plan
Satker Satuan Kerja Work Units SDO Subsidi Daerah Otonom Subsidy for Autonomous Region SIKD Sistem Informasi Keuangan Daerah Regional Financial Information System SOfEI Support Office for Eastern Indonesia STIE OG
Sekolah Tinggi Ilmu Ekonomi Ottow & Geisler
Ottow & Geissler School of Economics
SUSENAS Survei Sosial Ekonomi Nasional National Socio-Economic Survey UN FUNDWI United Nations Fund for West Irian UNCEN Universitas Negeri Cenderawasih Cenderawasih State University UNDP United Nations Development Program UNIPA Universitas Negeri Papua State University of Papua UNTEA United Nations Temporary Authority
Papua Public Expenditure Analysis | Overview Report _________________________________________________________________________________________
v
FOREWORD It is my pleasure to announce the launching of the “Papua Public Expenditure Analysis” report which was conducted amidst the debate regarding the implementation of special autonomy in the Province of Papua. This report provides a clear picture of public expenditure in the province of Papua. This detailed report provides not illustrates public expenditures at the provincial level, but also covers a number of kabupaten and kota in Papua. There are many lessons to be learned from the results of this study which serve as valuable input for local governments in Papua, as well as for local governments throughout the Republic of Indonesia. This balanced report clearly illustrates various obstacles to public expenditure management. The issues identified should be carefully studied and addressed in order to improve the management of public expenditures in the future. The Papua Public Expenditure Analysis is an initiative of the Government of Papua Province undertaken to continually improve performance in the implementation of special autonomy. The Government of Papua Province has implemented an evaluation of special autonomy, where much of the public scrutiny was directed towards issues in financial management, without a full comprehension of the various obstacles faced by the government. We have taken these concerns seriously and have addressed these concerns through cooperation with various institutions in order to identify appropriate measures to support the acceleration of development in Papua. These efforts have brought about collaboration with the World Bank, an institution recognized for its capacity and experience in conducting public expenditure analyses. In this collaborative effort, the Government of Papua Province has included a prerequisite that local institutions are involved in order to ensure transfer of knowledge. This requirement was also included to ensure that the process of public expenditure monitoring can be continued in Papua in a sustainable manner by independent bodies in the region. In this case, local universities took the leading role. This program as a whole is a concrete step towards improving the management of finances in the interests of the public, which simultaneously provides a foundation for capacity building of public servants. This report represents the first phase in the Papua Public Expenditure Analysis and Capacity Harmonization program. Using the findings from the Public Expenditure Analysis (PEA), we will implement the second phase, the capacity building or Capacity Harmonization (CH) phase. The final outcome from the program is a public financial management apparatus in Papua Province with extensive knowledge of its role in each phase of the public financial management cycle from the planning, allocations, and service delivery stages to the monitoring and reporting stages. The reader can judge independently to what extent this report reflects the effort of the Government of Papua Province to enhance transparency and accountability to the public according to principles of good governance. The completion of this report does not symbolize the end of a process but rather serves as a starting point to navigate a path that contains many challenges, but also holds promise for a brighter future. It is my hope that this book becomes a reference not only for Papua, but also for other local governments in other regions to address their public financial management capacity, as a step in attaining the dream of all Indonesian people, a future free of poverty, corruption, and injustice.

Regional Finance and Service Delivery in Indonesia’s most Remote Region ________________________________________________________________________________________
vi
This report was made possible through the hard work of many people. I would like to thank the World Bank and the Multi-Donor Support Office for Eastern Indonesia (SOfEI) for its cooperation and support through the Dutch Trust Fund. I also want to express my appreciation to the teams from Cenderawasih State University, State University of Papua, and the Ottow & Geissler School of Economics for their involvement facilitated by the Agency for Planning and Coordination of Regional Development (BP3D) of Papua Province. Based on the recommendations in this report, I invite all interested parties to participate in various follow up activities with the hope that Papua will become an example to other regions of Indonesia for the effective, efficient, accountable, and transparent management of public funds. May God bless us all. Jayapura, 26 August 2005 Governor of Papua Province Dr. J.P. Solossa, Drs., M.Si.
Papua Public Expenditure Analysis | Overview Report _________________________________________________________________________________________
vii
FOREWORD This expenditure review is an excellent example of the government’s effort to better serve the community by finding ways to improve public financial management and bring services to the poor and disadvantaged. It is, indeed, no small thing for an administration to expose its finances to close scrutiny in order to increase efficiencies and ensure that funds are spent in the most effective way. It is also extremely heartening to see the provincial and district governments’ enthusiasm and commitment to this exercise, demonstrated by the real contribution they made to the initiative through budget and staff time. I would like to congratulate the Government of Papua Province and his staff for their support. I would also like to commend the universities in Papua for their hard work in collecting and analyzing data. This project really demonstrates how collaboration between provincial and local governments and universities can bring real results. This is an example of a partnership that has worked and provides a model for the rest of the region and the country. Over the last few weeks, requests have started coming in from other provinces to undertake similar exercises, amongst others, Aceh and North Sulawesi. What better indicator of success? Now that Papuan universities have demonstrated their capacity, I am certain they will be called upon to assist with the design and implementation of similar public expenditure reviews in other districts of Papua and in other parts of the country. This degree of collaboration between institutions as varied as provincial and local governments, academic institutions and multi-lateral organizations is a great source of optimism. I am now, more than ever, convinced that, with good will, we can work together to make for a brighter future for the people of Papua. Finally, I would like to thank the authors for their collaborative effort and sterling work in facilitating the process and producing a report in such a timely manner which will surely serve as a model for the future. 7 September, 2005 Andrew Steer Country Director World Bank, Indonesia
Regional Finance and Service Delivery in Indonesia’s most Remote Region ________________________________________________________________________________________
viii
ACKNOWLEDGEMENTS This report is the result of collaborative efforts between the World Bank Office Jakarta, Support Office for Eastern Indonesia (SOfEI) in Makassar, Cenderawasih State University (UNCEN) in Jayapura, State University of Papua (UNIPA) in Manokwari, and STIE Ottow & Geissler in Jayapura. It is one of the outputs of the Papua Expenditure Analysis and Capacity Harmonization (PEACH), an activity initiated by the Papua Provincial Government. This report was prepared by a core team consisting of Jasmin Chakeri, Bambang Suharnoko Sjahrir, John Theodore Weohau and Jana Hertz. The Task Team Leaders were Wolfgang Fengler and Richard Manning This report draws on PEACH background reports in five case study locations prepared by three leading institutions in Papua. The Provinsi Papua and Kota Jayapura reports were prepared by the UNCEN team consisting of Agustinus Salle, Adolf Siahaay, Hasan Basri Umar and Aaron Simanjuntak. The Kabupaten Mimika and Kabupaten Biak Numfor reports were prepared by the UNIPA team consisting of Rully Wurarah, Achmad Rohani, Naftali Mansim and Agus Sumule. The Kabupaten Pegunungan Bintang report was prepared by the STIE Ottow & Geissler team consisting of Esther Saranga, Johanis Marani and Philipus Ramandey. The team would like to thank Max Boekorsjom, Wahyu Widayati, Syafruddin Daerlan and Domi Sukamto from the Badan Perencaan dan Pengendalian Pembangunan Daerah (BP3D) of Papua Province for their guidance and Marthinus Howay, the head of BP3D, for his and his team’s support throughout the PEACH process. The team would also like to thank Waryono, Ruslan Ramli, Istiyoso, Elia Loupatty (Papua Province), Mardin Manurung, Mohamad Idrus, Irianto Jacobus (Kota Jayapura), Simon Mote, Laduane (Kabupaten Mimika), Melly G. Sembay, Turbey O. Dangeubun, Joseph Kapisa, Carla Th. Karubaba (Kabupaten Biak Numfor) Welington Wenda and Befa Yigibalom (Kabupaten Pegunungan Bintang) for their assistance during the field visits to the respective case study locations. Valuable inputs and comments were received from Blane Lewis, Petrarca Karetji, Kathy Macpherson, William Wallace, Joel Hellman, Anne-Lise Klausen, Mila Gregorio, Cut Dian, Bastian Zaini, Ahya Ihsan, Arnold Lopulalan and Vincent da Cruz. Karen St. John and John Tan from BP and Tony Wenas from Freeport provided useful background materials. Special thanks go to Ari Perdana for translating the document; Chris Stewart for editing; Indra Irnawan for assisting with the formatting; and Caroline Tupamahu and Ira Triasdewi for excellent logistical support. The peer reviewer was Kai Kaiser. The PEACH overview and background reports have also benefited from the comments and inputs received during the Public Seminar in Jayapura conducted jointly by BP3D Papua Province, the World Bank and SOfEI on 5 July 2005. Last but not least, the team would like to thank the Governor of Papua Province, Dr. J.P. Solossa, Drs., M.Si. for his support and Andrew Steer for his guidance throughout the PEACH initiative. Financial support was provided by the World Bank Dutch Trust Fund.

Papua Public Expenditure Analysis | Overview Report _________________________________________________________________________________________
ix
TABLE OF CONTENTS 1. EXECUTIVE SUMMARY ...........................................................................................................................................1 2. THE PAPUA CONTEXT: HISTORY, ECONOMY AND POVERTY .......................................................................5
2.1 Historical Context ...........................................................................................................................................5 2.2 Decentralization & Special Autonomy.........................................................................................................6 2.3 Papua’s Economy............................................................................................................................................7 2.4 Poverty ..............................................................................................................................................................8 2.5 Prices .............................................................................................................................................................. 10 2.6 Selected Case Study Sites – Characteristics .............................................................................................. 11
3. PLANNING, BUDGETING AND FINANCIAL MANAGEMENT........................................................................ 13 3.1 Planning ......................................................................................................................................................... 13 3.2 Budgeting ....................................................................................................................................................... 14 3.3 The New Budget Format ............................................................................................................................ 15 3.4 Budget Reporting and Audit....................................................................................................................... 16
4. REVENUE AND FINANCING .............................................................................................................................. 19 4.1 Revenue.......................................................................................................................................................... 19
4.1.1 The General Allocation Grant (DAU)............................................................................................ 21 4.1.2 The Special Autonomy Fund (Dana Otsus)................................................................................... 21 4.1.3 Revenue from Natural Resources .................................................................................................... 25 4.1.4 Issues in Own-Source Revenue Mobilization................................................................................ 29
4.2 Financing........................................................................................................................................................ 30 4.3 Recommendations........................................................................................................................................ 32
5. EXPENDITURES .................................................................................................................................................... 35 5.1 Routine and Development Expenditures ................................................................................................. 35 5.2 Development Spending in Papua .............................................................................................................. 37 5.3 Special Autonomy Fund.............................................................................................................................. 40 5.4 Recommendations........................................................................................................................................ 43
6. SECTORAL ANALYSIS........................................................................................................................................... 45 6.1 Health ............................................................................................................................................................. 45
6.1.1 The Health Sector in Papua.............................................................................................................. 45 6.1.2 Spending on Health............................................................................................................................ 47
6.2 Education....................................................................................................................................................... 50 6.2.1 The Education Sector in Papua........................................................................................................ 50 6.2.2 Spending on Education ..................................................................................................................... 52
6.3 Infrastructure................................................................................................................................................. 54 6.3.1 The State of Infrastructure in Papua ............................................................................................... 54 6.3.2 Spending on Infrastructure ............................................................................................................... 55
6.4 Recommendations........................................................................................................................................ 57 7. ADMINISTRATION AND CIVIL SERVICE ........................................................................................................... 59
7.1 Administrative Structures............................................................................................................................ 59 7.2 Civil Service ................................................................................................................................................... 60
8. ANNEX 1: HOW MANY PEOPLE ARE THERE IN PAPUA? ............................................................................. 63 9. ANNEX 2: PAPUA PUBLIC EXPENDITURE ANALYSIS AND CAPACITY HARMONIZATION (PEACH)
PROGRAM .............................................................................................................................................................. 65 10. BIBLIOGRAPHY ..................................................................................................................................................... 74
Regional Finance and Service Delivery in Indonesia’s most Remote Region ________________________________________________________________________________________
x
FIGURES Figure 1.1: Papua's Per Capita Revenue, 1999-2002 (Rp.) ........................................................................................... 1 Figure 1.2: Dana Otsus Substitutes Regular Development Spending ........................................................................ 3 Figure 2.1: The structure of Papua’s Economy did not change much between 1975 and 2002............................ 8 Figure 2.2: Real GRDP Growth, 1991-2002 .................................................................................................................. 8 Figure 2.3: Papua has the highest level of poverty (2003)............................................................................................ 9 Figure 2.4: Poverty Headcount in Papua’s Local Governments, 2003 ...................................................................... 9 Figure 2.5: Food Consumption of the Poor................................................................................................................. 10 Figure 2.6: Papua is the most expensive province....................................................................................................... 11 Figure 2.7: Large price differences within Papua......................................................................................................... 11 Figure 4.1: Papua's Real PC Revenue Doubled Between 1996 and 2002................................................................ 19 Figure 4.2: In Papua, fiscal inequality is high ............................................................................................................... 20 Figure 4.3: Per Capita DAU allocations (2005)............................................................................................................ 21 Figure 4.4: Distribution of Dana Otsus, 2002-03 and 2004....................................................................................... 23 Figure 5.1: ... while increasing unspecified expenses................................................................................................... 36 Figure 5.2: More Spending on Routine…..................................................................................................................... 36 Figure 5.3: Papua's Infrastructure Spending 2003 ....................................................................................................... 37 Figure 5.4: Development Spending on Infrastructure, Government Apparatus,................................................... 39 Figure 5.5: High Development Spending Per Capita, 2003 ....................................................................................... 39 Figure 5.6: Papua's Development Spending With and Without Special Autonomy Fund ................................... 40 Figure 5.7: Routine Share in non-earmarked APBD has increased .......................................................................... 41 Figure 5.8: How Kab. Sorong spends its Dana Otsus* .............................................................................................. 42 Figure 6.12: Development of Good Quality Roads (1999-2002).............................................................................. 55 Figure 7.1: Civil Servants per 1,000 inhabitants by province (2003) ........................................................................ 60 Figure 7.2: Papua has a higher wage bill relative to civil servants… ........................................................................ 62 Figure 7.3:... even when higher prices are taken into account ................................................................................... 62 TABLES Table 2.1: Key Indicators For Case Study Locations.................................................................................................. 12 Table 3.1: Changes in Key Regional Planning Documents........................................................................................ 13 Table 3.2: Regional Government Budget Process*..................................................................................................... 14 Table 3.3: Comparison of Old and New Budget Formats ......................................................................................... 16 Table 4.1: Papua Revenue by Source, 2003 (billion Rp.)............................................................................................ 20 Table 4.3: Delays in Disbursement of Dana Otsus 2003, Province to Kab/Kota ................................................ 22 Table 4.2: Distribution of Dana Otsus.......................................................................................................................... 22 Table 4.4: 2004 Allocations to Kab/Kota .................................................................................................................... 23 Table 4.5: Dana Otsus Formula, 2004........................................................................................................................... 24 Table 4.6: Inequality Measures of PC Revenue............................................................................................................ 24 Table 4.7: Natural Resource Revenue, 2003 (billion Rp.) .......................................................................................... 25 Table 4.8: Natural Resource Revenue Sharing ............................................................................................................. 26 Table 4.9: Simulation of Future Revenue from BP Tangguh (billion Rp.).............................................................. 27 Table 4.10: Largest Provincial Taxes and Charges in Papua, 2003 (billion Rp.)..................................................... 29 Table 4.11: Kab/Kota Own Source Revenue in Papua, 2003 (billion Rp.) ............................................................ 29 Table 4.12: Largest Kab/Kota Taxes and Charges in Papua, 2003 (billion Rp.)....................................................29 Table 4.13: Items to be reported as Financing (Pembiayaan) ...................................................................................... 30 Table 4.14: Surplus in Papua, 2001-2003 (billion Rp.)................................................................................................ 31 Table 4.15: Regional Borrowing in Papua, 2001 (billion Rp.) ................................................................................... 32
Papua Public Expenditure Analysis | Overview Report _________________________________________________________________________________________
xi
Table 4.16: Financing in Case Study Locations, 2004 (billion Rp.) .......................................................................... 32 Table 5.1: Papua Sub-National Expenditures (billion Rp.)........................................................................................ 35 Table 5.2: Budgeted vs. Actual Spending ..................................................................................................................... 36 Table 5.3: Papua's Sub-National Development Spending by Sector (billion Rp.) ................................................. 38 Table 5.4: Dana Otsus by Sector, 2003 (billion Rp.) .................................................................................................. 41 Table 5.5: Kota Jayapura Special Autonomy Fund (billion Rp.)............................................................................... 42 Table 6.1: Papua's Per Capita Health Spending is Higher Than Elsewhere ........................................................... 48 Table 6.2: Health Expenditures in Papua, 2001-03 (billion Rp.) .............................................................................. 49 Table 6.3: Health Spending in Case Study Locations, 2004* .................................................................................... 49 Table 6.4: Per Capita Spending on Education is High ............................................................................................... 53 Table 6.5: Education Expenditures in Papua, 2001-03 .............................................................................................. 53 Table 6.6: Papua's per capita spending on infrastructure is higher than elsewhere ............................................... 55 Table 6.7: Share of spending on road development ................................................................................................... 56 Table 6.8: Infrastructure Expenditure in Papua, 2001-03 (billion Rp.) ................................................................... 56 Table 6.9: Eleven Strategic Road Networks Funded by Dana Otsus ...................................................................... 57 Table 7.1: Average population, area and population density per kab/kota ............................................................ 59 Table 7.2: Respect for Institutions................................................................................................................................. 60 Table 7.3: Civil Service in Papua.................................................................................................................................... 61 Table 7.4: Regional Civil Service, Comparison of Census with Case Study Data.................................................. 61 Table 8.1: BPS Population Data for Papua, 2003 ....................................................................................................... 64 BOXES Box 2.2: The Challenge of Defining Poverty............................................................................................................... 10 Box 4.1: Future Windfalls from BP Tangguh.............................................................................................................. 27 Box 4.2: Own Source Revenue Mobilization in Pegunungan Bintang .................................................................... 30 Box 5.1: Dana Otsus for PILKADA?........................................................................................................................... 42 Box 6.1: Spread of HIV/AIDS in Papua ..................................................................................................................... 47 Box 6.2: Floating Puskesmas in Biak Numfor ............................................................................................................... 48 Box 6.3: Higher Education ............................................................................................................................................. 52 Box 6.4: How to get to the Highlands .......................................................................................................................... 54

Regional Finance and Service Delivery in Indonesia’s most Remote Region ________________________________________________________________________________________
xii

Papua Public Expenditure Analysis | Overview Report _________________________________________________________________________________________
1
1. EXECUTIVE SUMMARY The region of Papua occupies a special place in Indonesia. It is the country’s easternmost, largest and most sparsely populated region. Ever since its integration into Indonesia in 1969 Papua has been troubled by separatist movements and social unrest. Following Indonesia’s transition towards democracy and decentralization in the late 1990s, the Special Autonomy Law for Papua was passed in 2001. This was aimed at solving the ongoing conflict and accelerating the economic development of the region.
The special autonomy status carried with it an increased flow of resources to Papua. While this boost in fiscal resources is important in helping Papua “catch up”, more attention needs to be paid to the quality and efficiency of public expenditure management. As history shows, economic growth and fiscal wealth alone will not be enough to reduce poverty and boost development outcomes in Papua. The region has experienced an average annual GDP growth of close to ten percent for the last fifteen years, and has had a substantial amount of revenues to spend. This stands in stark contrast to Papua’s consistent underperformance in fighting poverty and raising human development outcomes: forty percent of Papuans still live below the poverty line, more than double the national average. One third of Papua’s children do not go to school. Nine out of ten villages do not have basic health services with a health center, doctor or midwife.
Revenues Papua’s fiscal position will remain strong for the foreseeable future. Even before decentralization and special autonomy, Papua was the second richest province in fiscal terms. After decentralization in 2001, Papua’s per capita revenues doubled in real terms1 (Figure 1.1). The recent revenue windfall is due to the large allocations from the General Allocation Fund (DAU) and a Special Autonomy Fund (Dana Otsus) that Papua is entitled to receive under Law 21/2001. Recent large-scale investment in the natural resource sector will further boost the region’s income. It is, however, important to keep in mind that revenues will start falling in 2021, when the Special Autonomy Fund will expire, and again in 2026, when Papua’s shares from oil and gas revenues will be reduced.
1 Even adjusted for higher relative prices, Papua is still the second richest province in the country.
Figure 1.1: Papua's Per Capita Revenue, 1999-2002 (Rp.)
0 200,000 400,000 600,000 800,000
1999
2001
2002Ow n Source revenue
Shared Revenue NaturalResources
Shared Revenue Taxes
Grants (DAU+DAK)
Special Autonomy Fund
Note: Numbers are real figures based on 1996 prices and include local and provincial APBD. Source: SIKD/MoF
Regional Finance and Service Delivery in Indonesia’s most Remote Region ________________________________________________________________________________________
2
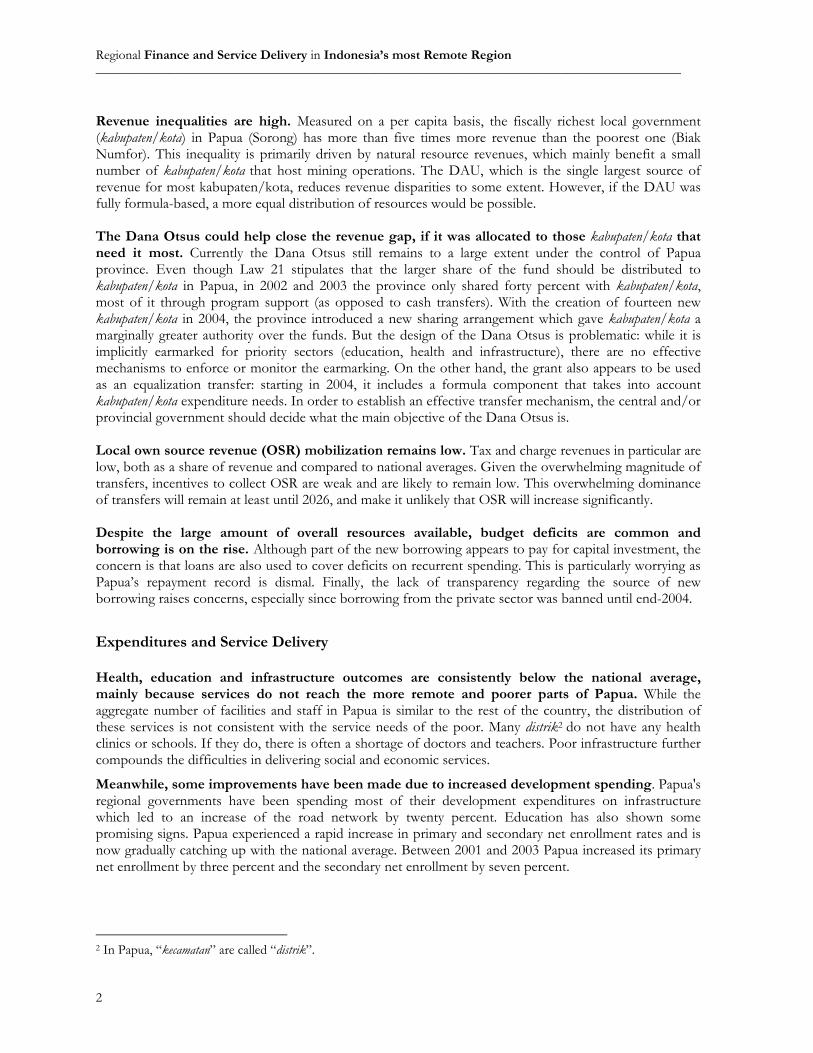
Revenue inequalities are high. Measured on a per capita basis, the fiscally richest local government (kabupaten/kota) in Papua (Sorong) has more than five times more revenue than the poorest one (Biak Numfor). This inequality is primarily driven by natural resource revenues, which mainly benefit a small number of kabupaten/kota that host mining operations. The DAU, which is the single largest source of revenue for most kabupaten/kota, reduces revenue disparities to some extent. However, if the DAU was fully formula-based, a more equal distribution of resources would be possible. The Dana Otsus could help close the revenue gap, if it was allocated to those kabupaten/kota that need it most. Currently the Dana Otsus still remains to a large extent under the control of Papua province. Even though Law 21 stipulates that the larger share of the fund should be distributed to kabupaten/kota in Papua, in 2002 and 2003 the province only shared forty percent with kabupaten/kota, most of it through program support (as opposed to cash transfers). With the creation of fourteen new kabupaten/kota in 2004, the province introduced a new sharing arrangement which gave kabupaten/kota a marginally greater authority over the funds. But the design of the Dana Otsus is problematic: while it is implicitly earmarked for priority sectors (education, health and infrastructure), there are no effective mechanisms to enforce or monitor the earmarking. On the other hand, the grant also appears to be used as an equalization transfer: starting in 2004, it includes a formula component that takes into account kabupaten/kota expenditure needs. In order to establish an effective transfer mechanism, the central and/or provincial government should decide what the main objective of the Dana Otsus is. Local own source revenue (OSR) mobilization remains low. Tax and charge revenues in particular are low, both as a share of revenue and compared to national averages. Given the overwhelming magnitude of transfers, incentives to collect OSR are weak and are likely to remain low. This overwhelming dominance of transfers will remain at least until 2026, and make it unlikely that OSR will increase significantly. Despite the large amount of overall resources available, budget deficits are common and borrowing is on the rise. Although part of the new borrowing appears to pay for capital investment, the concern is that loans are also used to cover deficits on recurrent spending. This is particularly worrying as Papua’s repayment record is dismal. Finally, the lack of transparency regarding the source of new borrowing raises concerns, especially since borrowing from the private sector was banned until end-2004.
Expenditures and Service Delivery Health, education and infrastructure outcomes are consistently below the national average, mainly because services do not reach the more remote and poorer parts of Papua. While the aggregate number of facilities and staff in Papua is similar to the rest of the country, the distribution of these services is not consistent with the service needs of the poor. Many distrik2 do not have any health clinics or schools. If they do, there is often a shortage of doctors and teachers. Poor infrastructure further compounds the difficulties in delivering social and economic services.
Meanwhile, some improvements have been made due to increased development spending. Papua's regional governments have been spending most of their development expenditures on infrastructure which led to an increase of the road network by twenty percent. Education has also shown some promising signs. Papua experienced a rapid increase in primary and secondary net enrollment rates and is now gradually catching up with the national average. Between 2001 and 2003 Papua increased its primary net enrollment by three percent and the secondary net enrollment by seven percent.
2 In Papua, “kecamatan” are called “distrik”.

Papua Public Expenditure Analysis | Overview Report _________________________________________________________________________________________
3
Development spending has been boosted by the Dana Otsus. Development spending more than tripled in real terms between 1999 and 2003, largely due to the introduction of the Special Autonomy Fund in 2002. Per capita development spending in Papua is now among the highest in the country. However, development spending from the non-earmarked local budgetary funds (APBD net of Dana Otsus) has decreased since 2002, suggesting that the Dana Otsus has partially substituted, instead of complemented, a large amount of regular development spending (Figure 1.2).
Expenditure priorities have, however, hardly changed. The Special Autonomy Law and provincial regulations prioritize education, health and infrastructure but spending has increased in all sectors so that relative priorities have remained almost the same. Infrastructure still tops the spending list, followed by government apparatus and education. At the same time, spending on health and education has become more important in recent years. The bulk of local spending is allocated to routine expenditures, with unspecified routine spending increasing disproportionately. The shares of routine and capital expenditures have broadly remained constant, even after the introduction of the Dana Otsus in 2002. This is not surprising as the increased spending on capital investment should be accompanied by adequate routine spending. However, the composition of routine spending appears to be problematic. Although personnel expenses still represent the single largest component of routine spending, their shares relative to other routine spending have declined since decentralization. This decline has been accompanied by a disproportionate increase in “unspecified” expenditures. Such a large increase in unspecified expenditures could increase the probability of misallocation and misuse of funds.
Summary of Key Recommendations The provincial and local governments could take a number of measures that would help improve revenue and expenditure management in the short- to medium term:
Figure 1.2: Dana Otsus Substitutes Regular Development Spending
Province (billion Rp.)
0
100
200
300
400
500
600
1996 1997 1998 1999 2001 2002 2003
Kabupaten/Kota (billion Rp.)
0
100
200
300
400
500
600
1996 1997 1998 1999 2001 2002 2003
TotalDevelopmentw ith otsus
TotalDevelopmentw ithout otsus
Source: Authors calculation based on SIKD/MoF. Data in real terms using 1996 base price.

Regional Finance and Service Delivery in Indonesia’s most Remote Region ________________________________________________________________________________________
4
Revenue & Financing
• Transfer control over the majority of Dana Otsus funds to the kabupaten/kota level. Local governments are responsible for the majority of basic public services, especially in health and education. In the case of newly established kabupaten, which may still lack capacity and institutional infrastructure, the province should provide a commitment to gradually increase the share of locally managed funds.
• Clarify the main purpose of the Dana Otsus. If its purpose is to equalize fiscal resources among kabupaten/kota in Papua, then the formula component needs to be strengthened. If the main objective is to earmark the funds for priority sectors, an enforcement mechanism needs to be put into place.
• Clarify the revenue sharing arrangements. It is not clear how the Dana Otsus and the natural resource revenue shares will be distributed among the two existing provinces and the kabupaten/kota in their jurisdiction. Once the Papua People’s Council (Majelis Rakyat Papua, MRP) is established, this should be one of the priorities to prevent conflict over resources.
Expenditures
• Decentralize more spending authority to kabupaten/kota. Provincial and kabupaten/kota spending overlaps significantly, particularly in health and education, and needs to be streamlined. The province could transfer responsibility for most of these expenditures to kabupaten/kota and play a more supervisory and/or coordinating role as envisaged by Law 32/2004.
• Ensure that long-term investments have priority over short-term financing needs, especially for the Dana Otsus spending. Three priority sectors have already been identified. The provincial and kabupaten/kota governments now have to commit to increase capital investment in these sectors, and match this with adequate recurrent spending.
Planning, Budgeting and Financial Management
• Create a simple kabupaten-based database to inform planning decisions. Such a database could include socio-economic and other indicators based on existing BPS survey and census data.
• Improve coordination between the provincial and kabupaten/kota governments at the planning stage. A better coordination mechanism is needed to avoid overlap of programs, especially those financed by the Dana Otsus.
Some problems have to be tackled at higher levels of government. The central government should therefore consider taking the following measures:
• Ensure that the Dana Otsus and revenue shares from natural resources are disbursed as planned. Delays in central government transfers have a negative impact on the effectiveness of budget execution. The central government has imposed a quarterly reporting requirement on the use of the Dana Otsus which is separate from overall budget reporting and has contributed to the delays.
• Clarify the legal status of the splitting of the region. The central government’s ambiguous messages regarding the splitting of the province have caused much confusion and uncertainty, not least over the level of revenues regional governments will receive.
Papua Public Expenditure Analysis | Overview Report _________________________________________________________________________________________
5
2. THE PAPUA CONTEXT: HISTORY, ECONOMY AND POVERTY 2.1 Historical Context Papua, Indonesia’s largest and easternmost province, covers the western part of the island of New Guinea. Papua is extremely rich in mineral, forest and marine resources and almost seventy-five percent of its 422,981 km2 is still covered by primary forest. Papua occupies twenty-two percent of Indonesia’s land mass. Papua’s original inhabitants are Melanesians, and ethnically, culturally and socially, are very different from the Malays of Western Indonesia. With 312 distinct ethnic groups and over 250 mapped languages, Papua is one of the most culturally and linguistically diverse areas of the world.3 In 2003, Papua had 2.4 million residents, or one percent of Indonesia’s total population, and a density of six persons per km2.4 In 1545 the name Papua was used for the first time on a map after the Inigo Ortiz de Retez expedition to search for spices in the Moluccas. On 17 March 1824, through the Treaty of London, the kingdoms of England and the Netherlands agreed to split the island of New Guinea into two, handing West New Guinea to the Netherlands. Papua was known as Nederlandsch Nieuw Guinea until October 1962, then placed under the control of the United Nations Temporary Executive Authority (UNTEA) and renamed Irian Barat. On 1 May 1963 the territory was transferred to Indonesia. In November 1963, the UN Fund for West Irian (FUNDWI) was established to assist the Indonesian government in accelerating the development of Irian Barat. In 1969, resistance to Indonesian rule and pressure from the international community led Indonesia to conduct a referendum on Papuan independence. In the "Act of Free Choice" (Penentuan Pendapat Rakyat-Pepera) Papua representatives chose integration with Indonesia. The “Act of Free Choice” remains controversial, however, due to acts of violence, intimidation and violation of rights which occurred during the referendum.5 After the referendum, the region of Irian Barat officially became a part of the Republic of Indonesia, and in 1973 the name was changed to Irian Jaya. Along with this change, the Government of Indonesia accelerated development activities, although the development was very slow and mostly concentrated in the northern coastal areas. The name, Papua, was used again after the enactment of the law on special autonomy for Papua Province in 2001. As in Aceh, there continues to be an independence movement in modern day Papua. Violence and political exclusion of the ethnic population are an integral part of the political history of this region, and the desire for independence thus remains a major issue. 3 Statement of the Head of the Papuan Central Statistics Center, 13 July 2002. (http://www.lin.go.id/detail.asp?idartcl=260702BcOT0001&by=wilayah). 4 Based on data from central BPS 2003. 5 See Richard Chauvel (2005), p.35 and Richard Chauvel and Ikrar Nusa Bhakti (2004), p. 19-21. The Supreme Court decree of the Republic of Indonesia No.0018/PUU-I/2004 (p.10-17) notes the difference in perspective and conflict surrounding the integration of the region of Papua into the Republic of Indonesia. This decree also notes several violations of the New York Agreement which became the basis for the Act of Free Choice (including violations of the principle of one man one vote and the void in representation of native Papuans in the New York Agreement) compounded with violence and intimidation toward native Papuans during the implementation of the Act of Free Choice.
Regional Finance and Service Delivery in Indonesia’s most Remote Region ________________________________________________________________________________________
6
2.2 Decentralization & Special Autonomy Following the completion of the Act of Free Choice, the central government issued Law 12/1969, which formally incorporated Papua into the national administrative structure by establishing the provincial as well as the nine kabupaten/kota governments and stipulating their functions and responsibilities. These regional governments were branches of the central government and had very little decision-making authority. In Papua, most of the civil servants running the regional governments were brought in from outside the province. Despite earlier attempts to decentralize government administrative functions, most notably in the mid-1970s, decentralization reforms were not introduced until 1999. An essential part of the democratic reforms following the fall of Suharto, Law 22/1999 introduced the concept of “regional autonomy”, a new decentralized governance structure that removed the hierarchy between provinces and kabupaten/kota governments. Provincial governors, in addition to being the head of the province, also continued to act as the central government’s representative in the regions, a role which puts the province in a somewhat ambiguous position. The recently enacted revision of Law 22 (Law 32/2004) in fact strengthened this role of the province further and now authorizes the governor to, for instance, review local government budgets before they can be implemented. Regional autonomy alone did not solve the latent conflicts and calls for independence in Aceh and Papua. The results of a study conducted by the Forum of Papuan civil society organizations found that the root of the problem is the collective dissatisfaction with the history of the integration of Papua into the Republic of Indonesia, a different cultural identity from the rest of Indonesia, and a perceived pattern of injustice.6 Given the intense conflict and demands for independence in Papua, the MPR (Majelis Permusyawaratan Rakyat) or People's Consultative Assembly of the Republic of Indonesia instructed the government to grant special autonomy status to Papua. A group of Papuan politicians and academics drafted the special autonomy law of Papua, which was strongly resisted by those parts of society that did not want to compromise the demand for independence. Law No.21/2001 regarding special autonomy for Papua Province represents an attempt by the Government of Indonesia to provide a solution to a number of crucial problems in Papua. These problems include: 1) political conflict, focused on the issue of Papuan demands for independence that is viewed by the Indonesian Government as a separatist movement, 2) social conflict between Papuans as a result of the lack of solutions to overcome the political conflict, and 3) the poor economic situation, particularly of native Papuans, compared to other regions in Indonesia.7 Papua's special autonomy law thus granted the province a greater level of authority in financial, political, and social matters (Box 2.1). Law 21 places more importance at the provincial level, which stands in contrast to Law 22, which focuses on the kabupaten/kota level.
6 Tim Forum Kerjasama LSM Papua (October 2000). See also the decision of the Supreme Court of the Republic of Indonesia No.018/PUU-I/2003 (pp.19-22). 7 See the Report of the Workshop on the Evaluation of the First Year of Implementation of Special Autonomy in Papua, sponsored by the Institute for Civil Society Strengthening (ICS) Papua, Jayapura 8-10 May 2003 in the book, Special Autonomy in Papua: Reflection on the Incident of 21 November 2001 through 23 December 2004, Institute for Civil Society, Strengthening Papua supported by the Partnership for Governance Reform in Indonesia, Jayapura (2005:11).
Papua Public Expenditure Analysis | Overview Report _________________________________________________________________________________________
7
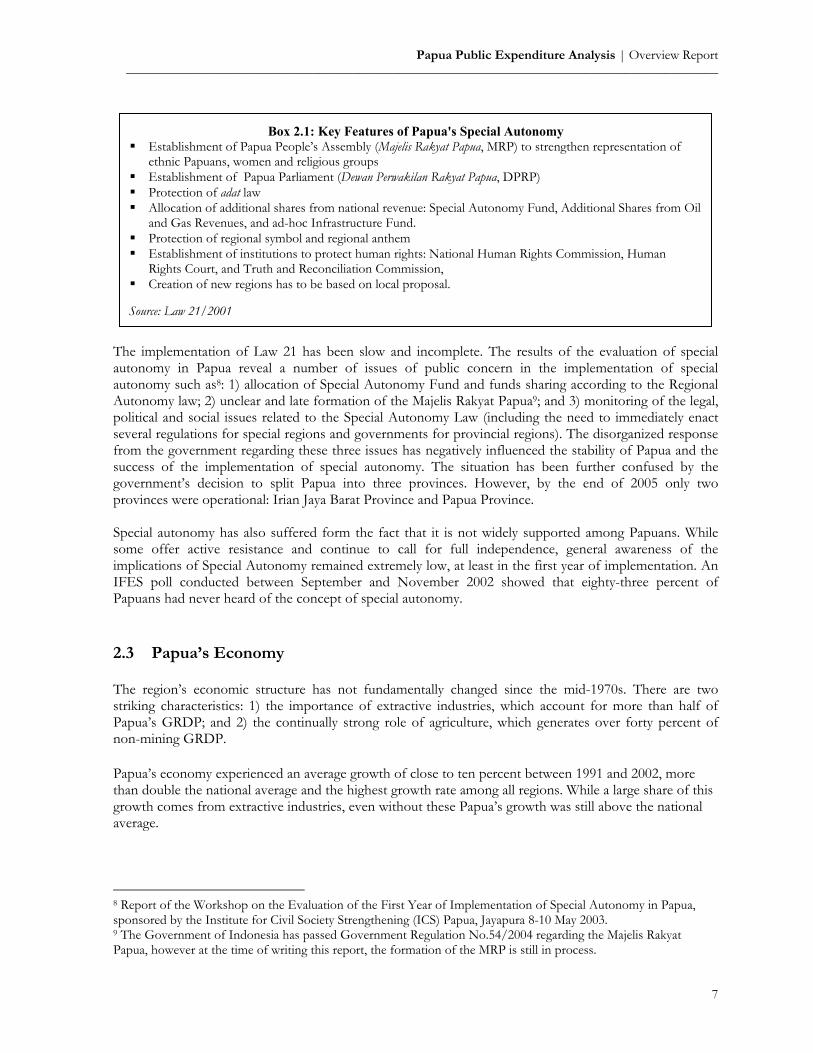
The implementation of Law 21 has been slow and incomplete. The results of the evaluation of special autonomy in Papua reveal a number of issues of public concern in the implementation of special autonomy such as8: 1) allocation of Special Autonomy Fund and funds sharing according to the Regional Autonomy law; 2) unclear and late formation of the Majelis Rakyat Papua9; and 3) monitoring of the legal, political and social issues related to the Special Autonomy Law (including the need to immediately enact several regulations for special regions and governments for provincial regions). The disorganized response from the government regarding these three issues has negatively influenced the stability of Papua and the success of the implementation of special autonomy. The situation has been further confused by the government’s decision to split Papua into three provinces. However, by the end of 2005 only two provinces were operational: Irian Jaya Barat Province and Papua Province. Special autonomy has also suffered form the fact that it is not widely supported among Papuans. While some offer active resistance and continue to call for full independence, general awareness of the implications of Special Autonomy remained extremely low, at least in the first year of implementation. An IFES poll conducted between September and November 2002 showed that eighty-three percent of Papuans had never heard of the concept of special autonomy. 2.3 Papua’s Economy The region’s economic structure has not fundamentally changed since the mid-1970s. There are two striking characteristics: 1) the importance of extractive industries, which account for more than half of Papua’s GRDP; and 2) the continually strong role of agriculture, which generates over forty percent of non-mining GRDP. Papua’s economy experienced an average growth of close to ten percent between 1991 and 2002, more than double the national average and the highest growth rate among all regions. While a large share of this growth comes from extractive industries, even without these Papua’s growth was still above the national average.
8 Report of the Workshop on the Evaluation of the First Year of Implementation of Special Autonomy in Papua, sponsored by the Institute for Civil Society Strengthening (ICS) Papua, Jayapura 8-10 May 2003. 9 The Government of Indonesia has passed Government Regulation No.54/2004 regarding the Majelis Rakyat Papua, however at the time of writing this report, the formation of the MRP is still in process.
Box 2.1: Key Features of Papua's Special Autonomy Establishment of Papua People’s Assembly (Majelis Rakyat Papua, MRP) to strengthen representation of
ethnic Papuans, women and religious groups Establishment of Papua Parliament (Dewan Perwakilan Rakyat Papua, DPRP) Protection of adat law Allocation of additional shares from national revenue: Special Autonomy Fund, Additional Shares from Oil
and Gas Revenues, and ad-hoc Infrastructure Fund. Protection of regional symbol and regional anthem Establishment of institutions to protect human rights: National Human Rights Commission, Human
Rights Court, and Truth and Reconciliation Commission, Creation of new regions has to be based on local proposal.
Source: Law 21/2001
Regional Finance and Service Delivery in Indonesia’s most Remote Region ________________________________________________________________________________________
8
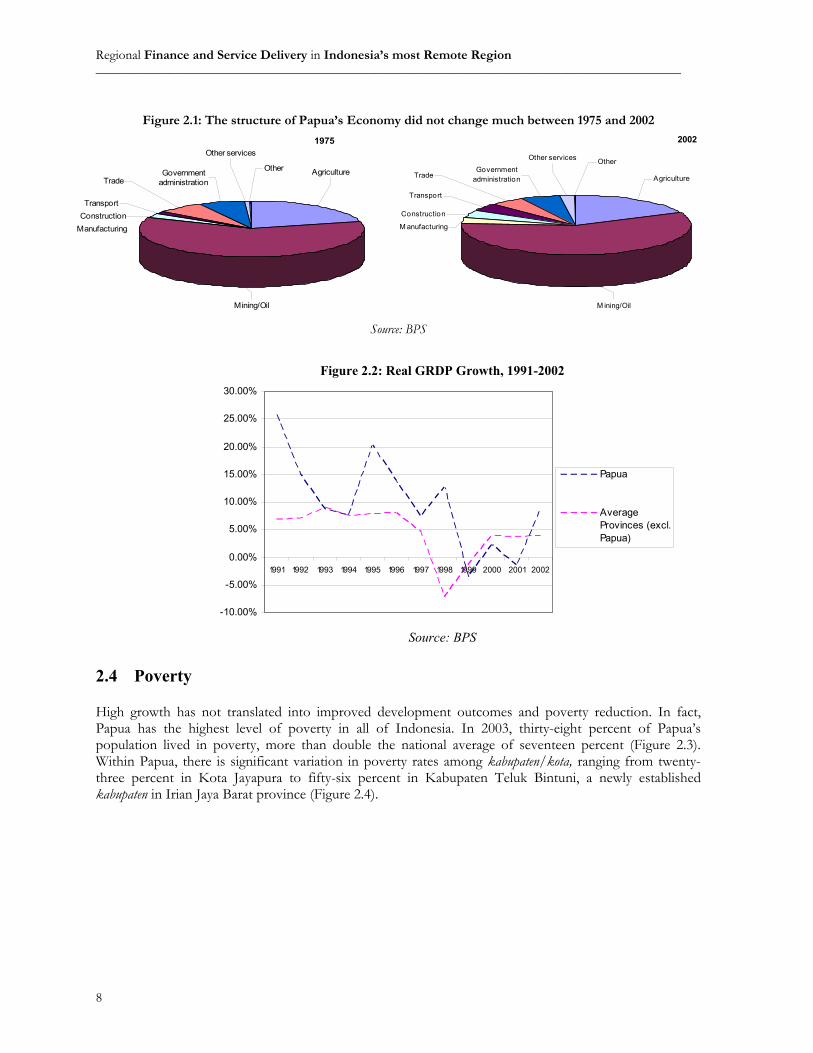
2.4 Poverty High growth has not translated into improved development outcomes and poverty reduction. In fact, Papua has the highest level of poverty in all of Indonesia. In 2003, thirty-eight percent of Papua’s population lived in poverty, more than double the national average of seventeen percent (Figure 2.3). Within Papua, there is significant variation in poverty rates among kabupaten/kota, ranging from twenty-three percent in Kota Jayapura to fifty-six percent in Kabupaten Teluk Bintuni, a newly established kabupaten in Irian Jaya Barat province (Figure 2.4).
Figure 2.1: The structure of Papua’s Economy did not change much between 1975 and 2002
1975Other services
OtherGovernment administrationTrade
TransportConstruction
Manufacturing
Mining/Oil
Agriculture
2002
Government administration
Other services Other
Trade
Transport
Construction
M anufacturing
Agriculture
M ining/Oil
Source: BPS
Figure 2.2: Real GRDP Growth, 1991-2002
-10.00%
-5.00%
0.00%
5.00%
10.00%
15.00%
20.00%
25.00%
30.00%
1991 1992 1993 1994 1995 1996 1997 1998 1999 2000 2001 2002
Papua
AverageProvinces (excl.Papua)
Source: BPS

Papua Public Expenditure Analysis | Overview Report _________________________________________________________________________________________
9
Figure 2.4: Poverty Headcount in Papua’s Local Governments, 2003
Source: BPS
Figure 2.3: Papua has the highest level of poverty (2003)
0%
5%
10%
15%
20%
25%
30%
35%
40%
45%
DKI
Jak
arta
Bali
Kals
elBa
nten
Sulu
tBa
ngka
Kalte
ngSu
mba
rKa
ltim Ria
uJa
bar
Mal
utJa
mbi
Kalb
arSu
lsel
Sum
utYo
gyak
arta
Jatim
Sum
sel
Jate
ngSu
lteng
Sultr
aLa
mpu
ngBe
ngku
luN
TB NTT
Aceh
Gor
onta
loM
aluk
uPa
pua
Province
poverty headcount
nat ional average
Source: BPS
Regional Finance and Service Delivery in Indonesia’s most Remote Region ________________________________________________________________________________________
10
The poverty figures compiled by the Central Bureau of Statistics (BPS) are, however, highly controversial in Papua. One set of complaints centers around problems in the implementation of the National Socio-Economic Survey (Susenas) which forms the basis for national and regional poverty figures. Other complaints refer to the way poverty numbers are calculated from the Susenas, which is often accused of not taking into account regional variations in food consumption (Box 2.2).
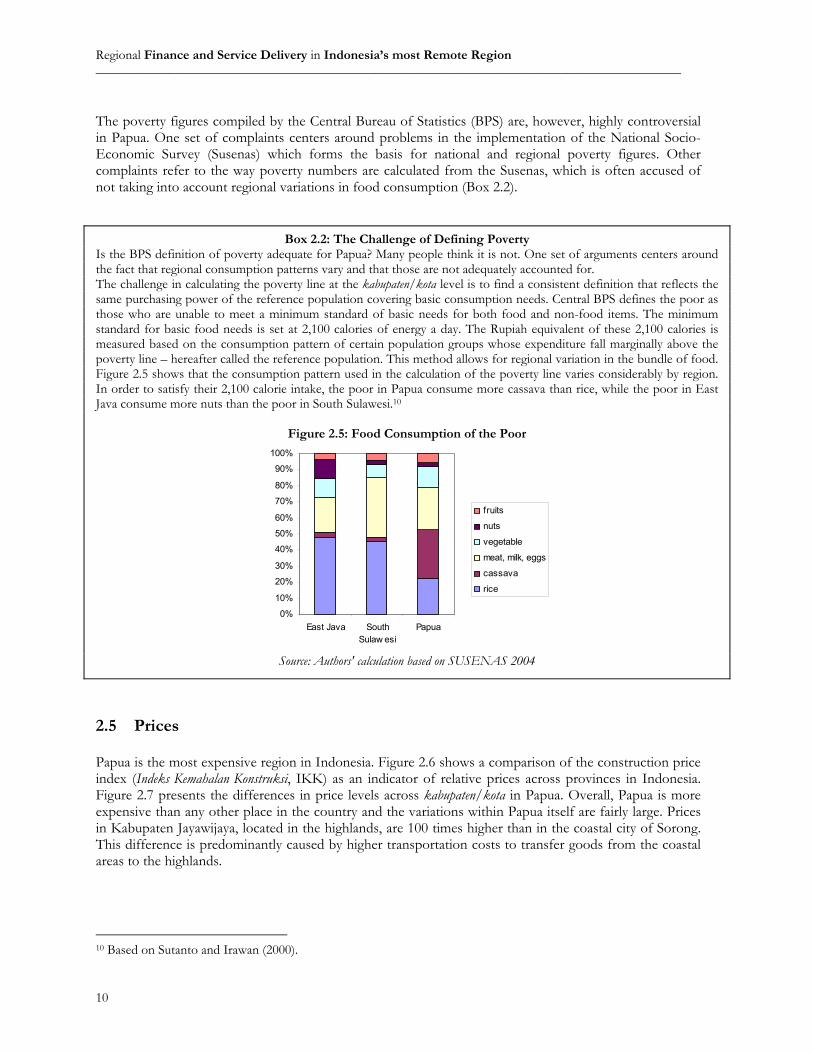
2.5 Prices Papua is the most expensive region in Indonesia. Figure 2.6 shows a comparison of the construction price index (Indeks Kemahalan Konstruksi, IKK) as an indicator of relative prices across provinces in Indonesia. Figure 2.7 presents the differences in price levels across kabupaten/kota in Papua. Overall, Papua is more expensive than any other place in the country and the variations within Papua itself are fairly large. Prices in Kabupaten Jayawijaya, located in the highlands, are 100 times higher than in the coastal city of Sorong. This difference is predominantly caused by higher transportation costs to transfer goods from the coastal areas to the highlands.
10 Based on Sutanto and Irawan (2000).
Box 2.2: The Challenge of Defining Poverty Is the BPS definition of poverty adequate for Papua? Many people think it is not. One set of arguments centers around the fact that regional consumption patterns vary and that those are not adequately accounted for. The challenge in calculating the poverty line at the kabupaten/kota level is to find a consistent definition that reflects the same purchasing power of the reference population covering basic consumption needs. Central BPS defines the poor as those who are unable to meet a minimum standard of basic needs for both food and non-food items. The minimum standard for basic food needs is set at 2,100 calories of energy a day. The Rupiah equivalent of these 2,100 calories is measured based on the consumption pattern of certain population groups whose expenditure fall marginally above the poverty line – hereafter called the reference population. This method allows for regional variation in the bundle of food. Figure 2.5 shows that the consumption pattern used in the calculation of the poverty line varies considerably by region. In order to satisfy their 2,100 calorie intake, the poor in Papua consume more cassava than rice, while the poor in East Java consume more nuts than the poor in South Sulawesi.10
Figure 2.5: Food Consumption of the Poor
0%
10%
20%
30%
40%
50%
60%
70%
80%
90%
100%
East Java SouthSulaw esi
Papua
fruits
nuts
vegetable
meat, milk, eggs
cassava
rice
Source: Authors' calculation based on SUSENAS 2004

Papua Public Expenditure Analysis | Overview Report _________________________________________________________________________________________
11
2.6 Selected Case Study Sites – Characteristics This report draws on case studies in four locations which were prepared by three local university teams. The four sites have very different economic, geographic, social and cultural profiles, and thus provide insights into different challenges faced by kabupaten/kota governments in Papua.
1. Kabupaten Biak Numfor is a densely populated coastal area, serving as one of the transportation hubs of Papua. Biak’s economy is dominated by the tertiary sector, including trade,
Figure 2.6: Papua is the most expensive province
0 20 40 60 80 100 120 140 160 180
PapuaMaluku
Maluku UtaraKalteng
NTTKaltim
SulutBabelRiau
KalbarKalsel
GorontaloSultra
SultengDKI
SulselNAD
JambiSumsel
NTBBengkuluLampung
SumutBali
SumbarBanten
JabarJatim
DIYJateng
IKK
Source: DAU 2005 basic data, MoF
Figure 2.7: Large price differences within Papua
0 50 100 150 200 250
Kab. Jayaw ijaya
Kab. PaniaiKab. Puncak Jaya
Kab. MeraukeKab. MimikaKab. Nabire
Kab. Biak NumforKab. Jayapura
Kab. Fak FakKab. Yapen Waropen
Kota JayapuraKab. Manokw ari
Kab. Sorong
Kota Sorong
IKK Source: DAU 2005 basic data, MoF
Regional Finance and Service Delivery in Indonesia’s most Remote Region ________________________________________________________________________________________
12
tourism, and transportation. Biak has one of the highest poverty rates in the province and is among the fiscally poorest kabupaten.
2. Kota Jayapura is the administrative and economic capital of Papua province and the biggest urban settlement in Papua. It has the lowest poverty rate and the highest non-mining GRDP per capita in the province.
3. Kabupaten Mimika has been the site of gold and copper mining for nearly four decades. Mimika continues to experience high population growth. Despite its natural resource revenue, in per capita fiscal terms Mimika is not one of the richest kabupaten in Papua.
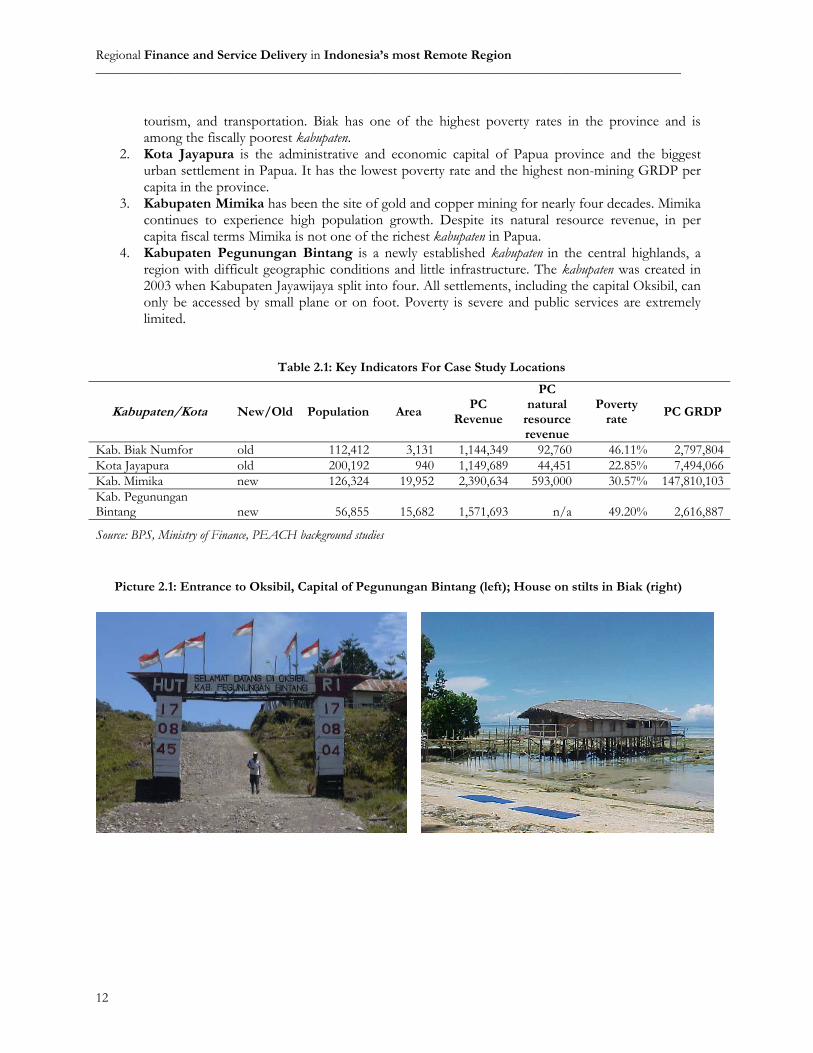
4. Kabupaten Pegunungan Bintang is a newly established kabupaten in the central highlands, a region with difficult geographic conditions and little infrastructure. The kabupaten was created in 2003 when Kabupaten Jayawijaya split into four. All settlements, including the capital Oksibil, can only be accessed by small plane or on foot. Poverty is severe and public services are extremely limited.
Picture 2.1: Entrance to Oksibil, Capital of Pegunungan Bintang (left); House on stilts in Biak (right)
Table 2.1: Key Indicators For Case Study Locations
Kabupaten/Kota New/Old Population Area PC
Revenue
PC natural
resource revenue
Poverty rate
PC GRDP
Kab. Biak Numfor old 112,412 3,131 1,144,349 92,760 46.11% 2,797,804Kota Jayapura old 200,192 940 1,149,689 44,451 22.85% 7,494,066Kab. Mimika new 126,324 19,952 2,390,634 593,000 30.57% 147,810,103Kab. Pegunungan Bintang new 56,855 15,682 1,571,693 n/a 49.20% 2,616,887
Source: BPS, Ministry of Finance, PEACH background studies
Papua Public Expenditure Analysis | Overview Report _________________________________________________________________________________________
13
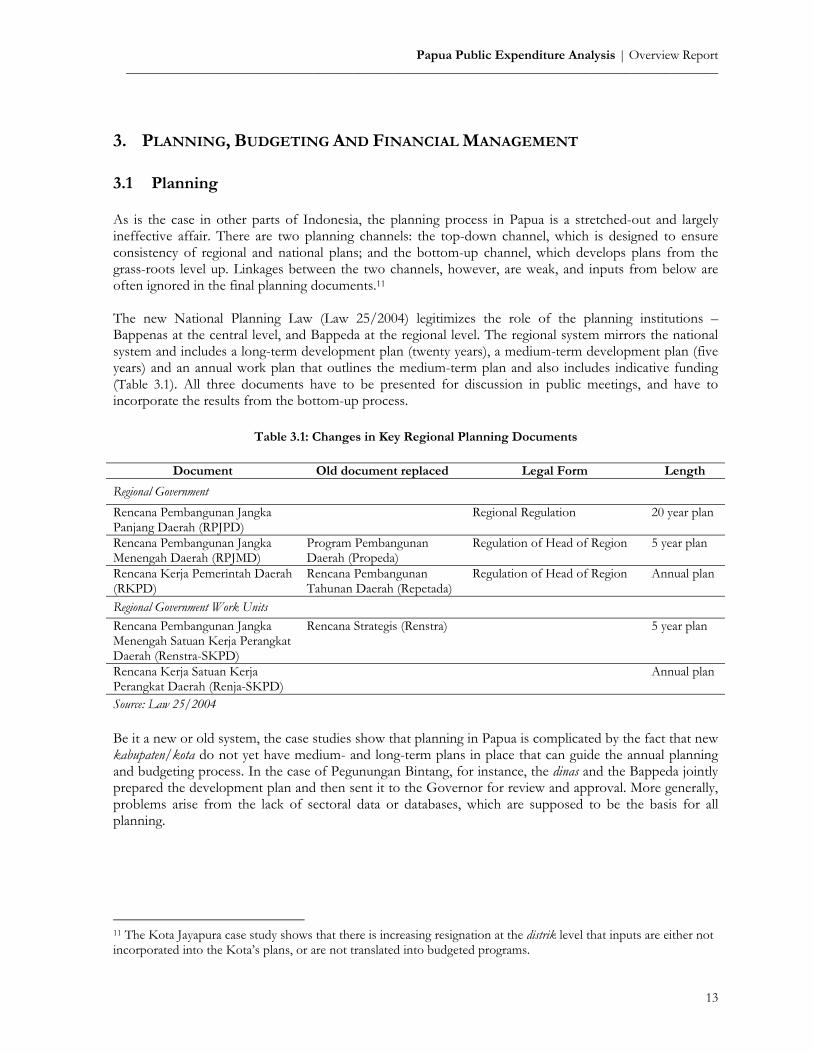
3. PLANNING, BUDGETING AND FINANCIAL MANAGEMENT 3.1 Planning As is the case in other parts of Indonesia, the planning process in Papua is a stretched-out and largely ineffective affair. There are two planning channels: the top-down channel, which is designed to ensure consistency of regional and national plans; and the bottom-up channel, which develops plans from the grass-roots level up. Linkages between the two channels, however, are weak, and inputs from below are often ignored in the final planning documents.11 The new National Planning Law (Law 25/2004) legitimizes the role of the planning institutions – Bappenas at the central level, and Bappeda at the regional level. The regional system mirrors the national system and includes a long-term development plan (twenty years), a medium-term development plan (five years) and an annual work plan that outlines the medium-term plan and also includes indicative funding (Table 3.1). All three documents have to be presented for discussion in public meetings, and have to incorporate the results from the bottom-up process.
Be it a new or old system, the case studies show that planning in Papua is complicated by the fact that new kabupaten/kota do not yet have medium- and long-term plans in place that can guide the annual planning and budgeting process. In the case of Pegunungan Bintang, for instance, the dinas and the Bappeda jointly prepared the development plan and then sent it to the Governor for review and approval. More generally, problems arise from the lack of sectoral data or databases, which are supposed to be the basis for all planning.
11 The Kota Jayapura case study shows that there is increasing resignation at the distrik level that inputs are either not incorporated into the Kota’s plans, or are not translated into budgeted programs.
Table 3.1: Changes in Key Regional Planning Documents
Document Old document replaced Legal Form Length
Regional Government Rencana Pembangunan Jangka Panjang Daerah (RPJPD)
Regional Regulation 20 year plan
Rencana Pembangunan Jangka Menengah Daerah (RPJMD)
Program Pembangunan Daerah (Propeda)
Regulation of Head of Region 5 year plan
Rencana Kerja Pemerintah Daerah (RKPD)
Rencana Pembangunan Tahunan Daerah (Repetada)
Regulation of Head of Region Annual plan
Regional Government Work Units Rencana Pembangunan Jangka Menengah Satuan Kerja Perangkat Daerah (Renstra-SKPD)
Rencana Strategis (Renstra) 5 year plan
Rencana Kerja Satuan Kerja Perangkat Daerah (Renja-SKPD)
Annual plan
Source: Law 25/2004
Regional Finance and Service Delivery in Indonesia’s most Remote Region ________________________________________________________________________________________
14
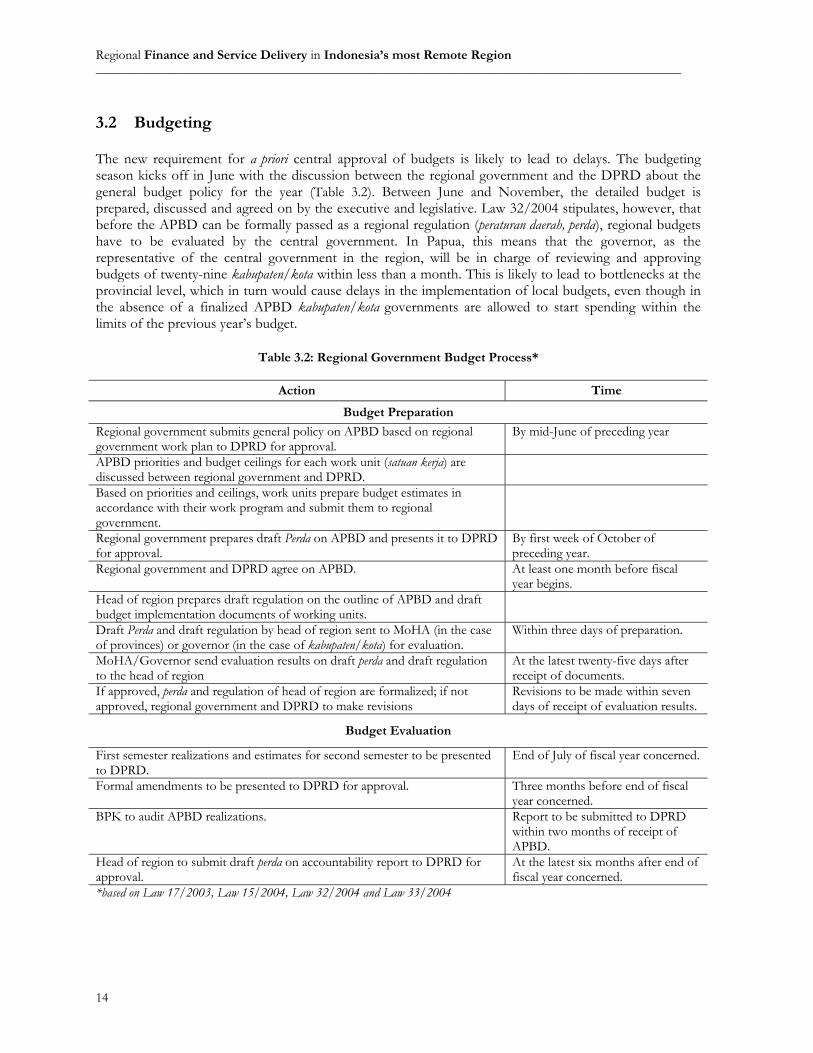
3.2 Budgeting The new requirement for a priori central approval of budgets is likely to lead to delays. The budgeting season kicks off in June with the discussion between the regional government and the DPRD about the general budget policy for the year (Table 3.2). Between June and November, the detailed budget is prepared, discussed and agreed on by the executive and legislative. Law 32/2004 stipulates, however, that before the APBD can be formally passed as a regional regulation (peraturan daerah, perda), regional budgets have to be evaluated by the central government. In Papua, this means that the governor, as the representative of the central government in the region, will be in charge of reviewing and approving budgets of twenty-nine kabupaten/kota within less than a month. This is likely to lead to bottlenecks at the provincial level, which in turn would cause delays in the implementation of local budgets, even though in the absence of a finalized APBD kabupaten/kota governments are allowed to start spending within the limits of the previous year’s budget.
Table 3.2: Regional Government Budget Process*
Action Time
Budget Preparation Regional government submits general policy on APBD based on regional government work plan to DPRD for approval.
By mid-June of preceding year
APBD priorities and budget ceilings for each work unit (satuan kerja) are discussed between regional government and DPRD.
Based on priorities and ceilings, work units prepare budget estimates in accordance with their work program and submit them to regional government.
Regional government prepares draft Perda on APBD and presents it to DPRD for approval.
By first week of October of preceding year.
Regional government and DPRD agree on APBD. At least one month before fiscal year begins.
Head of region prepares draft regulation on the outline of APBD and draft budget implementation documents of working units.
Draft Perda and draft regulation by head of region sent to MoHA (in the case of provinces) or governor (in the case of kabupaten/kota) for evaluation.
Within three days of preparation.
MoHA/Governor send evaluation results on draft perda and draft regulation to the head of region
At the latest twenty-five days after receipt of documents.
If approved, perda and regulation of head of region are formalized; if not approved, regional government and DPRD to make revisions
Revisions to be made within seven days of receipt of evaluation results.
Budget Evaluation
First semester realizations and estimates for second semester to be presented to DPRD.
End of July of fiscal year concerned.
Formal amendments to be presented to DPRD for approval. Three months before end of fiscal year concerned.
BPK to audit APBD realizations. Report to be submitted to DPRD within two months of receipt of APBD.
Head of region to submit draft perda on accountability report to DPRD for approval.
At the latest six months after end of fiscal year concerned.
*based on Law 17/2003, Law 15/2004, Law 32/2004 and Law 33/2004
Papua Public Expenditure Analysis | Overview Report _________________________________________________________________________________________
15
3.3 The New Budget Format The new budget format was not widely adopted in Papua until 2004. In addition to introducing the concept of performance-based budgeting, Ministry of Home Affairs Decree 29/2002 (Kepmen 29) changed the local government budget format. Only Kabupaten Fak-Fak and Kabupaten Yapen Waroepen used the new format in 2003; all other kabupaten/kota and the provincial government followed suit in 2004. The new budget format uses the concept of a unified budget and thus a move to a more integrated approach to expenditure management: from the split between routine and development to the distinction between expenditure on the government apparatus and expenditure on public services. In addition, borrowing and other financing flows and reserves are now treated separately. While the treatment of revenues thus did not change significantly, there were some significant changes on the expenditure side which affected local budgets more fundamentally. The classification of apparatus and public expenditures are based on the difference of the beneficiaries of the spending. If the expenditures are spent on activities that benefit the public in general, they will be reported under public expenditures. This vague definition has forced the kabupaten/kota government to come up with their own interpretation that makes comparison of expenditure across kabupaten/kota difficult. Before Kepmen 29 was introduced, each spending unit prepared their own budget documents. Separate warrants were issued for routine (daftar isian kegiatan daerah, DIK-DA) and for development spending (daftar isian proyek daerah, DIP-DA). Under the new structure, spending units now use unified budget documents (Dokumen Anggaran Satuan Kerja, DASK). In general, DIKs covered all routine spending, which is comparable to spending under the “general administration” category of the DASK, which includes both apparatus and public expenditures. DIPs covered all project expenditures, including capital outlays and recurrent expenditures. In the new budget format, capital outlays are reported under capital expenditures while the recurrent expenditures of projects (now called activities) are reported under operation and maintenance expenditures. This makes the comparison of development expenditures with corresponding expenditures under the new budget format problematic. Table 3.3. shows the conceptual mapping of old and new formats. The new budget format attempts to move away from the routine/development split and towards a more programmatic approach to budgeting. Over time, this could lead to a more effective allocation of resources (for example by avoiding building schools without teachers, health centers without health workers etc). For instance, in Papua, provincial spending on education has focused on developing infrastructure, while kabupaten/kota government spending has primarily covered routine expenditures, especially teacher salaries (see Chapter 6). Given that sectoral spending is rarely coordinated across levels of government, the danger is that the provincial government builds schools that cannot be staffed with teachers, as local governments may not have budgeted the personnel costs (or do not have the personnel available).

Regional Finance and Service Delivery in Indonesia’s most Remote Region ________________________________________________________________________________________
16
3.4 Budget Reporting and Audit Papua’s fiscal reporting record has been unsatisfactory. Regional governments are by law required to report budget information to the Ministry of Finance. Failure to do so may lead to the withholding of transfers from the central government. Local governments in Papua have been among those that report their information late or not at all. In 2002, for instance, only eight out of fourteen kabupaten/kota reported their APBD to the central government. Despite such non-compliance, MoF has generally only issued warning letters, without implementing any formal sanctions. It is not clear whether the provincial government will be more successful in enforcing the a priori review of local APBD. It may well be the case that kabupaten/kota governments are more likely to comply with provincial reporting requirements. In fact, the provincial reports on the use of the Dana Otsus, which cover all kabupaten/kota in Papua, suggest that compliance can indeed be achieved. Heads of regions have to submit an accountability report to the DPRD that includes four kinds of reports: 1) APBD realizations; 2) a detailed explanation of realized APBD including performance measurements; 3) cash flow statement; and 4) balance sheet. The case studies show that in Kota Jayapura, the walikota’s (mayor) accountability report in 2003 and 2004 already included all the required financial reports. But it points out that the report makes no reference to key planning documents against which the kabupaten/kota government’s performance could be measured. There were also significant delays in the 2003 accountability report, which was delivered in June instead of March. Such late submission makes it difficult to incorporate important findings into the next year’s planning and budgeting cycle. As in other parts of the country, regional audit arrangements are weak. Every province and kabupaten/kota has regional audit agencies (Badan Pengawasan Daerah, Bawasda), which are coordinated at the national level by the Ministry of Home Affairs’ Inspectorate General.12 According to Presidential Decree 74/2001, the
12 World Bank (2003), p.55.
Table 3.3: Comparison of Old and New Budget Formats
OLD FORMAT NEW FORMAT
1. Revenue 1. Revenue • Carry-Over From Previous Year • Regional Own-Source Revenue • Regional Own-Source Revenue • Balancing Fund • Balancing Fund • Regional Borrowing • Other Revenue • Other Revenue
2. Financing 2. Expenditure 3. Expenditure 2.1 Routine Expenditure 3.1 Apparatus Expenditure • General Administration • Operational and Maintenance • Capital 2.2 Development Expenditure 3.2 Public Expenditure • General Administration • Operational and Maintenance • Capital
Papua Public Expenditure Analysis | Overview Report _________________________________________________________________________________________
17
Bawasda’s task is to check the performance of the government apparatus at the regional level. There is no indication, however, that the Bawasda’s findings have any major impact or consequences. The introduction of the Audit Law (Law 15/2004) clarified the role of the external auditor, the Supreme Audit Authority (Badan Pemeriksa Keuangan, BPK), in inspecting both central and local government finances. BPK audit is now required for all regional government budgets and has to be completed before the head of the region can submit the accountability report to the DPRD. Whether BPK will be able to audit 434 kabupaten/kota governments and thirty-two provinces within six months of the end of the fiscal year remains to be seen. In 2002, BPK audited less than a third of all regional government budgets. It appears that capacity is currently limited and would have to be expanded significantly to enable BPK to conduct the 2005 audit in time. Recommendations
• Create a simple database based on available data from BPS and other sources. Planning decisions are not based on reliable data, even though BPS has detailed socio-economic and other indicators available at the kabupaten/kota level. A simple database, set up in cooperation with the local BPS office, could help the kabupaten/kota governments improve planning.
• Establish a better coordination mechanism between the province and kabupaten/kota, especially on programs financed by the Dana Otsus. Both levels of government currently spend on similar programs, leading to potential overlap. This could be avoided through better coordination at the planning stage.

Regional Finance and Service Delivery in Indonesia’s most Remote Region ________________________________________________________________________________________
18

Regional Finance and Service Delivery in Indonesia’s most Remote Region ________________________________________________________________________________________
19
4. REVENUE AND FINANCING 4.1 Revenue Papua’s per capita fiscal resources are vastly higher than in other parts of Indonesia. This has been the case for a long period of time because Papua has always benefited from large central government transfers. Even before decentralization, it was the second richest province on a per capita basis. Papua’s most important revenue source in the pre-decentralization period were earmarked grants from the central government, including the SDO (Subsidi Daerah Otonom), an operational grant covering primarily civil servant salaries, and various Inpres (Instruksi Presiden) grants that were earmarked for sectoral development expenditures. Shares of tax revenues and revenues derived from natural resources represented the second most important source of revenues for Papua, accounting for twenty-seven percent of the aggregate budget. When decentralization took effect in 2001, Papua was one of the biggest beneficiaries, after East Kalimantan and Riau, both of which are also resource-rich regions. Aggregated at the provincial level, Papua’s per capita revenues almost doubled between 1996 and 2002 in real terms (Figure 4.1). In 2003, Papua thus had the third highest per capita revenue in the country, six times larger than that of West Java Province.
On the other hand, decentralization increased Papua’s dependence on grants from the central government as additional expenditure responsibilities have not been matched with the authority and capacity to mobilize sufficient own source revenue. The pre-decentralization system of earmarked grants was replaced with an intergovernmental transfer system that consists of the General Allocation Grant (DAU), a small Specific Purpose Grant (DAK)13, and Papua’s Special Autonomy Fund. Shared revenue from taxes and natural resources became relatively less important, despite the increased oil and gas shares for Papua introduced in 2002.
13 The DAK was initially for reforestation only but in 2003 was expanded to cover a number of other sectors as well.
Figure 4.1: Papua's Real PC Revenue Doubled Between 1996 and 2002
0 200,000 400,000 600,000 800,000
1996
1997
1998
1999
2001
2002 Ow n Source revenue
Shared Revenue NaturalResources
Shared Revenue Taxes
Grants (DAU+DAK)
Special Autonomy Fund
Source: BPS, MoF/SIKD, Note: 1996 base year
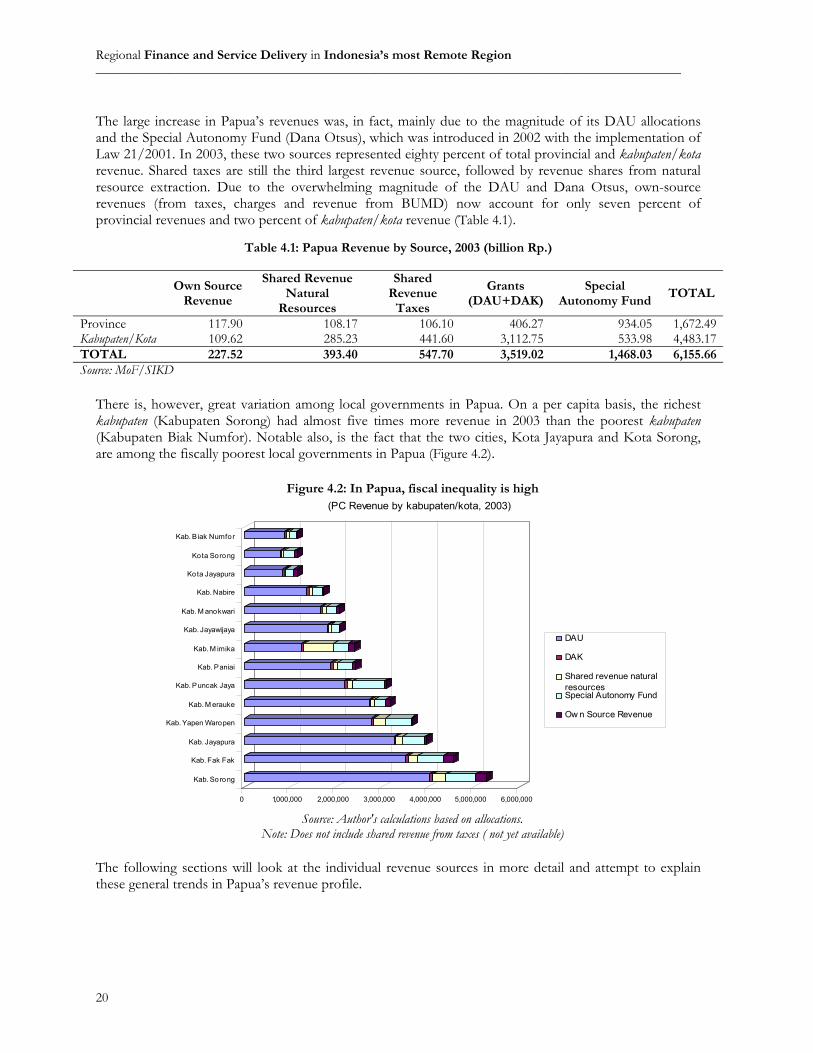
Regional Finance and Service Delivery in Indonesia’s most Remote Region ________________________________________________________________________________________
20
The large increase in Papua’s revenues was, in fact, mainly due to the magnitude of its DAU allocations and the Special Autonomy Fund (Dana Otsus), which was introduced in 2002 with the implementation of Law 21/2001. In 2003, these two sources represented eighty percent of total provincial and kabupaten/kota revenue. Shared taxes are still the third largest revenue source, followed by revenue shares from natural resource extraction. Due to the overwhelming magnitude of the DAU and Dana Otsus, own-source revenues (from taxes, charges and revenue from BUMD) now account for only seven percent of provincial revenues and two percent of kabupaten/kota revenue (Table 4.1).
Table 4.1: Papua Revenue by Source, 2003 (billion Rp.)
Own Source
Revenue
Shared Revenue Natural
Resources
Shared Revenue
Taxes
Grants (DAU+DAK)
Special Autonomy Fund
TOTAL
Province 117.90 108.17 106.10 406.27 934.05 1,672.49Kabupaten/Kota 109.62 285.23 441.60 3,112.75 533.98 4,483.17TOTAL 227.52 393.40 547.70 3,519.02 1,468.03 6,155.66Source: MoF/SIKD
There is, however, great variation among local governments in Papua. On a per capita basis, the richest kabupaten (Kabupaten Sorong) had almost five times more revenue in 2003 than the poorest kabupaten (Kabupaten Biak Numfor). Notable also, is the fact that the two cities, Kota Jayapura and Kota Sorong, are among the fiscally poorest local governments in Papua (Figure 4.2).
The following sections will look at the individual revenue sources in more detail and attempt to explain these general trends in Papua’s revenue profile.
Figure 4.2: In Papua, fiscal inequality is high
0 1,000,000 2,000,000 3,000,000 4,000,000 5,000,000 6,000,000
Kab. Sorong
Kab. Fak Fak
Kab. Jayapura
Kab. Yapen Waropen
Kab. M erauke
Kab. Puncak Jaya
Kab. Paniai
Kab. M imika
Kab. Jayawijaya
Kab. M anokwari
Kab. Nabire
Kota Jayapura
Kota Sorong
Kab. B iak Numfor
(PC Revenue by kabupaten/kota, 2003)
DAU
DAK
Shared revenue naturalresourcesSpecial Autonomy Fund
Ow n Source Revenue
Source: Author's calculations based on allocations.
Note: Does not include shared revenue from taxes ( not yet available)
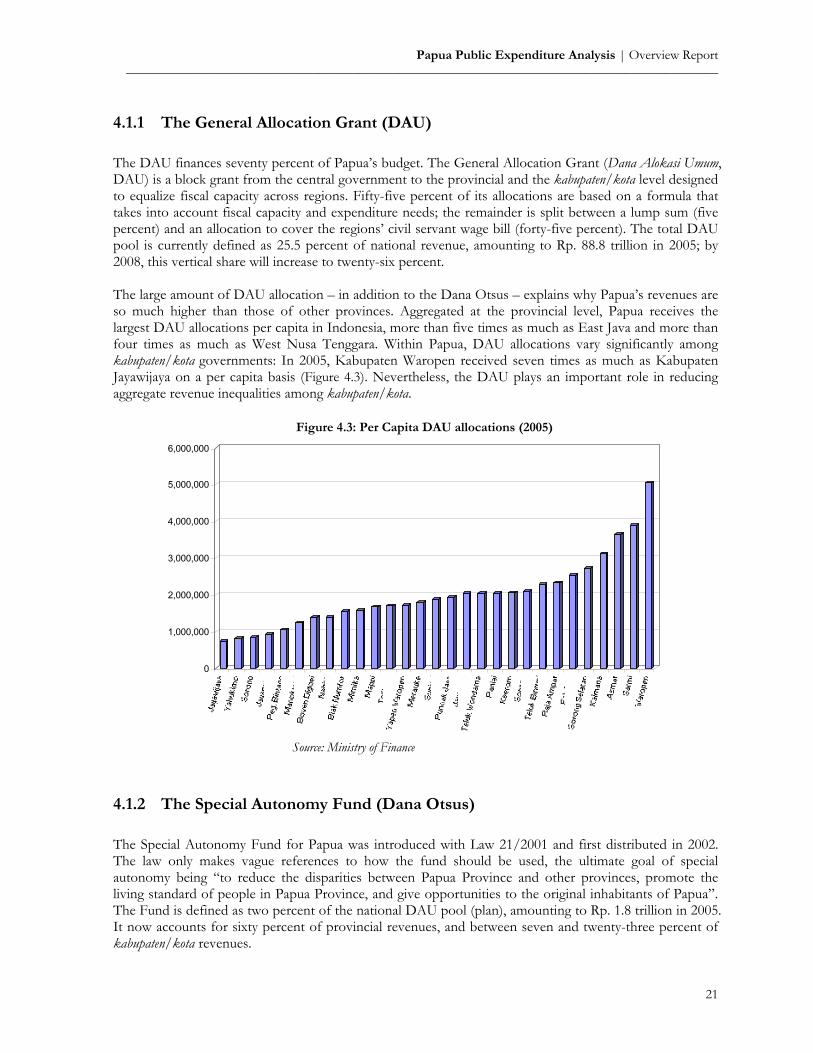
Papua Public Expenditure Analysis | Overview Report _________________________________________________________________________________________
21
4.1.1 The General Allocation Grant (DAU) The DAU finances seventy percent of Papua’s budget. The General Allocation Grant (Dana Alokasi Umum, DAU) is a block grant from the central government to the provincial and the kabupaten/kota level designed to equalize fiscal capacity across regions. Fifty-five percent of its allocations are based on a formula that takes into account fiscal capacity and expenditure needs; the remainder is split between a lump sum (five percent) and an allocation to cover the regions’ civil servant wage bill (forty-five percent). The total DAU pool is currently defined as 25.5 percent of national revenue, amounting to Rp. 88.8 trillion in 2005; by 2008, this vertical share will increase to twenty-six percent. The large amount of DAU allocation – in addition to the Dana Otsus – explains why Papua’s revenues are so much higher than those of other provinces. Aggregated at the provincial level, Papua receives the largest DAU allocations per capita in Indonesia, more than five times as much as East Java and more than four times as much as West Nusa Tenggara. Within Papua, DAU allocations vary significantly among kabupaten/kota governments: In 2005, Kabupaten Waropen received seven times as much as Kabupaten Jayawijaya on a per capita basis (Figure 4.3). Nevertheless, the DAU plays an important role in reducing aggregate revenue inequalities among kabupaten/kota.
4.1.2 The Special Autonomy Fund (Dana Otsus) The Special Autonomy Fund for Papua was introduced with Law 21/2001 and first distributed in 2002. The law only makes vague references to how the fund should be used, the ultimate goal of special autonomy being “to reduce the disparities between Papua Province and other provinces, promote the living standard of people in Papua Province, and give opportunities to the original inhabitants of Papua”. The Fund is defined as two percent of the national DAU pool (plan), amounting to Rp. 1.8 trillion in 2005. It now accounts for sixty percent of provincial revenues, and between seven and twenty-three percent of kabupaten/kota revenues.
Figure 4.3: Per Capita DAU allocations (2005)
0
1,000,000
2,000,000
3,000,000
4,000,000
5,000,000
6,000,000
Source: Ministry of Finance

Regional Finance and Service Delivery in Indonesia’s most Remote Region ________________________________________________________________________________________
22
Allocation and Disbursement of the Dana Otsus – From the Center to the Province
As the DAU is fixed early on, and the Dana Otsus is clearly defined as a two percent share of the DAU pool, there is a high degree of certainty over the amount the province is supposed to receive from the central government. In fact, in 2002 and 2003 the province was able to estimate the exact amount of revenues from the Dana Otsus in its yearly budget. The budget stipulates quarterly disbursements of the Dana Otsus. A joint MoF/MoHA decree issued in April 2003 requires the province to report on the allocations of each tranche and gives MoF and MoHA the right to cancel the next disbursement if the Dana Otsus was not used as specified. So far disbursement has never been cancelled, but delays in reporting occur frequently, leading to delayed disbursements.14 The splitting of the province has thus far not affected the distribution of the Dana Otsus at the provincial level as the central government decided to continue disbursing the entire fund to the provincial government in Jayapura, instead of the new government in Manokwari.
Allocation and Disbursement of the Dana Otsus – From the Province to Kabupaten/Kota
The Special Autonomy Law does not stipulate in detail how the funds are to be distributed among kabupaten/kota in Papua, stating only that allocations should be decided by special regional regulation (perdasus), with priority to be given to lagging regions.15 A joint MoHA and MoF decree (KMK160a/2003), issued in April 2003, clarified that kabupaten/kota are to receive a larger share of the fund than the province because of their greater responsibilities in delivering education and health services. Consequently, in 2004, the province reduced its own allocation to forty percent; in 2002 and 2003 the province had kept sixty percent of the funds and only allocated the remaining forty percent to local governments (Table 4.3). The entire kabupaten/kota share is not, however, under the complete control of kabupaten/kota governments. Part of the funds are transferred to the local governments in the form of cahs transfer, or “fresh money” (dana segar); another part is given in the form of program support that is agreed with, and “directed” (diarahkan) by, the province. Both flows, however, became part of the kabupaten/kota government budget, which can be revised by the DPRD before being approved. As there is no formal earmarking of the Dana Otsus, this makes it hard for the provincial government to enforce the use of the Dana Otsus for priority sectors. Another complication was that disbursement of the Dana Otsus from the province to the kabupaten/kota did not begin until 15 July 2003. In fact, more than half of the funds were not disbursed until the end of November (Table 4.2).
14 See Pemerintah Provinsi Papua (2003), p.83. 15 Perdasus can only be issued by the MRP, which has not yet been established. Consequently, the allocations were made by Governor’s Decree and Regional Regulation (perda).
Table 4.2: Delays in Disbursement of Dana Otsus 2003, Province to Kab/Kota
15-Jul 15% 05-Sep 30% 20-Nov 40% 20-Nov 15%
Source: BP3D Provinsi Papua
Table 4.3: Distribution of Dana Otsus 2002 2003 2004Province 60.01% 60.67% 39.99%Kabupaten/Kota 39.99% 39.33% 60.01% Fresh Money 14.47% 18.19% n/a Program Support 25.51% 21.14% n/aTotal 100.00% 100.00% 100.00%Source: Provinsi Papua
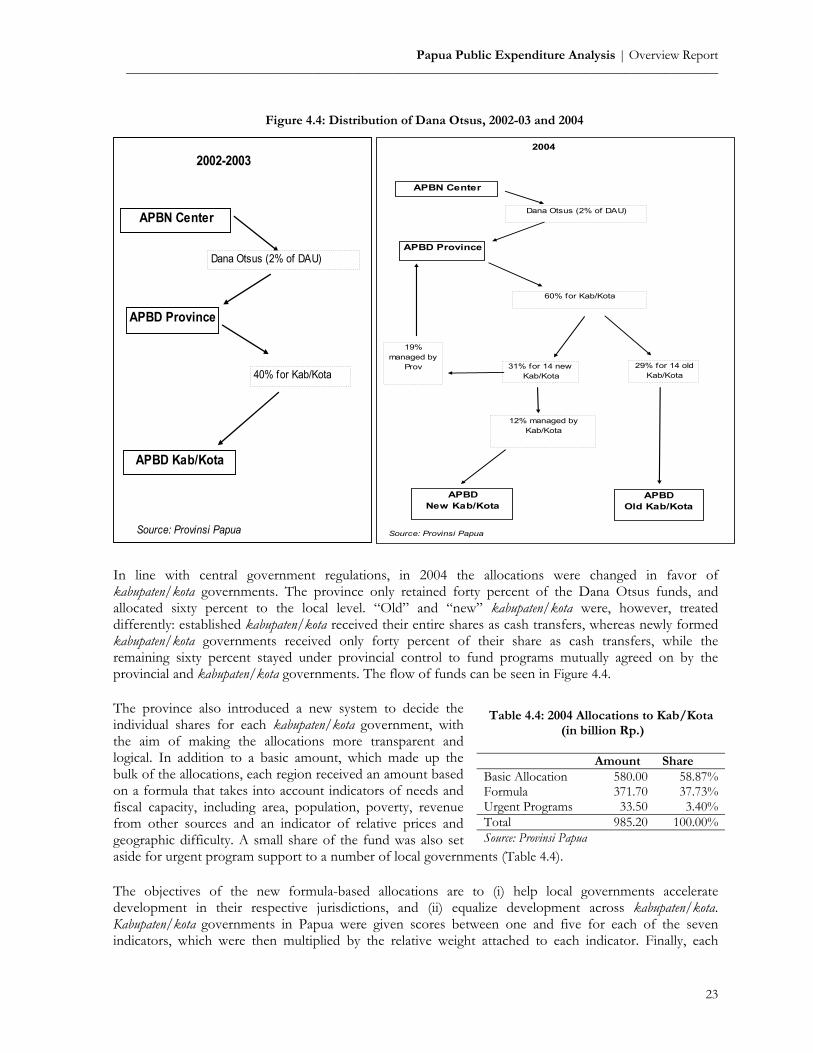
Papua Public Expenditure Analysis | Overview Report _________________________________________________________________________________________
23
In line with central government regulations, in 2004 the allocations were changed in favor of kabupaten/kota governments. The province only retained forty percent of the Dana Otsus funds, and allocated sixty percent to the local level. “Old” and “new” kabupaten/kota were, however, treated differently: established kabupaten/kota received their entire shares as cash transfers, whereas newly formed kabupaten/kota governments received only forty percent of their share as cash transfers, while the remaining sixty percent stayed under provincial control to fund programs mutually agreed on by the provincial and kabupaten/kota governments. The flow of funds can be seen in Figure 4.4. The province also introduced a new system to decide the individual shares for each kabupaten/kota government, with the aim of making the allocations more transparent and logical. In addition to a basic amount, which made up the bulk of the allocations, each region received an amount based on a formula that takes into account indicators of needs and fiscal capacity, including area, population, poverty, revenue from other sources and an indicator of relative prices and geographic difficulty. A small share of the fund was also set aside for urgent program support to a number of local governments (Table 4.4). The objectives of the new formula-based allocations are to (i) help local governments accelerate development in their respective jurisdictions, and (ii) equalize development across kabupaten/kota. Kabupaten/kota governments in Papua were given scores between one and five for each of the seven indicators, which were then multiplied by the relative weight attached to each indicator. Finally, each
Figure 4.4: Distribution of Dana Otsus, 2002-03 and 2004
Table 4.4: 2004 Allocations to Kab/Kota (in billion Rp.)
Amount Share Basic Allocation 580.00 58.87%Formula 371.70 37.73%Urgent Programs 33.50 3.40%Total 985.20 100.00%Source: Provinsi Papua
2002-2003
Dana Otsus (2% of DAU)
40% for Kab/Kota
APBN Center
APBD Province
APBD Kab/Kota
Source: Provinsi Papua
2004
APBN Center
APBD Province
APBDOld Kab/Kota
APBDNew Kab/Kota
Source: Provinsi Papua
Dana Otsus (2% of DAU)
60% for Kab/Kota
29% for 14 old Kab/Kota
31% for 14 new Kab/Kota
19% managed by
Prov
12% managed by Kab/Kota
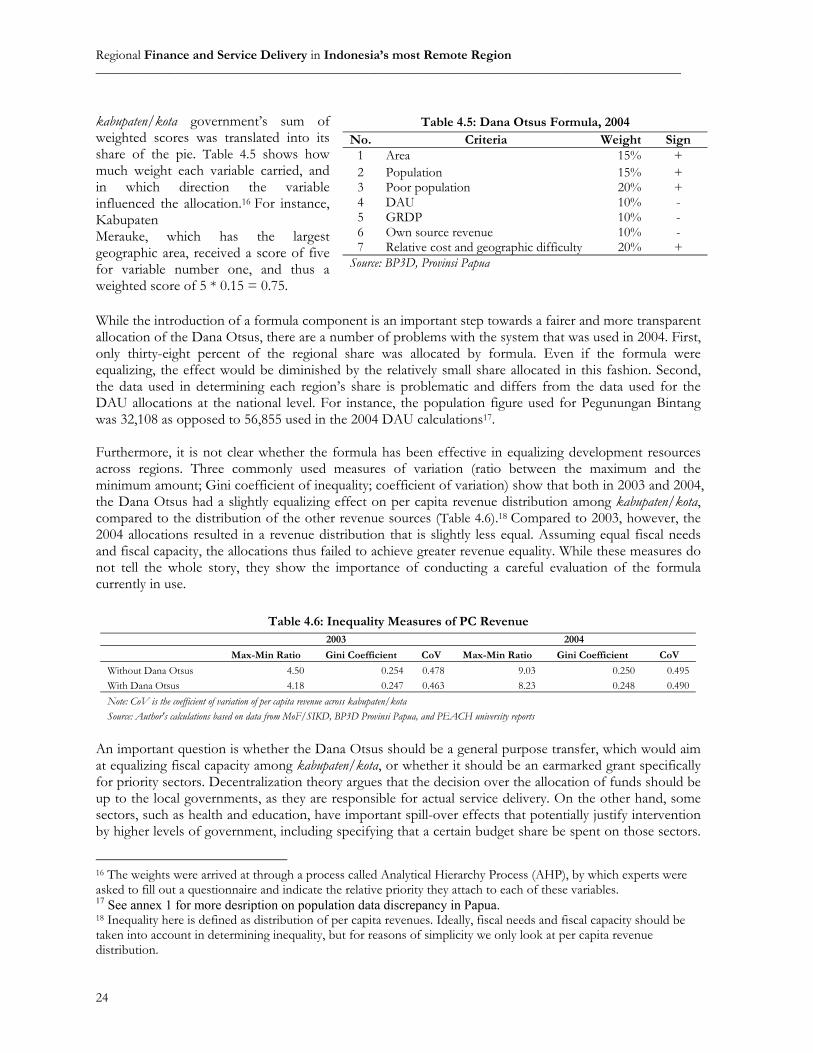
Regional Finance and Service Delivery in Indonesia’s most Remote Region ________________________________________________________________________________________
24
kabupaten/kota government’s sum of weighted scores was translated into its share of the pie. Table 4.5 shows how much weight each variable carried, and in which direction the variable influenced the allocation.16 For instance, Kabupaten Merauke, which has the largest geographic area, received a score of five for variable number one, and thus a weighted score of 5 * 0.15 = 0.75. While the introduction of a formula component is an important step towards a fairer and more transparent allocation of the Dana Otsus, there are a number of problems with the system that was used in 2004. First, only thirty-eight percent of the regional share was allocated by formula. Even if the formula were equalizing, the effect would be diminished by the relatively small share allocated in this fashion. Second, the data used in determining each region’s share is problematic and differs from the data used for the DAU allocations at the national level. For instance, the population figure used for Pegunungan Bintang was 32,108 as opposed to 56,855 used in the 2004 DAU calculations17. Furthermore, it is not clear whether the formula has been effective in equalizing development resources across regions. Three commonly used measures of variation (ratio between the maximum and the minimum amount; Gini coefficient of inequality; coefficient of variation) show that both in 2003 and 2004, the Dana Otsus had a slightly equalizing effect on per capita revenue distribution among kabupaten/kota, compared to the distribution of the other revenue sources (Table 4.6).18 Compared to 2003, however, the 2004 allocations resulted in a revenue distribution that is slightly less equal. Assuming equal fiscal needs and fiscal capacity, the allocations thus failed to achieve greater revenue equality. While these measures do not tell the whole story, they show the importance of conducting a careful evaluation of the formula currently in use.
Table 4.6: Inequality Measures of PC Revenue 2003 2004
Max-Min Ratio Gini Coefficient CoV Max-Min Ratio Gini Coefficient CoV
Without Dana Otsus 4.50 0.254 0.478 9.03 0.250 0.495With Dana Otsus 4.18 0.247 0.463 8.23 0.248 0.490Note: CoV is the coefficient of variation of per capita revenue across kabupaten/kota Source: Author's calculations based on data from MoF/SIKD, BP3D Provinsi Papua, and PEACH university reports
An important question is whether the Dana Otsus should be a general purpose transfer, which would aim at equalizing fiscal capacity among kabupaten/kota, or whether it should be an earmarked grant specifically for priority sectors. Decentralization theory argues that the decision over the allocation of funds should be up to the local governments, as they are responsible for actual service delivery. On the other hand, some sectors, such as health and education, have important spill-over effects that potentially justify intervention by higher levels of government, including specifying that a certain budget share be spent on those sectors.
16 The weights were arrived at through a process called Analytical Hierarchy Process (AHP), by which experts were asked to fill out a questionnaire and indicate the relative priority they attach to each of these variables. 17 See annex 1 for more desription on population data discrepancy in Papua. 18 Inequality here is defined as distribution of per capita revenues. Ideally, fiscal needs and fiscal capacity should be taken into account in determining inequality, but for reasons of simplicity we only look at per capita revenue distribution.
Table 4.5: Dana Otsus Formula, 2004 No. Criteria Weight Sign
1 Area 15% + 2 Population 15% + 3 Poor population 20% + 4 DAU 10% - 5 GRDP 10% - 6 Own source revenue 10% - 7 Relative cost and geographic difficulty 20% +
Source: BP3D, Provinsi Papua
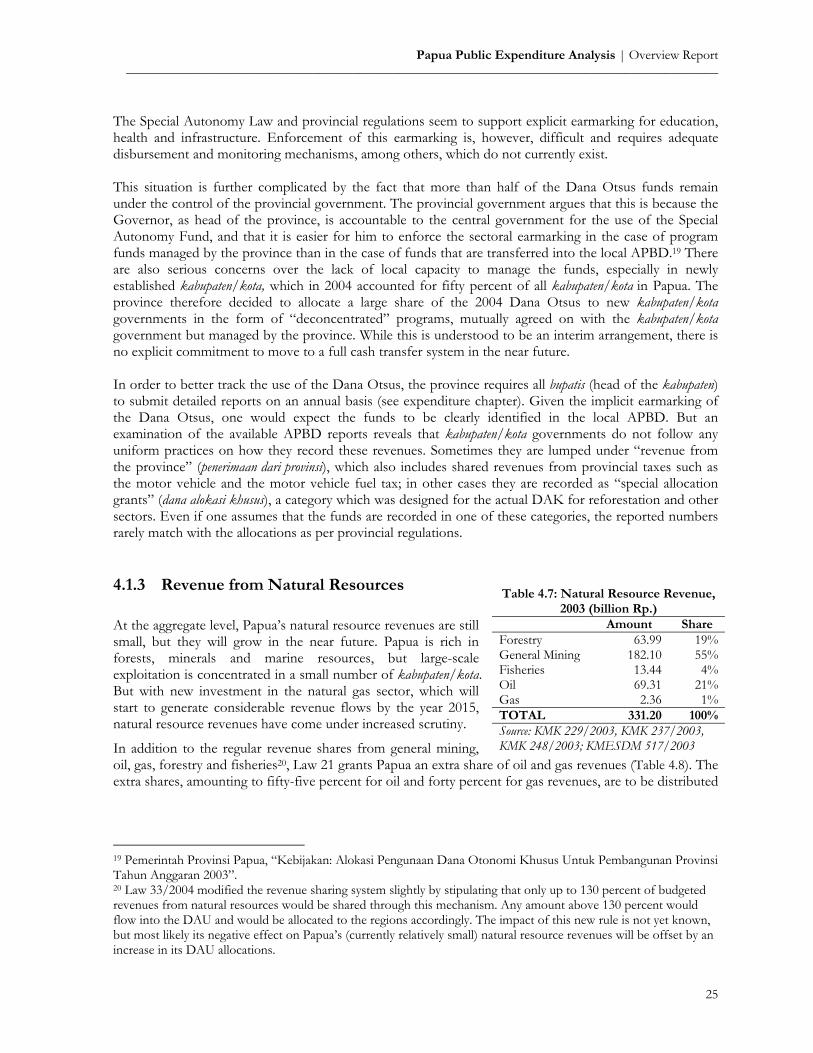
Papua Public Expenditure Analysis | Overview Report _________________________________________________________________________________________
25
The Special Autonomy Law and provincial regulations seem to support explicit earmarking for education, health and infrastructure. Enforcement of this earmarking is, however, difficult and requires adequate disbursement and monitoring mechanisms, among others, which do not currently exist. This situation is further complicated by the fact that more than half of the Dana Otsus funds remain under the control of the provincial government. The provincial government argues that this is because the Governor, as head of the province, is accountable to the central government for the use of the Special Autonomy Fund, and that it is easier for him to enforce the sectoral earmarking in the case of program funds managed by the province than in the case of funds that are transferred into the local APBD.19 There are also serious concerns over the lack of local capacity to manage the funds, especially in newly established kabupaten/kota, which in 2004 accounted for fifty percent of all kabupaten/kota in Papua. The province therefore decided to allocate a large share of the 2004 Dana Otsus to new kabupaten/kota governments in the form of “deconcentrated” programs, mutually agreed on with the kabupaten/kota government but managed by the province. While this is understood to be an interim arrangement, there is no explicit commitment to move to a full cash transfer system in the near future. In order to better track the use of the Dana Otsus, the province requires all bupatis (head of the kabupaten) to submit detailed reports on an annual basis (see expenditure chapter). Given the implicit earmarking of the Dana Otsus, one would expect the funds to be clearly identified in the local APBD. But an examination of the available APBD reports reveals that kabupaten/kota governments do not follow any uniform practices on how they record these revenues. Sometimes they are lumped under “revenue from the province” (penerimaan dari provinsi), which also includes shared revenues from provincial taxes such as the motor vehicle and the motor vehicle fuel tax; in other cases they are recorded as “special allocation grants” (dana alokasi khusus), a category which was designed for the actual DAK for reforestation and other sectors. Even if one assumes that the funds are recorded in one of these categories, the reported numbers rarely match with the allocations as per provincial regulations.
4.1.3 Revenue from Natural Resources At the aggregate level, Papua’s natural resource revenues are still small, but they will grow in the near future. Papua is rich in forests, minerals and marine resources, but large-scale exploitation is concentrated in a small number of kabupaten/kota. But with new investment in the natural gas sector, which will start to generate considerable revenue flows by the year 2015, natural resource revenues have come under increased scrutiny.
In addition to the regular revenue shares from general mining, oil, gas, forestry and fisheries20, Law 21 grants Papua an extra share of oil and gas revenues (Table 4.8). The extra shares, amounting to fifty-five percent for oil and forty percent for gas revenues, are to be distributed
19 Pemerintah Provinsi Papua, “Kebijakan: Alokasi Pengunaan Dana Otonomi Khusus Untuk Pembangunan Provinsi Tahun Anggaran 2003”. 20 Law 33/2004 modified the revenue sharing system slightly by stipulating that only up to 130 percent of budgeted revenues from natural resources would be shared through this mechanism. Any amount above 130 percent would flow into the DAU and would be allocated to the regions accordingly. The impact of this new rule is not yet known, but most likely its negative effect on Papua’s (currently relatively small) natural resource revenues will be offset by an increase in its DAU allocations.
Table 4.7: Natural Resource Revenue, 2003 (billion Rp.)
Amount Share Forestry 63.99 19%General Mining 182.10 55%Fisheries 13.44 4%Oil 69.31 21%Gas 2.36 1%TOTAL 331.20 100%Source: KMK 229/2003, KMK 237/2003, KMK 248/2003; KMESDM 517/2003

Regional Finance and Service Delivery in Indonesia’s most Remote Region ________________________________________________________________________________________
26
among kabupaten/kota in Papua based on a special regional regulation (perdasus). 21 Currently these additional revenues are small, as there are only minor oil and gas operations at this point, mostly located around Sorong in the new province of Irian Jaya Barat. In 2003, total revenues from oil and gas amounted to only twenty-two percent of natural resource revenues in all of Papua (Table 4.7).
Overall, revenues from natural resources only make up a small portion of Papua’s budget: seven percent at the provincial level, and two to five percent at the individual kabupaten/kota level. The exception is Kabupaten Mimika, which relies on receipts from the PT. Freeport copper and gold mining operations for twenty-seven percent of its revenues. Future investments in the natural resource sector, particularly the new BP LNG plant in Bintuni Bay, will make this source of revenues more significant.
21 In the absence of the MRP, a Governor’s Decree or Regional Regulation are considered a substitute for the perdasus.
Table 4.8: Natural Resource Revenue Sharing
Center Regions Province Producing kab/kota
Other kab/kota in
Province
All kab/kota in Indonesia
Forestry 20% 80% Concessions 16% 64% Royalties 16% 32% 32% General Mining 20% 80% Land rent 16% 64% Royalties 16% 32% 32% Fisheries 20% 80% Levies on exploitation 80% Levies on production 80%Oil 30% 15% 3% 6% 6% additional share for Papua 55% to be decided by Special Regulation (Perdasus) Natural gas 30% 30% 6% 12% 12% additional share for Papua 40% to be decided by Special Regulation (Perdasus) Source: PP 104/2000 and Law 21/2001

Papua Public Expenditure Analysis | Overview Report _________________________________________________________________________________________
27
Table 4.9: Simulation of Future Revenue from BP Tangguh (billion Rp.) Scenario 1 Scenario 2 Scenario 3 Prov. Papua 703.80 0.00 351.90 Kab/Kota in Papua 131.14 0.00 131.14 TOTAL Prov. Papua 834.94 0.00 483.04 Prov. Irja Barat 0.00 703.80 351.90 Producing Kab/Kota in Irja 183.60 183.60 183.60 Other Kab/Kota in Irja 52.46 183.60 52.46 TOTAL Prov. Irja 236.06 1,071.00 587.96 TOATL PAPUA 1,071.00 1,071.00 1,071.00 Assumptions: Tangguh Net Revenue = USD 170 million at peak; 1USD = Rp. 9,000
Regional allocations of natural resource revenues have typically been announced late, sometimes as late as November of the fiscal year concerned.22 In Papua, this situation has been further complicated by the recent splitting of the province. Law 21 does not specify how Papua’s shares are to be distributed in case there is more than one province; in the absence of the Papua People’s Assembly (Majelis Rakyat Papua, MRP), it was up to the central government to decide the allocations. As a consequence, the announcement of the 2004 revenue shares for the two provinces were delayed, except in the case of the producing regions whose allocations were announced in a separate decree. Given the overall small role of this type of revenue in most kabupaten/kota government budgets, these delays are unlikely to have had a large effect on their budgets. In the medium- to long run, however, the division of revenue from the BP Tangguh operation will become a prominent issue and depending on how the funds are distributed, some regional governments stand to win considerably (Box 4.1 and table 4.9). One of the main complaints of regional governments in Papua is the lack of transparency in the allocation of revenue shares from natural resources. Kabupaten/kota governments often do not obtain detailed information on production and prices, and therefore find it hard to check whether the revenue they receive is in line with local production or not. Earlier this year, the provincial government formally complained to Jakarta about the lack of transparency regarding central government revenues from the
22 See Lewis & Chakeri (2004a).
Box 4.1: Future Windfalls from BP Tangguh The site of the new BP Tangguh investment is Bintuni Bay, located in newly established Kabupaten Teluk Bintuni in Irian Jaya Barat Province. While Teluk Bintuni and surrounding areas already benefit from community development programs funded by BP, significant amounts of revenues from the operation are not expected to flow for another ten years. As the central government has not yet made a decision on how natural resource revenue is to be shared among the two provinces, it remains unclear how the Tangguh revenues will be distributed within Papua. It is evident that the project will bring significant additional resources to the region, increasing the region’s share from oil and gas revenues from currently Rp. 70 billion to over Rp. 1 trillion. The decision on the future set-up of the province will have important implications for resource allocation between and within the province(s). The resource implications were simulated for three scenarios (Table 4.9): Scenario 1: Gas revenues to Papua Province, distributed among all kabupaten/kota in Papua region. Scenario 2: Gas revenues to Irja Barat Province only, distributed among kabupaten/kota in Irja Barat only. Scenario 3: Gas revenues to Papua and Irja Barat Provinces, distributed among kabupaten/kota in both
provinces. Note: The simulation does not include additional revenue from shared taxes (property tax, income tax etc).
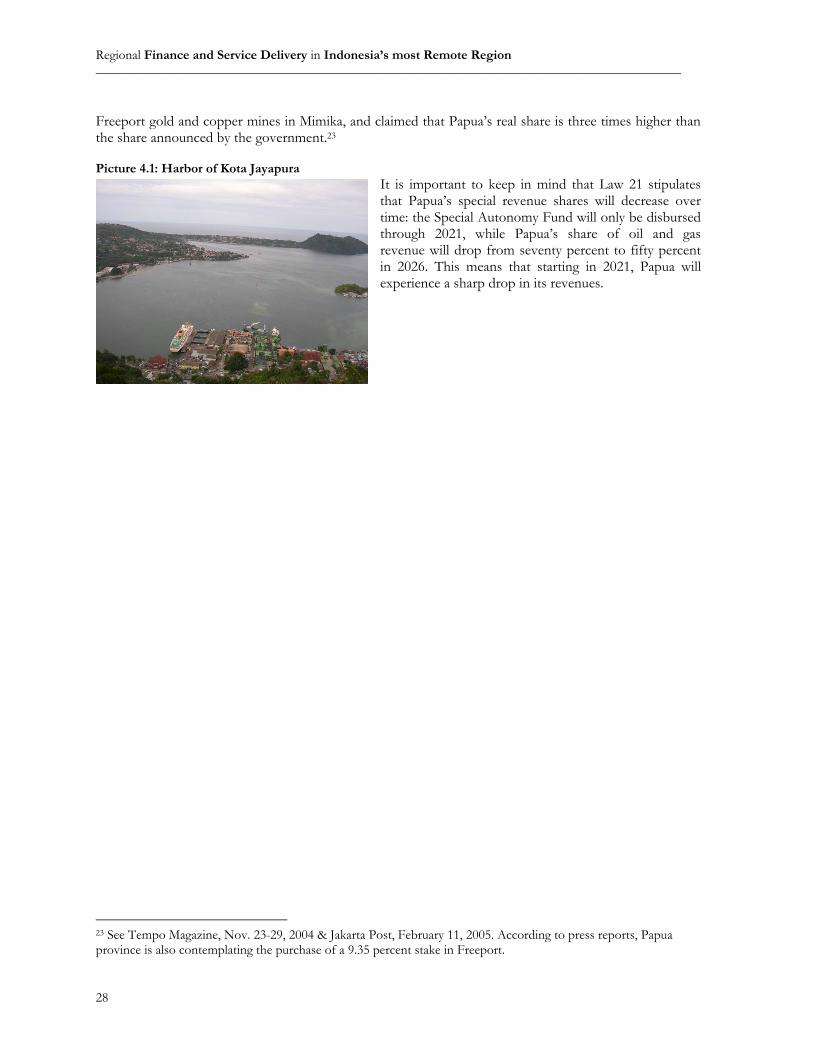
Regional Finance and Service Delivery in Indonesia’s most Remote Region ________________________________________________________________________________________
28
Freeport gold and copper mines in Mimika, and claimed that Papua’s real share is three times higher than the share announced by the government.23 Picture 4.1: Harbor of Kota Jayapura
It is important to keep in mind that Law 21 stipulates that Papua’s special revenue shares will decrease over time: the Special Autonomy Fund will only be disbursed through 2021, while Papua’s share of oil and gas revenue will drop from seventy percent to fifty percent in 2026. This means that starting in 2021, Papua will experience a sharp drop in its revenues.
23 See Tempo Magazine, Nov. 23-29, 2004 & Jakarta Post, February 11, 2005. According to press reports, Papua province is also contemplating the purchase of a 9.35 percent stake in Freeport.
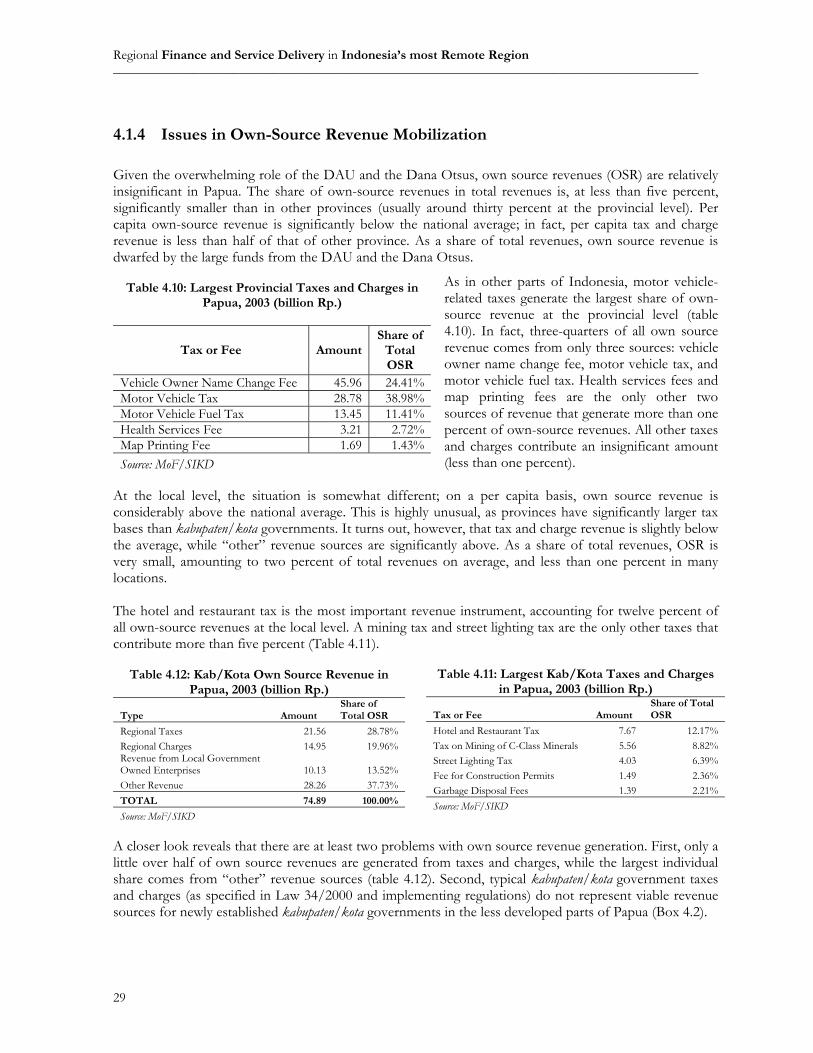
Regional Finance and Service Delivery in Indonesia’s most Remote Region ________________________________________________________________________________________
29
4.1.4 Issues in Own-Source Revenue Mobilization Given the overwhelming role of the DAU and the Dana Otsus, own source revenues (OSR) are relatively insignificant in Papua. The share of own-source revenues in total revenues is, at less than five percent, significantly smaller than in other provinces (usually around thirty percent at the provincial level). Per capita own-source revenue is significantly below the national average; in fact, per capita tax and charge revenue is less than half of that of other province. As a share of total revenues, own source revenue is dwarfed by the large funds from the DAU and the Dana Otsus.
As in other parts of Indonesia, motor vehicle-related taxes generate the largest share of own-source revenue at the provincial level (table 4.10). In fact, three-quarters of all own source revenue comes from only three sources: vehicle owner name change fee, motor vehicle tax, and motor vehicle fuel tax. Health services fees and map printing fees are the only other two sources of revenue that generate more than one percent of own-source revenues. All other taxes and charges contribute an insignificant amount (less than one percent).
At the local level, the situation is somewhat different; on a per capita basis, own source revenue is considerably above the national average. This is highly unusual, as provinces have significantly larger tax bases than kabupaten/kota governments. It turns out, however, that tax and charge revenue is slightly below the average, while “other” revenue sources are significantly above. As a share of total revenues, OSR is very small, amounting to two percent of total revenues on average, and less than one percent in many locations. The hotel and restaurant tax is the most important revenue instrument, accounting for twelve percent of all own-source revenues at the local level. A mining tax and street lighting tax are the only other taxes that contribute more than five percent (Table 4.11).
Table 4.12: Kab/Kota Own Source Revenue in Papua, 2003 (billion Rp.)
Type Amount Share of Total OSR
Regional Taxes 21.56 28.78% Regional Charges 14.95 19.96% Revenue from Local Government Owned Enterprises 10.13 13.52% Other Revenue 28.26 37.73% TOTAL 74.89 100.00%
Source: MoF/SIKD A closer look reveals that there are at least two problems with own source revenue generation. First, only a little over half of own source revenues are generated from taxes and charges, while the largest individual share comes from “other” revenue sources (table 4.12). Second, typical kabupaten/kota government taxes and charges (as specified in Law 34/2000 and implementing regulations) do not represent viable revenue sources for newly established kabupaten/kota governments in the less developed parts of Papua (Box 4.2).
Table 4.10: Largest Provincial Taxes and Charges in Papua, 2003 (billion Rp.)
Tax or Fee AmountShare of
Total OSR
Vehicle Owner Name Change Fee 45.96 24.41%Motor Vehicle Tax 28.78 38.98%Motor Vehicle Fuel Tax 13.45 11.41%Health Services Fee 3.21 2.72%Map Printing Fee 1.69 1.43%Source: MoF/SIKD
Table 4.11: Largest Kab/Kota Taxes and Charges in Papua, 2003 (billion Rp.)
Tax or Fee Amount Share of Total OSR
Hotel and Restaurant Tax 7.67 12.17%Tax on Mining of C-Class Minerals 5.56 8.82%Street Lighting Tax 4.03 6.39%Fee for Construction Permits 1.49 2.36%Garbage Disposal Fees 1.39 2.21%Source: MoF/SIKD
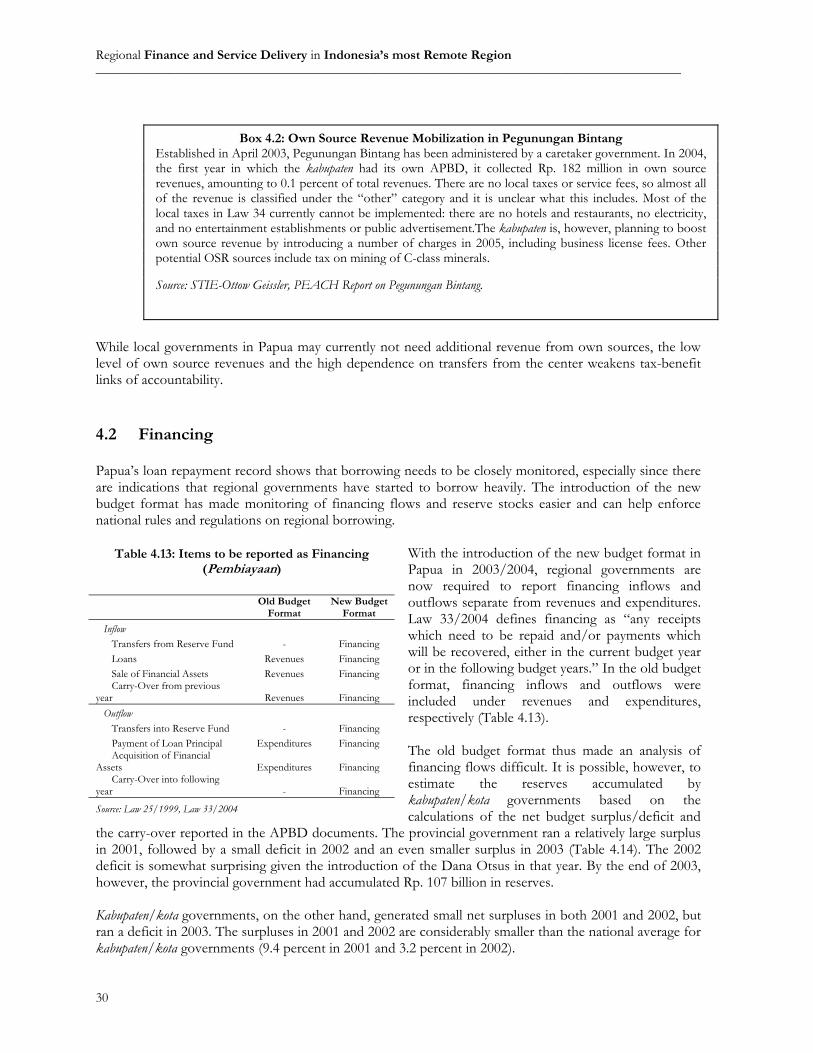
Regional Finance and Service Delivery in Indonesia’s most Remote Region ________________________________________________________________________________________
30
While local governments in Papua may currently not need additional revenue from own sources, the low level of own source revenues and the high dependence on transfers from the center weakens tax-benefit links of accountability. 4.2 Financing Papua’s loan repayment record shows that borrowing needs to be closely monitored, especially since there are indications that regional governments have started to borrow heavily. The introduction of the new budget format has made monitoring of financing flows and reserve stocks easier and can help enforce national rules and regulations on regional borrowing.
With the introduction of the new budget format in Papua in 2003/2004, regional governments are now required to report financing inflows and outflows separate from revenues and expenditures. Law 33/2004 defines financing as “any receipts which need to be repaid and/or payments which will be recovered, either in the current budget year or in the following budget years.” In the old budget format, financing inflows and outflows were included under revenues and expenditures, respectively (Table 4.13). The old budget format thus made an analysis of financing flows difficult. It is possible, however, to estimate the reserves accumulated by kabupaten/kota governments based on the calculations of the net budget surplus/deficit and
the carry-over reported in the APBD documents. The provincial government ran a relatively large surplus in 2001, followed by a small deficit in 2002 and an even smaller surplus in 2003 (Table 4.14). The 2002 deficit is somewhat surprising given the introduction of the Dana Otsus in that year. By the end of 2003, however, the provincial government had accumulated Rp. 107 billion in reserves. Kabupaten/kota governments, on the other hand, generated small net surpluses in both 2001 and 2002, but ran a deficit in 2003. The surpluses in 2001 and 2002 are considerably smaller than the national average for kabupaten/kota governments (9.4 percent in 2001 and 3.2 percent in 2002).
Box 4.2: Own Source Revenue Mobilization in Pegunungan Bintang Established in April 2003, Pegunungan Bintang has been administered by a caretaker government. In 2004, the first year in which the kabupaten had its own APBD, it collected Rp. 182 million in own source revenues, amounting to 0.1 percent of total revenues. There are no local taxes or service fees, so almost all of the revenue is classified under the “other” category and it is unclear what this includes. Most of the local taxes in Law 34 currently cannot be implemented: there are no hotels and restaurants, no electricity, and no entertainment establishments or public advertisement.The kabupaten is, however, planning to boost own source revenue by introducing a number of charges in 2005, including business license fees. Other potential OSR sources include tax on mining of C-class minerals. Source: STIE-Ottow Geissler, PEACH Report on Pegunungan Bintang.
Table 4.13: Items to be reported as Financing (Pembiayaan)
Old Budget Format
New Budget Format
Inflow Transfers from Reserve Fund - Financing Loans Revenues Financing Sale of Financial Assets Revenues Financing Carry-Over from previous year Revenues Financing Outflow Transfers into Reserve Fund - Financing Payment of Loan Principal Expenditures Financing Acquisition of Financial Assets Expenditures Financing Carry-Over into following year - Financing
Source: Law 25/1999, Law 33/2004

Papua Public Expenditure Analysis | Overview Report _________________________________________________________________________________________
31
Borrowing has, until recently, not played a big role in regional government finances in Papua. In fact, 2001 data from the Ministry of Finance shows that the only outstanding loans in Papua were to the provincial government and local PDAMs in four kabupaten/kota. It is, however, important to note that the repayment record of local governments in Papua has been dismal: provincial arrears amount to sixty percent, while the local PDAM arrears amount to close to 100 percent. This compares to a national average arrears ratio of forty percent for provincial governments and fifty-five percent for kabupaten/kota governments (Table 4.15). 24 Borrowing, however, is on the rise. For the three case study locations which used the new format in 2004 and for which the relevant data was available, financing data is presented in table 4.16. Kabupaten Biak Numfor reported a budget deficit of Rp. 30 billion, which was offset by a surplus on the financing side. The financing inflows came from a Rp. 50 billion loan from the private sector and a small carry-over from the previous year’s budget. On the financing outflow side, the kabupaten recorded Rp.15 billion in repayment of loan principal, and Rp. 5 billion in acquisition of financial assets. Kabupaten Mimika, on the other hand, used a budget surplus to pay for a financing deficit. Inflows were recorded from a Rp. 26 billion loan25 and a small carry-over. On the outflow side, Rp. 100 billion were transferred into the reserve fund, Rp. 5.7 billion were used to pay back principal on a loan, and Rp. 5 billion were invested in financial assets. These two cases show that despite the moratorium on borrowing (except from the center), kabupaten/kota governments have taken out sizable loans from the private sector, although the exact sources are not specified. These loans are considerably higher than previous loans taken out by PDAMs and the provincial government. Kabupaten/kota governments used new loans to repay previous loans, invest in kabupaten/kota government-owned enterprises, accumulate reserves, and cover budget deficits. It is clear, however, that regional governments are increasingly making use of below-the-line financial transactions. In fact, the provincial government may well be leading the way: Governor JP Solossa recently announced that Papua intends to purchase a 9.36 percent stake in PT. Freeport for Rp. 3.6 trillion, or double the entire 2003 provincial budget. The proposal is currently under review by the Ministry of Finance.26 24 See Lewis (2004) 25 The APBD document lists the creditor as “Bank X”. 26 Miningindo.com, 13 June 2005.
Table 4.14: Surplus in Papua, 2001-2003 (billion Rp.)Papua Province 2001 2002 2003 Total Expenditure* 715.84 2,072.05 2,392.62Total Revenue* 774.60 2,034.00 2,413.00Net Surplus/Deficit 58.76 -38.05 20.38Net Surplus/Deficit as share of expenditure 8.21% -1.84% 0.85%Carry-Over 65.89 124.60 86.29Reserves end of period 124.65 86.55 106.67 All Kabupaten/Kota in Papua
2001** 2002** 2003** Total Expenditure* 2,969.68 4,339.88 4,736.66Total Revenue* 3,075.45 4,350.85 4,650.80Net Surplus/Deficit 105.77 10.97 -85.86Net Surplus/Deficit as share of expenditure 3.56% 0.25% -1.81%Carry-Over 22.72 172.63 112.86Reserves end of period 128.49 183.61 27.01Notes: * Net of borrowing and repayment **: Inflated data based on 12 out of 14 kab/kota in 2001 & 8 out of 14 kab/kota in 2002 Source: Authors' calculations based on Ministry of Finance data

Regional Finance and Service Delivery in Indonesia’s most Remote Region ________________________________________________________________________________________
32
Table 4.15: Regional Borrowing in Papua, 2001 (billion Rp.)
Year of Loan
Amounts Disbursed
Payments Due
Payments Made
Arrears Arrears Ratio
Regional Government
Province 1981 0.15 0.20 0.08 0.12 0.60
PDAM
Kabupaten Biak Numfor 1997 4.29 1.32 0.01 1.31 0.99Kabupaten Manokwari 1997 4.89 2.01 0.00 2.01 1.00Kabupaten Sorong 1996 5.08 3.09 0.00 3.08 1.00Kota Jayapura 1993 8.01 6.76 0.05 6.71 0.99
Total Papua
Provinces 0.15 0.20 0.08 0.12 0.60Kabupaten/Kota 22.27 13.18 0.07 13.11 0.99
Source: Ministry of Finance
Table 4.16: Financing in Case Study Locations, 2004 (billion Rp.) Biak Numfor Mimika Kota Jayapura 1. Total Revenues 268.69 423.30 258.90 2. Total Expenditures 298.57 350.07 266.39 Budget Surplus (Deficit) -29.87 73.23 -7.49 3. Financing 29.87 -73.23 10.69 Inflows 50.18 33.47 11.69 Transfers from Reserve Fund 0.00 Loans 49.89 26.77 Sale of Financial Assets 0.00 Carry-Over from previous year 0.29 6.70 Outflows 20.31 106.70 1.00 Transfers to Reserve Fund 0.00 100.00 Payment of Loan Principal 15.31 5.70 Acquisition of Financial Assets 5.00 1.00 Carry-Over into following year 0.00 0.00 Note: * 2003 data Source: UNIPA & UNCEN reports; APBD 2004 Mimika; APBD 2004 Biak Numfor
4.3 Recommendations
• Transfer control over the majority of Dana Otsus funds to the kabupaten/kota level. Kabupaten/kota governments are responsible for the majority of basic public services, especially in health and education. In the case of newly established kabupaten, which may still lack capacity and institutional infrastructure, the province should provide a commitment to gradually increase the share of locally managed funds.
• Clarify the main purpose of the Dana Otsus. If the objective of the Dana Otsus is to equalize fiscal resources among kabupaten/kota in Papua, then the formula component needs to be strengthened. If the main objective is to earmark the funds for priority sectors, an enforcement mechanism needs to be put into place.

Papua Public Expenditure Analysis | Overview Report _________________________________________________________________________________________
33
• Clarify the revenue sharing arrangements. It is not clear how the Dana Otsus and the natural resource revenue shares will be distributed among the two existing provinces and the kabupaten/kota in their jurisdiction. Once the MRP is established, this should be one of the priorities to prevent conflict over resources.
• Provide guidelines to kabupaten/kota government on how to record the Dana Otsus revenues in their APBD. This would facilitate the monitoring of the use of these funds.
• Strengthen own source revenue mobilization, by identifying potential local taxes and charges that have not yet been tapped and by improving the administration of existing revenue instruments.
Closely monitor borrowing levels and ensure that practices are in line with central government regulations.

Regional Finance and Service Delivery in Indonesia’s most Remote Region ________________________________________________________________________________________
34
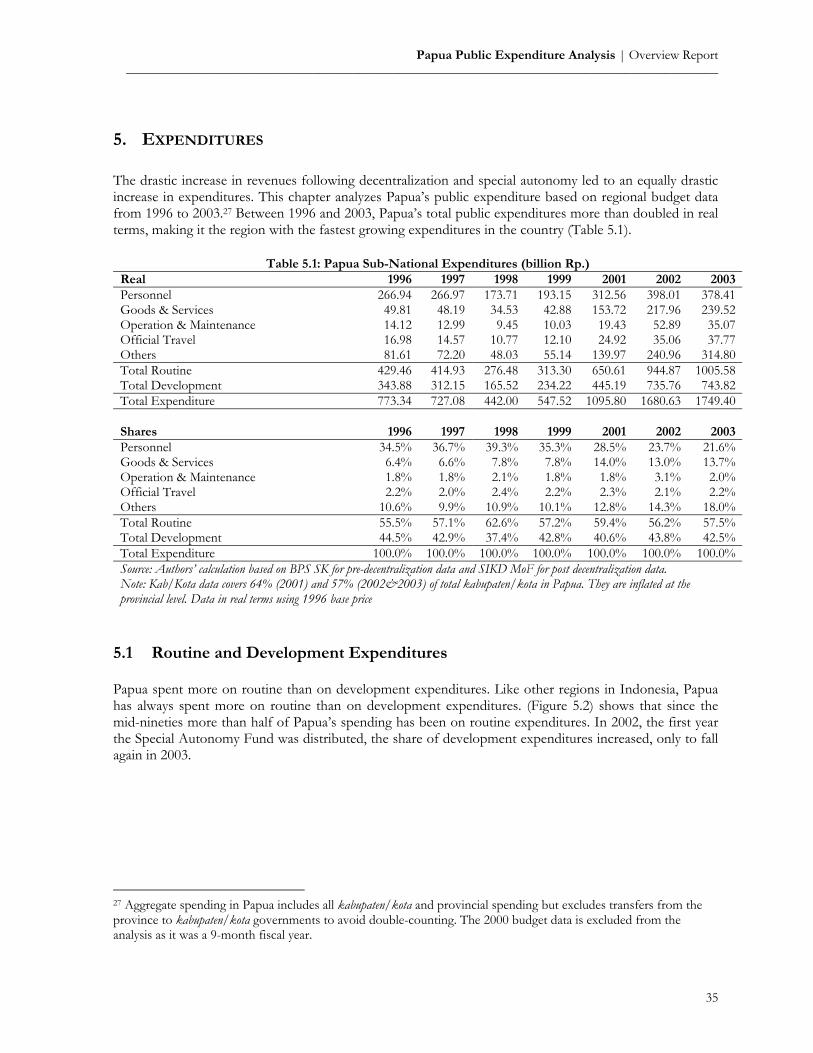
Papua Public Expenditure Analysis | Overview Report _________________________________________________________________________________________
35
5. EXPENDITURES The drastic increase in revenues following decentralization and special autonomy led to an equally drastic increase in expenditures. This chapter analyzes Papua’s public expenditure based on regional budget data from 1996 to 2003.27 Between 1996 and 2003, Papua’s total public expenditures more than doubled in real terms, making it the region with the fastest growing expenditures in the country (Table 5.1).
Table 5.1: Papua Sub-National Expenditures (billion Rp.) Real 1996 1997 1998 1999 2001 2002 2003Personnel 266.94 266.97 173.71 193.15 312.56 398.01 378.41Goods & Services 49.81 48.19 34.53 42.88 153.72 217.96 239.52Operation & Maintenance 14.12 12.99 9.45 10.03 19.43 52.89 35.07Official Travel 16.98 14.57 10.77 12.10 24.92 35.06 37.77Others 81.61 72.20 48.03 55.14 139.97 240.96 314.80Total Routine 429.46 414.93 276.48 313.30 650.61 944.87 1005.58Total Development 343.88 312.15 165.52 234.22 445.19 735.76 743.82Total Expenditure 773.34 727.08 442.00 547.52 1095.80 1680.63 1749.40 Shares 1996 1997 1998 1999 2001 2002 2003Personnel 34.5% 36.7% 39.3% 35.3% 28.5% 23.7% 21.6%Goods & Services 6.4% 6.6% 7.8% 7.8% 14.0% 13.0% 13.7%Operation & Maintenance 1.8% 1.8% 2.1% 1.8% 1.8% 3.1% 2.0%Official Travel 2.2% 2.0% 2.4% 2.2% 2.3% 2.1% 2.2%Others 10.6% 9.9% 10.9% 10.1% 12.8% 14.3% 18.0%Total Routine 55.5% 57.1% 62.6% 57.2% 59.4% 56.2% 57.5%Total Development 44.5% 42.9% 37.4% 42.8% 40.6% 43.8% 42.5%Total Expenditure 100.0% 100.0% 100.0% 100.0% 100.0% 100.0% 100.0%Source: Authors’ calculation based on BPS SK for pre-decentralization data and SIKD MoF for post decentralization data. Note: Kab/Kota data covers 64% (2001) and 57% (2002&2003) of total kabupaten/kota in Papua. They are inflated at the provincial level. Data in real terms using 1996 base price
5.1 Routine and Development Expenditures Papua spent more on routine than on development expenditures. Like other regions in Indonesia, Papua has always spent more on routine than on development expenditures. (Figure 5.2) shows that since the mid-nineties more than half of Papua’s spending has been on routine expenditures. In 2002, the first year the Special Autonomy Fund was distributed, the share of development expenditures increased, only to fall again in 2003.
27 Aggregate spending in Papua includes all kabupaten/kota and provincial spending but excludes transfers from the province to kabupaten/kota governments to avoid double-counting. The 2000 budget data is excluded from the analysis as it was a 9-month fiscal year.

Regional Finance and Service Delivery in Indonesia’s most Remote Region ________________________________________________________________________________________
36
Papua’s “unspecified” recurrent spending increased after decentralization. The largest share of recurrent expenditures is spent on salaries. Expenditures on goods and services as well as on “others” are, however, the items that have experienced the strongest increase since decentralization (Figure 5.1). Goods and services spending increased 300 percent between 1999 and 2001, while “others” more than doubled. Items classified as “others” include unforeseen expenditures, pensions and assistance, other expenditures not included in the previous classifications and others. Petty cash funds of local offices (dinas or kantor) are examples of expenditure reported under “others”. These so called “tactical funds” (dana taktis) are not illegal but difficult to track and prone to corruption and other types of budget misuse. Development spending is generally carried out as planned, although actual spending on a few sectors, most notably manpower and health, significantly exceeded budgeted amounts. Overall, development spending diverged from plan by less than ten percent (Table 5.2). On the other hand, inter-sectoral variation is high, and a few sectors spent significantly more than budgeted, including manpower and health.
Figure 5.1: ... while increasing unspecified expenses
0%
20%
40%
60%
80%
100%
1996 1997 1998 1999 2001 2002 2003
Others/Unspecif ied
Off icial Travel
Operation & Maintenance
Goods & Services
Personnel
Source: BPS SK various editions (pre-decentralization data) and SIKD – MoF various years (post-decentralization data)
Figure 5.2: More Spending on Routine…
0%
10%
20%
30%
40%
50%
60%
70%
1996 1997 1998 1999 2001 2002 2003
Total Routine Total Development
Source: BPS SK various editions (pre-decentralization data) and SIKD – MoF various years (post-decentralization data)
Table 5.2: Budgeted vs. Actual Spending
2001 2002
Kabupaten/Kota Budgeted Actual Realization
Rate Budgeted Actual
Realization Rate
Personnel 517.81 31.15 103% 714.61 70.56 94%Goods & Services 153.15 236.91 155% 275.26 37.71 123%Operation & Maintenance 21.87 25.68 117% 72.77 89.11 122%Official Travel 41.67 43.67 105% 42.20 55.39 131%Other 148.20 52.90 103% 173.58 244.60 141%Total Routine 882.70 990.31 112% 1,278.41 1,397.37 109%
Total Development 984.62 939.00 95% 798.54 863.00 108%
Source: Authors' calculation based on SIKD/MoF. 2001 kabupaten/kota data is based on non-random sample of nine kabupaten/kota in Papua and 2002 kabupaten/kota data is based on non-random sample of seven kabupaten/kota in Papua that submitted planned and realized data.
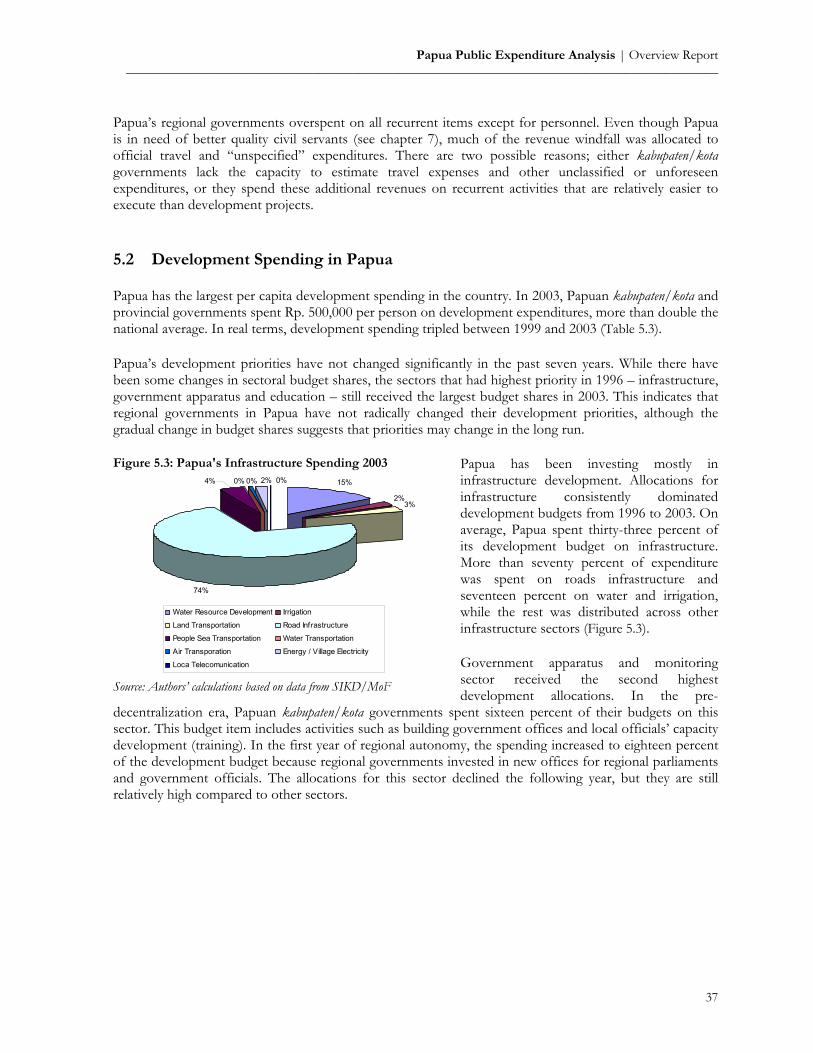
Papua Public Expenditure Analysis | Overview Report _________________________________________________________________________________________
37
Papua’s regional governments overspent on all recurrent items except for personnel. Even though Papua is in need of better quality civil servants (see chapter 7), much of the revenue windfall was allocated to official travel and “unspecified” expenditures. There are two possible reasons; either kabupaten/kota governments lack the capacity to estimate travel expenses and other unclassified or unforeseen expenditures, or they spend these additional revenues on recurrent activities that are relatively easier to execute than development projects. 5.2 Development Spending in Papua Papua has the largest per capita development spending in the country. In 2003, Papuan kabupaten/kota and provincial governments spent Rp. 500,000 per person on development expenditures, more than double the national average. In real terms, development spending tripled between 1999 and 2003 (Table 5.3). Papua’s development priorities have not changed significantly in the past seven years. While there have been some changes in sectoral budget shares, the sectors that had highest priority in 1996 – infrastructure, government apparatus and education – still received the largest budget shares in 2003. This indicates that regional governments in Papua have not radically changed their development priorities, although the gradual change in budget shares suggests that priorities may change in the long run.
Papua has been investing mostly in infrastructure development. Allocations for infrastructure consistently dominated development budgets from 1996 to 2003. On average, Papua spent thirty-three percent of its development budget on infrastructure. More than seventy percent of expenditure was spent on roads infrastructure and seventeen percent on water and irrigation, while the rest was distributed across other infrastructure sectors (Figure 5.3). Government apparatus and monitoring sector received the second highest development allocations. In the pre-
decentralization era, Papuan kabupaten/kota governments spent sixteen percent of their budgets on this sector. This budget item includes activities such as building government offices and local officials’ capacity development (training). In the first year of regional autonomy, the spending increased to eighteen percent of the development budget because regional governments invested in new offices for regional parliaments and government officials. The allocations for this sector declined the following year, but they are still relatively high compared to other sectors.
Figure 5.3: Papua's Infrastructure Spending 200315%
2%3%
74%
0% 2% 0%0%4%
Water Resource Development Irrigation
Land Transportation Road Infrastructure
People Sea Transportation Water Transportation
Air Transporation Energy / Village Electricity
Loca Telecomunication
Source: Authors’ calculations based on data from SIKD/MoF

Regional Finance and Service Delivery in Indonesia’s most Remote Region ________________________________________________________________________________________
38
Table 5.3: Papua's Sub-National Development Spending by Sector (billion Rp.)
Real 1996 1997 1998 1999 2001 2002 2003
Industry 0.42 0.41 0.28 1.23 2.31 2.22 4.28Agriculture and Forestry 11.36 11.81 5.70 11.09 26.66 57.67 42.43Manpower 1.01 0.60 0.43 0.61 1.98 4.50 2.89Trade, Local Business Devt, Local Finance and Coop 22.00 11.33 6.93 14.53 26.49 34.58 35.09Mining 1.24 0.83 0.34 0.47 0.91 1.64 2.05Tourism 3.50 1.29 0.89 1.35 3.83 3.61 3.07Regional Devt and Settlement 19.77 20.24 13.31 16.72 24.05 55.94 59.22Environment and Spatial Planning 5.38 4.30 4.43 7.33 12.71 17.57 18.92Education 31.26 26.92 13.81 25.19 41.01 75.57 76.86People and Family Welfare 0.10 0.78 0.47 0.17 0.47 1.93 1.14Health 18.08 18.87 8.52 14.43 31.26 59.20 63.28Housing and Settlement 3.20 1.20 2.57 24.24 33.33 32.10 21.24Religion 2.37 1.95 0.93 1.77 5.70 5.31 7.03Science and Technology 4.64 4.10 2.15 3.69 4.27 12.22 9.12Law 2.30 2.27 0.32 1.55 1.45 3.22 1.88Government Apparatus and Monitoring 55.38 52.43 26.54 26.38 82.48 95.46 89.13Politics, Information, Communication and Mass Media 3.07 2.53 2.13 1.06 2.51 5.81 9.75Security and Public Order 2.81 0.80 0.27 0.52 6.71 9.86 26.64Infrastructure 134.45 133.33 66.07 58.61 120.34 219.96 212.00National Culture, Faith in God, Youth and Sports 2.65 3.58 2.12 5.15 11.21 28.73 34.97Social Welfare, Women Empowerment, Children & Teens 2.61 2.86 1.15 2.94 5.51 8.68 22.83Others 16.27 9.75 6.17 15.20 0.00 0.00 0.00Total development 343.88 312.15 165.52 234.22 445.19 735.76 743.82
Share 1996 1997 1998 1999 2001 2002 2003
Industry 0.12% 0.13% 0.17% 0.53% 0.52% 0.30% 0.58%Agriculture and Forestry 3.30% 3.78% 3.45% 4.73% 5.99% 7.84% 5.70%Manpower 0.29% 0.19% 0.26% 0.26% 0.44% 0.61% 0.39%Trade, Local Business Devt, Local Finance and Coop 6.40% 3.63% 4.19% 6.20% 5.95% 4.70% 4.72%Mining 0.36% 0.27% 0.21% 0.20% 0.21% 0.22% 0.28%Tourism 1.02% 0.41% 0.54% 0.58% 0.86% 0.49% 0.41%Regional Devt and Settlement 5.75% 6.48% 8.04% 7.14% 5.40% 7.60% 7.96%
Environment and Spatial Planning 1.57% 1.38% 2.67% 3.13% 2.85% 2.39% 2.54%Education 9.09% 8.62% 8.34% 10.75% 9.21% 10.27% 10.33%
People and Family Welfare 0.03% 0.25% 0.29% 0.07% 0.11% 0.26% 0.15%Health 5.26% 6.04% 5.15% 6.16% 7.02% 8.05% 8.51%
Housing and Settlement 0.93% 0.38% 1.55% 10.35% 7.49% 4.36% 2.86%Religion 0.69% 0.62% 0.56% 0.76% 1.28% 0.72% 0.94%Science and Technology 1.35% 1.31% 1.30% 1.57% 0.96% 1.66% 1.23%Law 0.67% 0.73% 0.19% 0.66% 0.32% 0.44% 0.25%Government Apparatus and Monitoring 16.10% 16.80% 16.03% 11.26% 18.53% 12.97% 11.98%
Politics, Information, Communication and Mass Media 0.89% 0.81% 1.29% 0.45% 0.56% 0.79% 1.31%Security and Public Order 0.82% 0.26% 0.16% 0.22% 1.51% 1.34% 3.58%Infrastructure 39.10% 42.71% 39.92% 25.02% 27.03% 29.90% 28.50%
National Culture, Faith in God, Youth and Sports 0.77% 1.15% 1.28% 2.20% 2.52% 3.90% 4.70%Social Welfare, Women Empowerment, Children & Teens 0.76% 0.92% 0.69% 1.26% 1.24% 1.18% 3.07%Others 4.73% 3.12% 3.73% 6.49% Total development 100.00% 100.00% 100.00% 100.00% 100.00% 100.00% 100.00%
Source: Authors’ calculation based on BPS SK for pre-decentralization data and SIKD MoF for post decentralization data. Note: Kab/Kota data covers 64% (2001) and 57% (2002&2003) of total kabupaten/kota in Papua. They are inflated at the provincial level. Data in real terms using 1996 base price.
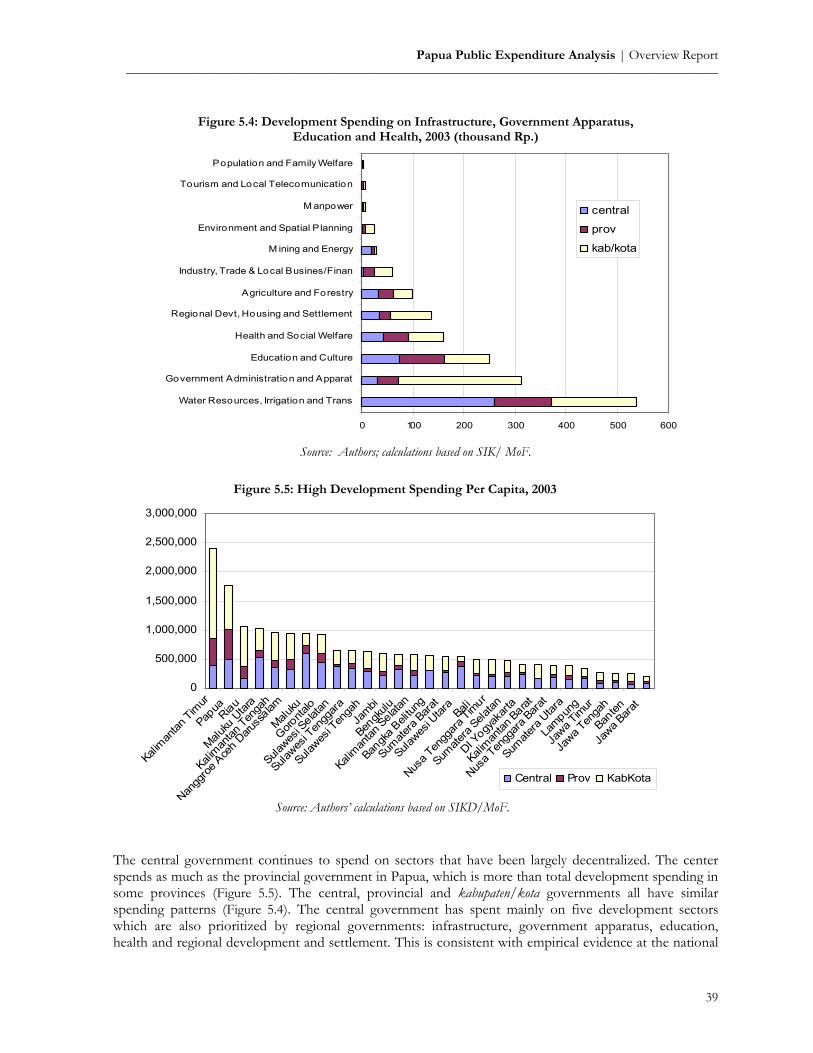
Papua Public Expenditure Analysis | Overview Report _________________________________________________________________________________________
39
The central government continues to spend on sectors that have been largely decentralized. The center spends as much as the provincial government in Papua, which is more than total development spending in some provinces (Figure 5.5). The central, provincial and kabupaten/kota governments all have similar spending patterns (Figure 5.4). The central government has spent mainly on five development sectors which are also prioritized by regional governments: infrastructure, government apparatus, education, health and regional development and settlement. This is consistent with empirical evidence at the national
Figure 5.4: Development Spending on Infrastructure, Government Apparatus, Education and Health, 2003 (thousand Rp.)
0 100 200 300 400 500 600
Water Resources, Irrigation and Trans
Government Administration and Apparat
Education and Culture
Health and Social Welfare
Regional Devt, Housing and Settlement
Agriculture and Forestry
Industry, Trade & Local Busines/Finan
M ining and Energy
Environment and Spatial P lanning
M anpower
Tourism and Local Telecomunication
Population and Family Welfare
central
prov
kab/kota
Source: Authors; calculations based on SIK/ MoF.
Figure 5.5: High Development Spending Per Capita, 2003
0
500,000
1,000,000
1,500,000
2,000,000
2,500,000
3,000,000
Kalim
antan
Timur
Papua
Riau
Maluku
Utar
a
Kaliman
tan T
enga
h
Nangg
roe A
ceh D
aruss
alam
Maluku
Goronta
lo
Sulawes
i Selat
an
Sulawes
i Ten
ggara
Sulawes
i Ten
gahJa
mbi
Bengk
ulu
Kaliman
tan S
elatan
Bangk
a Beli
tung
Sumate
ra Bar
at
Sulawes
i Utar
aBali
Nusa T
engg
ara T
imur
Sumate
ra Sela
tan
DI Yogy
akart
a
Kalim
antan
Barat
Nusa T
engg
ara B
arat
Sumate
ra U
tara
Lampun
g
Jawa T
imur
Jawa T
enga
h
Banten
Jawa B
arat
Central Prov KabKota
Source: Authors’ calculations based on SIKD/MoF.
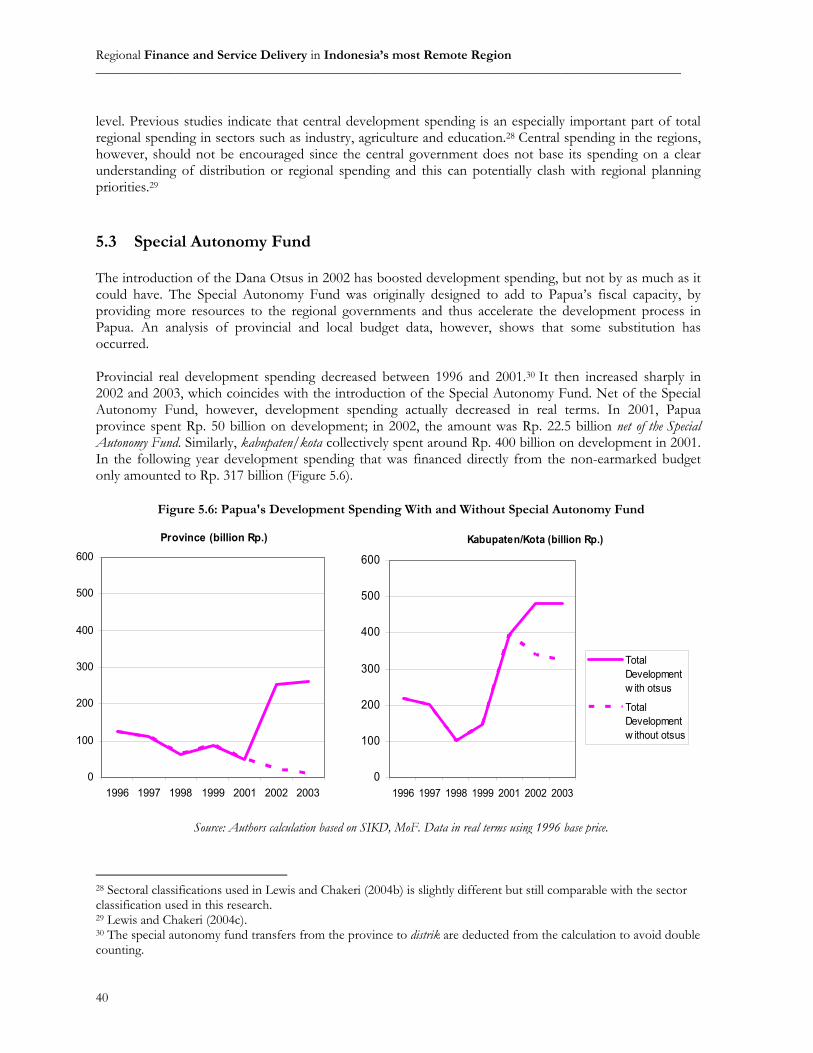
Regional Finance and Service Delivery in Indonesia’s most Remote Region ________________________________________________________________________________________
40
level. Previous studies indicate that central development spending is an especially important part of total regional spending in sectors such as industry, agriculture and education.28 Central spending in the regions, however, should not be encouraged since the central government does not base its spending on a clear understanding of distribution or regional spending and this can potentially clash with regional planning priorities.29 5.3 Special Autonomy Fund The introduction of the Dana Otsus in 2002 has boosted development spending, but not by as much as it could have. The Special Autonomy Fund was originally designed to add to Papua’s fiscal capacity, by providing more resources to the regional governments and thus accelerate the development process in Papua. An analysis of provincial and local budget data, however, shows that some substitution has occurred. Provincial real development spending decreased between 1996 and 2001.30 It then increased sharply in 2002 and 2003, which coincides with the introduction of the Special Autonomy Fund. Net of the Special Autonomy Fund, however, development spending actually decreased in real terms. In 2001, Papua province spent Rp. 50 billion on development; in 2002, the amount was Rp. 22.5 billion net of the Special Autonomy Fund. Similarly, kabupaten/kota collectively spent around Rp. 400 billion on development in 2001. In the following year development spending that was financed directly from the non-earmarked budget only amounted to Rp. 317 billion (Figure 5.6).
28 Sectoral classifications used in Lewis and Chakeri (2004b) is slightly different but still comparable with the sector classification used in this research. 29 Lewis and Chakeri (2004c). 30 The special autonomy fund transfers from the province to distrik are deducted from the calculation to avoid double counting.
Figure 5.6: Papua's Development Spending With and Without Special Autonomy Fund
Province (billion Rp.)
0
100
200
300
400
500
600
1996 1997 1998 1999 2001 2002 2003
Kabupaten/Kota (billion Rp.)
0
100
200
300
400
500
600
1996 1997 1998 1999 2001 2002 2003
TotalDevelopmentw ith otsus
TotalDevelopmentw ithout otsus
Source: Authors calculation based on SIKD, MoF. Data in real terms using 1996 base price.

Papua Public Expenditure Analysis | Overview Report _________________________________________________________________________________________
41
As a consequence, the share of routine spending in the non-earmarked APBD increased to seventy-five percent in 2003. The Dana Otsus thus not only boosted development spending, but also indirectly increased routine expenditures (Figure 5.7). To some extent, this is desirable, as capital investments should generally be accompanied by adequate recurrent spending. As the analysis of routine spending demonstrates, however, the increase in aggregate financing has disproportionately benefited unspecified routine spending .
Table 5.4: Dana Otsus by Sector, 2003 (billion Rp.)
Programs Cash Transfer TOTAL %
Sector By province By
Kab/Kota By Kab/Kota
Industry 4.34 2.77 0.43 7.54 0.51%Agriculture and Forestry 68.05 29.63 7.86 105.54 7.12%
Manpower 5.10 - 3.77 8.87 0.60%Trade, Local Business Devt, Local Finance and Coop 34.01 19.30 5.85 59.16 3.99%Mining 5.25 - - 5.25 0.35%Tourism 6.98 - 0.90 7.88 0.53%Regional Devt and Settlement 35.41 5.71 13.91 55.03 3.71%Environment and Spatial Planning 10.33 0.43 - 10.76 0.73%Education 122.33 74.29 37.34 233.96 15.79%
Health 111.03 46.55 20.44 178.02 12.01%
Housing and Settlement 18.38 1.30 - 19.68 1.33%Religion 7.41 - 5.96 13.37 0.90%Science and Technology 13.31 - - 13.31 0.90%Law 2.95 - - 2.95 0.20%Government Apparatus and Monitoring 87.54 9.60 78.58 175.72 11.86%
Politics, Information, Communication and Mass Media 13.03 - 1.18 14.21 0.96%Security and Public Order 3.14 - 1.51 4.65 0.31%Infrastructure 270.05 119.11 52.53 441.69 29.81%
National Culture, Faith in God, Youth and Sports 74.69 - 2.65 77.34 5.22%Social Welfare, Women Empowerment, Children & Teens 14.57 - 8.92 23.50 1.59%Unclassified - - 23.41 23.41 1.58%Total 907.90 308.69 265.24 1,481.83 100.00%
Source: Authors' Calculation based on Special Autonomy Fund Realized Expenditure report by Papua Provincial Govt, Dec 2003
The Special Autonomy Fund has not been spent according to the stipulations in the regional regulations.31 In 2003, infrastructure was the main priority and received thirty percent of the allocation while health and
31 In 2003, the special autonomy fund allocations were stipulated by provincial regional regulation (PERDA) No.1/2003 on provincial budget.
Figure 5.7: Routine Share in non-earmarked APBD has increased
0%
10%
20%
30%
40%
50%
60%
70%
80%
1996 1997 1998 1999 2001 2002 2003
Routine
Development (netof Dana Otsus)
Source; Authors’ calculations based on SIKD/MoF. Figures in real terms based on 1996 base price
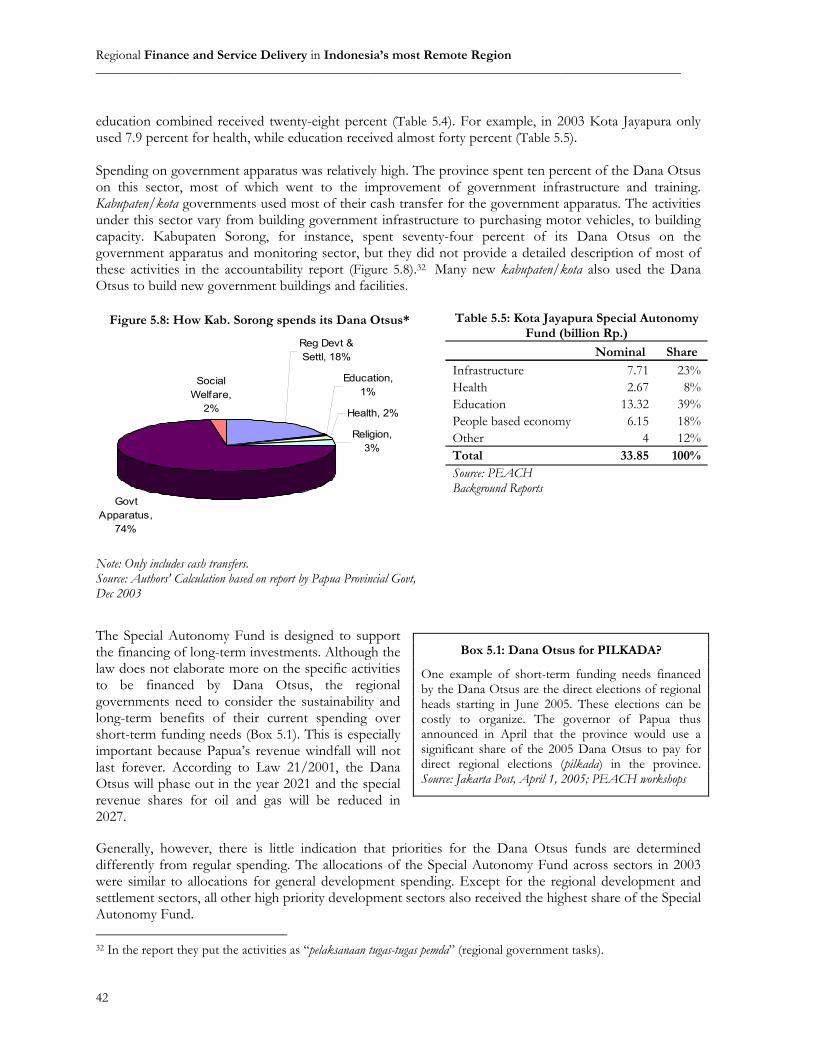
Regional Finance and Service Delivery in Indonesia’s most Remote Region ________________________________________________________________________________________
42
education combined received twenty-eight percent (Table 5.4). For example, in 2003 Kota Jayapura only used 7.9 percent for health, while education received almost forty percent (Table 5.5). Spending on government apparatus was relatively high. The province spent ten percent of the Dana Otsus on this sector, most of which went to the improvement of government infrastructure and training. Kabupaten/kota governments used most of their cash transfer for the government apparatus. The activities under this sector vary from building government infrastructure to purchasing motor vehicles, to building capacity. Kabupaten Sorong, for instance, spent seventy-four percent of its Dana Otsus on the government apparatus and monitoring sector, but they did not provide a detailed description of most of these activities in the accountability report (Figure 5.8).32 Many new kabupaten/kota also used the Dana Otsus to build new government buildings and facilities.
The Special Autonomy Fund is designed to support the financing of long-term investments. Although the law does not elaborate more on the specific activities to be financed by Dana Otsus, the regional governments need to consider the sustainability and long-term benefits of their current spending over short-term funding needs (Box 5.1). This is especially important because Papua’s revenue windfall will not last forever. According to Law 21/2001, the Dana Otsus will phase out in the year 2021 and the special revenue shares for oil and gas will be reduced in 2027. Generally, however, there is little indication that priorities for the Dana Otsus funds are determined differently from regular spending. The allocations of the Special Autonomy Fund across sectors in 2003 were similar to allocations for general development spending. Except for the regional development and settlement sectors, all other high priority development sectors also received the highest share of the Special Autonomy Fund. 32 In the report they put the activities as “pelaksanaan tugas-tugas pemda” (regional government tasks).
Table 5.5: Kota Jayapura Special Autonomy Fund (billion Rp.)
Nominal Share
Infrastructure 7.71 23%Health 2.67 8%Education 13.32 39%People based economy 6.15 18%Other 4 12%Total 33.85 100%Source: PEACH Background Reports
Figure 5.8: How Kab. Sorong spends its Dana Otsus*
Reg Devt & Settl, 18%
Education, 1%
Health, 2%
Religion, 3%
Govt Apparatus,
74%
Social Welfare,
2%
Note: Only includes cash transfers. Source: Authors' Calculation based on report by Papua Provincial Govt, Dec 2003
Box 5.1: Dana Otsus for PILKADA?
One example of short-term funding needs financed by the Dana Otsus are the direct elections of regional heads starting in June 2005. These elections can be costly to organize. The governor of Papua thus announced in April that the province would use a significant share of the 2005 Dana Otsus to pay for direct regional elections (pilkada) in the province. Source: Jakarta Post, April 1, 2005; PEACH workshops

Papua Public Expenditure Analysis | Overview Report _________________________________________________________________________________________
43
5.4 Recommendations • Improve accounting of routine expenditures and reduce the number of “unspecified” items in the budget. In general,
Papua has been spending more on routine than on development expenditures. The more alarming finding is the fact that the fastest growing routine spending is in the “others” category. Such large unspecified expenditures potentially encourage budget misuse and should thus be reduced.
• If the objective of the Dana Otsus is to provide earmarked funding for priority sectors, adequate enforcement and monitoring mechanisms must be established. The Dana Otsus is currently not spent according to the provincial regulations. Education and health shares are lower than infrastructure’s. The usefulness and feasibility of specifying sectoral shares for the Dana Otsus should be evaluated carefully. Earmarking without enforcement is inefficient, as proven by the case study locations.
• Clarify what activities can be financed by the Dana Otsus. The analysis shows that a significant share of the Dana Otsus was spent on government apparatus and on activities that do not necessarily have a long-term benefit.
• Besides spending on the human development sectors, kabupaten/kota governments should invest in other programs that yield longer term benefits. As Papua’s revenue windfall will end within the foreseeable future, regional governments should be prudent in the use of these resources including the Dana Otsus.

Regional Finance and Service Delivery in Indonesia’s most Remote Region ________________________________________________________________________________________
44

Papua Public Expenditure Analysis | Overview Report _________________________________________________________________________________________
45
6. SECTORAL ANALYSIS Special autonomy is designed to boost spending especially in the health, education and infrastructure sectors. The ultimate objective is to accelerate Papua’s development and increase the quality of life of its people, especially ethnic Papuans. This chapter evaluates regional governments’ expenditures in these three key sectors. The chapter analyzes the needs of each sector and the kabupaten/kota governments’ attempt to meet those needs through the allocation of expenditures. Investment in health, education and infrastructure development is thoroughly analyzed by looking at realized expenditures. 6.1 Health
6.1.1 The Health Sector in Papua
Human development outcomes vary greatly across Papua. In 2002, UNDP’s Human Development Report placed Papua in the “lower medium” category. Papua’s Human Development Index (HDI) is fifty-nine, lower than the national average of sixty-five.33 This low score is due to several reasons, including the high proportion of the population without access to clean water and the high rate of child malnutrition. There is, however, great variation among kabupaten/kota in Papua. For example, the HDI in Kabupaten Sorong is seventy while Kabupaten Jayawijaya is slightly above forty. It indicates a significant gap between the quality of life in accessible coastal areas and the more isolated highlands. Few Papuans have access to good health facilities. The region has a network of twelve public hospitals, six private hospitals, 213 local health centers (Puskesmas) and 940 secondary health centers (Pustu) and around 200 village medication homes (balai pengobatan).34 Papua’s geographical condition, however, presents more challenges to health development. More than ninety percent of villages in Papua do not have basic health facilities such as health centers, doctors and midwives, and seventy percent of these villages have difficult access to such facilities in other villages (Figure 6.1). The Integrated Health Service units (Posyandu) seem to be the most accessible facilities as they exist in half of the villages in region, but posyandu can not provide a wide range of medical services. They can only provide limited services such as immunization and basic infant examinations. Villagers who do not have hospitals in their village have to go to the nearest one in other villages. The average distance of these neighboring health facilities is seventy-five km. In Papua traveling for seventy-
33 BPS, Bappenas and UNDP (2004). HDI is an aggregate index indicating quality of human life with a maximum level of 100. ‘lower medium’ HDI category ranges from 50 – 65.99 and ‘upper medium’ category ranges from 66-79.99. Fourteen out of thirty provinces in Indonesia belong to the ‘lower medium’ category and the rest in the ‘upper medium’ category. 34 “BPS Papua dalam Angka 2003”.
Figure 6.1: Share of Villages with Difficult Access to Health Facilities in Other Villages
0% 20% 40% 60% 80%
Medicine Store
Pharmacists
Doctor
Maternity Hospital
Hospital
Midw ife
Village Medical Post
Clinic
Village Maternal Post (Polindes)
Health Center (Puskesmas)
Mini Puskesmas (Pustu
Integrated Health Service(Posyandu)
Source: Author’s calculation based on PODES 2003
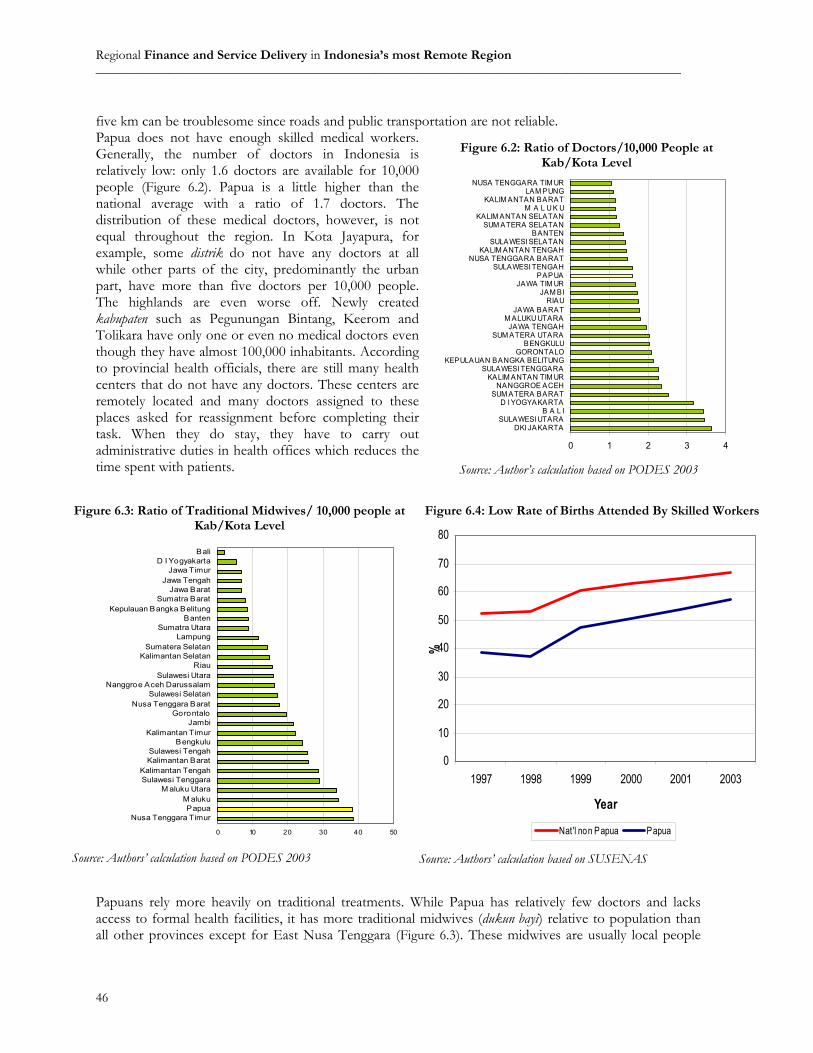
Regional Finance and Service Delivery in Indonesia’s most Remote Region ________________________________________________________________________________________
46
five km can be troublesome since roads and public transportation are not reliable. Papua does not have enough skilled medical workers. Generally, the number of doctors in Indonesia is relatively low: only 1.6 doctors are available for 10,000 people (Figure 6.2). Papua is a little higher than the national average with a ratio of 1.7 doctors. The distribution of these medical doctors, however, is not equal throughout the region. In Kota Jayapura, for example, some distrik do not have any doctors at all while other parts of the city, predominantly the urban part, have more than five doctors per 10,000 people. The highlands are even worse off. Newly created kabupaten such as Pegunungan Bintang, Keerom and Tolikara have only one or even no medical doctors even though they have almost 100,000 inhabitants. According to provincial health officials, there are still many health centers that do not have any doctors. These centers are remotely located and many doctors assigned to these places asked for reassignment before completing their task. When they do stay, they have to carry out administrative duties in health offices which reduces the time spent with patients.
Papuans rely more heavily on traditional treatments. While Papua has relatively few doctors and lacks access to formal health facilities, it has more traditional midwives (dukun bayi) relative to population than all other provinces except for East Nusa Tenggara (Figure 6.3). These midwives are usually local people
Figure 6.2: Ratio of Doctors/10,000 People at Kab/Kota Level
0 1 2 3 4
DKI JAKARTASULAWESI UTARA
B A L ID I YOGYAKARTA
SUM ATERA BARATNANGGROE ACEH
KALIM ANTAN TIM URSULAWESI TENGGARA
KEPULAUAN BANGKA BELITUNGGORONTALO
BENGKULUSUM ATERA UTARA
JAWA TENGAHM ALUKU UTARA
JAWA BARATRIAU
JAM BIJAWA TIM UR
PAPUASULAWESI TENGAH
NUSA TENGGARA BARATKALIM ANTAN TENGAH
SULAWESI SELATANBANTEN
SUM ATERA SELATANKALIM ANTAN SELATAN
M A L U K UKALIM ANTAN BARAT
LAM PUNGNUSA TENGGARA TIM UR
Source: Author’s calculation based on PODES 2003
Figure 6.3: Ratio of Traditional Midwives/ 10,000 people at Kab/Kota Level
0 10 20 30 40 50
Nusa Tenggara TimurPapua
M alukuM aluku Utara
Sulawesi TenggaraKalimantan Tengah
Kalimantan BaratSulawesi Tengah
BengkuluKalimantan Timur
JambiGorontalo
Nusa Tenggara BaratSulawesi Selatan
Nanggroe Aceh DarussalamSulawesi Utara
RiauKalimantan Selatan
Sumatera SelatanLampung
Sumatra UtaraBanten
Kepulauan Bangka BelitungSumatra Barat
Jawa BaratJawa Tengah
Jawa TimurD I Yogyakarta
Bali
Source: Authors’ calculation based on PODES 2003
Figure 6.4: Low Rate of Births Attended By Skilled Workers
0
10
20
30
40
50
60
70
80
1997 1998 1999 2000 2001 2003
Year
%
Nat'l non Papua Papua
Source: Authors’ calculation based on SUSENAS
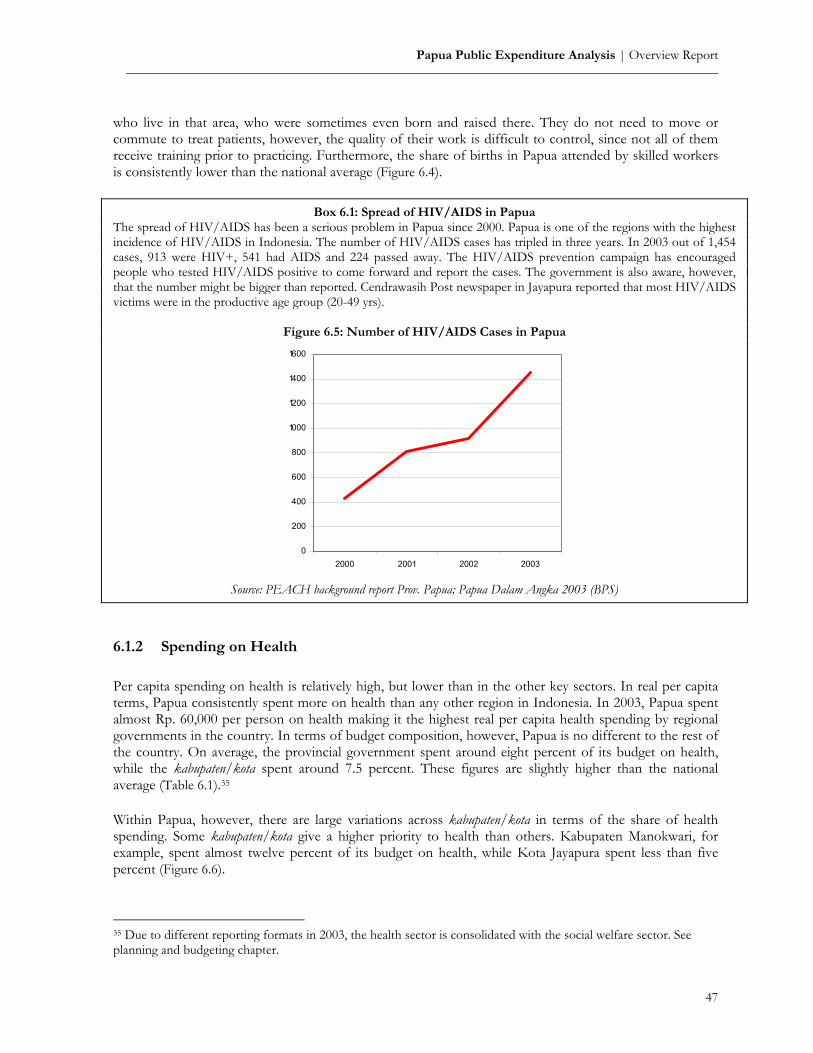
Papua Public Expenditure Analysis | Overview Report _________________________________________________________________________________________
47
who live in that area, who were sometimes even born and raised there. They do not need to move or commute to treat patients, however, the quality of their work is difficult to control, since not all of them receive training prior to practicing. Furthermore, the share of births in Papua attended by skilled workers is consistently lower than the national average (Figure 6.4).
6.1.2 Spending on Health
Per capita spending on health is relatively high, but lower than in the other key sectors. In real per capita terms, Papua consistently spent more on health than any other region in Indonesia. In 2003, Papua spent almost Rp. 60,000 per person on health making it the highest real per capita health spending by regional governments in the country. In terms of budget composition, however, Papua is no different to the rest of the country. On average, the provincial government spent around eight percent of its budget on health, while the kabupaten/kota spent around 7.5 percent. These figures are slightly higher than the national average (Table 6.1).35 Within Papua, however, there are large variations across kabupaten/kota in terms of the share of health spending. Some kabupaten/kota give a higher priority to health than others. Kabupaten Manokwari, for example, spent almost twelve percent of its budget on health, while Kota Jayapura spent less than five percent (Figure 6.6).
35 Due to different reporting formats in 2003, the health sector is consolidated with the social welfare sector. See planning and budgeting chapter.
Box 6.1: Spread of HIV/AIDS in Papua The spread of HIV/AIDS has been a serious problem in Papua since 2000. Papua is one of the regions with the highest incidence of HIV/AIDS in Indonesia. The number of HIV/AIDS cases has tripled in three years. In 2003 out of 1,454 cases, 913 were HIV+, 541 had AIDS and 224 passed away. The HIV/AIDS prevention campaign has encouraged people who tested HIV/AIDS positive to come forward and report the cases. The government is also aware, however, that the number might be bigger than reported. Cendrawasih Post newspaper in Jayapura reported that most HIV/AIDS victims were in the productive age group (20-49 yrs).
Figure 6.5: Number of HIV/AIDS Cases in Papua
0
200
400
600
800
1000
1200
1400
1600
2000 2001 2002 2003
Source: PEACH background report Prov. Papua; Papua Dalam Angka 2003 (BPS)
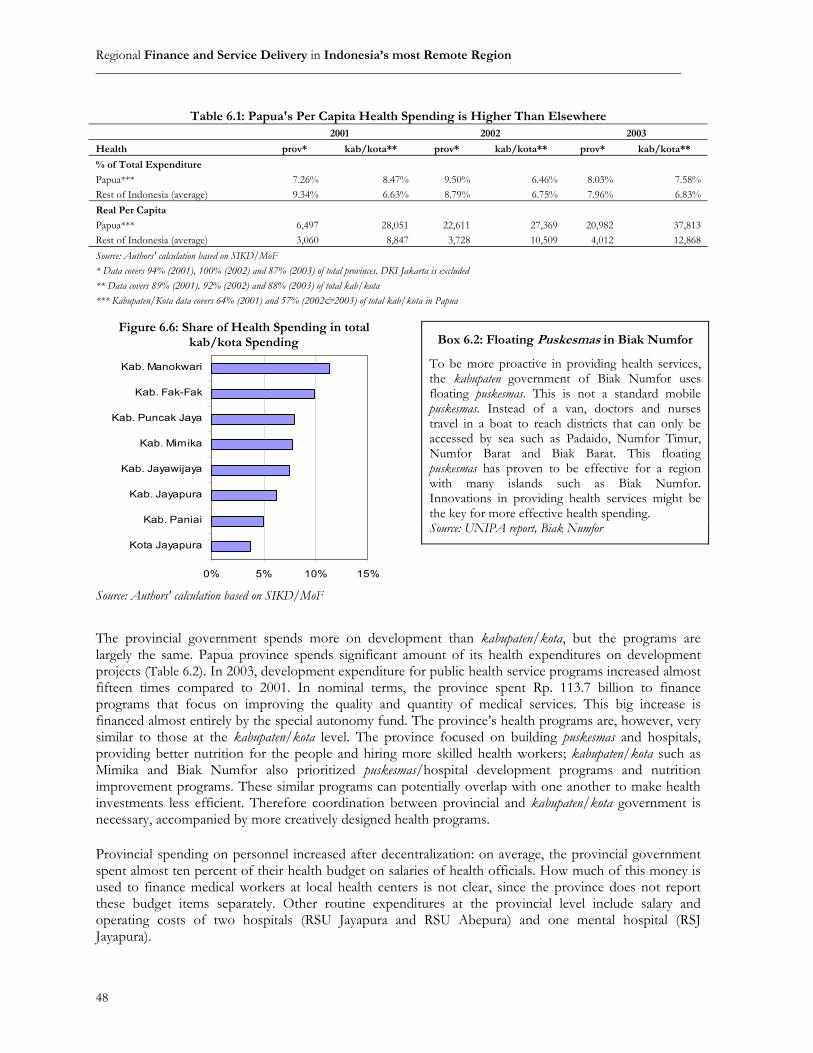
Regional Finance and Service Delivery in Indonesia’s most Remote Region ________________________________________________________________________________________
48
The provincial government spends more on development than kabupaten/kota, but the programs are largely the same. Papua province spends significant amount of its health expenditures on development projects (Table 6.2). In 2003, development expenditure for public health service programs increased almost fifteen times compared to 2001. In nominal terms, the province spent Rp. 113.7 billion to finance programs that focus on improving the quality and quantity of medical services. This big increase is financed almost entirely by the special autonomy fund. The province’s health programs are, however, very similar to those at the kabupaten/kota level. The province focused on building puskesmas and hospitals, providing better nutrition for the people and hiring more skilled health workers; kabupaten/kota such as Mimika and Biak Numfor also prioritized puskesmas/hospital development programs and nutrition improvement programs. These similar programs can potentially overlap with one another to make health investments less efficient. Therefore coordination between provincial and kabupaten/kota government is necessary, accompanied by more creatively designed health programs. Provincial spending on personnel increased after decentralization: on average, the provincial government spent almost ten percent of their health budget on salaries of health officials. How much of this money is used to finance medical workers at local health centers is not clear, since the province does not report these budget items separately. Other routine expenditures at the provincial level include salary and operating costs of two hospitals (RSU Jayapura and RSU Abepura) and one mental hospital (RSJ Jayapura).
Table 6.1: Papua's Per Capita Health Spending is Higher Than Elsewhere 2001 2002 2003
Health prov* kab/kota** prov* kab/kota** prov* kab/kota**
% of Total Expenditure Papua*** 7.26% 8.47% 9.50% 6.46% 8.03% 7.58%Rest of Indonesia (average) 9.34% 6.63% 8.79% 6.75% 7.96% 6.83%Real Per Capita Papua*** 6,497 28,051 22,611 27,369 20,982 37,813Rest of Indonesia (average) 3,060 8,847 3,728 10,509 4,012 12,868Source: Authors' calculation based on SIKD/MoF * Data covers 94% (2001), 100% (2002) and 87% (2003) of total provinces. DKI Jakarta is excluded ** Data covers 89% (2001), 92% (2002) and 88% (2003) of total kab/kota *** Kabupaten/Kota data covers 64% (2001) and 57% (2002&2003) of total kab/kota in Papua
Box 6.2: Floating Puskesmas in Biak Numfor
To be more proactive in providing health services, the kabupaten government of Biak Numfor uses floating puskesmas. This is not a standard mobile puskesmas. Instead of a van, doctors and nurses travel in a boat to reach districts that can only be accessed by sea such as Padaido, Numfor Timur, Numfor Barat and Biak Barat. This floating puskesmas has proven to be effective for a region with many islands such as Biak Numfor. Innovations in providing health services might be the key for more effective health spending. Source: UNIPA report, Biak Numfor
Figure 6.6: Share of Health Spending in total kab/kota Spending
0% 5% 10% 15%
Kota Jayapura
Kab. Paniai
Kab. Jayapura
Kab. Jayawijaya
Kab. Mimika
Kab. Puncak Jaya
Kab. Fak-Fak
Kab. Manokwari
Source: Authors' calculation based on SIKD/MoF

Papua Public Expenditure Analysis | Overview Report _________________________________________________________________________________________
49
Table 6.2: Health Expenditures in Papua, 2001-03 (billion Rp.) Province Routine 2001 2002 2003 Health Office wage 2.74 3.47 3.02 non-wage 1.06 2.06 2.72 Others wage 3.19 4.39 2.89 non-wage 5.90 6.74 4.25 Development Public Health Service Programs 2.64 37.18 30.69 Others 0.58 0.66 0.54 TOTAL Province 16.11 54.50 44.12 Kab/Kota Routine 2001 2002 2003 Health Office wage 18.03 22.69 19.47 non-wage 2.41 6.37 7.16 Others wage 17.55 18.87 20.11 non-wage 7.23 5.56 4.41 Development Public Health Service Programs 14.10 13.07 13.40 Others 13.92 8.23 18.60 TOTAL Kab/Kota 73.24 74.78 83.15 Source: Authors' calculation based on SIKD/MoF Note: Only includes major programs that exist in all kabupaten/kota.
The share of routine spending is, however, much higher among kabupaten/kota governments. Almost fifty percent of the budget is used to pay salaries. Other than health offices, kabupaten/kota reported detailed routine expenditures for health centers and hospitals (lumped together under “others” in table 6.2). These expenses are for the salaries of doctors, nurses and other medical workers who work for the health centers or hospitals in kabupaten/kota. Unfortunately, details on how much of these salary expenses are paid to functional staff (doctors, nurses, etc) and administrative staff (health office officials) are not available. New kabupaten/kota invest heavily in health infrastructure. While old kabupaten/kota continued their bias towards routine expenditures in 2004, new kabupaten such as Pegunungan Bintang spent more on development. In total, there are seventeen puskesmas and puskesmas pembantu in Pegunungan Bintang, but most of them are in a poor condition. In 2004, therefore, the kabupaten government used all the “directed programs” financed by the special autonomy fund to build puskesmas and hospitals (Table 6.3).
Table 6.3: Health Spending in Case Study Locations, 2004* Mimika Biak Numfor Pegunungan Bintang Routine 13,131,969,000 15,376,450,000 1,262,080,000 53% 54% 20% Development 11,483,077,000 13,263,269,600 5,000,000,000 47% 46% 80% Total 24,615,046,000 28,639,719,600 6,262,080,000 Source: PEACH background reports * Classified to old budget reporting format. Details in Planning & Budgeting Chapter
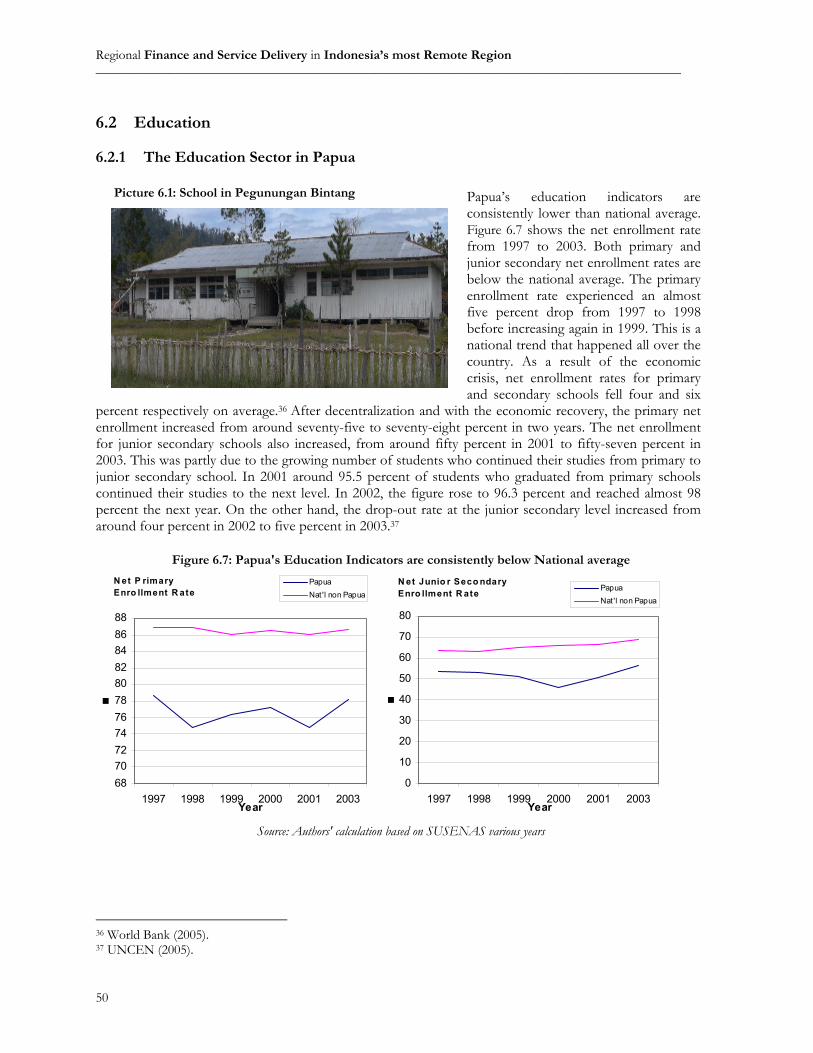
Regional Finance and Service Delivery in Indonesia’s most Remote Region ________________________________________________________________________________________
50
6.2 Education
6.2.1 The Education Sector in Papua
Papua’s education indicators are consistently lower than national average. Figure 6.7 shows the net enrollment rate from 1997 to 2003. Both primary and junior secondary net enrollment rates are below the national average. The primary enrollment rate experienced an almost five percent drop from 1997 to 1998 before increasing again in 1999. This is a national trend that happened all over the country. As a result of the economic crisis, net enrollment rates for primary and secondary schools fell four and six
percent respectively on average.36 After decentralization and with the economic recovery, the primary net enrollment increased from around seventy-five to seventy-eight percent in two years. The net enrollment for junior secondary schools also increased, from around fifty percent in 2001 to fifty-seven percent in 2003. This was partly due to the growing number of students who continued their studies from primary to junior secondary school. In 2001 around 95.5 percent of students who graduated from primary schools continued their studies to the next level. In 2002, the figure rose to 96.3 percent and reached almost 98 percent the next year. On the other hand, the drop-out rate at the junior secondary level increased from around four percent in 2002 to five percent in 2003.37
36 World Bank (2005). 37 UNCEN (2005).
Picture 6.1: School in Pegunungan Bintang
Figure 6.7: Papua's Education Indicators are consistently below National average
N et P rimary Enro llment R ate
6870727476788082848688
1997 1998 1999 2000 2001 2003Year
PapuaNat 'l non Papua
N et Junio r Seco ndary Enro llment R ate
0
10
20
30
40
50
60
70
80
1997 1998 1999 2000 2001 2003Year
PapuaNat'l non Papua
Source: Authors' calculation based on SUSENAS various years

Papua Public Expenditure Analysis | Overview Report _________________________________________________________________________________________
51
Papua has relatively more teachers than other parts of Indonesia. There is no optimum ratio that can be used as a benchmark, but the World Development Indicators 2002 calculated the pupil per teacher ratio for a cross section of countries and found that low income countries on average had forty-two pupils per teacher, while medium income countries had twenty-two and high income countries had seventeen. In 2003, Indonesia’s pupil/teacher ratio was twenty-five, above the average for low income countries, while Papua’s was twenty – significantly above the Indonesian average. Teachers are, however, unequally distributed across Papua. The pupil per teacher ratio of Kabupaten Mimika is more than double that of Kabupaten Sorong (Figure 6.8). Furthermore, teachers are not well distributed among distrik within the same kabupaten. Figure 6.9 shows the pupil per teacher ratio for primary schools in Pegunungan Bintang. There are distrik such as Okyop that have more than eighty pupils per teacher while Iwur only has twenty-four pupils per teacher.
Papua has a ratio of 5.6 primary schools per 1,000 primary school aged children. This puts Papua somewhat below the national average of 5.9. The main problem, however, is the unequal distribution of schools; the ratio is fourteen in Kabupaten Fak Fak compared to less than three in Kota Jayapura and Kota Sorong (Figure 6.10). In the aggregate, Papua does not suffer from a lack of teachers or a lack of schools, but the unequal distribution of these resources limits access to education in certain parts of the province. As a consequence, it is not surprising that there are large disparities of education outcomes among kabupaten/kota in Papua. Kabupaten in the highlands have relatively low literacy rates and years of schooling compared to distrik on the coast or in urban areas.38 38 BPS, Bappenas and UNDP (2004).
Figure 6.8: Pupils per Teacher Ratio by Kab/Kota in Papua (2003)
0 5 10 15 20 25 30 35
SORONG
PUNCAK JAYA
YAPEN WAROPEN
JAYAPURA
FAK FAK
BIAK NUMFOR
MANOKWARI
MERAUKE
JAYAWIJAYA
PANIAI
NABIRE
KOTA JAYAPURA
MIMIKA
pupil/teacher Source: BPS’s Papua Dalam Angka 2003.
Figure 6.9: Pupils per Teacher Ratio by Distrik in Pegunungan Bintang (2004)
0 20 40 60 80 100
Iw ur
Okbibab
Oksibil
Batom
Kiw irok
Borme
Okyop
pupil / teacher
Source: PEACH Background Report
Figure 6.10: Primary Schools Per 1,000 Primary School Aged Children in Papua (2003)
0 5 10 15
KOTA SORONGKOTA JAYAPURA
MIMIKANABIRE
JAYAWIJAYAPUNCAK JAYA
PANIAIMANOKWARI
MERAUKEBIAK NUMFOR
YAPEN WAROPENSORONG
JAYAPURAFAK-FAK
Primary Schools / 1,000 Children Aged 7 to 12
Source: Authors' calculation based on PODES 2003 and SUSENAS 2003

Regional Finance and Service Delivery in Indonesia’s most Remote Region ________________________________________________________________________________________
52
6.2.2 Spending on Education
Education expenditure policy in Papua focuses on increasing access and availability of basic education services to support nine years of basic education. The special autonomy status emphasizes the provision of better education for all, especially for ethnic Papuans. At the provincial level the programs are designed to improve the quality of education through better facilities and teachers and by providing better incentives for teachers such as construction of houses. Papua has high per capita spending on education. Papua’s poor performance in education indicators relative to other regions is not necessarily a result of inadequate funding levels. In fact, Papua has the second highest education spending in the country (Figure 6.11). In 2003, Papua spent almost Rp. 220,000 per capita, seventy percent more than the national average of Rp. 130,000 (excluding DKI Jakarta). Papua thus ranks second after East Kalimantan, another resource-rich region. Education is one of the priority sectors in Papua. The budget share for education decreased, however, at the kabupaten/kota level (from twenty-three percent to eighteen percent) between 2001 and 2003, while doubling at the provincial level – from five percent to ten percent (Table 6.4). Even with the revenue windfall generated by the Special Autonomy Fund, education expenditure remains well below twenty percent of total spending in Papua. This makes Papua one of only two provinces (next to Maluku Utara) that spend less than a fifth of their total budget on education. Nevertheless, there is not a single region so far that complies with the National Education Law, which stipulates that all levels of governments should spend at least twenty percent of their budget, net of salaries, on education.
Box 6.3: Higher Education “Actually universities in Papua are providing a lot of opportunities for native Papuan students. We provide scholarships and other types of funding assistance. We even lowered our standard just to be able to accept more ethnic Papuans. But it is difficult for us to keep them in the classroom. Some of them can not follow the lecture since they are way behind the others. No matter how hard we try to help them, still they can not catch up. It is not entirely their fault. Once I asked them why they could not do simple multiplication and division. Didn’t they learn it in secondary schools? Their answers were, how could we learn proper math if the teachers were never around to teach us? That’s why most of them drop out of the university because they cannot follow the course …” Source: Interview with a university lecturer in Jayapura
Figure 6.11: Papua has second highest per capita education spending in the country (2003)
0
50,000
100,000
150,000
200,000
250,000
300,000
Kaliman
tan T
imur
Papua
Nangg
roe A
ceh D
aruss
alam
Riau
Kaliman
tan T
enga
h
Sulawes
i Ten
ggara
Sulawes
i Utar
a
Bengk
ulu
Sulawes
i Ten
gah
Sumate
ra B
arat Bali
Goron
taloJa
mbi
DI Yog
yaka
rta
Kaliman
tan S
elatan
Nusa T
engg
ara T
imur
Kaliman
tan B
arat
Sumate
ra U
tara
Nusa T
engg
ara B
arat
Sulawes
i Sela
tan
Lampu
ng
Sumate
ra S
elatan
Jawa T
enga
h
Jawa T
imur
Jawa B
arat
Banten
Source: Authors' calculation based on SIKD/MoF
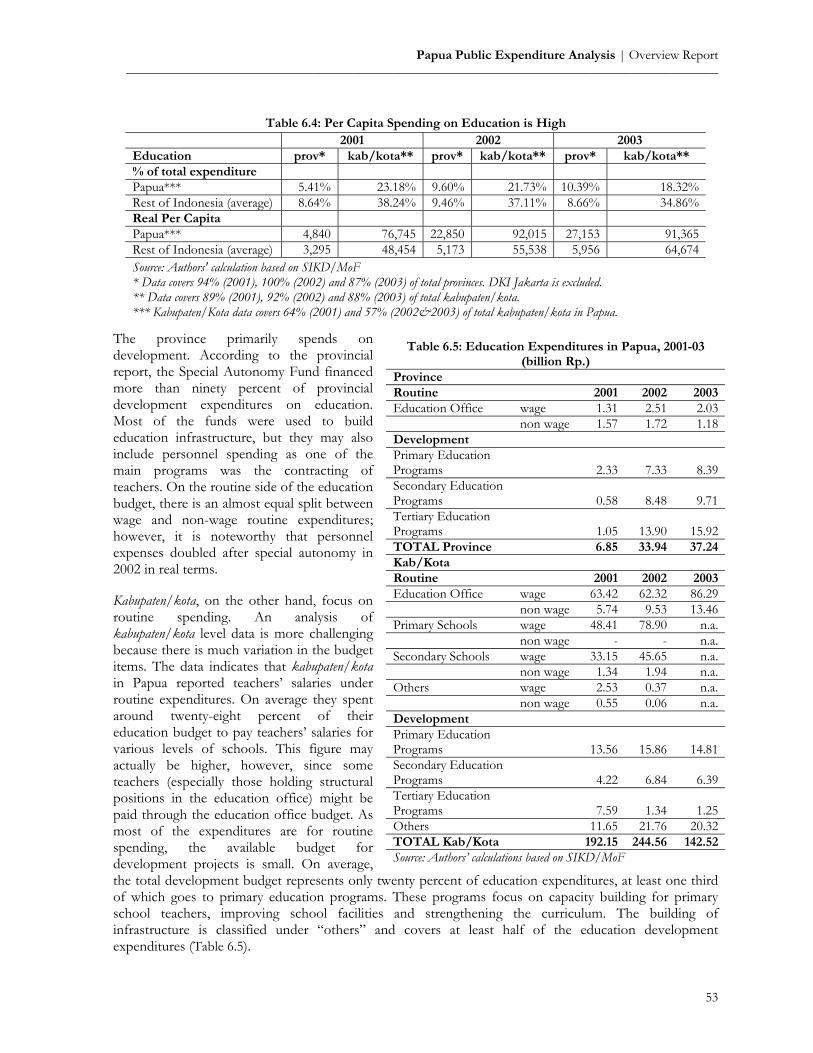
Papua Public Expenditure Analysis | Overview Report _________________________________________________________________________________________
53
Table 6.4: Per Capita Spending on Education is High 2001 2002 2003 Education prov* kab/kota** prov* kab/kota** prov* kab/kota** % of total expenditure Papua*** 5.41% 23.18% 9.60% 21.73% 10.39% 18.32%Rest of Indonesia (average) 8.64% 38.24% 9.46% 37.11% 8.66% 34.86%Real Per Capita Papua*** 4,840 76,745 22,850 92,015 27,153 91,365 Rest of Indonesia (average) 3,295 48,454 5,173 55,538 5,956 64,674 Source: Authors' calculation based on SIKD/MoF * Data covers 94% (2001), 100% (2002) and 87% (2003) of total provinces. DKI Jakarta is excluded. ** Data covers 89% (2001), 92% (2002) and 88% (2003) of total kabupaten/kota. *** Kabupaten/Kota data covers 64% (2001) and 57% (2002&2003) of total kabupaten/kota in Papua.
The province primarily spends on development. According to the provincial report, the Special Autonomy Fund financed more than ninety percent of provincial development expenditures on education. Most of the funds were used to build education infrastructure, but they may also include personnel spending as one of the main programs was the contracting of teachers. On the routine side of the education budget, there is an almost equal split between wage and non-wage routine expenditures; however, it is noteworthy that personnel expenses doubled after special autonomy in 2002 in real terms. Kabupaten/kota, on the other hand, focus on routine spending. An analysis of kabupaten/kota level data is more challenging because there is much variation in the budget items. The data indicates that kabupaten/kota in Papua reported teachers’ salaries under routine expenditures. On average they spent around twenty-eight percent of their education budget to pay teachers’ salaries for various levels of schools. This figure may actually be higher, however, since some teachers (especially those holding structural positions in the education office) might be paid through the education office budget. As most of the expenditures are for routine spending, the available budget for development projects is small. On average, the total development budget represents only twenty percent of education expenditures, at least one third of which goes to primary education programs. These programs focus on capacity building for primary school teachers, improving school facilities and strengthening the curriculum. The building of infrastructure is classified under “others” and covers at least half of the education development expenditures (Table 6.5).
Table 6.5: Education Expenditures in Papua, 2001-03(billion Rp.)
Province Routine 2001 2002 2003Education Office wage 1.31 2.51 2.03 non wage 1.57 1.72 1.18Development Primary Education Programs 2.33 7.33 8.39Secondary Education Programs 0.58 8.48 9.71Tertiary Education Programs 1.05 13.90 15.92TOTAL Province 6.85 33.94 37.24Kab/Kota Routine 2001 2002 2003Education Office wage 63.42 62.32 86.29 non wage 5.74 9.53 13.46 Primary Schools wage 48.41 78.90 n.a. non wage - - n.a. Secondary Schools wage 33.15 45.65 n.a. non wage 1.34 1.94 n.a. Others wage 2.53 0.37 n.a. non wage 0.55 0.06 n.a. Development Primary Education Programs 13.56 15.86 14.81 Secondary Education Programs
4.22 6.84 6.39
Tertiary Education Programs 7.59 1.34 1.25 Others 11.65 21.76 20.32 TOTAL Kab/Kota 192.15 244.56 142.52 Source: Authors’ calculations based on SIKD/MoF
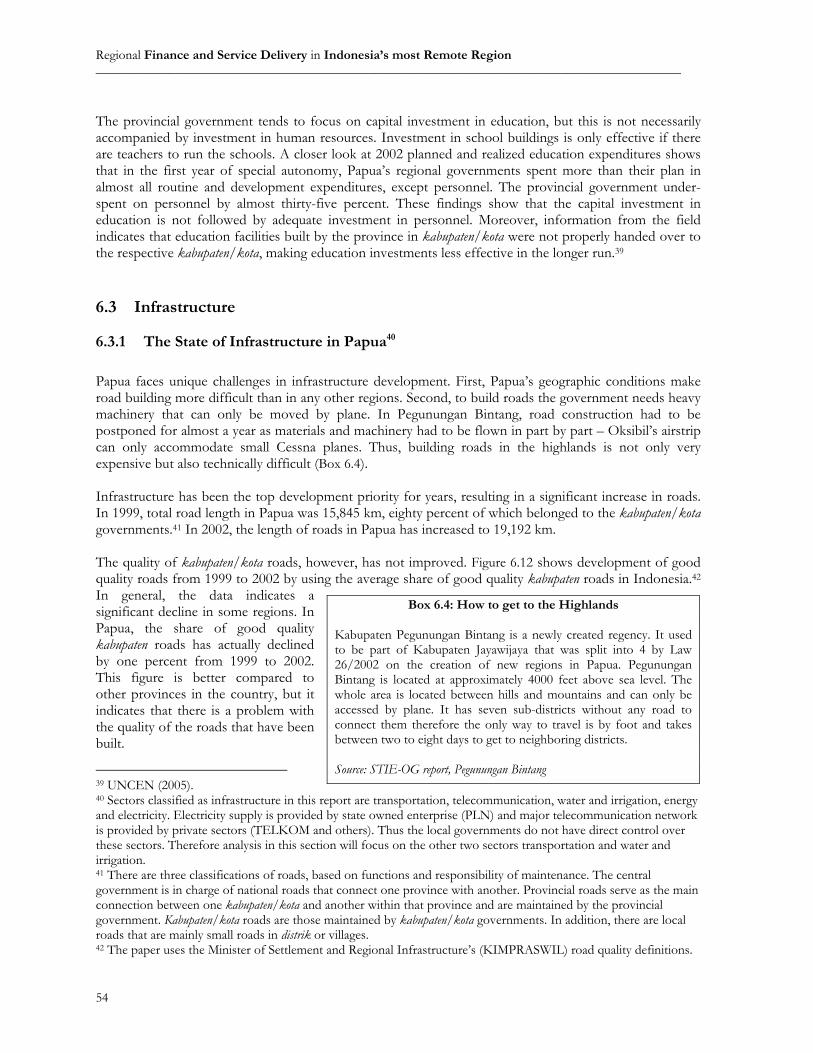
Regional Finance and Service Delivery in Indonesia’s most Remote Region ________________________________________________________________________________________
54
The provincial government tends to focus on capital investment in education, but this is not necessarily accompanied by investment in human resources. Investment in school buildings is only effective if there are teachers to run the schools. A closer look at 2002 planned and realized education expenditures shows that in the first year of special autonomy, Papua’s regional governments spent more than their plan in almost all routine and development expenditures, except personnel. The provincial government under-spent on personnel by almost thirty-five percent. These findings show that the capital investment in education is not followed by adequate investment in personnel. Moreover, information from the field indicates that education facilities built by the province in kabupaten/kota were not properly handed over to the respective kabupaten/kota, making education investments less effective in the longer run.39 6.3 Infrastructure
6.3.1 The State of Infrastructure in Papua40
Papua faces unique challenges in infrastructure development. First, Papua’s geographic conditions make road building more difficult than in any other regions. Second, to build roads the government needs heavy machinery that can only be moved by plane. In Pegunungan Bintang, road construction had to be postponed for almost a year as materials and machinery had to be flown in part by part – Oksibil’s airstrip can only accommodate small Cessna planes. Thus, building roads in the highlands is not only very expensive but also technically difficult (Box 6.4). Infrastructure has been the top development priority for years, resulting in a significant increase in roads. In 1999, total road length in Papua was 15,845 km, eighty percent of which belonged to the kabupaten/kota governments.41 In 2002, the length of roads in Papua has increased to 19,192 km. The quality of kabupaten/kota roads, however, has not improved. Figure 6.12 shows development of good quality roads from 1999 to 2002 by using the average share of good quality kabupaten roads in Indonesia.42 In general, the data indicates a significant decline in some regions. In Papua, the share of good quality kabupaten roads has actually declined by one percent from 1999 to 2002. This figure is better compared to other provinces in the country, but it indicates that there is a problem with the quality of the roads that have been built.
39 UNCEN (2005). 40 Sectors classified as infrastructure in this report are transportation, telecommunication, water and irrigation, energy and electricity. Electricity supply is provided by state owned enterprise (PLN) and major telecommunication network is provided by private sectors (TELKOM and others). Thus the local governments do not have direct control over these sectors. Therefore analysis in this section will focus on the other two sectors transportation and water and irrigation. 41 There are three classifications of roads, based on functions and responsibility of maintenance. The central government is in charge of national roads that connect one province with another. Provincial roads serve as the main connection between one kabupaten/kota and another within that province and are maintained by the provincial government. Kabupaten/kota roads are those maintained by kabupaten/kota governments. In addition, there are local roads that are mainly small roads in distrik or villages. 42 The paper uses the Minister of Settlement and Regional Infrastructure’s (KIMPRASWIL) road quality definitions.
Box 6.4: How to get to the Highlands Kabupaten Pegunungan Bintang is a newly created regency. It used to be part of Kabupaten Jayawijaya that was split into 4 by Law 26/2002 on the creation of new regions in Papua. Pegunungan Bintang is located at approximately 4000 feet above sea level. The whole area is located between hills and mountains and can only be accessed by plane. It has seven sub-districts without any road to connect them therefore the only way to travel is by foot and takes between two to eight days to get to neighboring districts. Source: STIE-OG report, Pegunungan Bintang
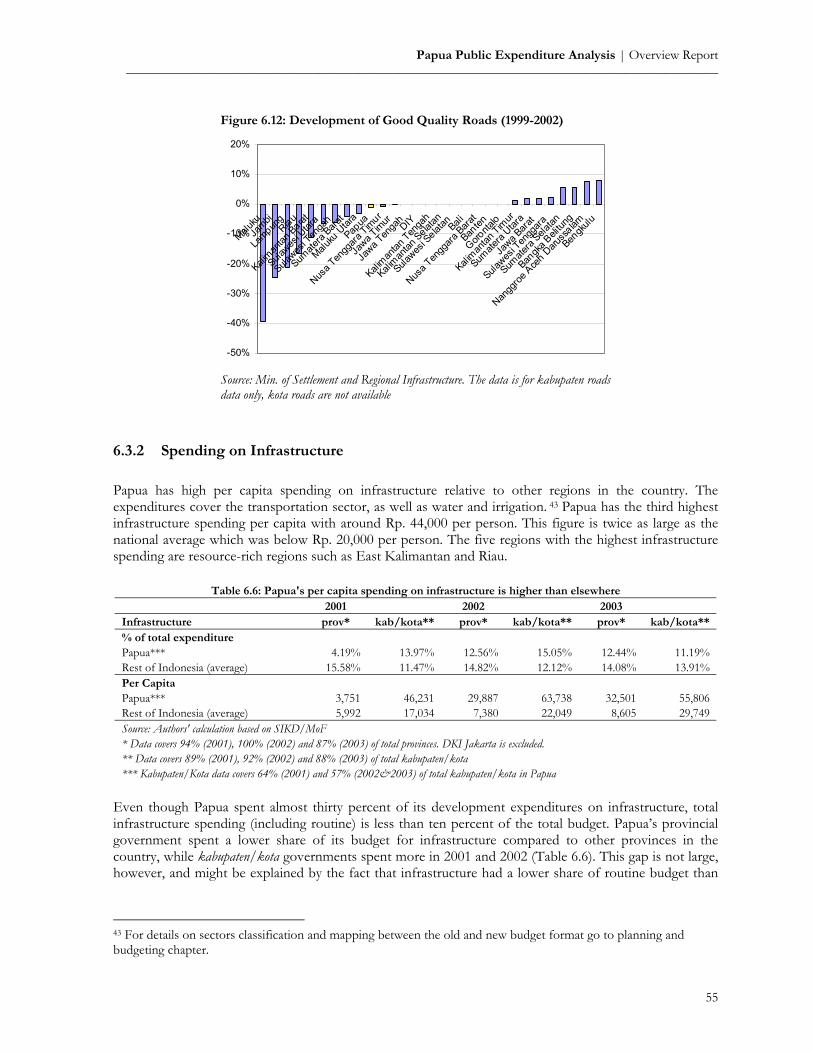
Papua Public Expenditure Analysis | Overview Report _________________________________________________________________________________________
55
6.3.2 Spending on Infrastructure
Papua has high per capita spending on infrastructure relative to other regions in the country. The expenditures cover the transportation sector, as well as water and irrigation. 43 Papua has the third highest infrastructure spending per capita with around Rp. 44,000 per person. This figure is twice as large as the national average which was below Rp. 20,000 per person. The five regions with the highest infrastructure spending are resource-rich regions such as East Kalimantan and Riau.
Table 6.6: Papua's per capita spending on infrastructure is higher than elsewhere 2001 2002 2003 Infrastructure prov* kab/kota** prov* kab/kota** prov* kab/kota**% of total expenditure Papua*** 4.19% 13.97% 12.56% 15.05% 12.44% 11.19%Rest of Indonesia (average) 15.58% 11.47% 14.82% 12.12% 14.08% 13.91%Per Capita Papua*** 3,751 46,231 29,887 63,738 32,501 55,806 Rest of Indonesia (average) 5,992 17,034 7,380 22,049 8,605 29,749 Source: Authors' calculation based on SIKD/MoF * Data covers 94% (2001), 100% (2002) and 87% (2003) of total provinces. DKI Jakarta is excluded. ** Data covers 89% (2001), 92% (2002) and 88% (2003) of total kabupaten/kota *** Kabupaten/Kota data covers 64% (2001) and 57% (2002&2003) of total kabupaten/kota in Papua
Even though Papua spent almost thirty percent of its development expenditures on infrastructure, total infrastructure spending (including routine) is less than ten percent of the total budget. Papua’s provincial government spent a lower share of its budget for infrastructure compared to other provinces in the country, while kabupaten/kota governments spent more in 2001 and 2002 (Table 6.6). This gap is not large, however, and might be explained by the fact that infrastructure had a lower share of routine budget than
43 For details on sectors classification and mapping between the old and new budget format go to planning and budgeting chapter.
Figure 6.12: Development of Good Quality Roads (1999-2002)
-50%
-40%
-30%
-20%
-10%
0%
10%
20%
MalukuJa
mbi
Lampun
gRiau
Kaliman
tan Barat
Sulawes
i Utar
a
Sulawes
i Ten
gah
Sumate
ra Bara
t
Maluku
Utar
a
Papua
Nusa T
engg
ara Tim
ur
Jawa T
imur
Jawa T
enga
hDIY
Kaliman
tan Ten
gah
Kaliman
tan Selat
an
Sulawes
i Selat
an Bali
Nusa T
engg
ara Bara
t
Banten
Goronta
lo
Kaliman
tan Tim
ur
Sumate
ra Utar
a
Jawa B
arat
Sulawes
i Ten
ggara
Sumate
ra Sela
tan
Bangk
a Beli
tung
Nangg
roe A
ceh D
aruss
alam
Bengk
ulu
Source: Min. of Settlement and Regional Infrastructure. The data is for kabupaten roads data only, kota roads are not available

Regional Finance and Service Delivery in Indonesia’s most Remote Region ________________________________________________________________________________________
56
other sectors such as education, but the magnitude of development budget for infrastructure is still relatively large. Papua spent the majority of its infrastructure budget on transportation. The provincial government spent almost ninety percent of its infrastructure budget for transportation development. A similar pattern is also found at the kabupaten/kota level. They spent almost half of their infrastructure spending on transportation. Road infrastructure seems to be the highest priority for Papua’s kabupaten/kota governments. The real spending on roads at the local level has increased significantly since the introduction of special autonomy status (Table 6.8). Local governments spent most of their development budget on improving roads, indicating they were trying to improve quality of existing roads instead of building new ones.
Table 6.7: Share of spending on road development
2001 2002Rehabilitation and Maintenance 8% 17%Improvement 40% 66%Development 25% 17%Others 27% 0%Source: Authors’ calculations based on SIKD/MoF
Picture 6.2: Unpaved road in the highlands
Table 6.8: Infrastructure Expenditure in Papua, 2001-03 (billion Rp.) Province Routine 2001 2002 2003Public Works wage 2.29 3.07 2.81 non wage 0.26 0.39 0.42 Transportation wage 0.80 1.45 1.42 non wage 0.34 0.46 0.82 Development Transportation 93.20 134.81 125.02 Road Infrastructure 70.50 106.98 98.44 Others 22.70 27.82 26.58 Energy / Village Electricity 2.13 3.86 3.17 Local Telecommunications 0.28 0.08 0.29 Water and Irrigation 1.66 12.00 13.52 TOTAL 100.96 156.12 147.48
Kab/Kota
Routine 2001 2002 2003Public Works wage 5.51 7.99 8.18 non wage 2.87 31.61 4.42Transportation wage 3.06 3.49 3.60 non wage 1.35 1.41 1.65Development Transportation 144.98 235.91 218.79 Road Infrastructure 109.67 187.22 172.28 Others 35.31 48.69 46.52Energy and Village Electricity 3.32 6.76 5.55Water and Irrigation 10.37 9.56 4.96TOTAL 171.46 296.73 247.15
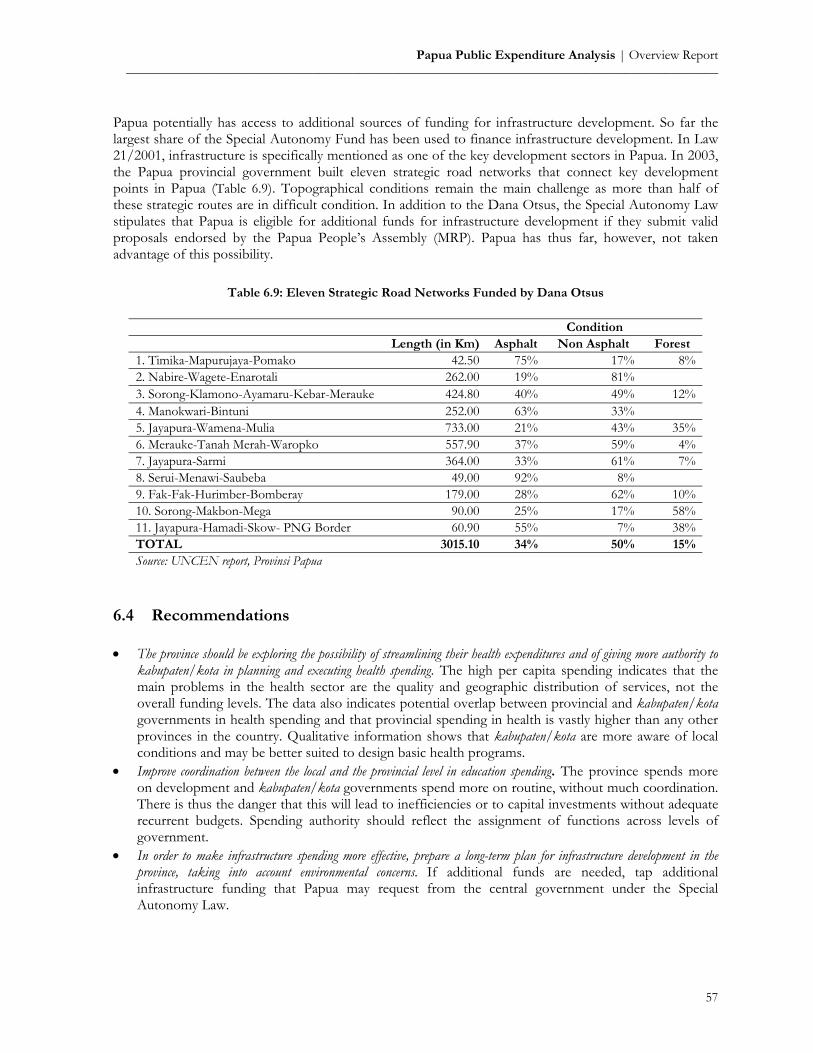
Papua Public Expenditure Analysis | Overview Report _________________________________________________________________________________________
57
Papua potentially has access to additional sources of funding for infrastructure development. So far the largest share of the Special Autonomy Fund has been used to finance infrastructure development. In Law 21/2001, infrastructure is specifically mentioned as one of the key development sectors in Papua. In 2003, the Papua provincial government built eleven strategic road networks that connect key development points in Papua (Table 6.9). Topographical conditions remain the main challenge as more than half of these strategic routes are in difficult condition. In addition to the Dana Otsus, the Special Autonomy Law stipulates that Papua is eligible for additional funds for infrastructure development if they submit valid proposals endorsed by the Papua People’s Assembly (MRP). Papua has thus far, however, not taken advantage of this possibility.
6.4 Recommendations • The province should be exploring the possibility of streamlining their health expenditures and of giving more authority to
kabupaten/kota in planning and executing health spending. The high per capita spending indicates that the main problems in the health sector are the quality and geographic distribution of services, not the overall funding levels. The data also indicates potential overlap between provincial and kabupaten/kota governments in health spending and that provincial spending in health is vastly higher than any other provinces in the country. Qualitative information shows that kabupaten/kota are more aware of local conditions and may be better suited to design basic health programs.
• Improve coordination between the local and the provincial level in education spending. The province spends more on development and kabupaten/kota governments spend more on routine, without much coordination. There is thus the danger that this will lead to inefficiencies or to capital investments without adequate recurrent budgets. Spending authority should reflect the assignment of functions across levels of government.
• In order to make infrastructure spending more effective, prepare a long-term plan for infrastructure development in the province, taking into account environmental concerns. If additional funds are needed, tap additional infrastructure funding that Papua may request from the central government under the Special Autonomy Law.
Table 6.9: Eleven Strategic Road Networks Funded by Dana Otsus
Condition Length (in Km) Asphalt Non Asphalt Forest 1. Timika-Mapurujaya-Pomako 42.50 75% 17% 8%2. Nabire-Wagete-Enarotali 262.00 19% 81% 3. Sorong-Klamono-Ayamaru-Kebar-Merauke 424.80 40% 49% 12%4. Manokwari-Bintuni 252.00 63% 33% 5. Jayapura-Wamena-Mulia 733.00 21% 43% 35%6. Merauke-Tanah Merah-Waropko 557.90 37% 59% 4%7. Jayapura-Sarmi 364.00 33% 61% 7%8. Serui-Menawi-Saubeba 49.00 92% 8% 9. Fak-Fak-Hurimber-Bomberay 179.00 28% 62% 10%10. Sorong-Makbon-Mega 90.00 25% 17% 58%11. Jayapura-Hamadi-Skow- PNG Border 60.90 55% 7% 38%TOTAL 3015.10 34% 50% 15%Source: UNCEN report, Provinsi Papua

Regional Finance and Service Delivery in Indonesia’s most Remote Region ________________________________________________________________________________________
58
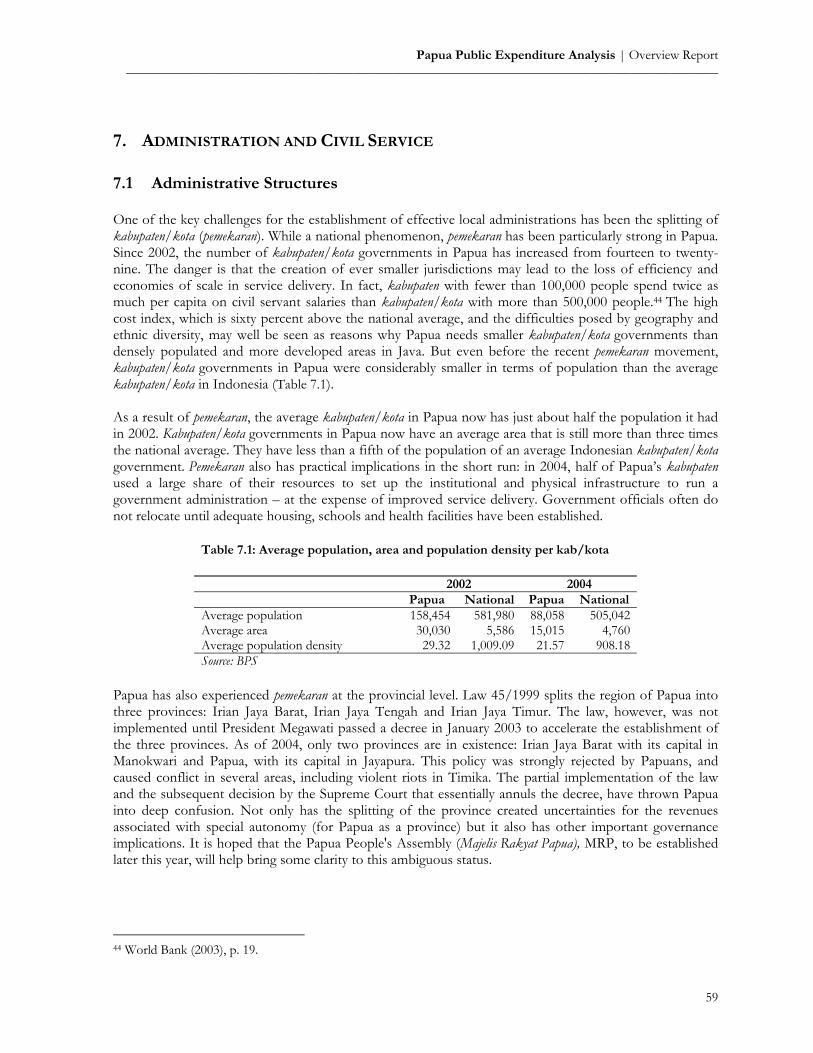
Papua Public Expenditure Analysis | Overview Report _________________________________________________________________________________________
59
7. ADMINISTRATION AND CIVIL SERVICE 7.1 Administrative Structures One of the key challenges for the establishment of effective local administrations has been the splitting of kabupaten/kota (pemekaran). While a national phenomenon, pemekaran has been particularly strong in Papua. Since 2002, the number of kabupaten/kota governments in Papua has increased from fourteen to twenty-nine. The danger is that the creation of ever smaller jurisdictions may lead to the loss of efficiency and economies of scale in service delivery. In fact, kabupaten with fewer than 100,000 people spend twice as much per capita on civil servant salaries than kabupaten/kota with more than 500,000 people.44 The high cost index, which is sixty percent above the national average, and the difficulties posed by geography and ethnic diversity, may well be seen as reasons why Papua needs smaller kabupaten/kota governments than densely populated and more developed areas in Java. But even before the recent pemekaran movement, kabupaten/kota governments in Papua were considerably smaller in terms of population than the average kabupaten/kota in Indonesia (Table 7.1). As a result of pemekaran, the average kabupaten/kota in Papua now has just about half the population it had in 2002. Kabupaten/kota governments in Papua now have an average area that is still more than three times the national average. They have less than a fifth of the population of an average Indonesian kabupaten/kota government. Pemekaran also has practical implications in the short run: in 2004, half of Papua’s kabupaten used a large share of their resources to set up the institutional and physical infrastructure to run a government administration – at the expense of improved service delivery. Government officials often do not relocate until adequate housing, schools and health facilities have been established.
Table 7.1: Average population, area and population density per kab/kota 2002 2004 Papua National Papua National Average population 158,454 581,980 88,058 505,042 Average area 30,030 5,586 15,015 4,760 Average population density 29.32 1,009.09 21.57 908.18 Source: BPS
Papua has also experienced pemekaran at the provincial level. Law 45/1999 splits the region of Papua into three provinces: Irian Jaya Barat, Irian Jaya Tengah and Irian Jaya Timur. The law, however, was not implemented until President Megawati passed a decree in January 2003 to accelerate the establishment of the three provinces. As of 2004, only two provinces are in existence: Irian Jaya Barat with its capital in Manokwari and Papua, with its capital in Jayapura. This policy was strongly rejected by Papuans, and caused conflict in several areas, including violent riots in Timika. The partial implementation of the law and the subsequent decision by the Supreme Court that essentially annuls the decree, have thrown Papua into deep confusion. Not only has the splitting of the province created uncertainties for the revenues associated with special autonomy (for Papua as a province) but it also has other important governance implications. It is hoped that the Papua People's Assembly (Majelis Rakyat Papua), MRP, to be established later this year, will help bring some clarity to this ambiguous status. 44 World Bank (2003), p. 19.
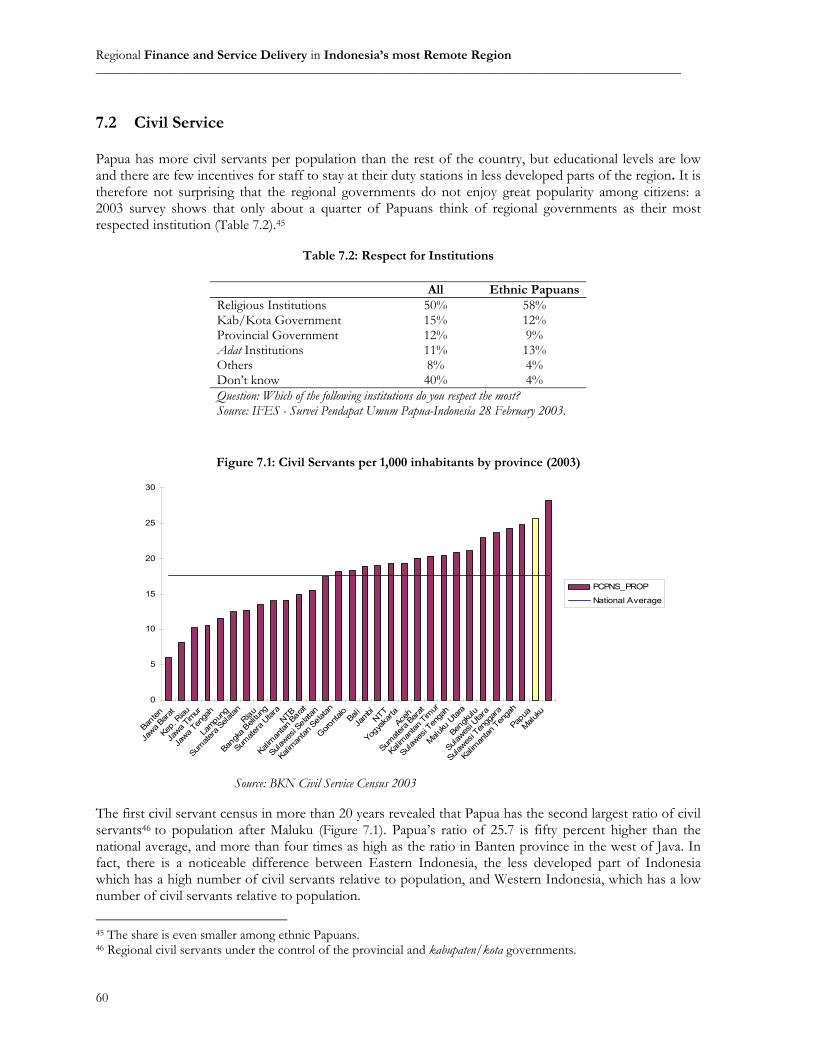
Regional Finance and Service Delivery in Indonesia’s most Remote Region ________________________________________________________________________________________
60
7.2 Civil Service Papua has more civil servants per population than the rest of the country, but educational levels are low and there are few incentives for staff to stay at their duty stations in less developed parts of the region. It is therefore not surprising that the regional governments do not enjoy great popularity among citizens: a 2003 survey shows that only about a quarter of Papuans think of regional governments as their most respected institution (Table 7.2).45
Table 7.2: Respect for Institutions
All Ethnic Papuans Religious Institutions 50% 58% Kab/Kota Government 15% 12% Provincial Government 12% 9% Adat Institutions 11% 13% Others 8% 4% Don’t know 40% 4% Question: Which of the following institutions do you respect the most? Source: IFES - Survei Pendapat Umum Papua-Indonesia 28 February 2003.
The first civil servant census in more than 20 years revealed that Papua has the second largest ratio of civil servants46 to population after Maluku (Figure 7.1). Papua’s ratio of 25.7 is fifty percent higher than the national average, and more than four times as high as the ratio in Banten province in the west of Java. In fact, there is a noticeable difference between Eastern Indonesia, the less developed part of Indonesia which has a high number of civil servants relative to population, and Western Indonesia, which has a low number of civil servants relative to population.
45 The share is even smaller among ethnic Papuans. 46 Regional civil servants under the control of the provincial and kabupaten/kota governments.
Figure 7.1: Civil Servants per 1,000 inhabitants by province (2003)
0
5
10
15
20
25
30
Banten
Jawa B
arat
Kep. R
iau
Jawa T
imur
Jawa T
enga
h
Lampun
g
Sumate
ra S
elatan
Riau
Bangk
a Beli
tung
Sumate
ra U
tara
NTB
Kalim
antan
Barat
Sulaw
esi S
elatan
Kalim
antan
Selat
an
Goronta
loBali
Jambi
NTT
Yogya
karta
Aceh
Sumate
ra B
arat
Kalim
antan
Tim
ur
Sulawes
i Ten
gah
Maluku
Utar
a
Bengk
ulu
Sulawes
i Utar
a
Sulawes
i Ten
ggar
a
Kalim
antan
Ten
gah
Papua
Maluku
PCPNS_PROP
National Average
Source: BKN Civil Service Census 2003
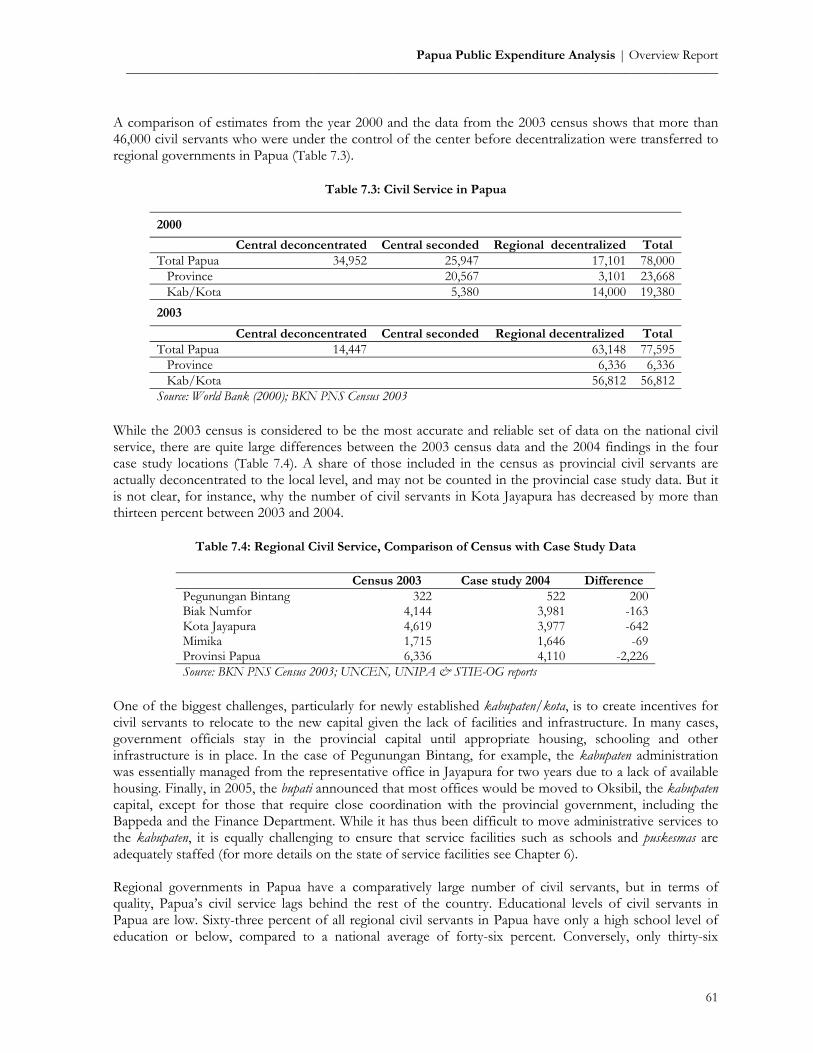
Papua Public Expenditure Analysis | Overview Report _________________________________________________________________________________________
61
A comparison of estimates from the year 2000 and the data from the 2003 census shows that more than 46,000 civil servants who were under the control of the center before decentralization were transferred to regional governments in Papua (Table 7.3).
Table 7.3: Civil Service in Papua 2000
Central deconcentrated Central seconded Regional decentralized Total Total Papua 34,952 25,947 17,101 78,000 Province 20,567 3,101 23,668 Kab/Kota 5,380 14,000 19,3802003
Central deconcentrated Central seconded Regional decentralized Total Total Papua 14,447 63,148 77,595 Province 6,336 6,336 Kab/Kota 56,812 56,812Source: World Bank (2000); BKN PNS Census 2003
While the 2003 census is considered to be the most accurate and reliable set of data on the national civil service, there are quite large differences between the 2003 census data and the 2004 findings in the four case study locations (Table 7.4). A share of those included in the census as provincial civil servants are actually deconcentrated to the local level, and may not be counted in the provincial case study data. But it is not clear, for instance, why the number of civil servants in Kota Jayapura has decreased by more than thirteen percent between 2003 and 2004.
Table 7.4: Regional Civil Service, Comparison of Census with Case Study Data
Census 2003 Case study 2004 Difference Pegunungan Bintang 322 522 200 Biak Numfor 4,144 3,981 -163 Kota Jayapura 4,619 3,977 -642 Mimika 1,715 1,646 -69 Provinsi Papua 6,336 4,110 -2,226 Source: BKN PNS Census 2003; UNCEN, UNIPA & STIE-OG reports
One of the biggest challenges, particularly for newly established kabupaten/kota, is to create incentives for civil servants to relocate to the new capital given the lack of facilities and infrastructure. In many cases, government officials stay in the provincial capital until appropriate housing, schooling and other infrastructure is in place. In the case of Pegunungan Bintang, for example, the kabupaten administration was essentially managed from the representative office in Jayapura for two years due to a lack of available housing. Finally, in 2005, the bupati announced that most offices would be moved to Oksibil, the kabupaten capital, except for those that require close coordination with the provincial government, including the Bappeda and the Finance Department. While it has thus been difficult to move administrative services to the kabupaten, it is equally challenging to ensure that service facilities such as schools and puskesmas are adequately staffed (for more details on the state of service facilities see Chapter 6). Regional governments in Papua have a comparatively large number of civil servants, but in terms of quality, Papua’s civil service lags behind the rest of the country. Educational levels of civil servants in Papua are low. Sixty-three percent of all regional civil servants in Papua have only a high school level of education or below, compared to a national average of forty-six percent. Conversely, only thirty-six
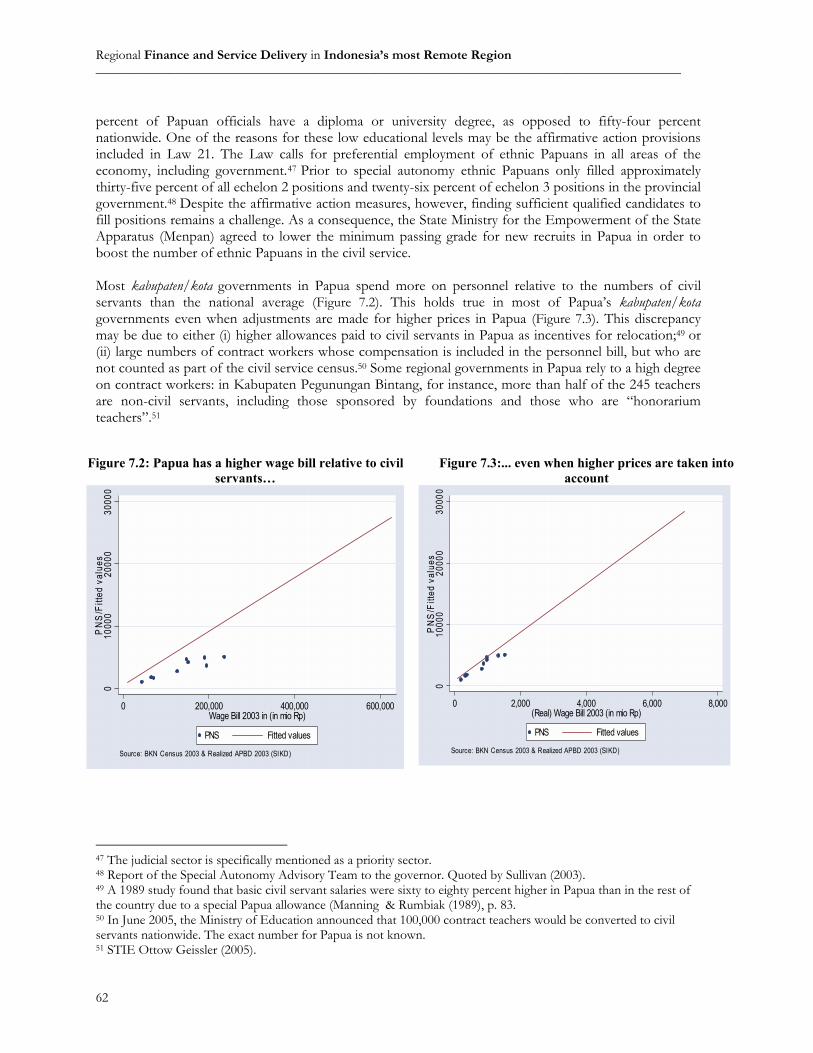
Regional Finance and Service Delivery in Indonesia’s most Remote Region ________________________________________________________________________________________
62
percent of Papuan officials have a diploma or university degree, as opposed to fifty-four percent nationwide. One of the reasons for these low educational levels may be the affirmative action provisions included in Law 21. The Law calls for preferential employment of ethnic Papuans in all areas of the economy, including government.47 Prior to special autonomy ethnic Papuans only filled approximately thirty-five percent of all echelon 2 positions and twenty-six percent of echelon 3 positions in the provincial government.48 Despite the affirmative action measures, however, finding sufficient qualified candidates to fill positions remains a challenge. As a consequence, the State Ministry for the Empowerment of the State Apparatus (Menpan) agreed to lower the minimum passing grade for new recruits in Papua in order to boost the number of ethnic Papuans in the civil service. Most kabupaten/kota governments in Papua spend more on personnel relative to the numbers of civil servants than the national average (Figure 7.2). This holds true in most of Papua’s kabupaten/kota governments even when adjustments are made for higher prices in Papua (Figure 7.3). This discrepancy may be due to either (i) higher allowances paid to civil servants in Papua as incentives for relocation;49 or (ii) large numbers of contract workers whose compensation is included in the personnel bill, but who are not counted as part of the civil service census.50 Some regional governments in Papua rely to a high degree on contract workers: in Kabupaten Pegunungan Bintang, for instance, more than half of the 245 teachers are non-civil servants, including those sponsored by foundations and those who are “honorarium teachers”.51
47 The judicial sector is specifically mentioned as a priority sector. 48 Report of the Special Autonomy Advisory Team to the governor. Quoted by Sullivan (2003). 49 A 1989 study found that basic civil servant salaries were sixty to eighty percent higher in Papua than in the rest of the country due to a special Papua allowance (Manning & Rumbiak (1989), p. 83. 50 In June 2005, the Ministry of Education announced that 100,000 contract teachers would be converted to civil servants nationwide. The exact number for Papua is not known. 51 STIE Ottow Geissler (2005).
Figure 7.2: Papua has a higher wage bill relative to civil servants…
010
000
2000
030
000
PN
S/F
itted
val
ues
0 200,000 400,000 600,000Wage Bill 2003 in (in mio Rp)
PNS Fitted values
Source: BKN Census 2003 & Realized APBD 2003 (SIKD)
Figure 7.3:... even when higher prices are taken into account
010
000
2000
030
000
PN
S/F
itted
val
ues
0 2,000 4,000 6,000 8,000(Real) Wage Bill 2003 (in mio Rp)
PNS Fitted values
Source: BKN Census 2003 & Realized APBD 2003 (SIKD)
Papua Public Expenditure Analysis | Overview Report _________________________________________________________________________________________
63
8. ANNEX 1: HOW MANY PEOPLE ARE THERE IN PAPUA?
The Central Bureau of Statistics (Badan Pusat Statistik, BPS) is the national institution that collects and calculates Indonesia’s statistical data, including population data. BPS is required by law (Law 6/1960 and Law 7/1960) to conduct a population census once every ten years. The information is collected in two fashions: (i) de jure, i.e. people who have a permanent residence and (ii) de facto, i.e. people who do not have a permanent residence, such as homeless people or sailors. The last census was conducted in 2000. Unlike previous censuses, the 2000 census covered fifteen variables including demographic and socio economic variables.52
Central BPS provides annual population estimates based on the latest census using demographic estimation programs. Table 8.1 presents population data from the central, provincial and local BPS offices for the year 2003. The table shows that the data is not consistent across sources, and that in some cases the differences are over sixty percent. For example, the population data for Kabupaten Biak Numfor according to the BPS center is 78,500 higher than the data computed by the provincial BPS office. On the other hand, the provincial BPS office’s estimate of the population of Kabupaten Sorong is 12,000 higher than that used in DAU calculations. These inconsistencies are a major problem as population data is one of the most fundamental pieces of information for policy makers: it is used, for instance, for the DAU calculations and for development planning at the kabupaten/kota, provincial and national level.
52 Based on 2000 Population Census Summary Report on the BPS website.
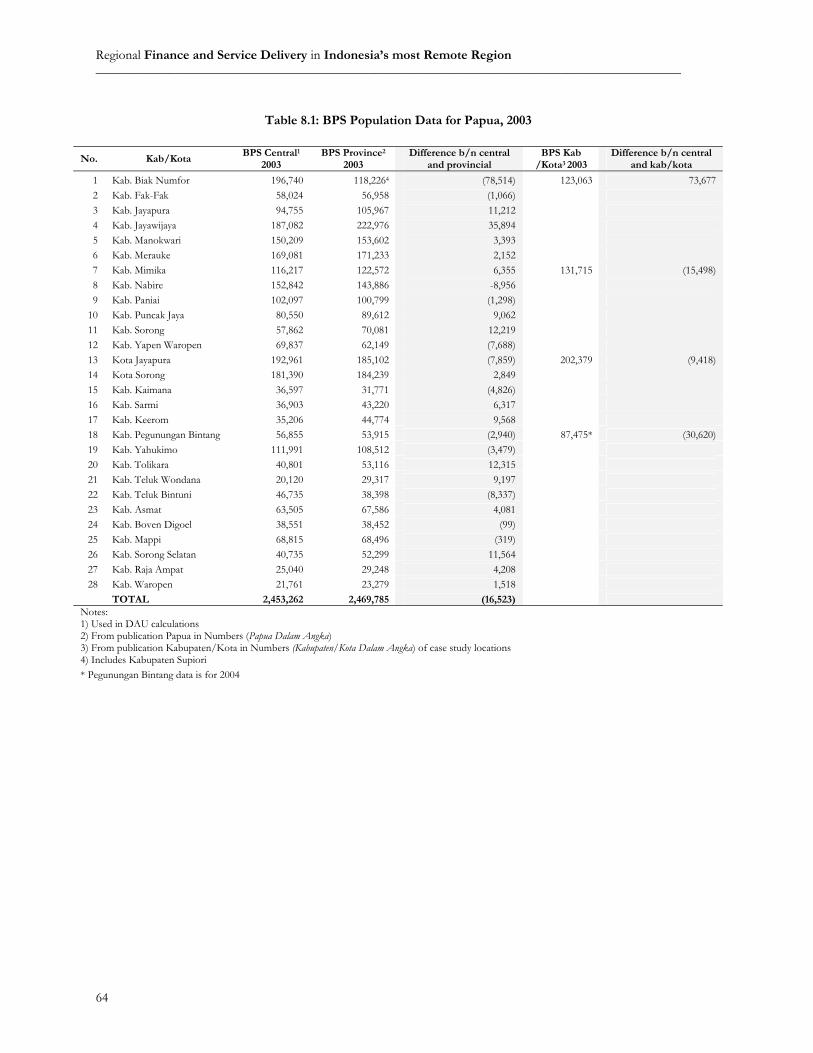
Regional Finance and Service Delivery in Indonesia’s most Remote Region ________________________________________________________________________________________
64
Table 8.1: BPS Population Data for Papua, 2003 No. Kab/Kota
BPS Central1
2003
BPS Province2
2003
Difference b/n central and provincial
BPS Kab /Kota3 2003
Difference b/n central and kab/kota
1 Kab. Biak Numfor 196,740 118,2264 (78,514) 123,063 73,6772 Kab. Fak-Fak 58,024 56,958 (1,066) 3 Kab. Jayapura 94,755 105,967 11,212 4 Kab. Jayawijaya 187,082 222,976 35,894 5 Kab. Manokwari 150,209 153,602 3,393 6 Kab. Merauke 169,081 171,233 2,152 7 Kab. Mimika 116,217 122,572 6,355 131,715 (15,498) 8 Kab. Nabire 152,842 143,886 -8,956 9 Kab. Paniai 102,097 100,799 (1,298)
10 Kab. Puncak Jaya 80,550 89,612 9,062 11 Kab. Sorong 57,862 70,081 12,219 12 Kab. Yapen Waropen 69,837 62,149 (7,688) 13 Kota Jayapura 192,961 185,102 (7,859) 202,379 (9,418)14 Kota Sorong 181,390 184,239 2,849 15 Kab. Kaimana 36,597 31,771 (4,826) 16 Kab. Sarmi 36,903 43,220 6,317 17 Kab. Keerom 35,206 44,774 9,568 18 Kab. Pegunungan Bintang 56,855 53,915 (2,940) 87,475* (30,620) 19 Kab. Yahukimo 111,991 108,512 (3,479) 20 Kab. Tolikara 40,801 53,116 12,315 21 Kab. Teluk Wondana 20,120 29,317 9,197 22 Kab. Teluk Bintuni 46,735 38,398 (8,337) 23 Kab. Asmat 63,505 67,586 4,081 24 Kab. Boven Digoel 38,551 38,452 (99) 25 Kab. Mappi 68,815 68,496 (319) 26 Kab. Sorong Selatan 40,735 52,299 11,564 27 Kab. Raja Ampat 25,040 29,248 4,208 28 Kab. Waropen 21,761 23,279 1,518
TOTAL 2,453,262 2,469,785 (16,523) Notes: 1) Used in DAU calculations 2) From publication Papua in Numbers (Papua Dalam Angka) 3) From publication Kabupaten/Kota in Numbers (Kabupaten/Kota Dalam Angka) of case study locations 4) Includes Kabupaten Supiori * Pegunungan Bintang data is for 2004
Papua Public Expenditure Analysis | Overview Report _________________________________________________________________________________________
65
9. ANNEX 2: PAPUA PUBLIC EXPENDITURE ANALYSIS AND CAPACITY
HARMONIZATION (PEACH) PROGRAM PEACH is a response to a request from the Papuan provincial government and local institutions to conduct a thorough analysis of public expenditure management, linked to a program of activities to strengthen capacity. The program was launched in December 2004 by the provincial government, together with the World Bank Jakarta Office and the Support Office for Eastern Indonesia (SOfEI) in Makassar. The provincial government’s commitment to this program, supported by APBD counterpart funding, shows that improving public expenditure management is a core concern in the province’s effort to promote good governance and the acceleration of development in Papua.
Conceptually, PEACH also forms part of a broader, national Public Expenditure Review, a joint initiative by the Government of Indonesia, local research institutions and donors. The main partner in conducting PEACH is the provincial government of Papua, which is coordinated by the Agency for Planning and Coordination of Regional Development (BP3D) of the provincial government as well as by higher education institutions in Papua.
Objectives The main objectives are to:
• Gain a better understanding of Papua provincial and kabupaten/kota revenues and expenditures, in particular with regards to management of revenues from natural resources and the Special Autonomy Fund.
• Gain a better understanding of the broader issues in the implementation of special autonomy. • Develop strategies for provincial and kabupaten/kota governments to improve management of
public revenue and expenditure. • Enhance and harmonize local capacity to manage public expenditures, and to conduct routine
expenditure analyses. PEACH aims to achieve these objectives by focusing on two types of activities:
1. Analytical Activities (Public Expenditure Analysis): preparation of a report by qualified and experienced local partners, with WB assistance and oversight by a committee of stakeholders.
2. Capacity Harmonization/Strengthening: follow-up workshops focusing on key public finance issues identified during the preparation of the report, targeted at regional government officials as executors of the budget, and other stakeholders as monitors of the budget.
Implementation of PEA Activities
The implementation of the Public Expenditure Analysis was divided into several stages:
Stage 1 Preliminary workshop (1-2 December 2004) Stage 2 Inception of research team from among higher education institutions in Papua (January
– February 2005) Stage 3 Technical workshop (1-2 March 2005) Stage 4 Data collection in the field, and preparation of first draft of report (3 March – 5 April
2005) Stage 5 First draft review meeting (8-9 April 2005) Stage 6 Finalization of data and preparation of final draft report (10 April – 3 May 2005) Stage 7 Final draft review meeting (6-7 May 2005)

Regional Finance and Service Delivery in Indonesia’s most Remote Region ________________________________________________________________________________________
66
Stage 8 Revision and submission of final report (8-23 May 2005) Stage 9 Preparation of overview report by the World Bank team (1 May - 30 June 2005) Stage 10 Public Seminar on Results of PEA in Papua (5 July 2005)
Implementation stages for the Capacity Harmonization activities will be decided in consultation with the provincial and kabupaten/kota governments.
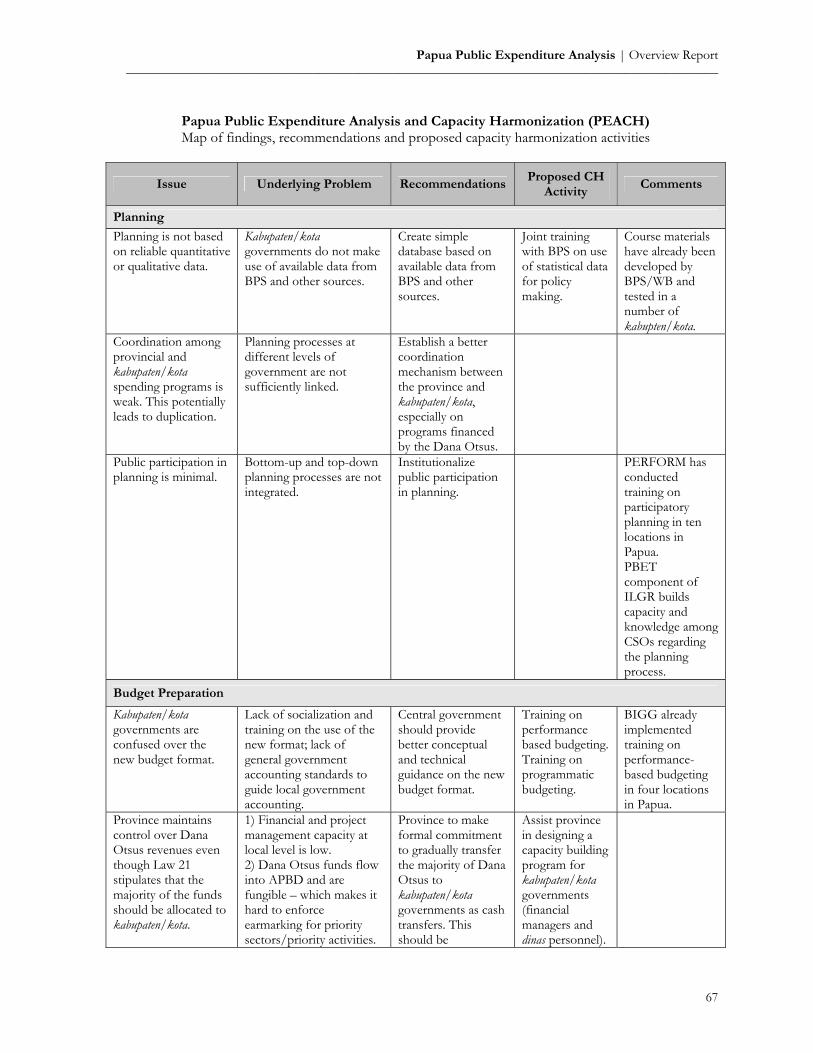
Papua Public Expenditure Analysis | Overview Report _________________________________________________________________________________________
67
Papua Public Expenditure Analysis and Capacity Harmonization (PEACH) Map of findings, recommendations and proposed capacity harmonization activities
Issue Underlying Problem RecommendationsProposed CH
Activity Comments
Planning
Planning is not based on reliable quantitative or qualitative data.
Kabupaten/kota governments do not make use of available data from BPS and other sources.
Create simple database based on available data from BPS and other sources.
Joint training with BPS on use of statistical data for policy making.
Course materials have already been developed by BPS/WB and tested in a number of kabupten/kota.
Coordination among provincial and kabupaten/kota spending programs is weak. This potentially leads to duplication.
Planning processes at different levels of government are not sufficiently linked.
Establish a better coordination mechanism between the province and kabupaten/kota, especially on programs financed by the Dana Otsus.
Public participation in planning is minimal.
Bottom-up and top-down planning processes are not integrated.
Institutionalize public participation in planning.
PERFORM has conducted training on participatory planning in ten locations in Papua. PBET component of ILGR builds capacity and knowledge among CSOs regarding the planning process.
Budget Preparation
Kabupaten/kota governments are confused over the new budget format.
Lack of socialization and training on the use of the new format; lack of general government accounting standards to guide local government accounting.
Central government should provide better conceptual and technical guidance on the new budget format.
Training on performance based budgeting. Training on programmatic budgeting.
BIGG already implemented training on performance-based budgeting in four locations in Papua.
Province maintains control over Dana Otsus revenues even though Law 21 stipulates that the majority of the funds should be allocated to kabupaten/kota.
1) Financial and project management capacity at local level is low. 2) Dana Otsus funds flow into APBD and are fungible – which makes it hard to enforce earmarking for priority sectors/priority activities.
Province to make formal commitment to gradually transfer the majority of Dana Otsus to kabupaten/kota governments as cash transfers. This should be
Assist province in designing a capacity building program for kabupaten/kota governments (financial managers and dinas personnel).
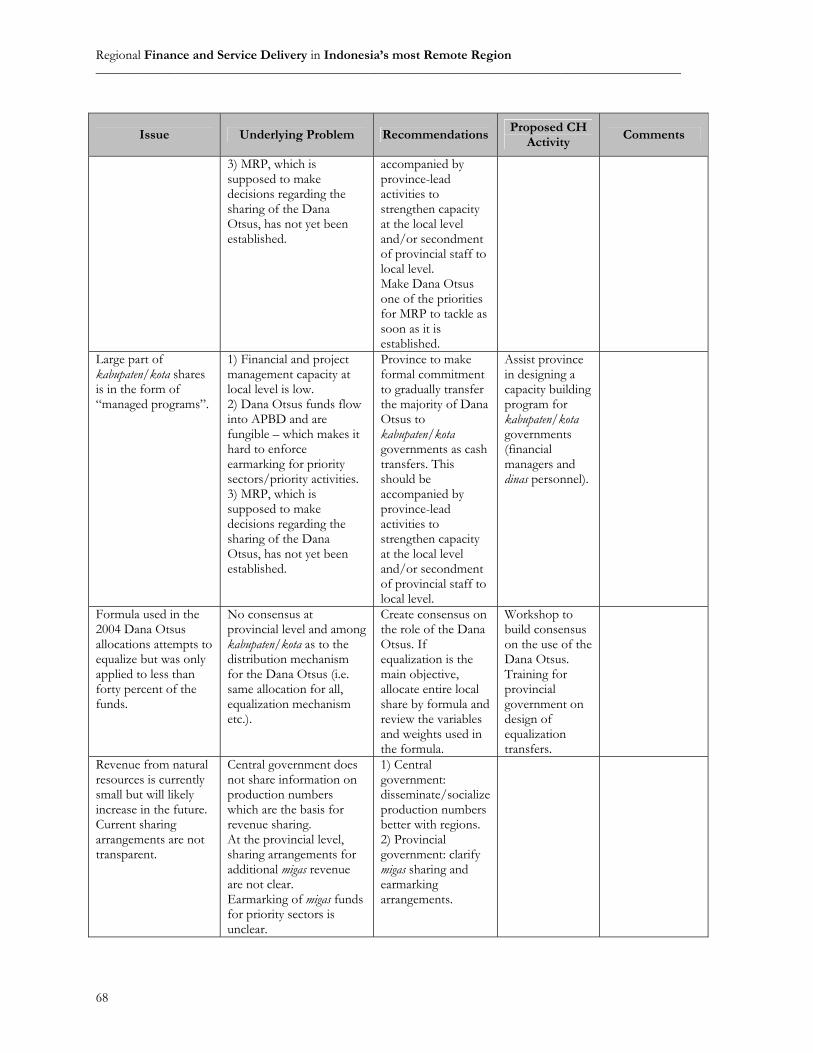
Regional Finance and Service Delivery in Indonesia’s most Remote Region ________________________________________________________________________________________
68
Issue Underlying Problem RecommendationsProposed CH
Activity Comments
3) MRP, which is supposed to make decisions regarding the sharing of the Dana Otsus, has not yet been established.
accompanied by province-lead activities to strengthen capacity at the local level and/or secondment of provincial staff to local level. Make Dana Otsus one of the priorities for MRP to tackle as soon as it is established.
Large part of kabupaten/kota shares is in the form of “managed programs”.
1) Financial and project management capacity at local level is low. 2) Dana Otsus funds flow into APBD and are fungible – which makes it hard to enforce earmarking for priority sectors/priority activities. 3) MRP, which is supposed to make decisions regarding the sharing of the Dana Otsus, has not yet been established.
Province to make formal commitment to gradually transfer the majority of Dana Otsus to kabupaten/kota governments as cash transfers. This should be accompanied by province-lead activities to strengthen capacity at the local level and/or secondment of provincial staff to local level.
Assist province in designing a capacity building program for kabupaten/kota governments (financial managers and dinas personnel).
Formula used in the 2004 Dana Otsus allocations attempts to equalize but was only applied to less than forty percent of the funds.
No consensus at provincial level and among kabupaten/kota as to the distribution mechanism for the Dana Otsus (i.e. same allocation for all, equalization mechanism etc.).
Create consensus on the role of the Dana Otsus. If equalization is the main objective, allocate entire local share by formula and review the variables and weights used in the formula.
Workshop to build consensus on the use of the Dana Otsus. Training for provincial government on design of equalization transfers.
Revenue from natural resources is currently small but will likely increase in the future. Current sharing arrangements are not transparent.
Central government does not share information on production numbers which are the basis for revenue sharing. At the provincial level, sharing arrangements for additional migas revenue are not clear. Earmarking of migas funds for priority sectors is unclear.
1) Central government: disseminate/socialize production numbers better with regions. 2) Provincial government: clarify migas sharing and earmarking arrangements.

Papua Public Expenditure Analysis | Overview Report _________________________________________________________________________________________
69
Issue Underlying Problem RecommendationsProposed CH
Activity Comments
Budget Implementation
Revenue Disbursement of Special Autonomy Fund from central to provincial government is delayed.
Onerous quarterly reporting requirements on the allocation of the funds, which requires province to request detailed reports from kabupaten/kota governments. The main problem is that unlike the DAK, the Dana Otsus is not formally earmarked for certain projects, which makes adequate monitoring of the use of funds difficult.
Simplify reporting and disbursement procedures for the Dana Otsus. Either follow DAK-type procedures (one disbursement, based on submission of project information) or DAU-type procedures (monthly installments, no reporting requirements).
-- Needs to be discussed with central government.
High dependence on central transfers. PAD mobilization is low, both as a share of total revenues and compared to other regions
1) Given the magnitude of the Dana Otsus and DAU, there is little incentive to increase PAD. 2) Local taxes prescribed by Law 34 may not be adequate for many local governments in Papua.
Strengthen kabupaten/kota governments’ capacity to administer standard taxes. Identify potential revenue sources that have not yet been tapped.
Local Revenue Mobilization Training for selected kabupaten/kota government officials and local academics (to be held in Makassar at end-August).
May also want to build on local revenue framework developed by ILGR.
Revenue inequality among kabupaten/kota in Papua is high.
DAU and Dana Otsus are not as equalizing as they could be. It is not, however, clear whether the Dana Otsus should indeed be an equalization transfer.
Central government should strengthen formula component of the DAU. Provincial government should determine whether Dana Otsus should be designed as an equalization transfer. If yes, the formula should be improved and applied to the entire local share of the fund.
Training for provincial government on design of equalization transfers.
Financing Budget deficits are common.
1) Weak financial management and revenue forecasting capacity. 2) Delays in disbursement of certain transfers may lead to liquidity problems.
Familiarize kabupaten/kota governments with central government regulations on budget deficits. Strengthen financial management capacity. Ensure that

Regional Finance and Service Delivery in Indonesia’s most Remote Region ________________________________________________________________________________________
70
Issue Underlying Problem RecommendationsProposed CH
Activity Comments
transfers are disbursed in a timely fashion.
Loan repayment record is weak, while new borrowing is on the rise.
The central government does not enforce any sanctions in case of non-repayment. New borrowing may be motivated by: 1) Possibly lack of funds for expensive long-term infrastructure development. 2) Use of loans to pay for routine expenditures.
Familiarize local governments with central government regulations on borrowing.
Expenditure Development spending has been boosted by Dana Otsus but some substitution can be observed.
Dana Otsus funds are fungible despite implicit earmarking. Lack of understanding of purpose of Dana Otsus.
Create consensus on the role of the Dana Otsus (i.e. equalization vs. explicit earmarking for priority sectors). If it should be an earmarked grant, mechanisms need to be in place to enforce the earmarking (eligibility, disbursement, monitoring etc).
Workshop to build consensus on the use of the Dana Otsus. If earmarking is desirable, provide assistance to provincial government in designing earmarked grants.
The relative importance of the three priority sectors (health, education and infrastructure) has not changed significantly. The Dana Otsus in particular has not been sufficiently prioritized for these sectors.
Revenue windfall has resulted in increased funding for all sectors, not exclusively for priority sectors. Implicit earmarking of Dana Otsus for priority sectors is not being enforced.
Create consensus on the role of the Dana Otsus (i.e. equalization vs. explicit earmarking for priority sectors). If it should be an earmarked grant, mechanisms need to be in place to enforce the earmarking (eligibility, disbursement, monitoring etc).
Workshop to build consensus on the use of the Dana Otsus. If earmarking is desirable, provide assistance to provincial government in designing earmarked grants.
Large share of Dana Otsus is spent on government apparatus.
Implicit earmarking for priority sectors is not being enforced. Kabupaten/kota governments do not understand the purpose of the Dana Otsus.
Create consensus on the role of the Dana Otsus (i.e. equalization vs. explicit earmarking for priority sectors). If it should be an
Workshop to build consensus on the use of the Dana Otsus. If earmarking is desirable, provide
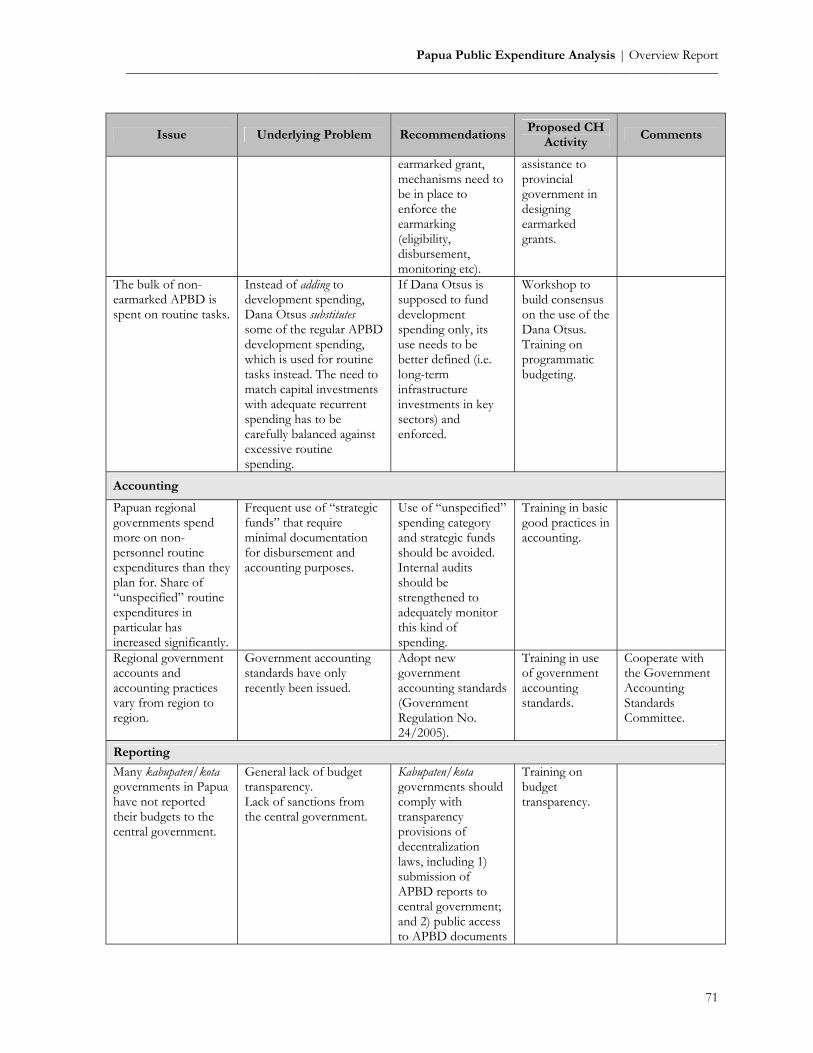
Papua Public Expenditure Analysis | Overview Report _________________________________________________________________________________________
71
Issue Underlying Problem RecommendationsProposed CH
Activity Comments
earmarked grant, mechanisms need to be in place to enforce the earmarking (eligibility, disbursement, monitoring etc).
assistance to provincial government in designing earmarked grants.
The bulk of non-earmarked APBD is spent on routine tasks.
Instead of adding to development spending, Dana Otsus substitutes some of the regular APBD development spending, which is used for routine tasks instead. The need to match capital investments with adequate recurrent spending has to be carefully balanced against excessive routine spending.
If Dana Otsus is supposed to fund development spending only, its use needs to be better defined (i.e. long-term infrastructure investments in key sectors) and enforced.
Workshop to build consensus on the use of the Dana Otsus. Training on programmatic budgeting.
Accounting
Papuan regional governments spend more on non-personnel routine expenditures than they plan for. Share of “unspecified” routine expenditures in particular has increased significantly.
Frequent use of “strategic funds” that require minimal documentation for disbursement and accounting purposes.
Use of “unspecified” spending category and strategic funds should be avoided. Internal audits should be strengthened to adequately monitor this kind of spending.
Training in basic good practices in accounting.
Regional government accounts and accounting practices vary from region to region.
Government accounting standards have only recently been issued.
Adopt new government accounting standards (Government Regulation No. 24/2005).
Training in use of government accounting standards.
Cooperate with the Government Accounting Standards Committee.
Reporting
Many kabupaten/kota governments in Papua have not reported their budgets to the central government.
General lack of budget transparency. Lack of sanctions from the central government.
Kabupaten/kota governments should comply with transparency provisions of decentralization laws, including 1) submission of APBD reports to central government; and 2) public access to APBD documents
Training on budget transparency.
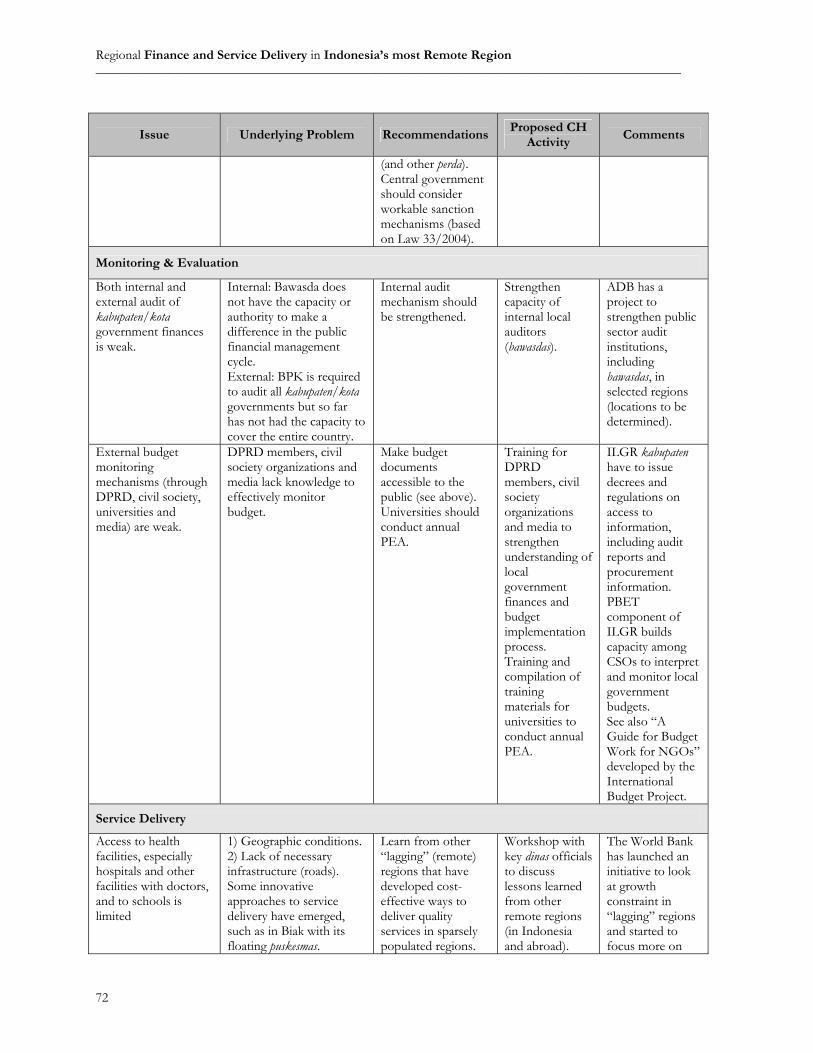
Regional Finance and Service Delivery in Indonesia’s most Remote Region ________________________________________________________________________________________
72
Issue Underlying Problem RecommendationsProposed CH
Activity Comments
(and other perda). Central government should consider workable sanction mechanisms (based on Law 33/2004).
Monitoring & Evaluation
Both internal and external audit of kabupaten/kota government finances is weak.
Internal: Bawasda does not have the capacity or authority to make a difference in the public financial management cycle. External: BPK is required to audit all kabupaten/kota governments but so far has not had the capacity to cover the entire country.
Internal audit mechanism should be strengthened.
Strengthen capacity of internal local auditors (bawasdas).
ADB has a project to strengthen public sector audit institutions, including bawasdas, in selected regions (locations to be determined).
External budget monitoring mechanisms (through DPRD, civil society, universities and media) are weak.
DPRD members, civil society organizations and media lack knowledge to effectively monitor budget.
Make budget documents accessible to the public (see above). Universities should conduct annual PEA.
Training for DPRD members, civil society organizations and media to strengthen understanding of local government finances and budget implementation process. Training and compilation of training materials for universities to conduct annual PEA.
ILGR kabupaten have to issue decrees and regulations on access to information, including audit reports and procurement information. PBET component of ILGR builds capacity among CSOs to interpret and monitor local government budgets. See also “A Guide for Budget Work for NGOs” developed by the International Budget Project.
Service Delivery
Access to health facilities, especially hospitals and other facilities with doctors, and to schools is limited
1) Geographic conditions. 2) Lack of necessary infrastructure (roads). Some innovative approaches to service delivery have emerged, such as in Biak with its floating puskesmas.
Learn from other “lagging” (remote) regions that have developed cost-effective ways to deliver quality services in sparsely populated regions.
Workshop with key dinas officials to discuss lessons learned from other remote regions (in Indonesia and abroad).
The World Bank has launched an initiative to look at growth constraint in “lagging” regions and started to focus more on
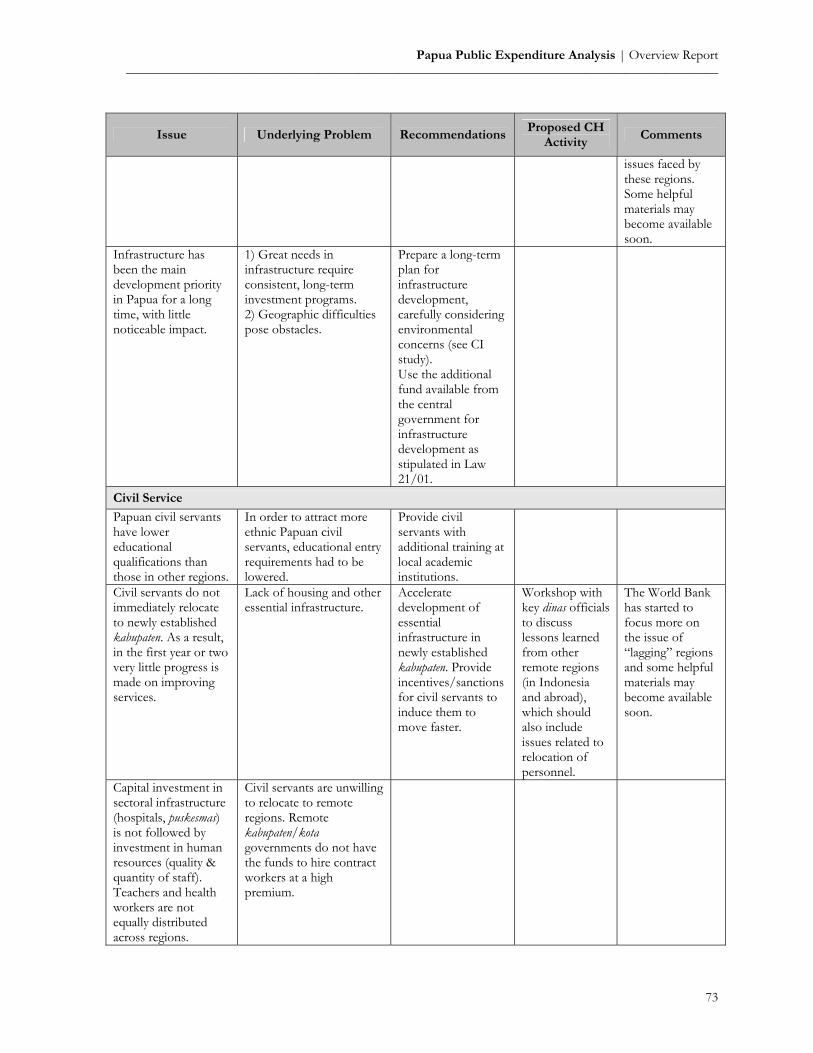
Papua Public Expenditure Analysis | Overview Report _________________________________________________________________________________________
73
Issue Underlying Problem RecommendationsProposed CH
Activity Comments
issues faced by these regions. Some helpful materials may become available soon.
Infrastructure has been the main development priority in Papua for a long time, with little noticeable impact.
1) Great needs in infrastructure require consistent, long-term investment programs. 2) Geographic difficulties pose obstacles.
Prepare a long-term plan for infrastructure development, carefully considering environmental concerns (see CI study). Use the additional fund available from the central government for infrastructure development as stipulated in Law 21/01.
Civil Service
Papuan civil servants have lower educational qualifications than those in other regions.
In order to attract more ethnic Papuan civil servants, educational entry requirements had to be lowered.
Provide civil servants with additional training at local academic institutions.
Civil servants do not immediately relocate to newly established kabupaten. As a result, in the first year or two very little progress is made on improving services.
Lack of housing and other essential infrastructure.
Accelerate development of essential infrastructure in newly established kabupaten. Provide incentives/sanctions for civil servants to induce them to move faster.
Workshop with key dinas officials to discuss lessons learned from other remote regions (in Indonesia and abroad), which should also include issues related to relocation of personnel.
The World Bank has started to focus more on the issue of “lagging” regions and some helpful materials may become available soon.
Capital investment in sectoral infrastructure (hospitals, puskesmas) is not followed by investment in human resources (quality & quantity of staff). Teachers and health workers are not equally distributed across regions.
Civil servants are unwilling to relocate to remote regions. Remote kabupaten/kota governments do not have the funds to hire contract workers at a high premium.

Regional Finance and Service Delivery in Indonesia’s most Remote Region ________________________________________________________________________________________
74
10. BIBLIOGRAPHY Badan Pusat Statistik (BPS), Bappenas and UNDP (2004). National Human Development Report 2004.
The Economics of Democracy -- Financing Human Development in Indonesia. Jakarta: BPS. Badan Pusat Statistik (BPS), Provinsi Papua (2004). Papua Dalam Angka 2003. Jayapura: BPS. Badan Pusat Statistik (BPS), Provinsi Papua (2003). Papua Dalam Angka 2002. Jayapura: BPS. Chauvel, Richard and Ikrar Nusa Bhakti (2004). The Papua Conflict: Jakarta’s Perceptions and Policies.
Washington: Policy Studies 5, East-West Center Washington. Chauvel, Richard (2005). Constructing Papuan Nationalism: History, Ethnicity, and Adaptation.
Washington: East-West Center Washington. Cookson, Michael (2004). Chronology of Papua. UNIPA, UNCEN & ANU Papuaweb Project
(www.papuaweb.org). Garnaut, Ross and Chris Manning (1974). Irian Jaya – The Transformation of a Melanesian Economy.
Canberra: Australian National University Press. Institute for Civil Society (2003). Report of the Workshop on the Evaluation of the First Year of
Implementation of Special Autonomy in Papua. Jayapura. Institute for Civil Society (2005). Special Autonomy in Papua: Reflection on the Incident of 21 November
2001 through 23 December 2004. Strengthening Papua supported by the Partnership for Governance Reform in Indonesia, Jayapura.
International Foundation for Election Systems (IFES) (2003). Survei Pendapat Umum Papua Indonesia.
Jakarta: IFES. Jakarta Post, 1 April 2005. “Papua gets Rp. 1.7 trillion for Special Autonomy”. Jakarta Post, 11 February 2005. “Papua Calls Foul Over Freeport Fees”. Lewis, Blane (2004). “Sub-National Public Debt”. World Bank Jakarta (unpublished document). Lewis, Blane and Jasmin Chakeri (2004a). “Decentralized Local Government Budgets in Indonesia: What
Explains the Large Stock in Reserves?” World Bank Jakarta (unpublished document). Lewis, Blane and Jasmin Chakeri (2004c). “Development Spending in the Regions”. World Bank Jakarta
(unpublished document). Lewis, Blane and Jasmin Chakeri (2004c). “Spatial Dsitribution of Development Spending”. World Bank
Jakarta (unpublished document). Manning, Chris and Michael Rumbiak (1989). “Irian Jaya: Economic Change, Migrants and Indigenous
Welfare”, in: Hill, Hal (ed.), Unity and Diversity – Regional Economic Development in Indonesia since 1970. Singapore: Oxford University Press.

Papua Public Expenditure Analysis | Overview Report _________________________________________________________________________________________
75
McGibbon, Rod (2004). Secessionist Challenges in Aceh and Papua: Is Special Autonomy the Solution? Hawaii: East West Center.
Millennium Institute (2003). Threshold 21 Model Project for Conservation International: Strategic
Options for Papua, Indonesia. Arlington, VA: Millennium Institute. Miningindo.com, 13 June 2005. “Acquisition of Freeport’s Shares will not Disrupt Papua’s APBD”. Pemerintah Kabupaten Biak Numfor (2004). Peraturan Daerah No. 1/2004 Tentang Penetapan APBD
Kabupaten Biak Numfor. Pemerintah Kabupaten Mimika (2004). Keputusan Bupati Mimika Tentang Penjabaran APBD Tahun
Anggaran 2004. Pemerintah Provinsi Papua (2003). Laporan Pengelolaan Dana Penerimaan Khusus Dalam Rangka
Otonomi Khusus Provinsi Papua Tahun Anggaran 2002 Dan Kebijakan Pengelolaan Tahun Anggaran 2003.
Pemerintah Provinsi Papua (2003). Kebijakan Alokasi Penggunaan Dana Otonomi Khusus Untuk
Pembangunan Provinsi Papua TA 2003. Pemerintah Provinsi Papua (2004). Laporan Pengelolaan Dana Penerimaan Khusus Dalam Rangka
Otonomi Khusus Provinsi Papua Tahun Anggaran 2003 Dan Kebijakan Pengelolaan Tahun Anggaran 2004.
Pemerintah Provinsi Papua (2004). Laporan Pelaksanaan Program Pembangunan Sumber Dana
Penerimaan Khusus Provinsi Papua Tahun Kedua (2003) Dan Kebijakan Pengelolaan Tahun 2004.
Pemerintah Provinsi Papua (2004). Prosiding: Lokakarya Evaluasi Pelaksanaan Otonomi Khusus Tahun
Kedua (2003) Provinsi Papua. Pemerintah Provinsi Papua (2004). Laporan Realisasi Fisk Dan Keuangan Proyek-Proyek Pembangunan
Daerah Provinsi Papua Sumber Dana Penerimaan Khusus Provinsi Papua Tahun Anggaran 2003 Keadaan 31 Desember 2003.
Pemerintah Provinsi Papua (2004). Laporan Realisasi Fisk Dan Keuangan Proyek-Proyek Pembangunan
Daerah Program Yang Diarahkan Dan Bantuan Dana Segar/Fresh Money Ke Kabupaten/Kota Sumber Dana Penerimaan Khusus Provinsi Papua Tahun Anggrana 2003 Keadaan 31 Desember 2003.
Pemerintah Provinsi Papua (2004). Laporan Realisasi Fisik dan Keuangan Program Yang Diarahkan Dan
Bantuan Dana Segar (Fresh Money) Ke Kabupaten/Kota Sumber Dana Penerimaan Khusus Provinsi Papua TA 2003.
Pemerintah Provinsi Papua (2004). Laporan Pelaksanaan Program Pembangunan Sumber Dana
Penerimaan Khusus Provinsi Papua Tahun Ketiga (2004). Pemerintah Provinsi Papua/BP3D (2004). Kriteria Pembagian Dana Otonomi Khusus Untuk
Kabupaten/Kota.
Regional Finance and Service Delivery in Indonesia’s most Remote Region ________________________________________________________________________________________
76
Sheng, Fulai (2004). Comparative Assessment of Development Options. CCG Report. Center for Conservation and Government. Washington, DC: Conservation International.
Sombuk, Musa (2004). Catatan Tentang 2 Tahun Pelaksanaan Otonomi Khusus Papua. Hasil Evaluasi
Otsus Papua Tanggal 13-14 Oktober 2004. Jayapura. STIE Ottow Geissler (2005). Public Expenditure Analysis and Capacity Harmonization: Laporan
Kabupaten Pegunungan Bintang. Sullivan, Laurence (2003). “Affirmative Action and Otsus”. Published on www.irja.org. Sumule, Agus (ed.) (2003). Mencari Jalan Tengah – Otonomi Khusus Provinsi Papua. Jakarta: PT.
Gramedia. Support Office for Eastern Indonesia (SOfEI) (2004). Papua – The Land of Lessons Unlearned.
Preliminary Survey Report. Makassar: SOfEI. Sutanto, Agus and Puguh B. Irawan (2000). Regional Dimensions of Poverty: Some Findings on The
Nature of Poverty. Jakarta: Paper Presented at International Conference on Poverty Measurement in Indonesia.
Tempo Magazine, Nov. 23-29, 2004. Papua Dreaming About Freeport. United Nations Development Program/Fund of the UN for the Development of West Irian (1968). A
Design for Development of West Irian. New York: United Nations. Universitas Cenderawasih (UNCEN) (2005). Papua Public Expenditure Analysis and Capacity
Harmonization: Laporan Provinsi Papua. Universitas Cenderawasih (UNCEN) (2005). Public Expenditure Analysis and Capacity Harmonization:
Laporan Kota Jayapura. Univeritas Negeri Papua Manokwari (UNIPA) (2003). Penelaan Penepatan Anggaran Pendapatan dan
Belanja Daerah Kabupaten Manokwari, Mimika dan Merauke Era Otonomi Khusus Provinsi Papua. Manokwari: UNIPA.
Univeritas Negeri Papua Manokwari (UNIPA) (2005). Public Expenditure Analysis and Capacity
Harmonization: Laporan Kabupaten Mimika. Univeritas Negeri Papua Manokwari (UNIPA) (2005). Public Expenditure Analysis and Capacity
Harmonization: Laporan Kabupaten Biak Numfor. Universitas Indonesia-LPEM (2004). Economic Analysis of PT. Freeport Indonesia. Jakarta: PT. Freeport. World Bank (2000). Priorities for Civil Service Reform. World Bank East Asia and Pacific Region, Poverty
Reduction and Economic Management Unit. World Bank (2003). Decentralizing Indonesia. World Bank Regional Public Expenditure Review Overview
Report. World Bank East Asia and Pacific Region, Poverty Reduction and Economic Management Unit.
Papua Public Expenditure Analysis | Overview Report _________________________________________________________________________________________
77
World Bank (2005). Education in Indonesia -- Managing the Transition to Decentralization. Jakarta: The World Bank.
Yayasan Konsultasi Independen Pemberdayaan Rakyat (KIPRa – Papua) (2004). Keprihatinan KIPRa –
Papua Terhadap APBD 2004 Kota Jayapura. Jayapura: KIPRa. Yayasan Konsultasi Independen Pemberdayaan Rakyat (KIPRa – Papua) (2004). Hasil Analsisi Dan Kajian
APBD 2004 Kota Jayapura Sesuai Dengan Perda No. 1 Tahun 2004. Jayapura: KIPRa.