public disclosure authorized coffee, tea, and cocoa tea, and cocoa market prospects ... deepak lal,...
TRANSCRIPT

Coffee, Tea, and CocoaMarket Prospectsand Development Lending
OCP-22Shamsher Singh, Jos de Vries,John C. L. Hulley, and Patrick Yeung
WORLD BANK STAFF OCCASIONAL PAPERS Z NUMBER TWENTY-TWO
Pub
lic D
iscl
osur
e A
utho
rized
Pub
lic D
iscl
osur
e A
utho
rized
Pub
lic D
iscl
osur
e A
utho
rized
Pub
lic D
iscl
osur
e A
utho
rized

World Bank Staff Occasional Papers
No. 1. Herman G. van der Tak, The Economic Choice between Hy-droelectric and Thermal Power Developments.
No. 2. Jan de Weille, Quantification of Road User Savings.No. 3. Barend A. de Vries, The Export Experience of Developing
Countries (out of print).No. 4. Hans A. Adler, Sector and Project Planning in Transportation.No. 5. A. A. Walters, The Economics of Road User Charges.No. 6. Benjamin B. King, Notes on the Mechanics of Growth and
Debt.No. 7. Herman G. van der Tak and Jan de Weille, Reappraisal of a
Road Project in Iran.No. 8. Jack Baranson, Automotive Industries in Developing Coun-
tries.No. 9. Ayhan ,Cilingiroglu, Manufacture of Heavy Electrical Equip-
ment in Developing Countries.No. 10. Shlomo Reutlinger, Techniques for Project Appraisal under
Uncertainty.No. 11. Louis Y. Pouliquen, Risk Analysis in Project Appraisal.No. 12. George C. Zaidan, The Costs and Benefits of Family Planning
Programs.No. 13. Herman G. van der Tak and Anandarup Ray, The Economic
Benefits of Road Transport Projects.No. 14. Hans Heinrich Thias and Martin Carnoy, Cost-Benefit Analy-
sis in Education: A Case Study of Kenya.No. 15. Anthony Churchill, Road User Charges in Central America.No. 16. Deepak Lal, Methods of Project Analysis: A Review.No. 17. Kenji Takeuchi, Tropical Hardwood Trade in the Asia-Pacific
Region.No. 18. Jean-Pierre Jallade, Public Expenditures on Education and In-
come Distribution in Colombia.No. 19. Enzo R. Grilli, The Future for Hard Fibers and Competition
from Synthetics.No. 20. Alvin C. Egbert and Hyung M. Kim, A Development Model
for the Agricultural Sector of Portugal.No. 21. Manuel Zymelman, The Economic Evaluation of Vocational
Training Programs.No. 22. Shamsher Singh and others, Coffee, Tea, and Cocoa: Market
Prospects and Development Lending.No. 23. Shlomo Reutlinger and Marcelo Selowsky, Malnutrition and
Poverty: Magnitude and Policy Options.

WORLD BANK STAFF OCCASIONAL PAPERS r:1 NUMBER TWENTY-TWO

The views and interpretations in this book are those of the authors and shouldnot be attributed to the World Bank, to its affiliated organizations, or to anyindividual acting in their behalf.

SHAMSHER SINGH, JOS DE VRIES
JOHN C. L. HULLEY, AND PATRICK YEUNG
Coffee, Tea, and CocoaMarket Prospects
and Development Lending
Published for the World Bank
THE JOHNS HOPKINS UNIVERSITY PRESSBALTIMORE AND LONDON

Copyright © 1977 The International Bank for Reconstruction and Developmenc /The World BankAll rights reserved
Mau ufact ured in the Uniited States of .Ameiica
Library of Congress Cataloging in Publication DataMain entry under title:
Coffee, tea, and cocoa.
(World Bank staff occasional papers; 22)1. Coffee trade. 2. Cocoa trade. 3. Tea trade. 4. Economic assistance. 1. Singh,Shamsher, 1928- 11. International Bank for Reconstruction and Development. I][J.Title. IV. Series.HD9199.A2C64 380.141"37 76-17239ISBN 0-8018-1869-9

FOREWORD
I would like to explain why the World Bank doesresearch work and why this research is published. We feel anobligation to look beyond the projects that we help finance towardthe whole resource allocation of an economy and the effectiveness ofthe use of those resources. Our major concern, in dealings withmember countries, is that all scarce resources-including capital,skilled labor, enterprise, and know-how-should be used to theirbest advantage. We want to see policies that encourage appropriateincreases in the supply of savings, whether domestic or international.Finally, we are required by our Articles, as well as by inclination, touse objective economic criteria in all our judgments.
These are our preoccupations, and these, one way or another, arethe subjects of most of our research work. Clearly, they are also theproper concern of anyone who is interested in promoting develop-ment, and so we seek to make our research papers widely available.In doing so, we have to take the risk of being misunderstood.Although these studies are published by the Bank, the viewsexpressed and the methods explored should not necessarily beconsidered to represent the Bank's views or policies. Rather, they areoffered as a modest contribution to the great discussion on how toadvance the economic development of the underdeveloped world.
ROBERT S. MCNAMARA
PresidentThe World Bank


PREFACE
This paper consists of studies of the markets for coffee,cocoa, and tea prepared for the use of World Bank staff. The Bank'scommodity studies serve a dual purpose: to evaluate prospects forthe export earnings of borrowing member countries and to assessthe market prospects for individual commodities. Thus, they mayhelp to justify lending for increased production and for diversifica-tion into more promising fields.
The paper was prepared under the overall direction of ShamsherSingh, chief of the Commodities and Export Projections Division,who also wrote chapter 1. Chapter 2 was written by Jos de Vries,who also prepared Appendix A. Chapter 3 contains contributions byJohn Hulley and Patrick Yeung. Chapter 4 was written by PatrickYeung, who also prepared appendix B.
This paper has benefited greatly from the comments of severalpeople in the Bank. The authors are particularly indebted to RachelWeaving for editorial assistance in early drafts and to Maw-ChengYang and John E. Fisk for their help in data collection. The finalmanuscript was edited by Donald J. Pryor.
WOUTER TIMSDirector
Economic Analysis and Projections DepartmentWashington, D. C.
Summer 1976


CONTENTS
Foreword vPreface viiSynthesis and background 3
Economic characteristics 6 -The scope for increasing exportearnings 8 -The role of the World Bank 14 -Summaryof prospects: principal findings and conclusions 18
2. The world coffee market 24
Production and exports 27 -Imports and consumption 34-Prices and stocks 37 -Market outlook 43 -Theinternational coffee agreement 48
3. The world tea market 49
Production and exports 49 -Imports and consumption 58-Prices 61 -Market prospects 61 -Market shares andthe scope for international action 71
4. The world cocoa market 76
Production and exports 76 -Imports and consumption 87-Prices and stocks 96 -Market prospects 96 -Productionforecasts 99 -Demand projections 99 -Priceforecasts 100 -Sensitive factors 102 -The internationalcocoa agreement 103
Appendix A: An econometric model of the world coffee economy 104
The coffee model: equations, 1947/48 to 1972/73 110 -Thecoffee model: glossary of symbols 112

X CONTENTS
Appendix B: A comparative analysis of cocoa production in selectedcountries 115
The domestic resource cost approach 116 -Countrycoverage and data collection 118 -Findings for plantationproduction 119 -Findings for peasant production 123 --Comparison of findin,gs on the two methods of cocoaproduction 125 -Combined results for the twomethods 125 -Qualifications of findings 126 -
Conclusion 127
Appendix C: Development lending 128
Tables
1. World market shares of developing countries in, anddependence on, coffee, tea, and cocoa 4
2. Type of coffee grown, share in world production, growth rate,and share of coffee in export earnings: coffee-producingcountries 28
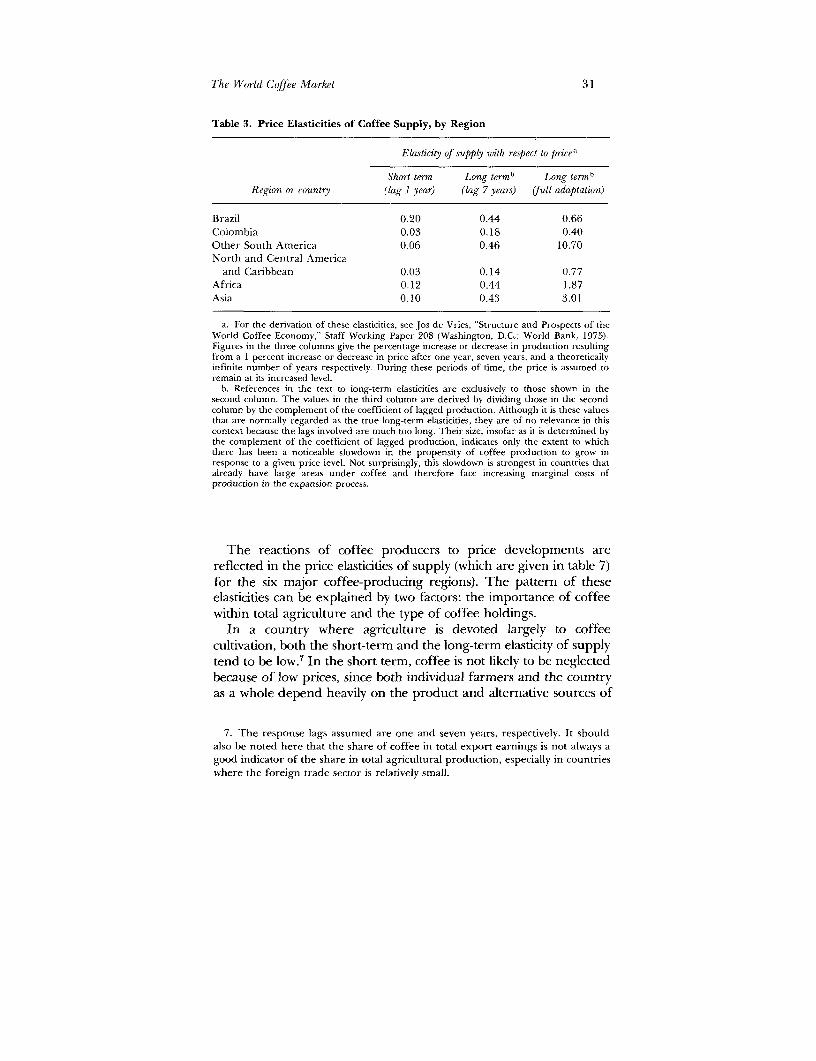
3. Price elasticities of coffee supply, by region 31
4. Share of coffee in foreign exchange receipts and GNP figuresfor countries highly dependent on coffee production 34
5. Average imports of coffee, total and per capita, majorimporting countries, 1950-53 and 1970-73 36
6. Price and income elasticities of demand for coffee, selectedyears, 1950-85 38
7. Coffee prices in the New York spot market 40
8. Average refunds to coffee importers under "contracts ofsupply" 41
9. Actual and projected coffee production and growth rates, byregion and year, 1970-86 and 1972-90 44
10. Actual and projected coffee consumption and growth rates, byregion and year, 1970-86 and 1972-90 46
11. Actual and projected coffee prices, and deflator, by year,1970-86 47
12. Average tea production, by region and country, and shares ofworld total, 1955-57 and 1971-73 51
13. Tea production, expcrts, and share of production exported,major producing countries, selected years, 1960-73 52

Contents xi
14. Average world tea exports, export value, export unit value, andLondon auction prices, 1955-57, 1960-62, and 1971-73,and annual percentage change, 1955-57 to 1960-62 and1960-62 to 1971-73 55
15. Value and market share of tea exports, Africa and South Asia,and per capita incomes 56
16. Average value of tea exports and tea share in world exportsand in total country export earnings, selected Asian andAfrican countries, 1955-57 and 1971-73 57
17. Imports of tea, selected countries, yearly, 1968-73 58
18. Comparison of tea imports and reexports of the UnitedKingdom with world totals, selected years, 1955-73 60
19. Average tea consumption, by region and country and shares ofworld total, 1955-57 and 1971-73 62
20. Price and income elasticities of the demand for tea, selectedcountries 64
21. Annual average tea prices for selected countries at Londonauctions, by year, 1955-75 66
22. Summary of tea production, consumption, and trade, 1955-57,1967-69, and 1973, with projections to 1980 and 1985 68
23. Price elasticity of demand for exports of tea, market share, andper capita GNP, selected countries, 1967-69 72
24. World production and exports of cocoa beans 7825. Export value of cocoa beans and products, selected countries,
and share in world totals and in national export earnings80
26. World summary of cocoa production, grindings, stocks, prices,exports, and imports, 1946-75 82
27. Export volume and total and unit value of cocoa beans 8428. Imports of cocoa beans, selected countries, 1957-61, 1967-71,
and 1973 88
29. Trade in cocoa beans by main areas of origin and destination,1970 89
30. Cocoa bean grindings by country, 1934-38 to 1973 90
31. Cocoa consumption of selected countries, 1957-61, 1967-71,and 1972 92
32. Elasticities of demand for cocoa in bean equivalent, selectedcountries 94
33. Price elasticity of demand for cocoa: three estimates 95

Xii CONITENITS
34. World cocoa production: actual, 1967-71, and projections for1980 and 1985 98
35. Basic projections of world demand for cocoa, 1980, using FAOmodel 101
B1. Estimated ratios of D:RC to SER (and to FX) for cocoaproduction 120
B2. Estimated ranges of I)RC/SER ratios for plantation cocoaproduction, various countries 122
B3. Computed DRCs and related measures of comparativeadvantage in 1972 for major cocoa-producing countries,using the average world spot price for 1972 123
B4. Original estimates of DRC/SER ratios, major cocoa-producingcountries 126
Cl. World Bank lending for cocoa and tea planting 129
Figures
1. Tea production in major producing countries and Africa,1955-74 53
2. Volume, total value, and unit value of world exports of tea,1955-73 54
3. Average annual tea prices at London auctions, selectedcountries, 1955-75 65
4. Elasticity of demand and market shares of tea-exportingcountries 74
5. Volume, total value, and unit value of world exports of cocoabeans, 1950-73. 86
6. Surplus or deficit of stocks and market prices for cocoa,1947-73 97
Al. Actual and simulated coffee prices since 1949 106A2. Price projections for coffee under different assumptions about
frost 107A3. Price projections for coffee at different levels of inflation 108A4. Price projections for coffee at different levels of income
growth 109

Coffee, Tea, and CocoaMarket Prospects
and Development Lending


1
SYNTHESIS AND BACKGROUND
THE INTEREST OF THE WORLD BANK' in the marketprospects for primary commodities stems from a variety of consider-ations. Primary products account for four-fifths of the total exportsof the Bank's developing members, its principal borrowers. Al-though exports of manufactured goods from these countries havebeen rising rapidly-by 13 percent a year in 1955-72-the startingbase is small, and primary commodities remain the main determi-nant of their overall export performance and ability to serviceexternal debt. The ability of Bank investments to enlarge theproductive base of the primary sector is directly affected by themarket outlook for the products involved. Coffee, tea, and cocoa areamong the more important primary commodities and are studied bythe Bank staff on a continuous basis. Coffee, in fact, is second only tooil as an earner of foreign exchange for developing countries. In1972-74, when the total export earnings of developing countriesfrom primary commodities other than oil were estimated at approxi-mately $47,000 million, the value of their exports of coffee was$3,700 million; of tea, $660 million; and of cocoa (beans), $1,000million.2 They are especially important in the export earnings ofsmall, poor countries (see table 1).
Studies of the three products have been combined in one bookbecause the economics of coffee, tea, and cocoa have much in
1. As used in this paper, the term "World Bank" refers to both the Interna-tional Bank for Reconstruction and Development and its affiliate, The Interna-tional Development Association.
2. All money amounts are in U.S. dollars unless otherwise specified. Tons aremetric tons.
3

Table 1. World Market Shares of Developing Countries in, and Dependence on, Coffee, Tea, and Cocoa
Countsy share in commodity exports Commodity sitares in country exports 1970-72Population, GNP per 1970-72 (percent) (percent)mid-1972 capita 1972
Region and counbly' (millions) (U.S. dollars) Coffte Cocoa Tea Coffee Cocoa Tea Total
T'otal, developing countries 96.8 100.0 83.1 4.9 1.3 1.0 7.2
Latin America and Caribbean
l3razil 98.2 530 30.2 8.7 0.5 27.7 2.1 0.1 29.9Colombia 23.0 400 14.4 0.0 0.0 58.8 0.0 0.0 58.8Costa Rica i.8 b3o 2.4 (.3 (0.0 28.9 0.9 0.0 29.8Dominicari Republic 4.2 480 0.8 2.1 0.0 8.5 G.0 0.0 14.5
4 Ecuador 6.5 360 1.5 3.1 0.0 16.8 9.2 0.1 26.1El Salvador 3.7 340 3.5 0.0 0.0 42.0 0.0 0.0 42.0Guatemala 5.6 420 3.5 0.0 0.0 33.7 0.1 0.0 33.8Haiti 4.4 130 0.6 0.1 0.0 43.3 1.6 0.0 44.9Honduras 2.7 320 0.9 (.0 0.0 14.7 0.0 0.0 14.7Nicaragua 2.2 470 1.0 0.0 0.0 15.5 0.1 0.0 15.6West Indies (British) n.a. n,a. 0.0 0.3 0.0 0.0 14.1 0.0 14.1Total 63.7 16.7 2.0 10.2 0.7 0.1 11.0
Africa
Angola 5.6 390 4.8 0.0 0.( 31.4 0.1 0.0 31.5Beniii 2.9 110 0.0 0.8 0.0 3.2 16.8 0.0 20.0Burundi 3.5 70 0.6 0.0 0.0 73.0 0.0 0.0 73.0Cameroon 6.1 200 1.9 6.5 0.I 25.1 22.7 0.3 48.1Central Africani Republic 1.7 160 0.2 0.( 0.( 20.6 (.0 0.( 20.6C.oniomo islatds Il.<l. n.a. 0.0 0.0 0.0 5.0 (.0 0.0 5.0

Equatorial Guinea n.a. n.a. 0.2 2.0 0.0 27.7 69.1 0.0 96.8Ethiopia 25.9 80 2.5 0.0 0.0 53. 3 0.0 0.0 53.3Ghana 9.1 300 0.0 31.7 0.0 0.3 62.0 0.0 62.3Guinea 5.1 90 0.2 0.0 0.0 11.7 0.0 0.0 11.7Ivory Coast 5.4 340 5.5 11.6 0.0 32.7 17.9 0.0 50.6Kenya 12.1 170 2.1 0.0 5.7 26.6 0.0 17.1 43.7Madagascar 7.4 140 1.4 0.1 0.0 26.3 0.3 0.0 26.6Malawi 4.7 100 0.0 0.0 2.0 0.3 0.0 20.3 20.6Nigeria 69.5 130 0.1 23.7 0.0 0.1 10.3 0.0 10.4
Rwanda 3.9 60 0.4 0.0 0.2 57.3 0.0 6.4 63.7Sao Tome and Principe n.a. n.a. 0.0 0.7 0.0 1.7 83.3 0.0 85.0Sierra Leone 2.7 190 0.2 0.5 0.0 6.4 3.6 0.0 10.0Tanzania 13.6 120 1.5 0.0 0.9 16.1 0.1 2.4 18.6Togo 2.1 160 0.3 2.3 0.0 18.0 34.5 0.0 52.5
Uganda 10.5 150 4.9 0.0 2.1 58.8 0.0 5.9 64.7Zaire 19.1 100 1.3 0.3 0.2 5.8 0.3 0.2 6.3
Total 28.3 80.7 13.1 6.1 4.5 0.7 11.3
Asia and Oceania
Bangladesh 72.5 70 0.0 0.0 4.9 0.0 0.0 11.0 11.0India 563.5 110 1.4 0.0 28.8 1.9 0.0 9.5 11.4Papua New Guinea 2.6 290 0.8 1.9 0.1 16.2 9.9 0.5 26.6Portuguese Timor n.a. n.a. 0.1 0.0 0.0 90.5 0.0 0.0 90.5Sri Lanka 13.2 110 0.0 0.1 27.4 0.0 0.3 59.5 59.8Yemen, Arab Republic of 6.1 90 0.1 0.0 0.0 35.0 0.0 0.0 35.0
Total 4.7 2.6 68.0 0.5 0.1 1.9 2.5
n.a. Not available.a. Only those countries have been included in which at least one of the three cotmmodities accounts for 5 percent or more of export earnings.Sources: Shares in exports, "Commodity Trade and Price Trends," Report EC-166/75 (Washington, D.C., 1974); Population and GNP per capita, World Bank Atlas
1974 (Washington, D.C., 1974).

6 COFFEE, TEA, AND COCOA
common and the Bank's lending policies toward their production,processing, and marketing are guided by virtually identical criteria.All are tropical products, exported almost exclusively by developingcountries. Production is largely concentrated in poor countries thatdepend heavily on them fcr their foreign exchange earnings. Theirmain markets are in the developed countries. Demand for them inthe major importing countries grows slowly, since their incomeelasticity is low.3 Their real prices have tended to decline, and thereis little scope for increasing their aggregate export earnings in rcalterms.4 Prospects for raising (as opposed to stabilizing) pricesthrough producer action or international agreement are limnited.Benefits could accrue to the developing countries, however, if themajor importing countries were to eliminate their internal taxes onthese commodities and liberalize their imports of processed pro,d-ucts.
Chapters 2 through 4 deal in general terms with the markets forcoffee, tea, and cocoa, respectively. For each product, an overvilew isgiven of production and exports and of consumption and imports,followed by a section on the market outlook. The two appendixes,one on coffee and the other on cocoa, summarize two of the studiesthat lay behind the market forecasts in chapters 2 and 4.
ECONOIAIC CHARACTERISTICS
Coffee, tea, and cocoa are tree crops with gestation periods of aboutfive years. They mature in from seven to ten years and have aneconomic life of about forty years. The new hybrid varieties startyielding in the third year, mature earlier than the older varieties, andhave a shorter economic life. Capital costs of establishing newplantings are high. Among recurrent costs, those for labor predomrli-nate, for both cultivation and harvesting are highly labor intensive.Price changes have little effect on supply in the short run, lbut adecided effect in the long run; when prices are high, therc is atendency toward overinvestment. Thus, price movements tend to be
3. In the language of econorrics, elasticity is the degree to which one variablewill change in response to change in another. Thus the elasticity of A with respectto B (or the B elasticity of A) is the percentage increase in A resulting from a Ipercent increase in B.
4. Relative to their import pur chasing power, for example, the nuhnber of bagsor tons of coffee, tea, or cocoa required to import a tractor or other vehicle.

Synthesis and Background 7
cyclical, with periods of boom often being followed by long periodsof oversupply and low prices.
By far the greater proportion of output from developing countriesenters international trade; with a few major exceptions-notablyBrazil in the case of coffee and India in the case of tea-domesticconsumption is small. In each case a small number of producingcountries accounts for a large share of world exports: Brazil,Colombia, and the Ivory Coast for coffee (48 percent of worldexports in 1970-72); India, Sri Lanka, and the Eastern Africancountries for tea (73 percent); and Ghana, Nigeria, and Brazil forcocoa (54 percent).5
A large number of producing countries are dependent on thesecommodities for a high proportion of their export earnings: abouttwenty-five derive more than a fourth of their export earnings froma single one, and several obtain a high proportion from coffee andtea or coffee and cocoa combined. Many of these countries haveannual per capita incomes of less than $200 and low rates of growthof gross national product (GNP).
Developed countries with market economies are the principalimporters of these beverages.' In 1970-72 they accounted for 92percent of the value of coffee exports from the developing countries,79 percent in the case of cocoa, and 61 percent in the case of tea.These percentages have changed little over the years, although theSoviet Union has emerged as an important importer of cocoa anddeveloping countries that do not produce tea now import largequantities of the less costly varieties.
In general, the elasticity of demand for these commodities in themajor importing countries is low with respect to both income andprice, at least within historical price ranges. Global price elasticities ofdemand 7 have been estimated at about -0.25 for coffee, -0.3 fortea, and -0.4 for cocoa. In most of the importing countries, incomeelasticities of demand for all three have tended to decline as percapita incomes have risen.
5. See table 1.6. Traditionally, cocoa was used as a beverage, hot chocolate; now its main use
is in confectionary. Cocoa's nomenclature as a beverage is thuts notional.7. Proportionate change in price required to induce a given change in demand.
For example, a price elasticity of -0.2 means that, for the market to absorb Ipercent of additional supplies, price would have to fall by 5 percent. Whenelasticities are low, the producers do not benefit from bringing additional supplieson the market.

8 COFFEE, TEA, AND COCOA
Since demand in the industrialized countries is relatively unres-ponsive to changes in price, increases in aggregate supply in excessof long-term demand depress international prices so that real exportearnings stagnate. Thus, between 1950 and 1972 the volume ofworld exports of coffee grew at an average rate of 3 percent a year,but the real value grew by only an average 0.6 percent a year. Overthe same period, the volume of world cocoa exports increased by 2.4percent a year and their real value by 1.7 percent; the volume ofworld exports of tea grew by 2 percent a year and their real value byonly 0.25 percent.
Under the assumptions detailed in the following chapters, worldimport demand for coffee is expected to increase by less lthan 2percent a year between 1973 and 1980 and consumption in theUnited States, the largest importer, is expected to decline at amarginal rate. World supplv and demand will be in a precariousbalance because of the destructive effects of the Brazilian frost ofJuly 1975; real prices are expected to remain relatively high in thenext few years, at a level of between 80 and 85 cents a pound (in1974 terms). Thereafter, a slow but steady decline in prices willaccompany the expected price-induced expansion of production.
As in the past, the international tea market is likelv to remaincharacterized by surpluses and weakening prices. World consump-tion of tea is expected to grow at an average rate of 3 percent a yearin the decade ahead, expanding more slowly than during the last twodecades. In real terms, tea prices are expected to decline substan-tially between 1970-72 and 1980.
The growth in world cocoa exports, which averaged nearly 3percent a year in the 1960s, dedined to less than 2 percent in theearly 1970s as supplies were reduced. Cocoa exports are expected toremain sluggish until 1976, then to turn up again as production risesin response to the high prices of the recent past and demand picksup in response to the downward adjustment in prices. Real prices ofcocoa are expected to decline to the low levels prevailing in 1970-72.
THE SCOPE FOR. INCREASING EXPORT EARNINGS
In general, there is little scope for rapid and sustained increases inthe earnings of developing countries from exports of coffee, tea, andcocoa. The most effective way to increase the total export earnings ofmany producers of these commodities would be to encourage
Synthesis and Background 9
diversification into the production of other crops for the domesticmarket and into the production of other exportable commodities forwhich prospects for demand are more favorable. FoI small and poorcountries, such a strategy may be unrealistic; for them, internationalmeasures to help increase their earnings from these staple commodi-ties may be crucial.
Several small and poor producers of coffee, tea, and cocoa have infact been able to expand their total export earnings relatively fast byexpanding their shares of the market for one or more of thesecommodities. They have done so at the expense of other exporters,whose market shares were correspondingly reduced. For example,the Ivory Coast increased the value of its cocoa exports by 10.5percent a year between 1960-62 and 1967-69, while the value ofworld cocoa exports grew by only 4 percent a year. This had anadverse effect upon the value of cocoa exports from Ghana, which atthe end of the 1960s still depended on cocoa for about 69 percent ofits export earnings. The Ivory Coast's dependence on cocoa was onlyof the order of 24 percent. In the case of coffee, Colombia and, evenmore notably, Brazil have been able to implement diversificationpolicies. In addition, recognizing their own interest in keepinginternational prices up, they deliberately restricted their coffeeexports.
It cannot be assumed, however, that important exporters ofcoffee, tea, or cocoa will always choose to diversify out of theirtraditional export staples, at least to any great extent, as they developthe capacity to do so. For example, the value of Indian and SriLankan tea on world markets continues to be eroded as the EasternAfrican countries expand their exports. If these two largest produc-ers were to restrict their exports voluntarily to take account of thenew producers' increasing shares of the market, they would benefitfrom the resulting effect on international price (provided, of course,the African expansion was held within reasonable limits). Untilrecently, however, neither has shown any clear propensity to do soor to promote diversification out of tea on a significant scale.
Three possible areas of action to enhance the prospects foraggregate export earnings from these commodities are consideredbriefly in the remainder of this section: increasing import demand inthe developed countries through trade liberalization; increasing thevalue-added component of exports by developing processing indus-tries in producing countries; and stabilizing or raising world pricesthrough international agreements.

10 COFFEE, TEA, AND COCOA
Liberalization of trade
Coffee, tea, and cocoa are noncompeting commodities in markets ofdeveloped countries in that they have no close substitutes (althoughconsumers' tastes may change) and cannot be produced in thesecountries.8 Thus, trade restrictions are not a highly significantconstraint on export earnings and are not as important as they arefor many other commodities, such as sugar.
Nonetheless, the benef.ts of trade liberalization should riot beunderestimated. A World Bank study9 shows that the gradualremoval of tariffs and of nontariff barriers (such as quantitativerestrictions and internal taKes) might enable developing countries toearn an additional $300 rnillion to $350 million annually (in 1974constant terms) from exports of these products. This estimate is onthe conservative side because it does not include the effect of theremoval of voluntary or subtle restrictions such as those on Brazilianexports of soluble coffee lo the United States. It also excludes theeffects of the possible contraction of tea production in Japan afterthe high Japanese import duty has been removed.
Tariffs on coffee are generally low or nonexistent. The EuropeanEconomic Community (EEC) levies an import duty of 7 percent, butcoffee from a number of African, Caribbean, and Pacific countriesenters duty free under the Lome agreement of 1975. Nontariffbarriers are even less comnion, but internal taxes are extremely highin Italy and West Germany. If trade in coffee were further liberal-ized, the effects on export earnings would be small, except for thesuppliers to West Germany (the largest importer of coffee after theUnited States), in which a sharp reduction in retail price (given alsothe relatively high price elasticity of demand) would mean expandedimports. The major share of the gains would go to producers of mildarabica coffees, which are preferred by the West German market.
Quantitative restrictions Dn tea have been removed by virtually alldeveloped countries. There are no import duties on tea into theUnited States and Canada. Tea from African, Caribbean and Placif-ic(ACP) countries enters the EEC duty free. Import duties are high,however, in Japan and mcst developing countries, such as those in
8. Japan is an exception; it accounted for about 9 percent of world teaproduction in 1969-7 1. Japan, h owever, is still a net importer of tea.
9. Wouter Tims, Possible Effects of Trade Liberalization on Trade in PrimanvCommodities, Working Paper no. 193 (Washington, D.C.: World Bank, Januwry1975).

Synthesis and Background 11
the Near East. Duties are also high on imports by many countries oftea extracts, essences, or concentrates. This situation adds to theproblems of developing export-oriented processing industries inproducing countries.
Import duties on cocoa beans and cocoa products have beenconsiderably reduced since the early 1960s, and none remain in mostdeveloped countries. As a result of the Lom& Agreement, cocoabeans and cocoa products originating in the African, Caribbean, andPacific (ACP) signatory countries enter any member state of the EECduty free as of July 1, 1975. Because of the inelastic demand forcocoa and the few tariffs remaining, the scope for increasing theconsumption of cocoa beans and products through further tariffreduction is rather limited. This is not the case, however, withrespect to chocolate products, for which tariffs and other duties stillplay an important role. Trade liberalization could greatly enhancethe manufacture of chocolate in developing countries.
Increasing the value-added component
Possibilities of expanding the value of exports by increasing the valueadded appear to be substantial. Currently, about 17 percent of theexports of cocoa from developing countries is in the form ofintermediate products, compared with about 6 percent in 1960, andthis rising trend is expected to continue. Cocoa-processing industriesgrew rapidly in West African producing countries during the 1960s,and processed products now account for a significant part of thevalue of their cocoa exports. Nevertheless, the growth of processedexports could be even further accelerated.
Coffee is sold in retail markets of developed countries at all stagesof processing, but traditionally roasting and grinding have not beencarried out in exporting countries because roasted beans rapidly losetheir freshness when exposed to air. Demand for soluble coffee hasbeen increasing rapidly over the past two decades, particularly inimporting countries where high per capita coffee consumption is arecent development (for example, the United Kingdom). At present,exports of soluble coffee account for less than 4 percent of coffeeexports from developing countries, principally Brazil. A lowering oftrade barriers will certainly help the developing countries to capturea larger share of this market.
Developing countries are gradually establishing facilities for theprocessing of raw tea into such products as instant tea or tea bags.Instant tea factories, for example, are already found in India, Sri

12 COFFEE, TEA, AND COCOA
Lanka, and Uganda. At present their output is exported mainly tothe United States and the United Kingdom. Potential marketsinclude the EEC countries. Canada, Australia, and the Soviet Union.
International agreements
Because coffee, tea, and cocoa are noncompeting commodities intheir main markets (and thus the maintenance of remunearativeinternational prices is unlikely to encourage substitution or theimposition of high tariffs in importing countries), the possibilities Forstabilizing export earnings through international agreements arerelatively bright. The negctiation and implementation of agreementsdesigned to stabilize earnings through export quotas for primarycommodities facing inelastic demand may confront many difficulties,however, as shown by the history of previous attempts to organizethe coffee, cocoa, and tea markets.
For example, unless controls are imposed, high prices maintainedby the agreement may stimulate excessive production, bringingpressure by member countries against the continued restriction ofexports on which the maintenance of price depends. Conflicts overthe size of market shares can be another obstacle to the negotiationor maintenance of such an agreement. There may also be adverseeffects on the distribution of income within a producing country ifthe volume of exports is successfully restricted: if the internationlalprice rises, well-establishec. producers may benefit at the expense ofthe newly emerging producers, who may be in greater need of anopportunity to increase their incomes. It may also be difficult toensure the cooperation oif consuming countries, particularly if theagreement is to have a price-raising effect. Without their coopera-tion, an export quota system may easily be abused by individualexporters, and the conseqluent depressing effect on prices will bespread over all.
International commodity agreements nevertheless have great po-tential value in stabilizing export earnings, let alone internationalprices. If only for this reason, there is a strong case for redoubledefforts to negotiate such schemes and maintain the machinery evenwhen economic provisions are not in force. There is also the ne,ed, asshown by experience, to keep their operation flexible. The Interna-tional Coffee Agreement of 1968 was based on a system of flexibleexport quotas, which were fixed at the beginning of each crop yearand adjusted whenever t:ne price moved out of a preestablishedrange. The effectiveness of such a system depends in large part on

Synthesis and Background 13
the willingness of participants to abide by its rules. Because theburden of stocks that can result from a limitation of exports has tobe borne by the individual producing country, such a system hasinvariably broken down when backed by producers alone. Moderatesuccess was achieved by the Coffee Agreement when consumersjoined producers to monitor the system, but when they refused toagree to a revision of price ranges to cope with world inflation andexchange rate changes, cooperation broke down.
Negotiations to arrive at a new International Coffee Agreementhave been in progress since 1973. In December 1975 producers andconsumers finally agreed upon the text of a new agreement, tobecome effective October 1, 1976. As in the previous agreement, themechanism of market control is the export quota system. There aretwo points, however, on which the present agreement differs fromits predecessors. First, the distribution of quotas among producingcountries depends not only on past export performance but also onstocks. This provision is intended to guarantee supplies to consumersby giving producers an incentive to accumulate stocks. Second, ifprices rise above certain levels, the quota system will automatically besuspended. This provision is intended to give the agreement moreflexibility and prevent it from breaking down in the face of strongupward pressure on prices.
Efforts to organize the tea market have not yet been fruitful. Atthe initiative of the exporters, who remain divided, the Intergovern-mental Group on Tea of the Food and Agriculture Organization ofthe United Nations (FAO) set up a working party in June 1974 tostudy proposals for an international agreement. Proposals underreview include the establishment of a minimum export price, coordi-nation and regulation of marketing to avert the buildup of stocks inimporting countries, which would have a depressing effect on prices,and increased promotion of world consumption.
The first International Cocoa Agreement between producers andconsumers came into force in June 1973. It provided for annualexport quotas, a buffer stock with capacity to purchase up to 250,000tons, and a fixed price range of 23 to 32 U.S. cents a pound. Theexport quota system and the price have never been applied. Theaverage price of cocoa (New York, spot, Accra)"0 in 1974 was threetimes higher than the agreement's ceiling price, and there were no
10. Ghanian cocoa of specified quality sold at New York for spot, or immediate,delivery.

14 COFFEE, TEA, AND COCOA
accumulated buffer stocks that could be sold, and thus used ats amoderating influence on prices. Many producing countries hadurged that the agreed puice range be revised upward, but tlhis wasnot accepted by the consumers. The agreement will expire at theend of the 1975-76 quota year: the second cocoa agreement,retaining the essential features of the first, has been renegotiated.The stipulated size of the buffer stock remains unchanged but theprice range has been raised to reflect the expected state of themarket.
THE ROLE OF THE WORLD BANK
Since its inception, the A'World Bank has invested in the agriculturalsector in developing countries, originally with an emphasis on majorland development and irrigation schemes and the improvement ofinfrastructure. Direct lending for agricultural and rural developmentprojects began in the mid-1960s. Since then there has been a slowbut steady evolution in Bank policy toward financing the incrementalproduction of primary prDducts.
Until recently, Bank lending policies toward the production ofprimary commodities were guided largely by the demand outlook:that is, the expected capacity of world markets to absorb additicnalsupplies at remunerative prices. Staff studies assessed the imarketoutlook for individual commodities, highlighting products facingencouraging market prospects and those in potential difficulty. Oneof the earliest examples is a 1958 Bank report on "The CoffeeProblem," by Dragoslav Avramovic, which pointed out, among otherthings, that heavy surpluses and sharply declining prices lay aheadfor the world coffee economy. Although no formal policy concern-ing Bank lending for commodities in oversupply was formulated,the effect of the report was to forestall further investment by theBank in coffee, either direct]y or indirectly.
The first formal policy action pertaining to a commodity insurplus supply was taken in 1961. Although the product to which itrelated was sugar, it would have been applicable equally to, otherproducts in a similar state of market. At that time the Bank'sexecutive directors agreed to impose restrictions on lending forsugar, which was then in a state of persistent oversupply." Hence-
11. See Lester B. Pearson and others, Partners in Development, Report of theCommission on International I)evelopment (New York: Praeger, 1969).

Synthesis and Background 15
forth, the Bank was to lend for the expansion of sugar productiononly to net importing countries in which additional output wasjustified by existing domestic demand and in which prices at thefactory compared favorably with those in other sugar importingcountries.
The formulation of a systematic policy toward Bank financing ofprimary commodities has its roots in the recommendations of thePearson Commission Report"2 and in a set of policy guidelinesadopted by the Bank in 1969, following a joint study by the Bankand the International Monetary Fund (IMF) on the stabilization ofprices of primary products.' 3 The executive directors of the Bankdecided, among other things, that "the World Bank Group will seekto intensify its efforts to promote diversification of production on aneconomic basis, giving special consideration to diversification projectswhich help restrain or reduce overproduction of primary products."Subsequently, the Bank entered into consultative arrangements withestablished international commodity bodies to ascertain their viewson the market effect of Bank-financed projects and the advisabilityof proceeding with proposed investments to increase production.The Bank agreed that it would not normally proceed with a projectif the international commodity body concerned advised against it.
In 1973 the Bank adopted a far-reaching policy limiting furtherinvestment to increase production of such primary commodities ascoffee, tea, and cocoa that faced inelastic demand. Thus, as a generalrule the Bank is not prepared to undertake further investments thatwould increase the output of these commodities.
This policy was applied almost immediately in the case of tea. Intea, there was a tendency toward persistent disequilibrium betweenproduction and consumption, reflected in either a chronic accumula-tion of stocks or a chronic underuse of productive capacity. Marketanalysis showed that any further investment in tea would onlycontribute to the chronic oversupply problem, and thus aggragatethe plight of tea exporting countries. Of course, the criterion thatweighs most heavily in any decision concerning the financing ofproduction expansion is the market outlook for the product, includ-ing the prospect for increasing the total export earnings that can bederived from it. It is on this ground that the Bank continues to lend
12. Ibid.13. International Monetary Fund and World Bank, The Problem of Stabilization of
Prices of Primary Products, parts I and II (Washington. D.C., 1969).

16 COFFEE, TEA, AND COCOA
for the expansion of cocoa production in several countries, as isdiscussed below.
For some countries, exDorts of coffee, tea, and cocoa neverthelessoffer the best-and somietimes the sole-opportunity to increaseincome. In such cases, the Bank is prepared to make exceptions tothe rule, after carefully balancing their needs against those of other(often larger and better established) exporters, whose earnings rnaybe threatened by an increase in supply from other sources.
The Bank is also prepared to make exceptions when the long-termmarket prospects for a commodity are favorable or where aninternational agreement is in force. In the latter case, it is preparedto consider financing increased production within global limits ornational quotas set under the agreement, after consultation with thebody in question.
The Bank recognizes that, for countries that are highly dependenton exports of primary commodities facing inelastic demand, devel-opment policies may be more critical to the growth of exportearnings than trade pol..cies, which are the principal concern ofseveral international organizations. This is because developmentpolicies directly affect their capacity to make the structural changesnecessary for the diversification of production and exports. But theextent to which the Bank (and other international organizations) canhope to increase the export opportunities of countries with a strongcomparative advantage in production of coffee, cocoa, or tea byencouraging and financing diversification by other exporting coun-tries which may have lost such an advantage can be answered only asspecific situations arise.
Coffee-producing countries in the main are aware of the clangersof overproduction, and many are limiting production expansion. Asfor the World Bank, it int;ends, as a general rule, to limit lending forincreased output to countries with little opportunity to diversif.y theirsources of export earnings-and then only if the aggregate impacton world production levels, and hence on prices, is likely to beinsignificant. This policy takes account of the likelihood that addi-tional production would tend to lower international coffe prices, andthat resultant losses would not be compensated by a long-term rise indemand.
So far the Bank has financed only three projects to increase coffeeoutput: a rehabilitation program for Burundi in 1968 and twocombination cocoa and coffee projects, one in Togo in 1974 and onein Liberia in 1975. The secretariat of the International CoiffeeOrganization (ICO) was consulted on these projects. It supported the

Synthesis and Background 17
first on the ground that coffee production in Burundi had sufferedas a result of natural disaster and internal political difficulties. Itraised no objection to the other two projects because it was felt thatthe increments to world production would not be out of proportionto the anticipated rate of growth of demand for coffee.
In principle, the Bank is prepared to finance coffee rehabilitationprojects involving no increase in output. Such projects would includea reduction in coffee hectarage to offset productivity gains andprovide for diversification of released areas to other crops. TheBank is also willing to consider financing projects to improve qualityor to increase the value-added element of coffee exports: forexample, the development of coffee processing. A loan was made toEthiopia in 1972 for washing coffee and improving quality.
In 1970-73 the Bank committed about $22 million for develop-ment in cocoa projects or projects with cocoa components in fiveproducing countries: Ghana, Indonesia, the Ivory Coast, Malaysia,and Nigeria. So far, of course, the output from these projects isnegligible, but by 1980 it will be about 50,000 metric tons, and willincrease to more than 55,000 metric tons by 1985. These quantitieswill amount to about 2.8 percent of expected world production in1980 and 2.6 percent in 1985.14
In 1974-75 six additional cocoa undertakings were approved inCameroon, Ecuador, Ghana, Liberia, Nigeria, and Togo. The Bank'scommitment to these cocoa projects was about $67 million. Tenta-tively, it is estimated that by 1980 these projects will produce about27,000 metric tons, increasing to 83,000 metric tons or more by1985. These figures represent about 1.5 and 3.9 percent of esti-mated world production in 1980 and 1985, respectively. From allBank projects, the Bank's share in world cocoa production in 1980and 1985 would be on the order of more than 4.2 and 6.5 percent,respectively.
A significant proportion of the Bank projects involves rehabilita-tion and replanting in dilapidated cocoa areas. By 1985 more than40 percent of the combined output of projects under considerationwill be the result of rehabilitation and replanting. The projectedcontribution of Bank-financed cocoa projects to world supply hasbeen included in the mo-.e detailed forecasts presented later in thisbook.
Further investments to increase tea production in exportingcountries with small market shares might yield high returns in the
14. For statistics on World Bank lending for cocoa and tea, see appendix C.

18 COFFEE, TEA, AND COCOA
short run, but over the long term any significant increase inproduction capacity can have major ill effects on all tea exporters.Thus, as already explained, the Bank does not in general intend tofinance increased production of tea unless the market outlookimproves considerably. It is prepared, however, to make exceptionsin countries with no other opportunities for productive investment.It will also consider rehabilitation schemes to raise productivity,along with provisions for diversification out of tea and projects toincrease the value-added element of tea exports (such as thedomestic manufacture of tea bags and instant tea).
The impact of past Bar[k tea investments on the volume of worldsupply has been substantial. In 1964-73 the Bank financed eightprojects involving tea planiting, including some financed as part ofother activities such as agricultural credit schemes. Because teabushes mature slowly, output from these projects will build up onlygradually during the 1970s. By 1980 it is expected to reach about53,000 metric tons and by 1985, about 69,000 metric tons, or aboutthree percent of projectecl world output in 1980-85. Assuming that90 percent of the incremental output from the projects is exported,this would account for about 6 percent of projected total worldexports in 1980.
In certain countries thc share of tea output contributed by Bankprojects will be much greater than the 3 percent mentioned above.By 1980, Bank tea investments will have contributed roughly 22percent toward total output in Indonesia, 28 percent in Kenya, 34percent in Mauritius, 46 percent in Tanzania, and 10 percent inUganda.
The current policy reflects the interdependence of countries withrespect to their developrrent policies. It implies recognition on thepart of the Bank that, in is lending operations, it has a responsibilitythat goes beyond the interests of the individual borrowing country.
SUMMARY OF PROSPECT',: PRINCIPAL FINDINGS AND CONCLUSIONS
As regards broad policies affecting the financing of commloditiesfacing inelastic demand (as discussed above), Bank decisions tofinance suitable projects will probably continue to be guided by themarket outlook for the reiulting output. Market considerations haveweighed heavily in past lending decisions and undoubtedly willcontinue to do so. Therefore, these prospects are reviewed inchapters 2 (for coffee), 3 (for tea), and 4 (for cocoa). The analyticalframework and the methodology followed are different in each case,as conditions vary. The main findings of these chapters are included

Synthesis and Background 19
in the summary review below-with the caution that the forecastingof commodity prices is a continuing activity in the Bank, and paperson market outlook are updated periodically.
Coffee
In 1950-75 world coffee production grew at the rate of just under 3percent a year, but the growth was rather uneven. Few newplantings had taken place during the war years, when exports toEurope fell and prices were depressed. Following the postwarrecovery in demand, the sharp rise in prices attracted large-scaleinvestment into new plantings. For the I950s as a whole, productionexpanded by about 75 percent; ensuing surpluses were enormous,and by 1960 oversupply had become a critical problem, and pricesfell steeply. Production actually declined during the 1960s, althoughprincipally the result of the diversification policies pursued by Brazil.New plantings elsewhere remained generally at a standstill, underthe surveillence exercised by the International Coffee Agreement.Expansion during the 1970s has so far been restrained and outputsomewhat irregular.
The growth in world exports, although it matched productionover this quarter of a century, has been more orderly. The gapbetween these two growth patterns was bridged by stocks held in theproducing countries, principally in Brazil. Coffee stocks rose contin-uously until 1966. Since then, as production continuously fell belowconsumption, stocks were steadily drawn down, to immediate pipe-line requirements. Prices began to react slowly at, first and thensharply following the major frost damage of 1975 in Brazil.
In recent years the rate of growth in world consumption has beenslowing down. The income elasticity of demand has been decliningin the traditional markets, as coffee consumption has become subjectto definite saturation levels. In the United States per capita con-sumption has been declining since 1962 in spite of increasedincomes. Growth is slowing down also in Western Europe, thoughthe United Kingdom, where coffee threatens the position of tea as anational drink, is a notable exception. Consumption in Japan hasbeen rising sharply, and it could rise rapidly in the Soviet Union andEastern Europe if more foreign exchange were made available bythe authorities for coffee imports.
The future behavior of coffee production, consumption, stocks,and prices has been simulated from 1949 onwards through theeconometric model described in Appendix A, which yields forecastsup to 1985. The variables used to estimate supply by regions include
20 COFFEE, TEA, AND COCOA
past production, lagged real prices, the biennial production cycle forarabicas, and, for Brazil, ratio of stock changes to output, plantingprograms, and effects of fi-osts. Demand is projected as a function ofprices and income. The equations are specified in such a way as toyield price elasticities of demand that increase in t]he case ofexporting countries and the United States, and to yield incomeelasticities of demand that decrease with increasing incomes in theimporting countries. The price equation includes as its main variablethe supply-and-demand balance, the one-year lagged price, ancl avariable to capture the effect of inflation on real prices. Projectionsare made on different assumptions concerning the three exogenousvariables (as given or developed externally) in the model: incomes,inflation, and frosts.
The results indicate that although prices may recede somewhatfrom their present high levels in the near future, they are expectedto remain relatively high through 1978-79, after which they maydecline rapidly and reach low levels in the mid-1980s. The expecteddevelopment of production and stocks mirrors the expected devel-opment of prices: low production and stocks through 1978-79 a:ndrapidly increasing production and stocks thereafter, reaching a highin the mid-1980s. The growth in world demand, although somrewhatslower at first, will average 2 percent a year in 1975-85.
Tea
Most of the world output and exports of tea are accounted for by afew countries in South Asia and East Africa. In 1955-73 growth ofworld production averaged about 3.3 percent a year, ranging from alow of 1.3 percent a year for Sri Lanka to a high of nearly 10 percentfor East Africa (which had begun from a low base). During the sameperiod, the volume of world exports grew rather slowly, averagingless than 2 percent a year. A continuous state of surplus and ofdifficulty in storing tea for long periods of time led to a steadydecline in tea prices. The unit value of world exports fell from 45pence a kilogram to 36 pence over the period. The decline in realprices was even steeper.
In 1973 the developed countries accounted for about three-fifhisof world tea imports; the United Kingdom was the largest singlemarket, followed by the United States. The imports of these coun-tries grew at a dwindling r ate, averaging barely 0.5 percent a year in1955-73. In the United Kingdom absolute as well as per capitaconsumption fell, and dermand in the developed countries was not

Synthesis and Background 21
highly responsive to changes in either price or income. In thedeveloping countries, however, consumption as well as their importsexpanded rapidly, averaging 5.4 percent and 4.6 percent a year,respectively.
The methodology used in this study to forecast supply, demand,and prices is eclectic, comprising techniques and information se-lected from various sources. On the supply side, past trends inhectarage and yields were adjusted to take account of countryproduction targets and the likelihood of their achievement. Thedemand was estimated on the basis of existing per capita consump-tion and the effects of tastes and income changes, using availableinformation on price and income elasticities of demand.
The results indicate that expansion in world production of teaduring 1973-85 will slow down slightly, to 3 percent a year. Importdemand of the developed countries will remain sluggish, expandingat less than 1 percent a year. But, the import demand of thedeveloping countries-and consumption in the exporting countriesthemselves-will remain buoyant, as a result of which the overall rateof growth in world imports will rise from 2 percent a year in 1955-73 to nearly 3 percent in 1973-85 because the developing countries,with their faster growth, will acquire a larger share of the total tradein tea. By 1985 the volume of imports of the developing countrieswill nearly match that of the developed countries. Total worldconsumption of tea will by then be shared by the developed,developing, and centrally planned countries in a 25:50:25 ratio. Thereal price of tea will continue to decline, but the fall will not be assteep as in the past.
Given the price elasticity of demand, a drop in the total volume oftea exports would improve its aggregate export earnings. A neces-sary condition for bringing this about is a market-sharing arrange-ment among the exporting countries. An important obstacle tonegotiating such an arrangement has been the divergence of viewsbetween the large, long-established producers and exporters and thecountries that have more recently become exporters. The former donot wish to recluce their export volumes, whereas the latter continueto add to the available in amounts larger than the market canhandle. Given the price elasticities of demand facing individualcountries, half of any increase in export volume of India or SriLanka would be offset by an associated price decline; for othercountries, the offset would be less than 10 percent. Therefore, itwould be of advantage to India and Sri Lanka to relinquishsystematically a share of the market to smaller exporters-provided,

22 COFFEE, TEA, AND COCOA
of course, the latter so restrain their expansion that total volume ofworld exports is consistent with the price objective.
Cocoa
Cocoa is exported almost entirely to the developed and the centrallyplanned countries; the latter's share of the market averaged about 14percent in 1970-75. Cocoa is exported chiefly in the form of beans,although exports of processed products have been gradually risinlg,amounting to 17 percent (in bean equivalent) of exports in 1973.Cocoa stocks are held almost entirely in importing countries.
The volume of exports expanded at 2.3 percent a year during the1950s, but there was little gain in the value of exports, since pricesweakened. The volume and value grew at 3.6 and 3.3 percent a year,respectively, during the 1960s, although prices remained weak in thefirst half of the 1960s and reached their lowest level in 1965, theyimproved considerably in the second half of the decade. Growth inthe value of exports in the 1970s has so far been a remarkable 8percent a year, with volume actually contracting as a consequence ofshort supplies-illustrating how value and price move in the sa:medirection while volume and value move in the opposite.
World consumption of cocoa grew at 4.1 percent a year during1955-73. Expansion was slower in the late 1960s and early 1970s asproduction fell following the very low price of 1960-65. In 1973--76there was an actual decline in consumption because of scarcity ofsupplies and relatively high.i prices.
The export outlook fDr cocoa is examined here within theframework of a market-clearing model. Production in the principalcountries was forecast on the basis of expert knowledge of cocoapolicies and of plans being executed in those countries. For minorproducers, FAO projections for 1980 were used and extrapolated to1985. The results showed that world production will tend to rise atabout 2.6 percent a year iri the 1970s and 3 percent in 1980-85, butcould be higher if cocoa-producing countries compete excessively inexpanding their output. Demand forecasts were made using theFAO model, which works under a variety of price assumptions anduses real income and real price among the variables. Equilibratingsupply and demand, the rnodel yields a real price (in 1973 constantterms) of 43 U.S. cents a pound in 1980. The forecast was tested withan alternative model; the results proved to be identical. At theseprices, consumption is forecast to expand at about 3 percent a yearin 1976-85.

Synthesis and Background 23
In connection with the financing of additional output of acommodity, a variety of issues arise concerning the selection ofprojects. One of these issues pertains to the comparative advantagein the production of a product enjoyed by one country as comparedwith another. In order to examine this problem, an experimentalempirical study on cocoa was undertaken by the World Bank staff.Various methods, including the Domestic Resource cost approach,were examined-as summarized in appendix B. The results con-cerning the relative comparative advantage of countries were incon-clusive and not of direct operational significance.

2
THE WO RLD COFFEE MARKETr
COFFEE IS A TREE CROP. The first harvest comes in aboutthree to four years after planting, and it takes two more years beforethe tree reaches its normal yield. Yields normally start to declineabout fifteen years after planting, but under good management thedrop in production is not rapid, and the tree can have an economiclife of up to fifty years. In rnost countries, however, the managementof coffee holdings is poor and trees have to be replaced after twentyto thirty years.
There are two main types of coffee: arabicas and robustas.Robustas can be grown in hot and humid climates. Arabicas requirelower temperatures and are therefore grown either at higheraltitudes or farther from the equator than robustas. Coffee is heavilydamaged, however, when temperatures fall below freezing, and thiislimits the area where it can be grown. There are also two other typesof coffee, liberica and excelsa, both of which are grown in WesternAfrica, but they account fcr less than half of one percent of worldproduction and exports.
Arabica coffees are divided into washed, or mild, arabicas andunwashed arabicas. If the coffee cherry is dried and then depulpedto free the coffee beans, the coffee is classified as unwashed. I[f thecherries are depulped immediately and the beans then placed inwater to facilitate later rermoval of the mucilage, the coffee is calledwashed. The washed, or mild, coffees are further divided into"Colombian milds" and "other milds," but this distinction is of littlerelevance from a technical point of view.' There are no comparableclassifications among the rcbustas.
1. Until 1966 under the International Coffee Agreement, only nmild arabicas,unwashed arabicas, and robustas were distinguished.
24

The World Coffee Market 25
Arabica coffees are generally preferred by consumers. They havea milder flavor and contain less caffeine than robustas. The tree ismore susceptible to diseases, however, and gives lower yields. Ara-bica coffee also gives a lower yield of instant coffee per pound ofbeans. The steady increase in the consumption of instant relative toregular coffee, therefore, has improved the position of robustas inthe world market and may explain in part the decline of the pricepremium of arabicas over the past decade.
The share of robusta coffee in total world production has in-creased steadily, from slightly more than 10 percent shortly afterWorld War II to more than 30 percent, and the share of arabicas hasbeen correspondingly reduced. Initially, the expansion of robustacoffee production was accompanied by low prices: until the mid-1960s New York spot prices of robusta coffees were from 20 to 40percent below those of coffees in the "other mild" group.2 Since thenthis gap has narrowed considerably, to the extent that in 1975 thespot prices of robustas at times exceeded those of the other milds.This development has been caused both by the increased consump-tion of instant coffee and by the growing tendency of coffee roastersto sell on the basis of brand names, with no indication of the type ofcoffee used in the blend.3 The latter practice enables the roaster tochange the coffee mix used in his blend in response to changes inthe relative prices of the various types and has thus greatly increasedthe cross-price elasticity between the different types of coffee.
The ease with which coffee can be stored is evident from thehistory of the world market: large stocks have been a fairly persistentfeature, especially in the 1960s, and in 1966 total producer stocksreached a peak of almost 90 million bags, equal to nearly two yearsof world import demand. In general, coffee can be stored for two tothree years with only a marginal deterioration in quality. Only in hotand humid climates are air-conditioned warehouses required forstorage. Storage for five years or more has been practiced, notably inBrazil, but coffee held for such long periods has always beendiverted to the domestic market, with the more recent growths beingused for exports.
The technical aspects of the conversion of coffee beans into coffeeas a beverage are fairly simple: the green beans are roasted, ground,
2. Spot prices are for immediate delivery from the warehouse in the marketindicated, in this case New York.
3. This practice is especially prominent in the United States. In Europe there isstill a definite premium for higher-quality coffees.
26 COFFEE, TEA, AND COCOA
and the soluble parts are then extracted with hot water. The resultcan either be consumed directly or it can be resolidified by evapora-ting or freezing the water, yielding soluble coffee.
Soluble coffee was first sold in the United States in 1951 and hasbeen consumed in increasing quantities ever since. Its share in themarket, which depends to a large extent on local tastes and habits, isabout 17 percent in the United States and 80 percent in the UnitedKingdom, but only about 5 percent in the Scandinavian countries.The share of soluble coffee in the retail market tends to be largest incountries where the popularity of coffee as a beverage is only arecent phenomenon.
The existence of soluble coffee causes statistical problems on boththe consumption and the production side. As a general rule, onepound of soluble coffee is taken to be the equivalent of three poundsof green coffee beans. From the point of view of consumption, thisratio is too low: one pound of soluble coffee yields up to 50 percentmore cups of coffee than can be extracted by the consumer from theequivalent amount of roasted coffee beans.4 This means thiat,although the rise of solub:le coffee may have increased the numberof cups of coffee consumed, it has not necessarily increased theconsumption of coffee beans. From the point of view of productionthe ratio of three to one is too high: many manufacturers of solulblecoffee manage to use only 2.5 pounds of green beans in making onepound of soluble coffee.5
Coffee is traded and soll to consumers in all stages of processing:as green beans, roasted coffee, ground coffee, and soluble coffee.Roasted and ground coffee, however, are not generally exported bydeveloping countries. All ;rade and consumption statistics are con-verted into "green bean equivalents" according to ratios establishedby the International Coffee Organization. One pound of roasted orground coffee is equivalent to 1.19 pounds of green beans, and onepound of soluble coffee is equivalent to three pounds of greenbeans. Slightly different conversion ratios are used for U.S. con-sumption statistics.
4. One pound of roasted coffee is equivalent to 1.19 pounds of green coffee.Therefore, one pound of soluble is equivalent to 2.52 pounds of roasted cof fee.
5. The amount of coffee used can be estimated by dividing the amount ofcaffeine found in the soluble co:Tfee by the amount of caffeine per pound of greenbeans, since all caffeine contained is removed.

The World Coffee Market 27
PRODUCTION AND EXPORTS
Although coffee is indigenous to Africa and reached Latin Americaonly by way of Asia, Latin America has been the dominant coffeeproducer for the last 100 years. Its share slowly declined during thefirst half of this century, but around 1950 it still accounted for 85percent of world production. Since then its share has been decliningmore rapidly. Latin America now accounts for 60 percent of worldproduction, Africa for 30 percent, and Asia and Oceania for theremaining 10 percent (see table 2).
Most coffees grown in both South and North America arearabicas; only Trinidad and Tobago produce exclusively robustacoffee. Robusta is also grown in the valleys of the state of EspiritoSanto in Brazil, but its production is still insignificant. Africaproduces both robustas and arabicas, but robustas account for by farthe larger share, about 70 percent. Arabicas are grown in Kenya,Ethiopia, Rwanda, and Burundi. Several African countries growboth types of coffee, but only Tanzania produces more arabicas thanrobustas. In Asia and Oceania as well, more robustas than arabicasare produced. Indonesia, the area's largest producer, grows almostexclusively robusta coffee. The production of arabicas is concen-trated in India and Papua New Guinea, which also produce robustacoffees.
In the distribution of world coffee production by countries (seetable 2), Brazil clearly dominates the scene. The importance of Brazilin this respect is illustrated by the fact that, in some of the yearsbefore World War II, a single Brazilian state, Sao Paulo, producedup to 90 percent of world coffee requirements. After the war Brazil'sshare in total world production has declined markedly; the countryas a whole now accounts for less than 30 percent of world produc-tion. Brazil is followed by Colombia, with a little more than 10percent of world production, and then by a long list of smallerproducers, among the largest of which are Angola and the IvoryCoast, each with a share of from 5 to 6 percent.
Most producing countries export virtually all of the coffee theygrow. A few, however, such as Brazil, India, and Mexico, consume asubstantial share of their own production, and all Philippine coffee isconsumed domestically. Thus, there is some divergence betweencountry shares in total production and in exportable production, thelatter being defined as total production minus domestic consump-tion. For example, the share of Brazil in exportable production over

Table 2. Type of Coffee Grown, Share in World Production, Growth Rate, and Share of Coffeein Export Earnings: Coffee-Producing Countries
Production" and shares Share ofAnnual coffee in
1948-52 1958-62 1968-72 growth ratec export
1947-48 to receipts"Thoufabds Thousands 7housands 1972-73 1970-72
Producing country Type of co]jeea of bags Percent of bags Percent of bags Percent (percent) (percent)
World total 38,591 100.0 70,370 100.0 65,454 100.0 2.87 4.95
Arabicas0 .33,696 87.3 56,860 80.8 45,801 70.0 1.7 9.9NO Robustas0 4,895 12.7 13,510 19.2 19,653 30.0 7.2 2.100
South America 26,139 67.7 44,237 62.9 28,309 43.3 0.8 11.7Brazil Unwashed arabica 19,486 50.5 34,250 48.7 17,275 26.4 -0.0 27.7Colombia Colombian mild arabica 5,593 14.5 7,783 11.1 7,904 12.1 1.6 58.8Ecuador Other mild arabica 299 0.8 735 1.0 1,048 1.6 6.4 8.5Peru Other mild arabica 102 0.3 568 0.8 980 1.5 11.7 4.4Venezuela Other mild arabica 625 1.6 829 1.2 926 1.4 1.2 0.4
North and Central 6,262 16.2 9,501 13.5 12,101 18.5 3.3 7.2America and Caribbean
Costa Rica Other mild arabica 368 1.0 1,062 1.5 1,320 2.0 6.2 28.9Dominican Republic Other mild arabica 387 1.0 546 0.8 677 1.0 2.7 8.5El Salvador Other mild arabica 1,216 3.2 1,613 2.3 2,332 3.6 3.3 16.8Guatemala Other mild arabica 1,103 2.9 1,600 2.3 1,908 2.9 3.0 33.7Haiti Other mild arabica 614 1.6 572 0.8 529 0.8 -0.9 43.2Honiduras Other mild arabica 174 0.4 332 ().5 605 0.9 6.4 14.7

Mexico Other mild arabica 1,158 3.0 2,117 3.0 3,231 4.9 5.4 4.9Nicaragua Other mild arabica 336 0.9 436 0.6 625 1.0 3.4 15.5
Western Hemispheretotal 32,401 84.0 53,738 76.4 40,410 61.7 1.4 10.2
Ajiica 4,732 12.3 13,140 18.7 19,758 30.2 7.2 6.1Angola Robusta 749 1.9 2,382 3.4 3,346 5.1 7.8 31.4Ethiopia Unwashed arabica 968 2.5 2,977 4.2 4,676 7.1 6.2 29.5Ivory Coast, Togo, Robusta 521 1.3 1,258 1.8 2,100 3.2 6.8 53.3
and Guinca'Kenya Colombian mild arabica 175 0.5 513 0.7 974 1.5 8.5 26.6Madagascar Robusta 547 1.4 873 1.2 1,040 1.6 3.1 26.3Tanzania Colombian nlild arabica 258 0.7 443 0.6 855 1.3 6.1 16.1Uganda Robusta 609 1.6 1,982 2.8 3,065 4.7 8.2 58.8Za'ire Robusta 536 1.4 1,089 1.5 1,248 1.9 3.4 5.8
Asia 1,459 3.8 3,491 5.0 5,285 8.1 7.0 .5India Other mild arabica 341 0.9 908 1.3 1,462 2.2 7.0 1.9Indonesia Robusta 822 2.1 1,730 2.5 2,288 3.5 6.5 5.2
a. Classifications of the International Coffee Organization.b. Weighted averatge over five years with wveights of 1, 3, 4, 3, 1 respectively.c. Determined by regressing the logarithm of production on time.d. Developing countries only.e. Arabica producers are those in Latin America plus Keniya, Tanzania, Ethiopia, and India. Some minor producers are excluded because of the unavailability oif
data. Robusta producers are taken to be all other countries.f. More than 90 percent of production in the Ivory Coast.Sources: Production data, U.S. Department of Agriculture; shares of coffee itl export receipts, World Bank data.

30 COFFEE, TEA, AND COCOA
the last few years was only 20 percent, as compared with a share intotal production of slightily less than 30 percent. Mexico, which isfirst among Central American countries as a coffee producer, ranksthird as an exporter.
If coffee could not be stored for relatively long periods, acountry's share in world cxportable production would give a directclue to its share in the wsrld export market. When stocks can beaccumulated or drawn down, however, a country's exports candeviate markedly from its exportable production. This has beenparticularly relevant in the case of Brazil. In the early 1960s Braziltried to stem the downward pressure on prices by storing part of itsexportable production, and in the years after 1966, when itsproduction had fallen drastically, it drew upon these stocks to keepits exports from declining. Thus, up to 1973, Brazil was able tomaintain a 30 percent share in the world export market despite itsmuch smaller share in world exportable production. The shares ofmost other countries roughly correspond to their shares in totalproduction.
World production has grown at an average rate of 3 percent ayear in the postwar period, but the rate of growth has been uneven.Until the mid-1950s, except for the recovery that naturally followedthe low level of production during World War II, there was hardlyany growth in coffee production. Demand recovered more rapidly inthis period, however, and a shortage of coffee was the unavoidableconsequence. Prices increased to record highs in 1954, with one lotof Colombian coffee selling at an all-time high of $1 a pound. Thissituation triggered an expansion of coffee production around theglobe. Output increased from about 40 million bags in 1950-54 toabout 70 million bags at the end of the decade. The ensuing surpluswas enormous; it depressed the growth of production to such anextent that the 1959-60 harvest of 79 million bags has since beenexceeded only once.6
The decline in production during the 1960s was due exclusively toBrazilian coffee policy. From 1962 to 1967, out of a total stock of 4.1thousand million coffee trees in 1962, an estimated 1.7 thousarndmillion were eradicated, most of them (about 1.4 thousand million)in response to government subsidies.
6. In 1965-66, when the Brazilian crop recovered sharply after frost damagedthe crop of the preceeding year, and world production reached an all-time high of82 million bags. The next largest crop in the period after 1959-60 was in 1974-75:about 78 million bags.
The World Coffee Market 31
Table 3. Price Elasticities of Coffee Supply, by Region
Elasticity of supply with respect to pice'
Short term Long termh' Long termb
Region or country (lag ] year) (lag 7 years) (full adaptation)
Brazil 0.20 0.44 0.66Colombia 0.03 0.18 0.40Other South America 0.06 0.46 10.70North and Central America
and Caribbean 0.03 0.14 0.77Africa 0.12 0.44 1.87Asia 0.10 0.43 3.01
a. For the derivation of these elasticities, see Jos de Vries, "Structur-e and Prospects of theWorld Coffee Economy," Staff Working Paper 208 (Washington, D.C.: World Bank, 1975).Figures in the three columns give the percentage increase or decrease in production resultingfrom a I percent increase or decrease in price after one year, seven years, and a theoreticallyinfinite number of years respectively. Dunng these periods of time, the price is assumed toremain at its increased level.
b. References in the text to long-term elasticities are exclusively to those shown in thesecond column. The values in the third column are derived by dividing those in the secondcolumn by the complement of the coefficient of lagged production. Although it is these valuesthat are normally regarded as the true long-term elasticities, they are of no relevance in thiscontext because the lags involved are much too long. Their size, insofar as it is determined bvthe complement of the coeffident of lagged production, indicates only the extent to whichthere has been a noticeable slowdown in the propensity of coffee production to grow inresponse to a given price level. Not surprisingly, this slowdown is strongest in countries thatalready have large areas under coffee and therefore face increasing marginal costs ofproduction in the expansion process.
The reactions of coffee producers to price developments arereflected in the price elasticities of supply (which are given in table 7)for the six major coffee-producing regions). The pattern of theseelasticities can be explained by two factors: the importance of coffeewithin total agriculture and the type of coffee holdings.
In a country where agriculture is devoted largely to coffeecultivation, both the short-term and the long-term elasticity of supplytend to be low.7 In the short term, coffee is not likely to be neglectedbecause of low prices, since both individual farmers and the countryas a whole depend heavily on the product and alternative sources of
7. The response lags assumed are one and seven years, respectively. It shouldalso be noted here that the share of coffee in total export earnings is not always agood indicator of the share in total agricultural production, especially in countrieswhere the foreign trade sector is relatively small.

32 COFFEE, TEA, AND COCOA
income are few. In the long run, since a large portion of agriculturalland is already occupied by coffee, the possibilities for expansion arerelatively limited.
Exactly the opposite holds for countries where coffee is anagricultural product of only minor importance. In a time of lowprices the government will tend to neglect the coffee sector, and thefarmer will turn his attention to the other products he Cultivates.When prices subsequently increase, farmers will begin to devoteconsiderably more time to their coffee holdings, and at the sametime they may start to substitute coffee for other crops. And thegovernment in these circumstances will not feel inhibited fromstimulating the expansion of production, as it might by the disadvan-tages of a growing monoculture.
The second factor in determining the price elasticities of supply isthe type of holding. The estate sector generally shows a higher short-term elasticity of supply than the smallholder sector. In a time of lcowprices, the smallholder might neglect his coffee plantings to someextent, but he will almost always pick at least a part of the crop. Anestate holder, however, can well decide to stop attending to his estatealtogether. He has alternative uses for his funds, whereas thesmallholder may have no alternative uses for his labor. As to thelong-term elasticity of supply, estate holders in general have astronger financial position than smallholders and thus can moreeasily respond to low prices, by diversifying out of coffee.
As regards the long-term response to high prices, however, thereis no reason to assume any significant differences on the basis of thetype of holding alone. Only when a country has ample virgin landsavailable will an estate economy be able to expand at a faster ratethan smallholdings, becausc large investments are needed to developnew lands for agricultural production. This explains why Brazil, acountry that was highly dependent on coffee until a short time ago,could show such an enormnous expansion in production after theprice boom of the mid-1950s.
The actual pattern of elasticities clearly reflects the operation ofthese factors. Colombia and Central America depend heavily oncoffee, and production comes mostly from smallholders. Therefore,these regions show the lowest price elasticities of supply. In Brazil,which until recently also (lepended heavily on coffee, productioncomes mostly from large estates, and consequently the price elastici-ties of supply are much higher. In all three traditional coffee-producing areas, however, Lhe rate of production increase at a given

The World Coffee Market 33
price level falls rapidly over time.8 The other three coffee-producingregions show relatively high elasticities of supply, and at a given pricelevel their rates of production growth decelerate only slowly, reflect-ing the fact that there is still ample scope for expanding production.
Whereas the growth in production has been far from even since1945, the growth of exports has been much more regular.9 The gapbetween these two growth patterns was bridged by stock develop-ments: until 1966 huge stocks accumulated in the producing coun-tries, which were subsequently drawn down when production beganto drop below consumption.
Because of the fairly regular growth of world export volume, thecourse of world export value clearly reflects the movement of exportunit values: it reached a high in the mid-1950s, declined rapidlytoward the early 1960s, and has grown since at a somewhat irregularpace, on the average more or less reflecting the growth in exportvolume.
As pointed out in Chapter 1, coffee is second only to crude oil asan earner of foreign exchange for developing countries. Accordingto 1970-72 data, eighteen countries depend on coffee for more than25 percent of their foreign exchange earnings: They are listed intable 4. Of the six countries that depend for more than half of theirexport earnings on coffee, five have a per capita GNP of less than$200. Colombia, which has by far the highest income level in thisgroup, is the only one of these countries that has been able todecrease its dependence on coffee since 1960. Although theseobservations are not conclusive, they at least do not contradict thenotion that high dependence on a commodity that faces only slowgrowth in demand is not conducive to vigorous economic develop-ment and that, at the same time, a low level of economic develop-ment may render attempts to diversify out of such a commodityrather difficult.
Although the share of soluble coffee in total coffee consumptionhas been increasing continuously over the last two decades, mostexports from developing countries are still in the form of greenbeans. Only Brazil has built up a sizable soluble coffee industry,almost wholly geared to the export market. It is now exporting
8. See table 3, note b.9. Exports have grown fractionally less than total production, since the rate of
growth of domestic consumption in producing countries has exceeded the rate ofgrowth of consumption in importing countries.

34 COFFEE, TEA, AND COCOA
Table 4. Share of Coffee in Foreign Exchange Receipts and GNP Figuresfor Countries Highly Dependent on Coffee Production
Skare of coffee inforeign Annual GAPexchange receipts per capita
growth rate1960 1970-72 GNP per 1960-72
Countrya (percent) (percent) capita, 1972 (percent)
Portuguese Timor 81.0 90.5 120 1.1Burundi n.a. 73.0 70 1.1Uganda 39.6 58.8 150 2.2Colombia 71.4 58.8 400 1.8Rwanda n.a. 57.3 60 -0.4
Ethiopia 52.0 53.3 80 2.6Haiti 52.4 43.2 130 0.3El Salvador 65.5 42.0 340 2.2Yemen, Arab Republic of n.a. 35.0 90 2.0Guatemala 63.7 33.7 420 2.2
Ivory Coast 50.2 32.7 340 4.2Angola 35.4 31.4 390 4.1Costa Rica . 51.1 28.9 630 3.1Brazil 56.2 27.7 530 3.2Equitorial Guinea 29.7 27.6 240 0.0
Kenya 25.7 26.6 170 3.6Madagascar 31.4 26.3 140 0.4Cameroon 19.2 25.1 200 4.0
n.a. Not available.a. In descending order of dependenice in 1970-72.Source: World Bank data.
solubles at the rate of 2 million bags a year (green bean equivalent).Other coffee producers expDrt only minor quantities of solubles, andthe total share of solubles in coffee exports does not exceed 4percent. There is a good potential for further growth in the share ofsolubles in total exports, but its realization will depend primarily onthe trade policies of the importing countries.
IMPORTS AND CONSUMPTION
Imports by the major importing countries, both absolute and percapita, are given in table 5. The United States is still by far the largest

The World Coffee Market 35
importer, although its share in world imports declined from 63percent in the early 1950s to less than 40 percent in 1975. It isfollowed by the Federal Republic of Germany (10 percent), Franceand Scandinavia (7 to 8 percent each), and the Benelux countriesand Italy (5 to 6 percent each). The share of Western Europe as awhole is 46 percent; thus, the United States and Western Europetogether account for nearly 85 percent of world coffee imports. Theremainder consists mainly of imports into Eastern Europe (5 per-cent) and Japan (3 percent).
The picture of total world consumption differs somewhat fromthat of total imports, because some coffee-producing countries arethemselves large consumers. Whereas world consumption of im-ported coffee amounts to nearly 60 million bags, another 20 millionbags are consumed in the producing countries. Of these, Brazilconsumes nearly half; in total consumption, it ranks second only tothe United States.
In per capita consumption, the Scandinavian countries occupy firstplace with about 26 pounds per capita, followed by the Beneluxcountries, with about 18 pounds. Consumption per capita in theUnited States is about 13 pounds, while Brazil, the Federal Republicof Germany, and France consume about 11 pounds per capita.
The prospects for consumption in the various regions are quitedifferent. In the United States per capita consumption has beendeclining since 1962, and there are no indications that this trend willsoon be reversed. In most Western European countries the growthof coffee consumption is slowing down as saturation levels areapproached. On the other hand, the rise of coffee consumption inJapan seems to have just begun; in recent years consumption therehas grown by as much as 20 percent a year. Consumption is alsogrowing vigorously in the United Kingdom, threatening the positionof tea as the national beverage. Consumption in Eastern Europe,now averaging one pound per capita, might be expanded enor-mously if more foreign exchange were made available by theauthorities for coffee imports. Coffee is already firmly established asthe national beverage in such producing countries as Brazil andColombia. In Asia, however, especially in some of the more popu-lous producing countries, any increase in average consumptionwould have a significant impact on total demand.
For purposes of consumption analysis, the world has been dividedinto three regions: the producing (net exporting) countries, theUnited States, and other importing countries. The estimated priceand income elasticities of demand are given in table 6. In the

Table 5. Average Imports of Coffee, Total and per Capita, Major Importing Countries, 1950-53 and 1970-73
Average annual imports
Per capita importsa
1950-53 1970-73 (pounds)
Thousands Percent Thousands Percent
Count7y of bags of total of bags of total 1950-53 1970-73
Canada 712 2.2 1,320 2.4 10.3 8.0
United States 20,034 62.8 20,986 37.6 16.8 13.3
Latin America 686 2.2 814 1.5 n.a. n.a.
Benelux countries 1.276 4n 3,20! .7 8.7 18°.1
France 2,657 8.3 4,251 7.6 8.3 10.9
G Germany, Federal Republic of' 843 2.6 5,478 9.8 2.2 11.7
Italy 976 3.1 3,V06 5.4 2.7 7.3
Scandinavia 1,667 5.2 4,253 7.6 11.7 25.9
United Kingdom 656 2.1 1,770 3.2 1.7 4.2
Other Western Europe 996 3.1 3,962 7.1 1.7 5.7
Total Western Europe 9,071 28.4 25,921 46.4 3.9 8.6
Eastern Europe 107 0.3 2,709 4.9 0.1 1.0
Africa 854 2.7 1,196 2.2 n.a. n.a.
Japan 30 0.1 1,583 2.8 0.0 2.0
Other Asia and Oceania 442 1.4 2,920 5.3 n.a. n.a.
World total 31,906 100.0 55,866 100.0 n.a. na.
.a. Not available.a. Average annual ilnpo,ts divided by 1952 ind 1972 population data, r-espectivcly. No; cailculated foi icgiu[s tlat inicludc producing counliies.
Sources: Coffee impor ts, Annual Coffee Sta.tistics (New York: Pan Arnerican Coffc Bureau, various issues); populationt, United Nations.

The T4'W-ld Coffee M'arket 37
producing countries the behavior of the elasticity of demand withrespect to the international market price is determined by the factthat domestic coffee consumption is largely a policy variable: in timesof surplus (with concomitant low prices) domestic consumption tendsto be subsidized and insulated from world market price fluctuations,whereas in times of shortage the domestic price has to bear the fullimpact of international price developments.
The income elasticities of demand for both the United States andother importing countries have been assumed to decline withincreasing incomes, since coffee consumption is subject to definitesaturation levels. The figures show that, whereas consumption in theUnited States has already reached its saturation level and the incomeelasticity of demand is nil, consumption in the other importingregions is still sensitive to income changes. Finally, the fact that theprice elasticity of demand in the United States is higher at higherprice levels reflects the historical experience that, whereas consumersnormally accept minor price changes rather readily, increasinglystrong consumer resistance develops once prices rise above a certainlevel.
PRICES AND STOCKS
The best-known coffee prices are those quoted on the New Yorkspot market (see table 7). Coffee is also traded in some EuropeanCenters (for example, in London and Bremen), but so far pricesquoted there are not widely reported. Under the agreement estab-lishing the International Coffee Organization, export quotas wereadjusted on the basis of the movement of New York Spot prices1 0; itis also those prices which determine the discounts given by Braziland Colombia on their export sales.
Prices on the New York market are quoted in U.S. cents a pound.Transport costs to New York (including insurance, interest, customsentry, and other charges) vary from 4.5 cents a pound from theLatin American countries to 5-5.5 cents from Africa and 6.5 centsfrom Asia. Subtraction of these costs from the New York spot pricesgives the f.o.b. prices of the various types of coffee-the price that isof most interest to coffee exporters. Hereafter, therefore, referencesto the price of coffee will be to the average f.o.b. value (or export
10. The best-known coffee prices are those quoted on the New York Coffee andSugar Exchange (see table 7).
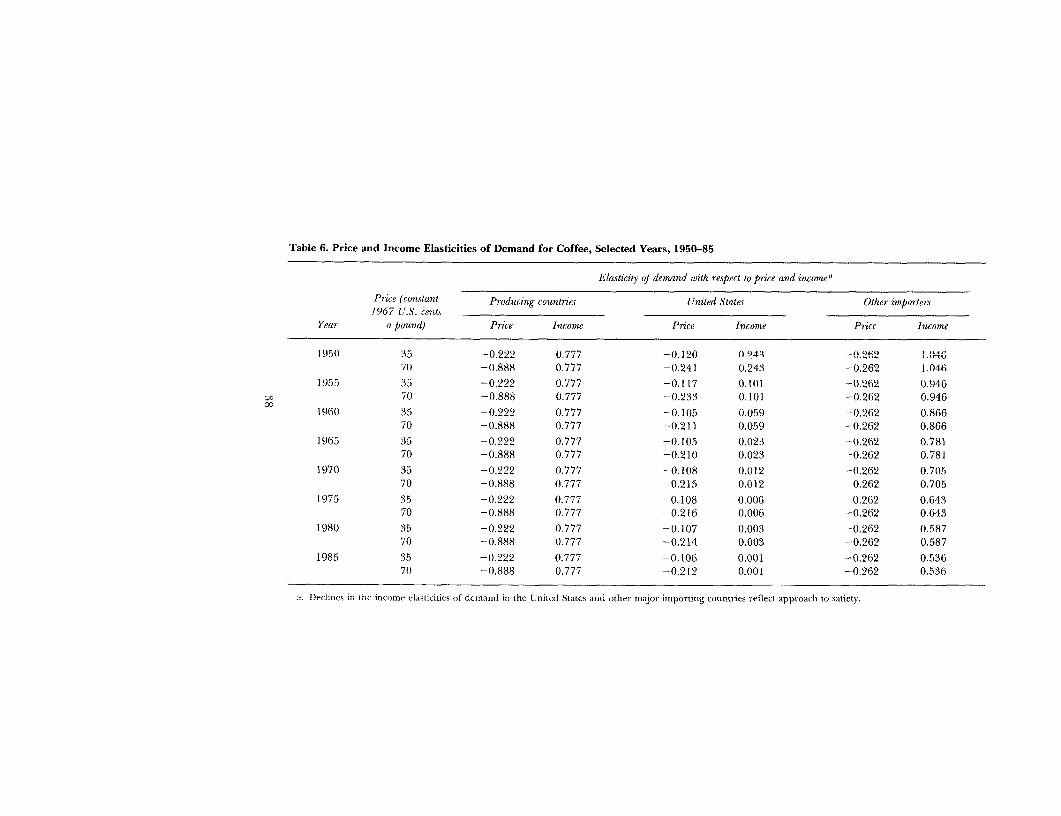
Table 6. Price and Income Elasticities of Demand for Coffee, Selected Years, 1950-85
Elasticity of demand with respect to price and income'
Price (constant Producing countries United States Other importers1967 U.S. cents
Year a pound) Price Income Price Income Price Income
1950 35 -0.222 0.777 -0.120 0 943 -0.262 .04670 -0.888 0.777 -0.241 0.243 -0.262 1.046
1955 35 -0.222 0.777 -0.t17 0.101 -0.262 0.94670 -0.888 0.777 -0.233 0.101 -0.262 0.946
1960 35 -0.222 0.777 -0.105 0.059 -0.262 0.86670 -0.888 0.777 -0.211 0.059 -0.262 0.866
1965 35 -0.222 0.777 -0.105 0.023 -0.262 0.78170 -0.888 0.777 -0.210 0.023 -0.262 0.781
1970 35 -0.222 0.777 -0.108 0.012 -0.262 0.70570 -0.888 0.777 -0.215 0.012 -0.262 0.705
1975 3 5 -0.222 0.777 -0.108 0.006 -0.262 0.64370 -0.888 0.777 -0.216 0.006 -0.262 0.643
1980 35 -0.222 0.777 -0.107 0.003 -0.262 0.58770 -0.888 0.777 -0.214 0.003 -0.262 0.587
1985 35 -0.222 0.777 -0.106 0.001 -0.262 0.53670 -0.888 0.777 -0.212 0.001 -0.262 0.536
a. Declines in ihc income elasticitics of demand ini the United States anid other major importing countries reflect approach to satiety.

The World Coffee Market 39
unit value) of coffee."1 To eliminate fluctuations resulting fromchanges in the value of the U.S. dollar, these prices have beendeflated by the U.S. wholesale price index (1967= 100).
In considering prices of the various types of coffee in the NewYork market, it must be borne in mind that quotations for Brazilianand Colombian coffee are entirely artificial. Virtually all coffee fromthese countries is sold under contracts with roasters in the importingcountries. The contracts entitle the roaster to a refund equal to thedifference between the price actually paid (based on the officialquotation) and the price of certain predetermined other varieties ofcoffee in the New York market. In return for this, the roaster takeson the obligation to purchase a specified quantity of coffee, thusguaranteeing the exporting countries a stable market outlet.
The most important example of such arrangements are theBrazilian contracts of supply.'2 They grant the roaster a refundequal to the difference between the ICO indicator price for un-washed arabicas on the day of purchase (i.e., the New York spotprice of Santos 4)13 and a 60-40 weighted average of the ICOindicator prices for other milds and robustas, respectively.'4 Inaddition, there is a "fidelity bonus" ranging from 2 cents a poundwhen the roaster uses a minimum of 30 percent Brazils in his blendto 3 cents when this minimum is 60 percent, and an "advertisingbonus" of $2 a bag (1.5 cents a pound) when the roaster uses morethan 80 percent Brazils in his blend and stresses this fact in hisadvertising. The degree of price distortion caused by these contractscan be seen in table 8, which gives the average Brazilian refunds toroasters from August 1974 through June 1975. In a similar way,Colombian contracts are reported to reduce the price actually paid tobetween 1.5 and 2 cents above the price of other milds.
I1. The unit value of U.S. imports, which is reported on an f.o.b. basis, is takenas an indication of this price. Not only is the United States by far the largestimporter, but also the distribution of its imports as to countries of origin does notdeviate significantly from the distribution of production among the variousregions.
12. The practice started in 1967 under the term "special contracts"; the"contracts of supply" began around September 1974. Despite the difference inname, the provisions of the contracts are virtually identical.
13. The New York spot price of Santos 4 is the ICO indicator price forunwashed arabicas.
14. The relevant weighted average for U.S. roasters is the weighted averageduring the month preceeding the day of purchase, and for Etiropean roasters, theweighted average on the day itself.

40 COFFEE, TEA, ANI) COCOA
Table 7. Coffee Prices in the New York Spot Market(U.S. cents a pound)
Guatemala prime Angola AmlnizYeara Colombian MAM Santos 4 washed 2AA
1947-48 31.55 26.85 28.38 18.081948-49 33.29 26.96 29.38 19.821949-50 46.74 42.05 43.75 34.971950-51 57.79 54.14 56.29 44.901951-52 57.63 53.96 57.45 47.451952-53 56.91 54.80 56.90 46.401953-54 73.49 71.60 73.62 59.741954-55 69.39 66.60 69.37 53.461955-56 68.88 55.77 67.91 39.281956-57 72.76 59.76 69.91 39.761957-58 57.06 53.43 55.34 41.231958-59 47.77 41.25 45.28 35.351959-60 45.06 36.39 42.12 27.541960-61 44.31 36.69 39.80 21.761961-62 42.36 34.57 36.56 20.411962-63 39.83 33.58 35.31 24.461963-64 43.66 41.01 40.86 35.381964-65 48.90 45.68 46.46 29.841965-66 49.00 42.89 44.72 35.671966-67 44.03 34.23 39.93 33.361967-68 41.97 37.27 39.63 34.231968-69 42.15 37.63 38.41 32..70
1969-70 53.09 48.46 47.83 38.:101970-71 52.36 51.28 47.98 43.101971-72 51.01 44.40 45.97 42.881972-73 67.05 59.65 57.85 47.991973-74 76.23 74.70 66.61 56.401974-75 73.53 72.15 56.70 53.69
Note: Coffees covered by this table are the best-known of the Colombian mild arabicas,unwashed arabicas, other mild arabicas, and robustas (left to right). Santos 4 is the mrostimportant variety exported by Brazil.
a. July I to June 30.Source: World Bank data.
Real prices of coffee increased rapidly after World War II; whenconsumption overtook prcduction and stocks were dwindling in t.heearly 1950s, they rose to a peak of 72 cents in 1954. Thereafter theybegan to decline when large supplies, evoked by the high prices,came on the market and stocks began to increase dramatically. Pricesreached a low of 32 cents in 1962, one year before the first

7The World Coffee Market 41
Table 8. Average Refunds to Coffee Importers under "Contracts of Supply"(U.S. cents a pound)
ICO indicator prices Refunds due to importers
Unwashedarabicas United
Mlonth (Santos 4) Other milds Rolnustas Europe States
1974August 69.50 62.55 56.01September 69.28 54.61 53.92 14.95 9.35October 69.71 56.78 54.94 13.67 15.38November 69.97 59.28 55.66 12.14 13.93December 71.59 58.78 55.18 14.25 13.76
1975January 73.25 55.84 54.32 18.02 15.91February 74.22 53.47 52.39 21.18 18.99March 72.76 50.05 49.64 22.87 19.72April 72.34 47.64 49.03 24.14 22.45May 75.15 50.85 47.52 25.63 26.95June 75.40 55.93 49.34 22.11 25.88
International Coffee Agreement (ICA) came into effect. The estab-lishment of the ICA led the trade to believe that prices would rise asa consequence of the export controls. This turned out to be a self-fulfilling prophecy: prices increased to 42 cents in 1964 despite thefact that stocks continued to accumulate. After the temporaryupsurge because of the establishment of the ICA, prices declinedagain to low levels when it became clear that coffee remained inample supply despite the export controls. In 1968 real prices wereback to their 1962 level.
In the meantime the low prices had their effect on production.The huge eradication programs in Brazil and a virtually totalstandstill in new plantings elsewhere caused aggregate world produc-tion to decline while consumption continued to increase. Thisturnaround was so pronounced that world consumption since 1966has continuously exceeded production."5 Large stocks remained forsome time, however, and prices began to react only in the early1970s.
15. The only possible exception is 1974-75, uhen, according to preliminarydata, production and consumption were approximately in balance.

42 COFFEE, TEA, AND COCOA
Prices increased slowly at first, but joined the general trend whenthe commodity boom beg,an in 1973-74. They reached 60 cents apound in current terms during the first half of 1974. Although thisrepresented an increase of- only 20 percent over the low levels of thelate 1960s in real terms, it was of great value to coffee-producingcountries, many of which are among those most seriously affected bythe increase in oil prices.
In mid-1974, however, the situation changed radically. Pricesstarted dropping fast, and in the period July 1974 through June1975 they were, in real terms, at their lowest levels since 1946.Reasons for the breakdown of prices in mid-1974 were not difficultto find at hand: for the first time since 1966 production was forecastto exceed consumption; a dock strike in the United States wasprevented by a negotiated settlement; and the winter in Brazil(June-August) was passing without a frost. More troubling was thefact that prices did not recover even after consumers had drawndown their stocks, which had been built up in 1973-74 as aprecaution against higher prices threatened by a possible frost andthe expected dock strike. The reason for the failure of prices torecover is to be looked for mainly in the sluggishness with whichcoffee prices tend to adapt to inflation. Normally it takes from two tothree years, and during that period real coffee prices suffer the fullimpact of inflation.
Based on normal assumptions, a strong recovery of coffee priceswas expected for 1976-77, but forecasts were overtaken by events. Inmid-July 1975 the heaviest frost in coffee-producing history hit themain Brazilian producing areas, and prices jumped by 60 percent ina matter of days. By the end of July they reached an average of 80cents a pound f.o.b. origin, in current terms.
If any one variable were to be used as a basis for explaining pricedevelopments in coffee, world producer stocks would be the mostuseful. Producer stocks show a long-term cycle that fairly accuratelymirrors the price cycle, wirh an all-time low in the mid-1950s, veryhigh levels during the 1960s, and lower but still sizable levels in theearly 1970s.
The main holder of stocks among producers has always beenBrazil. This may be explained by the fact that Brazil is the onlycountry that could actually increase its earnings by reducing thequantity of coffee that it supplies to the market. With an estimatedprice elasticity of aggregate world demand of -0.25, a country needsa share in world exports exceeding 25 percent to benefit from aunilateral reduction of supply in this way. This explains why Brazil

The World Coffee Market 43
accounted for 80 percent of world producer stocks in the 1960s.Because of its policy of production limitations over that period,however, its stocks have since been rapidly reduced. By late 1975world producer stocks, which totaled about 40 million bags, werespread fairly evenly among all coffee exporting countries.
Coffee stocks in the importing countries are of relatively minorimportance in comparison to producer stocks. They fluctuatearound 9 million bags, their level depending on price expectationsand the possibility of interruptions in supply (through, for example,dock strikes). Generally they tend to increase when prices rise, andvice versa. In this way they reached a peak of around 13 million bagsin mid-1974, then dropped quickly when prices began to crumble.When the frost hit Brazil in July 1975, stocks in importing countrieswere only about 6 million bags, a fact that probably contributed tothe immediate and substantial response of prices in internationaltrade.
MARKET OUTLOOK
In analyzing the market outlook for coffee, an econometric model isused.'6 In this model, production depends on lagged production,lagged prices, and, in the case of arabicas, on the phase of thebiennial cycle.'7 Consumption depends on prices and income, andthe price depends on the balance of supply and demand, on the one-year lagged price, and on inflation.
Before giving the forecast results, some explanation of the effectsof frosts on Brazilian coffee production is required. The south ofBrazil has always been subject to frost. Not until the second half ofthe 1950s, however, when coffee production had moved heavily intothe frost-prone state of Parana, did frosts come to be of majorimportance in coffee production. Since frosts occur at the time ofharvesting, they normally do not affect the current crop, but canheavily damage the crop of the following year. Thus, the three heavyfrosts on record since the late 1950s-in 1963, 1969, and 1972-cutthe 1964-65, 1970-71 and 1973-74 crops by an average of 55
16. See appendix A for a brief description of the model. A full discussion of itcan be found in World Bank Staff Working Paper 208.
17. Although a biennial production cycle can be observed for nearly all treecrops, it is especially marked in the case of arabica coffee, whereas it is hardlynoticeable for robustas.

Table 9. Actual and Projected Coffee Production and Growth Rates, by Region and Year, 1970-86 and 1972-90
Other SouthYear Brazil Colombia America Central America Africa Asia and Oceania Total
Actual production (millions of bags)
1970-71 9.8 7.8 3.3 11.8 19.8 5.8 58.31971-72 23.6 7.2 3.2 12.9 19.8 5.0 71.81972-73 24.0 8.8 3.4 12.9 21.4 5.9 76.51973-74 14.5 7.8 3.0 12.8 18.2 6.0 62.21974-75 27.5 9.0 3.0 13.7 19.6 6.3 79.01975-76 21.9 8.5 2.9 14.1 17.9 6.1 72.5Projected production (millions of bags)
! 97. 77 1 v.1 v 8.7 3.9 15.b 21.5 6.5 64.21977-78 18.0a 8.7 3.8 14.2 25.2 6.8 76.7
a 1978-79 24.0a 8.8 4.3 14.3 26.0 7.2 84.71979-80 27.0 8.9 4.2 14.8 25.9 7.5 88.21980-81 29.0 9.0 4.2 15.0 25.4 7.7 90.31981-82 31.0 9.3 4.3 15.6 26.0 8.2 94.41982-83 33.3 9.4 4.6 15.8 27.3 8.6 99.11983-84 32.9 9.7 5.2 16.3 30.5 9.2 103.81984-85 34.4 9.6 5.5 16.3 32.2 9.4 107.51985-86 33.3 9.6 5.8 16.6 33.0 9.6 107.91990-91 26.5 9.7Growth rates (percent per year) b
1973-80 4.1 0.9 4.4 1.9 3.8 3.6 3.21980-85 2.2 1.1 6.3 1.8 4.8 4.2 3.21985-90 -3.9 0.3 3.0 1.4 1.3 2.6 0.0
a. Based on preliminary estimates of firost datmage.b. Based oni thlee-yec--centered novinig asverages of production.Source: Actual data: Foreign Agriculturali Service, U.S. Departmttent of Agriculture, July 1975; projected data: Wol Id Bltrik.

The World Coffee Market 45
percent. The crops following the frost-damaged ones, however,tended to be relatively large because of the effects of the biennialcycle.
The frost of 1975 seems to have been worse than its predecessorsand to have affected a great number of trees to such an extent thattwo crops will be strongly affected: those of 1976-77 and 1977-78."8Preliminary estimates from Brazil place the two crops at between 8and 10 million bags and 15 to 18 million bags, respectively. Evendiscounting these trade estimates for their inevitable downward biasand taking average production in the two years to be 10 and 18million bags, respectively, implies extremely tight coffee supplies inthe coming years.
The forecast of supply by region is given in table 9. Before thedisastrous frost of 1975, the rate of production increase was ex-pected to slow down considerably in the 1980s. Stocks were expectedto reach a low of 25 to 30 million bags around 1977-78 and tostabilize at about 30 million bags thereafter, leading to a period offairly stable price levels. The frost of 1975, however, threatens areturn to the earlier coffee cycle. Stocks are now expected todecrease to about 15 million bags in 1977-78, a level that isinsufficient to prevent a physical scarcity of coffee in the face of evenminor adversities in production. Actually, since this level is below thenormal pipeline requirements of about 15 million bags, occasionalsupply difficulties may arise and prices will be highly volatile. As aconsequence, however, production in the 1980s will increase muchfaster than originally forecast; stocks can be expected to rise to about50 million bags in the mid-1980s, with considerably lower prices.
The supply forecasts imply a continued decline in the share of thetraditional coffee-producing regions in total world production. Themodel indicates that only Brazil will be able to increase its share byabout 1980, but this will not change the underlying long-term trend,which is definitely downward. This development at the same time
18. The way in which frost damages production depends on the extent to whicha tree is affected by the frost. This is shown below:
Crop sizefollowingfrost, by yearsDamaged part 1 2 3 4Leaves Small Normal Normal NormalLeaves and branches Nil Small Normal NormalLeaves, branches, and trunk Nil Nil Small Normal
If the root system has also been destroyed, the tree must be eradicated.

46 COFFEE, TEA, AND COCOA
Table 10. Actual and Projected Coffee Consumption and Growth Rates., byRegion and Year, 1970-86 and 1972-90
ProducingYear countries United States Other importersa To gal5
Actual consumption (millions of bags)1970-71 18.2 2].0 30.4 69.21971-72 18.8 21.3 36.6 77.31972-73 19.3 21.6 38.3 79.91973-74 18.7 21.5 39.5 80.51974-75 19.3 21.2 33.9 72..1Projected consumption (millions of bags)1975-76 19.2 21.0 37.3 78.21976-77 22.1 20.5 36.1 75.41977-78 21.2 20.5 37.3 77.61978-79 20.5 20.6 39.4 80.61979-80 21.7 20.8 41.1 83.9
1980-81 23.2 20.9 42.6 86.71981-82 24.6 20.9 44.1 89.41982-83 25.6 21.0 45.9 92.41983-84 26.4 21.2 47.8 95..91984-85 27.6 21.3 49.8 99.61985-86 29.4 21.4 51.6 103.01990-91 34.9 21.1 55.2 111.6
Growth rates (percent a year)c1973-80 2.8 -0.4 1.9 1.61980-85 5.2 0.5 3.8 3.41985-90 3.1 -0.3 1.6 1.7
a. Including demand for inventories.b. Including demand for invento ries in United States. Because demand for this pur-pose has
been excluded from the data forl U.S. consumption, figures shown for producers andimporters do not add to totals. The growth in world exports will be less than the growth inworld consumption, since domestic consumption in producing countries is expected to growfaster than consumption in the impDrtirig countries.
c. Based on three-year-centered moving averages of consumption.Sources: Actual consumption, U.S. Department of Agriculture and U.S. Depart:ment of
Commerce; projected consumption, World Bank.
means that the share of robusta coffees in world production willcontinue to increase.
The outlook for demand is given in table 10. In the short run it isfairly pessimistic because of unfavorable economic developments inthe industrialized member countries of the Organization for Eco-nomic Cooperation and Development (OECD). In 1974-75 totaldemand actually dropped, both because of the decline in OECD

The World Coffee Market 47
incomes in 1974 and because of the drawdown of the largeconsumer stocks built up during 1973-74. From 197576 through1977-78 the growth of demand to be expected on account of therecovery of OECD incomes does not show up in the model because itis curbed by a simultaneous sharp increase in real prices. After this,however, the growth in demand resumes its momentum. Only in theUnited States is demand expected to continue declining, though at anominal rate.
The trend of prices, both in real and in current terms, is given intable 11. The model shows firm price levels in the remaining half ofthis decade. Because of the expected response of production,however, a strong decline is forecast for the 1980s.
Table 11. Actual and Projected Coffee Prices, and Deflator by Year, 1970-86
pricea
ConstantCurrent 1967 Deflatorb
Year (U.S. cents a pound) (1967 =100)
Actual prices
1970-71 45 41 110.41971-72 40 35 113.91972-73 49 41 119.11973-74 58 43 135.51974-75 54 35 160.1Projected prices
1975-76 91 52 174.91976-77 95 51 186.31977-78 104 48 201.91978-79 104 46 218.11979-80 107 45 234.41980-81 113 44 250.81981-82 118 42 268.41982-83 122 40 287.21983-84 124 38 307.31984-85 126 37 328.81985-86 131 38 351.81990-91 212 43 493.4
a. Average export unit value of coffee, f.o.b. origin.b. For the first calendar year of split years.Sources: Historical data, U.S. wholesale price index: projections, World Bank index of
international prices.

48 COFFEE, TEA, AND COCOA
THE INTERNATIONAL COFFEE AGREEMENT
In December 1975 a new International Coffee Agreement wasnegotiated, providing for the introduction of export quotas when-ever (a) the average of the indicator prices of "other mild" Arabicasand Robustas falls for 20 consecutive market days below its 1975level of 62.23 U.S. cents a pound, or (b) the composite indicatorprice (on the nature of which the International Coffee Council stillhas to decide) falls for 20 consecutive market days more than 15percent below its average for the preceding year, and at the sametime the average of the indicator prices of "other mild" Arabicas andRobustas does not exceed its 1975 level by more than 22.5 percent(i.e., does not exceed 77.46 U.S. cents a pound).
Of the total available quota 70 percent will be distributed am)ongthe exporting countries according to their recent export perform-ance. The other 30 percent will be distributed in proportion to theexportring countries' carryover stocks at the end of the previouscrop year.
The new agreement is to extend over a period of six years,beginning October 1, 1976. Quotas will probably not be introducedduring the first two years, since a drop in the average indicator priceof "other mild" Arabicas and Robustas below 77 U.S. cents in currentterms is highly unlikely. The agreement provides, however, for arevision of the trigger price levels for its second and third two-yearperiods. During this time real prices are expected to start falling, andexport quotas will probably have to be introduced.

3
THE WORLD TEA MARKET
TEA CAN BE GROWN under a wide range of climaticconditions, from Mediterranean to tropical. In general, the nearerthe tea area to the equator, the higher the altitude necessary toachieve any given standard of quality. The tea bush begins toproduce leaves that can be processed about three to four years afterplanting; it takes from nine to ten years to reach maturity and beginsto decline after about fifty years.
Tea is processed in two principal ways, yielding either green orblack tea. The latter is far the more important in the world market.Processed tea is classified in a large number of grades, but there isno single index for the measurement of quality. Because tea ishygroscopic-that is, it readily absorbs moisture from the air-itcannot be stored for extended periods in most producing countries.Even in the United Kingdom, quality can be adversely affected if teais stored longer than from six to eight months.
PRODUCTION AND EXPORTS
Developing countries in South Asia and East Africa account formore than 85 percent of world tea production ancl exports.' Indiaand Sri Lanka are dominant in both.
1. The definitions of such terms as "Latin America," developed and developingcountries, and centrally planned economies are as in the quoted sources. Ingeneral, developed countries are, for example, those industralized countries whichare members of the Organization for Economic Cooperation and Development(OECD); developing countries are those with economies that are not generally
49

50 COFFEE, TEA, AND COCOA
During the period 1955-57 to 1971-73 world production in-creased at an average annual rate of 3.3 percent, to a level of about1,152,000 metric tons (see table 12). The geographical distributionl ofproduction has been changing significantly since the mid-1950s.Country growth rates oF production (see figure 1) ranged1 fi-omabout 9.2 percent a year in the African countries to 2.4 percent inIndia and 1.3 percent in Sri Lanka between 1955-57 and 1971-73.2The combined share of India and Sri Lanka in world productiondeclined over this period from about 70 percent to roughly 58percent, while that of the African producers rose from about 4.7percent to about 12 percent. Production tended to stagnate inBangladesh and Indones..a but showed marked increases in Argen-tina, Iran, and Turkey.
The proportion of tea output that is exported varies betweencountries and has chanrged over time (see table 13). In Indiadomestic consumption has been growing at about 5.5 percent a yearsince 1960, faster than the growth of production (2.9 percent). In1973 about 40 percent of Indian output was exported, as against 60percent in 1960. In Sri Lanka, with a much smaller population, andalso in the producing countries of Africa, a much higher proportionis exported: between 74 and 97 percent in 1973.
The volume of world tea exports has grown slowly since the mid-1950s, at an average annual rate of 1.9 percent a year and at 1.8percent since 1960. Meanwhile, the value of world exports hasstagnated, reflecting a secular (or long-term) decline in real prices(see figure 2). In 1955-57 world exports amounted to 4151,000metric tons, valued at $582 million. By 1971-73 volume hadincreased to about 622,00) metric tons, valued at only $551 million.World unit value fell over this period from 56.9 cents a pound to40.1 cents a pound (see table 14).
As table 14 shows, the volume of tea exports from Asian countriesgrew at an average annual rate of 1.4 percent between 1955-57 and1960-62 and by only 0.1 percent between 1960-62 and 197 1-73. Bycontrast, exports from Afiican countries grew by an average annual
considered to be "developed" or centrally planned; and centrally planned econom-ies are those of countries that are members of the Council of Mutual EconomicAssistance (COMECON) plus The People's Republic of China, The People'sDemocratic Republic of Korea, andi The Democratic Republic of Vietnam.
2. These differences are explained partly by the low levels of production andexports in Africa during the base period.

The World Tea Market 51
Table 12. Average Tea Production, by Region and Country, and Shares ofWorld Total, 1955-57 and 1971-73
Production(thousands of metric Annual Percentage share of
tons) percentage world total'change
Region and country 1955-57 1971-73 in production 1955-57 1971-73
Asia
Bangladesh 23 21 0.6 3.3 1.8China, Republic of' 14 27 4.2 2.0 2.3India 309 451 2.4 44.9 39.2Indonesiac 45 51 0.8 6.5 4.4Iran 6 22 8.5 0.9 1.9Japand 72 94 1.7 10.5 8.2Sri Lanka 175 214 1.3 25.5 18.6Turkey 2 41 21.0 0.3 3.6Other Asian countries 6 56 15.0 0.9 4.9
Total 652 977 2.6 94.8 84.9
Afnca
Kenya 10 49 10.4 1.4 4.3Malawi 9 21 5.2 1.2 1.8Mozambique 6 18 7.1 0.9 1.6Tanzania 2 12 11.8 0.3 1.0Uganda 3 21 12.9 0.4 1.8Zaire 2 7 8.2 0.2 0.6Other African countries 2 12 11.9 0.3 1.0
Total 34 140 9.2 4.7 12.1
Latin America
Argentina 2 28 18.0 0.3 2.4Other Latin American
countries 2 7 8.2 0.2 0.6
Total 4 35 14.5 0.5 3.0
World total 690 1,152 3.3 100.0 100.0
a. Excluding countries with centrally planned economies.b. About 85 percent is green tea.c. Estates only.d. About 98 percent is green tea.Sources: FAO, Tea Statistcs (Rome, 1967); FAO, Produchon Yearbook (Rome. 1973); and FAO,
Monthly Bulletin of Agriculture Statistics (Mar ch 1975).

Table 13. Tea Production, Exports, and Share of Production Exported, Major Producing Countries, Selected Years, 1960-73
Year Argentina In,dia 1ndoneija lapan Kenya Malalri Motambiqae .Si lanka Tanoania Turkey Uganda World tal;"
Production (ma nie Ions)
1960 6,500 321,077 46,061 77,566 13,775 12,825' 9,025 197,181 3,722 5,933 4,668 789,100
1968 18,560 402,489 41,384 84,971 29,762 15,811 14,251 224,803 7,925 27,557 15,163 1,023,200
1969 18,88t) 395,968 45,600 89,604 36,060 16,916 16,034 219,639 8,777 34,373 17,627 ll051,000
1970 19,530 420,843 44,300 91,198 41,077 18,731 16,974 212,210 8,4912 33,431 18,217 1,067,200
1971 27,514) 428,280 47,900 92,911 36,290 18,615 16,536 217,773 10,457 32,260 17,966 1,076,800
1972 27,0)10 455,50)5 49,777 94,832 53,322 20,682 18,678 213,475 12,7()6 46,500 23,376 t,251,70()
1973 29,000 469,782 54,546 95,000 56,578 23,5:i3 18,795 211,271 12,658 43,202 20,426 1,2146,639
E xporh. (mehir 1on')
14960 3,017 193,0')8 36,140 9.811 11,871 11,067 8,()66 185,875 :3,340 - 4,171 489,4(0
1'168 14,693 208,440 34.712 1.968 8,436 45709 !4,21:i 208,071 7,052 ,:i52 ii,7 583, 20
11)69 14,633 168,709 27,070 1,614 33,828 17,287 15,43"1 201,394 7,699 8,301 15,927 554,31)1)
1970 19,114 2()(),155 :15,600 i,369 36,(94 17,709 16,653 208,277 7,054 7,84:i 15,052 607,700
1971 22,500 202,000 39,000 1,494 310,100 18,200 16,400 207,00( 8,300 17,500 15,300 626,000
1972 18,894 209,814 38,529 1,883 47,368 19,855 18,351 190,088 9,208 14,881 20,683 649,000
1973 9,500 188,1142 39.536 2,170 51,545 22,148 17,879 205,515 9,391i 18,807 18,979 663,614
Percenitge h-re oj produelion exported
196() 46.4 60.1 78.5 12.6 86.2 86.3 89.4 94.3 89.7 - 89.4 62.0
1968 79.2 51.8 83.1) 2.3 95.3 99.9 99.9 142.8 89.0 26.7 75.1 57.6
1969 77.5 42.0 59.4 1.8 93.8 102.2 96.3 91.7 87.7 24.1 90.4 52.7
1970 97.9 47.4 80.4 1.7 87.9 94.5 98.1 18.1 83.1 23.5 82.6 56.9
1971 81.8 47.2 81.4 1.6 82.9 99,0 99.2 95.0 79.4 54.3 85.2 58.1
1972 70.0 46.1 77.4 2.0 88.8 96.0 98.3 814.0 72.5 32.0 88.5 51.9
1973 32.8 40.1 72.3 2.3 91).1 94.0 95.1 )7.3 74.2 43.5 92.9 54.5
-. Nil or negligible.a. Excluding thie Soviet Union and the Pcoples' Republic of China.
Ih. Quantities fom Malawoi before 1963 relate to the Feder-ation of Rhodesia atrd Nyasalatid and exclude trade between Nyasaland and the Rhodesias.
c. Quantities of production for Indonesia for 1969 through 1971 i elate only to estates.
Snrrces: International Tea Committee, Anntil Bulletin of S)atit.ics (vatrious issues); FAO, Tea Statitir, (Rrotre, 1969); FAO, Mont/vA Bullelin of tgricul1amrl Eroonmica nd StiaStics (Ma,cli 1975; atsid
FA(), Trae Yearbook (1973).

The World Tea Market 53
Figure 1. Tea Production in Major Producing Countries and Africa,
1955-742,000 -
World'
1,000
800
600
Inedia400
Sri Lanka
200
''100_ -- t a~~~~~~
,> 60 4
40 / aAf-ca
1955 60 65 70 75Year
a. Excluding the Soviet Union and the People's Republic of China.
Source: World Bank data.

54 COFFEE, TEA, AND COCOA
Figure 2. Volume, Total Value, and Unit Value of World Exportsof Tea, 1955-73a
800X 65l
700 - _ __60
\ ~~~~~~~~~Volume ( f c/
7 600 55
a '.~N.0FIl.a :Total value-E '.,(left scale)
40C ~ ~ ~ ~ ~ ~ ~ ~ ~ ~ ~~~~~~4Unit value (right scale)
:Rt 3°° ~~~~~~ - <# t ~~~~40
cZS 200 -35
300 430
0 -251955 60 65 70 75
Yeara. Excluding centrally planned economies.Source: World Bank data.

The World Tea Market 55
Table 14. Average World Tea Exports, Export Value, Export Unit Value, andLondon Auction Prices, 1955-57, 1960-62, and 1971-73, and Annual PercentageChange, 1955-57 to 1960-62 and 1960-62 to 1971-73
Annual percentagechange
1955-57 1960-62to to
Region and country 1955-57 1960462 1971-73 1960-62 1971-73
Exports (thousands of metric tons)
World 461.0 513.0 622.3 2.1 1.8Developed countriesa 12.0 9.0 18.9 -5.6 7.0Developing countries 449.0 504.0 603.4 2.3 1.6
Asia 420.0 450.0 452.4 1.4 0.1India 202.0 204.0 199.0 0.2 -0.2Sri Lanka 163.0 195.0 200.7 3.6 0.3Others 55.0 51.0 52.7 -1.5 0.3
Africa 28.0 48.0 125.7 11.4 9.2Latin America 0.3 6.0 25.3 81.0 14.0
Export value (millions of U.S. dollars)
World 582.1 584.9 550.6 0.1 -0.5Developed countriesa 7.1 5.2 5.0 -6.1 -0.3Developing countries 575.0 579.7 545.6 0.2 -0.5
Asia 546.5 531.5 428.2 -0.5 -1.9India 265.9 257.4 198.9 -0.6 -2.3Sri Lanka 228.2 235.0 191.6 0.6 -1.8Others 52.4 39.1 37.7 -5.7 -0.3
Africa 28.1 44.2 102.2 9.5 7.9Latin America 0.4 4.0 15.2 60.0 12.9
Export unit value (U.S. cents a pound)
World 56.9 51.6 40.1 -1.9 -2.3India 60.2 57.4 45.3 -0.9 -2.1Sri Lanka 63.4 54.8 43.3 -2.8 -2.1Africa 45.6 41.6 36.9 - 1.8 - 1.1
London auction prices (U.S. cents a pound)
All tea 66.9 62.8 47.9 -1.3 -2.4North India 70.5 68.4 48.6 -0.6 -3.1South India 58.2 53.7 43.0 -1.6 -2.0Sri Lanka 73.4 66.6 50.7 -1.9 -2.4Africa 47.2 48.4 46.3 0.5 -0.4
Note: Data do not include those for countries with centrally planned economies.a. Japan and Turkev.Sources: FAO, Tea Statistics (Rome, 1967 and 1969); FAO, Trade Yearbook (Rome, 1974), and
Commodity Review and Outlook 1974-75 (Rome, 1975).

56 COFFEE, TEA, AND) COCOA
11.4 percent in the earlier period, and by 9.2 percent in the later.The share of India anc. Sri Lanka in world export volume hasdeclined from about 79 percent in 1955-57 to about 64 percent in1971-73, while that of the African producers rose from about 6percent to more than 20 percent. Thus, the African countries'export earnings from tea have risen over this period at the expenseof India and Sri Lanka (see tables 15 and 16).
The importance of tea in the total export earnings of selectedproducing countries is i]lustrated in table 15. Sri Lanka hkas thehighest dependence on r:ea: 56 percent of its export earnings in1971-73, only slightly be]ow the figure a decade earlier. In Africa,Malawi and Kenya derive a significant share of their export earningsfrom tea (19 and 16 percent, respectively, in 1971-73), and the
Table 15. Value and Market Share of Tea Exports, Africa and South Asia, andper Capita Incomes
Value Market share(millioss of U.S. dollars) 1971-73 Per capita
(percent of income, 1970Country 1960-62 1971-73 Change total) (U.S. dollars)
Africa
Kenya 13.3 44.1 30.8 6.6 150Malawi 11.0 15.4 4.4 2.3 80Mozambique 6.9 10.6 3.7 1.6 240Tanzania 3.8 7.0 3.2 1.1 100Uganda 4.6 15.6 11.0 2.3 130Others 4.4 8.4 4.0 1.3Total 44.0 101.1 57.1 15.2
South Asia
Bangladeshand Pakistan' 2.6 29 .2 26.6 4.4 1100
India 257.4 201.0 -56.4 30.2 110Sri Lanka 235.0 191.6 -43.4 28.8 :110Total 495.0 421.8 -73.2 63.3
Other countries
Total 80.9 143.2 62.3 21.5
World totalb 619.9 666.1 46.2 100.0
Note: Figures may not add to tolals because of rounding.a. Combined for purposes of comparability; separate data for the earlier periocd are not
available.b. Excluding centrally planned economies.Source: FAO, Trade Yearbook (Rorne, 1973) for export data; World Bank estimates for per
capita incomes.

Table 16. Average Value of Tea Exports and Tea Share in World Exports and in Total Country Export Earnings,Selected Asian and African Countries, 1955-57 and 1971-73
1 955-57 1971-73
Country tea share in: Country tea share in:Tea export value _ _ _ _ _ _ _ _ _ _ _ _ _ _ _ _ _ __ Tea export value _ _ _ _ _ _ _ _ _ _ _ _ _ _ _ _ _ _ _
(millions of U.S. World tea export Country total export (millions of U.S. World tea export Country total export
Country dollars) value (percent) earnings (percent) dollars) value (percent) earnings (percent)
Asia
India 265.9 46.1 19.9 201.0 30.4 8.2Sri Lanka 228.2 39.5 60.8 191.6 29.0 55.8
Africa
Kenya 8.5 1.5 9.9 44.1 6.7 15.8Malawi 8.9 1.6 n.a. 15.4 2.3 18.5Uganda 3.0 0.5 2.3 15.6 2.3 5.7Tanzania 1.7 0.3 1.3 7.0 1.0 2.4Mauritius 0.3 0.05 0.5 3.5 0.5 1.4
World totala 582.1 100.0 666.1 100.0
n.a. Not available.a. Excludinig countries with centrally planned economies.Sources: FAO, Tea Statistics (Rome, 1967); FAO, Trade Yearbook (Rome, 1973); and U.N., Monthly Bulletin of Statistics (New York, various issues).

58 COFFEE, TEA, AND COCOA
proportion has been growing rapidly since the mid-1950s. The shareof tea in India's export earnings has been declining, from about 20percent in 1955-57 to about 8 percent in 1971-73.
IMPORTS AND CONSUMPTION
The developed countries accounted for about 62 percent of worldtea imports in 1973 (see table 17). The United Kingdom dominatesthe market, with about 28 percent of total tea imports in 1973: that
Table 17. Imports of Tea, Selected Countries, Yearly, 1968-73(Thousands of metric tons)
Country 1968 1969 1970 1971 1972 19.73
Developed countriesAustralia 27.6 30.5 27.0 27.3 29.0 29.2Belgium 0.9 1.1 1.1 1.4 1.4 1.6Canada 23.0 22.4 20.7 23.6 23.8 23.6Germany, Federal Republic of 9.0 9.2 9.3 9.8 10.0 10.7Ireland 13.2 11.2 11.3 12.1 12.9 13.3Italy 2.2 2.7 2.8 2.2 2.6 2.6Japan 5.3 11.6 15.6 14.1 18.9 21.8Netherlands 32.8 29.2 25.7 40.1 34.9 42.1New Zealand 7.2 8.4 7.6 6.7 8.1 7.6South Africa 19.1 19.6 17.4 19.0 19.4 18.0Sweden 1.9 1.9 2.0 2.1 2.1 2.4Switzerland 1.5 1.5 1.6 1.6 1.7 1.8United Kingdom 269.6 212.2 252.7 226.3 212.2 211.2United States 70.6 63.5 62.2 79.6 68.7 78.6
Total 493.0 434.5 466.3 476.3 457.6 478.1
Developing countriesEgypt, Arab Republic of 14.5 24.9 29.8 11.0 13.8 9.8Iran 6.3 6.5 6.2 7.3 9.0 7.5Iraq 18.2 23.0 19.5 19.9 22.0 16.0Sudan 13.3 10.0 19.4 14.4 18.0 17.0
Centrally planned economiesU.S.S.R. 22.7 28.0 29.2 42.6 47.5 37.3
Total 36.3 43.5 45.0 60.6 67.8 59.5
Total 184.0 224.9 236.6 205.9 223.6 227.8
World total 713.6 702.9 747.9 742.8 749.0 765.4
Note: Figures may not add to tots Is because of rounding.Source: FAO, Trade Yearbook (Rome, 1973).

The World Tea Market 59
is, gross imports of 211,000 metric tons, of which about 26,000 tonswere reexported (see table 18). The United States is the secondlargest importer (79,000 metric tons in 1973), with a much smallerproportion of the total. The Netherlands ranks third, but less than athird of its imports is retained for domestic consumption. The EECcountries, Australia, Canada, Japan, South Africa, Ireland, someNear Eastern countries, and the Soviet Union also import andconsume significant quantities.
Since 1970 India has become the largest absolute consumer of tea.In 1971-73 it accounted for 22 percent of total world consumption,compared with the United Kingdom's 18 percent (see table 19). Teaconsumption in India has continued to grow at more than 5 percenta year despite government efforts to restrict it in recent years byincreasing the retail price through higher excise taxes.3 Per capita teaconsumption in India is also rising.
Both absolute and per capita consumption in the United Kingdomhas been declining over the past two decades, partly reflecting thediversification of tastes in favor of coffee (particularly instant coffee)and soft drinks.4 By contrast, U.S. consumption shows a continuouslyrising trend, reflecting the increased popularity of iced tea.
Shifts in the composition of demand for tea in the developedimporting countries have had unfavorable effects on aggregateexport earnings from tea. The increasing use of tea bags and solubleinstant tea effectively reduces the quantity of tea needed per cup andalso raises the demand for plain (cheaper) teas at the expense ofthose of high quality. Tea bags account for about 10 percent of thevolume of world consumption. About 16 percent of apparentconsumption in the United Kingdom is in this form; by 1980, thefigure may have risen to 50 percent. 5 Factors that seem to havestimulated consumption of instant tea include its ease of use as a colddrink and the growing prevalence of vending machines.
World demand for tea is not highly responsive to changes in either
3. Retail demand for tea in India is price elastic.4. See, for example, R. J. Ball and R. Agarwala, An Econometric Analysis of
Demandfor Tea in the United Kingdom (London: Ogilvy & Mather Ltd., 1959); FAO,"Trends in Tea Consumption-The United Kingdom," November 29, 1968,prepared by the Committee on Commodity Problems, Third Ad Hoc Consultationon Tea, Kampala, January 1969; and R. J. Ball and T. Burns, The Demandfor Teain The United Kingdom-The Outlook to 1980 (London: Economic Models Ltd., April1972).
5. See John Edwards, "Big Drop in U.K. Tea Demand Predicted," FinancialTimes, May 17, 1972.

Table 18. Comparison of Tea Imports and Reexports of the United Kingdom with World Totals, Selected Years, 1955-73
Percentage of U.K. Percentage of U.K. Percentage of U.K.7lotal world imnportsa U.K. gross imports U.K. reexports gross imports in total reexports in U.K. reexports in total
Year (thousands of metric tons) world imports a gross imports world import' a
1955 506.0 226.5 14.9 44.8 6.6 2.91960 <5.'9 2O38." i3.7 43.1 5.7 2.51965 646.1 253. 4 17.8 39.2 7.0 2.81968 713.6 269.6 20.3 37.8 7.5 2.81969 702.9 212.2 22.2 30.2 10.5 3.2
1970 747.9 254.6 19.2 34.0 7.5 2.61971 742.8 226.3 22.9 30.5 10.1 3.11972 749.0 211.8 19.7 28.3 9.3 2.61973 765.4 211.2 25.7 27.6 12.2 3.4
a. Gross imports inicluding green tea.Sources: FAO, Tea Statistics (Rome, 1967 and 1969); International Tea Committee, Armsual Bultletin of Statistics (1971 and 1974); FAO, Trade Yearbook (Rome, various
issues).

The World Tea Market 61
price or income. The overall price elasticity of demand has beenestimated at between -0.2 and -0.4. Demand for tea is generallymore price elastic in developing countries; the magnitude of elastic-ity, for instance, is greater than 1 in Kenya and India (-1.70 and-1.60, respectively). The estimated income elasticity of world de-mand for tea is in the range of 0.2 to 0.4. The data in table 20 showthe elasticities of demand for tea in selected countries with respect toboth income and price.
PRICES
Prices of tea rose in the years after World War II to a high of 71cents a pound in 1955 (current prices). Subsequently, with aggregateproduction growing by 2.9 percent a year and aggregate demand byonly 2.0 percent, prices showed a secular (long-term) decline,dropping as low as 44.1 cents a pound in 1969 (in current prices; seetable 21).
The international market price of tea is determined at majorauction centers such as Calcutta, Colombo, and London. The UnitedKingdom has historically held about 50 percent of world tea stocks,the remainder being held by producing countries. Since Britain isalso the largest tea importer, London provides the leading priceindicator in the world market.
The price premium that Indian and Sri Lankan teas commandedin the early 1950s has gradually been eroded (see figure 3). Thoughthe quality of African teas has improved, this trend reflects the shiftin the composition of demand, such as the rise in popularity of teabags and instant tea.
MARKET PROSPECTS
In forecasting the prospects of the world tea market, informationfrom various reports 6 and recent results from some experimentationwith econometric analyses in the World Bank have been utilized.
6. Dieter Elz, "Report on the World Tea Economy," World Bank report EC-178(Washington, D.C., June 30, 1971); FAO, Commodity Review and Outlook, variousissues; FAO, "Tea Production and Export Plan, 1972-1982" (Rome, May 1973);FAO, "Import Demand of the USSR and Eastern Europe-Recent Trends andOutlook" (Rome, May 1973).

Table 19. Average Tea Consumption, by Regions and Country, and Shares of World Total, 1955-57 and 1971-73
T'otal con-sumption(thouands of metric tons) Annual percentage Percentage share of world total
change in _ _ _ _ _ _ _ _ _ _ _ _ _ _ _ _
Region and country 1955-57 1971-73 consumption 1955-57 1971-73
Developed counties
United Kingdom 227.3 203.5 -0.7 32.9 17.6Other EEC countries 17.2 28.3 3.2 2.5 2.5
s Ireland 10.1 11.5 0.8 1.5 1.0Other Western Europe 6.2 21.1 8.0 0.9 1.8United States 47.7 75.6 2.9 6.9 6.5Canada 20.2 21.0 0.2 2.9 1.8South Africa 11.9 19.4 3.1 1.7 1.7Australia 25.4 27.2 0.4 3.7 2.4New Zealand 6.7 7.8 1.0 1.0 0.7Japan 58.7 110.5 4.0 8.5 9.6Turkey 4.4 23.6 11.1 0.6 2.0
Total 435.8 549.5 1.5 63.1 47.6
Nonproducing developing countries
Asia 32.8 64.2 4.3 4.8 5.6Africa 52.0 75.3 2.3 7.5 6.5Latin America 5.8 12.3 4.8 0.8 L.1
Total 90.6 151.8 3.3 13.1 13.2

Producing developing countries
AsiaSri Lanka 8.1 19.7 5.7 1.2 1.7India 100.0 248.3 5.9 14.4 21.5Indonesia 4.5a 22.1 10.5 0.6 1.9Bangladesh and Pakistanb 17.1 39.3 5.4 2.5 3.4Others 25.5 86.6 7.9 3.7 7.5
Total Asia 155.2 416.0 6.4 22.4 36.0
AfricaKenya 2.3 6.0 6.2 0.3 0.5Malawic 1.5 4.7 7.4 0.2 0.4Tanzania 0.8 2.5 7.4 0.1 0.2Uganda 0.7 1.6 5.3 0.1 0.1Others 0.9 8.9 15.4 0.1 0.8
C4 TIotal Africa 6.2 23.7 8.8 0.8 2.0
Latin America 3.3 13.6 9.3 0.5 1.2
Oceania 0.5 0.6 1.1 0.1 0.1
Total, producing countries 165.2 453.9 6.5 23.8 39.3Total, developing countries 255.8 605.7 5.5 36.9 52.4
World total' 691.6 1,155.2 3.3 100.0 100.0
a. Par tly estimated.b. Combined for purposes of comparability; separate data for the earlier period are not available.c. Includes Southern Rhodesia and Zambia.d. Excluding centrally planned economies,Sources: FAO, Tea Statistics, (Rome, 1967); and International Tea Committee, Annual Bulletin of Statistics (London, 1974).

64 COFFEE, TEA, AND COCOA
Table 20. Price and Income Eilasticities of the Demand for Tea,Selected Countries
Elasticitya Coefficient of timevariable1 ' (thousands of
Country Price Income metric tons a year)
Developed countriesAustralia and New Zealand -0.93 0.31 --0.81
Canada -0.87 0.l21 -0.44Japan - 0.32 -South Africa -0.321 0.69 -United States -0.34 0.52 -Germany, Federal Republic of -0.73e 0.59c -Ireland -0.24 0.25 -Netherlands -0.64 0.86 -0.60cUnited Kingdom -0.33' 0.17, --2.92Other Western Europe -0.82' 1.10
Developing countries
India -1.60 0.91 -
Indonesia - - 0.81
Iran - - 0.91
Kenya -1.70 - 0.54
Pakistand -0.32c 1.35 -
Sri Lanka -0.54' 1.20 -
Turkey - - 0.45
United Arab Republic -0.50 - 0.85
- Negligible or not available.a. With respect to average of the variables for the period covered. Based on time series for
1954-66 or 1955-66 (annual data).b. Measures the changing trend in consumer taste.c. Coefficient was less than twice the standard error, meaning it was niot signiificantly
different from zero at 95 percent confidence level in the time period covered.d. Included what is now Bangladesh.Source: FAO, Ad Hoc Working IParty on International Arrangements for Stabili:ation of
Tea Prices (Rome, March 1969).
The data in table 22 sumrnarize the forecasts for 1980 and 1985 andshow anticipated growth rates.
On the demand side cansideration has been given to existing percapita consumption and the effects of taste and income changes.Available information on income and price elasticities has been used.
On the supply side, extrapolations have been made frorn pasttrends on hectarage and yields.
The results have been adjusted to take account of Coun tryproduction targets and ihe likelihood of their achievement, ithe

The World Tea Market 65
Figure 3. Annual Average Tea Prices at London Auctions, SelectedCountries, 1955-75
8001 1 1 1 i I I I I I I I I l l I
Sn Lanka
70 A
740#'o Vndia (North)
Average, all tea
60
50 enya
40
30
20
10
O l. l l l l l1955 60 65 70 75
YearSource: Table 21.

Table I. Annual Average Tea Prices for Selected Countries at London Auctions, by Year, 1955-75(U.S. cents a pound)
India
Year North South Sri Lanka Kenya Malawi Uganda Tanzania Average, all teas
1955 74.2 62.5 75.1 52.1 52.3 59.4 64.6 71.01956 71.3 59.6 77.2 49.7 43.8 49.8 54.7 67.71957 66.0 52.6 68.0 48.0 43.7 50.3 51.9 62.11958 68.7 53.6 69.1 54.2 45.1 51.3 55.8 64.31959 67.7 51.8 70.9 54.7 41.3 49.4 54.4 63.6
1960 69.1 55.6 69.9 59.7 46.4 55.1 55.6 64.41961 65.3 54.1 64.6 58.4 47.0 54.9 58.0 61.71962 70.7 51.4 65.2 62.7 40.6 54.1 58.9 62.21963 64.9 50.6 61.0 56.8 40.9 51.4 53.6 59.11964 63.6 .53 5 62.7 59.3 39.1 51.8 55.4 59.9

1965 61.0 52.2 59.7 57.4 47.5 54.1 56.8 58.41966 60.8 47.9 59.3 58.8 42.9 52.7 57.2 56.91967 61.9 48.9 60.2 60.0 41.9 55.7 57.9 57.41968 48.7 42.2 43.8 48.7 40.6 43.0 46.3 47.41969 45.2 34.4 48.4 48.1 28.0 40.0 43.4 44.1
1970 50.8 44.0 51.1 52.9 43.3 50.9 52.7 49.71971 46.4 44.0 50.0 52.2 43.6 48.1 50.1 47.81972 48.7 43.0 52.1 49.4 42.4 46.5 47.3 47.81973 50.8 42.3 50.7 49.5 42.0 46.7 47.4 48.31974 64.2 58.7 64.0 68.6 58.7 64.6 63.9 63.61975 64.1 58.5 63.6 66.3 57.7 62.1 65.0 62.9
Note: Figures have been converted from aninual average London auction prices to U.S. cents a pound at the annual average exchange rates between the pouindsterling anid the U.S. dollar.
cS Sources: International Tea Committee, Annual Bulletin of Statistics (London, various issues) and Monthly Statistical Summanry (London, various issues); and Tea Broker's" Association of London, Tea Market Report (Lonidon, various issues).

Table 22. Summary of Tea Production, Consumption, and Trade, 1955-57, 1967-69, and 1973, with Projections to 1980 and 1985
Actual Projected Percentage annual growth rates
1955-57 1967-69 1973 19801955-57 1967-69 1973 1980 1985 to to to to
Item (thousands of metric tons) 1973 1973 1980 1985
Production
Developed countries 73.7 114.4 135 163 187 3.6 3.4 2.7 2.8Developing countries 614.6 855.6 1,014 1,233 1,422 3.0 3.5 2.8 2.9
Subtotal 688.3 970.0 1,149 1.396 1,608 3.1 3.4 2.8 2.9
Centrally planned economies 142.0 221.2 295 380 451 4.4 5.9 3.7 3.5
Total 830.3 1,191.2 1,444 1,776 2,059 3.3 3.9 3.0 3.0
Apparent Consumption
Developed countries 435.8 517.2 524 551 572 1.1 0.3 0.7 0.8Developing countries 255.8 456.0 625 839 1,020 5.4 6.5 4.3 4.0
Subtotal 691.6 973.2 1,149 1,390 1,592 3.0 3.4 2.8 2.8
Centrally planned econornics 118.6 224.0 287 376 455 5.3 5.1 4.0 3.9
Iotal 8t102 1,197.9 1,436 1,766 2,047 3.4 3.7 3.0 3.0

Exportsa
Developed countries 12.0 8.1 20 30 36 3.1 19.8 6.0 3.6Developing countries 449.0 559.0 616 736 835 1.9 2.0 2.6 2.6
Subtotal 461.0 567.2 636 765 871 1.9 2.3 2.7 2.6
Centrally planned economies 38.8b 26.4 71 97 123 3.6 22.0 4.5 4.9
Total 492.0 593.6 707 862 994 2.2 3.6 2.9 2.9
Importsc
Developed countries 377.8 416.5 409 430 440 0.5 -0.4 0.9 0.5Developing countries 105.5 155.1 227 327 413 4.6 7.9 5.4 4.8
Subtotal 483.3 571.6 636 757 853 1.6 2.2 2.5 2.4
Centrally planned econlomlies 15.6 29.2 63 104 140 8.6 16.6 7.4 6.1
World total 498.9 600.8 699 861 993 2.0 3.1 3.0 2.9
U: Note: Figures may not add to totals becauise of rounding at various stages of aggregation.a. Sum of net expor-ts of cxporting countries ini eacrl group, unless otherwise specified.b. tIotal exports.c. Sum of net imports of importing countries in each grouip.Sources: FAO, Tea Statistics (Rome, 1967); Commodity Review and Outlook (Rome, various issucs); Document CCP:TEP 73/6 (Rome, May 1973); Document CCP:TE 74/
EXPO 7/2 (Rome, April 1974); Inteinational Tea Committee, Annual Bulletin of Statistics (London, various issues); and World Bank, Price Forecasts for Major PrinmaryCommodities, report no. 814 (Washington, D.C., July 1975).

70 COFFEE, TEA, AND COCOA
incentives and disincentives related to tax structures, and the availa-bility of fertilizers.
Demandforecasts
World demand for tea is expected to grow at an average annual rateof 3 percent until 1985. [n all major consuming areas, the growth ofdemand will be slower than during the past two decades, reflectingthe effect of high prices and slower income growth.
Increase in domestic consumption in developing countries isexpected to experience a declining rate which levels off at arounid 4percent a year during the projection period, compared vwith 5.4percent during the period 1957-73. This is expected to be accom-panied by a 2.6 percent annual rate of tea exports from thedeveloping countries, compared with the historical rate of 1.9percent.
Tea is still a comparatively cheap drink in developed countries,where it competes with many substitute beverages. Encouragecd byaccelerated promotional efforts, tea consumption in developed coun-tries is expected to increase at approximately 0.8 percent a year inthe projection period, or slightly less than the historical 1.1 percent.
In countries with centrallv planned economies, it is estimated thatthe average annual growth rate of tea consumption will decreasefrom 5.3 percent during the last two decades to 3.9 or 4.0 percent inthe projection period. Part of the reason for the apparent slowdownis the fact that 1973 had a larger consumption base than 1955-57 forcalculating percentage growth rates.
Supply forecasts
The projected increase of world tea production by about 3 percent ayear in 1973-85 is slower than the 3.3 percent average of theprevious two decades. The projection takes account of shortages ofessential inputs such as fertilizers, as well as the resultant squeeze onproducers' profits. Attrition of some areas under tea is also antici-pated in the light of increased competition for land for use in fDodproduction. 7 In this connection, 1974 may have represente(d aturning point in the supply of tea, which some experts believe mnaygradually change from a surplus to a deficit commodity.
7. These trends, if confirms d, should facilitate the progressive implementationof international measures to regulate trade in tea with a view to maintaining inorestable and remunerative prices.

The World Tea Market 71
Exports, however, are projected to grow more rapidly than before,by 2.9 percent a year during the projection period, compared with2.2 percent in 1955-1973. This would reflect the reduced rate ofincrease of consumption in developing countries.
Price forecasts
After more than a decade of relative stability, tea prices at Londonauctions jumped over 30 percent in 1974 to an average of 63.6 centsa pound, up from 48.3 cents a pound in 1973. Major contributingfactors included inflation resulting from higher costs for fuel,fertilizer, packaging, and transport-as well as poor crops, particu-larly in Sri Lanka. On the demand side, economies during recessionin a number of countries appeared to be turning people to tea, thecheapest drink except for water.
International inflation is expected to affect future tea pricesmainly through higher costs of production, processing, and trans-port. In the long term, tea prices sufficient to maintain profitabilityof production from marginal areas are estimated to stay at about 38cents a pound in 1973 constant terms. The market price in 1980would be about 74 cents a pound at estimated rates of inflation.
MARKET SHARES AND THE SCOPE FOR INTERNATIONAL ACTION
In the mid-1930s the members of an International Tea Agreementsucceeded in keeping prices up to about 75 to 80 percent of theirpredepression level. At a meeting in Mauritius in 1969 an agreementwas reached by major tea-exporting countries to establish voluntaryexport quotas. Efforts to organize the tea market have againgathered new momentum recently. The FAO IntergovernmentalGroup on Tea met in June 1974 and supported a recommendationby its Sub-Group of Exporters to set up a working party to reviewthe feasibility of proposals for a multidimensional international teaagreement. These include (a) a minimum export price arrangement;(b) coordination and regulation of marketing to avoid building upstocks in importing countries that would have depressing effects onprices; (c) intensification and coordination of global promotion,including the development of new markets; (d) rationalization ofmarketing to achieve the most favorable prices, with special refer-ence to the feasibility of expanding auctions in producing countries;and (e) provisions for an independent market intelligence service for

72 COFFEE, TEA, AND COCOA
tea-exporting countnres clesigned to provide up-to-date and regularinformation about market developments and the future outlook forvarious types of tea.
Because of the low overall elasticity of world import demand fortea, all producers could increase their earnings by restricting output.The potential advantages of such a course are substantial: a 2percent reduction of world export volume would raise the interna-
Table 23. Price Elasticity of Demarnd for Exports of Tea, Market Share.,and per Capita GNP, Selectel Countries, 1967-69
Price offset to Per capitavolume changeb Elasticity of Market share GNP, 1970
Exporting country (per.-ent) demandc (percent) (U.S. dollars)
India 53 1.9 32.2 Ito
Sri Lanka 43 2.3 34.1 110
Indonesia 6 16.5 4.8 80
Kenya 5 18.5 4.3 150
China, Republic of 4 24.8 3.2 390
Bangladesh 4 26.5 3.00 100"
Malawi 3 29.6 2.7 80
Mozambique 3 33.3 2.4 240
Argentina 3 36.3 2.2 1,160
Uganda 3 39.9 2.0 130
Turkey 2 60.2 1.3 310
Za'ire 2 66.6 1.2 90
Tanzania 1 72.6 1.1 100
Others 5.5
World 233 0.43 100.0
a. Includes all World Bank members with shares of the export market greater than Ipercent.
b. Reciprocal of the price elastiuity of demand (second column). Measures the extent towhich an increase in volume of tea exports will be offset by an associated price decline.
e - ERc. Price elasticity of demand for exports from each country is calculated as equal to
where e is the price elastidty of demand for world exports of tea; E is the pnce elasticity ofsupply of world exports of tea, ;ssociated with potential diversion to or from domesticconsumption in the producing countries; R is the share of the others in conisumption bv allproducng countries; and S is the share of the country in the export market. Values of -0.43for e and 0.37 for E are derived from recent estimates by FAO staff. Alternative valuesavailable from other sources and a broader definition of E do not significantly alter the resultsfor the purpose of this paper.
d. Estimated. East Pakistan, now Bangladesh, supplied West Pakistan duririg this period.e. Estimate for Pakistan; separate data not available for East Pakistan, now Bangladesh.Sources: Elasticities of demand, World Bank; per capita GNP, World Bank Atlas (Washington,
D.C., 1972).

The World Tea Market 73
tional price by about 5 percent and would thus increase the earningsof exporting countries by the difference, about 3 percent.
The bargaining positions of individual countries are stronglyrelated to their market shares. This is illustrated in table 23, in whichthe price elasticities of demand for the tea exports of individualcountries are shown. The reciprocals of these elasticities (expressedas percentages in the first column of table 23) show the proportionof any increase in volume which is offset by a decline in price. Figure4 illustrates some of the data from this table.
In the case of India and Sri Lanka, about half of any increase inexport volume will be offset by an associated price decline. For allother countries the offset is less than 10 percent. For India and SriLanka the offset is likely to exceed any probable economic return,after costs are allowed for. Given the low elasticity of world importdemand, it follows that investments to increase tea production forexport would not be beneficial to these countries.8
Countries with large shares of the tea market could benefitsubstantially by reducing them. Theoretically such a process ofreduction could continue to the point at which other cost considera-tions became relevant. But that point is a long way off: the effects onIndia and Sri Lanka of their present large market shares are muchgreater than any plausible advantage in other costs. There is roomfor a substantial decline in their market shares while smaller onesexpand. Such counterbalancing movements of expansion and de-cline bear no relation to comparative advantage as it is conventionallyunderstood. 9
Adjustment of market shares is in fact taking place through therapid expansion of exports by the smaller producing countries, whileIndia and Sri Lanka hold their export volumes roughly constant.Expansion in East Africa has been facilitated by new methods ofproduction, particularly the use of vegetative propagation, withwhich yields can be increased threefold over those from seedplantings. The major contribution to the expansion of tea produc-
8. Diversification out of tea can be advantageous to countries with large marketshares. A decline in the aggregate volume of tea exports, resultinlg from diversifi-cation, yields an offsetting rise in price, which benefits the remaining teaproducers in the same country. Encouraging domestic consumption of tea in thesecountries may also vield significant benefits.
9. If India or Sri Lanka were each subdivided into small separate regions,with no other change in tea production, competitive positions relative to other teaproducers might change sharply: some of the separate countries might be foundto have the advantage in price and therefore for growth.

74 COFFEE, TEA, AND COCOA
Figure 4. Elasticity of Demand and Market Shares of Tea-ExportingCountries
60 __II
India0
5C
Sri Lanka
40
30a
aL,
20
I10
Indonesia
All others
0 _ I10 20 30 40
Shares of export market (percent)
a. The extent to which an increase in volume X of a country's exports of tea will be offsetby an associated decline in prce. (This is the reciprocal of the price elasticity of dernand.)Source: Table 23.

The World Tea Market 75
tion in these countries has been by smallholders, using new hectar-ages as well as land previously under other crops.
In East Africa the great majority of tea bushes are less than fiftyyears old. By contrast, 30 percent of those in India are estimated tobe more than fifty, and thus declining in productivity, and another40 percent are between thirty and fifty. Government measures havebeen introduced to stimulate replanting, but their total impact hasbeen small. In Sri Lanka, about 60 percent of the bushes areestimated to be between seventy and eighty years old. Loan subsidyschemes for replanting were introduced but have affected only asmall proportion of the total area. Results from vegetative propaga-tion can be as good in Asia (where the method originated) as inAfrica, but conversion is expensive and the majority of Asiangrowers have not made the change.
Large increments to supply in one tea-exporting country or regioncan benefit the rural poor in that area at the expense of those inanother. Continued rapid expansion of tea production, which islikely to accelerate the decline in international prices, will have moreserious adverse effects on some growers than on others. In the Asianexporting countries tea yields are generally lower on smallholdingsthan on estates, and poorer producers there may be the first tosuffer from a decline in international prices. Bv contrast, smallholdertea production in East Africa is characterized, in general, by moderntechniques; thus, yields on African smallholdings are higher than onthe estates, most of which tend to have older bushes and a higherproportion of fixed costs. Production on smallholdings has remainedprofitable despite the low international prices of recent years.
An important obstacle to the negotiation of a new internationalagreement is the divergence of views between the large, long-established producers and the newer exporting countries. Theformer do not wish to reduce their export volumes, while the latteradd to the total in amounts larger than the market can handle. Asalready mentioned, a drop in the tea export volumes of India andSri Lanka could be advantageous to the smaller producers. Incombination with a slowdown in the growth rate of tea productionby those with smaller market shares, diversification out of tea by thelarger producers may be a precondition for an effective internationalagreement.

4
THE WORLD COCOA MARKETr
COCOA CAN BE GROWN only in tropical climates, normallyat altitudes of less than 1,000 feet above sea level.' The tree begins tobear on a commercial scale after five years, attains its maximum yieldafter ten to fifteen years, ancd continues to bear until it is fifty Ito siLxtyyears old. A crop year for cocoa runs from October of one year toSeptember of the next.
The true quality of cocoa can be assessed only when it is made intochocolate.2 Fermentation of cocoa beans is essential to the develop-ment of flavor. After drying, beans can be stored for as long astwelve months in the tropics and for three years in temperateclimates.
PROEtUCTION AND EXPORTS
While cocoa is produced only in certain tropical developing coun-tries, it is consumed mainly in the industrialized countries. Bothproduction and consump:ion are characterized by a high degree ofgeographical concentration. Five countries-Ghana, Nigeria, Brazil,the Ivory Coast, and Carneroon-account for nearly four-fifths ofworld production and exports (see tables 24 and 25).
World cocoa production has grown at a long-term average annual
1. Unless otherwise specified, the term "cocoa" as used here refers to cocoabeans only.
2. Chocolate used to be most popular as a beverage and is still classified as su<ch,though most of it is now consumed in solid form.
76
The World Cocoa Market 77
rate of 3.3 percent since World War II. The rapid growth of outputin the early 1960s (see table 26), which reached a record level of1,509,000 metric tons in the crop year 1964/65, was attributed to acombination of favorable weather conditions, previous hectarageexpansion, and extensive technical developments.' The price ofcocoa dropped to a record low in 1965. Four years of deficit supplyfollowed, caused partly by excessive rain in 1965/66 and 1968/69,and also by the termination of a subsidy for spraying in Ghana in1966. In 1969/70 world production rose to 1,433,000 metric tons,with large harvests in West Africa that resulted chiefly from newplantings and improved technology in the Ivory Coast and Came-roon. Production levels in Brazil and the Dominican Republic alsoincreased considerably. Production continued to grow in 1970/71and exceeded the 1964/65 record in 1971/72, as a result of favorableweather conditions. The 1972/73 and 1973/74 crops fell off substan-tially because of poor weather in the main West African-producingcountries.
By far the greater part of cocoa output enters international trade.The volume of world cocoa exports has grown at a long-termaverage rate of 2.4 percent a year over the past twenty-five years.Exports are still mainly in the form of beans, but an increasingamount has been shipped as intermediate products, reflecting thegrowth of domestic processing industries.4 In recent years intermedi-ate products accounted for about 17 percent oF cocoa exports,compared with 8 percent in 1957-61 (see table 25).
Although the volume of world cocoa exports grew during the1950s by 2.3 percent a year, there was little gain in value-onaverage, only 0.1 percent a year. This was because of an annualaverage decline in unit values of 2.2 percent (see table 27). Duringthe 1960s, value grew by 3.3 percent a year, somewhat faster thanvolume. Unit values grew correspondingly, by 0.5 percent. Exportvalue gained substantially in the early 1970s, at an average rate of 7.9percent annually, while export volume grew by only 1.7 percent andunit value by 6.1 percent. Figure 5 shows the relation betweenexport volume, value, and unit value. It illustrates how, in general,value and unit value of exports move in the same direction, while
3. Extensive cutting out of trees infected by swollen shoot disease, mainly inGhana, replanting with high-yielding stock, and control of capsid disease by massspraying, particularly in Ghana and Nigeria.
4. Cocoa products include cocoa butter, paste, powder or cake, and chocolateand chocolate products (including milk crumb).

Table 24. World Production and Exports of Cocoa Beans
Item Ghana Nigeria Ivory Coast Cameroon Brazil Other countries World total
Part A. ProductionVolume (thousands oJ metnic tons, yearly average)
co 1947-51 241.4 99.6 45.2 46.0 127.8 158.0 718.01957-61 299.6 137.3 66.2 70.5 163.6 221.0 958.21967-71 390.4 244.5 160.2 100.5 173.4 299.6 1,368.61973 415.7 241.1 185.0 106.9 158.7 298.6 1,406.0
Percentage share in world total
1947-51 33.6 13.9 6.3 6.4 17.8 22.0 100.01957-61 31.3 14.3 6.9 7.4 17.1 23.1 100.01967-71 28.5 17.9 11.7 7.3 12.7 21.9 100.01973 29.6 17.1 13.2 7.6 11.3 21.2 100.0
Rate of growth (percent a year)
1947-51 to 1957-61 2.2 3.3 .1.9 4.4 2.5 3.4 2.91957-61 to 1967-71 2.7 5.9 9.2 3.6 0.6 3.1 3.61947-51 to 1967-71 2.4 4.6 6.5 4.0 1.5 3.2 3.31967-71 to 1973 1.6 -0.4 3.7 1.6 -2.2 -0.1 0.7

Part B. Exports
Volume (thousands of metric tons, vearly average)
1947-51 234.7 107.2 48.5 44.4 106.2 121.8 662.81957-6J 287.7 142.9 65.5 57.2 104.5 158.2 816.01967-71 319.5 219.7 127.1 72.2 109.7 226.2 1,074.51973 422.1 213.9 142.9 86.5 82.8 201.8 1,150.0
Percentage share in world total
1947-51 35.4 16.2 7.3 6.7 16.0 18.4 100.0
1957-61 35.3 17.5 8.0 7.0 12.8 19.4 100.01967-71 29.7 20.4 11.8 6.7 10.2 21.1 100.01973 36.7 18.6 12.4 7.5 7.2 17.6 100.0
Rate of growth (percent a year)
1947-51 to 1957-61 2.1 2.9 3.0 2.6 -0.2 2.7 2.11957-61 to 1967-71 1.0 4.4 6.9 2.4 0.5 3.6 2.81947-51 to 1967-71 1.6 3.6 4.9 2.5 0.2 3.1 2.41967-71 to 1973 7.2 -0.7 3.0 4.6 -6.8 -3.7 1.7
Note: Figures may not add to totals because of rounding.Source: FAO, Cocoa Statistics (Rome, var-ious issues).

Table 25. Export Value of Cocoa Beans and Products, Selected Countries, and Share in World Totalsand in National Export Earnings
Percentatge shar e in countqy's exportValue Percentage share in world total earn ings
Caountry 1957-61' 1967-71' 1973 195761" 1967-71' 1973 1957-61" 1967-71a 1973
Brazill3eanls 68.7 70.1 88.5 12.5 8.6 7.7 5.2 3.0 1.4Products 25.9 29.8 55.0 4.7 3.7 4.8 2.0 1.3 0.9Subtotal 94.6 99.9 143.5 17.2 12.2 12.5 7.2 4.3 2.3
Camiier-oo0iEcans 315.3 49.6 79.8 6.3 S.i 7.0 35.3 24.5 22.7Products 4.4 15.6 19.8 0.8 1.9 1.7 4.4 7.7 5.6Subtotal 39.7 65.2 99.6 7.2 8.0 8.7 39.7 32.2 28.3
co Dominican RepublicBeans 13.6 35.4 19.5 2.5 1.9 1.7 9.1 8.0 4.4Products 7.4 0.4 3.5 1.3 - 0.3 4.9 0.2 0.8Subtotal 21.0 15.8 23.0 3.8 1.9 2.0 14.0 8.2 5.2
EcuadorBeans 19.6 26.9 27.2 3.6 3.3 2.4 14.5 12.8 4.9Products - 2.6 7.7 - 0.3 0.7 - 1.2 1.4Subtotal 19.6 29.5 34.9 3.6 3.6 3.0 14.5 14.1 6.3
GhanaBeans 177.9 198.6 339.8 32.4 24.3 29.7 65.2 60.5 57.9Products 2.2 28.2 35.2 0.4 3.5 3.1 0.8 8.6 6.0Subtotal 180.1 226.8 375.0 32.8 27.8 32.8 66.0 69.1 63.9
Ivory CoastBeans 36.6 81.8 124.7 6.7 10.0 10.9 24.4 19.2 14.6Products - 18.( 4.5 - 2.2 3.0 - 4.2 4.0Subtotal 36.6 99.8 159.2 6.7 12.2 1'3.9 24.4 23.4 18.6

MexicoBeans 2.2 3.1 5.5 0.4 0.4 0.5 0.3 0.2 0.2
Products 0.2 3.09 6.4 - 0.4 0.6 - 0.2 0.3
Subtotal 2.4 6.1 11.9 0.4 0.7 1.1 0.3 0.4 0.5Nigeria
Beans 90.4 166.4 170.8 16.5 20.4 14.9 21.0 16.0 5.1
Products - 15.6 31.2 - 1.9 2.7 - 1.5 0.9
Subtotal 90.4 182.0 202.0 16.5 22.3 17.6 21.0 17.5 6.0
Papua New GuineaBeans 2.8 15.1b 14.8 0.5 1.9 1.3 8.5 16.1 2.9
Products - - - - - - - -
Subtotal 2.8 15.1 14.8 0.5 1.9 1.3 8.5 16.1 2.9Togo
Beans 4.9 14.6 16.0 0.9 1.8 1.4 31.0 33.2 26.2Products - - - - - - - - -Subtotal 4.9 14.6 16.0 0.9 1.8 1.4 31.0 33.2 26.2
Other countriesBeans 55.8 60.4 63.4 10.2 7.4 5.6 n.a. n.a. n.a.Products 1.4 0.8 - 0.3 0.1 - n.a. n.a. n.a.
Subtotal 57.2 61.2 63.4 10.4 7.5 5.6 n.a. n.a. n.a.Total, all above countries
Beans 507.8 702.0 950.0 92.5 86.0 83.1 n.a. n.a. n.a
Products 41.5 114.0 193.3 7.6 14.0 16.9 n.a. n.a. In.a.
Total 549.2 816.0 1,143.3 100.0 100.0 100.0 n.a. n.a. n.a.
- Nil or negligible.n.a. Not available.Note: Figures may not add to totals because of rounding.a. Annual average for period.b. Four-year averatge, 1967-70.Sources: FAO, Cocoa Statistics UJanuary issues 1967, 1969, 1975); U.N., Year-book of ntemrnational Trade Stali/tic.i (New York, 1961), and Monthly Bulletin of Statistics (New
York, various issues); FAO, Trade Yearbook (Romc, 1973).

Table 26. World Summary of Cocoa Production, Grindings, Stocks, Prices, Exports, and Imports, 1946-75
Stocks at Stocks at end Number of Spot priceuGCraw World Net vorld beginning of T'otal of period month.s' supply (U.S. cents Worldproduction Productiona beriod aovdilbiliot ((r4nd-r51 14--) 6 - 51) x 12 a pvu.u) i''oe1e L/ iris!
Crop year (1) (2) (3) (4) (5) (6) (7) (8) (9) (10)
GO 1946/47 623 617 203 820 660 160 2.9 34.9 580 588< 1947/48 599 593 160 753 627 126 2.4 39.7 591 566
1948/49 783 775 126 901 689 212 3.7 21.6 722 6821949/50 769 761 212 973 772 201 3.1 32.1 747 7311950/51 814 806 201 1,007 769 238 3.7 35.5 673 662
1951/52 651 644 238 882 737 145 2.4 35.4 619 6231952/53 811 803 145 948 789 159 2.4 37.1 730 7011953/54 788 780 159 939 764 175 2.8 57.8 695 6991954/55 815 807 175 982 737 245 4.0 37.5 700 6861955/56 855 846 245 1,091 811 280 4.1 27.3 751 731
1956/57 911 902 280 1,182 901 281 3.7 30.6 785 7981957/58 786 778 281 1,059 879 180 2.5 44.3 636 6581958/59 923 914 180 1,094 874 220 3.0 36.6 749 7541959/60 1,053 l ,049 220 1,262 922 34() 4.4 28.4 896 8711960/61 1,189 1,177 340 1,517 1,004 513 6.1 22.6 1,017 996

1961/62 1,140 1,129 513 1,642 1,100 542 5.9 21.0 1,037 1,0211962/63 1,176 1,164 542 1,706 1,151 555 5.8 25.3 1,039 1,0271963/64 1,234 1,222 555 1,777 1,189 588 5.9 23.4 1,035 1,0341964/65 1,506 1,491 588 2,079 1,301 778 7.2 17.3 1,304 1,2211965/66 1,226 1,214 778 1,992 1,375 617 5.4 24.4 1,110 1,171
1966/67 1,351 1,337 617 1,954 1,388 566 4.9 29.1 1,080 1,0991967/68 1,354 1,340 566 1.906 1,406 500 4.3 34.4 1,052 1,0661968/69 1,236 1,224 500 1,724 1,369 355 3.1 45.7 996 1,0251969/70 1,435 1,421 355 1,776 1,356 420 3.7 34.2 1,119 1,0961970/71 1,496 1,481 420 1,901 1.420 481 4.1 26.8 1,186 1,208
1971/72 1,580 1,564 481 2,045 1,521 524 4.1 32.3 1,223e 1,251'1972/73 1,398 1,384 524 1,908 1,615 293 2.2 64.4 1,102 1,14201973/74 1,443Y 1,429' 293 1,722e 1,478e 244e 2.oe 98.1 ii.a. n.a.
0o 1974/75 1,504e 1,489e 244e 1,7330 1,387e 346e 3.0e n.a. n.a. n.a.
n.a. Not available at the time of wviiting.a. After adjustment for sveight loss.b. Cocoa beans, fair fermented main crop Ghana, New York quotatiDn for immediate delivery; average foi the calendar year in which the crop year ends.c. World net exporLs from prodlucing cotintries; average for the calendar year iri which the crop year ends.d. World net imports; average for the calendar year in which the crop year ends.e. Estimate or provisional figure.Source: Gill & Duffus Group Ltd., Cocoa Slatistics (Londoni, May 1975).

Table 27. Export Volume and Total and Unit Value of Cocoa Beans
Average annual change (percent)
1950-54 to 1957-61 toItem and country 1950-54 1957-61 1967-71 1973 1957-61 1967-71 1967-71 to 1973
Volume (thousands of metric tonrdse Ghana 235.66 287.73 319.53 422.1 2.9 1.05 7.2
Nigeria 109.57 142.94 219.66 213.9 3.9 4.4 -0.7Ivory Coast 58.21a 65.49 127.14 142.9 2.0b 6.9 3.0Caineroon 50.83 57.15 72.23 86.5 1.7 2.4 4.6Brazil 103.21 104.47 109.72 83.8 0.2 0.5 -6.8Other countries 136.46 158.24 226.20 201.8 2.1 3.6 3.7
World total 694.02 816.02 1,074.02 1,150.0 2.3 2.8 1.7
Total value (millions of U.S. dollars)
Ghana 172.58 177.90 198.60 339.75 0.4 1.5 14.4Nigeria 80.16 90.45 166.39 170.80 1.7 6.3 0.7Ivor-y Coast 43.60a 36.60 81.75 124.66 -2.9k 8.4 11.1Cameroon 35.62 35.34 49.45 79.79 -0.1 3.45 12.7Brazil 79.91 68.73 70.11 28.52 -2.1 0.2 6.0Other countries 92.53 98.82 135.52 146.48 0.9 3.2 2.0
Wotild Lotai 504.40 507.84 701.96 950.00 0.1 3.3 7.9

Unit valueC (ULS. cents a pound)
Glhana 33.2 28.0 28.2 36.5 -2.4 +0.1 6.7Nigeria 33.2 28.7 34.4 36.2 -2.1 +1.8 1.3Ivory Coast 34.0a 25.3 29.2 39.6 -4.8b +1.4 7.9Cameroon 31.8 28.0 31.1 41.8 -1.8 +1.1 7.7Brazil 35.1 29.8 29.0 48.5 -2.3 -0.3 13.7Other countries 30.8 28.3 27.2 32.9 -1.2 -0.4 4.9World total 33.0 28.2 29.6 37.5 -2.2 +0.5 6.1
a. Thr-ee-year average for 1952-54.b. 1952-54 to 1957-61.c. Value divided by volume.Source: FAO, Cocoa Statistics (Rome, various issues).
00

ODFigure 5. Volume, Total Value, and Unit Value of World Exports of Cocoa Beans, 1950-73
21,201 0 1 1 120
Ya 1,000O-A101,200 Volum (left sca~~~~~~~~~otl aue(lftscle.N~~~~~~~~~~~~~~~
1,00o~~~~~~~~~~~~~~~~~~~~~~~~~~
80eWr ak..
200 ~ ~ ~ ~ _ _ __ 20
>
1950 52 54 56 58 60 62 64 66 68 70 72 74 Year
Sourre. World Banik data.0

The World Cocoa Market 87
volume and value move in opposite directions. This reflects the lowprice elasticity of demand for cocoa, which is discussed below.
The share of African countries in the cocoa market has increasedsubstantially, especially between 1967/69 and 1973. That of Ghana,the world's largest producer and exporter (with roughly 30 percentof world exports in recent years), has been gradually declining sincethe late 1940s, but over the same period increasing shares have goneto Nigeria (recently about 20 percent) and the Ivory Coast (about 12percent). There has been a sharp decline in the share of LatinAmerica, particularly in that of Brazil, which has been about 10percent in recent years.
Table 25 gives the share of' cocoa in the total export earnings ofselected producing countries. With the exception of Mexico, allreduced their dependence on cocoa between 1957/61 and 1973. Inmost cases this trend reflects an ability to diversify into otherexportable commodities, but it may also be explained by the histori-cally poorer long-term price performance of cocoa compared withthat of other exportables.
IMPORTS AND CONSUMPTION
The volume of world imports increased by about 2.3 percent a yearduring the 1950s and by nearly 3 percent during the 1960s (see table28). In 1970, Western Europe and North America together ac-counted for about four-fifths of world imports of' cocoa beans, andEastern Europe for more than 10 percent (see table 29). Shares ofthe former have been declining while those of the latter haveincreased rapidly, and shares of the developing countries haveremained roughly constant. The declining share of industrializedcountries in North America and Western Europe has resulted partlyfrom a rise in their imports of intermediate products.
The United States is the largest importer of cocoa, accounting forabout 22 percent of the world market in 1973. It is followed by theFederal Republic of Germany, with about 13 percent during thesame year, the Netherlands, with about 10 percent, and the UnitedKingdom, with about 8 percent. Since 1957-61 the share of theUnited States has declined from 30 percent and that of the UnitedKingdom from 11 percent. Combined shares of' the Soviet Unionand other East European countries doubled, from approximately 9percent in 1957-61 to more than 18 percent in 1973 (see table 28).
Consumption of cocoa in importing countries is often measured in

Table 28. Imports of Cocoa Beans, Selected Countries, 1957-61, 1967-71, and 1973
Annual average imports (thousands of metric Rate of changetons) Percentage share in world total (percent)
1957-61 toC(ounthy 1957-61 1967-71 1973 1957-61 1967-71 1973 1967-71
Canada 13.7 16.8 15.7 1.6 1.5 1.3 2.1United States 249.9 269.1 251.9 29.9 24.2 21.5 0.7
Belgium 11.4 17.6 19.0 1.4 1.6 1.6 4.4France 57.5 42.6 42.0 6.9 3.8 3.6 -3.(Germany, Federal Republic of 108.3 135.1 151.6 12.9 12.2 13.0 2.2Italy 28.2 42.1 42.9 3.4 3.8 3.7 4.1Neieliailds 81.3 113.7 119.2 9.7 10.2 10.2 3.4
w Norway 4.0 5.0 4.8 0.5 0.4 0.4 2.3oo Switzerland 13.0 15.9 18.8 1.6 1.4 1.6 2.0
United Kingdom 94.8 87.1 95.0 11.3 7.8 8.1 -0.9
Australia 11.2 14.1 13.0 1.3 1.3 1.1 2.3Japan 9.0 34.7 38.9 1.1 3.1 3.3 14.4
Colombia 7.3 11.2a 8.0 0.9 1.0 ' 0.7 4.4
Soviet Union 34.6 105.5 119.1 4.2 9.5 10.2 11.8Other Eastern EuLope 37.4 80.7 94.4 4.5 7.3 8.1 8.0
Other countries 75.4 118.6 135.6 9.0 10.7 11.6 4.6
World total 836.9 1,109.7 1,169.9 100.0 100.0 100.0 2.9
Note: Figures may not add to totails because of rouniding.a. Four-year average, 1967-70, inclusive.Source: FAO, COcoQ Statistics (Romrie, various issues).

7The World Cocoa Market 89
Table 29. Trade in Cocoa Beans by Main Areas of Origin and Destination, 1970
Origin
Item and destination West Africa Brazil Others Total
Volume (thonsands of metric tons)North America 165 61 69 295Western Europe 499 17 58 574Eastern Europe 82 35 8 125Others 58 11 18 86Total 804 124 153 1,080
Percentage share of wnorld totazlNorth America 15 6 6 27Western Europe 46 2 5 53Eastern Europe 8 3 1 12Others 5 1 2 8['Total 74 12 14 100
Note: Figures may not add to totals because of rounding.Source: Adapted, with additions, from United Nations Conference on Trade and Develop-
ment (UNCTAD) ((Geneva, January 9, 1975), p. 4.
terms of grindings. By 1973, however, about 22 percent of grindingstook place in exporting countries, as compared with about 9 percentin 1947-51 (see table 30). A more accurate measure of cocoaabsorption is apparent consumption, which is calculated by adjustingnet imports of beans or grindings for net trade in cocoa products,converted into bean equivalent by weight.5 By this measure, theseven countries with the largest total consumption in 1972 were, indescending order, the United States, the Federal Republic of Ger-many, the Soviet Union, the United Kingdom, France, Japan, andCanada (see table 31). In order of per capita consumption, however,the leading seven were Switzerland, the Federal Republic of Ger-many, Belgium, the United Kingdom, Canada, Norway, and theUnited States. The Netherlands, which is shown in table 30 to be oneof the four largest consumers, does not rank high in apparentconsumption because it specializes in the trade of intermediateproducts.
5. 'IThe standard (net) conversion factors are, for cocoa butter, 1.13; cocoa pasteand nibs, 1.25; cocoa powder and cake. 1.18; chocolate, 0.50; and milk crumb0.154.

Table 30. Cocoa Bean Grindings by Country, 1934-38 to 1973(Thousands of metric tons)
Countiy 1934-38a 1947-5 1 1952-56a 1957-61 a 1962-66a 1967 61a 1972 1973
Developed countries
France 43.0 56.7 47.6 ' 5.° u4.; 45.1 48.0 47.3Germany, Federal Republic of 76.0b 25.9 75.2 102.0 140.0 133.8 138.8 152.3
c Italy 9.1 9.5 17.6 27.9 38.5 42.0 40.5 42.9° Japan 1.6 0.2 3.6 8.9 29.4 33.6 36.1 38.0
Netherlands 59.0 44.7 57.7 79.6 109.2 113.8 124.4 122.6United Kingdomn 91.0 118.0 107.6 87.5 97.8 89.6 97.7 106.8United States 242.8 263.0 221.4 222.9 272.8 279.6 289.0 278.5Others 72.4 91.2 89.7 111.4 149.8 167.9 181.5 177.4
Subtotal 594.9 609.2 620.4 696.0 901.6 905.4 956.0 965.8
Producing developing countries
Brazil 10.0 22.0 28.1 55.6 49.6 60.8 89.0 91.5Cameroon - - 3.0 7.2 12.7 25.0 33.0 28.0Ghana - 2.0 5.6 4.8 34.8 48.1 51.6 49.9Ivory Coast - - - - 5.8 31.5 38.5 32.0Nigeria - - - - - 18.7 26.0 27.0Others 29.2 42.9 60.6 73.1 90.1 92.0 103.4 102.7
Subtotal .39.2 66.9 97.3 140.7 193.0 276.1 341.5 331.1

Nonproducing developing countries
Subtotal 7.1 11.4 11.0 10.6 16.1 16.7 17.9 16.7Total, above categories 641.2 687.5 728.7 847.3 1,110.8 1,198.2 1,315.6 1,313.4
Centrally planned economies 34.5 19.7 35.0 64.3 126.6 182.9 241.4 220.6U.S.S.R. 9.3 12.0 19.0 26.6 61.0 101.7 132.0 119.1Eastern Europe 25.2 7.7 16.0 37.3 59.5 80.1 105.4 95.5Others - - - 0.4 6.0 1.1 4.0 6.0
World total 676.0 707.0 764.0 911.6 1,237.2 1,381.2 1,557.0 1,534.0
- Nil or negligible.Note: Figures rnay not add to totals because of round or incomplete data.a. Annual averaige for the period.b. Includes figure for what is not the German Democratic Reptiblic.
- Sources: FAO, Cocoa Statislit-s (Romc, various issues).

Table 31. Cocoa Consumption of Selected Countries, 1957-61, 1967-71, and 1972
Percentageannual
change inAnnual average consunip- Per capital consumption
(thousands oj metic tonM) Share in world total (percent) tion (kilogranms)
1957-61 toCountries 1957-61 1967-71 1972 1957-461 1967-71 1972 1967-71 1957-61 1967-71 1972
Canada 27.9 39.5 48.1 3.1 2.9 3.0 3.5 1.60 1.87 2.20United States 286.1 369.6 411.0 31.5 26.6 26.0 2.6 1.61 1.82 1.97
Belgium 18.4 24.4 24.7 2.0 1.8 1.6 2.9 1.95 2.44 2.46France 53.2 79.0 93.4 5.9 5.7 5.9 4.0 1.18 1.57 1.81(Germany, Federal Republic of 1(07.7 161.9 176.5 11.9 11.7 11.2 4.2 1.96 2.67 2.86Italy 18.4 30.6 34.4 2.0 2.2 2.2 -5.2 0.18 0.58 0.64Netherlands 24.8 19.0 27.0 2.7 1.4 1.7 -2.6 2.19 1.48 2.02Norway 4.4 7.4 8.3 0.5 0.5 0.5 5.3 1.25 1.92 2.11Switzerland 15.9 21L2 24.7 1.8 1.5 1.6 2.9 3.01 3.41 3.87Unite(d Kingdomii 95.8 119.4 128.6 10.6 8.6 8.1 2.2 1.84 2.14 2.'3()

Australia 13.5 19.9 22.4 1.5 1.4 1.4 4.0 1.33 1.62 1.73Japan 12.0 50.2 60.8 1.3 3.6 3.8 15.4 0.13 0.49 0.57
Brazil 11.1 19.3 19.9 1.2 1.4 1.3 5.7 0.17 0.21 0.19Columbia 21.9 29.3 35.3 2.4 2.1 2.2 3.0 1.52 1.43 1.57
Soviet Union 28.3 112.1 140.0 3.1 8.1 8.9 14.8 0.13 0.46 0.57Other Eastern Europe 40.2 81.8 105.2 4.4 5.9 6.7 7.4 0.40 0.80 n.a.
Other countries 128.6 200.3 222.0 14.2 14.5 14.0 4.5 n.a. n.a. n.a.
World total 908.0 1,384.9 1,582.3 100.0 100.0 100.0 4.3 0.40 0.40 0.45
n.a. Not available.Note: Consumption is defined for this table as net imports of bearts or grindings, adjUsted for riet imports or expolts of cocoai products, convcrted into bean
equivalent at standard conversion factors. Figures may not add to totals because of rounding.Source: FAO, Cocoa Statistirs (Romc, various issues).
QZ

Table 32. Elasticities of Demand for Cocoa in Bean Eqttivalent, Selected Countries,
Consumption of cocoa products,1968-70 Elasticity' of consumption per capita wvith respect to
Per capita Percent of woildCountry (kilograms) total Income per capita Cocoa price Sugar price' Soybean oil priceC
Canada 2.0 2.8 0.72 -0.19 -0.12 0.43France 1.6 5.9 0.68 -0.38 0.15 0.05Germany, Federal Republic of' 2.6 11.4 0.93 -0.18 - 0.32Italy 0.6 2.2 0.93 -0.21 - 0.05Netherlarids 1.3 1.3 0.62 -0.89" - 0.77
Spaini 1.0 2.4 0.85 -0n94 -United Kingdom 2.2 8.9 0.71 -0.16 - 0.40United States 1.8 26.7 - -0.25 0.08 0.19Other countiies na. 38.4 n.a. -0.25 0.20 -0.74
- Negligible or insigniificanit.n.a. Not available.a. The elasticity estimates are based on least squares regressions of annual figures for the period 1947 48 to 1963-64.b. Cocoa consumiiption responds only moderately to price changes of complements antd substitutes. In chocolate manufactuting, as much as 50 percent of the
product by weight is suigar; in this r-espect sugar is a complement to cocoa, In another respect, however, by treating sugar as a proxy for all confectionery ploducts, itmight be consider-ed ais a substitute for chocolate and thereby for cocoa. The two r-oles that suigar plaiys in cocoa consumption are difficult to separate. The cross-elasticity of demantTd for cocoa consumption with r espect to the price of sugar has also beenl founid to be staitistically insignificant. Econometric anialysis has also failed toreveal any significant relation between sugar prices and cocoa griTndings. (See F. Helmut Weymar's regressionl anIaysis in 7he Dynamics oj this World Cocoa Market[Cambridge, Mass.: M.I.T. Press, 1968]).
c. Vegetable oils are ailso both substitutes for and complements to cocoa beans because they nmay simultaneously complement cocoa powdel when it is in relattiveabundance and suibstitute for cocoa butter. By treating the price of soybean oils as a proxy for the price of vegetable oils, it has been founid that vegetable oils onbalance act more strongly as substitutes thani as cottiplenilettts for- cocoa beauis. Cocoa beans mnay also be considered as a proxy for cocoa butter; the substitutionbetweers vegetatble oils and cocoa butter usually does not become significant until the lattter is in short supply. This kind of situationi appeared in 1973, for instance,wheni ati estimated amount of noni-cocoai btttter fats equivalent to about 250,000 metric tons of cocoa beans was consumed. (See FAO Intergovernmental Group onC-:coa, Sub-'Group on Statistics, Rome, Noveulber 1973, p. 3.) in 1973, 250,000 inetric torts of beans constitLtted some 17 percent of 1972-73 cocoa productioni. Thereis al1so souie indication that the consumption of variotts types otf cocoa bhtter substitutes has been incr-easing substantially in r-ecent years (ibil.).
d. Tic ui ustually high value to- the Netheriands is probably acotUotedl for in part by the cotntoty's r-oic as an entrepot.Source: Jei-e R. Behrman, "Monopolistic Cocoa Pricing," American journal of Agricultural Economics (August 1968), p. 706; FAO Cocoa Statistics (Rome, various issues).

The World Cocoa Market 95
Table 33. Price Elasticity of Demand for Cocoa: Three Estimates
Item World Banka FAO-UNCTADI Behrman'
Developed countries -0.4182 -0.31 -0.25Developing countries -0.2 -0.50 -0.25
World excluding centrallyplanned economies -0.3648d -0.33 -0.25
Centrally planned economies -0.2 -0.50 -0.50
World total includingcentrally planned economies -0. 3 4 3 0 d -0.36 -0.28
Note: The estimates given here are of short-run elasticities. The long-run elasticity forgrindings has been variously estimated at a somewhat higher level of around -0.4 for theworld. There is also evidence that the price elasticity of demand for cocoa increases in absolutevalue as cocoa prices increase.
a. Louis M. Goreux, "Price Stabilization Policies in World Markets for Primary Commodi-ties: An Application to Cocoa," (paper presented at the World Bank Development ResearchCenter, February 9, 1972), p. 25. Data used are for yearly grindings, 1950-70; prices of beansare lagged one year (two years for centrally planned economies).
b. Prepared jointly by the secretariats of FAO and UNCTAD for the "World PriceEquilibrium Model." The averages presented here are weighted by respective shares ofconsumption for the period 1967-71, following the procedure used in International CocoaCouncil, document COCOA/R.6 (August 6, 1973).
c. Jere R. Behrman. "Monopolistic Cocoa Pricing," American Journl of Agnicultural Econoincs(August 1968), p. 706. Data are for annual per capita derived demand for cocoa (that is, actualgrindings adjusted for net imports of cocoa products for the period 1948-64). Averages areweighted by respective shares of consumption for the period 1967-71, following theprocedure used in International Cocoa Council document COCOA/R.6.
d. The averages are weighted by respective shares of grindings for the period 1967-71.
The price elasticity of world demand for cocoa has been estimatedat between -0.20 and -0.47. The range of estimated incomeelasticities of world demand is 0.25 to 0.57 (see, for example, tables32 and 33).
In the major importing countries, high prices can lead to amarked reduction in the volume of demand, even though the priceelasticities of demand for cocoa with respect to cocoa prices alone arelow. This reflects the feasibility of substituting alternative ingredientsin chocolate making. The major ingredients of chocolate productsare cocoa cake, cocoa butter, sugar, milk and fats, and oils. Prices ofcocoa beans and cocoa butter are, in general, both higher and subjectto wider fluctuation than those of the other ingredients, with therecent exception of sugar, and there has been a definite but gradualtrend towards reducing the cocoa content of chocolate products. 6
6. For instance, the indexes of price fluctuations for cocoa, sugar, and soybeanoil are 15.2, 12.4, and 10.6 percent, respectively.
96 COFFEE, TEA., AND COCOA
The use of cocoa can be reduced in several ways. One is by thesubstitution of other fats and oils for cocoa butter. Another is toreduce the cocoa content of enrobed bars or filled chocolate bars,although in certain countries, including the United States, a productmay not be sold as "chocolate" if it contains more than a specifiedproportion of fillings substituting for chocolate. A third way is tolimit cocoa usage by reducing the size of chocolate bars to maintainthe same retail price per bar for a period of time.
PluICES AND STOCKS
Cocoa prices fluctuate widely and frequently because demand isrelatively inelastic with respect to price, and short-term supply is aptto be unstable (mainly because of weather conditions). The price ofGhanaian cocoa-(New York spot price) 7 -is often used as anindication of the world market situation. It has fluctuated between apeak annual average of about 98 cents a pound, which it reached in1974, and the low of about 17 cents recorded in 1965 (see figure 6and table 26).
The high prices in recent years reflect, among other things, theshortage of readily available supplies and a continuing drought inmajor producing countrie5, coupled with buoyant consumption, thelow level of stocks, and the effect of uncertainties in the internationalmonetary situation.
During the last five years or so, the stocking policy of manufactur-ers appears to have changed. Average stocks maintained during thetwo seasons 1972-74 were sufficient for less than two and a halfmonths of grindings, compared with more than five months cluringmuch of the 1960s (see tabile 26).
MARKET PROSPECTS
Since more than 60 percent of world production of cocoa originatesin West Africa, climatic conditions in that area are a determiningfactor in world supply. Poor weather conditions during 1972/73 keptproduction well below the 1971/72 level. During the 1973/74 cropyear, production continued to decline in both Ghana and Nigeria.
7. The spot price is the quoiation for inmmediate delivery.

Figure 6. Surplus or Deficit of Stocks and Market Prices for Cocoa, 1947-73
800
-002 00 __ _ ___ __ _
7200 I 1 I F I I l
1947 49 5 1 53 55 57 59 6 1 63 65 67 69 71l 73 74
Source: WoPld Bank data. Year

Table 34. World Cocoa Production: Actual, 1967-71, and Projections for 1980 and 1985
Production (thousands of metric tons)
1967-71 1980 1985 Annual percentage increae
1947-51 to 1967-71 to(Country Volume Share Volume Share Volume Share 1967-71 1980 1980 to 1985
00 Ghana 390.4 28.5 440 24.2 510 24.1 2.4 1.1 3.0Nigeria 244.5 17.9 320 17.6 385 18.2 4.6 2.5 3.8Ivory Coast 160.2 11.7 290 15.9 335 15.8 6.5 5.6 2.9Cameroon 100.5 7.3 150 8.2 195 9.2 4.0 3.7 5.4Brazil 173.4 12.7 255 14.0 300 14.2 1.5 3.5 3.5Other countries 299.6 21.9 365 20.1 390 18.5 3.2 1.8 1.3
World total 1,368.6 100.0 1,820 100.0 2,115 100.0 3.3 2.6 3.0
Sources: World Batnk; FA0, Agriculturat Comnmodity Projectiow, 1970-1980 (Rome, 1971).

The World Cocoa Market 99
This decline was offset by good crops in other major producingcountries, so that total 1973/74 output still exceeded the previousyear's level. Final data are expected to show still higher production in1974/75, but not nearly as high as in 1971/72.
PRODUCTION FORECASTS
Projected long-run production levels of the five major cocoa-produc-ing countries-Ghana, Nigeria, the Ivory Coast, Cameroon, andBrazil-were arrived at by taking into account country productionplans and recent information indicating the likelihood of theirattainment in the light of the effects of production responses tohigher prices within the forecast range. For the rest of the world, theFAO's 1980 production level estimates are used, and the 1985production forecast was made by simple extrapolation. 8 The worldtotals arrived at in this way are approximately 1,820,000 and2,115,000 metric tons for 1980 and 1985, respectively (see table 34).These amounts represent an average annual growth rate of about2.6 percent for the 1970s and 3 percent for 1980-85.
Of the five major cocoa-producing countries, the share of theIvory Coast in total world output is likely to increase substantially,from 11.7 percent in 1967-71 to about 16 percent by 1985. On theother hand, a tendency is evident for Ghana's share to decline, from28.5 percent in 1967-71 to about 24 percent by 1985.
DEMAND PROJECTIONS
World consumption increased at an average annual rate of 4.1percent from 1955 to 1973, but by only 2.5 percent in the period1967-69 to 1973. Some decline is expected between 1973 and 1976,followed by an upturn in the latter part of the decade, at a rate ofabout 2.9 percent a year. World demand is projected at approxi-mately 1,820,000 metric tons in 1980.
To arrive at these results, an FAO model was employed. Anumber of forecasting models of the world cocoa market isavailable.9 In most models, grindings of cocoa beans are used as a
8. FAO, Agricultural Commodity Projections, 1970-1980 (Rome, 1971).9. For example, F. Helmut Weymar, The Dynamics of the World Cocoa Market
(Cambridge, Mass.: MIT Press, 1968) and FAO studies as reported in A. Viton,"The Prospects and Promise of Cocoa" (Rome: FAO, September 28, 1970).

100 COFFEE, TEA, AND COCOA
proxy for demand. Demand can be more accurately measured,however, by adjusting grirdiings for net trade in semiprocessecl cocoaproducts and in chocolate products converted to bean equivalent byweight. A model that uses this definition of cocoa consumption is theone employed by FAO fo^- its long-term projections to 1980.'"
The FAO model is based on regression analysis of per capitaconsumption, using real ircome, population, and deflated spot pricesof cocoa."1 It assumes that usage patterns, including cocoa substitutesand stocking policies, remairn unchanged. On this basis, the projec-tions for 1980 are shown in table 35 at various 1973 prices. Forinstance, at the 1973 constant price of 36.6 cents a pound, worlddemand in 1980 would anmiount to 1,910,000 metric tons, whereas atthe 1973 price of 48.8 cents the amount would be 1,770,000 metrictons. Four alternative prices are given, and their correspondingconsumption levels are calculated by applying the FAG's priceelasticity assumptions. Within a market-clearing framework, cocoaconsumption in 1980 can be forecast at around the level of 1,820,-000 metric tons by equilibrating supply and demand.
]?RICE FORECASTS
The equilibrium real price of cocoa, in 1973 constant terms., isprojected to be around 43 cents a pound in 1980. In current terms,this is equivalent to a price of about 84 cents a pound in 1980 atprojected rates of inflation. The highest prices reached in 1974 arenot expected to be sustainable in the years immediately ahead, partlyas a result of their impact on final demand and partly because of amoderate increase in proc.uction.
The same price forecast for 1980 has been derived by mearns of adifferent forecasting model, which consists of equations on produc-tion, grindings, and supply of stocks in numbers of months ofgrindings requirements. World production is projected by applying aprobable annual average rate of growth. The level of world grin-d-ings at constant prices is estimated, using an overall income elasticityof demand of 0.3. The supply of stocks is assumed to increasegradually up to three months of grindings requirements by 1977and to remain at that level thereafter. Actual grindings can then bededuced. The difference between this and grindings at constant
10. FAO, Agricultural Commodity Projections.11. The deflator is the U.S. wholesale price index, 1957-59 = 100.

The World Cocoa Market 101
Table 35. Basic Projections of World Demand for Cocoa, 1980,Using FAO Model(Thousands of metric tons)
Constant 1973 U.S. cents a pounda
Item 30.5 36.6 42.7 48.8
World 2,000 1,910 1.825 1,770World excluding centrally planned 1,680 1,610 1,545 1,494
economiesb
Centrally planned economies 320 300 280 275
a. For explanation, see text, "Demand projections." Alternative prices on which projectionsare based correspond to 1970 prices of 25, 30, 35, and 40 cents a pound, respectivelv.
b. The elasticity of demand used by FAO was -0.25. While the time period covered bv theregression analysis there (1953-68) is different from that in Behrman's (see table 33), theelasticity estimate for the world (excluding centrally planned economies) coincides withBehrman's.
Source: FAO, Agrcultural Commoditq Projectiom, 1970-1980 (Rome, 1971).
prices implies price changes that can be calculated by applying anoverall price elasticity of demand of -0.4.
With world consumption estimated at about 1,820,000 metric tonsfor 1980, the annual rate of increase of consumption from the levelof 908,000 tons in the period 1957-61 to 1980 is approximately 3.4percent. Assuming that, at the higher projected prices, consumptionwould increase at a long-term rate of about 3 percent annually,supply and demand would grow at about the same rate, and theirapproximate long-term balance could be maintained at around the1973 price of 43 cents a pound. In current terms, this would beequivalent to a price of about $1.18 a pound for 1985. However, ifproducer response to the recent high prices is strong, a higher levelof production can be expected by 1985, resulting in a lower price.
Allowance should be made for the possibility of wide pricefluctuations. The index of historical fluctuations of the price of cocoabeans is 15.2 percent."2 Applying this to the estimate of 84 cents and$1.18 a pound in current prices would give a range of between 71cents and 97 cents a pound in 1980 and between $1 and $1.36 in1985.
12. The index is calculated for the period 1950-72 by taking the arithmeticmean of annual differences between observations and five-year moving averages,irrespective of sign and expressed as a percentage of the moving average.

102 COFFEE, TEA, ANI) COC(OA
SENSITIVE FACTORS
The forecasting of cocoa prices is necessarily subject to manyuncertainties regarding such factors as the growth of world outlput,the stock policy of traders and manufacturers, purchases by centrallymanaged countries, changes in taste in countries with rnarket-oriented economies, and operation of the International CocoaAgreement.
Cocoa production is influenced by many variables in addition toweather. They include the reactions of farmers to changes inproducer prices, the response of yields to the application of fertil-izers, the results of pest and disease control, and the developrnent ofnew varieties and planting techniques. Since forecast prices aresubstantially higher than the historical level, there should be scopefor raising producer prices. The amount of additional productiondepends on the incentive effect of changes in producer prices. Onthe question of yield response to fertilizer application, no generalconclusion can be drawn from experiments that have been carriedout in different countries.13 Regarding disease control, there is alsouncertainty: there is evidence, for instance, that the capsid insect isdeveloping resistance to Gammalin insecticide. Although all thesefactors have been taken into account in forming a judgment aboutlikely production, they are difficult to quantify for purposes offorecasting.
As noted, stocks in recent years have been low. With a tendencyfor the cost of carrying them to increase, and with an apparentchange in the policy toward stocks on the part of manufacturers,there is also uncertainty about the long-term level of stocks.
Per capita consumption in countries with centrally planned econ-omies is relatively low compared with that in Western Europe,' 4 andthere would appear to be ample scope for growth in consumption(and therefore in imports) in these areas. Low priorities, however,constrict Eastern European allocations of foreign exchange forpurchases of cocoa beans and pr-oducts. Cocoa demand in otherdeveloped countries may slow down because of high prices andconcern about obesity and dental problems. Demand in developing
13. For instance, although Fertilizer application has shown positive results inNigeria, it has had little effect in Ghana and the Ivory Coast.
14. In 1970, for example, the average per capita consumption of cocoa, interms of bean equivalent, waS spproximately 0.6 kilograms in countries of EasternEurope, compared with 2.0 kilograms for Western Europe as a whole.

7he World Co(oa Market 103
countries, on the other hand, is expected to increase from its presentlow per capita base. Thus, there is uncertainty on the side ofdemand as well as supply.
THE INTERNATIONAL COCOA AGREEMENT
A three-year International Cocoa Agreement negotiated in 1972came into force in 1973. Subject to ratification, it will be succeededby a modified agreement expected to be in force from October 1976to September 1979. The basic objectives of the agreement are toprevent excessive cocoa price fluctuations and to help stabilize andincrease the export earnings from cocoa of producing countrieswhile taking account of the interests of consumers in importingcountries as well. The main features are (a) annual export quotas, (b)a buffer stock of up to 250,000 metric tons of cocoa, and (c) anindicator price range to be defended by export quota adjustmentsand buffer stock operations. The price range for the first agreementwas initially 29.5 to 38.5 cents a pound and has been revised upwardto 29.5 to 38.5 cents. The second agreement is considered as acontinuation of the first, and its price range will be 39 to 55 cents apound.
The current participants in the agreement include nineteen ex-porting members (representing more than 90 percent of worldproduction and exports) and twenty-nine importing countries (rep-resenting more than 70 percent of world imports and grindings).The largest importing country, the United States, is not a signatoryto the first agreement, however, and it seems unlikely that it willaccede to the second.
Because of unprecedentedly high prices since the agreement cameinto force, neither annual export quotas nor the buffer stock hasbeen operative. Therefore, the mechanisms for defending the pricerange will not have been put to the test before the expiration of theterm of the first agreement. Since the indicator price range has beenraised and widened in the second agreement, it is likely that exportquotas and buffer stock transactions will be operative.

AppendiX A
AN ECONOMETRIC MODEL OFTHE WORLD COFFEE EcONO014-
THE PROJECTIONS in chapter 2 were made with thte helpof an econometric model. This appendix presents a brief explana-tion of the model's structure.1 The estimated equations can be foundat the end of this append.x.
On the supply side, the world has been divided into six regions:Brazil, Colombia, other South America, Central and North Arnerica,Africa, and Asia and Oceania. For each of these regions, supplyequations have been estirnated that have the following basic struc-ture:
log Q = a + b, log QA V- 7 + b2 log PA V- 7
+ b:l log P-1 + b4 log CYC,
in which Q is total production; P is the level of real prices; AVdenotes that the single value for the year concerned has beenreplaced by a moving centered average; and CYC stands f'or thephase of the biennial procuction cycle as measured by Q-,/Q-2. Sincerobusta coffee trees do not display this cycle, the variable has beenused only in the equations for the arabica-producing regions.
The only important deviation from the structure described aboveoccurs in the equation for Brazil. This equation includes an acidi-tional variable, SCH, standing for the change in stocks over the pastfive years relative to the present level of production. The variable
1. For a full discussion of the model, see Jos de Vries, "Structure and Prospectsof the World Coffee Economy," World Bank Staff Working Paper no. 208(Washington: World Bank, June 1975; processed).
104

An Econometric Model of the World Coffee Economy 105
can be interpreted as the relative shortfall (or surplus) in Brazilianproduction with respect to the requirements of exports and domesticconsumption. It has been included to capture the effects of theBrazilian policy that aims, on the one hand, to stabilize the marketand, on the other, to preserve the Brazilian market share.
On the demand side, three regions are distinguished: the export-ing countries, the United States, and other importing countries. Theequations have been specified in such a way as to yield priceelasticities of demand that increase when prices rise in the first tworegions and to yield income elasticities of demand that decrease withincreasing incomes in the last two regions. The reasons for choosingthis particular behavior of elasticities have been explained in the text.
The price equation includes as its main variables the supply-demand balance, the one-year lagged price, and a variable to capturethe effect of inflation on real prices. The one-year lagged price hasbeen introduced to account for the lag in the adaptation of prices tochanges in the supply-demand balance. The variable PINFL repre-sents the theoretical price increase caused by inflation over the lasttwo years. Since its coefficient is -1, this suggests that real pricessuffer the full impact of inflation over this period of time and adjustonly afterwards.
The model is closed by three definitional equations that aggregateregional supplies and regional demand figures and determine stockchanges on the basis of the difference between annual productionand consumption.
The model has been simulated from 1949 onward, with allvariables generated endogenously. The results with respect toprice-the most crucial variable, since it enters into each structuralequation of the model-can be seen in figure Al. The smallsystematic deviation results from the slight overestimation of Brazil-ian production in the immediate pre-1954 period. This results inhigher stocks and lower prices than actually prevailed in the 1950sand, in consequence, in higher prices and lower production in the1960s, than occurred in fact. Because of the balancing properties ofthe model, however, the error redresses itself toward the end of theperiod.
Projections have been made on different assumptions concerningthe three exogenous variables in the model: income, inflation, andfrosts. Figures A2, A3, and A4 give three such projections. The base-line projection assumes income and inflation developments as pro-jected by the World Bank and incorporates the effects of theBrazilian frost of 1975. Figure A2 gives the price projection that

Figure Al. Actual and Simulated Coffee Prices since 194980 -I - I - I I I I I F F F I
70 ___i_X1Actual
60 - - -_ _ _
t /w Simulated
40 6
1950-51 1955-56 1960'61 1965-66 1970-71 1975-76 oYear >

Figure A2. Price Projections for Coffee under Different Assumptions about Frost
55 1 I t
n 50 __ __ _ ________
50
1980 81 1985-86 Year ~~~~ 190-1, 199-9 200-0
Projection without 1975 frost
45 _ _ _ _ _ _ _ _ _
Be-ie projection Q
35 _ __ _
1980-81 1985-86 1990-91 1995-96 2000-01Year

Figure A3. Price Projections for Coffee at Different Levels of Inflation
60 l I I I I I l
45
(2 I40r50~~~~~~~~~~~~~~~~~~~~~~~~~~~~~~
oor~~~~~~~~~40 I
1980-81 iic~~~198-86 1990-91i 1995-96 2000-0 1 Yeair

Figure A4. Price Projections for Coffee at Different Levels of Income Growth
50 l ll l
a~~Ya
Baelinte pr-ojectioni
.. 40 _ _ _ __ _ _ _
Projection wvithi income gowth I percent al yearf le"s
1980-81 1985-86 1990-91 1995-96 2000-01
Year

110 COFFEE, TEA, AND COCOA
would have been made in the absence of the 1975 frost. It shows thatthe heavy 1975 frost strongly accentuates the boom-bust cycle in thecoffee market. Figure A3 gives the projection of prices that resultswhen the forecasted ratc of inflation is reduced by 50 percent.Initially prices improve, but this leads to a stronger increase ofproduction in later years that depressed prices. Whereas the lon-g-term price trend is relatively independent from assumptions as tothe occurrence of frosts and the level of inflation, it does dependsignificantly on the assumptions made about income growth. This isshown in Figure A4, where a reduction of income growth! by Ipercent a year leads to a clear change in the price trend. The reasonis simple: although the lower prices generated by a reduction inincome growth lead to lower output levels, these lower output levelsdo not lead to a revival in prices, since consumption requirementsare also lower.
The projections in Chapter 2 result directly from the applicationof the present model, incorporating the latest available inforrnationabout the endogenous variables. Since detailed information is avail-able on the recent Brazilian planting programs, as well as on theeffects of the latest frost, Brazilian production up to 1980 has beenforecast exogenously. Use Df the actual equation for Brazil, however,leads to substantially the same projections.
THE COFFEE MODEL: EQUATIONS, 1947/48 TO 1972/73
(1) log Ql = 0.69262 + 0.32609 logQAV_ 7(1.36)
+ 0.44386 log PAWV7 + 0.2 log P 1(4.32) (fixed)
- 0.1460 1 log CYCbr - 0.46559 SCH_7(2.02) (1.96)
- 0.36152 Dlbr - 0.83875 D25r
(3.05) (6.60)
R2= 0.840 Durbin-Watson statistic = 1.888
(2) log QCO = 1.45585 4 0.55961 logQAV!7'(5.73)
+ 0.17612 logPA V_7 + 0.03 logP,(4.21) (fixed)

An Econometric Model of the World Coffee Economy 111
+ 0.02527 DCYCCo'
(1.58)
R2 = 0.800 Durbin-Watson statistic = 1.578
(3) log QSar = -5.2557 + 0.95693 logQAV"7(16.07)
+ 0.45997 log PAV 7 + 0.06199 logP_(9.02) (0.77)
- 0.24549 log CYC"'(2.24)
R' = 0.962 Durbin-Watson statistic = 2.065
(4) log Qfl' = -0.63024 + 0.82343 logQAV'-'m
(23.44)
+ 0.13676 log PA V-7 + 0.03019 log P,
(5.74) (0.90)
- 0.34088 log CYC" m
(3.36)
R2 = 0.982 Durbin-Watson statistic = 1.725
(5) log Ql = -3.40738 + 0.76647 logQAVafr(28.57)
+ 0.43605 log PAV-7 + 0.12335 logP 1(10.48) (2.08)
R2 = 0.988 Durbin-Watson statistic = 2.275
(6) log Qas = -4.34392 + 0.85623 logQAVY
(6.49)
+ 0.43288 log PAV 7 + 0.1 logP(2.40) (fixed)
- 0.59811 D la + 0.40167D2"(4.95) (1.74)
R2 = 0.942 Durbin-Watson statistic = 1.422
(7) Q = Qbr + QCOI + Qsam + Qram + Qafr + Qas
(8) Sprod = SProd + Q _C + SR7
(9) P = -300.2 + 0.51296P-, + 2162.3 DSBAL(9.47) (10.59)

112 COFFEE, TEA, AND COCOA
- 1.0 1405 PINFL + 449.7 DICO(6.28) (2.32)
R= 0.960 Durbin-Watson statistic = 2.599
(10) log CPro = 2.41447 - 906(10 1 )(P_,) + 0.77738 log Yoecd
(7.88) (19.42)
R= 0.965 Durbin-Watson statistic = 2.685
(11) casa = 22909 - 0.2-5274(10l8)(Yusa)-4 - 0.646 P(10.09) (14.10)
+ 912.44 (PIP-,) + 583.66 exp(-0.1(t - 16)2)(2.65) (3.46)
R= 0.960 Durbin-Watson statistic = 1.767
(12) log Cother = 14.3071 - 54.7014 (yother)-318 - 0.26165 logP. 1(51.78) (9.54)
+ 0.14552 (STs,al"Susa)
(5.69'
R2= 0.995 Durbin-Watson statistic = 2.519
(13) C = Cprod + cusa + cother + (Susa - Susa)
THE COFFEE MODEL: GLOSSARY OF SYMBOLS
All variables refer to crop years (for 1947/48, t = 1), wit]i theexception of the index of United States wholesale prices and thleincome figures, which refer to calendar years (for 1947, t = 1). Allquantities are in thousands of 60-kilogram bags. Income figures arein hundreds of millions of constant 1963 U.S. dollars.
SymbolsQ Total harvested production of coffeeRegions br, Brazil
col, Colombiasam, South Amierica excluding Brazil and Colomb.ianam, North Arnerica (including Central America)afr, Africaas, Asia and Oceania
QAV The five-year moving centered average of Q:
QAV = 0.25Q-2 + 0.75Q-, + Q + 0.75Q+l + 0.25Q+.! 2
2. To simplify calculations, division by 3 has been omitted.

An Econometric Model of the World Coffee Economy 113
CYC Q-1/Q-2
P Real price of coffee, in U.S. cents per 100 pounds. Thisprice is measured by the unit value of U.S. imports(f.o.b.). The deflator is I.
PA V The three-year moving centered average of PR:
PRAV =P + P + P+,
I Index of U.S. wholesale prices (1967 = 100).PINFL P_1 (I- 1-2)I-2yoecd GNP of the OECD countries at market prices.yusa GNP of the United States at market prices.yother GNP at market prices of the OECD countries other than
the United States.cprod Domestic consumption of coffee in producing countries.Cusa Consumption of coffee in the United States ("net civilian
visible disappearance of coffee," as reported by the U.S.Department of Commerce).
cother Consumption in importing countries other than theUnited States, as measured by total exports from produc-ing countries minus U.S. consumption and minus theincrease in U.S. inventories.
C World disappearance of coffee, as measured by totalexports from producing countries plus their domesticconsumption.
sprod Stocks in producing countries at beginning of period.susa Beginning-of-period inventories of green coffee in the
United States.SCH (SProd - SProdp)QA Vbr
SRV Stock revision due to factors such as destruction orreevaluation of stock.
DSBAL (C 1 -+ C-2)(SProd + Q)D 1br Dummy variable to capture the effects of Brazilian frosts
in 1953 and 1955. It is unity in 1954-55 and 1956-57 andzero in all other years.
D2br Dummy variable to capture the effects of Brazilian frostsin 1963 and 1969. It is unity in 1964-65 and 1970-71 andzero in all other years.
DCYC"CO Dummy variable to capture the effect of the biennial cyclein Colombia. It is nil in noncyclical years (t = 4-8, 25, and26), -1 in off years (t = 1, 3, 10, 12, 14, 16, 18, 20, 22,24), and 1 in on years (all other years).
D las Dummy variable to capture the direct effects of the warin Indonesia on production in Asia and Oceania. It is

114 COFFEE, TEA., AND COCOA
unity from 1947-48 through 1949-50 and zero in allother years.
D2as Dummy variable to correct for the underestimation ofpast production capacity by lagged production for theAsia and Oceania region because of the war in Indonesia.It is 0.5 in 1947-48 and 1956-57, unity in the interveningyears, and zero in all other years.
DICO Dummy variable to capture the effect of the establish-ment of ICO on prices. It is unity in 1963-64 and 1964-65, 0.5 in 196I-66 and 1966-67, and zero in all otheryears.

Appendix B
A COMPARATIVE ANALYSISOF COCOA PRODUCTION
IN SELECTED COUNTRIES
THIS APPENDIX DEALS MAINLY with the experimentalcharacter of an empirical study of the complex issue of comparativeadvantage.' The first systematic exposition of the theory of compara-tive advantage is attributed to David Ricardo.2 A more recent,neoclassical, version of the theory was formulated by Eli Heckscherand Bertil Ohlin.3 The formal demonstration of the Ricardian andthe Heckscher-Ohlin theories usually relies upon simple modelsconsisting of two countries, two commodities, and one or two factorsof production. Extensions of the theory of comparative advantagehave attempted to overcome the limited dimensionality of the formalmodels, as well as to relax their restrictive assumptions. With respectto empirical evidence, neither the Ricardian nor the Heckscher-Ohlin theory has been conclusively demonstrated.
1. The analysis was carried out in the period fall 1973 to spring 1974, based oninformation then available.
2. David Ricardo, Principles of Polit2cal Economy and Taxation (London: JohnMurray, 1817). His doctrine of comparative costs states in essence that a countrytends to export the commodity whose relative cost of production, compared withother commodities, is lower than in other countries.
3. Eli Heckscher, "The Effect of Foreign Trade on the Distribution of Income,"Economisk Tidskrift, 21, no. 2 (1919), pp. 19-32; and Bertil Ohlin, International andInterregional Trade, 1933. The Heckscher-Ohlin theorem states that a country tendsto export that commodity, the production of which is more intensive than othersin the use of whatever factor of production it possesses in relatively greaterabundance than other countries.
115

116 COFFEE, TEA. AND COCOA
THE DOMESTIC RESOURCE COST APPROACH
One possible way to measure comparative advantage in the realworld is to start with Chenery's view4 that a country can be said tohave a comparative advantage in exporting a commodity if the socialopportunity cost of producing additional amounts of the commod-ity-the social value of factors of production used to produce thecommodity if employed i n their next best uses-is less than thecommodity's export price, and if the analysis considers social valua-tions of outputs and inputs, external effects, and changes in variablesover time. This definition of comparative advantage can be statedrelative to total costs and returns as follows;
( 1 ) nv + Efv, < uv 1 + E,s=2
where u is total value at world prices (in foreign currency) of theoutput of the project in question; v1 is shadow foreign exchange rateexpressed as a ratio of local currency to foreign currency; E is netexternal benefits imparted by the project to the rest of the domesticeconomy; r is total (direct plus indirect) value (in foreign currency)of imported materials used by the project and total (direct plusindirect) value (in foreign currency) of repatriated earnings offoreign-owned factors of production employed on the project (in-cluding repatriated portions of the direct foreign factor cost,fivl,and of the indirect forei,n factor costs); f, is total (direct andindirect) quantity of the sth domestic factor employed on the project;and v, is shadow price (in domestic currency) of the sth domesticfactor employed on the project.
A country has a comparative advantage in producing and export-ing a commodity if total social costs of an incremental project-including direct and indi:ect foreign costs (rv1) and direct andindirect domestic costs (1s2 2fv,)-are less than total returns (uv,)plus net external benefits (E).
By rearranging the terms of (1), the following relationship isestablished:
Xfsvs -E(2) s 2 < V.
u -r
4. Hollis Chenery, "Comparat.ve Advantage and Development Policy." Americ7vn
Economic Review 51 (March 1961,, pp. 18-51.

A Comparative A nalysis of Cocoa Production in Selected Countries 117
Equation (2) can be written as:
DRC(3) DRC < v, or < 1.
V 1
where DRC, the domestic resource cost of foreign exchange earnedor saved by the activity in question,' is defined bv the term on theleft side of (2). DRC measures the social opportunity cost (relative tothe domestic factors of production employed directly or indirectly)of earning a net marginal unit of foreign exchange.
Hence, the DRC concept is a restatement of comparative advan-tage: an export is socially profitable-or has a comparative advantagein international trade-if the opportunity cost of domestic resourcesused in its incremental production per unit of net foreign exchangeearned is less than the shadow price of foreign exchange. If the DRCratio of the project is less than this shadow price, the country has acomparative advantage in producing the incremental output of theproject. Therefore, as Bruno has noted,' DRC is particularly wellsuited for measuring comparative advantage.
To use DRC as a criterion for choosing between projects oreconomic activities within a country, the project that has the lowerDRC will be preferred for acquiring or saving foreign exchange.Thus, projects may be ranked according to their DRCs. Such aranking, however, does not, in itself, indicate whether (and if so, towhat extent) the project is socially profitable for the country. Theremust be a benchmark or cutoff point, therefore, against which aproject's DRC is matched. Such a benchmark is the shadow price offoreign exchange, that is, the shadow exchange rate (SER, or v 1). Forthis purpose, the SER can be thought of as a weighted average of theefficiency of all tradable activities (exports and imports) in theeconomy in transforming domestic resources into foreign exchange.
5. The formula for DRC can be adapted for multiperiod analysis as:
Y- [ E' fst,Ust Et ] /( + Vrd'
DRCT = t=
E (ut - rd/l( + V,)t
t=O
for the period t = 0 to t = T, where V. is the shadow price (opportunity cost) ofcapital.
6. Michael Bruno, "Optimal Pattern of Trade and Development," Review ofEconomics and Statistics 49 (November 1967), pp. 548-49; "Domestic Resource Costsand Effective Protection: Clarification and Synthesis." Journal of Political Economy80 (January-February 1972), pp. 21-22.

118 COFFEE, TEA, AND COCOA
Thus it becomes a simple proposition, at least in principle, toanswer one important question bearing on the selection of invest-ment projects. All identified investment activities are scrutinized withrespect to the domestic cost of earning or saving a unit of foreignexchange, with those pro:mnising least domestic cost topping the listand the others ranked subsequently in order of increasing cost. Thelast project included in the program is the one for which thedomestic cost per unit of foreign exchange is just marginally lowerthan the shadow rate of exchange.
To identify comparative advantage in the classical sense but in aninternational rather than merely a national context, an extensionmust be made to the DIRC approach described thus far. Thisextension consists of forming ratios between the DRC of theeconomic activity concerned in a country and the country's SER andthen comparing such DRCISER ratios for the same economic activityfor all the countries for which the international comparative advan-tage of the economic activity is to be determined. Suppose, forexample, that the comparative advantage in cocoa production is tobe determined among three countries. Cocoa's DRC is first com-puted in each of the three countries. For each country, the ratiobetween cocoa's DRC and the country's SER is formed. The threeDRC/SER ratios are then c4ompared and ranked. The country withthe lowest DRC/SER ratios is the one relatively more capable ofreaping net social benefits from cocoa production. In other wor(ds,this country can be considered as having the international compara-tive advantage in cocoa production among the three countriesconsidered. The term "relative comparative advantage" is used forthis kind of comparative advantage in the international context todistinguish it from "comparative advantage" in the national context.
COUNTRY COVERAGE AND DATA COLLECTION
Because four-fifths of world output and exports is concentrated infive countries (Ghana, Nigeria, Brazil, the Ivory Coast, and Came-roon), they were the first to be selected for the study. To gain moreinsight into comparative advantage in cocoa production, otherimportant or potentially important cocoa-producing countries wereconsidered for inclusion. Because of the difficulties and costs of datacollection, however, only Togo and Indonesia were added.
In using the DRC approach, data collection was centered on cocoaprices and the costs of cecoa production only, together with thie

A Comparative Analysis of Cocoa Production in Selected Countries 119
estimation of actual and shadow prices of labor, capital, and foreignexchange. The relevant data were gathered from World Bank staffin the case of shadow prices,7 from the Bank's cocoa projectappraisal reports, and from questionnaires used for sample surveysfrom the fastest expanding cocoa producing region in each country.The questionnaires were designed separately for the two major typesof cocoa-producing units, the smallholder and the plantation, orestate.
FINDINGS FOR PLANTATION PRODUCTION
Information on the "plantation mode" of cocoa production wasobtained from five World Bank cocoa project appraisal reports, oneeach for the Ivory Coast, Ghana, Nigeria, Togo, and Cameroon, 8
and six questionnaires returned from Indonesia. Internal WorldBank data are projected rather than actual; these contrast with thosefor Indonesia, most of which were actual figures for the period1970-73.
Because the World Bank cocoa project appraisals were undertakenat different times between 1970 and 1974, cost-price informationwas not necessarily consistent. A spot price of 55 cents a pound wasassumed for 1980 and deflated backward to the year of theappraisal.
Differences existed in the composition of Bank cocoa projects andthe cocoa estates that were surveyed. For instance, some projectsinvolved replanting or rehabilitation, while others did not. Some, butnot all, estates surveyed reported new planting, the effects of whichwere reflected only on the cost side. DRC ratios were first calculatedfor projects with and without road programs wherever present.Further breakdowns were made for new planting, rehabilitation, andreplanting. Overheads and administrative costs were divided amongthese components according to their share in the total hectarageinvolved in each project.
The results obtained are presented in table BI, showing the
7. For some of the countries under study, estimates of shadow prices had to bemade for the first time and therefore must be considered provisional. These andother estimated values used in the study may be obtained from the author uponrequest.
8. Not all Bank projects in those countries are of the "plantation type," but theyare included under that heading for the purpose of this paper.

Table B1. Estimated Ratios of DRC to SER (and to FX) for Cocoa Production
Countries zwith Exclurding road programs Including road programWorld Bankcocoa projectsa New planting Rehabilitation Replanting Total sample New planting Rehabilitation Replanting Iotal samnple
Ghana - 0.192 0.298 0.241 - -
(0.266) (0.412) (0.333)T ogo - - 0.245 - - - .9 6.r
(0.323) (0.350)Nigeria 0.267 0.275 0.271 - - - 0.275
NO (0.320) (0.329) (0.324) (0.329)Ivory Coast 0.304 0.311 - 0.307 - - - -
(0.388) (0.397) (0.391)Cameroon 0.269 0.408 - 0.347 0.286 0.442 - 0.373
(0.368) (0.557) (0.474) (0.391) (0.603) (0.510)Indonesia - - 0.576[0.526]
(0.576)([0.526])
- Not applicable or niot availablc.Notes: Figtures in parentheses are rajtios of domiiestic resource costs (DRC) to actual foreign exchange ra.tes (FX). Figures in br-ackets represent domestic factor coSts
excluded for new plantinlg and replanting components.a. Except Indonesia (see text).Source: Catlculated from World Bank data.

A Compariative Analysis of Cocoa Production itl Selected Countries 121
calculated ratios of domestic resource cost of foreign exchangeearned or saved, DRC, to the shadow exchange rate, SER. Forcomparison, the corresponding ratios of DRC to the actual exchangerate, FX, are also shown in the table. The calculated DRC/SER ratiosturned out to be less than 1 in all cases. This indicates that plantationproduction of cocoa is socially profitable for all countries concerned.The ratios were in decreasing order for Indonesia, Cameroon, theIvory Coast, Nigeria, Togo, and Ghana. Recalling that the smallerthe ratio of DRC to SER, the greater the relative comparativeadvantage, the figures in table B1 appear to indicate that, among thesix countries covered by the exercise, Ghana has the largest relativecomparative advantage in cocoa production, while Indonesia has thesmallest.
These results had to be subjected to sensitivity analysis by modify-ing the exchange rates and the cocoa price. The shadow exchangerates used in table B1 were varied by 10 percent up and down.Cocoa prices were varied by 10 percent up and down in theIndonesian sample; in the case of the World Bank cocoa projects,the 1980 world cocoa price was given the value of 50, 55, 60, and 65cents a pound.
By varying the cocoa price, the net social benefits from cocoaproduction change, affecting the values of the DRC estimates. As thecocoa price is decreased, the denominator of DRC decreases, thusraising the magnitude of the DRC estimate. The opposite holds trueas the cocoa price is increased. It was found that, holding the originalpoint estimate of the SER constant, the DRC/SER ratio in the case ofthe Indonesian sample increases by about 11 percent, with a 10percent decrease in the cocoa price, and decreases bv about 9percent, with a 10 percent increase in the cocoa price. As for theBank cocoa projects, the DRC/SER ratio increases from 12 to 13percent by decreasing the 1980 world cocoa price from 55 to 50cents a pound (that is, by 9 percent), and decreases from 10 to 11percent with a 9 percent increase (from 55 to 60 cents) in the cocoaprice.
The DRC/SER ratio also varies inversely with the shadow ex-change rate. By varying the shadow exchange rale only, the DRC/SER ratio drops by about 9 percent, with a 10 percent increase in theoriginal point estimate of the SER, and increases by about 11percent. with the same percentage change in the SER in the oppositedirection.
Thus, the percentage change in the computed DRC/SER ratio inresponse to a given percentage increase and decrease in either the

122 COFFEE, TEA, AND COCOA
Table B2. Estimated Ranges oi DRC/SER Ratios for Plantation CocoaProduction, Various Countries
Range of DRCISER ratios
At 50 cents a At 55 cents a At 60 cents a At 65 cents aCountry pound pound pound pound
Ghana 0.245-0.299 0.219-0.268 0.198-0.242 (0.181-0.221Togo 0.253-0.309 0.223-0.272 0.198-0.242 0.179-0.21 8Nigeria 0.276-0.338 0.246-0.301 0.223-0.273 0.203-0.249Ivory Coast 0.314-0.384 0.279-0.341 0.250-0.306 0.228-0.278
Cameroon 0.358-0.438 0.315-0.385 0.281-0.344 0.253-0.309Indonesia 0.43t,-0.710
Note: World cocoa price for 198l assumed for World Bank cocoa projects. Though theprice forecast for cocoa has been sevised upward by the Bank since the calculations weremade, varying the cocoa price does niot change the relative ranking of countries.
Source: World Bank estimates.
cocoa price or the shadow exchange rate-other things beingequal-is asymmetrical.9 It: appears also that responses of the DRC/SER estimate to the same percentage change in either variable arenot of a very different orcer of magnitude.
The combined effect of varying both cocoa prices and slhadowexchange rates provides the ranges of DRC/SER ratios summarizedin table B2, showing considerable overlap among the countries. Theresults appear to indicate that Ghana and Togo have a relativecomparative advantage in cocoa production over the Ivory Coast,Cameroon, and Indonesia. Because of the overlapping DR(C/SERranges among Ghana, Togo, and Nigeria, it is hard to say whichcountry has the greatest relative comparative advantage. Also, it is nolonger possible to say that Cameroon has a definite relative compara-tive advantage over Indon.-sia.
Sensitivity analysis on the cost components was not undertaken.The results obtained from variations in the cocoa price and shadowexchange rates, however give sufficient reason to expect thatsensitivity analysis on the cost components would show additionaloverlapping of the DRC/SER ranges. This would limit further theability to make definite statements about the relative comparativeadvantage of the various countries.
9. A greater percentage change in the DRC/SER ratio occurs with a certainpercentage decrease than with the same percentage increase in either the cocoa
price or the SER.

A Comparative Analysis of Cocoa Production in Selected Countries 123
FINDINGS FOR PEASANT PRODUCTION
The data on factor costs of the peasant stvle of cocoa productionwere obtained from a questionnaire survey of peasant farms in fivecountries: the Ivory Coast, Ghana, Togo, Nigeria, and Brazil. Thefarms were selected from the most rapidly expanding cocoa-growingregion in each country, and samples consisting of twenty productionunits were obtained for each. The data for Togo were incomplete;the other reports were more adequate.
The most difficult aspect of research in peasant economies is theevaluation of the factors of production. In this case, it was decidednot to amortize land and capital, since properly kept cocoa land doesnot depreciate and the cash outlays for hand-hoe cultivation andfertilizers are insignificant. Work on farms is done by family andhired labor. Familv labor was valued at the minimum wage rateestablished by the government in the countries concerned. The shareof female and child labor in cocoa farming was valued at two-thirdsand one-third of male labor, respectively. For simplicity, it wasassumed that most cocoa farmers specialized in cocoa production;thus, multiple cropping was not accounted for.
To make intercountry comparisons, data were selected that wereavailable for all the countries. Thus, although some of the farmersprovided cost data covering a number of years, computations wererestricted to 1972 data only. The figures in table B3 show the DRC/
Table B3. Computed DRCs and Related Measures of Comparative Advantage in1972 for Major Cocoa-Producing Countries, Using the Average World SpotPrice for 1972
Shadow price Market price'
Foreignexchange DRCI DRCI
Country DRC ratio (SER) SER DRC FX FX
Nigeria 1.2078 0.79 1.528 1.6517 0.66 2.50Ghana 1.1607 1.60 0.725 1.9187 1.156 1.659Brazil 6.0880 6.825 0.892 7.009 5.940 1.178Ivory Coast 318.3223 293.5 1.084 445.46 230.2 1.935Togo 108.4659 304.0 0.356 333.97 230.2 1.450
Note: For sources, description, and explanation of data, see text.a. The annual average price of cocoa for 1972 was $705.47 a metric ton (FAO, Cocoa
Statstics (Rome, October 1973).Source: World Bank estimates.

124 COFFEE, TEA, AND COCOA
FX and DRC/SER ratios, assuming that the price received per unit ofthe commodity was the spot price. Only Ghana, Togo, and Brazilappeared to have a comparative advantage in cocoa productionwhen shadow prices and exchange rates were used, because thevalues of their respective DRC/SER ratios were below 1. Whenmarket prices were used, none of the countries showed comparativeadvantage in cocoa production, because the DRC/FX ratios weregreater than 1. This may be explained by the overvaluation of labor,which has a large share in total factor costs.'"
The ratios presented in table B3 can be used to rank the countrieson a scale of relative comparative advantage. For shadow values, therankings in descending order are Togo, Ghana, Brazil, the IvoryCoast, and Nigeria. The rankinigs change when market prices areused; Brazil is then first, followed bv Togo, Ghana, the Ivory Coast,and Nigeria. These findings may result from the overvaluation ofTogo's exchange i-ate.
The results were subjected first to sensitivity analysis by varyingthe shadow exchange rates 10 percent up and down. The percent-age changes in the DRC/SER ratios were asymmetrical. A higherSER lowered the DRC/SER ratio by about 9 percent; when the SERwas lowered, the DRC/SER. ratio climbed by about 11 percent.'"
Sensitivity analysis by varying the cocoa price'2 10 percent up anddown gave the percentage changes in the DRC/FX ratios, which alsowere asymmetrical. A higher cocoa price lowered the DRC/FX ratioby about 9 percent; when [he cocoa price was lowered, the DRC/IFXratio climbed by aboLit 10 percent.
Responses of the computed DRC/SER or DRC/FX ratio to thesame percentage change in either the cocoa price or the foreignexchange rate-other thin,s being equal-were found to be of thesame order of magnitude. The result of sensitivity analysis byvarying only the shadow exchange rates did not change the rankingsof the countries on the scale of relative comparative advaontagebecause the computed ranges of DRC/SER ratios did not overlap.'3
Overlaps occurred, however, when the cocoa price was varied. Fromthis, it would be expected that by varying both the foreign exclhange
10. The legal minimum or national average wage rates were used to valuefamily and hired labor.
11. An exception to this was i:he Ivory Coast sample.12. Here, export unit values in tJ.S. dollars were used.13. An explanation of this may be that, because labor bulks so large, I.he
changes described in the SERs only may not be large enough to affect the DRC/SER ratios appreciably.

A Comparative Analysis of Cocoa Production in Selected Countries 125
rate and the cocoa price simultaneously, considerably more overlap-ping would occur. Therefore, nothing definite about relative com-parative advantage in the peasant type of cocoa production can beconcluded.
COMPARISON OF FINDINGS ON THE TWO METHODS
OF COCOA PRODUCTION
The first observation is that the computed DRC/SER ratios aregenerally much lower in plantation production. The second is that,although these computed ratios are all below unity in the plantationenterprises, they are not always so in peasant pr oduction. Theseresults may stem from one or more of the following causes: (a)peasant farming on the average is less efficient than estates or theWorld Bank projects in the survey; (b) family labor, which accountsfor the major portion of factor cost, is overvalued; and (c) data forthe two types may be of significantly different quality.
There are similarities in findings for the two types of production.For example, the percentage change in the DRC/SER ratio inresponse to a given percentage increase or decrease in either thecocoa price or the shadow exchange rate-other things beingequal-is asymmetrical in both types. It appears that responses of theDRC/SER ratio to the same percentage change in either variable areof the same general order of magnitude for both.
COMBINED RESULTS FOR THE TWO METHODS
A preliminary impression of relative comparative advantage in cocoaproduction may be gained from the lists in table B4 of DRC/SERratios for plantation and peasant production. As the figures makeclear, however, the rankings are inconsistent for the four countriesin which both types of production were explored for this study-Ghana, Togo, Nigeria, and the Ivory Coast. This leads to inconclu-sive results concerning the relative comparative advantage of coun-tries. Moreover, the inconsistent rankings obviously would overlap ifranges were established around the two sets of estimates of the DRC/SER ratios.
It may therefore be argued that there is not enough differenceamong these four neighboring countries of West Africa to bediscernible in terms of relative comparative advantage in cocoa

126 COFFEE, TEA, ANI) CCICOA
Table B4. Original Estimatesof DRCJSER Ratios,Major Cocoa-Producing Countries
Plantation Pea-santCountry production production
Ghana 0.241 0.725Togo 0.245 0.356Nigeria 0.271 1.528Ivory Coast 0.307 1.084Cameroo:. 0.347Indonesia 0.576Brazil 0.892
Source: Tables BI -and B3.
production. The results of the sensitivity analysis would underscorethis view.
QUALIFICATIONS OF FINDINGS.
The empirical findings reported above are subject to a number ofqualifications, some of which have already been mentioned. Forexample, the samples are relatively small and are not raindom,because most of the cocoa farms surveyed were selected fromcontiguous areas. This points to a central issue of comparativeadvantage analysis. Comparative advantage, as a marginal concept,requires a comparison of the "next best" cocoa project in eachcountry. There is therefore no need for the sample to be representa-tive and the problem becomes one of whether the area selected ineach country is in fact the next best for cocoa production. Theanswer to that question must be left open, as a subject for f'urtherresearch.
The selection from among alternative crops for investment pur-poses requires the identification of potential, rather than existing,comparative advantage. Although the latter might be assessed on thebasis of existing cost-benefit sample data, the determination ofpotential comparative advantage requires data from the simultane-ous appraisal of projects for alternative crops, each project beingdesigned as the next best project for each crop in each country. In

A Comparative Analysis of Cocoa Production in Selected Countries 127
this rigorous sense, the resources required to undertake a compre-hensive comparative advantage study would be enormous.
Furthermore, in determining potential comparative advantage,variables such as the rate of return on capital and the shadowexchange rate cannot be treated as given, but must be consideredwithin a dynamic framework. Investments in each country, and forthe same crops in other countries, change relative prices andcomparative advantage.
Even within the limited framework of the approach used in thisstudy, other limitations exist. For example, the level and allocation ofadministrative, overhead, and other related costs cannot be con-trolled as in a controlled experiment. Varying these costs couldproduce decidedly different results. Economies of scale, which caninfluence overhead costs per unit of output, are important in thiscontext.
Finally, other costs and benefits, including externalities, cannot betotally accounted for, given the status of the existing data. Alleconomic costs between the farmgate and the point of export aredifficult to ascertain.
CONCLUSION
This appendix reports on the first attempt to study comparativeadvantage in cocoa production. The positive result of the study is theidentification of a theoretical approach to a complicated problem.The method illustrates an approach to evaluation of alternativeinvestment projects within a country, especially in one sector. Whathas not been obtained is a set of clear-cut results that can be useful asguides to international investment policy in cocoa-producing coun-tries.
The empirical difficulties of the study are substantial. Therefore,even the best answer that can be given regarding the limited conceptof relative comparative advantage in cocoa production is far fromconclusive and not of direct operational significance. Further im-provements in methodology and field implementation will be costlyand time consuming, without promising results of a definite andoperationally useful character. International comparisons of the kindattempted here will become more meaningful when the data base inindividual countries has been improved and the evaluation methodhas been applied to comparative analysis of projects within individualcountries.

Appendix C
DEVELOIPMENT LENDING
The data in table Cl are those used in the cliscussion ofWorld Bank lending for cocoa and tea projects on pages 17 and 18.
128

129
Table Cl. World Bank Lending for Cocoa and Tea Plantinga
Amount of Projected output Projected outputDate of Bank credit credit (millioms 1980 1985
Country agreement of U.S. dollars) (thousands of metric tons)
Cocoa Projects'Ivory Coast June 5, 1970 5.30 20.3 20.3
January 10, 1975 20.00 8.4 27.5(;hana June 26, 1970 8.50 19.3 19.3
December 23, 1975 14.00 2.8 10.2Nigeria June 23, 1971 7.20 10.7 15.5
October 11, 1974 20.00 8.3 25.6Indonesia June 28, 1972 0.03 n.a. n.a.Malaysia March 13, 1973 0.70 n.a. n.a.TIogo August 6, 1974 6.00 0.2 4.4Cameroon September 18, 6.50 6.9 13.4
1974Liberia August 1, 1975 n.a.c 0.3 1.4
Total 8 8 .2 3d 772d 137.6
Teai Projects'Kenya August 17, 1964 2.7 5.(-7.0 5.0-7.0
June 17, 1968 2.1 18.0 18.0Tanzania January 13, 1966' 1.4 2.1 2.1
March 3, 1972 10.8 7.6 9.6Uganda September 15, 3.7 4.5 7.6
1967Mauritius April 9, 1971 5.4 2.4 3.8Indonesia June 24, 1971 15.1 10.1 12.7
June 22, 1973 7.8 2.0 9.0
Total 49.0 51.7-53.7 67.8-69.8
+ Over the preceding number.n.a. Not available.a. Includes only projects at least part of which are to finance planting or replanting; some
financing of processing and transport costs is also covered.b. There was also a small cocoa component in an IDA project in Ecuador (Milagro) in 1974.c. Fraction of a $17.0 million agricultural project.d. Figure does not include amounts not available.e. As of June 30, 1975.f. Part of an agricultural credit project.

The full range of World Bank publications, both free and for sale, isdescribed in the World Bank Catalog of Publications, and of the continuingresearch program of the World Bank, in World Bank Research Programr:Abstracts of Current Studies. The most recent edition of each is availablewithout charge frorrm:
PUBLICATIONS UNIT
THE WORID BANK
1818 H STREET, N.W.
WASHINGTON, D. C. 20433U.S.A.


Published byThe Johns Hopkins University PressBaltimore and London
EXPORT SALES REPRESENTATIVES
THE UNITED KINGDOM, CONTINENTAL EUROPE, THE NEAR EAST AND MIDDLE EAST, AFRICA
The Johns Hopkins University Press, Ltd., 2-4 Brook Street, London WIY-IAA,England
CANADA
Burns & MacEachern Ltd., 62 Railside Road, Don Mills, Ontario M3A I A6, CanadaAUSTRALIA, NEW ZEALAND, AND SOUTHEAST ASIA
Australia and New Zealand Book Co. Pty. Ltd., P.O. Box 459, Brookvale, N.S.W.2100, Australia
JAPAN
United Publishers Services Ltd., Shimura Building, 4-1 Kojimachi, Chiyoda-ku,Tokyo, Japan
THROUGHOUT REST OF THE WORLD, orders can be sent directly to The Johns Hopkins Uni-versity Press, Baltimore, Maryland 21218, U.S.A.

-~~~~~~~~~~~~~~ SX
COFFEE. TEA. AND COCOA. grown in almost every tropical and subtropical coun-
try. are among the most important export crops of the developing countries.
But the relative rigidity of short-term supply and the low price elasticity of de-mand in importing countries, combined with the long gestation period of thecrops. cause alternating short periods of boom conditions and long periods ofoversupply and consequently depressed market prices.
Since such developments greatly compound the problems of the developingcountries, especially the rural sectors. the World Bank has followed these mar-kets carefully and has lent money for the expansion of the production of thesecrops in only a few cases. The development of the Bank's lending policy is
described in the first section of the book. Since the application of this policy isdependent on the Bank's assessment of the market outlook, the followingthree sections analyze the structure and the prospects for the coffee. tea, andcocoa markets.
Shamsher Singh is chief of the Commodities and Export Projections Divisionof the World Bank. Patrick Yeung is an economist in that division. Jos de Vriesis an economist in the Western Africa Regional Office, and John C.L. Hulley isa senior economist in the Policy Planning Division.