public disclosure authorized 41791 - world bank · public disclosure authorized 41791 ......
TRANSCRIPT

IEG Independent Evaluation Group
INDEPENDENT
EVALUATION
OF IFC’S
DEVELOPMENT
RESULTS 2007Lessons and Implications from 10 Years of Experience
41791
Pub
lic D
iscl
osur
e A
utho
rized
Pub
lic D
iscl
osur
e A
utho
rized
Pub
lic D
iscl
osur
e A
utho
rized
Pub
lic D
iscl
osur
e A
utho
rized
Pub
lic D
iscl
osur
e A
utho
rized
Pub
lic D
iscl
osur
e A
utho
rized
Pub
lic D
iscl
osur
e A
utho
rized
Pub
lic D
iscl
osur
e A
utho
rized

THE WORLD BANK GROUP
WORKING FOR A WORLD FREE OF POVERTY
The World Bank Group consists of fi ve institutions – the International Bank for Reconstruction
and Development (IBRD); International Finance Corporation (IFC); the International
Development Association (IDA); the Multilateral Investment Guarantee Agency (MIGA);
and the International Center for the Settlement of Investment Disputes (ICSID). Its mission
is to fight poverty for lasting results and to help people help themselves and their
environment by providing resources, sharing knowledge, building capacity, and forging
partnerships in the public and private sectors.
THE INDEPENDENT EVALUATION GROUP
ENHANCING DEVELOPMENT EFFECTIVENESS THROUGH EXCELLENCE AND INDEPENDENCE IN EVALUATION
The Independent Evaluation Group (IEG) is an independent, three-part unit within the
World Bank Group. IEG-IFC independently evaluates IFC’s investment projects and
Advisory Services operations that support private sector development. IEG-World Bank is
charged with evaluating the activities of the IBRD (The World Bank) and IDA, and IEG-MIGA
evaluates the contributions of MIGA guarantee projects and services. IEG reports directly
to World Bank Group’s Boards of Directors through the Director-General, Evaluation.
The goals of evaluation are to learn from experience, to provide an objective basis for
assessing the results of the World Bank Group’s work, and to provide accountability in
achieving its objectives. IEG seeks to improve World Bank Group work by identifying and
disseminating lessons learned from experience and by framing recommendations drawn
from evaluation fi ndings.

Independent Evaluation of IFC’s Development Results 2007
Lessons and Implications from
10 Years of Experience
2007
Washington, D.C.
I N D E P E N D E N T E V A L U A T I O N G R O U P
http://www.ifc.org/ieg

2008 © International Finance Corporation (IFC)
2121 Pennsylvania Avenue NW
Washington, D.C. 20433, USA
Telephone: 202-473-1000
Internet: www.ifc.org
All rights reserved
This volume, except for the “IFC Management Response to IEG-IFC” and “Chairperson’s Summary” is a product of
the Independent Evaluation Group (IEG) and the findings, interpretations, and conclusions expressed herein do not
necessarily reflect the views of IFC Management, the Executive Directors of the World Bank Group or the governments
they represent. This volume does not support any general inferences beyond the scope of the evaluation, including
any inferences about IFC’s past, current, or prospective overall performance.
The World Bank Group does not guarantee the accuracy of the data included in this publication and accepts no
responsibility whatsoever for any consequences of their use. The boundaries, colors, denominations, and other in-
formation shown on any map in a publication do not imply any judgment on the part of the World Bank Group con-
cerning the legal status of any territory or the endorsement or acceptance of such boundaries.
Rights and Permissions
The material in this publication is copyrighted. Copying and/or transmitting portions or all of this work without per-
mission may be a violation of applicable law. The World Bank Group encourages dissemination of its work and will
normally grant permission to reproduce portions of the work promptly.
For permission to photocopy or reprint any part of this work, please send a request with complete information to
the Copyright Clearance Center Inc., 222 Rosewood Drive, Danvers, MA 01923, USA; telephone: 978-750-8400; facsimile:
978-750-4470; Internet: www.copyright.com.
All other queries on rights and licenses, including subsidiary rights, should be addressed to the Office of
the Publisher, The World Bank, 1818 H Street NW, Washington, DC 20433, USA; facsimile: 202-522-2422; e-mail:
Photo: Teamwork on a construction site in Cairo, Egypt. Photograph by Amal Zarif Labib.
ISBN: 978-0-8213-7264-7
e-ISBN: 978-0-8213-7265-4
DOI: 10.1596/978-0-8213-7264-7
Library of Congress Cataloging-in-Publication Data have been applied for.
Printed on Recycled Paper
World Bank InfoShop
E-mail: [email protected]
Telephone: 202-458-4500
Facsimile: 202-522-1500
Independent Evaluation Group–IFC
E-mail: [email protected]
Telephone: 202-458-2299
Facsimile: 202-974-4302

Contents
vii Abbreviations
ix Acknowledgments
xi Foreword
xiii Avant-propos
xv Prólogo
xvii Executive Summary
xxi Résumé analytique
xxvii Resumen
xxxiii IFC Management Response to IEG-IFC
xxxix Chairperson’s Summary: Committee on Development Effectiveness (CODE)
1 1 Development Results of IFC-Supported Projects, 1996–20061 Substantial Increases in IFC Investment and Advisory Services Activities
3 Most IFC-Supported Projects Achieved High Development Ratings
8 Further Improvement Is Anticipated
10 No Trade-off between Development Results and IFC Investment Returns
11 Comprehensive Evaluation of IFC’s Development Effectiveness Remains a
Major Challenge
15 2 Lessons from 10 Years of Private Sector Development Evaluation15 Development Results Are Driven by Five Factors
15 A. Changes in the Quality of a Country’s Business Climate Following
Project Approval
17 B. Type of Industry Sector
18 C. Quality of the Sponsor
20 D. Level of Product Market, Client Company, and Project Type Risks
20 E. IFC Work Quality
24 Type of Financing Has Implications for Development Performance
25 Nature of Linkages between Investment and Advisory Services Activities Is
Also Important
25 Evaluation Provides a Basis for Better IFC Results
i i i

29 3 Strategic Implications for IFC 29 IFC Is Pursuing an Ambitious Growth Plan While Further Decentralizing
30 Stakeholder and Client Perspective: Need to Adopt a Deeper Country
Focus and Emphasize Distributional Issues
35 Internal Process Perspective: New Incentives and Mechanisms for
IFC–World Bank Cooperation Required
37 Human Capital Perspective: Ensure Robust Work Quality as IFC
Decentralizes
40 Financial and Measurement Perspective: Prepare for the Next Major
Market Correction and Improve Development Impact Measurement
43 4 Recommendations43 Meeting Stakeholder and Client Needs
44 Developing More Seamless World Bank Group Processes
44 Addressing Learning and Growth Needs
44 Financial and Measurement Issues
47 Appendixes49 A: Evaluation Methodology
53 B: Performance of IFC-Supported Projects and the Profitability of IFC
Investment Operations: Further Analysis
63 C: Definitions of Evaluation Terms
65 Endnotes
71 References
Boxes4 1.1 IEG Independently Rates the Development and Investment
Performance of IFC Operations
5 1.2 Examples of Successful and Less Successful IFC Projects
13 1.3 IFC Is Deepening Its Development Results Measurement but
Methodological Challenges Remain
14 1.4 IFC and World Bank Development Results Are Generally Not
Comparable
19 2.1 Examples of IFC Transport Investments in Brazil
21 2.2 IEG Evaluates IFC Work Quality across Three Underlying Indicators
22 2.3 IFC Faced Considerable Challenges Pursuing Sustainable PSD in
Africa
34 3.1 Examples of Successful Agribusiness and Rural Finance Operations
35 3.2 Examples of World Bank Group Cooperation
41 3.3 Examples of IFC’s Countercyclical Role during Previous Crises
Figures2 1.1 IFC Has Increased Its Private Investment Operations Sixfold since
1991
5 1.2 IFC Operations Can Help Reduce Poverty through a Chain of Events
7 1.3 Trends in Project Development Performance, 1996–2006
8 1.4 Projects with More High-Risk Factors Achieve Lower Development
Ratings
i v
I N D E P E N D E N T E VA L U AT I O N O F I F C ’ S D E V E L O P M E N T R E S U LT S 2 0 0 7

C O N T E N T S
v
9 1.5 Reduced Business Climate Risk Implies Higher Development
Ratings in 2007
11 1.6 IFC-Supported Projects Show No Trade-off between Development
Results and IFC Investment Returns
14 1.7 EBRD and IFC Achieved Similar Development Ratings on One
Subindicator
16 2.1 Much Riskier Business Climates in Africa, with Some Improvement
since 2003
16 2.2 Much Lower Private Investment in Africa Than Elsewhere
18 2.3 IFC Development Ratings Varied Considerably by Industry
Department
23 2.4 Supervision Quality Has Improved since 2001, Reflecting Several
Quality Enhancement Steps
25 2.5 IFC Is Increasing Its Provision of Local Currency Financing
31 3.1 Many Nonfrontier Countries Are as Lacking in Banking Capacity as
Frontier Countries
36 3.2 Implementation of World Bank Group Cooperation Differed from
What Was Planned in CASs
37 3.3 Follow-through on Cooperation Was Modest in Many Countries
39 3.4 IFC Faces a Knowledge-Retention Challenge
Tables3 1.1 IFC Is More Concentrated Than Other Private Capital in Frontier
Countries
6 1.2 Most IFC-Supported Projects Achieved High Development Ratings,
1996–2006
12 1.3 More Loan Than Equity Operations Achieved High Investment
Ratings
17 2.1 IFC Success Rates Are Significantly Better Where Country Business
Climate Risk Is Improving, or Not Deteriorating
19 2.2 IFC Project Development Results Improve Significantly with the
Presence of a High-Quality Sponsor
20 2.3 Product Market Risk Has a Strong Influence on IFC Project
Development Results
23 2.4 Good Quality Supervision Cannot Compensate Fully for Weak
Appraisal Quality
27 2.5 Evaluation Findings Have Provided a Basis for Better IFC Results in
Three Main Areas
33 3.1 IFC’s Financial Sector Development Success Rates Are Lower Where
Banking Capacity Is Weak
38 3.2 Drivers and Inhibitors of World Bank–IFC Cooperation
39 3.3 With Decentralization, the South Asia Region Improved Its Risk
Management in Key Areas


v i i
ABBREVIATIONS
CAS Country Assistance Strategy
DOTS Development Outcome Tracking System
EBRD European Bank for Reconstruction and Development
FI Financial intermediary
FY Fiscal year
GDP Gross domestic product
IEG Independent Evaluation Group
IFC International Finance Corporation
MIC Middle-income country
PSD Private sector development
SME Small and medium enterprise
XPSR Expanded Project Supervision Report


i x
Acknowledgments
This report was prepared by a team led by Dan
Crabtree and Hiroyuki Hatashima, drawing upon
research and contributions from Susan Chaffin,
Jouni Eerikainen, Nisachol Mekharat, Maria Elena
Pinglo, Stephen Pirozzi, Miguel Angel Rebolledo,
Cherian Samuel, and Victoria Viray-Mendoza. Yvette
Jarencio, Marylou Kam-Cheong, and Rosemarie
Pena provided general administrative support to
the study team. Helen Chin edited the report; and
Sid Edelmann, Sona Panajyan, and Vivian Jackson
managed its production and dissemination.
The evaluation was written with the guidance
of Nicholas Burke, Head of Micro Evaluation,
IEG-IFC; and Linda Morra-Imas, Head of Macro
Evaluation, IEG-IFC, and under the overall lead-
ership of Marvin Taylor-Dormond, Director,
IEG-IFC.
The report benefited substantially from the con-
structive advice and feedback from many staff at
IFC, and also from a number of Independent
Evaluation Group (IEG) colleagues in both IFC and
in the World Bank. Peer review was provided by
Nils Fostvedt (IEG-Bank) and David McKenzie
(Development Research Group, World Bank).
Director-General, Evaluation, World Bank Group
Vinod Thomas
Director, IEG-IFC Marvin Taylor-Dormond
Acting Manager Denis Carpio
Head of Macro Evaluation Linda Morra-Imas
Head of Micro Evaluation Nicholas Burke
Head, Communication, Knowledge and Quality Sidney Edelmann
Task Managers Dan Crabtree
Hiroyuki Hatashima
Study Team
Senior Environmental Specialist Jouni Eerikainen
Senior Evaluation Officer Stephen Pirozzi
Senior Evaluation Officer Miguel Angel Rebolledo
Evaluation Officer Cherian Samuel
Evaluation Analyst Nisachol Mekharat
Evaluation Analyst Maria Elena Pinglo
Evaluation Analyst Victoria Viray-Mendoza
x
x i
Foreword
As part of the World Bank Group, IFC’s overriding objective is to help
reduce poverty and support sustainable development in developing
countries. IFC pursues this mission by supporting the private sector
to create jobs and stimulate markets. This report, which assesses the impact
of IFC toward that mission, appears at a time of unprecedented levels of pri-
vate investment in the emerging markets.
The report takes a look back at the development
results that IFC-supported projects have achieved
in the last 10 years, the main lessons that have
emerged at the project level, and the strategic im-
plications for IFC going forward, in the context of
rapid organizational growth.
In the last decade, 59 percent of IFC-supported
projects (65 percent by volume) achieved high de-
velopment ratings. In addition, profitability and
development impact have tended to go together,
with about half of projects delivering high devel-
opment results and acceptable IFC returns, and
about one-third of projects achieving low devel-
opment rating and a less than acceptable IFC re-
turn. These results are expected to be sustained
for projects to be evaluated in 2007 and 2008, due
to improved project risk layering by IFC at ap-
proval and reduced business climate risk in many
client countries since project approval (in 2002 and
2003, respectively).
The report finds that IFC-supported project per-
formance is closely linked to the quality of a coun-
try’s business climate, the presence of a high-
quality sponsor, well-managed company and prod-
uct market risk, and in particular, to IFC’s work
quality (especially at the appraisal and structuring
stage, and including oversight of the environ-
mental and social effects of projects). There are
also several other factors that improve IFC’s qual-
ity of development impact: IFC’s ability to offer
local currency financing, its reach to small and
medium enterprises through financial interme-
diaries, and the nature of linkages between its in-
vestment and advisory services.
Going forward, the report highlights major chal-
lenges IFC faces to achieving overall develop-
ment effectiveness. IFC will need to adopt a
sharper country focus and better exploit synergies
with the Bank and other development partners
in improving business climates in developing

countries. Furthermore, rapid and increasingly
decentralized growth will need to be managed
carefully to ensure high work quality. Finally, risk-
management systems and risk-mitigation products
will have to continue to evolve to help IFC pre-
pare and deliver improved services to clients.
x i i
I N D E P E N D E N T E VA L U AT I O N O F I F C ’ S D E V E L O P M E N T R E S U LT S 2 0 0 7
Vinod Thomas
Director-General, Evaluation

x i i i
Avant-propos
En tant qu’institution du Groupe de la Banque mondiale, la Société fi-
nancière internationale (IFC) a avant tout pour objectif de promouvoir
la réduction de la pauvreté et de favoriser un développement durable
dans les pays en développement. Elle s’acquitte de cette mission en aidant le
secteur privé à créer des emplois et à stimuler les marchés. Ce rapport, qui
évalue la contribution de l’IFC à cette mission, paraît à un moment où l’in-
vestissement privé sur les marchés émergents atteint des niveaux sans précédent.
Le rapport fait le bilan des accomplissements des
projets financés par l’IFC au cours des dix dernières
années au plan du développement, reprend les
principales leçons qui se dégagent au niveau des
projets et analyse leurs implications pour la stra-
tégie future de la Société dans le contexte de la
croissance rapide de l’organisation.
Au cours des dix dernières années, 59 % des pro-
jets soutenus par l’IFC (65 % en volume) ont ob-
tenu des notes élevées pour leur impact sur le
développement. Rentabilité et impact sur le dé-
veloppement vont, par ailleurs, généralement de
pair : la moitié environ des projets affichent de
bons résultats en termes de développement et un
taux de rentabilité acceptable pour l’IFC, et en-
viron un tiers des projets obtiennent une note mé-
diocre en termes de développement et un taux
de rentabilité moins qu’acceptable pour l’IFC. Il
devrait en être de même pour les projets dont
l’évaluation est prévue en 2007 et en 2008 par suite
d’une meilleure segmentation des risques liés
aux projets par l’IFC au moment de l’approbation
et de la réduction des risques liés au climat des
affaires dans de nombreux pays clients après l’ap-
probation des projets (respectivement en 2002 et
en 2003).
Le rapport conclut que la performance des projets
financés par l’IFC est étroitement liée à la qualité
du climat des affaires dans un pays, à la présence
d’une solide entité parrainante, à la bonne gestion
de l’entreprise, à la maîtrise du risque de marché
et, en particulier, à la qualité des interventions de
l’IFC (notamment au stade de l’évaluation et de la
structuration, et durant la supervision de l’impact
environnemental et social des projets). Plusieurs
autres facteurs améliorent la qualité de l’impact des
interventions de l’IFC au plan du développement :
la possibilité qu’elle a de proposer des finance-
ments en monnaie nationale et de faire profiter les
petites et moyennes entreprises de son action

par le biais d’intermédiaires financiers, et la nature
des liens existant entre ses opérations d’investis-
sement et ses services-conseil.
Le rapport expose les difficultés majeures que
rencontrera l’IFC à l’avenir pour assurer l’effica-
cité générale de son action de développement. La
Société devra axer davantage ses interventions sur
chaque pays et mieux exploiter les synergies avec
la Banque et les autres partenaires de dévelop-
pement pour améliorer le climat des affaires dans
le monde en développement. Elle devra aussi
gérer avec soin la rapide expansion et décentra-
lisation de ses activités pour en assurer la qualité.
Enfin, il importera que les systèmes de gestion et
les produits d’atténuation des risques continuent
d’évoluer pour lui permettre de concevoir et de
fournir de meilleures prestations à ses clients.
x i v
I N D E P E N D E N T E VA L U AT I O N O F I F C ’ S D E V E L O P M E N T R E S U LT S 2 0 0 7
Vinod Thomas
Directeur général, Évaluation

x v
Prólogo
Como parte del Grupo del Banco Mundial, el objetivo principal de la Cor-
poración Financiera Internacional (IFC, por su sigla en inglés) es ayu-
dar a reducir la pobreza y apoyar el desarrollo sostenible en países en
desarrollo. La IFC trata de cumplir este objetivo brindando apoyo al sector pri-
vado, a fin de crear puestos de trabajo y estimular a los mercados. Este informe,
en el que se evalúa el impacto de la IFC en el contexto de esa misión, se pu-
blica en un momento en el que la inversión privada registra niveles sin pre-
cedentes en mercados emergentes.
El informe contempla los resultados de desarro-
llo que han logrado los proyectos respaldados
por la IFC en los últimos 10 años, las principales
lecciones que se obtuvieron a nivel de los pro-
yectos y las consecuencias estratégicas a futuro
para la Corporación, en el contexto de un rápido
crecimiento institucional.
En la última década, el 59% de los proyectos res-
paldados por la IFC (un 65% en términos de vo-
lumen) logró altas calificaciones de desarrollo.
Además, el impacto sobre el desarrollo y la ren-
tabilidad han tendido a producirse en forma con-
junta: cerca de la mitad de los proyectos generó
resultados altos en términos de desarrollo y re-
tornos aceptables para la IFC, mientras que un ter-
cio de los proyectos alcanzó una baja calificación
de desarrollo y retornos para la IFC por debajo de
lo aceptable. Se espera que estos resultados se
mantengan en los proyectos a evaluar en 2007 y
2008, gracias una mejora en la estructuración de
riesgo del proyecto por parte de la IFC al mo-
mento de la aprobación y una reducción del
riesgo del ambiente para los negocios en mu-
chos países clientes desde la aprobación de los
proyectos (en 2002 y 2003, respectivamente).
El informe concluye que el desempeño de los pro-
yectos respaldados por la IFC está íntimamente re-
lacionado con la calidad del ambiente para los
negocios de un país, con la presencia de un pa-
trocinador de calidad, con una buena gestión del
riesgo de empresas y del mercado de productos y,
en especial, con la calidad del trabajo de la IFC (es-
pecialmente en la etapa de evaluación y estructu-
ración, y también en la supervisión de los impactos
ambientales y sociales de los proyectos). Existen
muchos otros factores que mejoran la calidad del
impacto de la IFC en términos de desarrollo: la
capacidad de la IFC para ofrecer financiamiento
en moneda nacional, su alcance a pequeñas y
medianas empresas a través de intermediarios

financieros y el carácter de la integración entre
sus servicios de inversión y asesoría.
A futuro, el informe destaca algunos importantes
desafíos que enfrenta la IFC al momento de lograr
eficacia en términos de desarrollo general. La IFC
tendrá que adoptar un enfoque más específico
para cada país y aprovechar de mejor manera las
sinergias con el Banco y otros socios de desarro-
llo, a fin de mejorar el ambiente para los negocios
en los países en desarrollo. Además, será preciso
gestionar cuidadosamente el crecimiento rápido
y cada vez más descentralizado si se pretende ga-
rantizar la calidad del trabajo. Por último, es ne-
cesario que los sistemas de gestión de riesgo y los
productos de mitigación de riesgo sigan evolu-
cionando para que la IFC pueda preparar y pres-
tar mejores servicios a los clientes.
x v i
I N D E P E N D E N T E VA L U AT I O N O F I F C ’ S D E V E L O P M E N T R E S U LT S 2 0 0 7
Vinod Thomas
Director General, Evaluación

x v i i
Executive Summary
This is the tenth annual review by the Independent Evaluation Group
of the International Financial Corporation (IEG-IFC).1 In each review,
IEG assesses IFC’s performance in promoting sustainable private sec-
tor development in all developing countries. The 2007 review affords IEG the
opportunity to look back at a decade of results for IFC’s private sector oper-
ations, and to ask
• Have IFC-supported projects achieved sound
development results—financially, economically,
environmentally, and socially?
• What has been learned about private sector de-
velopment after 10 years of evaluation?
• What are the strategic implications for IFC in im-
proving its development performance in the
next few years?
Development Results of IFC-SupportedProjects, 1996–2006IFC’s development role is clearly mandated in its
Articles of Agreement and Mission Statement.
Article 1 states that IFC will “seek to stimulate, and
to help create conditions conducive to the flow
of private capital, domestic and foreign, into pro-
ductive investment in member countries.” In
seeking to deliver development impact, IFC pur-
sues a fourfold mission: to promote open and
competitive markets, to support companies and
other private sector partners, to generate pro-
ductive jobs and deliver basic services, and to cre-
ate opportunities for people to escape poverty
and improve their lives. IFC uses two types of de-
velopment intervention: financial products and
advisory services.
Since 1991, IFC has increased its financial activities
approximately sixfold, investing approximately $50
billion in developing countries through its loan
and equity operations. Including funds provided by
cofinanciers, IFC-supported projects have consis-
tently made up about 4 percent of all private cap-
ital flows to developing countries. IFC investments
are more than twice as concentrated as foreign di-
rect investment in what the institution considers
to be frontier countries—defined as low-income by
the World Bank, and/or high risk.2 IFC investments
also account for about 30 percent of International
Finance Institution private sector volumes. The
World Bank provided approximately $340 billion of
assistance to the governments of developing coun-
tries during this time, with much more static, year-
on-year volume changes than those of IFC.

Majority of Evaluated Projects Achieved HighDevelopment RatingsOut of 627 investment operations approved dur-
ing 1991–2001, and evaluated between 1996 and
2006 (as the projects reached operating matu-
rity),3 59 percent (65 percent by volume) achieved
high development ratings at the project level. That
is, most projects were, on balance, delivering (and
were expected to deliver in the long run) sustain-
able results—across indicators measuring their fi-
nancial, economic, environmental, and social
performance—as well as contributing to private sec-
tor development generally. These results in part re-
flect the market test that IFC projects face, meaning
they cannot be compared directly with those of
public-sector-oriented development institutions
such as the World Bank.4 Performance has varied
significantly by sector and by region, with the re-
sults of IFC-supported projects in Africa lagging
those in other regions, mainly due to the more chal-
lenging business climates and weaker environ-
mental and social compliance among IFC’s clients.
Profitability and Development Impact UsuallyGo Hand-in-HandIn addition to evaluating the development re-
sults of IFC-supported projects, IEG also examines
whether its investment operations contribute
positively to IFC’s own profitability (and thus its
ability to fund its future operations from retained
earnings). To achieve a high investment return
rating, a loan must be expected to be repaid as
scheduled, while an equity investment should
provide IFC with a return above that of a loan,
commensurate with the extra instrument risk.
Although fewer equity investments are judged
successful on this basis (31 percent had above-
benchmark returns, compared with 74 percent for
loans), those that are deemed so contribute to
high overall portfolio returns for IFC.
When the investment results of IFC operations
are considered alongside project development
results, about a half of IFC projects evaluated
during 1996–2006 had high-high ratings (high
development ratings at the project level and an
acceptable IFC investment return from the op-
eration) while about a third had low-low ratings
(low development results; less than acceptable
IFC investment return). This shows that IFC has
not actively supported projects where there was
a trade-off between development results and in-
vestment returns. Projects fail to achieve high-high
ratings for a number of reasons, including the in-
herent commercial risk in different industry sec-
tors, adverse business climates, poor sponsor
quality, or shortfalls in IFC’s work quality.
Comprehensive Assessment of IFC’sDevelopment Effectiveness Is ChallengingIFC is making significant improvements in how it
measures development performance at the proj-
ect level, but methodological challenges remain
before IFC can fully identify its overall develop-
ment effectiveness at the sector, country, regional
and global levels. IFC’s monitoring and self-
evaluation systems have advanced such that IFC
is starting to measure its development results
across its portfolio of investment and advisory
operations (primarily through a Development
Outcome Tracking System introduced in 2005).
Building on that progress, these systems will need
to evolve to capture the wider sector and coun-
try impacts of the projects that IFC supports.
There has been gradual progress toward harmo-
nizing the private sector evaluation standards of
multilateral development institutions. While this
has resulted in an agreed set of good practice
standards, with which IFC is largely compliant,
comparing IFC’s performance against those of
other private sector international finance institu-
tions remains challenging–not least because of
varying institutional mandates and objectives.
Lessons from 10 Years of Private SectorDevelopment Evaluation
Five Factors Have Driven ProjectPerformanceThere is no magic formula guaranteed to deliver
sustainable private sector development across all
IFC operations. Nonetheless, after 10 years of
evaluation, five factors are seen to significantly in-
fluence IFC’s development performance at the
project level:
x v i i i
I N D E P E N D E N T E VA L U AT I O N O F I F C ’ S D E V E L O P M E N T R E S U LT S 2 0 0 7

• Changes in the quality of a country’s business
climate following project approval;
• Type of industry sector in which an investment
is made;
• Quality of the sponsor;
• Level of product market, client company, and
project type risks; and
• IFC work quality.
The extent to which IFC is able to offer local cur-
rency options, whether it offers financing directly
or indirectly to small and medium enterprises, and
the nature of the linkages between advisory ser-
vices and investment activities also have impor-
tant consequences for private sector development.
IFC Work Quality Has Been Most Important The quality of IFC’s own project execution and su-
pervision (particularly of environmental and social
effects) has been the most critical influence on the
development results of IFC-supported projects.
This is especially so in Africa, where IFC has, in cer-
tain cases, mitigated very high business climate risk
through high-quality due diligence and appro-
priate project structuring. However, IFC’s work
quality in Africa has generally lagged behind other
regions (work quality was rated high in 45 percent
of operations in Africa, compared with 68 per-
cent of operations in other regions), highlighting
the greater risks that IFC was willing to take his-
torically in the region, as well as challenges in
recruiting and retaining suitably experienced staff.
Strategic Implications for IFC
IFC Has Made Sound Strategic Choices Overallbut Challenges RemainEvaluation findings from the past decade broadly
support IFC’s core directions and priorities.
Operations in strategic frontier countries and sec-
tors have generally yielded above-average devel-
opment results, and IFC has improved its balancing
of project risks at approval and its quality of proj-
ect supervision overall. At the same time, evalua-
tion findings also point to potential areas of risk
and of opportunities for IFC in the context of the
challenges it set for itself in its 2006 Strategic Di-
rections paper.5 These include greater develop-
ment impact, improved World Bank Group co-
operation, leadership in standard setting, im-
proved client satisfaction, sound finances, and a
strong staff.
IFC Must Develop a Sharper Country Focus,Especially in Middle-Income CountriesIFC has successfully mobilized funding from a
variety of sources to support operations in high-
risk and low-income countries in pursuit of its fron-
tier strategy. IFC could now seek to define more
sharply its role and priorities in nonfrontier
middle-income countries (MICs),6 where approxi-
mately one-third of all people who subsist on less
than $2 a day live, and where IFC carries out most
of its investment operations. Lack of capacity in
domestic financial markets means that many MICs
are like low-income countries in having limited or
zero availability of long-term, local currency fi-
nance, as a result of which exposure to devalua-
tion risk is a widespread problem for enterprises
forced to borrow in foreign currency. Infrastruc-
ture to support production and trade is another
challenge in many MICs, as is tackling large pock-
ets of rural poverty. A valuable role for IFC there-
fore still exists in many MICs. However, IFC has
achieved very weak development results when it
has supported projects in which its additionality
in MICs was not clear, emphasizing the need for
IFC to understand clearly the private sector de-
velopment dynamics in a country and to identify
where its comparative advantage lies so that it can
effectively complement existing capital flows.
New Incentives and Mechanisms for WorldBank Group Cooperation Are NeededA stronger country focus could complement IFC’s
sector and regional efforts, in part by helping to
identify opportunities for enhanced coopera-
tion with the World Bank7 in areas of synergy such
as business climate improvement, deepening of
financial sector capacity, infrastructure develop-
ment and environmental and social impact. Co-
operation in these areas has brought development
gains in counties as diverse as Mexico, the Philip-
pines, and Senegal, and is of utmost importance in
Africa, which has fallen far behind other developing
markets. In practice, cooperation between IFC
E X E C U T I V E S U M M A R Y
x i x

and the World Bank in areas of synergy has not
reached the level envisaged in Country Assistance
Strategies (CASs), and evaluation has uncovered
as many inhibitors as facilitators of cooperation.
CASs have seldom provided a good framework for
cooperation, and new incentives and mechanisms
to complement the CAS would be desirable.
IFC Must Ensure Sound Work Quality as ItDecentralizesIFC’s current strategy seeks greater development
impact through a scaling up of investment and
advisory services operations, and stronger local
representation through further decentraliza-
tion of IFC operations. IFC will need to be fully
cognizant of the possible trade-offs among rapid
growth, organizational change, and project exe-
cution quality. During a previous period of sig-
nificant organizational change in 1998–2001,
supervision quality fell sharply. Effectively retain-
ing staff and knowledge are already areas needing
attention and such challenges are amplified with
further decentralization. IFC might learn from the
World Bank’s experiences with knowledge man-
agement under highly decentralized structures.
Continued Strengthening of Risk MitigationRequiredExperience highlights how markets can quickly
withdraw financial support for companies in re-
sponse to adverse economic or political events.
Despite the current investment optimism among
investors in much of the developing world, IFC
could explicitly address in its strategy the threat
of a global investment decline, its likely impact on
clients, and any mitigating actions that would
be necessary. Planning now to improve risk-
management systems, and developing new risk-
mitigating products to soften the impact for
clients, would strengthen IFC’s ability to respond
to future economic shocks as well as enhance its
countercyclical role.
RecommendationsIn seeking to address the many challenges that the
IFC faces, IFC Management will need to pursue
the following recommendations (see chapter 4 for
further details):
• From a client and stakeholder perspective,
(i) Adopt more tailored country strategies,
to complement its strong sector and re-
gional approach, including through the
development and pursuit of a set of
country-specific private sector develop-
ment indicators.
(ii) In its country strategies, flag opportunities
to work on the nexus of rural poverty and
sustainable natural resources, on which
poor people depend, and to identify and
develop high-impact agribusiness and rural
microfinance projects with widespread
demonstration effects, while at the same
time providing leadership for promoting
socially and environmentally sustainable
practices.
• From an internal process perspective, enhance
cooperation with the World Bank in areas of
synergy,
(i) By considering, with the Bank, new in-
centives and mechanisms for cooperation
to complement the CAS process.
(ii) By identifying investments at approval that
were facilitated by Bank policy or regula-
tory assistance to a government, and track-
ing them throughout the project cycle
(through IFC’s Development Outcome
Tracking System or other means) to judge
their success.
• From a human capital perspective, monitor the
decentralization process closely to ensure that
IFC work quality remains robust and is sup-
ported by a rigorous training program for new
investment staff.
• From a financial and measurement perspective,
(i) Make continued efforts to improve its
risk-management systems and to pre-
pare for the next correction in the inter-
national markets, including perhaps the
extended use and development of new
risk-mitigation products.
(ii) With IEG’s support, advance its metrics to
understand better (and derive lessons
about) the wider sector and country-level
impacts of the projects that IFC supports.
x x
I N D E P E N D E N T E VA L U AT I O N O F I F C ’ S D E V E L O P M E N T R E S U LT S 2 0 0 7

x x i
Résumé analytique
Cet examen est le dixième effectué sur une base annuelle par le Groupe
indépendant d’évaluation de la Société financière internationale (IEG-
IFC)1. Dans le cadre de chaque examen, l’IEG évalue la mesure dans
laquelle l’IFC a réussi à promouvoir un développement durable du secteur privé
dans tous les pays en développement. L’examen 2007 a été l’occasion pour
le Groupe de faire le point des résultats des opérations menées par l’IFC dans
le cadre du secteur privé au cours des dix dernières années pour tenter de
répondre aux question suivantes :
• Les projets soutenus par l’IFC ont-ils abouti à
de bons résultats en matière de développe-
ment — aux plans financier, économique, en-
vironnemental et social ?
• Quels enseignements peut-on tirer des évalua-
tions réalisées au cours des dix dernières années
pour le développement du secteur privé ?
• L’amélioration de l’impact de l’IFC sur le dé-
veloppement au cours des prochaines années
a-t-elle des implications stratégiques ?
Résultats au plan du développement desprojets soutenus par l’IFC, 1996–2006Le rôle de l’IFC en matière de développement
ressort clairement de ses Statuts et de sa mission.
L’Article 1 stipule que l’IFC « s’efforcera de sti-
muler et de promouvoir les conditions favorisant
le courant du capital privé local et étranger vers
des investissements de caractère productif dans
les pays membres ». Dans le but de produire un
impact sur le développement, l’IFC poursuit quatre
objectifs principaux : promouvoir des marchés
ouverts et compétitifs, appuyer les entreprises et
autres partenaires du secteur privé, générer des
emplois productifs et fournir des services de base,
et créer des opportunités pour permettre aux po-
pulations d’échapper à la pauvreté et d’améliorer
leurs conditions de vie. L’IFC poursuit son action
de développement en ayant recours à deux ins-
truments : les produits financiers et les services-
conseil.
Depuis 1991, l’IFC a approximativement sextuplé
ses activités de financement et a investi environ
50 milliards de dollars dans des pays en déve-
loppement dans le cadre de ses opérations de prêt
et ses prises de participations. Si l’on prend en
compte les montants qu’elle a mobilisés sous
forme de cofinancements, les projets appuyés
par l’IFC ont systématiquement absorbé l’équi-
valent d’environ 4 % du total des entrées de ca-
pitaux privés dans les pays en développement. La

proportion des investissements de l’IFC destinés
aux pays qu’elle considère pionniers — c’est-à-dire
des pays à faible revenu (tels que définis par la
Banque) et/ou présentant des risques élevés2 —
est deux fois plus élevée que celle des investis-
sements étrangers directs allant à ces pays. Les in-
vestissements de l’IFC représentent également
environ 30 % des volumes alloués au secteur privé
par les institutions financières internationales.
Pendant cette période, la Banque mondiale a ac-
cordé aux gouvernements des pays en dévelop-
pement une aide à hauteur de 340 milliards de
dollar environ, affichant des variations bien moins
prononcées en glissement annuel que celle de
l’IFC.
La majorité des projets évalués ont été jugésavoir un fort impact sur le développement Sur les 627 opérations d’investissement approu-
vées durant la période 1991-2001 et évaluées
entre 1996 et 2006 (une fois que les projets ont
atteint leur régime de croisière)3, 59 % des pro-
jets (65 % en volume) ont été jugés avoir un fort
impact sur le développement. En d’autres termes,
la plupart des projets affichent dans l’ensemble
des résultats durables (qui devraient perdurer à
long terme) pour l’ensemble des indicateurs de
performance aux plans financier, économique,
environnemental et social — tout en contribuant
t au développement général du secteur privé.
Ces résultats traduisent en partie le fait que les pro-
jets de l’IFC subissent l’épreuve du marché, de
sorte qu’ils ne peuvent pas être directement com-
parés avec ceux d’institutions de développement
dont les activités sont axées sur le secteur public
comme la Banque mondiale4. Les performances
varient considérablement selon les secteurs et
les régions ; les résultats des projets appuyés par
l’IFC sont moins bons en Afrique que dans d’autres
régions en grande partie parce que le climat des
affaires y est moins favorable et que les clients de
l’IFC y respectent moins les normes environne-
mentales et sociales.
Rentabilité et résultats au plan dudéveloppement vont habituellement de pairOutre qu’il évalue l’impact sur le développement
des projets soutenus par l’IFC, IEG examine si ses
opérations d’investissement contribuent à assu-
rer la rentabilité de l’IFC elle-même (et donc sa
capacité de financer ses opérations futures à par-
tir des bénéfices mis en réserve). Pour qu’une note
élevée soit attribuée au titre de la rentabilité de
l’investissement, il faut pouvoir compter, s’il s’agit
d’un prêt, qu’il sera remboursé conformément au
calendrier établi et, s’il s’agit d’une prise de par-
ticipation, qu’elle aura un taux de rendement su-
périeur à celui d’un prêt compte tenu du risque
supplémentaire qu’elle comporte. Bien que la
proportion des prises de participation affichant
de bons résultats à cet égard (31 % ont produit
des rendements supérieurs à la référence, contre
74 % des prêts), celles qui sont jugées profitables
contribuent aux bons rendements du portefeuille
global de l’IFC.
Lorsque l’on considère à la fois la rentabilité des
opérations de l’IFC et leur impact sur le déve-
loppement, la moitié environ des projets de l’IFC
évalués pendant la période de 1996 à 2006 affi-
chent une double note élevé-élevée (un impact
élevé du projet au plan du développement et
une rentabilité de l’investissement acceptable
jugée par l’IFC) tandis qu’environ un tiers des pro-
jets affichent une double note faible-faible (ils ont
un faible impact sur le développement et ont une
rentabilité jugée moins qu’acceptable pour l’IFC).
On peut en déduire que l’IFC n’a pas cherché à
appuyer des projets pour lesquels il importait
de trouver un compromis entre l’impact sur le dé-
veloppement et la rentabilité de l’investissement.
La note élevé-élevée peut ne pas être attribuée à
un projet pour diverses raisons, notamment le
risque de marché associé à différentes branches
d’activité, un climat des affaires défavorable, des
entités parrainantes présentant des insuffisances
ou la qualité insuffisante des travaux de l’IFC.
Il est difficile d’évaluer précisémentl’efficacité de l’action de l’IFC au plan dudéveloppement L’IFC a entrepris d’améliorer considérablement la
façon dont elle mesure l’impact sur le dévelop-
pement au niveau des projets, mais il lui faudra
encore résoudre des problèmes méthodologiques
pour pouvoir pleinement identifier son efficacité
globale en matière de développement au niveau
sectoriel, de même qu’à l’échelle nationale, ré-
gionale et mondiale. Les systèmes de suivi et
d’autoévaluation de l’IFC ont été perfectionnés de
x x i i
I N D E P E N D E N T E VA L U AT I O N O F I F C ’ S D E V E L O P M E N T R E S U LT S 2 0 0 7

sorte que l’institution commence à mesurer ses
résultats de développement pour l’ensemble de
son portefeuille d’opérations d’investissement et
de services-conseil (essentiellement grâce à un sys-
tème de suivi de l’impact de ses opérations d’in-
vestissement mis en place en 2005). Sur cette
base, les systèmes devront évoluer de manière à
permettre de prendre en compte les impacts plus
vastes des projets bénéficiant de l’appui de l’IFC
au niveau sectoriel et à l’échelle nationale.
Les efforts d’harmonisation des normes d’éva-
luation du secteur privé utilisées par les institutions
de développement multilatérales progressent.
S’ils ont bien débouché sur l’adoption d’un en-
semble de normes de bonne pratique, que suit de
manière générale l’IFC, il reste difficile de comparer
la performance de la Société à celles d’autres ins-
titutions internationales de financement du sec-
teur privé, ne serait-ce que parce qu’elles ont une
mission et des objectifs institutionnels différents.
Les leçons tirées de l’évaluation dudéveloppement du secteur privé sur unepériode de dix ans
Cinq facteurs contribuent à déterminer lesrésultats des projetsIl n’existe pas de formule magique qui garantisse
que toutes les opérations de l’IFC produiront un
développement durable du secteur privé. Il res-
sort néanmoins des évaluations réalisées sur une
période de dix ans que cinq facteurs ont un im-
pact considérable sur les résultats obtenus par
l’IFC au plan du développement au niveau de
ses projets :
• l’évolution de la qualité du climat des affaires
dans un pays après l’approbation d’un projet ;
• le secteur d’activité dans lequel un investisse-
ment est réalisé ;
• la qualité de l’entité parrainante ;
• le niveau de développement du marché pour
les produits, la société cliente et les risques
liés au type de projet ; et
• la qualité des interventions de l’IFC.
La mesure dans laquelle l’IFC peut proposer des
financements en monnaie nationale, directement
ou indirectement, aux petites et moyennes en-
treprises, et la nature des liens entre les services-
conseil et les activités d’investissement ont aussi
des conséquences importantes pour le dévelop-
pement du secteur privé.
La qualité des interventions de l’IFC est unfacteur d’une importance majeure La qualité de l’exécution et de la supervision des
projets par l’IFC (surtout en ce qui concerne leurs
effets environnementaux et sociaux) est le facteur
le plus déterminant des résultats des projets
appuyés par l’IFC en matière de développement.
C’est le cas tout particulièrement en Afrique, où
l’IFC a parfois atténué les risques très élevés as-
sociés au climat des affaires grâce à des travaux pré-
paratoires minutieux et une conception bien
adaptée des projets. Toutefois, la qualité des in-
terventions de l’IFC est généralement moins bien
notée en Afrique que dans les autres régions (la qua-
lité a été jugée élevée dans 45 % des opérations me-
nées en Afrique, contre 68 % des opérations
effectuées dans d’autres régions), ce qui montre
que l’IFC est généralement disposée à prendre
des risques plus importants dans la région et té-
moigne de la difficulté de recruter, de former et de
conserver un personnel doté d’une expérience
suffisante.
Les implications stratégiques pour l’IFC
L’IFC a, dans l’ensemble, effectué de bonschoix stratégiques mais des problèmespersistentLes conclusions des évaluations effectuées au
cours des dix dernières années confortent les
orientations et les priorités fondamentales de
l’IFC. Les opérations entreprises dans des pays et
des secteurs pionniers d’importance stratégique
ont en général produit des résultats supérieurs à
la moyenne et l’IFC a amélioré sa capacité de ges-
tion des risques des projets au stade de l’appro-
bation ainsi que la qualité globale de ses activités
de supervision. Les conclusions de l’évaluation
identifient cependant certaines sources poten-
tielles de risques et d’opportunités pour l’IFC au
regard des défis qu’elle s’est fixée dans ses Notes
d’orientation stratégique 20065. Au nombre de ces
orientations, on peut citer un plus grand impact
sur le développement, une coopération plus
étroite avec les autres institutions du Groupe de
R É S U M É A N A LY T I Q U E
x x i i i

la Banque mondiale, un rôle moteur dans la défi-
nition des normes, une amélioration de la satis-
faction de ses clients, une assise financière solide
et un personnel de haut calibre.
L’IFC doit cibler ses interventions plusprécisément sur les pays, en particulier lespays à revenu intermédiaireL’IFC a réussi à mobiliser des financements au-
près d’une variété de bailleurs pour appuyer des
opérations dans des pays présentant des risques
élevés et à faible revenu afin de poursuivre sa stra-
tégie axée sur les marchés pionniers. Elle pourrait
désormais s’efforcer de mieux définir son rôle et
ses priorités dans les pays à revenu intermédiaire
non pionniers6, où vit environ un tiers de ceux qui
ont moins de deux dollars par jour pour subsister
et où l’IFC réalise la plupart de ses opérations
d’investissement. Compte tenu de la capacité in-
suffisante des des marchés des capitaux natio-
naux, de nombreux pays à revenu intermédiaire
n’ont, dans le meilleur des cas, qu’un accès limité,
comme les pays à faible revenu, à des capitaux à
long terme en monnaie nationale ; de ce fait, les
entreprises sont obligées de contracter des em-
prunts en devises, et sont donc de manière gé-
nérale exposées au risque d’une dévaluation. Les
infrastructures nécessaires aux activités de pro-
duction et aux échanges sont un autre problème
auquel se heurtent beaucoup de pays à revenu in-
termédiaire, tout comme l’élimination de vastes
poches de pauvreté rurales. L’IFC a donc encore
un rôle important à jouer dans de nombreux pays
à revenu intermédiaire. Elle a toutefois obtenu
des résultats médiocres au plan du développe-
ment lorsqu’elle a appuyé des projets dans ces pays
sans que l’additionalité de sa contribution ait été
clairement établie, ce qui montre que l’IFC doit
bien comprendre la dynamique du développe-
ment du secteur privé d’un pays et identifier les
domaines dans lesquels elle jouit d’un avantage
comparatif de manière à pouvoir compléter effi-
cacement les flux de capitaux existants.
Nécessité de mettre en place de nouvellesincitations et de nouveaux mécanismes decoopération pour le Groupe de la BanquemondialeUn ciblage de ses interventions au niveau natio-
nal permettrait à l’IFC de compléter les efforts
qu’elle déploie aux niveaux sectoriel et régional,
en partie en l’aidant à identifier les possibilités
d’une coopération renforcée avec la Banque mon-
diale7 dans des domaines où il existe des syner-
gies comme l’amélioration du climat des affaires,
le développement des circuits financiers, le dé-
veloppement des infrastructures et l’impact en-
vironnemental et social. Les travaux menés en
collaboration dans ces domaines ont eu un impact
positif sur le développement dans des pays aussi
divers que le Mexique, les Philippines et le Séné-
gal, et ils revêtent une importance primordiale
dans le cas de l’Afrique, qui a pris beaucoup de
retard par rapport à d’autres marchés en déve-
loppement. Dans la pratique, la coopération entre
l’IFC et la Banque mondiale dans les domaines où
il existe des synergies n’a pas été aussi étroite
que prévu dans les Stratégies d’aide-pays (CAS),
et les évaluations ont révélé autant de facteurs
pouvant inhiber la coopération que de facteurs
pouvant la favoriser. Les CAS ont rarement consti-
tué un bon cadre de coopération ; il serait donc
souhaitable de mettre en place de nouvelles me-
sures incitatives et de nouveaux mécanismes pour
compléter ces dernières.
L’IFC doit veiller à la bonne qualité de sesinterventions alors qu’elle poursuit sonprocessus de décentralisation La stratégie actuelle de l’IFC vise à accroître son
impact en termes de développement en élargis-
sant l’ampleur de ses opérations d’investissement
et de services-conseil et en étant plus présente sur
le terrain grâce à la poursuite de la décentralisa-
tion de ses activités. La Société devra être plei-
nement consciente des compromis qu’elle
pourrait devoir accepter entre une rapide ex-
pansion, les transformations organisationnelles et
la qualité de l’exécution des projets. Lorsqu’elle
a procédé à un profond remaniement de sa struc-
ture en 1998–2001, la qualité des activités de
supervision a chuté. L’IFC doit déjà veiller à conser-
ver son personnel et à maintenir son savoir ins-
titutionnel de manière efficace, et les difficultés
qu’elle peut rencontrer à ces égards iront en s’ag-
gravant avec la poursuite du processus de dé-
centralisation. Elle pourrait profiter des leçons
de l’expérience de la Banque mondiale en matière
de gestion du savoir dans le cadre de structures
fortement décentralisées.
x x i v
I N D E P E N D E N T E VA L U AT I O N O F I F C ’ S D E V E L O P M E N T R E S U LT S 2 0 0 7

L’expérience montre la rapidité avec laquelle les
marchés peuvent retirer leur soutien financier
aux entreprises lorsque surviennent des pro-
blèmes économiques ou politiques défavorables.
Malgré l’optimiste dont font preuve les investis-
seurs dans une grande partie du monde en dé-
veloppement, l’IFC pourrait clairement définir
sa stratégie de manière à faire face à la menace
d’une contraction des investissements à l’échelle
mondiale, à l’impact probable de cette contraction
sur ses clients et à considérer toute mesure d’at-
ténuation qui pourrait s’avérer nécessaire. Plani-
fier d’ores et déjà les dispositions à prendre pour
améliorer les systèmes de gestion des risques et
mettre au point de nouveaux produits d’atté-
nuation des risques pour amortir les impacts sur
ses clients renforcerait la capacité de l’IFC de
faire face à de futurs chocs économiques et de
conforter son rôle de stabilisation conjoncturelle.
RecommandationsPour relever les nombreux défis auxquels la SFI
se trouve confrontée, son équipe de direction
devra mettre en œuvre les recommandations sui-
vantes (décrites plus en détail au chapitre 4).
• Pour ses clients et parties prenantes,
i) elle devra adopter des stratégies mieux
adaptées au contexte national pour com-
pléter son approche axée sur les secteurs
et les régions, notamment en élaborant et
en utilisant une série d’indicateurs du dé-
veloppement du secteur privé propre à
chaque pays ;
ii) dans le cadre de ses stratégies par pays, elle
devra signaler les opportunités de traiter
les questions indissociables de la pauvreté
rurale et de la gestion durable des res-
sources naturelles dont les populations
pauvres sont tributaires ; et identifier et
développer des projets d’agroindustrie et
de microfinance rurale ayant un fort impact
et pouvant avoir de vastes effets de dé-
monstration, tout en menant les efforts
de promotion de pratiques durables dans
les domaines social et environnemental.
• Au niveau des procédures internes, elle devra
coopérer davantage avec la Banque mondiale
dans les domaines où il est possible d’exploi-
ter des synergies,
i) en examinant, avec la Banque, de nou-
velles incitations et de nouveaux méca-
nismes de coopération pour compléter le
processus des CAS ;
ii) en identifiant au stade de l’approbation
les investissements qui ont été facilités par
l’assistance fournie par la Banque dans le
domaine de l’action publique ou du cadre
réglementaire et en assurant leur suivi du-
rant tout le cycle du projet (grâce au sys-
tème de suivi des réalisations au plan du
développement ou par d’autres moyens)
pour déterminer leurs résultats.
• Du point de vue du capital humain, l’IFC devra
suivre attentivement le déroulement du pro-
cessus de décentralisation pour s’assurer que
la qualité de ses interventions demeure satis-
faisante et que les nouveaux chargés d’inves-
tissement bénéficient d’un programme de
formation rigoureux.
• S’agissant du financement et de l’évaluation,
i) l’IFC devra systématiquement s’efforcer
d’améliorer ses systèmes de gestion du
risque et se préparer à faire face à la pro-
chaine correction sur les marchés interna-
tionaux, notamment peut-être en utilisant
de manière plus générale des produits d’at-
ténuation des risques et en formulant de
nouveaux.
ii) l’IFC devra, avec l’appui d’IEG, développer
son système d’indicateurs pour mieux dé-
terminer les impacts plus généraux des
projets soutenus par l’IFC au plan sectoriel
et à l’échelle nationale, et en tirer les en-
seignements nécessaires.
R É S U M É A N A LY T I Q U E
x x v


x x v i i
Resumen
Ésta es la décima revisión anual de la Corporación Financiera Internacional
(IFC, por su sigla en inglés) que realiza el Grupo de Evaluación Inde-
pendiente (GEI)1. En cada revisión, el GEI evalúa el desempeño de la
IFC en la promoción del desarrollo sustentable del sector privado en los paí-
ses en desarrollo. La revisión de 2007 le ofrece al GEI la oportunidad de ana-
lizar retrospectivamente una década de resultados para las operaciones de la
IFC en el sector privado y preguntarse
• Si los proyectos respaldados por la IFC logra-
ron resultados sólidos en términos de desa-
rrollo financiero, económico, ambiental y social;
• Qué se aprendió acerca del desarrollo del sec-
tor privado luego de 10 años de evaluación, y
• Si hay consecuencias estratégicas para la IFC en
la mejora de su desempeño en términos de de-
sarrollo en los próximos años.
Resultados en términos de desarrollo delos proyectos respaldados por la IFC,1996–2006El rol de la IFC en relación con el desarrollo está
claramente establecido en su Convenio Consti-
tutivo y en su Misión. El Artículo 1 establece que
la IFC “tratará de estimular y de ayudar a la crea-
ción de condiciones que favorezcan el flujo de ca-
pital privado, local y extranjero, hacia una inversión
productiva en los países miembros”. Para generar
un impacto en términos de desarrollo, la IFC
lleva a cabo una misión con cuatro facetas: la pro-
moción de mercados abiertos y competitivos, el
apoyo a empresas y a otros asociados del sector
privado, la generación de puestos de trabajo pro-
ductivos y la prestación de servicios básicos, y la
creación de oportunidades para que las personas
escapen de la pobreza y mejoren sus vidas. La IFC
utiliza dos tipos de intervención para el desarro-
llo: los instrumentos financieros y la asistencia de
asesoría.
Desde 1991, la IFC ha aumentado sus actividades
financieras aproximadamente seis veces, con una
inversión de cerca de US$50.000 millones en paí-
ses en desarrollo, a través de sus operaciones de
préstamos e inversiones en capital social. Si se in-
cluyen los fondos provistos por cofinanciadores,
los proyectos respaldados por la IFC han repre-
sentado de manera sostenida cerca del 4% de
todos los flujos de capital privado hacia países en
desarrollo. Las inversiones de la IFC tienen más
del doble de concentración que la inversión
extranjera directa en los países que la institución
denomina “de frontera” (aquéllos que el Banco

Mundial define como “país de ingreso bajo” y/o paí-
ses de alto riesgo)2. Las inversiones de la IFC tam-
bién representan cerca del 30% de los volúmenes
del sector privado en la Institución Financiera In-
ternacional. El Banco Mundial suministró aproxi-
madamente US$340.000 millones en concepto
de asistencia para los gobiernos de países en de-
sarrollo durante este período, con cambios año a
año en los volúmenes mucho más estáticos que
los de la IFC.
La mayoría de los proyectos evaluados logróaltas calificaciones de desarrolloDe las 627 operaciones de inversión aprobadas du-
rante el período 1991–2001 y evaluadas entre
1996 y 2006 (a medida que los proyectos alcan-
zaban la madurez operativa)3, el 59% (un 65% en
términos de volumen) logró altas calificaciones de
desarrollo a nivel de los proyectos. En otras pa-
labras, la mayoría de los proyectos, en términos
generales, generó resultados sostenibles (y se
espera que sigan generándolos a largo plazo) en
relación con los indicadores que miden el de-
sempeño financiero, económico, ambiental y
social, además de contribuir en general con el
desarrollo del sector privado. Estos resultados
reflejan en parte la prueba de mercado que en-
frentan los proyectos de la IFC, es decir, que no
pueden compararse directamente con los de ins-
tituciones de desarrollo orientadas al sector pú-
blico, como el Banco Mundial4. El desempeño
ha variado en forma significativa entre los distin-
tos sectores y regiones: por ejemplo, los proyec-
tos respaldados por la IFC en África estuvieron
rezagados respecto de los de otras regiones, prin-
cipalmente debido a ambientes más desafiantes
para los negocios y al menor cumplimiento am-
biental y social entre los clientes de la IFC.
El impacto en términos de desarrollo y larentabilidad suele producirse en formaconjuntaAdemás de evaluar los resultados en términos de
desarrollo de los proyectos respaldados por la IFC,
el GEI también analiza si las operaciones de in-
versión contribuyen en forma positiva con la pro-
pia rentabilidad de la IFC (y, por lo tanto, con su
capacidad para financiar proyectos futuros a par-
tir de utilidades no distribuidas). A fin de lograr
un mayor nivel de retorno sobre la inversión,
debe esperarse que un préstamo se reembolse en
el tiempo estipulado, mientras que una inversión
en capital debería suministrar a la IFC un retorno
superior al de un préstamo, proporcional al riesgo
extra que implica el vehículo. Aunque son menos
las inversiones en capital que se consideran exi-
tosas en estos términos (un 31% registró retornos
por encima de los puntos de referencia, propor-
ción que en el caso de los préstamos fue de un
74%), aquéllas que en efecto se consideran exi-
tosas contribuyeron con los elevados retornos
generales de la cartera de la IFC.
Cuando se analizan los resultados de inversión de
las operaciones de la IFC junto con los resultados
de los proyectos en términos de desarrollo, cerca
de la mitad de estos proyectos evaluados durante
el período 1996–2006 recibió calificaciones alta-
alta (calificaciones altas en términos de desarro-
llo a nivel de los proyectos y un retorno sobre la
inversión de la IFC aceptable), mientras que un
tercio recibió calificaciones baja-baja (resulta-
dos pobres en términos de desarrollo y retorno
sobre la inversión de la IFC por debajo de lo acep-
table). Esto muestra que la IFC no ha respaldado
activamente los proyectos donde había un dese-
quilibrio entre los resultados en términos de de-
sarrollo y los retornos sobre la inversión. Son
varias las causas por las que los proyectos no lo-
gran calificaciones alta-alta: los riesgos comer-
ciales inherentes de distintos sectores industriales,
ambientes adversos para los negocios, baja cali-
dad de los patrocinadores o deficiencia en la
calidad del trabajo de la IFC.
La evaluación integral de la eficacia entérminos de desarrollo de la IFC constituye undesafíoSi bien la IFC está logrando mejoras significativas
en relación con la forma de medir el desempeño
en términos de desarrollo a nivel de los proyec-
tos, aún debe resolver algunos desafíos metodo-
lógicos antes de determinar su eficacia en términos
de desarrollo general a niveles sectoriales, nacio-
nales, regionales e internacionales. Los sistemas
de control y autoevaluación de la IFC han pro-
gresado a punto tal que la IFC está comenzando
a medir sus resultados de desarrollo en toda su car-
x x v i i i
I N D E P E N D E N T E VA L U AT I O N O F I F C ’ S D E V E L O P M E N T R E S U LT S 2 0 0 7

tera de operaciones de asesoría e inversión (prin-
cipalmente a través de un sistema de seguimiento
de sus operaciones introducido en 2005). Sobre
la base de ese progreso, estos sistemas tendrán que
evolucionar para reflejar los efectos más amplios
(a nivel sectorial y regional) de los proyectos que
apoya la IFC.
Se ha registrado un progreso gradual al momento
de armonizar los estándares con los que las ins-
tituciones multilaterales de desarrollo evalúan el
sector privado. Si bien esto ha generado un con-
junto consensuado de estándares de prácticas
modelo respecto del cual la IFC muestra un ele-
vado grado de cumplimiento, la comparación del
desempeño de la IFC con la de otras institucio-
nes financieras internacionales del sector privado
sigue siendo un desafío, debido en gran parte a
las diferencias que existen entre los cometidos y
los objetivos de las instituciones.
Lecciones extraídas de los 10 años deevaluación del desarrollo del sectorprivado
Los cinco factores que han intervenido en eldesempeño de los proyectosNo existe una fórmula mágica que garantice un de-
sarrollo sostenible del sector privado en todas
las operaciones de la IFC. Sin embargo, tras 10
años de evaluación, todo indica que hay cinco fac-
tores que influyen significativamente sobre el de-
sempeño de la IFC en términos de desarrollo a
nivel de los proyectos:
• Cambios en la calidad del ambiente para los ne-
gocios de un país luego de la aprobación del
proyecto;
• Tipo de sector industrial en el que se hace una
inversión;
• Calidad del patrocinador;
• Nivel de riesgos del mercado del producto, de
la empresa cliente y del tipo de proyecto, y
• Calidad del trabajo de la IFC.
Existen otros factores que tienen importantes
consecuencias para el desarrollo del sector privado:
hasta qué punto la IFC puede ofrecer opciones en
moneda nacional, si ofrece financiamiento en
forma directa o indirecta a pequeñas y medianas
empresas y el carácter de la integración entre
los servicios de asesoría y las actividades de
inversión.
La calidad del trabajo de la IFC ha sido muyimportante La calidad de la ejecución y la supervisión de pro-
yectos por parte de la IFC (en especial de los
efectos sociales y ambientales) ha representado
la influencia más crítica sobre los resultados en tér-
minos de desarrollo de los proyectos respaldados
por la IFC. Esto es especialmente claro en África,
donde la IFC, en algunos casos, ha logrado miti-
gar riesgos muy altos en el ambiente para los ne-
gocios mediante un procedimiento de diligencia
debida de calidad y una estructuración de pro-
yectos adecuada. Sin embargo, la calidad del tra-
bajo de la IFC, en general, se ha visto retrasada
respecto de otras regiones (la calidad del trabajo
se calificó como “alta” en el 45% de las operacio-
nes de África, proporción que llegó al 68% en las
operaciones realizadas en otras regiones), lo cual
resalta los mayores riesgos que la IFC ha estado
dispuesta a aceptar históricamente en la región,
además de reflejar los desafíos al momento de con-
tratar, capacitar y retener personal con experien-
cia adecuada.
Consecuencias estratégicas para la IFC
En general, la IFC ha tomado decisionesestratégicas acertadas, pero aún quedandesafiosLos resultados de la evaluación de la última dé-
cada apoyan, en general, las orientaciones estra-
tégicas y las prioridades de la IFC. Las operaciones
en países y sectores de frontera estratégicos pre-
sentaron, en su mayoría, resultados superiores al
promedio en términos de desarrollo, mientras
que la IFC logró un mejor equilibrio entre los
riesgos del proyecto al momento de la aprobación
y una mejor supervisión general de los proyectos.
Al mismo tiempo, los resultados de la evaluación
también resaltan algunas posibles áreas de ries-
gos y oportunidades para la IFC en el contexto de
los desafíos que se planteó en su documento de
Orientación Estratégica de 20065, tales como
mayor impacto en términos de desarrollo, mejor
R E S U M E N
x x i x

cooperación con el Grupo del Banco Mundial,
liderazgo al momento de definir estándares, mejor
satisfacción del cliente, finanzas sólidas y perso-
nal capacitado.
La IFC debe desarrollar un enfoque másespecífico para cada país, en especial enpaíses de ingreso medianoLa IFC ha logrado movilizar financiamiento de
una variedad de fuentes para apoyar operaciones
en países de alto riesgo e ingreso dentro del marco
de su estrategia con respecto a los países de fron-
tera. La IFC podría tratar ahora de definir con
mayor exactitud su rol y sus prioridades en países
de ingreso mediano no calificados como “de fron-
tera”6, donde vive aproximadamente un tercio
de las personas que subsisten con menos de dos
dólares por día y donde la IFC realiza la mayor
parte de sus operaciones de inversión. La falta de
capacidad en los mercados financieros internos im-
plica que muchos países de ingreso mediano se
asemejan a países de ingreso bajo porque tienen
una disponibilidad nula o reducida de financia-
miento en moneda nacional a largo plazo, a raíz
de lo cual la exposición al riesgo de devaluación
pasa a ser un problema generalizado para las em-
presas que se ven obligadas a pedir préstamos
en moneda extranjera. La infraestructura que res-
palda la producción y el comercio constituye otro
desafío en muchos países de ingreso mediano,
como lo es enfrentar el problema de los grandes
focos de pobreza rural. Por lo tanto, aún existe una
función valiosa que puede cumplir la IFC en mu-
chos países de ingreso mediano. Sin embargo, la
IFC ha conseguido resultados muy débiles en tér-
minos de desarrollo cuando brindó apoyo a pro-
yectos en los que la adicionalidad en países de
ingreso mediano no estaba clara, lo cual enfatiza
la necesidad de que la IFC comprenda claramente
la dinámica de desarrollo en el sector privado en
un país y determine dónde están sus ventajas
comparativas, a fin de poder complementar con
eficacia los flujos de capital existentes.
Se necesitan nuevos incentivos y mecanismospara la cooperación dentro del Grupo delBanco MundialUn enfoque más específico para cada país podría
complementar las iniciativas sectoriales y regio-
nales de la IFC, lo cual permitiría en parte detec-
tar oportunidades de mejorar la cooperación con
el Banco Mundial7 en áreas de sinergia como la
mejora del ambiente para los negocios, la pro-
fundización de la capacidad del sector financiero,
el desarrollo de infraestructura y el impacto am-
biental y social. La cooperación en estas áreas ha
traído mejoras en el desarrollo en países tan di-
versos como Filipinas, México y Senegal, y es ex-
tremadamente importante en África, región que
se ha rezagado respecto de otros mercados en de-
sarrollo. En la práctica, la cooperación entre la IFC
y el Banco Mundial en áreas de sinergia no ha
alcanzado el nivel previsto en las Estrategias de
Asistencia a los Países (EAP), y las evaluaciones de-
terminaron que existen tantos factores que obs-
taculizan la cooperación como factores que la
promueven. En general, las EAP no han suminis-
trado un buen marco para la cooperación, por lo
que sería bueno contar con nuevos incentivos y
mecanismos para complementarlas.
La IFC debe asegurar una sólida calidad detrabajo a la par de la descentralización La estrategia actual de la IFC busca un mayor im-
pacto en términos de desarrollo a través de la in-
tensificación de las operaciones del servicio de
asesoría y la inversión, y una representación local
más sólida por medio de una mayor descentrali-
zación de las operaciones de la IFC. La IFC deberá
estar consciente de los posibles equilibrios entre
el rápido crecimiento, la reestructuración y la ca-
lidad de la ejecución de los proyectos. Durante un
período anterior de considerables cambios insti-
tucionales en 1998-2001, la calidad de la supervi-
sión disminuyó drásticamente. La retención
efectiva del personal y los conocimientos ya son
áreas que requieren atención, y estos desafíos se
magnifican con la mayor descentralización. La
IFC podría aprender de las experiencias del Banco
Mundial en la gestión de los conocimientos bajo
estructuras altamente descentralizadas.
La experiencia pone de relieve cómo los merca-
dos pueden retirar rápidamente el apoyo finan-
ciero para las empresas en respuesta a los
acontecimientos políticos o económicos adversos.
Pese al actual optimismo respecto de la inver-
sión entre los inversores de gran parte del mundo
x x x
I N D E P E N D E N T E VA L U AT I O N O F I F C ’ S D E V E L O P M E N T R E S U LT S 2 0 0 7

en desarrollo, la IFC podría tratar explícitamente
en su estrategia la amenaza de un descenso glo-
bal de la inversión, sus posibles efectos para los
clientes y cualquier medida que pueda ser nece-
saria para mitigarlos. Planificar ahora la mejora de
los sistemas de gestión del riesgo y desarrollar nue-
vos productos para mitigar los riesgos y así amor-
tiguar los efectos para los clientes fortalecería la
capacidad de la IFC de responder a los futuros im-
pactos económicos, y también incrementaría su
rol contracíclico.
RecomendacionesPara abordar los diversos desafíos que enfrenta la
institución, la administración de la IFC deberá
seguir las siguientes recomendaciones (véase el ca-
pítulo 4 para obtener información más detallada).
• Desde una perspectiva de clientes y partes
interesadas,
i) Adoptar estrategias de país más persona-
lizadas, para complementar su sólido en-
foque sectorial y regional, incluso a través
del desarrollo y la búsqueda de una serie
de indicadores de desarrollo del sector
privado específicos para cada país.
ii) En sus estrategias de país, resaltar las opor-
tunidades para trabajar en el vínculo entre
la pobreza rural y los recursos naturales
sostenibles, del que depende la población
pobre, y para identificar y desarrollar ne-
gocios agrícolas de alto impacto y pro-
yectos de microfinanzas rurales con efectos
de demostración generalizada, y al mismo
tiempo proporcionar el liderazgo para fo-
mentar prácticas ambiental y socialmente
sostenibles.
• Desde una perspectiva de proceso interno, in-
crementar la cooperación con el Banco Mun-
dial en las áreas de sinergia
i) Analizando, junto con el Banco, nuevos in-
centivos y mecanismos de cooperación
para complementar el proceso de EAP.
ii) Identificando inversiones en proceso de
aprobación que fueron facilitadas por el
asesoramiento del Banco a un gobierno en
materia de regulación o políticas, y su-
pervisándolas a lo largo del ciclo del pro-
yecto (a través del Sistema de Seguimiento
de Operaciones de la IFC o por otros me-
dios) para evaluar su éxito.
• Desde una perspectiva de capital humano, con-
trolar de cerca el proceso de descentralización
para asegurar que la calidad del trabajo de la IFC
se mantenga sólida y se vea respaldada por un
riguroso programa de capacitación para el
nuevo personal de inversión.
• Desde una perspectiva de la medición y las fi-
nanzas,
i) Realizar esfuerzos duraderos para mejo-
rar sus sistemas de gestión del riesgo y
prepararse para la próxima corrección en
los mercados internacionales, incluyendo
quizás el uso extendido y el desarrollo de
nuevos productos para mitigar los riesgos.
ii) Con el respaldo del GEI, mejorar sus in-
dicadores para comprender mejor los im-
pactos en el sector más amplio y en los
países de los proyectos que respalda la
IFC, y aprender de ellos.
R E S U M E N
x x x i

x x x i i i
IFC ManagementResponse to IEG-IFCIndependent Evaluation of IFC’s Development Results 2007: Lessons and Implications from 10 Years of Experience*
Management greatly welcomes IEG-IFC’s tenth, independent, annual
review of evaluation findings. This year’s annual review takes stock
of eleven years of project approvals, from 1991 to 2001 (evaluated
in 1996–2006).
IntroductionManagement notes that IEG-IFC’s independent
evaluation found that IFC had positive develop-
ment impacts and profitable investment opera-
tions. The report indicates that most of IFC’s
projects have consistently performed well in terms
of financial, economic, environmental, and so-
cial aspects, and have had good impacts on pri-
vate sector development. This performance was
achieved while IFC’s projects were exposed to all
the risks that are associated with private sector in-
vestments in the developing world.
We are encouraged by IEG-IFC’s independent find-
ing that IFC has generally made sound corporate-
wide strategic choices. The report found that IFC
has successfully scaled up its investment and ad-
visory operations in frontier counties (high risk
and low income) and in priority sectors, such as
infrastructure. More importantly, the report shows
that investment operations have largely yielded
above-average development results in these pri-
ority areas.
We also note that the report indicates that im-
pacts on private sector development of IFC’s proj-
ects have been strong and reached well beyond the
project company. Among other results, these proj-
ects had broad positive demonstration effects,
stimulating follow-on investments by other in-
vestors, downstream and upstream business link-
ages, and increased competition. Some contributed
to domestic capital markets development by pro-
viding increased access to finance and introducing
new financing instruments.
The report also found a consistently strong posi-
tive correlation between development and in-
vestment results. This supports IFC’s long-standing
* Distributed to IFC’s Board of Directors on April 11, 2007, and
discussed by the Board’s Committee on Development Effec-
tiveness on April 25, 2007. Released by IFC in accordance
with IFC’s Policy on Disclosure of Information.

operating principle of pursuing projects that are
both developmentally and financially viable over
the long term.
IFC takes on more risks than other investors, cat-
alyzing private investments where the private sec-
tor would not go alone. In some markets, such as
in Sub-Saharan Africa, IFC took on higher coun-
try risks, in line with its development agenda.
The evaluation findings should be interpreted in
this context, recognizing that success rates will re-
flect the higher risks the Corporation undertakes.
The 1991–2006 period in which the evaluated
projects operated saw major financial crises, in-
cluding those in Asia, Argentina, Mexico, Russia,
Turkey, and Brazil. IFC remained focused during
these years of high risk and market volatility, quickly
responding to crises through countercyclical in-
vestments, as well as enhanced portfolio operations
to support its existing clients. This allowed IFC to
mobilize scarce capital for the private sector in
difficult times and help boost liquidity in affected
economies. At the same time, IFC remained
forward-looking by pursuing a strategy to reach
markets and sectors where it can deliver greater
development impacts and strong additionality.
Looking forward, Management welcomes IEG-
IFC’s finding that more recent commitments are
poised to have greater development impacts. The
report indicates that IFC’s overall work quality, a
key driver of success, is on the uptrend and proj-
ect risks are better mitigated. In addition, the im-
proving investment climates in many countries
where IFC operates suggests greater develop-
ment results, given IEG-IFC’s finding that devel-
opment impacts are better when investment
climates are improving. Nevertheless, as IFC con-
tinues to take on significant project risks, actual
results will depend on many factors, including
market performance.
Management recognizes that there may be op-
portunities for IFC to enhance its development ef-
fectiveness and finds this report valuable in
informing IFC in this regard. Management agrees
with the general direction of the report’s rec-
ommendations. Specific responses to each rec-
ommendation follow.
Responses to Specific Recommendations
IEG-IFC Recommendation: Develop a deeper,more differentiated country approach. As IFC decentralizes, it has the opportunity to
adopt more tailored country strategies, to com-
plement its strong sector and regional approach.
This strategy might include, in consultation with
the Bank and country governments, the devel-
opment and pursuit of a set of country specific pri-
vate sector development indicators (such as for
the level of private, gross fixed capital formation;
banking sector capacity; and private provision of
infrastructure).
Management Response Management agrees with the recommendation
to develop a more differentiated country approach.
Current IFC strategic processes already involve
developing country level strategies that feed into
Country Assistance Strategies (CASs) and into
IFC’s regional strategies that form part of IFC’s
Strategic Directions Paper. Because of the com-
monality of certain characteristics, regional de-
partments are also able to group countries with
similar needs and issues for the purpose of de-
veloping a coordinated approach. For example, in
Sub-Saharan Africa, countries are grouped in four
categories: (i) post-conflict (such as the Demo-
cratic Republic of Congo and Liberia); (ii) natural
resource rich (such as Nigeria and Tanzania);
(iii) middle income (such as South Africa and Mau-
ritius); and (iv) others (such as Mali and Niger).
Similar approaches are used in other regions.
Building on this base of activity, IFC is seeking
to strengthen its country focus. As discussed in
IFC Strategic Directions, FY08-10: Creating Op-
portunity (chapter 2), IFC is working to develop
greater systemic approaches to its activities, which
will be done at the country or sector level. In
addition, increased IFC staff country presence
through its phased decentralization should also fa-
cilitate a more country-focused strategic approach.
With respect to the suggestion to develop macro
private sector development targets, we need to
study this more carefully to determine what is
feasible and meaningful, considering the difficulty
in attributing country-wide macro indicators to IFC
x x x i v
I N D E P E N D E N T E VA L U AT I O N O F I F C ’ S D E V E L O P M E N T R E S U LT S 2 0 0 7

operations. IFC could also benefit from IEG-IFC
findings on which private sector development tar-
get indicators have worked in other institutions.
In the meantime, IFC is working on advancing its
metrics on outcomes and impacts that can clearly
be attributed to IFC’s projects, advisory activi-
ties, and systemic approaches. These metrics
could serve as IFC targets, but they will have to
be tried on perhaps one or two countries on a pilot
basis. There may be some issues with respect to
the burden on clients for certain types of re-
porting. Therefore, IFC will need to assess the fea-
sibility of this approach.
In addition, IFC has on-going work with the World
Bank in providing broad indicators that coun-
tries may use to track private sector develop-
ment. The joint World Bank/IFC annual Doing
Business report is one example which has been
increasingly used by many countries in setting
targets in their reform agenda for improving in-
vestment climates.
Another joint World Bank/IFC initiative in indicator-
setting is the on-going development of the “Private
Sector at a Glance” tables. These one-page per
country tables cover almost 60 key private sector
indicators encompassing: (i) economic and so-
cial context (such as inflation rate and size of labor
force); (ii) investment climate (such as ease of
doing business ranking and number of proce-
dures to start a business); (iii) private sector
investment (such as private participation in infra-
structure and net private FDI); (iv) regulation and
taxes (such as time dealing with government of-
ficials and corporate tax rate); (v) finance and
banking (such as total financial system deposit
and bank branches per one hundred thousand
people); and (vi) infrastructure (such as paved
roads and electric power outages).
IEG-IFC Recommendation: Place an emphasison rural development. In its country strategies, IFC may consider flagging
opportunities to work on the nexus of rural
poverty and sustainable natural resources, on
which poor people depend, and to identify and
develop high-impact agribusiness and rural mi-
crofinance projects with widespread demonstra-
tion effects, while simultaneously providing lead-
ership in promoting socially and environmentally
sustainable practices.
Management Response In the FY08–10 Strategic Directions paper, IFC in-
corporated agribusiness into the five strategic
priorities. Over the past five years, IFC’s com-
mitments in the agribusiness sector have grown
significantly and development outcomes have
also improved. IFC is now intending to further in-
crease its involvement in this sector by, for ex-
ample, developing wholesale financing solutions
using financial intermediaries, processors, and
traders.
IFC is also doing some rural microfinance. How-
ever, beyond agribusiness and a few rural micro-
finance projects, further study is needed to
understand how to be effective in rural areas, given
that the results so far appear to be mixed. Man-
agement would welcome IEG-IFC’s input on les-
sons learned from successful models of private
sector rural finance to inform this recommendation.
With respect to the suggestion of providing lead-
ership to promote socially and environmentally
sustainable practices, IFC addresses this through
its sustainability pillar. Following Board approval
and formal launch of the performance standards
in 2006, IFC’s focus has been on sound imple-
mentation of the performance standards. To main-
tain its environmental and social sustainability
leadership, IFC will continue to provide support
for the further adoption and implementation of
the Equator Principles. In addition, IFC is com-
mitted to scaling up its activities in renewable
energy and energy efficiency sectors.
IEG-IFC Recommendation: Pursue newincentives and mechanisms to enhancecooperation with the World Bank in areas ofsynergy. To enhance cooperation with the World Bank in
areas of synergy, IFC could (i) consider new in-
centives and mechanisms to complement the
CAS process (with the Bank); and (ii) identify in-
vestments at approval that were facilitated by
Bank policy or regulatory assistance and track
them throughout the project cycle (through the
I F C M A N A G E M E N T R E S P O N S E T O I E G - I F C
x x x v
Development Outcome Tracking System (DOTS)
or other means) in order to judge their success.
Management Response Management agrees with the recommendation of
enhancing cooperation with the Bank. Leveraging
the strengths of the whole World Bank Group
will become more important as IFC aims to in-
crease its development impact and increase its sys-
temic interventions. In past years, IFC has taken
several steps in this direction, from increased
focus by IFC Senior Management (including in-
viting senior World Bank staff to IFC’s strategy
discussions), to including World Bank Group co-
operation as part of the performance appraisal for
managers in Sub-Saharan Africa, to a World Bank
Group review of advisory services to assess syn-
ergies. In addition, the World Bank and IFC have
a joint Vice Presidency Unit (VPU) for Financial and
Private Sector Development; the Vice President
of this VPU is also IFC’s Chief Economist. There
are also joint departments in a number of core sec-
tors: oil, gas, mining, information and communi-
cation technology, and subnationals.
Going forward, IFC envisages increasing cooper-
ation with the World Bank as the Corporation
adopts systemic and programmatic approaches to
scaling up activities. Typically, a systemic approach
to a sector would start with upstream advisory
work on the business-enabling environment and/or
privatization, often building on efforts of the World
Bank and the government. IFC can then partici-
pate in the financing of associated projects, as
appropriate. In addition, IFC and World Bank co-
operation will be enhanced by the implementation
of IFC’s phased decentralization program. This
should provide more opportunities for increased
World Bank-IFC staff contacts in the field.
With respect to the recommendation to identify
and track performance of investments with World
Bank/IFC cooperation, IFC will consider this along
with the other work it is doing on metrics, such
as DOTS, systemic metrics, and advisory metrics.
An important issue to consider is the extent to
which the performance of projects can be partly
attributed to good World Bank Group cooperation.
IEG-IFC Recommendation: Manage the trade-offs inherent in the decentralization process toachieve the highest possible work quality. IFC will need to monitor the decentralization
process closely to ensure that its work quality re-
mains robust, and support this with a rigorous
training program for new investment staff.
Management Response Management agrees with the recommendation of
ensuring that work quality remains high as IFC
implements its phased decentralization. IFC is tak-
ing a number of steps to help ensure sustained
work quality. More experienced/senior industry
staff will be located in regional operations cen-
ters to mentor and provide leadership to more jun-
ior investment staff. Credit officer(s) will similarly
be stationed in operations centers and will be in-
volved in field-based investment decisions. Field
presence of environment and social specialists
will be increased to further mainstream sustain-
ability into IFC’s investment work, mitigate envi-
ronmental and social risks, and ensure sustainability
in clients’ operations. In addition, as discussed
below, IFC is undertaking several steps to enhance
its risk management function in connection with
the decentralization. Finally, the decentralization
is being undertaken in a phased approach, first in
Asia, and then in other regions over three years.
This approach allows IFC to learn from experi-
ence and revise implementation processes, as
needed, based on these experiences.
IFC is also developing a knowledge manage-
ment initiative to maintain global expertise as
decentralization deepens. This would include
department-level training at entry (on-boarding)
and structured activities for sharing knowledge.
This initiative would complement the current IFC
induction program and credit courses, which
have proven to be effective.
IEG-IFC Recommendation: Ensure sound risk-management systems and develop risk-mitigation products. IFC will need to make continued efforts to im-
prove its risk-management systems and to prepare
for the next correction in the international mar-
x x x v i
I N D E P E N D E N T E VA L U AT I O N O F I F C ’ S D E V E L O P M E N T R E S U LT S 2 0 0 7

kets, including perhaps the extended use and
development of new risk-mitigation products.
Management ResponseManagement agrees with this recommendation.
IFC has in the past responded well to such crises
by supporting its portfolio projects and under-
taking countercyclical investments such as trade fi-
nancing, as well as debt and equity funding. IFC’s
FY08-10 Strategic Directions paper acknowledges
that current conditions in markets where it oper-
ates could change should there be financial crises.
IFC’s growth strategy takes into consideration the
need to maintain financial capacity to accommo-
date the impact of possible financial crises. IFC
stands ready to play a countercyclical role, with in-
struments such as trade lines and other support,
including advisory services, to select clients.
IFC is undertaking several steps to improve over-
all risk management and thereby better prepare
IFC for the next crises. As part of the decentral-
ization initiative, the risk-management function will
be transformed to facilitate improved client ser-
vice and efficiency, while retaining appropriate
checks and balances on decentralized decision
making. Steps in this direction include: (i) the
ongoing Business Process Review to streamline
and strengthen operational procedures; (ii) shift-
ing credit review and, eventually, most aspects of
risk management decision-making to the field;
(iii) enhanced corporate tools for risk manage-
ment, including improved risk-rating systems;
(iv) integration of development-impact metrics
with financial risk-return metrics; (v) enhanced re-
porting of all metrics; and (vi) strengthening of in-
formation technology (IT) for more efficient and
effective document processing and management.
IEG-IFC Recommendation: Strengthen thecapacity for evaluation and its application. As it deepens its self-evaluation and monitoring
systems, IFC could, with IEG-IFC’s assistance, ad-
vance its metrics to better understand (and derive
lessons about) the wider sector and the country-
level impacts of its operations.
Management ResponseIFC agrees with the recommendation of deepen-
ing its evaluation and monitoring system in con-
sultation with IEG-IFC. In the past, IFC has
consulted with IEG-IFC on the development of
its monitoring and self-evaluation system, that
is, DOTS for investment operations and the proj-
ect completion report (PCR) for advisory services.
Both DOTS and PCRs are already contributing
to increased development focus through clear
objective-setting and tracking of outcomes. The
PCR for advisory services, which is in the pilot
stage, is being supplemented by thematic impact
evaluations.
As the report mentions, DOTS is starting to sup-
plement expanded project supervision reports
(XPSRs) by providing results that cover IFC’s en-
tire portfolio (rather than a sample) and are more
up-to-date. DOTS provides an earlier, prelimi-
nary indication of results, and takes into account
developments after the XPSR is written. The data
from DOTS feed into IFC’s strategic decision
making. Both XPSRs and DOTS already cover
broader impacts beyond the client company.
On evaluating country and sector-wide impacts of
IFC’s operations and drawing lessons from them,
IFC already routinely considers the results of its
projects, including impacts beyond the client com-
pany. IEG-IFC’s country and sector evaluations
are also providing valuable insights. Tracking coun-
try and sector-wide metrics will, however, not
make sense in all cases, because IFC’s investments
are often a relatively small share of private in-
vestment, making attribution of country-level re-
sults to IFC’s activities difficult or even meaningless.
However, as noted earlier, there could be scope
for a pilot test.
I F C M A N A G E M E N T R E S P O N S E T O I E G - I F C
x x x v i i


x x x i x
Chairperson’s Summary: Committee on Development Effectiveness (CODE)
On April 25, 2007 the Committee on Development Effectiveness (CODE)
met to discuss the Independent Evaluation Group–IFC (IEG) report
entitled Independent Evaluation of IFC’s Development Results 2007:
Lessons and Implications from 10 Years of Experience and the Draft Man-
agement Response.
Summary of Evaluation ReportThis tenth IEG annual review of evaluation findings
took stock of the performance of 627 investment
operations approved during 1991–2001 and eval-
uated in 1996–2006, and drew on other evaluative
materials to highlight lessons and strategic impli-
cations for IFC going forward. The report’s main
findings were: (i) 59 percent of IFC-supported
projects (65 percent by volume) achieved high
development ratings at the project level; (ii) de-
velopment outcomes and IFC profitability tend
to go hand in hand; (iii) five factors—changes in
business climate; type of industry sector; quality
of the sponsor; level of product market, client
company, and project type risks; and IFC work
quality—have significantly influenced the devel-
opment outcomes of IFC-supported projects; and
(iv) IFC has generally made sound strategic choices.
IEG recommended that IFC should: (1) develop
a deeper, more differentiated country approach;
(2) place emphasis on rural development, espe-
cially through support for agribusiness and rural
microfinance projects; (3) pursue new incentives
and mechanisms to enhance cooperation with
the Bank in areas of synergy; (4) manage the fric-
tions resulting from a combination of the decen-
tralization process, scaling up of operations, and
improving work quality; (5) ensure sound risk
management systems, and develop risk mitigation
products for clients, to cope with the risks ema-
nating from the next correction in the global fi-
nancial market; and (6) strengthen the capacity
for evaluation and its application.
Draft IFC Management ResponseManagement appreciated IEG’s evaluation, and
agreed with the general direction of its report’s rec-
ommendations. It took note of the overall IEG find-
ing that IFC has had positive development impact
in most of its projects and profitable investment
operations overall, and has made sound strategic

decisions over the years. Management also noted
the report’s findings that quality at entry of recent
commitments is likely to have better outcome
than the evaluated sample, and the positive cor-
relation between development impact and prof-
itability. Management agreed on the importance
of coordination with the Bank. It informed the
meeting of its plans to hold an internal workshop
to further consider the IEG’s findings and rec-
ommendations, including the improvement of
IFC measurement and evaluation system.
Overall ConclusionsMembers commended IEG for the useful and in-
formative report, and noted Management’s gen-
eral concurrence with the recommendations.
They were reassured by Management that IFC’s
strategic directions incorporated the lessons dis-
tilled by IEG. One main issue discussed was mea-
suring development impact and the related
perceived trade-offs with profitability. While ac-
knowledging the ongoing efforts in this area,
speakers also commented on the need to im-
prove the existing methodology to capture
broader impacts, beyond financial and economic
results. CODE noted that ex-post IFC profitabil-
ity and development impact have tended to go to-
gether but also remarked on the IEG statement
in the report that implies IFC support was limited
for projects where there was a trade-off between
the two.
CODE also considered risk mitigation instru-
ments, and relative performance of equity vs.
loan investments. Other issues discussed included
the variability across sectors and regions, small vs.
large projects, and aggregation of indicators to
country or sector portfolios. Specific comments
and questions were raised about IFC’s role in
middle-income countries (MICs), environmental
and social practices, performance of intermediary
operations, and evaluation criteria including those
used for assessing additionality. Several speakers
remarked on the expanded decentralization ef-
forts, its implications on work quality including
during the transition, and the challenges to man-
agement and Board oversight. It was hoped that
decentralization would contribute to country
focus. There were also comments on the differ-
ent role of Country Assistance Strategies (CASs)
in the Bank and IFC, the possibility of strength-
ening joint CASs, and the importance of paying
due attention to private sector development in the
overall Bank Group strategy.
Next StepsSince the main topics of the IEG evaluation were
central to the discussion of IFC strategic directions,
CODE recommended that it be considered by
the Board under an absence-of- objection proce-
dure (without a meeting). For the future, mem-
bers requested that the schedules be set to allow
CODE to discuss the IEG report well before the
discussion of IFC’s strategic directions.
The following main issues were raised during the
meetings:
Development impact. Speakers were generally
satisfied with the overall positive link between
developmental impact and profitability. However,
they also took note of low development impact
and low investment return in almost one-third of
projects, and asked whether performance was
linked to work quality, particularly at approval and
supervision levels. Questions were also raised on
how to address trade-offs between development
and investment return. A few speakers sought
more information on outsourcing supervision in
projects with financial intermediaries. Manage-
ment pointed out that work quality has been im-
proving in recent years based on IEG’s report.
Management also explained that the case of less
than satisfactory work quality in the past was due
to a number of reasons, including exogenous
factors and certain opportunities or risks not
being captured at the outset. Management also
remarked that the critical stage for identifying de-
velopment impact is project appraisal. Man-
agement indicated that IFC considers not only
development impact, additionality, and financial
viability, but also other factors such as quality of
sponsors, or reputational risks.
A number of members were concerned that the
current methodology for measuring development
x l
I N D E P E N D E N T E VA L U AT I O N O F I F C ’ S D E V E L O P M E N T R E S U LT S 2 0 0 7

impact was heavily focused on financial and eco-
nomic results; there was a need to deepen as-
sessment of qualitative impact; and development
impacts at the sector, country, regional, and global
levels were not being fully captured. Some speak-
ers remarked on the perceived trade-offs between
additionality and development impact, although
there was a sentiment in favor of a more in-depth
discussion of this issue at the subsequent meet-
ing on IFC’s strategic directions. IEG indicated
that the evaluation methodology incorporates
quantitative as well as qualitative assessments
on environmental and social impact, economic
sustainability, and private sector development
impact e.g., demonstration effect.
Portfolio performance. Comments were made
on the varied performance of projects across re-
gions and sectors, particularly the weak per-
formance in Africa. In this regard, one member
asked why smaller projects performed badly in
comparison to larger projects, and the reasons for
poor performance of direct investment and tech-
nical assistance to SMEs in Africa. Management
elaborated on the lessons learned in trying to
manage small projects in Africa from Washing-
ton. In this regard, it said that some changes
have been introduced such as using more in-
termediaries, and increased staffing in Africa
through decentralization.
Concerning the lower evaluated success rates for
equity compared to loans, despite the fact that eq-
uity has a higher overall contribution to IFC’s
profitability, one member found it reasonable that
higher return was linked to risk-adjusted return;
Management added that the profitability of IFC’s
equity investment should be looked at on a port-
folio basis whereby successful projects drive over-
all outcome. Others asked about IFC’s criteria,
other than customer’s demand, for offering eq-
uity and loan.
Country approach. Some members stressed
the importance of strengthening IFC’s country
approach taking into account the different needs
for private sector development in frontier and
nonfrontier countries and markets. In this regard,
few members felt that more could be done to
strengthen and institutionalize the CAS. One
speaker agreed with IEG’s calls for IFC to define
roles and priorities in MICs, and whether it should
focus on key priority areas affecting the poorest,
e.g. infrastructure, and frontier markets. Another
proposed a model for looking at a country-level
development impact analysis, which may facili-
tate the analysis of a project and its implications
in a particular market. Management informed
that IFC is moving towards a more country-
focused strategy under the current decentral-
ization efforts, and when appropriate to pro-
grammatic approaches.
World Bank Group (WBG) synergies. A few
members encouraged improving the interaction
between the Bank and IFC, including division of
labor and consistency of country approaches.
One member suggested addressing alignment of
incentives and remuneration.
Specific areas for engagement. IFC’s focus
on rural projects particularly agribusiness and
rural microfinance was encouraged. There was
also a proposal to focus on climate change and en-
ergy efficiency. Management replied that fol-
lowing IEG’s recommendation to place an
emphasis on rural development, agribusiness
was selected as one of IFC’s five priorities, par-
ticularly in frontier areas
Decentralization. There were comments and
questions on the cost-effectiveness of decentral-
ization, and the impact on human resources in-
cluding maintaining adequate staffing, diversity,
and incentives to share knowledge while in-
creasing efficiency. Relatedly, one member was
concerned about tensions raised during mana-
gerial and organizational changes. A speaker cau-
tioned about the use of incentives focused on
volume. Others sought further elaboration on
the delegation of operational authority to the
field, and the quality of supervision of projects.
Management responded that its Industry De-
partments are working on enhancing knowl-
edge sharing in a decentralized organizational
structure, and across the WBG. While noting the
C H A I R P E R S O N ’ S S U M M A R Y: C O M M I T T E E O N D E V E L O P M E N T E F F E C T I V E N E S S ( C O D E )
x l i

possibility of higher operational and oversight
costs, Management stressed the benefits of de-
centralization such as closer knowledge of local
markets including risks, and empowerment of
staff through more delegation. Management in-
formed that it was piloting successfully an in-
centives system where Bank staff are credited
in their annual performance assessment for sub-
national assets added to IFC book. Management
emphasized the importance of using a system that
will promote innovation and creativity rather
than one focused on a checklist.
Disclosure of IEG report. Through the full
disclosure of the report, IEG expected better ac-
countability. A few speakers welcomed the pub-
lic disclosure of the report, and the impact on
accountability and transparency, which could ben-
efit other multilaterals and private investors, and
promote monitoring and evaluation.
Makoto Hosomi, Acting Chairperson
x l i i
I N D E P E N D E N T E VA L U AT I O N O F I F C ’ S D E V E L O P M E N T R E S U LT S 2 0 0 7

1
Development Results of IFC-Supported Projects,1996–2006
The Independent Evaluation Group of the International Finance Cor-
poration (IEG-IFC) has conducted evaluations of the development
results of IFC-supported private sector projects since 1996.1
This chapter presents a 10-year retrospective of
the development performance of IFC’s invest-
ment operations and a directional forecast of fu-
ture results. (IFC did not establish a systematic
approach for evaluating project-level results of
its advisory operations until 2006.)2
Amid considerable variation in private capital flows
to emerging markets, IFC has been successful in
increasing the level of its investment and advisory
services activities in the last 15 years, investing
about $50 billion (approximately 4 percent of pri-
vate capital flows, including funds from cofi-
nanciers). Out of 627 IFC investment operations
approved during 1991–2001 that had reached early
operating maturity and were evaluated between
1996 and 2006, IFC’s year-on-year development
success rates (the proportion of IFC-supported
projects that achieved high development ratings)
have not generally departed greatly from an over-
all average of 59 percent (65 percent by volume).
In the last three years, however, IFC’s develop-
ment success rates have fluctuated significantly—
from 58 percent in 2004, to 51 percent in 2005, and
to 66 percent in 2006—reflecting industry sector
dynamics as well as variations in business climate
quality. Continued higher success rates will hinge
on sustained improvements, or nondeterioration,
in the business climate quality of emerging market
economies as well as improved project risk layer-
ing by IFC at approval.
To enable a comprehensive view of IFC’s devel-
opment impact, performance metrics will need to
evolve further to capture the wider sector and
country-level impacts of IFC-supported projects.
Substantial Increases in IFC Investmentand Advisory Services ActivitiesPrivate capital flows to developing countriesfell in the wake of several crises in the late1990s, but are again at record levels. Net
private capital flows to developing countries grew
dramatically between 1991 and 1997, from less
than $100 billion per year to about $300 billion per
year. Capital flows then fell to under $200 billion
in 2002 following various regional and country
political and economic crises (including those in
Asia in 1998 and Argentina in 2001). Since 2003,
private capital flows have again achieved new
record levels, reaching $647 billion in 2006, ap-
proximately 5 percent of the gross domestic prod-
uct (GDP) of developing countries. This pattern
of growth contrasts sharply with declining official
1

aid to developing country governments. Net of-
ficial flows (debt plus aid) fell from $78 billion in
1998 to minus $5 billion in 2006, reflecting a ris-
ing trend in the substitution of official capital in
financing for development.3
IFC has increased its investment activitiessixfold. During 1991–99, IFC’s investment com-
mitments almost doubled, with minor dips in 1995
and 1999. Since 1999, IFC has grown its investment
operations in every year, with an increase in new
investments per year from approximately $2 bil-
lion in 1999 to $6 billion in 2006 (figure 1.1). In
total, IFC invested about $50 billion in developing
countries between 1991 and 2006, a sixfold in-
crease overall. Including funds provided by cofi-
nanciers (IFC normally provides around 25 percent
of total project costs), IFC-supported projects
have consistently made
up about 4 percent of
all private capital flows
to developing countries.
Over the same period, the
World Bank provided ap-
proximately $340 billion of assistance to the gov-
ernments of developing countries during this
time, with much smaller year-on-year volume
changes than those of IFC.4
IFC’s countercyclical growth during 2000–02 in part
reflected the successful implementation of a new
growth strategy. The strategy called for a reposi-
tioning of IFC ahead of the market on multiple
fronts, including leading the private sector into new
countries, particularly frontier countries (defined
by IFC as being high risk and/or low income, see
table 1.1), and sectors (infrastructure, financial
markets, and health and education), as well as
making a significant push toward second-tier com-
panies and small and medium enterprises (SMEs).
A prime example of IFC’s countercyclical role was
its support for large industrial clients in Turkey
through several periods of market turbulence
(since the mid-1990s), and their emergence as
major engines of economic growth in the country.5
IFC has also grown its advisory services op-erations. The country coverage of active advi-
2
I N D E P E N D E N T E VA L U AT I O N O F I F C ’ S D E V E L O P M E N T R E S U LT S 2 0 0 7
Between 1991 and
2006, IFC invested
about $50 billion in
developing countries.
0
1
2
3
4
5
6
7
8
1991 1992
IFC investments Private capital flows
1993 1994 1995 1996 1997 1998 1999 2000 2001 2002 2003 2004 2005 2006
IFC
inve
stm
ents
($ b
illio
ns)
Tota
l priv
ate
capi
tal f
low
s to
deve
lopi
ng c
ount
ries
($ b
illio
ns)
0
100
200
300
400
500
600
700
Figure 1.1. IFC Has Increased Its Private Investment Operations Sixfold since 1991
Source: IFC and World Bank databases.
� Since 1991, net private capital flows (of debt and equity) have varied considerably. They rose steadily in 1991–97, before falling back in 1998–2002,and are again at record levels.
The volume of IFC investments has, however, grown almost year-on-year since 1991. IFC was consistent with its mission of moving counter-cyclically to the market during a downturn (1998–2002). IFC investments represent about 1 percent of all private capital flows to developingcountries (4 percent, including the funds of cofinanciers), but make up about 30 percent of international finance institution private sector volumes.

sory services operations has increased from 72 in
1996, to 134 in 2005, with frontier countries ac-
counting for the majority of new advisory services
commitments. The volume of advisory services
commitments has, accordingly, increased from
about $53 million per year in 1996, to $222 million
in 2005.7
Most IFC-Supported Projects AchievedHigh Development RatingsIEG8 evaluates the development and in-vestment performance of IFC’s operations.Each year, IEG-IFC assesses the performance of a
random sample of IFC’s investment and advisory
services operations (see appendix A), as a way to
provide accountability for the performance of IFC
operations and to identify lessons that will inform
future strategy and operations (box 1.1). As such,
IEG-IFC assesses the development and IFC in-
vestment results arising from individual projects,
and synthesizes performance at the sector, the-
matic, country, regional, and global levels to pres-
ent aggregate accounts of IFC’s development
impacts (or effectiveness). There are, however,
accordant limitations in the inferences one can
draw about the wider development impacts of
IFC. This is partly because of the difficulty in at-
tributing project-level impacts to wider develop-
ment in a country and the often indirect nature by
which IFC operations help promote private sec-
tor development and contribute to the reduction
of poverty (see figure 1.2).
Fifty-nine percent of operations (65 percentby volume) achieved high development rat-ings. On average, based on a random sample of
627 operations, 59 percent of IFC-supported proj-
ects between 1996 and 2006 achieved high de-
velopment ratings (65 percent when weighted by
the size of IFC’s investment in each case). The
project development rating is a synthesis of four
subindicators: project business success; economic
sustainability; environmental and social effects;
and impact on private sector development. These
indicators are explored in more detail in box 1.1;
box 1.2 illustrates how the indicators describe
successful and less successful IFC-supported proj-
ects. Development ratings are higher by volume
because larger operations tend to be more suc-
cessful than smaller operations.
D E V E L O P M E N T R E S U LT S O F I F C - S U P P O R T E D P R O J E C T S , 1 9 9 6 – 2 0 0 6
3
Table 1.1. IFC Is More Concentrated Than Other Private Capital in Frontier Countries
High risk and/orlow income
Neither high risknor low income
Bangladesh; India;Nigeria; Pakistan;Vietnam
Brazil; China; Mexico;Russia; Turkey
Frontier
Nonfrontier
15%
85%
12%(ratio to GDPshare of 0.8)
88%(ratio to GDPshare of 1.0)
29%(ratio to GDPshare of 1.9)
71%(ratio to GDPshare of 0.9)
Risk andincome level Examplesa IFC classification
Share ofdeveloping country
GDP (2005)
Share ofdeveloping country
foreign directinvestment (2005)
Share of IFCcommitments
(2006)
� If a country meets the criteria of being high risk (with an Institutional Investor Country Credit Rating of less than 30) and/or low income (gross national income of lessthan $826 per capita),6 then IFC classifies it as a frontier country. As the table below shows, frontier countries accounted for about 15 percent of developing countryGDP in 2005. In line with its strategy, IFC has a far higher share of the commitments in these countries relative to foreign direct investment.
Sources: IEG, derived from IFC documentation and databases; and the Institutional Investor.
a. In the each case, the country examples are those with the five largest economies (measured by GDP) in 2005.

There has been some variability in the de-velopment subindicators. IFC operations have
done better in terms of private sector development
impacts beyond the project, environmental and so-
cial effects, and economic sustainability (all were
above the synthesis success rate of 59 percent be-
tween 1996 and 2006, see table 1.2). IFC operations
have done less well in terms of project business suc-
4
I N D E P E N D E N T E VA L U AT I O N O F I F C ’ S D E V E L O P M E N T R E S U LT S 2 0 0 7
Box 1.1. IEG Independently Rates the Development and Investment Performanceof IFC Operations
Each year, IEG-IFC independently assesses the development re-sults of a random sample of IFC’s investment and advisory servicesoperations, as a way to provide accountability for past perform-ance and to identify lessons that will inform IFC and World BankGroup strategy and operations going forward. IEG is independentin reporting directly to the Board of Directors of the World BankGroup rather than to IFC Management.
IEG-IFC carries out two types of evaluations—micro and macroevaluations. Micro evaluations are assessments of the perform-ance of individual IFC investment and advisory services operations,which are first self-evaluated by IFC staff before being validatedby IEG-IFC. Micro evaluations provide the building blocks for macroevaluations of sector, country, regional, and global performance,or on a theme, such as IFC’s experiences with small and mediumenterprises. Macro evaluations link project-level outcomes toprevailing country and regional conditions, as well as internal fac-tors, such as the way IFC organizes itself and its work processesand procedures.
The timing of an evaluation depends on its nature. For invest-ment operations, IEG-IFC evaluates project performance at “earlyoperating maturity” (usually 18 months into commercial operations,which is generally five years after approval), while for advisory ser-vices operations, the evaluation is carried out after the projectcloses. Macro evaluations are often carried out to tie in with IEG-World Bank evaluations of the same sectors, countries, or re-gions, but such evaluations also address issues specific to IFC’soperations and strategic priorities.
All evaluations look at the development results, as well as theinvestment success (in the case of investment operations) of IFC’soperations. The project development rating is a bottom-line as-sessment of the project’s results across four development di-mensions, relative to what would have occurred without theproject.9 Operations are judged to be at least satisfactory basedon the following criteria.
• Project business success. For real-sector projects, operationsgenerated a project financial rate of return at least equal to thecompany’s cost of capital (inclusive of a 350-basis-point spreadto its equity investors over its lenders’ nominal yield); for finan-cial sector projects, the associated subportfolios or asset growth
contributed positively to the intermediary’s profitability, financialcondition, and business objectives.
• Economic sustainability. Where measurable, operations gen-erated an economic rate of return of at least 10 percent. This in-dicator takes into account net gains or losses by nonfinanciers,unquantifiable impacts, and contributions to widely held devel-opment objectives.
• Environmental and social effects. Operations met or exceededIFC’s environmental, social, health, and safety requirements atapproval, and (since 1998) Bank Group policies and guidelines,as well as local standards that would apply if the project wereappraised today.
• Private sector development impacts. Whether a project’s privatesector development impact beyond the project is positive, par-ticularly its demonstration effect, in creating a sustainable en-terprise capable of attracting finance, increasing competition,and establishing linkages.
IFC’s investment rating is an assessment of the gross profit con-tribution quality of an IFC loan and/or equity investment, that is, with-out taking into account transaction costs or the cost of IFC equitycapital.
• Loan. Loans are rated satisfactory provided they are expectedto be repaid in full with interest and fees as scheduled (or areprepaid or rescheduled without loss).
• Equity. Equities are rated satisfactory if they yield an appropri-ate premium on the return on a loan to the same company (a nom-inal, dollar, internal rate of return greater than or equal to the fixedloan interest rate,10 plus a premium).
Unlike other development financial institutions that focus on thepublic sector, IFC’s private sector projects face competition and,therefore, the evaluation framework for investment operationscaptures the inherent commercial risks and market factors af-fecting the projects. Accordingly, results cannot be directly com-pared with those of public sector institutions such as the WorldBank, which employ different evaluation approaches, including interms of focus, timing of evaluation, and benchmarks used11 (seebox 1.4 and appendix A).

D E V E L O P M E N T R E S U LT S O F I F C - S U P P O R T E D P R O J E C T S , 1 9 9 6 – 2 0 0 6
5
Inputs Outputs Outcomes Impacts
Investmentoperations
Advisory servicesImproved
business climate
Sustainable privateinvestment
SustainablePSD Economic growth
Demonstrationeffects
Poverty reduction
Improvedliving standards
▼
▲
▲ ▲ ▲
▼
▲
▲ ▲
▲ ▲
Figure 1.2. IFC Operations Can Help Reduce Poverty through a Chain of Events
Source: IEG.
� IFC activities can help to reduce poverty via a sequence of steps. For instance, an investment operation can have positive demonstration effects, leading to a num-ber of companies entering a market, thus creating jobs and economic growth, which ultimately helps to reduce poverty among workers and consumers alike (on thebasis that prices fall and/or quality improves with increased competition).
Box 1.2. Examples of Successful and Less Successful IFC Projects
Successful project: The project was the installation of a new dig-ital cellular network in an Asian country, to provide 55 percent cov-erage by area and increase access to telephone services amongpoor rural communities. At the start time of the project, the coun-try had one of the lowest telephone density rates in the world anda wait time of more than 10 years for a fixed telephone line. Theproject was a major commercial success (an excellent projectbusiness-success rating), with a subscriber base of nearly half amillion, more than twice what was anticipated. Economic sus-tainability was rated as excellent because the project yielded out-standing returns to the economy, including taxes and duties paidto the government, revenue-sharing payments to the regulator, li-cense fees, and lease payments to a railway company for usingits fiber-optic backbone. Environmental and social effects wererated as satisfactory, with the company committed to sound en-vironmental and social performance, in compliance with WorldBank Group guidelines. Private sector development impacts wereexcellent, with the project increasing cellular competition, andresulting in lower tariffs, increased range, and improved quality forusers, as well as improving the essential infrastructure for otherprivate sector development.
Less successful project: The project was a pilot credit agency lineserving wood processors and furniture manufacturers in a post-conflict transition economy in Europe. The companies were pre-viously part of a state-owned conglomerate which collapsed.Project business success was unsatisfactory because all of thecompanies financed through the agency line fell into financial dis-tress. IFC provided technical assistance to build management ca-pacity (ahead of a planned privatization) but it was insufficient tobridge their lack of expertise, and problems were compounded bydifficult trading conditions. Economic sustainability was also un-satisfactory because none of the companies had proved to be asustainable source of employment, tax revenues, or added value.Their expected contribution to postwar reconstruction was limited.Environmental and social effects were unsatisfactory becausethe companies did not meet the prescribed standards, with one fur-niture manufacturer polluting local air quality, soil, and surface andground waters. Finally, private sector development impacts wereunsatisfactory because no privatization occurred due to a lack ofinterest from domestic and foreign investors. Moreover, the agencyline failed in its objective to help build expertise within the agentbanks to support future private enterprise in the country.

cess (46 percent by number, 50 percent by volume),
reflecting in large part the inherent commercial risk
of a private sector business. However, even some
businesses that achieve only marginal commer-
cial performance, can still operate in an econom-
ically sustainable manner, and have positive
environmental and social effects and private sec-
tor development impacts. Environmental and so-
cial effects ratings for IFC-supported projects have
varied in the past decade due to the introduction
of stricter requirements,12 the examination of
a growing number of issues in environmental and
social assessments and evaluations, and the vary-
ing complexity and industry
sectors of evaluated projects.
Appendix B provides trend in-
formation for each indicator.
Performance has also differed across re-gions and sectors. By region, project devel-
opment results have been weaker in Africa, driven
by persistently high-risk business climates, to-
gether with below-average IFC work quality, the
willingness by IFC to take greater project risks in
the region, and below-average project environ-
mental and social compliance. By sector, IFC-
supported projects in the infrastructure and the
extractive sectors have achieved better develop-
ment performance, with more mixed results in
general manufacturing and services, funds, and
health and education operations. Chapter 2 dis-
cusses regional and sector performance varia-
tions in more detail, in the context of what we have
learned about private sector development in the
last decade.
6
I N D E P E N D E N T E VA L U AT I O N O F I F C ’ S D E V E L O P M E N T R E S U LT S 2 0 0 7
Overall development rating
(a bottom-line assessment of the below indicators) 59 65
(i) Project business success 46 50
(ii) Economic sustainability 62 65
(iii) Environmental and social effects 67 72
(iv) Private sector development impact (beyond the project) 72 76
Source: IEG.
Note: Performance reported above is based on the evaluations of 627 projects between 1996 and 2006.
Table 1.2. Most IFC-Supported Projects Achieved High Development Ratings,1996–2006
� Most IFC-supported projects were, on balance, delivering (and were expected to deliver in the long run) sustainable development across thefour dimensions that IEG rates: their financial, economic, environmental and social performance, as well as their contribution to private sectordevelopment beyond the project (see box 1.1 for more details on the criteria used to rate each dimension, and box 1.4 on the general noncomparabilityof these results with those of other institutions such as the World Bank).
IFC projects have performed better, in terms of private sector development impacts beyond the project, environmental and social effects, andeconomic sustainability—all were above the overall rating of 59 percent. IFC projects have done less well in terms of project business success(46 percent by number, 50 percent by volume), which reduces the overall development rating. Weaker performance on project business suc-cess is mainly due to the inherent commercial risk of a private sector business—IFC projects face the test of market competition—combinedwith business climate risk. However, some businesses that achieve only marginal commercial performance (they achieve a positive return butfail to achieve the satisfactory financial rate of return “hurdle rate”) can still operate in an economically sustainable manner, and have posi-tive environmental and social effects and private sector development impacts.
Success rates are higher by volume because larger operations tend to be more successful than smaller operations.
Development Indicator
Percentage with highdevelopment ratings,
by number
Percentage with highdevelopment ratings,
weighted bycommitment volume
Development
performance is assessed
across four dimensions.

Performance has fluctuated substantially inthe last three years. Previous IEG reviews of
IFC’s development results have focused on the de-
velopment performance of IFC-supported projects
that were evaluated in the most recent three years,
to ensure their relevance for informing IFC strat-
egy and operations going forward. While this re-
view, overall, adopts a longer-term perspective, this
section addresses the quality of IFC’s develop-
ment results since 2004. Figure 1.3 shows that
project development ratings have varied sub-
stantially, from 58 percent in 2004, to 52 percent
in 2005, and to 66 percent in 2006.
Recent variations in project developmentresults in part reflect sectoral specifics.The fall in the proportion of projects with high de-
velopment ratings, from 58 percent in 2004, to
52 percent in 2005, coincided with the start of
IFC’s frontier growth strategy and with signifi-
cant organizational changes. In pursuit of its fron-
tier growth strategy, IFC faced new risks in its
operations, with investments in new countries13
and in new sectors. For example, a Health and
Education Department was created in 2000, and
the number of investments in the social sectors
peaked around that time. These investments—ap-
proved in 2000 and evaluated in 2005—while
small in number, exhibit lower suc-
cess rates than investments in other
sectors. That time also coincided with
the technology and Internet bubble,
and in line with the high-risk nature
of that sector, few of IFC’s investments in Inter-
net firms proved to be successful.14 IFC’s invest-
ments in general manufacturing also did not fare
well, compared with the all-sector average or
compared with general manufacturing invest-
ments by IFC historically, in part due to increased
competition between IFC-supported operations
and Chinese producers.
Factors outside of IFC’s control also con-tributed to development impact quality.There were a number of political and economic
crises in the emerging markets before and during
2000 (including the after-effects of the Asian cri-
sis in 1998). The country risk ratings for 37 percent
of projects approved in non-high-risk countries ac-
tually deteriorated to high risk after project ap-
proval, while the country risk ratings for 79 percent
of high-risk approvals remained high risk. As pre-
vious evaluations have shown, deterioration in a
country’s business climate risk adversely affects the
development performance of projects in that
country. By contrast, most operations evaluated in
D E V E L O P M E N T R E S U LT S O F I F C - S U P P O R T E D P R O J E C T S , 1 9 9 6 – 2 0 0 6
7
IFC projects face
the test of market
competition.
1009080706050403020100
1996–2006 average
1996 1997 1998 1999 2000 2001 2002 2003 2004 2005 2006
Perc
enta
ge o
f pro
ject
s w
ithhi
gh d
evel
opm
ent r
atin
g
Figure 1.3. Trends in Project Development Performance, 1996–2006
Source: IEG.
� Based on 627 evaluations of IFC-supported projects between 1996 and 2006, 59 percent achieved high development ratings. Performance wasabove average between 1996 and 1998, below average in 2005, and then above average in 2006.

2006 benefited from the fact that their host coun-
tries achieved a significant improvement in busi-
ness climate risk after approval. This helped boost
companies’ business success and economic sus-
tainability in particular.
Further Improvement Is AnticipatedProject high-risk intensity affects develop-ment performance. The projects that IFC sup-
ports, by their nature, typically face intrinsic
business risks. To an extent, IFC can control the
level of project risk, first by screening out proj-
ects with unmanageable risks, and for projects
processed through to approval, mitigating risks
through appropriate project and investment struc-
turing. IEG has found that, in aggregate, high lev-
els of risk can detract from the quality of a project’s
development impact. As figure 1.4 shows, projects
with more high-risk factors present achieve lower
development ratings, with the presence of four
or more high-risk factors generally equating to
lower-than-average development success. For proj-
ects approved since 2002, there is no independ-
ently validated evaluation
data because these projects
have not yet reached early
operating maturity. In the absence of ex-post in-
formation, IEG analyzes the level of project risk in
recent commitments to provide an ex-ante,
directional indication of the trend in future suc-
cess rates. IEG screens projects for eight risk fac-
tors: sponsor quality, market risk, debt service
burden, project type, sector risk, country busi-
ness climate at approval, IFC credit review inten-
sity, and non-repeat-project risk. Appendix A
describes IEG’s methodology and each risk factor
in further detail.
The high-risk intensity of IFC projects at ap-proval has fallen. Fifty-nine percent of projects
evaluated between 1995 and 2000 carried four or
more high-risk factors, compared with 46 per-
cent between 2002 and 2005.15 This pattern re-
flects a declining trend almost year-on-year since
1995.16 The decrease in high-risk layering is likely
a result of various quality-enhancement steps
taken by IFC since 1998. IFC has made a number
of organizational changes, such as the creation of
a Credit Department, portfolio units, equity desks,
and deploying more investment staff in the field,
as well as several procedural changes that have in-
creased the rigor of front-end review, facilitated
8
I N D E P E N D E N T E VA L U AT I O N O F I F C ’ S D E V E L O P M E N T R E S U LT S 2 0 0 7
100908070605040302010
00–1 2 3 4 5 6 7+
Number of high-risk factors
Perc
enta
ge o
f pro
ject
s w
ithhi
gh d
evel
opm
ent r
atin
g
Figure 1.4. Projects with More High-Risk Factors Achieve Lower DevelopmentRatings
Source: IEG.
Note: IFC investment success rates have a similar relationship with the number of high-risk factors, although the dropoff in success rates with four or more high-riskfactors is even sharper for investment success rates than it is for development success rates.
� Project risk layering in new approvals has a significant impact on the development ratings of IFC-supported projects. Based on the risk profil-ing of 388 operations, the proportion of projects with high development ratings fell as the number of high-risk factors per project increased.
IFC can control the
level of project risk.
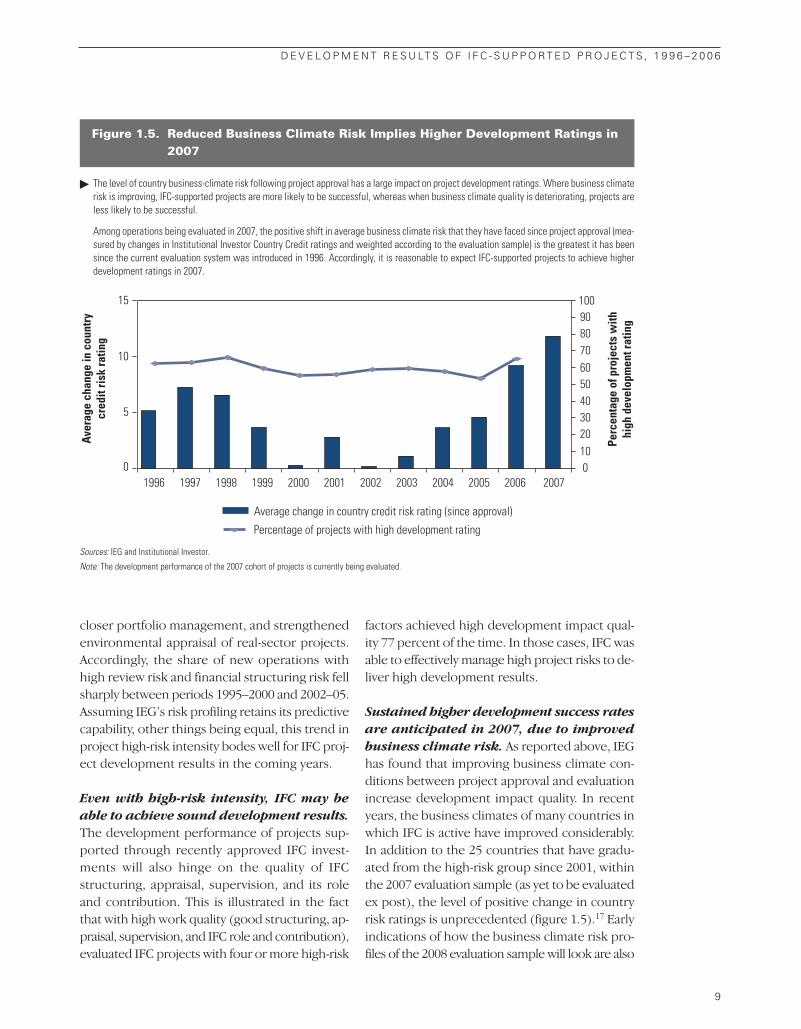
closer portfolio management, and strengthened
environmental appraisal of real-sector projects.
Accordingly, the share of new operations with
high review risk and financial structuring risk fell
sharply between periods 1995–2000 and 2002–05.
Assuming IEG’s risk profiling retains its predictive
capability, other things being equal, this trend in
project high-risk intensity bodes well for IFC proj-
ect development results in the coming years.
Even with high-risk intensity, IFC may beable to achieve sound development results.The development performance of projects sup-
ported through recently approved IFC invest-
ments will also hinge on the quality of IFC
structuring, appraisal, supervision, and its role
and contribution. This is illustrated in the fact
that with high work quality (good structuring, ap-
praisal, supervision, and IFC role and contribution),
evaluated IFC projects with four or more high-risk
factors achieved high development impact qual-
ity 77 percent of the time. In those cases, IFC was
able to effectively manage high project risks to de-
liver high development results.
Sustained higher development success ratesare anticipated in 2007, due to improvedbusiness climate risk. As reported above, IEG
has found that improving business climate con-
ditions between project approval and evaluation
increase development impact quality. In recent
years, the business climates of many countries in
which IFC is active have improved considerably.
In addition to the 25 countries that have gradu-
ated from the high-risk group since 2001, within
the 2007 evaluation sample (as yet to be evaluated
ex post), the level of positive change in country
risk ratings is unprecedented (figure 1.5).17 Early
indications of how the business climate risk pro-
files of the 2008 evaluation sample will look are also
D E V E L O P M E N T R E S U LT S O F I F C - S U P P O R T E D P R O J E C T S , 1 9 9 6 – 2 0 0 6
9
15
10
5
0
1009080706050403020100
Aver
age
chan
ge in
cou
ntry
cred
it ri
sk ra
ting
Perc
enta
ge o
f pro
ject
s w
ithhi
gh d
evel
opm
ent r
atin
g
19971996 1998 1999
Average change in country credit risk rating (since approval)
Percentage of projects with high development rating
2000 2001 2002 2003 2004 2005 2006 2007
Figure 1.5. Reduced Business Climate Risk Implies Higher Development Ratings in2007
Sources: IEG and Institutional Investor.
Note: The development performance of the 2007 cohort of projects is currently being evaluated.
� The level of country business-climate risk following project approval has a large impact on project development ratings. Where business climaterisk is improving, IFC-supported projects are more likely to be successful, whereas when business climate quality is deteriorating, projects areless likely to be successful.
Among operations being evaluated in 2007, the positive shift in average business climate risk that they have faced since project approval (mea-sured by changes in Institutional Investor Country Credit ratings and weighted according to the evaluation sample) is the greatest it has beensince the current evaluation system was introduced in 1996. Accordingly, it is reasonable to expect IFC-supported projects to achieve higherdevelopment ratings in 2007.

positive.18 Combined with better risk mitigation
at approval, we can reasonably expect that the
above-average development performance ob-
served in 2006 will likely be sustained in 2007.
With higher investment volumes, IFC’s de-velopment impact ought to increase com-mensurately in the coming years. Given
higher investment volumes, with commitments in-
creasing twofold from $3 billion per year in 2001
to $6 billion per year in 2006, and expectations of
further significant increases over the coming
years, IFC’s corporate development footprint
should expand commensurately. This expecta-
tion rests on two key assumptions. First, the busi-
ness climate risk in the countries in which IFC is
investing will continue, on average, to improve.
It remains too early to predict the impact of busi-
ness climate changes on post-2004 IFC invest-
ment approvals, because these will not reach
early operating maturity (and hence not be eligi-
ble for full evaluation) for three or more years.
Second, as in the past, the development impact
quality of IFC-supported projects will, in the fu-
ture, hinge on factors internal to IFC, such as
how effective IFC is in increasing its field presence,
maintaining transaction quality and ensuring that
lessons from past operations are internalized
(which is to say that IFC repeats successes that can
be replicated, and avoids past mistakes). Some of
the issues raised by IFC’s efforts at greater de-
centralization are explored further in chapter 3.
No Trade-off between DevelopmentResults and IFC Investment ReturnsBetween 1996 and 2006, 46 percent of eval-uated projects achieved both high devel-opment and investment ratings. Considering
development results alongside IFC investment re-
turns, out of the 627 projects evaluated between
1996 and 2006, 46 percent achieved high-high re-
sults (high development success as well as high IFC
investment return, as defined in box 1.1). Mean-
while, 31 percent delivered low-low results (low
development success as well as low IFC investment
return). By volume of commitments, some 53
percent of projects achieved high-high results,
while 26 percent delivered low-low results (figure
1.6). This pattern of performance has strengthened
over time, with an increase in high-high results im-
plying improved project execution by IFC. The re-
lationship is robust among three of the four
component development indicators and IFC
investment success: project business success, eco-
nomic sustainability, and private sector develop-
ment (PSD) impacts, but not environmental and
social effects (with effective environmental and so-
cial performance typically still being achieved
when IFC’s investment return is low).19
IFC has not actively supported projectswhere there was a trade-off between prof-itability and development results. Only 23
percent of the 627 evaluated operations had
mixed results (high development success with
low investment success in 13 percent of cases; low
development success and high investment success
in 10 percent of cases). Consequently, it is ap-
parent that there is not a necessary trade-off be-
tween development results and IFC investment
returns and that IFC has not consciously sup-
ported projects where there was likely to be a
trade-off between these two dimensions. Projects
failed to achieve high-high ratings for a number
of reasons. These include the inherent commer-
cial risk in different industry sectors, adverse busi-
ness climates, poor sponsor quality, or shortfalls
in IFC work quality. Of the 23 percent that
achieved mixed results, IFC’s choice of financing
instrument was the most common reason. Pro-
portionately, more operations involving equity
achieved high development success and low in-
vestment returns (some four-fifths of these cases),
while more operations involving loans achieved
low development success and high investment re-
turns (in about nine-tenths of the cases), for rea-
sons described below. As appendix B shows, loans
featuring high IFC work quality are the most likely
combination to achieve high-high ratings.
Loans have been more likely than equity in-struments to achieve high (above bench-mark) investment ratings but, in aggregate, IFC
has achieved higher returns from its equity port-
folio. Considered individually, loans have a higher
chance of performing successfully than equity in-
vestments (see table 1.3), reflecting the different
inherent risks of each instrument. In the case of
1 0
I N D E P E N D E N T E VA L U AT I O N O F I F C ’ S D E V E L O P M E N T R E S U LT S 2 0 0 7

loans, IFC has a ranking claim on company cash-
flow for loan service as well as the collateral security
package, which together provide some downside
protection. Equity investments, however, must
meet rigorous return standards to compensate for
the instrument’s subordination and currency risk.
Accordingly, while 68 percent of equity invest-
ments generated a positive return, only 31 percent
achieved high (above benchmark) investment rat-
ings. In aggregate, IFC has been rewarded with
higher returns on its portfolio of equity invest-
ments in recent years. In common with all com-
mercial equity portfolios, the few successful
investments tend to be major contributors to
overall profitability. In IFC’s case, its equity in-
vestments in Africa have recently helped IFC’s
portfolio of investment operations in the region
become profitable (after losses each year during
the 1990s). Equity investments, in general, have
made a significant contribution to IFC’s retained
earnings and hence its capacity to scale up the vol-
ume of its investment and advisory services op-
erations in recent years.
Maintaining this level of prof-
itability will, however, de-
pend on continued investor
optimism in the emerging
markets and consequent high valuations—par-
ticularly given the high ratio of unrealized to
realized gains (about a 4:1 ratio). Appendix B pro-
vides further details on the profitability of IFC’s
whole portfolio of investment operations.
Comprehensive Evaluation of IFC’sDevelopment Effectiveness Remains aMajor ChallengeSubstantial progress has been made inmeasuring project development results,but challenges remain. IFC has increased
the breadth and depth of its monitoring and self-
evaluation systems, such that IFC is now tracking
its development results across its portfolio of in-
vestment and advisory operations. Preliminary
D E V E L O P M E N T R E S U LT S O F I F C - S U P P O R T E D P R O J E C T S , 1 9 9 6 – 2 0 0 6
1 1
Deve
lopm
ent r
atin
g
HIGH
IFC investment returnIFC investment return
By number of operations By volume of commitments
HIGH
53%
12%
9%26%
LOW
LOW
65%
62%
Deve
lopm
ent r
atin
g
HIGH
HIGH
46%
13%
10%31%
LOW
High developmentrating
Low IFC return
Low developmentrating
Low IFC return
High developmentrating
High IFC return
Low developmentrating
High IFC return
High developmentrating
Low IFC return
Low developmentrating
Low IFC return
High developmentrating
High IFC return
Low developmentrating
High IFC returnLOW
59%
56%
1 2
4 3
1
34
2
Figure 1.6. IFC-Supported Projects Show No Trade-off between Development Results and IFC Investment Returns
Source: IEG.
� Of the IFC operations evaluated between 1996 and 2006, about three-quarters (by number and volume) resulted in high-high ratings (high development result/high IFCinvestment return) or low-low ratings (low development result/low IFC investment return). For the most part, therefore, IFC has not supported projects where therewas an apparent trade-off between development results and investment returns. Where project development results and IFC investment returns were not correlated(23 percent of cases), proportionately more operations involving equity achieved high development success and low investment returns (square 2), while more oper-ations involving loans achieved low development success and high investment returns (square 3), reflecting different investment risk associated with each instrument.
IFC has achieved higher
returns from its equity
portfolio.

data are emerging under the Development Out-
come Tracking System (DOTS), and IEG will re-
port in next year’s Independent Evaluation of
IFC’s Development Results on its validation of
this data. Building on the above progress, IFC
could advance its metrics to better capture the
wider impacts of its operations, including those
covering broader environmental and social ef-
fects, as well as undertaking more rigorous impact
evaluation, to get a better understanding of its true
development footprint (box 1.3).
Comparing the development performanceof IFC-supported projects with those of otherdevelopment organizations is problematic.A Multilateral Development Bank Evaluation Co-
operation Group was established in 1996, with the
aim of harmonizing evaluation standards among
development banks. Based on a January 2005
benchmarking report by an independent con-
sultant of the Evaluation Cooperation Group,
IFC’s standards are currently closely aligned with
the harmonized standards, while other institutions
are still in the process of implementing these
standards. Although substantial progress toward
harmonization of private sector evaluation ap-
proaches has been made, continued differences
mean that IFC’s results are not yet comparable to
those of other international financial institutions.
These differences generally reflect different or-
ganizational mandates and objectives and varying
degrees of adoption of the standards.20 For
example, while the European Bank for Recon-
struction and Development (EBRD) focuses on as-
sisting countries in their transition process, the
World Bank Group tasks itself with poverty re-
duction and sustainable private sector develop-
ment (and even within the Bank Group there are
differences; see box 1.4).
There is some degree of comparability withEBRD on one subindicator. Despite differ-
ences in operational mandates, IFC’s private sec-
tor development impact rating (one of the four
components of the synthesis development impact
rating) is somewhat comparable to EBRD’s “tran-
1 2
I N D E P E N D E N T E VA L U AT I O N O F I F C ’ S D E V E L O P M E N T R E S U LT S 2 0 0 7
All instruments, 1996–2006 627a 56 62
Loans, 1996–2006 473 74 78
Equity investments,1996–2006 329 31 30 68 (70 by volume)
Source: IEG.
a. Some operations involved a combination of loan and equity instruments. The total number of operations is, therefore, not a straight sum of the number ofloan and equity operations.
Table 1.3. More Loan Than Equity Operations Achieved High Investment Ratings
� Loans are more than twice as likely as equity operations to achieve high investment ratings, due to the different inherent risk involved in eachinstrument. In the case of loans, IFC has a ranking claim on company cashflow for loan service and the collateral security package that togetherprovide some downside protection. Equity investments, however, must meet rigorous return standards to compensate for the instrument’s sub-ordination and currency risk. Accordingly, while 68 percent of equity investments generated a positive return, only 31 percent achieved high(above benchmark) investment ratings. In aggregate, however, IFC has been rewarded with higher returns on its portfolio basis of equity investmentsin recent years (see appendix B).
InstrumentNumber ofoperations
Percentage of equityoperations with positive
returns (real internalrate of return >0)
Percentage ofoperations withhigh ratings, by
commitment volume
Percentage ofoperations with high
ratings, by number

sition impact.” Based on 2000–05 evaluations,
EBRD’s “transition impact” success rate was ap-
proximately the same as IFC’s PSD success rate
in EBRD countries over the same period (see
figure 1.7). Nonetheless, there is no common
basis for benchmarking the overall development
effectiveness of the two institutions.23 Slightly dif-
ferent timings for evaluation (EBRD evaluates
performance after 12 months of operations while
IFC evaluates performance after 18 months of
operations) and hurdle rates for effective per-
formance (for example, in determining what con-
stitutes a satisfactory investment rating) may also
have an impact on results comparability.24
D E V E L O P M E N T R E S U LT S O F I F C - S U P P O R T E D P R O J E C T S , 1 9 9 6 – 2 0 0 6
1 3
Box 1.3. IFC Is Deepening Its Development Results Measurement but MethodologicalChallenges Remain
IFC Has Introduced a New Development Outcome TrackingSystem for All Investment Operations In July 2005, IFC established a new Development Effectiveness Unitwithin the office of the Chief Economist. The unit seeks to sys-tematically track IFC’s development results for all investment proj-ects throughout their life cycles. To perform this work, the unitemploys the Development Outcome Tracking System (DOTS),which is distinct from IFC’s existing monitoring and self-evaluationsystem—the Expanded Project Supervision Report (XPSR) sys-tem—in that DOTS:
• Examines potential development effectiveness before earlyoperating maturity;
• Does not assess IFC’s work quality;• Currently covers the whole population of active investment
operations (the XPSR system covers a random sample of bothclosed and active operations), although in future, DOTS ratingswill also be available for closed projects; and
• Updates development ratings with each new Project SupervisionReport (whereas the XPSR system assesses performance once,at early operating maturity).
The two systems are expected to complement, rather thancompete with one another. The first full results arising from DOTS (preliminary results were announced in November 2006)21
are expected to be announced publicly in October 2007.
IFC Is Also Piloting a Monitoring and Self-Evaluation Systemfor Its Advisory Services Operations Since 2006, IFC has been piloting a monitoring and self-evaluationsystem, a DOTS for advisory services, which tracks the de-
velopment results arising from advisory services projects. Theresults of these pilots are also expected to be included in IFC’sannual report. Appendix A contains further details on the method-ology IFC employs to measures its development results in thisarea.
A Key Challenge Is to Capture the Wider Sector and Country-Level Impacts of IFC-Supported Projects While these are steps forward in the monitoring and evaluationof IFC’s development effectiveness, they will not completely cap-ture the full development impacts of IFC’s activities. For example,these systems will not always pick up the wider, non-project-level effects of IFC’s operations, such as the impact on energy ef-ficiency in a sector or country from a series of power sectorinvestments.
Time Will Tell Whether the Development Results Identifiedthrough DOTS Are Reliable Because DOTS assigns ratings before operating maturity (whenoperational performance tends to stabilize, according to the trendin IFC’s own project credit ratings, as well as an assessment of the stability of equity ratings postevaluation),22 anticipated re-sults from recently approved operations will need to be treatedwith caution. DOTS ratings assigned to operations that IEG hasalready evaluated are similar to the ratings reported by IEG, whichis not surprising because these operations have reached early op-erating maturity and therefore their performance has stabilized.It remains to be seen whether ratings assigned under DOTS to proj-ects not yet operationally mature (and not yet validated by IEG)are reliable.

1 4
I N D E P E N D E N T E VA L U AT I O N O F I F C ’ S D E V E L O P M E N T R E S U LT S 2 0 0 7
Box 1.4. IFC and World Bank Development Results Are Generally Not Comparable
A Shared Mission to Reduce Poverty . . . but Different Meansand Clients to Deliver on This MissionThe World Bank—which is comprised of the International Bank forReconstruction and Development, and the International Develop-ment Association—IFC, and the Multilateral Investment Guaran-tee Agency all work to promote sustainable economic growth andpoverty reduction.
In pursuing the goal of sustainable economic growth andpoverty reduction, each institution uses different mechanisms andstructures to reach its often distinct clients. For example, while theBank provides loans and advisory services to governments for var-ious development purposes, IFC invests in, and provides techni-cal assistance to, private sector companies. Sometimes, IFC doeswork with governments directly, for instance, in seeking to improvethe ease of doing business or in facilitating municipal finance, butmost often its clients are private sector companies.
Different types of development engagement are also associatedwith different levels of risk (including the risk of market competi-tion in IFC’s case), as well as different timescales and account-abilities. Each institution has historically organized itself alongdifferent lines, the Bank by country and regional teams, and IFC byindustry department and region.
IFC Projects Are Assessed against Market ParametersIn the Bank, evaluation systems assess how the results of theBank’s development interventions with governments measure up
against their own stated objectives. At the project level, thismethodology focuses on relevance, efficacy, efficiency, sustain-ability, and institutional development impact of Bank operations.25
IFC evaluations, however, assess IFC’s development performancein terms of whether the projects IFC supports achieve projectbusiness success, economic sustainability, positive environmen-tal and social effects, and beneficial private sector developmentimpacts beyond the project. Unlike Bank projects, IFC-supportedprojects are assessed against market parameters and face mar-ket competition once they are operational. Given the close linkbetween investment and development results, this may have a con-sequence for their ability, relative to Bank projects, to achievehigh development ratings. Finally, IFC evaluations are carried outat early operating maturing, typically 18 months into operations,which is approximately 5 years after project approval, rather thanat project close, as with Bank operations. Appendix A provides amore detailed comparison of the different evaluation approachesemployed by the two institutions.
Possible Comparability of Performance in Advisory Services IFC is now starting to systematically monitor and evaluate the ef-fectiveness of its advisory services operations (see box 1.3). Be-cause IFC’s approach in evaluating its advisory services is relativelysimilar to that used by the Bank for its own advisory services,there may be the potential for a comparison of success rates, es-pecially where both institutions are working with governments.
Succ
ess
rate
(per
cent
)
2000 2001 2002 2003 2004 2005
100908070
6050403020
100
“EBRD transition impact”IFC PSD impact
Figure 1.7. EBRD and IFC Achieved Similar Development Ratings on One Subindicator
Source: IEG and EBRD.
Note: EBRD typically evaluates performance after 12 months of operations, while IFC evaluates performance after 18 months of operations.
� While not comparable in overall terms, there is some degree of comparability between the development performance of IFC and EBRD on one specific subindicator.IFC’s private sector development impact rating (one of four subcomponents of the synthesis development impact rating) can generally be compared to EBRD’s “tran-sition impact” ratings.
Looking at the period 2000–05, for the countries in which both EBRD and IFC have operations, IFC’s private sector development impact rating was below that of EBRD’stransition impact rating in three years (2000, 2003, and 2004); above it in two years (2001 and 2002); and about the same in 2005.

1 5
Lessons from 10 Years of Private Sector Development Evaluation
This is IEG’s tenth annual review of the development results of IFC-
supported projects, a good point at which to take stock of what eval-
uation findings tell us about the conditions for effective private sector
development. A decade of evaluation1 has revealed five key drivers of IFC’s
project development results, most notably, IFC’s work quality throughout the
project cycle.
Development Results Are Driven by Five FactorsFrom 10 years of PSD evaluation, IEG has identi-
fied five factors that have a significant impact on
a project’s development results:
A. Changes in the quality of a country’s busi-
ness climate following project approval;
B. Type of industry sector;
C. Quality of the sponsor;
D. Level of product market, client company,
and project type risks; and
E. IFC work quality.
Taken together, these factors successfully explain
the development performance of about two-thirds
of IFC-supported projects. Appendix A provides
details on the statistical significance of individual
factors, as well as their subcomponents, in pre-
dicting IFC project development results.
A. Changes in the Quality of a Country’sBusiness Climate Following ProjectApprovalBusiness climate quality materially affectslevels of private investment, as the con-trasting experiences of Asia and Africa il-lustrate. As discussed earlier in the report, the
overall pattern among developing countries in re-
cent years is one of improving business climate
risk—as proxied by changes in the Institutional In-
vestor Country Credit Risk ratings of these coun-
tries. There is, nonetheless, considerable variation
by region. As figure 2.1 shows, the East Asia and Pa-
cific Region has had better country risk ratings
than other regions. Other regions, particularly Eu-
rope and Central Asia, have “caught up,” except for
Africa, which has improved little since 1996. This
variation has had a material impact on the level of
private investment in each region (see figure 2.2).
Africa not only has the lowest proportion of private
2
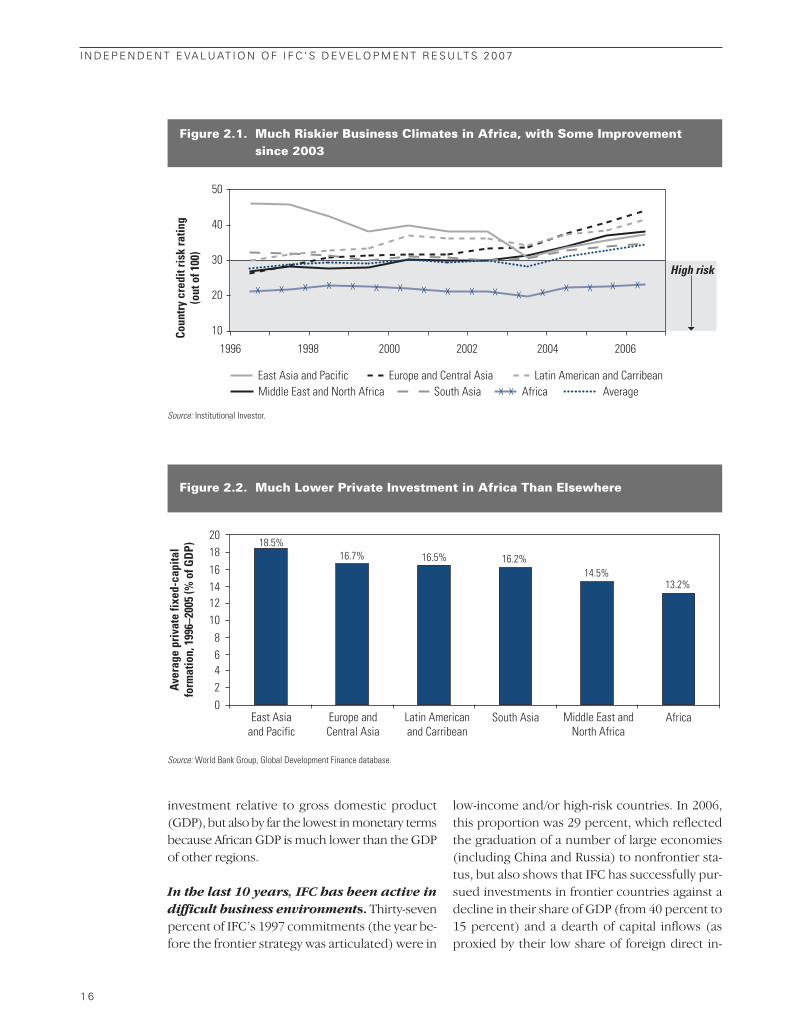
investment relative to gross domestic product
(GDP), but also by far the lowest in monetary terms
because African GDP is much lower than the GDP
of other regions.
In the last 10 years, IFC has been active indifficult business environments. Thirty-seven
percent of IFC’s 1997 commitments (the year be-
fore the frontier strategy was articulated) were in
low-income and/or high-risk countries. In 2006,
this proportion was 29 percent, which reflected
the graduation of a number of large economies
(including China and Russia) to nonfrontier sta-
tus, but also shows that IFC has successfully pur-
sued investments in frontier countries against a
decline in their share of GDP (from 40 percent to
15 percent) and a dearth of capital inflows (as
proxied by their low share of foreign direct in-
1 6
I N D E P E N D E N T E VA L U AT I O N O F I F C ’ S D E V E L O P M E N T R E S U LT S 2 0 0 7
Coun
try
cred
it ri
sk ra
ting
(out
of 1
00)
1996 1998 2000 2002 2004 2006
High risk
East Asia and Pacific
10
20
30
40
50
Europe and Central Asia Latin American and CarribeanMiddle East and North Africa Africa AverageSouth Asia
X X X X X X X
X X
X X X X X X X XXX
Figure 2.1. Much Riskier Business Climates in Africa, with Some Improvement since 2003
Source: Institutional Investor.
Aver
age
priv
ate
fixed
-cap
ital
form
atio
n, 1
996–
2005
(% o
f GD
P)
20181614121086420
East Asiaand Pacific
18.5%16.7% 16.5%
14.5%13.2%
16.2%
Europe andCentral Asia
Latin Americanand Carribean
Middle East andNorth Africa
AfricaSouth Asia
Figure 2.2. Much Lower Private Investment in Africa Than Elsewhere
Source: World Bank Group, Global Development Finance database.

vestment). If IFC’s commitments in frontier re-
gions within its top 10 middle-income countries
(MICs) are included, the frontier share of com-
mitments increases to 38 percent.
Where a country’s business climate riskhas improved following project approval,development performance has been bet-ter. Projects in high-risk business climates are
typically exposed to macroeconomic instabil-
ity, weak physical and financial infrastructure,
cumbersome regulatory burdens, and high lev-
els of corruption and informality. It is not sur-
prising, therefore, that improvements in these
attributes have a beneficial effect on IFC in-
vestments and, by extension, on private sector
development more widely in a country. In fact,
IFC has been approximately 20 percentage
points more successful, in development and in-
vestment terms, where the business climate
risk in the country in which the operation is
taking place has improved from high risk to
non-high risk between approval and evalua-
tion (see table 2.1). The potential for business
climate improvement is, of course, particu-
larly great in conflict-affected countries, and
project evaluations show that IFC can achieve
high development ratings even from such weak
starting points in terms of country investment
risk.2 Conversely, where business climate qual-
ity deteriorated during the life of a project,
ratings were 25 percentage points lower.
It is accordingly crucial that IFC work closelywith partners to help sustain the trend of im-proving business climates. IFC carries out
many activities to help improve business climates,
such as investment financing for demonstration ef-
fects, technical assistance to the public sector on
legal and regulatory issues, and advisory assistance
to the private sector for capacity building.3 Nonethe-
less, bringing about improvements in the business
climate to enable successful private sector growth
needs the help of governments and other devel-
opment partners to be successful. The extent of
IFC–World Bank cooperation in this direction is dis-
cussed in chapter 3.
B. Type of Industry Sector IFC-supported projects have achieved bet-ter development results in infrastructure,extractive sectors, and financial markets.As illustrated in figure 2.3, IFC has achieved above-
average development performance in infrastruc-
ture projects (78 percent), which, by their nature,
have provided large economic benefits and pos-
itive externalities (see Brazil transport examples
in box 2.1), and in extractive industry operations
L E S S O N S F R O M 1 0 Y E A R S O F P R I VAT E S E C T O R D E V E L O P M E N T E VA L U AT I O N
1 7
Improved from high risk 102 75 72
Stayed high risk 168 54 51
Stayed non–high risk 216 60 56
Deteriorated from non–highrisk to high risk 40 35 33
Source: IEG, based on Institutional Investor country credit risk ratings.
Table 2.1. IFC Success Rates Are Significantly Better Where Country BusinessClimate Risk Is Improving, or Not Deteriorating
� IFC has been approximately 20 percentage points more successful, in development and investment terms, where the business climate risk inthe country in which the operation is taking place has improved from high risk to non–high risk. Conversely, where business climate quality hasworsened from non–high risk to high risk, IFC has been roughly 25 percentage points less successful.
Change in country business-climate risk postentry Number of operations
Percentage ofprojects with highinvestment ratings
Percentage ofprojects with high
development ratings

(75 percent). The overall success rate of financial
sector operations was the same as the all-sector
average of 59 percent over the last decade, al-
though this success rate was depressed by below-
average performance in Africa (40 percent) and
was above average in the last five years (during
which time financial markets became a strategic
sector for IFC) (see Appendix B).
Project development results were weakerin the general manufacturing and services,funds, and health and education sectors.Figure 2.3 also shows that performance in IFC-
supported projects in the general manufactur-
ing and services sector (51 percent), and funds
sector (46 percent) is below the all-sector average
of 59 percent. Reflecting the fact that health and
education are relatively new sectors for IFC in-
vestments, social sector projects that have been
evaluated (13 to date) show below-average per-
formance. Different levels of risk are a factor
contributing to lower success rates. Investments
in funds tend to carry greater risks than invest-
ments in other sectors, while the relatively few
evaluated investments in the social sectors have
tended to face substantial structuring and market
risks (for example, in developing commercially
viable business models that are acceptable to the
public in the country in which the investments
are being made, given that the government re-
mains the lead provider of these services in many
countries).
C. Quality of the SponsorA low-quality sponsor can jeopardize thesuccess of a project. Lower-quality sponsors—
defined in terms of experience, financial capacity,
commitment, and reputation—are associated
with much lower development ratings (see table
2.2). Low sponsor quality was prevalent in about
40 percent of IFC commitments between 2002 and
2005, but sponsor quality can vary considerably
by sector, and even within the same sector. For ex-
ample, IFC investments in information and com-
1 8
I N D E P E N D E N T E VA L U AT I O N O F I F C ’ S D E V E L O P M E N T R E S U LT S 2 0 0 7
Health and education (13)
Funds (46)
General manufacturingand services (178)
Finance (182)
Food and agribusiness (70)
Extractive (55)
Infrastructure (83)
0 20 40
Development success rate, 1996–2006 (percent)
60 80 100
78%
75%
59%
59%
51%
46%
38%
Figure 2.3. IFC Development Ratings Varied Considerably by Industry Department
Source: IEG.
Note: Numbers in parentheses refer to the number of evaluated projects; Infrastructure classification includes Information Communications Technology projects as wellas transport and utilities projects.
� Based on 627 projects evaluated between 1996 and 2006, IFC has achieved the best development results in its infrastructure projects (78 per-cent). IFC has also achieved above-average success rates in the extractive industries (74 percent) and in financial markets projects outside ofAfrica (63 percent, not shown).
On the other hand, IFC has achieved lower development results in the funds (46 percent), and general manufacturing and services sectors (51percent). Health and education projects also show below-average ratings, although only 13 projects have been evaluated to date, and theseare relatively new sectors for IFC.

L E S S O N S F R O M 1 0 Y E A R S O F P R I VAT E S E C T O R D E V E L O P M E N T E VA L U AT I O N
1 9
Box 2.1. Examples of IFC Transport Investments in Brazil
In the early 1990s, Brazil’s ports were suffering from low produc-tivity, high operating costs, and inadequate maintenance. Handlingcharges in Brazil were roughly double those of international ports,and these high charges and inefficiencies were estimated to costBrazilian exporters up to $5 billion per year in lost export oppor-tunities. As part of its program to increase the competitiveness ofthe Brazilian economy, the government of Brazil passed a portsmodernization law in 1993, which transferred port administrationto state port authorities and required that the private sector operatethe ports. IFC assisted in this privatization process by providing fund-ing to the new private operators for upgrading and expanding portfacilities.
• IFC supported the rehabilitation and expansion of the containerterminal at the Port of Rio Grande, following the awarding of a25-year lease in 1997 to a private consortium. IFC helped the com-pany purchase four cranes, expand the length of the quay, andrepair and upgrade existing facilities. The $50 million projecthas enhanced transport logistics in southern Brazil, resulting inincreased exports and higher local employment, with moreskilled and better-paid jobs.4
• The Port of Salvador in the Bahia state, in northeastern Brazil,was privatized in 2000 with the awarding of a 25-year lease to aprivate company. IFC arranged funding for part of a $20 millionproject to purchase two portainers (container cranes) andcontainer-handling equipment, to pave the container storage
area, and to construct a warehouse and administration buildings.The private operator played an important role in increasingoverall container volumes by nearly 300 percent between 2000and 2005. As a successful project in a relatively poor and lessdeveloped part of Brazil, it played a vital role in increasing ex-ports from the region, attracting other firms into the area (in-cluding companies such as Continental, Bridgestone, Pirelli,Monsanto, and Ford), and inducing follow-on investments inlocal transportation logistics.
• The government-built (and previously unused) container andsteel-products terminal of Sepetiba is being operated under a 25-year lease awarded by the Port Authority of Rio de Janeiro in 1998.IFC is assisting the new private operator in a phased $140-million redevelopment of the container terminal, including the pur-chase of seven cranes, conversion of an existing dolphin berthinto a straight quay, and construction of a rail connection. Largelyowing to an intense competitive reaction from the neighboringport of Rio, Sepetiba’s operations, in terms of container movesand profitability, have not yet met expectations. The project has,however, helped reduce congestion at ports across southeastBrazil, and the increased competition has resulted in a dramaticdrop in tariffs for importers and exporters.
IEG’s recent evaluation brief of IFC investments in the transportsector provides more detailed analysis of IFC’s performance in thissector.5
High-quality sponsor 67 63 33 77
Low-quality sponsor 42 37 23 50
All projects 57 53 28 68
Source: IEG.
Note: Based on the risk profiling of 388 IFC investment operations that were approved during 1995–2000 and evaluated during 2000–05.
Table 2.2. IFC Project Development Results Improve Significantly with thePresence of a High-Quality Sponsor
� When sponsor quality is high, projects are around 25 percentage points more likely to achieve high development ratings.
Sponsor quality
Percentage ofprojects with highinvestment ratings
Percentage ofprojects with high
development ratings
Percentage ofprojects with
high investmentratings—loans
Percentage ofprojects with
high investmentratings—equity
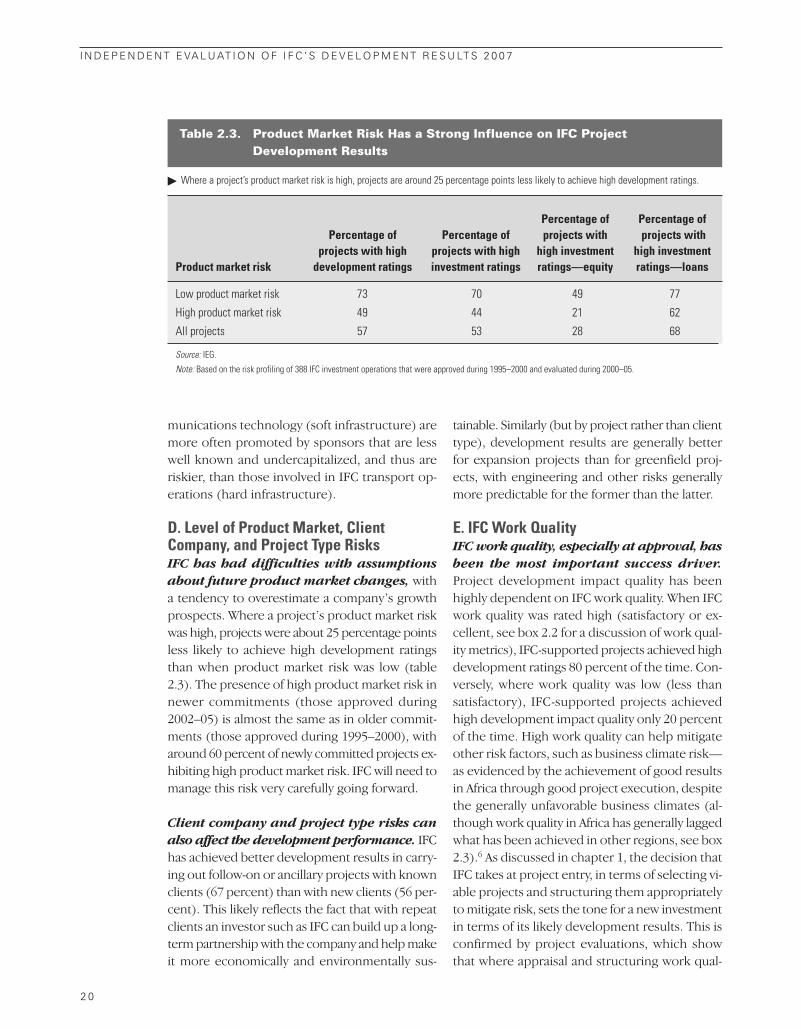
munications technology (soft infrastructure) are
more often promoted by sponsors that are less
well known and undercapitalized, and thus are
riskier, than those involved in IFC transport op-
erations (hard infrastructure).
D. Level of Product Market, ClientCompany, and Project Type RisksIFC has had difficulties with assumptionsabout future product market changes, with
a tendency to overestimate a company’s growth
prospects. Where a project’s product market risk
was high, projects were about 25 percentage points
less likely to achieve high development ratings
than when product market risk was low (table
2.3). The presence of high product market risk in
newer commitments (those approved during
2002–05) is almost the same as in older commit-
ments (those approved during 1995–2000), with
around 60 percent of newly committed projects ex-
hibiting high product market risk. IFC will need to
manage this risk very carefully going forward.
Client company and project type risks canalso affect the development performance. IFC
has achieved better development results in carry-
ing out follow-on or ancillary projects with known
clients (67 percent) than with new clients (56 per-
cent). This likely reflects the fact that with repeat
clients an investor such as IFC can build up a long-
term partnership with the company and help make
it more economically and environmentally sus-
tainable. Similarly (but by project rather than client
type), development results are generally better
for expansion projects than for greenfield proj-
ects, with engineering and other risks generally
more predictable for the former than the latter.
E. IFC Work Quality IFC work quality, especially at approval, hasbeen the most important success driver.Project development impact quality has been
highly dependent on IFC work quality. When IFC
work quality was rated high (satisfactory or ex-
cellent, see box 2.2 for a discussion of work qual-
ity metrics), IFC-supported projects achieved high
development ratings 80 percent of the time. Con-
versely, where work quality was low (less than
satisfactory), IFC-supported projects achieved
high development impact quality only 20 percent
of the time. High work quality can help mitigate
other risk factors, such as business climate risk—
as evidenced by the achievement of good results
in Africa through good project execution, despite
the generally unfavorable business climates (al-
though work quality in Africa has generally lagged
what has been achieved in other regions, see box
2.3).6 As discussed in chapter 1, the decision that
IFC takes at project entry, in terms of selecting vi-
able projects and structuring them appropriately
to mitigate risk, sets the tone for a new investment
in terms of its likely development results. This is
confirmed by project evaluations, which show
that where appraisal and structuring work qual-
2 0
I N D E P E N D E N T E VA L U AT I O N O F I F C ’ S D E V E L O P M E N T R E S U LT S 2 0 0 7
Low product market risk 73 70 49 77
High product market risk 49 44 21 62
All projects 57 53 28 68
Source: IEG.
Note: Based on the risk profiling of 388 IFC investment operations that were approved during 1995–2000 and evaluated during 2000–05.
Table 2.3. Product Market Risk Has a Strong Influence on IFC ProjectDevelopment Results
� Where a project’s product market risk is high, projects are around 25 percentage points less likely to achieve high development ratings.
Product market risk
Percentage ofprojects with highinvestment ratings
Percentage ofprojects with high
development ratings
Percentage ofprojects with
high investmentratings—loans
Percentage ofprojects with
high investmentratings—equity

ity was high, IFC-supported projects achieved a
76 percent development success rate. Conversely,
where appraisal and structuring work quality was
low, IFC-supported projects achieved only a 21 per-
cent development success rate.
Supervision quality is important, and im-proving, but insufficient to make up for lowwork quality at approval. Effective supervision
also has a positive influence on development per-
formance, with 73 percent of projects achieving
high development ratings when supervision qual-
ity was high. This success rate fell to 32 percent
when supervision quality was low. IFC supervi-
sion quality is currently the highest it has been since
the current evaluation system was introduced in
1996 (85 percent satisfactory). This suggests that
various quality enhancement steps taken by IFC be-
tween 1998 and 2001, while associated with a fall
in quality as they were being introduced (which
may reflect in part the need to meet more rigor-
ous criteria from 1998), have started to have a
positive effect (see figure 2.4). However, where
work quality at approval was
low, high supervision work
quality was not always able to
compensate for shortfalls in
due diligence or structuring at
the front end, with 42-percent
high development ratings in
this situation, compared with
88 percent when both appraisal and supervision
quality were high. These combinations of front-end
and supervision work quality have a similar impact
on investment success rates (see table 2.4). Most
individual project evaluation lessons relate to work
quality at approval, further stressing its signifi-
cance to project development performance.7
Good supervision is nevertheless critical inensuring strong client commitment to soundenvironmental and social practices. A forth-
coming evaluation covering IFC’s support for en-
vironmentally sustainable enterprises in Brazil,
China, the Arab Republic of Egypt, Ghana, India,
Kenya, Russian Federation, and Uganda8 shows
L E S S O N S F R O M 1 0 Y E A R S O F P R I VAT E S E C T O R D E V E L O P M E N T E VA L U AT I O N
2 1
Box 2.2. IEG Evaluates IFC Work Quality across Three Underlying Indicators
IFC’s overall work quality is rated on a four-point scale (excellent,satisfactory, partly unsatisfactory, and unsatisfactory) across thefollowing three indicators:
• Screening, appraisal, and structuring (at approval). The extentto which IFC followed good practice standards, such as thoseidentified in IFC credit notes. For example, with hindsight, did IFCidentify key risk factors, mitigate them as much as possible, andarrive at realistic expectations for project and company per-formance? Actual results are compared with expectations andthe main reasons for variance are analyzed, to assess whetherIFC’s assumptions were well-grounded in good practices, due dili-gence, and structuring, and the extent to which differences inactual results were due to extraneous effects, such as recog-nized but uncontrollable risks.
• Supervision and administration (after approval). Following ap-proval and commitment, and through to eventual closure, this in-dicator assesses how well IFC carried out its supervision of aninvestment. For example, whether IFC was able to detect emerg-ing problems in a company and respond expeditiously with ap-propriate and effective interventions.
• Role and contribution (additionality). Aligned with IFC’s Article1 guiding principles, this indicator describes the extent to whichIFC played a catalytic role in an investment, and made a specialcontribution. For example, did IFC adhere to its corporate, coun-try, and sector strategies and business principle, and was IFCtimely and efficient in its dealings with the client?
As much as possible, IFC’s work quality is evaluated independ-ently of the project’s outcome, to avoid bias in the ratings. For ex-ample, 12 percent of projects with high development ratings werenevertheless judged to have had low overall IFC work quality; and32 percent of projects with low development ratings were still ratedhigh for overall IFC work quality. Occasionally, however, actualproject results can influence work quality ratings. Projects per-forming poorly can expose or exaggerate the weaknesses inIFC’s structuring or supervision, which in the absence of signifi-cantly negative project performance might have gone unde-tected. Conversely, a project that is performing very well may bedoing so despite shortfalls in IFC’s work quality, which might,under different circumstances, have been more critical for out-come quality.
The most important
driver of project
development
performance has been
IFC work quality.

that the most important success factor in deliver-
ing high environmental and social effects ratings
(achieved in 67 percent of IFC operations overall)
is a client’s commitment to good environmental and
social management. If the client is committed, with
IFC’s help it can build environmental management
capacity and resources to identify and mitigate the
environmental and social risks in a project, and
proactively engage with project stakeholders and
communities.14 IEG evaluations find that where
clients are developing sound environmental man-
agement systems, with close supervision by IFC,
projects are more likely to deliver sustainable en-
vironmental and social performance.15
2 2
I N D E P E N D E N T E VA L U AT I O N O F I F C ’ S D E V E L O P M E N T R E S U LT S 2 0 0 7
Box 2.3. IFC Faced Considerable Challenges Pursuing Sustainable PSD in Africa
IFC is embarking on a bold growth plan in Africa, where it isseeking to double its investments by 2009Between 1990 and 2006, IFC committed to 696 projects in Africa,with a total value of $4.6 billion. This represents 10 percent of IFCtotal commitments during this period, almost twice Africa’s shareof developing world GDP (5.6 percent). During the same period,Africa received just over $230 million (approximately 29 percent)of IFC’s advisory services funding. Going forward, IFC is seekingto more than double its investments to about $900 million per yearby 2009.
Ten years of evaluation show that IFC has faced major challenges doing business in AfricaWhile it is too early to evaluate the development results, invest-ment success, and work quality of IFC’s projects deriving from its2007 Africa Strategy and the 2005 Bank Group Africa Action Plan,9
reviewing 10 years of evaluation history of IFC’s involvement inAfrica highlights the challenges of doing business in the region. Thedevelopment performance of IFC investment projects in Africawas below average (49 percent, compared with 61 percent for otherregions between 1996 and 2006). Similarly, past results for IFC ad-visory services programs—the African Management ServicesCompany and the African Project Development Facility—have notbeen particularly strong (although these programs were recentlyrevamped).10 Low development ratings in IFC investment projectsreflected the lower quantifiable economic benefits of projects inAfrica. IEG-IFC estimated that projects with at least satisfactory de-velopment results generated net quantifiable economic benefitsof $1.50 for every $1 invested; whereas the yield from unsuccess-ful projects was just $0.10 for every $1 invested.11
IFC’s experience also shows that smaller projects (below $5 mil-lion) in Africa performed less well (41 percent success rate, com-pared with 56 percent for larger operations) and that the qualityof work (37 percent) was below average compared with larger proj-ects (56 percent).The evaluation of IFC’s experience also shows thatfinancial market projects performed poorly and that financial mar-ket and general manufacturing projects were associated with
weaker environmental and social effects than other projects, withlower compliance among IFC’s clients. Two types of instrumentsdid not work well: direct investments in SMEs and direct techni-cal assistance to SMEs. This is important in the context of the rel-atively large presence of SMEs in the region, many of themoperating in the informal sector, and given the priority role they playin IFC’s Africa Strategy and the Africa Action Plan.
Scaling up successfully will require better project executionquality and concerted efforts to improve African businessclimatesThe main reasons for the weak performance of private sector proj-ects were a challenging business climate, a high operating-cost en-vironment (administrative costs in Africa were twice those in otherregions),12 the relatively weak quality of IFC’s work (45 percent ofoperations in Africa had high work quality, compared with 68 per-cent for operations in other regions), and IFC’s willingness to takegreater risks in its projects there,13 as compared with other regions.Where the business climate and quality improved, so did IFC’s re-sults. For the success of its current strong scale up of operationsin Africa, IFC will need to follow through on its efforts to improvequality control, including design, appraisal, and supervision through-out the project cycle, especially on smaller projects, and continueits focus on enhancing business climates in the region. Efforts tostrengthen IFC–World Bank cooperation and to actively promotedonor partnerships on initiatives for improving the business envi-ronment are, therefore, fundamental for private sector developmentand for better development impact of IFC’s operations in Africa.
There have been several recent IFC strategic initiatives to sig-nificantly scale up and improve investment levels in Africa, in par-allel with its high increase in commitments. These initiatives includethe reorganization of advisory services into the Private EnterprisePartnership for Africa program, with a strong focus on businessclimate, financial market development, public-private partner-ships in infrastructure and SMEs, as well as the strengthening ofIFC’s capabilities on the ground through stronger decentraliza-tion, all of which are a response to the above evaluation results.

IFC’s environmental and social effects workquality at appraisal is good but FI super-vision is insufficient. Based on evaluations of
environmental and social effects work quality since
2004, IFC’s environmental appraisal for both FI and
non–FI projects is good, but supervision quality of
the FI portfolio is much lower compared with
real-sector projects. New annual monitoring report
L E S S O N S F R O M 1 0 Y E A R S O F P R I VAT E S E C T O R D E V E L O P M E N T E VA L U AT I O N
2 3
1009080706050403020100
Appraisal quality (at approval)
1996 1997 1998 1999 2000 2001 2002 2003 2004 2005 2006
Hig
h qu
ality
(per
cent
)
Supervision quality (at evaluation)
Role and contribution (at evaluation)
Period of majorIFC quality steps
Figure 2.4. Supervision Quality Has Improved since 2001, Reflecting Several Quality Enhancement Steps
Source: IEG.
� IFC took a number of quality enhancement steps between 1998 and 2001. The impact of these steps is showing up in better supervision rat-ings since 2001. Assessing the impact of these steps on appraisal quality is more difficult because of the 5-year lag between appraisal andevaluation (meaning appraisal quality has not yet been evaluated ex post for those operations appraised since 2001). This issue does not arisein the case of supervision quality, which is already evident at the time of evaluation (that is, up to and including 2006).
That said, improved risk management at approval (which IEG assesses ex ante) suggests that these quality enhancements steps should havea positive impact on evaluated appraisal ratings in the coming years.
High appraisal quality, high supervision quality 88 77
High appraisal quality, low supervision quality 64 59
Low appraisal quality, high supervision quality 42 44
Low appraisal quality, low supervision quality 19 26
Source: IEG-IFC.
Table 2.4. Good Quality Supervision Cannot Compensate Fully forWeak Appraisal Quality
� Based on 627 operations evaluated between 1996 and 2006, appraisal and supervision quality have been key determinants of developmentsuccess rates. High appraisal quality adds approximately 45–46 percentage points to IFC’s development success rates while high supervisionquality adds approximately 23–24 percentage points. The pattern is similar, though to a slightly lesser degree, for IFC investment success rates.Accordingly, high supervision quality cannot compensate fully for weak appraisal quality.
Work quality ratingPercentage of projects with
high development ratingsPercentage of projects with
high investment ratings

templates, adopted in 2003, for various real-
sector industries improved reporting quality and
allowed IEG to better track the project compliance
with at-appraisal objectives. IFC achieved high en-
vironmental and social effects appraisal ratings in
100 percent of the FI operations that were evalu-
ated in 2005 and 2006, mainly because IFC’s
generic requirements for FI projects are quite
straightforward and have been diligently trans-
lated into legal documents and commitment let-
ters. There has, however, been a downward trend
in the success rate of FI-project supervision work
quality between 2004 and 2006, with only 47 per-
cent of operations achieving high environmental
and social effects supervision ratings in 2006. IFC
has allocated most supervision resources to A-
category and high-risk B-category projects.16 As a
consequence, IFC has not visited some lower-risk
B-category projects and most FI projects. Some FIs
that IFC finances may have thousands of subpro-
jects—if even only a small percentage is screened
to the B–category, incorporating environmental
and social effects risks, the cumulative impact of
many subprojects could be significant. There is
thus a serious gap in IFC’s knowledge of project
environmental and social effects in FI operations,
and in environmental and social effects ratings
themselves, a fourth of which IEG has been unable
to validate, given the lack of information or liti-
gation/legal barriers to obtaining information. In
response to observed gaps in environmental and
social effects supervision, IFC is taking a number
of steps to improve its performance, including
visiting FI projects with a high-risk profile or with
deficiencies in their environmental management
systems every three years. Environmental and so-
cial management system deficiencies may be ad-
dressed without a site visit. Time will tell whether
these steps are successful.17
Type of Financing Has Implications forDevelopment PerformanceForeign currency financing can be prob-lematic, especially for nonexporting SMEs.A common theme highlighted by IEG evaluations
in last 10 years is the lack of term local-currency
financing, especially in Africa, and the substantial
investment constraints placed on firms with a
high dependence on domestic currency revenues,
particularly if exposed to exchange rate devalua-
tion.18 This is because of the mismatch between
income (in local currency) and expenditure com-
mitments (in foreign currency). An extreme ex-
ample is that of the Argentinean banks that
borrowed heavily in dollars in the 1990s, and fol-
lowing a one-time, drastic, 70-percent devaluation
of the Argentinean peso in 2001, were left with
large deficits in their balance sheets. Other ex-
amples include devaluations in Turkey and Brazil
in the 1990s, which had particularly adverse im-
pacts on second-tier companies in which IFC in-
vested.19
IFC is seeking to address the need for morelocal currency financing, with increasedloans and guarantees in local currency.As figure 2.5 shows, IFC has substantially increased
its local-currency-denominated financial products
in recent years. IFC is able to offer medium- to
long-term loans and hedges in 28 emerging mar-
ket currencies. IFC’s largest recipient of local cur-
rency loans has been Mexico, followed by India and
China (by amount), although IFC has now pro-
vided local currency operations to 16 African coun-
tries (the CFA franc zone, which includes Benin,
Burkina Faso, Cameroon, Chad, Côte d’Ivoire,
Mali, Senegal, Togo, plus, the Gambia, Ghana,
Guinea, Kenya, Madagascar, Nigeria, Swaziland, and
South Africa). IFC has also facilitated a number of
local-currency bond issues, including in Brazil
and Morocco. IFC nonetheless recognizes it could
provide more local currency products, given the
high demand for them. IFC is exploring ways to
provide local currency financing in markets where
there are no hedging alternatives available, through
the crea-tion of a global fund that provides local
currency hedges for loans disbursed by IFC.20 IFC
is also carrying out preparatory work for a CFA
franc, domestic-currency bond issue, which will
allow IFC to establish its credit in the market so
it can support local financial institutions by offer-
ing structured products to finance the private
sector throughout the region.
In reaching SMEs generally, direct en-gagement has not proven to be very suc-cessful for IFC. An internal IEG evaluation in
2000 found that direct lending to SMEs was nei-
2 4
I N D E P E N D E N T E VA L U AT I O N O F I F C ’ S D E V E L O P M E N T R E S U LT S 2 0 0 7

ther an effective nor an efficient model for IFC.
The evaluation found that IFC faced unacceptably
high administrative costs lending directly to SMEs,
and should focus more on FIs as a vehicle to
reach SMEs. IFC subsequently shifted its SME
approach to a wholesale model through FIs, an
approach for which a 2007 evaluation provides
continued support.21 IFC has also moved to a
more wholesale approach on the advisory services
side of its business (under the Private Enterprise
Partnership), by working with groups of SMEs as
part of a single project.
Nature of Linkages between Investmentand Advisory Services Activities Is AlsoImportantTwo forthcoming evaluations highlight thepotential benefits of linkages between in-vestment and advisory services activities.
IEG-IFC will soon report in detail on the per-
formance of the Private Enterprise Partnership ad-
visory services program in Eastern Europe and
Central Asia,22 as well as on IFC’s results in fi-
nancing micro, small, and medium enterprises
through financial intermediaries.23 One finding
that emerges from both evaluations is the po-
tential development gains for clients through
IFC’s synergies between its investment and advi-
sory services activities. In the Private Enterprise
Partnership, for example, sectorwide initiatives in-
tegrating advisory services with IFC investments
achieved higher development results than indi-
vidual transaction-based links. On the other hand,
advisory strategy and projects were largely de-
veloped and delivered independently of IFC in-
vestment staff expertise, diminishing potential
synergies and results. In helping microfinance
intermediaries, meanwhile, IFC has achieved suc-
cessful results where it has provided, along with
other multilateral development bank sharehold-
ers, technical assistance grant funds to cover costs
involved with, for instance, establishment and
training alongside equity investments.
Evaluation Provides a Basis for Better IFCResults Evaluation has helped promote a devel-opment effectiveness culture within IFC.Building on IFC Management’s initiative, in 1996,
L E S S O N S F R O M 1 0 Y E A R S O F P R I VAT E S E C T O R D E V E L O P M E N T E VA L U AT I O N
2 5
IFC
inve
stm
ent (
$ m
illio
ns)
Num
ber o
f pro
ject
s
0
100
200
300
400
500
600
700
1991–99 p.a. 2000 2001
Volume of commitment Number of projects
2002 2003 2004 2005 20060
5
10
15
20
25
30
Figure 2.5. IFC Is Increasing Its Provision of Local Currency Financing
Source: IFC.
Note: Figures do not include local currency options offered to, but not yet accepted by, IFC clients or some commitments that have yet to be disbursed.
� Prior to 2001, IFC made one or two low-value loans each year in local currency, each typically under the value of $10 million-equivalent. Since2004, IFC has increased its local currency lending, averaging nearly $25 million-equivalent per investment, and has also started to provide abroadly similar number of local currency guarantees.

IFC and IEG copioneered a monitoring and self-
evaluation system for IFC’s investment opera-
tions. More recently, IFC constructed a monitoring
and self-evaluation system for its advisory ser-
vices operations, developed broadbased per-
formance scorecards, and introduced real-time
development results tracking the project life cycle
for the whole portfolio.24 These steps are aligned
with evaluation report recommendations made
since the late 1990s for IFC to identify and mon-
itor development results from the point of proj-
ect approval onward and to establish an incentive
structure that emphasizes development-based
effectiveness.
Evaluation has revealed some key driversof development results and areas for processimprovement and strategy. As presented
throughout this chapter, a decade of evaluation has
identified several factors that have had a significant
determinant effect on project-level development
results. The knowledge of these drivers influences
IFC decision making about issues, such as en-
gagement in countries with high business cli-
mate risk and which sectors to emphasize or
de-emphasize. Evaluation findings on IFC appraisal
and supervision performance, beginning with
IEG’s first annual review (covering operations eval-
uated in 1996), also helped inform some of the
steps that IFC Management took in the late 1990s,
such as setting up a Credit Department, portfolio
units, and an equity desk, as well as developing
tighter environmental and social appraisal and su-
pervision procedures. Finally, country and sector
evaluations have fed into the Bank Group’s coun-
try and sector strategies.
Management has adopted the vast major-ity of IEG recommendations. Table 2.5 sets out
key evaluation recommendations, findings, and
impacts in the areas mentioned above. IFC Man-
agement and IEG, together, track IFC’s progress
in implementing recommendations from evalua-
tion reports in a Management Action Tracking
Record. An internal report found that, as of early
2006, about three-quarters of IEG recommenda-
tions were rated as having a “high” or “substan-
tial” level of adoption by IFC Management.
2 6
I N D E P E N D E N T E VA L U AT I O N O F I F C ’ S D E V E L O P M E N T R E S U LT S 2 0 0 7

L E S S O N S F R O M 1 0 Y E A R S O F P R I VAT E S E C T O R D E V E L O P M E N T E VA L U AT I O N
2 7
1996
1997
1998
1999
2000
2001
2002
2003
2004
2005
2006
Overallimpact
Exampleof impact
IEG (with IFC management) copioneersnew evaluation system for investmentoperations
IEG recommendation: establishdevelopment effectiveness objectivesat approval
Recommendation: Introducedevelopment-based incentives
Recommendation: Describe expecteddevelopment results at appraisal, andmonitor during supervision
Recommendation: Establish self-evaluation systems for noninvestmentoperations
IEG inputs into new evaluation systemfor advisory services operations
Better measurement of, and incentivesfor, development impact
Real-time Development OutcomeTracking System and Long-TermPerformance Awards (linked toachieved development impact) since2005
IEG finding: More realistic marketassessments (less optimism bias)would improve results
Finding: Large investments tend toperform better
Finding: IFC performs best in high riskcountries
Finding: Lack of local currency fundinga major problem for IFC clients
Recommendation: Consider wholesaleapproach to SMEs through FIs ratherthan direct lending
Finding: Better results where businessclimates improved
Finding: Good IFC work qualityespecially key where business climaterisk is high
Finding: Four key results driversexplain some two thirds of IFC results
Finding: IFC performs well in countrieswith improving business climates
Finding: Local currency finance key fornonexporting SMEs
Influences IFC decision making,including how to target and tailoroperations in high-risk countries
IFC is increasing the availability oflocal currency financing
Recommendation: Ensure projectionstake full account of identified risks
Recommendations: Set upindependent appraisal and/or creditcommittee to improve due diligence;adopt Project Supervision Records;carry out more supervision from fieldoffices
Recommendation: Improve FImonitoring of environmental effects of subprojects
Recommendation: Involve portfoliomanagers early on in the appraisalprocess
Recommendation: Track IFC’s role andcontribution through the supervisionstage
Recommendation: Ensure effectivemainstreaming of environmentalappraisal and supervision
Strengthened procedures andstructures for appraisal andsupervision
IFC established a credit department in1998
Table 2.5. Evaluation Findings Have Provided a Basis for Better IFC Results in Three Main Areas
Year2. Identifying key development
success drivers1. Promoting a development
effectiveness culture3. Laying the foundations for better IFC appraisal
Note: All findings and recommendations cited above are contained in IEG-IFC evaluations.


Evaluation findings have shown that IFC has generally made sound cor-
poratewide strategic choices over the past decade. IFC has extended
its reach in frontier markets and has achieved above-average develop-
ment results, overall, in its strategic countries and sectors—particularly through
its infrastructure operations.
Nonetheless, performance can always be improved
and IFC is rightly looking for ways to strengthen
its development contribution. IFC is seeking to in-
crease its development impact by growing its busi-
ness rapidly and decentralizing its operations. As
it pursues a higher level of activity under a new or-
ganizational structure, IFC must develop more
country-focused planning, adopt new incentives
and mechanisms for IFC–World Bank coopera-
tion in areas of synergy (such as business climate
development), and pay extra close attention to
work quality issues. It is also crucial that IFC in-
corporate in its strategic vision the possible growth
and institutional implications of the next major cor-
rection in the international markets.
IFC Is Pursuing an Ambitious GrowthPlan While Further Decentralizing Since 1998, IFC has broadly pursued fivestrategic priorities, generally with above-average development performance. IFC’s
1998 strategy (the first major strategic review
since 1991) provided the initial market and sec-
tor grounding for the five strategic priorities that
IFC has pursued in recent
years: (i) greater focus on
frontier markets; (ii) build
long-term partnerships
with emerging global play-
ers in developing countries;
(iii) differentiate through
sustainability; (iv) address constraints to private
sector growth in infrastructure, health, and edu-
cation; and (v) develop local financial markets.
Evaluation results from the past decade broadly
support these priorities, with IFC generally achiev-
ing better development and investment results in
the projects it has supported in its strategic coun-
tries and sectors (with the exception of the social
sectors), as well as with larger, repeat clients.
In 2005, IFC embarked on an ambitiousnew growth plan. IFC’s 1998 strategy also en-
visaged a potential doubling of IFC approvals by
2005 (from about $3 billion per year, to about $6
billion per year).1 This goal was broadly achieved.
In light of better development performance in
most of its areas of strategic focus, IFC’s 2005
2 9
Strategic Implicationsfor IFC
3
Overall, IFC has
achieved above-
average development
performance in strategic
countries and sectors.

strategy called for IFC to accelerate the imple-
mentation of its strategic priorities, as a means to
maximize its development impact and optimize
the use of its capital base. In this context, the
strategy called for an increase in investment op-
erations by approximately 35 percent overall, and
by nearly 100 percent in frontier countries by
2008.
This growth plan was supplemented in 2006with six high-priority goals, and a chal-lenge to further decentralize operations.The 2006 strategy extended the growth plan until
2009, and set out six high-priority goals to be
achieved during the 2006–09 period. These goals
are: (i) greater development impact, (ii) improved
World Bank Group cooperation, (iii) leadership
in standard setting, (iv) improved client satisfac-
tion, (v) sound finances, and (vi) strong staff. The
revised strategy also laid out the challenges to IFC
of further decentralizing its operations, bolster-
ing its human resources (for example, building and
developing diverse talent, enhanc-
ing corporate and staff incentives,
and accelerating decentralization),
developing sufficient risk manage-
ment and financial capacity, and
ensuring effective management of
its advisory services. There has been a conscious
trend toward the decentralization of IFC opera-
tions in the last 10 years, with the number of IFC
investment officers in the field more than doubled
during that time.2 The latest decentralization ini-
tiative, confirmed by IFC Management in early
2007, is bolder than previous ones, however, in
that it proposes the same level of relative growth
in field-based investment staff in just three years,
by 2010.
For analytical purposes, IFC’s strategicobjectives can be seen to cover four per-spectives of a strategy-focused organiza-tion.3 IFC’s strategy would map onto these
perspectives as follows:
• Stakeholder and client perspective. To meet the
expectations of its stakeholders, in strength-
ening its development impact, IFC is propos-
ing to scale up its activities in all of its focus
sectors and regions, especially in frontier coun-
tries and regions, and to expand its invest-
ments in infrastructure, health, and education,
as well as strengthen the development of local
financial markets. Meanwhile, IFC is offering a
value proposition to its clients, based on pur-
suing differentiation through sustainability,
promoting “South-South” investment part-
nerships, supplying a range of complementary
technical assistance and investment instru-
ments, and improving client relations and
satisfaction.
• Internal process perspective. To meet these
objectives toward its stakeholders and clients,
IFC is internally undertaking major initiatives for
decentralization, strengthening World Bank co-
operation, improving client relations processes,
and reducing processing time.4
• Human capital perspective. The above strate-
gic objectives have led to the pursuit of further
redeployment of staff that would allow the
creation of a global/local institution. This has
created demands for careful institutional knowl-
edge management based on local business
originators and portfolio managers, and global
specialists that will transfer international de-
velopment knowledge.
• Financial and measurement perspective. Fi-
nally, IFC strategy is underpinned by the pur-
suit of stronger risk-management capacity to
support growth, sound finances, and a tech-
nological platform that can facilitate internal
processes to help IFC be more effective with
its clients.
Going forward, there are opportunities for im-
provement for IFC across each perspective.
Stakeholder and Client Perspective: IFCNeeds to Adopt a Deeper Country Focusand Emphasize Distributional IssuesPrioritizing high-need countries remains ahighly relevant approach for IFC. IFC has
achieved high development ratings through its
pursuit of a frontier strategy, catalyzing invest-
ment in high-risk and low-income countries (in-
cluding a number that have been affected by
conflict) and sectors. The subsequent graduation
of many frontier countries into environments
more conducive to private sector investment is the
driving force behind these positive results, and
3 0
I N D E P E N D E N T E VA L U AT I O N O F I F C ’ S D E V E L O P M E N T R E S U LT S 2 0 0 7
The latest
decentralization
initiative is bolder
than previous ones.

thus highlights the importance of Bank and IFC
efforts to improve business climate quality. This
is of utmost importance in Africa, which has fallen
far behind other developing markets in terms of
investment risk and private investment.
Major private sector development needs are not, however, found exclusively in fron-tier countries. Many nonfrontier MICs, the
mainstay of the developing world, also have sub-
stantial PSD needs. The binary split of the world
into frontier/nonfrontier has its shortcomings.
First, many countries have migrated from the
former to the latter category (such that frontier
markets account for a much smaller share of
developing country GDP than they did in 1997).
Second, many countries that are currently clas-
sified as nonfrontier have similar enabling infra-
structure needs as do frontier countries. More-
over, there are significant constraints to doing
business in nonfrontier MICs, relative to high-
income countries, including financial markets
and infrastructure development that hinder the
competitiveness of firms in these countries
(which account for about 85 percent of devel-
oping country GDP and where approximately
one-third of all people who live on less than $2
per day reside):
• The banking capacity of non-
frontier countries is generally
no deeper than frontier coun-
try banking capacity (see fig-
ure 3.1), and is much lower
than in high-income coun-
tries.5 Financial markets are particularly un-
derdeveloped in Latin American MICs.6 Lack of
banking capacity keeps the cost of doing busi-
ness high for many countries, especially where
term local-currency financing has been lacking
and limits poverty-reducing growth.7
• Infrastructure shortages are notable in many
nonfrontier MICs. The Private Provision of In-
frastructure average for these countries, at 1.6
percent of GDP, is higher than the average 0.9
percent of GDP for frontier countries.8 How-
ever, the cost of trading across borders nonethe-
less remains high, keeping the cost of doing
business higher than it might be otherwise.9 In-
frastructure shortcomings of this kind are par-
ticularly important for many MICs, such as
Egypt, Mexico, and the Philippines, which are
S T R AT E G I C I M P L I C AT I O N S F O R I F C
3 1
There are significant
constraints to doing
business in middle-
income countries.
Dom
estic
cre
dit t
o pr
ivat
e se
ctor
(per
cent
age
of G
DP)
0
20
40
60
80
100
120
140
1995 1996 1997 1998 1999 2000 2001 2002 2003 2004 2005
Nonfrontier MICs (excluding China)Frontier LICs and MICs China
Figure 3.1. Many Nonfrontier Countries Are as Lacking in Banking Capacity asFrontier Countries
Source: World Bank Group, Global Development Finance database.
� In terms of banking capacity (proxied by the proportion of private-sector domestic credit to GDP), there is close similarity between frontier andnonfrontier countries. Excluding China, which accounts for approximately 23 percent of developing country GDP, the average banking capacityof nonfrontier MICs has stagnated in the last 10 years at about 40 percent. Average banking capacity in frontier countries has, however, grownto the point where there is little to distinguish the banking depth of frontier from nonfrontier countries.

heavily dependent on otherwise low-cost
industrial exports.10
• High informality that reduces the produc-
tivity of the law-abiding, otherwise efficient
companies.11
• There are sizable low-income and/or high-risk
regions within nonfrontier MICs, which reflects
the unequal development of the private sector
and economic growth in these countries. IFC
is starting to measure its commitments in the
frontier regions of 20 MICs, but does not yet
know to what extent it is reaching low-income
and/or high-risk regions across all MICs.
When private capital flows have been moreabundant, IFC has made less of a unique,pioneering contribution in MICs—empha-
sizing the need for IFC to carefully consider coun-
try dynamics in defining its additionality. When
private capital flows were relatively high in the mid-
1990s, the institution was less successful in pro-
viding a unique role and contribution. IFC also
achieved noticeably worse development and in-
vestment ratings in MICs when its role and con-
tribution were rated as less than satisfactory. When
role and contribution was rated low, only 6 per-
cent of IFC-supported projects achieved high de-
velopment ratings, generally, compared with 71
percent when IFC’s role and contribution was
rated high—a bigger differential than for IFC op-
erations in low-income countries.12
The need for a deeper country approach isamplified when looking at IFC’s below-average results in countries with low bank-ing capacity. While IFC prioritizes investments
in the financial sector (together with infrastructure
and social sector investments) and is, on the whole,
reaching countries with below-
average banking capacity (where
the share of private sector credit
to GDP has been less than the
developing country average of
35 percent), its results in these
countries are much weaker than
in countries with above-average
banking capacity (where the
share of private sector credit to GDP has been
greater than 35 percent). Sixty-seven percent of IFC
financial sector commitments between 1996 and
2006 were in countries with low banking sector
depth, while 25 percent of IFC financial sector
commitments were in countries with high bank-
ing sector depth.13 However, the development re-
sults of IFC-supported financial sector projects in
countries where banking sector depth was low—
which includes 39 countries in Africa—were lower
than those in countries with high banking capac-
ity. Only 55 percent of IFC-supported financial sec-
tor projects were rated highly in low banking
capacity countries, compared with 71 percent in
countries with above-average banking capacity
(see table 3.1). These results highlight the need for
IFC to work closely with governments and other
development partners to optimize IFC’s addi-
tionality and the development potential of these
investments, for example, in financial intermediaries
providing support to micro, small, and medium en-
terprises (which a forthcoming evaluation con-
firms is an effective way for IFC to reach them).14
IFC also has a role to play in identifying and facil-
itating regulatory changes that reduce corruption
and/or the pursuit of anticompetitive practices
(which have been a problem in low banking ca-
pacity countries such as Senegal and Malawi).15
A forthcoming evaluation of the PrivateEnterprise Partnership also shows thatgreater country tailoring is needed in someof IFC’s advisory services operations. In its
Private Enterprise Partnership program, a forth-
coming evaluation shows that IFC has tended to
replicate product line initiatives rather than tailor
them to individual country needs. Moreover, sen-
ior staff took brief needs-assessment trips to as-
certain the appropriateness of new projects, but
these assessments were not thorough enough to
prepare or sufficiently adapt many projects ade-
quately to country-specific needs and conditions
before project launch.16
IFC could strengthen its commitment tocountry needs through the use of systematicindicators for PSD progress. Clearly identi-
3 2
I N D E P E N D E N T E VA L U AT I O N O F I F C ’ S D E V E L O P M E N T R E S U LT S 2 0 0 7
Where IFC’s role and
contribution was low
in MICs, only 6
percent of projects
achieved high
development ratings.

fying individual country needs is challenging and
the ability of IFC to respond to these needs will
depend on IFC’s own capacity in the country,
particularly in relation to other sources of pri-
vate finance. Nonetheless, together with the Bank
and country governments, IFC could develop
and pursue a set of PSD indicators that would help
guide its strategy and operations in each country,
bearing in mind its own capacity constraints.
These indicators could include the level of private,
gross, fixed-capital formation; banking sector
depth; and other indicators of access to finance
as well as private provision of infrastructure in a
country. Some indicators along these lines were
included for select countries in the 2005 World
Bank Group Africa Action Plan.17
Tackling quality of growth and pure mar-ket distributional issues will be impor-tant, as will recognizing that poverty has a strong
rural origin. Evaluation has shown that the qual-
ity of economic growth and the distribution of in-
come matters in reducing the number of poor
people.18 Poverty continues to show a strong rural
origin, and an explicit recognition of this in IFC’s
strategy would be appropriate. A focus on the
agribusiness sector, where IFC operations have
had beneficial impacts for farmers and producers
through linkage programs, could be useful in this
respect.19 Rural microfinance is equally important,
though evaluation findings suggest that the cost
basis of rural schemes may be higher than for
urban-based microfinance institutions because of
the greater geographical spread of clients.20 Box
3.1 provides examples of successful agribusiness
and rural microfinance operations. As IFC decen-
tralizes further, one priority would be an envi-
ronmental and social strategy at the country level
to identify and develop high-impact projects with
widespread demonstration effects. Such projects
include those with meaningful and effective
safeguards to offset environmental and social dam-
ages, projects aimed at capitalizing on the possi-
bilities for developing countries to make money
from environmental and social protection, and
also those designed to facilitate greater involvement
of women entrepreneurs. From IEG’s ongoing
study in the area of environmental performance,
actions relating to the environment and climate
change are emerging as a priority area.21 Finally,
given its growing and evident impact upon lower-
income groups, in this same area of market dis-
tribution considerations, IFC might evaluate its
role in the remittances market, either in the efforts
that many are making to reduce the costs of trans-
fers or in the provision of better financial services
to the population involved in these flows.22
IFC will need to continue efforts to increasethe provision of local currency financing. As
S T R AT E G I C I M P L I C AT I O N S F O R I F C
3 3
Above-average (private sectorcredit share > 35%) 38 71 76
Below-average (private sectorcredit share < 35%) 121 55 58
Total 159 59 62
Source: IEG; and World Bank Group, Global Development Finance database.
Note: Projects were evaluated between 2001 and 2006.
Table 3.1. IFC’s Financial Sector Development Success Rates Are Lower WhereBanking Capacity Is Weak
Level of banking capacity Number of projects
Percentage ofprojects with highinvestment ratings
Percentage ofprojects with high
development ratings

various evaluations have shown in the last 10 years,
term local-currency financing is insufficient in many
countries. Where term local-currency financing is
unavailable and companies resort to hard-currency
financing, they are often unable to match their as-
sets (denominated in local currency) and liabilities
(borrowings, typically denominated in foreign cur-
rency), thus making them especially vulnerable to
exchange rate fluctuations. This has been a partic-
ular problem in Africa, where exchange rate volatil-
ity, combined with commodity price fluctuations
in economies with limited diversity, has meant that
foreign currency borrowing has
proven costly for African firms.23
While IFC has increased its local-
currency financial products, the
need for more local currency
financing remains substantial.
Finding a workable model for social sectorinvestments is also an area for improve-ment. Based on the 13 evaluations to date, IFC
has had a weak record in its social sector invest-
ments. Nonetheless, it has achieved some suc-
cesses, notably through innovative structuring
(through Public Private Partnerships) and where
the operations have targeted a market segment
that is not significantly exposed to foreign ex-
change risk.24 Since education and health care is
typically paid for in local currency, some opera-
tions have failed due to currency devaluations
that have made their foreign currency exposures
(including IFC foreign-currency loans) an unsus-
tainable burden. IFC is, encouragingly, increasing
its use of innovative, nonconventional structuring,
although public acceptance of the role of private
provisioning in social services remains variable.
3 4
I N D E P E N D E N T E VA L U AT I O N O F I F C ’ S D E V E L O P M E N T R E S U LT S 2 0 0 7
Tackling quality of
growth and
distributional issues
will be important.
Box 3.1. Examples of Successful Agribusiness and Rural Finance Operations
An agribusiness operation in West Africa with substantial socialimpacts: The project was a palm oil operation in a west Africancountry. Operations would include the planting of palm trees as wellas establishing a mill to extract oil. The expansion was a follow-up investment following the privatization of a rubber plantation (thepalm operation was a new project on the plantation). The client com-pany inherited workers as well as the social services infrastruc-ture (schools and health care) of the region. The project allowedfor more productive use of the labor force and facilitated mainte-nance of the social infrastructure. The company also providedtwo smallholder programs with extension services around the in-dustrial plantation. The outgrower scheme supported by the com-pany provided linkages to surrounding planters and for local privatebusinesses. The project brought improved living standards to thesmall outgrowers as they gained access to new plantation tech-niques and practices, with the outgrowers earning more revenuesthan they would have earned from subsistence farming, as well asgaining access to improved physical infrastructure.
An integrated approach to microfinance, including fee-based ad-visory services, with significant rural development impacts: Theproject was to support the expansion and development of one ofthe first private-sector microfinance institutions responding to thecredit needs of the rural poor, a large market segment not prop-erly served by the formal and informal financial system. IFC invested
equity together with a pre- and post-investment advisory servicesprogram (the client microfinance institution realized that apartfrom microcredit, rural households have a significant need for ad-visory assistance to improve their microbusinesses). Subsequently,IFC reoriented its strategy to provide three services in an integratedmanner:
(i) Financial services—microcredit and microinsurance (forexample, life, rainfall, crops);
(ii) Agricultural/business development services—advisoryservices on productivity enhancements (vaccinations,pest management) and alternate input/output market link-ages; and
(iii) Institutional development services—advisory services onthe formation of producers’ groups for enhancing bar-gaining power and lowering transaction costs, capacitybuilding, accounting, and information technology systems.
IFC is now engaged in providing credit as well as technical assis-tance and advisory services to rural small-enterprise owners,farmers, village self-help groups and other rural service providers.The revised strategy has been appreciated by its target customers,with the total client base increasing to almost 20,000 by the end of2005. IFC has not only generated additional fee income, but alsosignificant goodwill among its clients.

Internal Process Perspective: New Incentives and Mechanisms forIFC–World Bank Cooperation RequiredClose cooperation between IFC and theWorld Bank in areas of synergy could po-tentially bring development gains, although
these gains are not systematically tracked. While
IFC and the World Bank generally have different
means, and work with different clients, to achieve
poverty reduction, there are opportunities for the
two institutions to cooperate to bring about de-
velopment gains. Areas of synergy in the work of
the two organizations include efforts to diag-
nose and improve the business-enabling envi-
ronment, as well as those geared toward deep-
ening the physical and financial infrastructure in
client countries. Cooperation to ensure that pri-
vate sector development is carried out in an en-
vironmentally and socially sustainable manner is
also an important area of institutional overlap
(see examples in box 3.2). The opportunities to
exploit these synergies vary by country but are
particularly great in Africa, which has fallen far be-
hind other developing markets in each of these
dimensions. At the thematic level, IFC and the
World Bank have, in recent years, created joint
departments to foster greater cooperation on
SME development, in the area of information
S T R AT E G I C I M P L I C AT I O N S F O R I F C
3 5
Box 3.2. Examples of World Bank Group Cooperation
Improving Business Climates
Morocco: As in a number of other countries, IFC and the Bank have,in recent years, carried out joint studies of the administrative andregulatory costs of doing business in Morocco, while IFC has pro-vided contributions to the most recent Bank-led investment climateassessment for the country. In 2006, Morocco was the top re-former in the Middle East and North Africa region, in terms ofreducing the costs to doing business. There is still room for im-provement though; Morocco ranked 115 out of 175 countries over-all by this measure.25
Developing Physical Infrastructure
Philippines: Water. After the Bank helped the city of Manila de-cide to restructure its water and sanitation services in 1997, IFCadvised it on how to structure the concessions, and later investedin one of the competitively selected concessionaires (which hasbeen largely successful). The Bank, for its part, financed a closelylinked, publicly funded project to upgrade and expand access tosewerage, a project ultimately rated moderately satisfactory be-cause of (among other things) delays, due to limited contact withthe concessionaires. As a result of the projects, the populationserved by water connections increased 64 percent. Those with for-mal sewerage connections or de-sludged septic tanks increased92 percent (though this still represented only 15 percent of allwater connections).
Senegal: Power. Close cooperation was a necessary condition forthe completion of a major power project, which three years of tech-nical assistance could not otherwise bring to completion.26
Deepening Financial Sector Capacity
Mexico: Housing Finance. Since 1995, in the wake of the country’sfinancial crisis, the Bank, with assistance and loans, has helpedauthorities to rebuild the systemic foundations for the provision ofhousing finance. IFC has provided funding and equity to housingfinance lenders in the primary and secondary mortgage markets.Following these interventions, the housing finance system hasevolved substantially, with, for example, bond funding and risk-based regulations. Among other things, IFC has helped develop-ers to access bonds to finance residential construction.
Ukraine: Private Credit Bureaus. The Bank assisted the govern-ment on legislative reform to help enable private credit bureaus.IFC followed with implementation assistance that resulted in thecreation of three private credit bureaus.
Environmental and Social Knowledge Building
Cambodia. The Bank and IFC cohosted a workshop on “ProfitableFinancial Services for Sustainable Energy Projects,” as a meansto sensitize financial institutions in the East Asia region to the op-portunities in sustainable finance. Cohosting of the event by the twoinstitutions attracted top officials in the private sector and gov-ernment from across the region. The workshop resulted in morethan 20 of the regional banks present at the workshop signing upfor further training on energy efficiency issues.

communications technology, and on private sec-
tor development overall. The Bank Group has
also pursued a number of special initiatives tar-
geted at Africa, including a joint International
Development Association/IFC micro, small, and
medium enterprises program, which now sup-
ports 25 banks in 7 countries.27 It is, however, too
early to fully evaluate the effectiveness of these re-
cent efforts. More generally, a lack of up-front
identification and tracking of IFC investment
operations that have benefited from Bank policy
or regulatory assistance
means that the ultimate
development gains of co-
operation that have oc-
curred to date cannot be
systematically evaluated.
Country-level cooperation between IFC andthe World Bank, as envisioned in CountryAssistance Strategies (CASs), has been mod-est. In spite of the numerous efforts that the Bank
Group has made to improve cross-institutional
cooperation, in 15 client countries that IEG eval-
uated in 2006 (countries that account for about half
of IFC and World Bank investment and lending op-
erations, respectively) operational cooperation28
in the previous decade had been modest relative
to what was envisioned in CASs. By theme, coop-
eration activity was highest but much less fre-
quent than envisaged in the areas of synergy
outlined above, and it was especially low in the
areas of rural and regional development, reflect-
ing IFC’s relative lack of emphasis on these is-
sues in the past. (See figures 3.2 and 3.3).
Evaluation has uncovered some signifi-cant inhibitors to Bank Group coopera-tion, which imply new incentives andmechanisms to complement the CAS. IEG’s
evaluation found that the CAS process has not gen-
erally provided a good basis for within-country co-
operation. The evaluation of 15 major Bank Group
client countries found a number of inhibitors of
cooperation, such as major structural differences
between the two institutions (IFC has tended to
structure itself by sector and region; the World
Bank by country and region, meaning the CAS
holds less sway on IFC’s deliverables than the
Bank’s), differences in organizational culture, and
lack of rewards for working across institutional
boundaries, which together have more than bal-
3 6
I N D E P E N D E N T E VA L U AT I O N O F I F C ’ S D E V E L O P M E N T R E S U LT S 2 0 0 7
There are opportunities
for cooperation to bring
about development gains.
Num
ber o
f act
iviti
es
Impl
emen
tatio
n ra
te(p
erce
nt)
Infrastructuredevelopment
Businessenvironment
Financialservices
Rural/regionaldevelopment
Other
Planned Implemented Implementation rate
0
5
10
15
20
25
30
35
40
0
10
20
30
40
50
60
70
Figure 3.2. Implementation of World Bank Group Cooperation Differed from WhatWas Planned in CASs
Source: IEG.

anced out the factors that facilitate cooperation
(see table 3.2).29 Incentives to cooperate with
the Bank and exploit synergies, within a better
country-level operational framework, particularly
to develop the enabling infrastructure for private
sector development, are urgently needed. Efforts
announced by IFC in March 2007 to create more
structured processes to enable greater input into
its advisory services operations by Bank staff are,
in this respect, encouraging.30
Human Capital Perspective: EnsureRobust Work Quality as IFC DecentralizesIFC’s strategy predicts greater develop-ment impacts through a higher level of ac-tivities and better quality. However, this is
difficult to achieve in the short run, as the expe-
rience in the late 1990s illustrates. Change is usu-
ally disruptive, and change in several dimensions
at the same time can be especially disruptive.
During a previous period of major organizational
change, 1998–2001, IFC supervision quality—an
important driver of development success rates—
fell sharply. In these years, IFC carried out nu-
merous quality enhancement steps, including the
establishment of a Credit
Department and portfolio
desks, and introduced new
environmental review pro-
cedures. Despite these mea-
sures (or because of them, since they raised
standards in some cases for projects that had al-
ready been approved), supervision quality was
high in only 56 percent of IFC investment oper-
ations in these years, compared with an average
of 73 percent in other years. The quality en-
hancement steps have, overall, helped IFC to im-
prove supervision quality, though with lagged
implementation (supervision quality started im-
proving from 2002).
IFC has improved risk management andsupervision quality in South Asia as it hasdecentralized, but with more modest volume
growth than in other regions. IFC has improved
its risk management at approval in South Asia
with decentralization of activities in the region, re-
ducing sponsor risk and market risk (table 3.3),
while also achieving above-average supervision
quality.31 This suggests that decentralization has
improved quality at different stages of the project
S T R AT E G I C I M P L I C AT I O N S F O R I F C
3 7
Num
ber o
f act
iviti
es
Impl
emen
tatio
n ra
te(p
erce
nt)
China
Jorda
n
Morocco
Azerba
ijan
Ukraine
Mexico
Brazil
Philip
pines
Argenti
naEg
yptRuss
ia
Kazakhs
tanAng
ola
Urugua
y
South
Africa
Planned Implemented Implementation rate
0
2
4
6
8
10
12
14
16
18
0
10
20
30
40
50
60
70
Figure 3.3. Follow-through on Cooperation Was Modest in Many Countries
Source: IEG.
The CAS holds less sway
on IFC’s deliverables
than the World Bank’s.

cycle. However, this improvement has occurred
with more modest volume growth than in other
regions.32 Employing more staff in the field and in-
creased volumes of operations may go hand-in-
hand (lack of local presence in the Ukraine in the
1990s was a key reason IFC was behind EBRD in
realizing investment opportunities in the country)33
but could take time. This suggests the need for a
steady roll-out in the decentralization of IFC ac-
tivities while pursuing a growth agenda, and care-
3 8
I N D E P E N D E N T E VA L U AT I O N O F I F C ’ S D E V E L O P M E N T R E S U LT S 2 0 0 7
Factor Example as driver Example as inhibitor
Institutional level
High-level direction
Organizational structure
Cross-institutional recognitionand incentives
Country level
Level of country managerinteraction
Country office setup
Client govenment demand
Project level
Project timeline
Perceived conflicts of interest
Individual level
Personality, relationships, andperceptions
Strong top-down messages encouragestaff to seek out cooperative opportunities
Joint departments increase informationsharing between staff with similarinterests
Greater information exchange andstrategic planning through jointmanagement teams, regular, systematicinformation exchanges (e.g., through jointstaff meetings)
(i) Strong IFC country office staff presence(ii) Co-located offices
Strong government push for cooperation
Similar timetables for completion
Some staff more likely to communicateacross institutional boundaries; priorworking relationships provide openings
Different reporting lines: IFC investmentdepartment and regional strategy unitsvs. Bank country office; modest IFCownership for CAS deliverables
Lack of recognition for contributions towork of the other institution
Limited interaction constrainsinformation sharing and/or breedsmisperceptions
(i) Lack of IFC country office staff(ii) Offices in different cities or anotherpart of the same city
Incompatible timelines slow project
Reputational and commercial risks frominappropriate information flows
(i) Perception that culture of otherinstitution is too different to exploitsynergies(ii) Staff too busy to seek out counterparts
Source: IEG.
Table 3.2. Drivers and Inhibitors of World Bank–IFC Cooperation

ful monitoring and management of the inherent
risks, so as to learn from experience and mitigate
any volume/project-execution quality trade-offs.
The greatest risk in a decentralizationprocess is the loss of global knowledge.Knowledge is one of the most important intangible
assets that IFC uses to promote private sector
development. As figure 3.4 illustrates, IFC faces a
knowledge-retention challenge in that the ma-
jority of staff attending core credit training in
2001 and 2002 are no longer active with IFC (im-
plying inefficient use of training resources by IFC
as well as a knowledge drain). This sort of reten-
tion issue is amplified in an organization that,
as previous evaluations have shown, does not
have the best record in knowledge capture and
sharing, and where knowledge often resides with
S T R AT E G I C I M P L I C AT I O N S F O R I F C
3 9
Product market risk –22 –6
Sponsor risk –14 –3
Review intensity risk –23 –3
Source: IEG.
Table 3.3. With Decentralization, the South Asia Region Improved Its RiskManagement in Key Areas
High-risk factor
South Asia:Change in operations exhibiting ahigh-risk factor between periods1995–2000 and 2002–05 (percent)
Other regions:Change in operations exhibiting ahigh-risk factor between periods1995–2000 and 2002–05 (percent)
Perc
enta
ge o
f tra
ined
sta
ff no
long
er w
ith IF
C in
Feb
ruar
y 20
07
0
10
20
30
40
50
60
2001 2002 2003 2004 2005
Year of credit training
Figure 3.4. IFC Faces a Knowledge-Retention Challenge
Source: IFC.
� Since 2001, all new IFC investment officers are required to attend core credit training, as a means to ensure that IFC transaction quality is con-sistent and of a high quality.
An analysis of past attendees of this core credit training shows that more than a half of attendees who completed the course in either 2001 or2002 are no longer working at IFC. While there are more new trainees now than in 2002 (192 in 2006 compared with 52 in 2002) this still pres-ents a major knowledge-retention challenge for IFC, as it seeks to increase transaction work quality, unless IFC develops a better record of retaining staff that have completed the training more recently.

a few very experienced individuals rather than a
unit or department.34 Finally, given the decen-
tralization process and redeployment of staff, IFC
will need to ensure that it protects not only its
brand but, more importantly, its organizational cul-
ture and global knowledge, guarding against the
creation of numerous local cultures that adversely
dilute IFC’s “style” and impact.
IFC might learn from the experiences of theBank in knowledge sharing within a moredispersed organization. The Bank has exten-
sive experience in trying to ensure effective global/
local knowledge synergies. The Bank’s regions
have developed internal knowledge-sharing tools
and activities. However, as a 2003 evaluation
showed,35 in the absence of a mandate defining the
regions’ internal knowledge-sharing responsibil-
ities, their scope has varied. And since 2000, the
Bank’s regions have increasingly focused on ex-
tending their knowledge-sharing activities to the
transfer and brokering of knowledge with clients,
but this has not been matched with enhanced at-
tention to internal knowledge sharing. Moreover,
while Bank operations are increasingly multisec-
toral in approach, the bulk of knowledge capture
and sharing is organized by network and sector.
In interviews conducted for a study by IEG-World
Bank, staff noted that the “silo” structure of the in-
ternal knowledge-sharing function did not meet
the needs of multisectoral operational work. Ad-
ditionally, there was inadequate coordination be-
tween network knowledge-sharing activities and
the country and project teams. Few network in-
ternal knowledge-sharing activities were embed-
ded directly in core work processes.36
Leveling up the quality of IFC’s environ-mental supervision of FI operations shouldbe a central consideration. In addition to
below-average supervision in the financial sector,
discussed earlier, evaluation has also highlighted
a low role and contribution of IFC in this sector.
More often than not this was due to IFC not hav-
ing delivered on its expected contribution—in-
cluding helping these institutions develop
adequate in-house environmental and social mon-
itoring capability. In theory, greater on-the-ground
presence should help IFC improve the supervision
of the environmental and social effects of its op-
erations, and provide a greater role and contri-
bution, as it potentially enables IFC to work more
closely with clients in promoting good environ-
mental and social practices. To maximize this op-
portunity, IFC will need to make sure it continues
mainstreaming environmental and social respon-
sibilities throughout its investment staff and that
the appropriate specialist capacity is provided to
support effective supervision of the environmental
and social effects of FI operations.
Effective local recruitment, especially inAfrica, will also be important. Overall, IFC
faces fierce competition from the market to attract
high-quality investment officers. Recruitment chal-
lenges are particularly acute in Africa. Despite its
increasing focus on development results, IFC’s in-
centive regime is still geared toward the level of
activities and speed of delivery of projects. Africa,
where projects outside the extractive and infra-
structure sectors are usually quite small and ges-
tation periods are lengthy, has historically not
been perceived as an attractive place to work.
IFC has found it difficult to attract significant
numbers of high-performing investment officers
to commit to working in the region (although
recent efforts to increase staffing in the regional
office in Johannesburg appear to be gaining some
traction).37 Compensation is also a problem, par-
ticularly in light of overall shortages in the num-
ber of suitably qualified, locally based personnel.
Financial and Measurement Perspective:Prepare for the Next Major MarketCorrection and Improve DevelopmentImpact Measurement While risk management and business cli-mate risk has improved, this pattern couldeasily be reversed. IFC’s development and in-
vestment success rates are heavily influenced by
the quality of risk management of its projects, as
well as the quality of the business climates in which
they operate. IFC has improved its risk manage-
ment at approval since 2001, to the extent that it
been able to balance the increased risk associated
4 0
I N D E P E N D E N T E VA L U AT I O N O F I F C ’ S D E V E L O P M E N T R E S U LT S 2 0 0 7

with new investments in frontier markets with ap-
propriate project and investment structuring. Pur-
suing a rapid-growth agenda while reorganizing IFC
may have an impact on the quality of risk man-
agement, however, and IFC will need to carefully
monitor this to avoid a decline in its success rates.
Moreover, there is the growing threat of a signifi-
cant global economic slowdown, including de-
veloping country economies, which would likely
affect the development effectiveness of IFC’s op-
erations. (In addition, it could have an impact on
IFC’s profitability, which has depended heavily in
recent years on returns of IFC’s equity invest-
ments, and will depend in coming years on the abil-
ity to convert considerable unrealized gains into
actual returns; see appendix B). An explicit recog-
nition of the potential for a major correcting event,
given a more complex global financial system, its
possible impacts on the developing countries, and
the risk-mitigating actions and products conceived
by IFC to serve its clients, would strengthen IFC’s
strategic vision. In general, within this context,
continued efforts to improve risk-management
systems38 and to prepare for the
next major shift in the interna-
tional markets, including perhaps
the development of new risk-mit-
igating products, will need to be
at the forefront of IFC’s strategic planning.39
IFC’s role as a countercyclical lender willbe more important than ever in the eventof a global economic downturn. Box 3.3 out-
lines some examples of how IFC played a coun-
tercyclical role in the respective crises in the
Republic of Korea, Russia, and Turkey. Learning
from past experiences, IFC will need to look for
similar opportunities for a value-added role in
the event of a new economic downturn and a
sudden cessation or withdrawal of private capital
flows directed at developing countries.
Strengthening capacity for evaluation andits application will also be important. In-
creasingly in recent years, IFC’s strategic directions
have been informed by evaluation findings. This
S T R AT E G I C I M P L I C AT I O N S F O R I F C
4 1
Box 3.3 Examples of IFC’s Countercyclical Role during Previous Crises
Korea
Corporate restructuring: IFC helped foreign investors to take overa failing security firm. The investors restructured the firm, introducednew marketing methods, and issued new financial instruments (dollar-denominated corporate bonds). The result was a successfulcorporate turnaround, with retention of jobs and regained marketshare. Other investors subsequently copied this deal structure, andthe company was ultimately bought by a domestic bank, as foreigninvestors exited.
Introduction of securitization: IFC helped in one of the first, cross-border, lease asset transactions in Korea in the wake of the Asiancrisis. The transaction was expected to provide much needed liq-uidity and term funding to the client company, and to demonstratethe feasibility of securitization of domestic assets in the country.Although placement of the securitized notes in international mar-kets was limited, the transaction had a capacity-building effect onlocal agencies, institutions, and counterparts, and showed thatsecuritizing Korean assets could be done.
Russia
Corporate restructuring and liquidity: IFC invested in a restruc-turing fund after the Russian Crisis of 1998. The fund was to pro-vide additional equity for corporate restructuring, capital investment,and working capital. The investment was successful because it pro-vided valuable capital to the portfolio companies to help themweather the crisis when external capital was scarce. IFC’s in-vestment was catalytic in terms of enabling new capital injectionsand helped the fund managers to stay intact during hard years offundraising.
Turkey:
Helping industrial clients through market turbulence: IFC playeda similar countercyclical role in Turkey. IFC has supported its largeindustrial clients through several periods of market turbulencesince the mid-1990s, and during the clients’ emergence as majorengines of economic growth within the country.40
IFC is pursuing a
rapid growth agenda
while decentralizing.

has been aided by the breadth and depth of IFC’s
evaluation systems, which have developed such
that IFC is now starting to measure development
results across its portfolio of investment and ad-
visory operations. Building on that progress, as dis-
cussed in box 1.3, IFC could (in consultation with
IEG) advance its metrics to include the wider sec-
tor and country-level impacts of its projects and
portfolio, and thereby paint a more complete
picture of IFC’s contribution to development,
economic growth, and the improvement of peo-
ple’s lives.
4 2
I N D E P E N D E N T E VA L U AT I O N O F I F C ’ S D E V E L O P M E N T R E S U LT S 2 0 0 7

Meeting Stakeholder and Client Needs
Develop a Deeper, More Differentiated CountryApproachBackground: IFC has achieved high develop-
ment success rates through the pursuit of its fron-
tier strategy since 1998, catalyzing investments in
high-risk and low-income countries, as well as
through investments in strategic sectors. However,
IFC does not have a defined strategy in nonfron-
tier MICs, where most poor people live and where
IFC has most of its operations. These countries
face a spectrum of private sector development
challenges, including a lack of capacity in do-
mestic financial markets and poor infrastructure
to support production and trade (see figure 3.1).
IFC can play a valuable role in many MICs, even
though IFC’s additionality in these countries has
not always been clear.
While IFC builds up its in-country capacity as part
of the decentralization process, the institution has
an opportunity to define clearly, at the country
level, how it will bring additionality to both the fron-
tier and nonfrontier countries in which it operates.
Recommendation: As IFC decentralizes, it has
the opportunity to adopt more tailored country
strategies to complement its strong sector and re-
gional approach. This strategy might include, in
consultation with the Bank and country govern-
ments, the development and pursuit of a set of
country-specific private sector development in-
dicators (such as for the level of private, gross,
fixed capital formation; banking sector capacity;
and private provision of infrastructure).
Place an Emphasis on Rural DevelopmentBackground: Economic growth and its result-
ing market distribution of income matters in re-
ducing the numbers of poor people. IFC may
want to acknowledge these elements in its strate-
gic approach, in line with its mission statement.
Poverty continues to show a strong rural origin.
IFC has not, however, placed much emphasis on
rural development in the past. In this regard,
evaluation supports a focus on the agribusiness
sector, which has had beneficial impacts on farm-
ers and producers through linkage programs,
and all instruments to expand access to finance
in rural areas. (See box 3.1)
Recommendation: In its country strategies, IFC
may consider flagging opportunities to work on
the nexus of rural poverty and sustainable natu-
ral resources, on which poor people depend, and
to identify and develop high-impact agribusiness
and rural microfinance projects with widespread
demonstration effects, while simultaneously pro-
viding leadership in promoting socially and envi-
ronmentally sustainable practices.
4 3
Recommendations
4

Developing More Seamless World BankGroup Processes
Pursue New Incentives and Mechanisms toEnhance Cooperation with the World Bank inAreas of SynergyBackground: Cooperation with the World Bank
in areas of synergy, such as in developing financial
markets and infrastructure, has been more mod-
est than anticipated in CASs. While cooperation has
been strong in a few countries, it has fallen below
expectations in many others. CASs have not proven
to be a good basis for enhanced cooperation, and
few staff have felt motivated to cooperate across
institutional boundaries (see figures 3.2 and 3.3,
and table 3.2). Moreover, because of the lack of up-
front identification and tracking of investment
operations involving IFC–World Bank coopera-
tion, the ultimate development impacts of coop-
eration are also unclear.
Recommendation: To enhance cooperation
with the World Bank in areas of synergy, IFC could
(i) consider new incentives and mechanisms to
complement the CAS process (with the Bank); and
(ii) identify investments at approval that were fa-
cilitated by Bank policy or regulatory assistance,
and track them throughout the project cycle
(through DOTS or other means) in order to judge
their success.
Addressing Learning and Growth Needs
Manage the Trade-offs Inherent in theDecentralization Process to Achieve theHighest Possible Work QualityBackground: IFC’s strategy predicts greater de-
velopment impact through higher investment vol-
umes and stronger decentralization. IFC will need
to prevent any trade-offs among rapid growth,
organizational change, and project execution qual-
ity. During a previous period of significant orga-
nizational change, 1998–2001, IFC’s evaluated
supervision quality—a key driver of development
success quality and currently at an all-time high—
fell sharply (see figure 2.4). The institution has
achieved improved quality with decentralization
in South Asia (lower market and sponsor risk,
higher supervision rates), but with more modest
volume growth than in other regions. In addi-
tion, IFC may be able to learn from the experiences
of the Bank in its efforts to share knowledge across
regions and countries
Recommendation: IFC will need to monitor
the decentralization process closely to ensure
that its work quality remains robust, and support
this with a rigorous training program for new in-
vestment staff.
Financial and Measurement Issues
Ensure Sound Risk-Management Systems andDevelop Risk-Mitigation Products Background: Experience highlights how quickly
financial support for companies can be with-
drawn, precipitated by economic or political
events. IFC has proved itself a valuable counter-
cyclical investor. One prime example is its support
for its large industrial clients in Turkey through pe-
riods of market turbulence, and their emergence
as major engines of economic growth. Despite the
current exuberance in the developing world, IFC
should acknowledge in its strategy the threat of
a cessation or decline in capital flows to the de-
veloping world, its likely impact on clients, and the
mitigating actions that would be needed. Planning
now to improve risk-management systems, and
developing new risk-mitigating products to soften
the impact for clients, would strengthen IFC’s
response to an economic shock and enhance its
countercyclical role. (See figure 1.1 and box 3.3.)
Recommendation: IFC will need to make con-
tinued efforts to improve its risk-management
systems and to prepare for the next correction in
the international markets, including perhaps the
extended use and development of new risk-mit-
igation products.
Strengthen the Capacity for Evaluation and Its ApplicationBackground: In recent years, IFC’s strategic di-
rections have been increasingly informed by eval-
uation findings. Substantial progress has occurred
in the development of IFC’s monitoring and self-
evaluation systems, which in the last two years
have advanced to where IFC is now starting to
4 4
I N D E P E N D E N T E VA L U AT I O N O F I F C ’ S D E V E L O P M E N T R E S U LT S 2 0 0 7
measure its development results across its port-
folio of investment and advisory operations, as well
as carry out impact evaluations of its advisory
services operations (see box 1.3). IEG will have
an important role to play in validating IFC’s re-
ported performance under these systems and,
building on this progress, in helping IFC advance
the measurement of the cumulative effects of its
operations and their wider environmental and
social impacts. Improved metrics should help
IFC structure and manage its operations to further
optimize development effectiveness. Better met-
rics will allow for deeper performance evaluation
and further learning from IFC operations.
Recommendation: As it deepens its self-
evaluation and monitoring systems, IFC could,
with IEG’s assistance, advance its metrics to bet-
ter understand (and derive lessons about) the
wider sector and the country-level impacts of its
operations.
R E C O M M E N D AT I O N S
4 5


APPENDIXES
4 7


4 9
This appendix explains the methodological ap-
proach IEG uses to evaluate the performance of
IFC investment operations, as well as the moni-
toring and self-evaluation framework IFC recently
began piloting to assess the results of its advisory
operations. The appendix also provides a dis-
cussion of the explanatory power of different fac-
tors influencing IFC’s success rates, and describes
the differences between the monitoring and self-
evaluation frameworks used by IFC (for its private
sector investment operations) and those of the
World Bank (for its public sector loan operations).
Methodology for Evaluating IFCInvestment OperationsSince 1996, when the present evaluation system
was introduced, IEG has rated the development
and investment success of IFC investment oper-
ations once they reached early operating maturity,
generally when operations have recorded at least
18 months of operating revenue, reflected in at
least two years of audited financial statements
(ex-post evaluation). More recently, since 2004,
IEG has assessed the prospects for the future de-
velopment and investment performance of IFC
operations based on the high-risk intensity of
IFC-supported projects at approval. IEG is now
supplementing the latter (ex-ante) evaluation
with a review of business climate trends affecting
IFC operations in the years after approval, for
operations reaching operating maturity (and to be
evaluated) in 2007 and 2008.
Evaluation of Achieved Success RatesIEG’s evaluations of achieved success rates are
based on project-level results derived from a sys-
tem introduced in IFC in 1996, the Expanded Proj-
ect Supervision Report (XPSR) system. The XPSR
process first involves a self-evaluation of a project
by an IFC investment department using corporate
guidelines. The ratings assigned by investment
departments are then independently verified (or
rerated) by IEG in terms of bottom-line outcome
ratings and their respective subcomponents.
Investments are selected for evaluation on a ran-
dom sampling basis. Between 1996 and 2006, 627
projects were evaluated under the XPSR system,
representing 51 percent coverage of all qualifying
investment operations approved over the last
decade. Based on a 95 percent confidence inter-
val, the true development success rate of the
population of investment operations was between
57 percent and 62 percent (table A1).
Further details of the evaluation framework for IFC
investment operations are available on IEG-IFC’s
website.
Evaluation of Future Success RatesIEG’s evaluation of future success rates involves
analysis of key internal and external drivers of
past IFC success rates: (i) Project high-risk inten-
sity at approval (internal driver); and (ii) the qual-
ity of the business climates that IFC operations are
exposed to after approval but before operating ma-
turity (external driver).
To examine project high-risk intensity at approval,
IEG assesses whether eight high-risk factors were
present or absent at the time of project approval.
These high-risk factors are:
• Sponsor quality—the sponsor’s experience,
financial capacity, commitment to the project,
and business reputation;
APPENDIX A: EVALUATION METHODOLOGY

Table A1. Sample of Evaluated Operations, 1996–2006 (in percents)
• Product market—market distortions or having
no clear, inherent, competitive advantage and
risk;
• Debt service burden—the burden of servicing
a debt in the year when principal repayments
start;
• Project type—greenfield projects (building on
previously undeveloped land) generally involve
higher risks than expansions;
• Sector risk—sectors exposed to high price or
supply volatility (such as agribusiness), or
weather and safety conditions (such as tourism)
are higher risk, as demonstrated in IFC’s in-
vestment experience;
• Country business climate at project approval—
IEG uses the Wall Street Journal/Heritage Foun-
dation’s Index of Economic Freedom—Overall
Synthesis Ratings as the primary indicator of a
country’s business climate quality;
• IFC review intensity—projects that do not go
to the Credit Department for review or to the
Corporate Investment Committee are consid-
ered to be higher risk; and
• Nonrepeat project—IFC’s first-time clients are
generally higher risk.
IEG began its profiling of high-risk factors in 2004,
in response to a 2003 request by the Board of Di-
rectors for IEG to assess whether IFC’s structural
and process improvements during 1998– 2001—
such as the establishment of a Credit Department
and Portfolio Units—had resulted in higher IFC
success rates in its operations. At the time, IEG pro-
filed 259 “mature” operations (operations that
had been self-evaluated and the ratings of which
IEG had validated) and 259 “new” operations (op-
erations approved since the completion of vari-
ous IFC quality steps in 2003 and 2004). This
profiling has evolved to the point where IEG has
now risk-profiled 388 “mature” operations, which
were evaluated in the last six years (approved
during 1995–2000) as well as a random sample of
“new” operations (290 in number) approved be-
tween 2002 and 2005.
For each operation, IEG profiles the operation’s
high-risk intensity according to appraisal infor-
mation available at project approval. Because of the
diverse nature of these projects, IEG does not as-
sign weights to these risk factors. The analysis fo-
cuses on a project’s intrinsic high-risk intensity at
approval, which, as the analysis in the main report
shows, strongly influences their development im-
pact quality, and accordingly reflects some, but
not all, elements of IFC quality-at-entry (such as the
intensity of IFC credit review at appraisal but not
the quality of transaction structuring).
To assess business climate trends after approval
(but before operating maturity), IEG reviews the
change in the level of country credit risk, as mea-
sured by the Institutional Investor Country Credit
Risk ratings, that IFC operations are exposed to,
following their approval and up until the most re-
cent date for which ratings are available. Because
of inherent uncertainty in global and emerging
market conditions, which can have material im-
pacts on country credit risk ratings, IEG has lim-
I N D E P E N D E N T E VA L U AT I O N O F I F C ’ S D E V E L O P M E N T R E S U LT S 2 0 0 7
5 0
Project development rating 59 59 1 3 57 62
IFC investment return 56 56 1 3 53 59
IFC’s work quality 66 66 1 3 64 69
Source: IEG.
Indicator
Success rate inthe sampled
evaluatedoperations,
Estimate ofsuccess rate inthe populationof operations,
Standarderror
Samplingerror
95% confidence interval
Lowerbound
Upperbound

ited its review of business climate trends to two
years ahead of the current evaluation sample; in
this case, to operations that will be evaluated in
2007 and 2008 (and which were approved in 2002
and 2003).
The Institutional Investor ratings were first com-
piled in 1979, and are now published in March and
September of every year, for an increasing num-
ber of countries (174 countries in 2006). The rat-
ings are numerical, ranging from 0 to 100, with
100 corresponding to the lowest chance of sov-
ereign default on its foreign currency debts. The
Institutional Investor relies on evaluations, pro-
vided by economists and international banks,
of the creditworthiness of the countries to be
rated, with respondents using their own criteria.
Responses are aggregated by the Institutional
Investor, with greater weights being given to re-
sponses from institutions with higher worldwide
exposure.
Methodology for Evaluating IFC AdvisoryServices OperationsIn 2006, IFC started to introduce a systematic ap-
proach to evaluating its advisory services opera-
tions. To date, IFC has completed two evaluation
pilots, involving 300 advisory operations. IFC is
expected to report its ratings for these operations
in its annual report in October 2007, with IEG pre-
senting its independent assessment of these ratings
in the Report on Operations Evaluation, 2007.
The evaluation framework covers the following
areas of performance of IFC’s advisory services
operations, with an indication of what equates to
satisfactory performance in each area:
• Strategic relevance. Assistance addressed major
priority issues to a large extent; was appropriate
for conditions at initiation and completion; and
achieved a majority of intended cost recovery.
• Efficiency. Assistance had a positive cost-
benefit ratio; resources used to provide assis-
tance were expended economically; and re-
sources used were reasonable in relation to
alternatives.
• Output achievement. Most of the major outputs
were achieved.
• Outcome achievement. Clients were satisfied
with the assistance; most of the major out-
comes were achieved; areas for improvement
in environmental and social conditions were
communicated to the client, with some im-
provements made or ongoing.
• Impact achievement. Most intended impacts
on the direct recipient(s) were achieved; some
impact beyond the direct recipient(s).
In addition to the above five performance areas,
IEG will also rate IFC’s work quality and the work
quality of consultants or others involved (client
and/or stakeholders) in the operation.
Explanatory Power of DifferentInfluences on IFC DevelopmentPeformanceThe factors that drive the development impact
quality of IFC investment operations, as described
in chapter 2, broadly explain about two-thirds of
IFC’s results. When two or more of the following
variables are present—country risk migration,
from high risk to non-high risk, between approval
and evaluation; fewer than four high-risk factors;
high IFC work quality; and an investment in a
strategic sector (infrastructure, financial inter-
ests, or health and education)—the development
rating for the operation is positive 68 percent of
the time.
A project-level econometric investigation of the de-
terminants of IFC success rates, based on data
from 388 operations evaluated during the 2000–05
period, reveals that IFC work quality is the
strongest determinant of the development and in-
vestment performance of IFC-supported projects.
Individual independent (or explanatory) variables
with high significance were: positive or negative
changes in country credit risk (measured by the
Institutional Investor); project type (greenfield
or expansion); sector risk; sponsor quality; prod-
uct market risk; nonrepeat risk; whether the in-
vestment was in a strategic sector; and each of the
component elements of IFC work quality (ap-
praisal quality; supervision quality; IFC role and
contribution). All variables, with the exception of
changes in country credit risk (measured on a
continuous scale), were rated on a binary scale,
A P P E N D I X A : E VA L U AT I O N M E T H O D O L O G Y
5 1

with 1 denoting high risk or present (in the case
of strategic sector choice) and 0 as non-high risk,
or absent (in the case of strategic sector choice).
The analysis was carried out using Probit analysis,
with significance determined on the basis of “z” val-
ues. We also checked for multicollinearity among
the explanatory variables and found none.
Differences between IFC and World BankEvaluation FrameworksIFC and the World Bank share the same mission
of poverty reduction, but follow different busi-
ness models in pursuit of this mission. As the re-
port discusses, IFC generally works with the pri-
vate sector (and in some cases with governments,
for instance, in the area of business climate diag-
nostics and development), while the Bank provides
its products and services to governments. Ac-
cordingly, the supervision, monitoring, and eval-
uation systems that each institution uses are
different. As the chart above illustrates, IFC’s proj-
ect cycle ends with full repayment (of a loan) or
equity divestment, while the Bank’s cycle ends at
or around project implementation (figure A1).
I N D E P E N D E N T E VA L U AT I O N O F I F C ’ S D E V E L O P M E N T R E S U LT S 2 0 0 7
5 2
Project Cycle
ApprovalCommitment
Project Supervision Report
Disbursement
Developmentratings
Implementation CompletionReport (ICR)
IEG-WBreview
Developmentratings
Early OperatingMaturity
Expanded ProjectSupervision Report (XPSR)
IEG-IFCreview
Project PerformanceAssessment Report(PPAR)(IEG-WB)
Supervision
Full disbursementLoanrepayment
Closing
Evaluation
Bank:
Project Cycle
ApprovalCommitment
Credit risk rating (Credit Review Department)Project Supervision Report
Disbursement
DOTS* (from 2006)
Loanrepayment/Equity exit
Evaluation
IFC:
Figure A1. World Bank and IFC Evaluate Operations at Different Stages
Source: IEG.
*Development Outcome Tracking System
� IFC and the World Bank share the same mission of poverty reduction but follow different business models in pursuit of this mission. Their project cycles accordingly dif-fer, with IFC’s project cycle ending at full repayment (in the case of a loan) or equity divestment, and with the Bank’s cycle ending at or around project implementation.

5 3
The following tables and figures present further
disaggregation of the development, investment,
and work quality ratings of IFC-supported projects.
In turn, they show:
• Rating trends (figure B1) and characteristics
(table B1) of IFC-supported projects, by sub-
indicator, between 1996 and 2006;
• Characteristics of IFC-supported projects, by
subindicator, in the last three years, 2004–06
(table B2);
• Trends in development ratings of IFC-supported
projects, by region, between 1996 and 2006
(figure B2);
• Development rating trends of IFC-supported
projects, by industry department, between
1996 and 2006 (figure B3); and
• Combined development and investment suc-
cess rates and characteristics of IFC-supported
projects, between 1996 and 2006 (figure B4).
APPENDIX B: PERFORMANCE OF IFC-SUPPORTED PROJECTS AND THE PROFITABILITY OF IFC INVESTMENT OPERATIONS:FURTHER ANALYSIS
Perc
enta
ge o
f pro
ject
sw
ith “
high
” ra
tings
0102030405060708090
100
1996 1997
Year of evaluation
Project business success, 1996–2006
1998 1999 2000 2001 2002 2003 2004 2005 2006
Figure B1. Rating Trends of IFC-Supported Projects, by Development Outcome,Investment Return, and Work Quality, 1996–2006
(Figure continues on next page)
Source: IEG.

I N D E P E N D E N T E VA L U AT I O N O F I F C ’ S D E V E L O P M E N T R E S U LT S 2 0 0 7
5 4
Perc
enta
ge o
f pro
ject
sw
ith “
high
” ra
tings
0102030405060708090
100
1996 1997
Year of evaluation
Economic sustainability, 1996–2006
1998 1999 2000 2001 2002 2003 2004 2005 2006
Perc
enta
ge o
f pro
ject
sw
ith “
high
” ra
tings
0102030405060708090
100
1996 1997
Year of evaluation
Environmental and social effects, 1996–2006
1998 1999 2000 2001 2002 2003 2004 2005 2006
Perc
enta
ge o
f pro
ject
sw
ith “
high
” ra
tings
0102030405060708090
100
1996 1997
Year of evaluation
Private sector development impacts, 1996–2006
1998 1999 2000 2001 2002 2003 2004 2005 2006
Figure B1. Rating Trends of IFC-Supported Projects, by Development Outcome, Investment Return, and Work Quality, 1996–2006 (continued)
Source: IEG.

A P P E N D I X B : P E R F O R M A N C E O F I F C - S U P P O R T E D P R O J E C T S
5 5
Inve
stm
ent s
ucce
ss ra
te (p
erce
nt)
0102030405060708090
100
1996 1997
Year of evaluation
IFC loan success rates, 1996–2006
1998 1999 2000 2001 2002 2003 2004 2005 2006
Inve
stm
ent s
ucce
ss ra
te (p
erce
nt)
0 10 20 30 40 50 60 70 80 90
100
1996 1997
Year of evaluation
IFC equity success rates, 1996–2006
1998 1999 2000 2001 2002 2003 2004 2005 2006
Figure B1. Rating Trends of IFC-Supported Projects, by Development Outcome,Investment Return, and Work Quality, 1996–2006 (continued)
(Figure continues on next page)Source: IEG.
Perc
enta
ge o
f pro
ject
s w
ith “
high
” ra
tings
0 10 20 30 40 50 60 70 80 90
100
1996 1997
Year of evaluation
Appraisal work quality, 1991–2006
1998 1999 2000 2001 2002 2003 2004 2005 2006

I N D E P E N D E N T E VA L U AT I O N O F I F C ’ S D E V E L O P M E N T R E S U LT S 2 0 0 7
5 6
Perc
enta
ge o
f pro
ject
sw
ith “
high
” ra
tings
0102030405060708090
100
1996 1997
Year of evaluation
Supervision work quality, 1996–2006
1998 1999 2000 2001 2002 2003 2004 2005 2006
Perc
enta
ge o
f pro
ject
sw
ith “
high
” ra
tings
0102030405060708090
100
1996 1997
Year of evaluation
IFC role and contribution, 1996–2006
1998 1999 2000 2001 2002 2003 2004 2005 2006
Figure B1. Rating Trends of IFC-Supported Projects, by Development Outcome,Investment Return, and Work Quality, 1996–2006 (continued)
Source: IEG.

IFC WORK QUALITY 8 26 54 1234 66
(by commitment volume) 6 20 58 1526 74
Screening, appraisal, structuring 13 32 43 1245 55
Supervision and administration 5 27 52 1632 68
Role and contribution 7 12 54 2719 81
DEVELOPMENT RATING 7 16 18 21 28 1041 59
(by commitment volume)6 13 16 24 31 10
35 65
Project business success 35 19 22 2454 46
Economic sustainability 21 18 40 2238 62
Environmental effects 6 26 56 1233 67
Private sector development 8 20 45 2628 72
IFC INVESTMENT 33 11 42 14RETURN 44 56
(by commitment volume) 25 13 47 1538 62
Loan 17 9 67 726 74
Equity 57 12 10 2169 31
A P P E N D I X B : P E R F O R M A N C E O F I F C - S U P P O R T E D P R O J E C T S
5 7
Table B1. Characteristics of High and Low Development, Investment Return, and Work QualityRatings, by Subindicator, 1996–2006 (in percents)
Development ratings,1996–2006
IFC investment returnratings, 1996–2006
UnsatisfactoryPartly
unsatisfactory Satisfactory Excellent
IFC work quality ratings,1996–2006
UnsatisfactoryPartly
unsatisfactory Satisfactory Excellent
LOW HIGH
High
lyun
succ
essf
ul
Unsu
cces
sful
Mos
tlyun
succ
essf
ul
Mos
tlysu
cces
sful
High
lySu
cces
sful
Succ
essf
ul
UnsatisfactoryPartly
unsatisfactory Satisfactory Excellent
Source: IEG. Note: (i) Following a similar approach since 1996, IEG uses a binary interpretation of these evaluation results, which describes operation ratings as either “high” or “low.” The central dividingline in the above tables separates the two categories.(ii) By-volume figures are the percentages of the total committed IFC investment amounts in each outcome-rating group.(iii) The success rates above are the percentages of all assigned ratings.

DEVELOPMENT RATING 8 17 19 18 31 744 56
(by commitment volume)4 14 16 22 38 5
35 65
Project business success 34 16 28 2250 50
Economic sustainability 19 19 42 2038 62
Environmental effects 8 22 63 829 71
Private sector development 6 22 47 2528 72
IFC WORK QUALITY 2 22 63 1323 77
(by commitment volume) 4 12 66 1716 83
Screening, appraisal, structuring 6 31 51 1237 63
Supervision and administration 0 18 62 2018 82
Role and contribution 3 15 52 3018 82
I N D E P E N D E N T E VA L U AT I O N O F I F C ’ S D E V E L O P M E N T R E S U LT S 2 0 0 7
5 8
IFC INVESTMENT 30 9 44 18RETURN 39 61
(by commitment volume) 18 10 54 1828 72
Loan 16 8 67 924 76
Equity 48 13 10 3060 40
Table B2. Characteristics of High and Low Development, Investment Return, and Work QualityRatings, by Subindicator, 2004–06 (in percents)
Development ratings,1996–2006
IFC investment returnratings, 1996–2006
UnsatisfactoryPartly
unsatisfactory Satisfactory Excellent
IFC work quality ratings,1996–2006
UnsatisfactoryPartly
unsatisfactory Satisfactory Excellent
LOW HIGH
High
lyun
succ
essf
ul
Unsu
cces
sful
Mos
tlyun
succ
essf
ul
Mos
tlysu
cces
sful
High
lySu
cces
sful
Succ
essf
ul
UnsatisfactoryPartly
unsatisfactory Satisfactory Excellent
Source: IEG. Note: (i) Following a similar approach since 1996, IEG uses a binary interpretation of these evaluation results, which describes operation ratings as either “high” or “low.” The central dividingline in the above tables separates the two categories.(ii) By-volume figures are the percentages of the total committed IFC investment amounts in each outcome-rating group.(iii) The success rates above are the percentages of all assigned ratings.

A P P E N D I X B : P E R F O R M A N C E O F I F C - S U P P O R T E D P R O J E C T S
5 9
Africa Asia Europe andCentral Asia
Latin Americaand Caribbean
Middle East andNorth Africa
Region
Perc
enta
ge o
f pro
ject
s w
ith“h
igh”
ratin
gs
0102030405060708090
49% 50%
68% 66%
53%
100
Figure B2. Development Ratings of IFC-Supported Projects, by Region, 1996–2006
Source: IEG.
All sectors
Funds
Health and education
Food and agribusiness
Finance
Infrastructure
Extractive sectors
General manufacturingand services
0 20 40
Percentage of projects with “high” developing rating
Indu
stry
sec
tor
60 80 100
1996–20002001–06
Figure B3. Development Rating Trends of IFC-Supported Projects, by IndustryDepartment, 1996–2006
Source: IEG.

I N D E P E N D E N T E VA L U AT I O N O F I F C ’ S D E V E L O P M E N T R E S U LT S 2 0 0 7
6 0
IFC investment return
Deve
lopm
ent r
atin
g
HIGH
HIGH
46%13%
10%31%
LOW
High developmentrating
Low IFC return
Low developmentrating
Low IFC return
High developmentrating
High IFC return
Low developmentrating
High IFC returnLOW
1
34
2
Number of operations: 84Commitments: $1,300m (12%)Project business success: 53%Environmental and social effects success rate: 76%>=4 high-risk factors: 77%Instrument: –Loan 13% –Equity 50% –Loan and Equity 37%Equity success rate (26 invs.): 4%Equity aggregate real internal rate of return 1.7%Work quality: –High 87% –Low 13%Country risk: –Improved 10% –Unchanged 77% –Deteriorated 13%% in strategic sectors (by #): 57%
Number of operations: 192Commitments: $2,761m (26%)Project business success: 1%Environmental and social effects success rate: 44%>=4 high-risk factors: 73%Instrument: –Loan 35% –Equity 30% –Loan and Equity 35%Equity success rate (47 invs.): 0%Equity aggregate real internal rate of return –10%Work quality: –High 24% –Low 76%Country risk: –Improved 7% –Unchanged 78% –Deteriorated 15%% in strategic sectors (by #): 29%
Number of operations: 288Commitments: $5,588m (53%)Project business success: 82%Environmental and social effects success rate: 78%>=4 high-risk factors: 44%Instrument: –Loan 62% –Equity 14% –Loan and Equity 25%Equity success rate (110 invs.): 83%Equity aggregate real internal rate of return 19%Work quality: –High 91% –Low 9%Country risk: –Improved 38% –Unchanged 58% –Deteriorated 5%% in strategic sectors (by #): 51%
Number of operations: 63Commitments: $967m (9%)Project business success: 6%Environmental and social effects success rate: 48%>=4 high-risk factors: 24%Instrument: –Loan 88% –Equity 6% –Loan and Equity 6%Equity success rate (2 invs.): 100%Equity aggregate real internal rate of return 1.9%Work quality: –High 31% –Low 69%Country risk: –Improved 0% –Unchanged 88% –Deteriorated 12%% in strategic sectors (by #): 50%
Figure B4. Combined Development and Investment Ratings and Characteristics of IFC Operations, 1996–2006
Source: IEG.
� A comparison of the characteristics of investment operations in each of the four rat-ings groups reveals the following:
• Operations with high-high ratings (square 1) featured high work quality in 91 per-cent of cases, compared with 24 percent in operations with low-low ratings (square 4). High development ratings (squares 1 and 2) featured high work qual-ity in 89 percent of cases.
• Operations with high development ratings (squares 1 and 2) featured a very highproportion (78 percent) of environmentally compliant projects, as compared withoperations with low development ratings (squares 3 and 4).
• There is significant variation in IFC’s choice of investment instrument across thefour ratings combinations:
� Square 1: High-high ratings have tended to feature loan and/or equity invest-ments in almost the same proportions as exist in the overall portfolio, at a ratioof 2:1, loan to equity, respectively. There is, therefore, nothing unusual abouthigh-high ratings in terms of IFC instrument mix.
� Square 2: In 87 percent of evaluated operations that achieved high develop-ment ratings but low investment returns, IFC had invested equity. In mostcases, investments in this square were made in businesses that had better-than-average project returns, have continued trading, and have therefore succeededin generating at least minimally satisfactory project development impacts.
IFC’s equity returns have nevertheless been impaired by factors such as illiquidity,weak exit mechanisms, and/or currency crises that have eroded U.S. dollar val-uations. While few of these investments have therefore yielded losses for IFC,their returns have been less than satisfactory.
� Square 3: 94 percent of operations categorized as having achieved high in-vestment ratings but low development ratings featured straight loan investments.In these cases, the underlying projects have not, themselves, been sufficientlyprofitable (their project business success rate was only 6 percent) and, conse-quently, have yielded little in the way of economic or social benefits, and/ormay have featured material environmental performance shortfalls. Despitethis, IFC has received repayment of its loan by virtue of its ranking claim on com-pany cashflow and the collateral security package. Also, the project’s sponsormay have decided, for strategic reasons, to advance funds to the enterprise fromits own resources, thus keeping the business alive and repaying its lenders.
� Square 4: Low-low ratings were substantially overweighted in equity invest-ments compared with high-high ratings, and the success rate and aggregatereturns of these operations were well below average. These returns did not com-pensate for the projects’ materially higher-than-average risk intensity—coun-try, sector, sponsor, and market risk were highest for projects in this square. Theseoperations also featured the lowest level of satisfactory or above (that is,“high”) IFC work quality (24 percent), including IFC’s additionality through itsrole and contribution.

A P P E N D I X B : P E R F O R M A N C E O F I F C - S U P P O R T E D P R O J E C T S
6 1
IFC Profitability from InvestmentOperations, 1996–2006To supplement IEG’s evaluations of achieved suc-
cess rates (ex-post evaluation) and expected suc-
cess rates (ex-ante evaluation), IEG also reviews
the profitability of IFC’s whole portfolio of in-
vestment operations. IEG carries out this analy-
sis to discern patterns that may have an effect on
IFC’s development performance, given the close
connection between investment and develop-
ment success. Figure B5 sets out the trends in the
profitability of IFC investment operations since
1996, by loan and equity instrument, and table B3
shows the profitability of IFC investment opera-
tions for the whole of period 1996–2006.
130120110100
9080706050403020
Perc
ent
100
–10FY96 FY97 FY98 FY99
19.3 19.6 18.6 17.9 18.3 19.019.819.019.019.719.6
FY00 FY01
Average equity at cost as a percentage of average loan and equity outstanding:
FY02 FY03 FY04 FY05 FY96
Equity net profit (with unrealized capital gains) as a percentage of averageequity outstanding at cost
Equity net profit (without unrealized capital gains) as a percentage of averageequity outstanding at cost
Loan net profit as a percentage of average loan outstanding
Figure B5. Net Profitability of IFC Investment Operations, FY96–FY06
Source: Profitability analysis is derived from IFC annual financial reports and internal IFC databases.
Note: Excludes income from IFC Treasury Department operations. The average outstanding balance for a fiscal year is the average of the out-standing amount at the beginning and the end of the fiscal year.
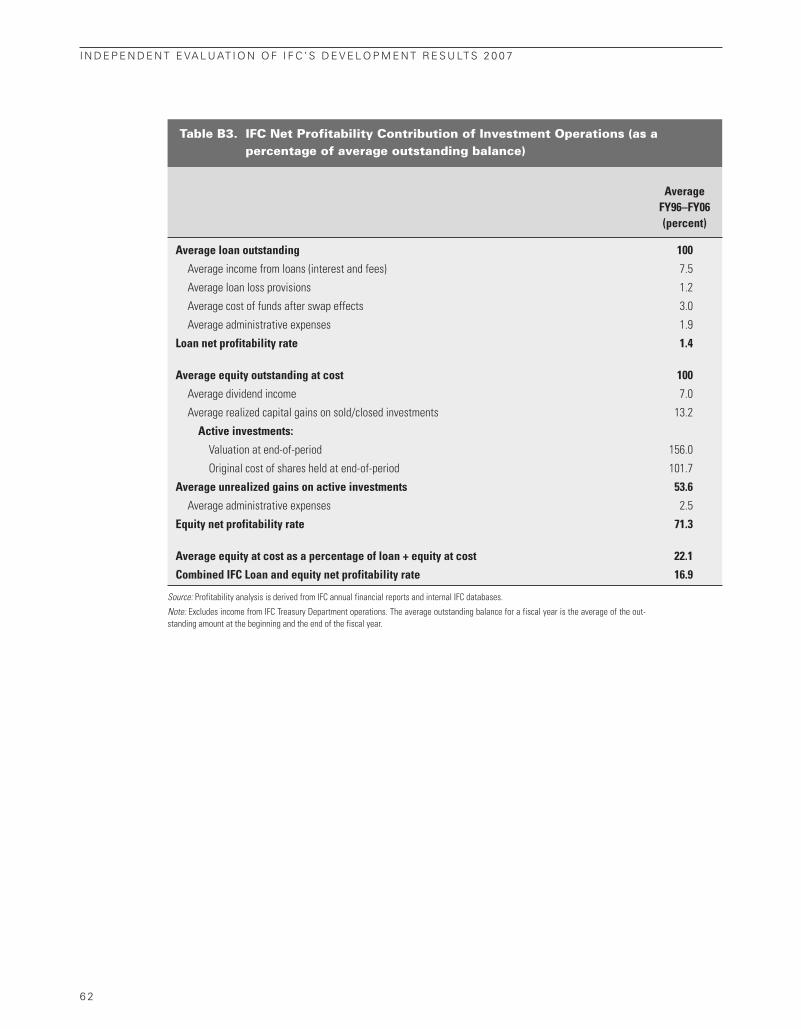
Average loan outstanding 100
Average income from loans (interest and fees) 7.5
Average loan loss provisions 1.2
Average cost of funds after swap effects 3.0
Average administrative expenses 1.9
Loan net profitability rate 1.4
Average equity outstanding at cost 100
Average dividend income 7.0
Average realized capital gains on sold/closed investments 13.2
Active investments:
Valuation at end-of-period 156.0
Original cost of shares held at end-of-period 101.7
Average unrealized gains on active investments 53.6
Average administrative expenses 2.5
Equity net profitability rate 71.3
Average equity at cost as a percentage of loan + equity at cost 22.1
Combined IFC Loan and equity net profitability rate 16.9
I N D E P E N D E N T E VA L U AT I O N O F I F C ’ S D E V E L O P M E N T R E S U LT S 2 0 0 7
6 2
Table B3. IFC Net Profitability Contribution of Investment Operations (as a percentage of average outstanding balance)
AverageFY96–FY06(percent)
Source: Profitability analysis is derived from IFC annual financial reports and internal IFC databases.
Note: Excludes income from IFC Treasury Department operations. The average outstanding balance for a fiscal year is the average of the out-standing amount at the beginning and the end of the fiscal year.

6 3
INVESTMENT OPERATIONS
Company The entity implementing the project and, generally, IFC’s in-
vestment counterparty. For financial markets operations, it
refers to the financial intermediary as distinct from its portfolio
of IFC-financed sub-project companies.
Investment IFC’s financing instrument(s) in the evaluated operation, such
as a loan, guarantee, equity, and underwriting commitment.
Operation IFC’s objectives, activities, and results in making and admin-
istering its investment.
Project The company objectives, capital investments, funding pro-
gram, and related business activities being partially financed
by IFC’s investment selected for evaluation.
For example, for one operation, IFC provided $55 million for the company’s $100 million cement
manufacturing expansion project in the form of a $20 million A-loan, a $30 million B-loan from com-
mercial banks, and a $5 million equity investment.
Financial markets All projects where the company is a financial intermediary or
financial services company, including agency lines.
Nonfinancial markets All other projects, except collective investment vehicles
(investment funds); sometimes referred to as “real sector”
projects.
Development rating The development result(s) of an IFC-supported project, as-
sessed in four respects: project business success; economic sus-
tainability; environmental and social effects; and wider private
sector development impacts.
Project business success For real sector projects, such success is measured by the proj-
ect’s financial rate of return (FRR), as compared with the com-
pany’s cost of capital. For financial sector projects, success is
measured by the positive contributions of the associated sub-
portfolios or asset growth to the intermediary’s profitability,
financial condition, and business objectives.
APPENDIX C: DEFINITIONS OF EVALUATION TERMS

Economic sustainability Measured, where possible, by the project’s economic rate of
return (ERR), as compared with a minimum benchmark of 10
percent. This indicator takes into account net gains or losses
by nonfinanciers, nonquantifiable impacts, and contributions
to widely held development objectives.
Environmental and social effects The degree to which a project meets IFC’s environmental, so-
cial, health and safety requirements at approval; and policies,
guidelines, and standards that would apply if the project were
appraised today.
Wider PSD impacts A project’s private sector development impact beyond the
project company, particularly its demonstration effect in cre-
ating a sustainable enterprise capable of attracting finance,
increasing competition, and establishing linkages.
Development success Based on performance in these four dimensions, the IFC-
supported project was rated overall as having a high-quality de-
velopment result.
Development effectiveness The aggregation of project development results at the coun-
try, sector, theme, regional, and global levels.
IFC investment return rating An assessment of the gross profit contribution quality of an IFC
loan and/or equity investment (without taking into account
transaction costs or the cost of IFC equity capital).
Loans are rated satisfactory provided they are expected to be
repaid in full, with interest and fees as scheduled (or are pre-
paid or rescheduled without loss).
Equities are rated satisfactory if they yield an appropriate pre-
mium on the return on a loan to the same company.
NON-INVESTMENT OPERATIONS: Advisory services (could include technical assistance
components)
Outcomes Implementation of recommendations or advice.
Impacts Changes that occurred following the implementation of a
recommendation.
For example, an operation recommends that a country amend its leasing law to incorporate best prac-
tice in the region. The outcome is the country amends the leasing law in line with the recommen-
dation. The impact is the leasing industry becomes attractive to potential sponsors, leading to the
establishment of new companies after the amendment of the leasing law.
I N D E P E N D E N T E VA L U AT I O N O F I F C ’ S D E V E L O P M E N T R E S U LT S 2 0 0 7
6 4

6 5
Executive Summary1. IEG changed its name from the Operations Eval-
uation Group in 2006.
2. As determined by having an Institutional Coun-
try Credit Risk rating of less than 30.
3. Generally, when operations have recorded at
least 18 months of operating revenue.
4. The two institutions accordingly employ differ-
ent evaluation frameworks, including in terms of focus,
timing of evaluation, and benchmarks. For example, the
World Bank evaluates projects immediately after dis-
bursement while IFC does so a few years after dis-
bursement (at early operating maturity). The Bank
assesses results based on achievement of objectives,
while IFC considers financial and economic results
based on market benchmarks, along with environ-
mental and social impacts, and private sector impacts
beyond the project company.
5. IFC 2006b.
6. Middle-income countries that are non-high risk,
meaning they have an Institutional Country Credit Risk
rating greater than 30.
7. Cooperation is defined broadly to include any in-
teraction among World Bank Group institutions aimed
at improving the development impact of World Bank
Group instruments by maximizing synergies and re-
ducing duplication and inconsistencies. It includes
both coordination (efforts to integrate the strategies
of the two institutions to accomplish common objec-
tives, such as through division of labor, but which does
not typically involve interaction on specific interven-
tions) and collaboration (defined as interaction be-
tween the two institutions on specific interventions).
Résumé analytique1. Le Groupe d’évaluation des opérations (OED) est
devenu le Groupe indépendant d’évaluation en 2006.
2. Indiqué par l’attribution par l’institution d’une
note de risque-pays inférieure à 30.
3. Généralement, lorsque les opérations ont gé-
néré des recettes d’exploitation pendant au moins 18
mois.
4. Les deux institutions emploient de ce fait des
cadres d’évaluation différents, notamment en ce qui
concerne le ciblage, le calendrier d’évaluation et les va-
leurs de référence. Par exemple, la Banque mondiale
évalue les projets immédiatement après le décaissement
du financement tandis que l’IFC le fait plusieurs années
après le décaissement (une fois que le projet a atteint
son rythme de croisière). La Banque évalue les résul-
tats sur la base de la réalisation des objectifs, tandis que
l’IFC examine les résultats financiers et économiques
sur la base des références du marché, de même que les
impacts environnementaux et sociaux et les impacts sur
le secteur privé qui sortent du cadre de l’entreprise du
projet.
5. IFC 2006b
6. Les pays à revenu intermédiaire qui ne posent pas
de risques élevés, c’est-à-dire ceux qui ont une note de
risque-pays supérieure à 30.
7. La coopération est définie au sens large comme
toute interaction entre les institutions du Groupe de
la Banque mondiale visant à améliorer l’impact sur le
développement des instruments du Groupe de la
Banque mondiale en optimisant les synergies et en ré-
duisant les chevauchements et les incohérences. Elle
recouvre aussi bien la coordination (efforts visant à in-
tégrer les stratégies des deux institutions en vue d’at-
teindre des objectifs communs tels que la division du
travail, mais qui n’implique pas le plus souvent d’in-
teractions dans le cadre d’interventions particulières)
que la collaboration (définie comme les interactions
entre les deux institutions dans le cadre d’interventions
particulières).
ENDNOTES

Resumen1. El GEI cambió su nombre anterior, Departa-
mento de Evaluación de Operaciones, en 2006.
2. Según determina su calificación Institutional
Country Credit Risk de menos de 30.
3. Por lo general, cuando las operaciones registra-
ron al menos 18 meses de ingresos operativos.
4. Las dos instituciones utilizan distintos marcos de
evaluación, incluso en términos de foco, momento de
evaluación y puntos de referencia. Por ejemplo, el
Banco Mundial evalúa los proyectos inmediatamente
luego de los desembolsos, mientras que la IFC lo hace
unos años después de los desembolsos (al inicio de la
madurez operacional). El Banco analiza los resultados
basándose en el cumplimiento de los objetivos, mien-
tras que la IFC considera los resultados financieros y
económicos sobre la base de los puntos de referencia
del mercado, junto con los impactos sociales y am-
bientales y los impactos del sector privado más allá de
la empresa del proyecto.
5. IFC 2006b.
6. Los países de ingreso mediano que no tienen altos
riesgos, lo que significa que tienen una calificación
Institutional Country Credit Risk superior a 30.
7. Definida en términos amplios, la cooperación in-
cluye cualquier interacción entre las instituciones del
Grupo del Banco Mundial dirigida a mejorar el im-
pacto en términos de desarrollo de los instrumentos
del Banco Mundial, maximizando las sinergias y redu-
ciendo la duplicación y las inconsistencias. Abarca tanto
la coordinación (los esfuerzos para integrar las estra-
tegias de las dos instituciones a fin de alcanzar objeti-
vos comunes, por ejemplo a través de la división del
trabajo, pero que generalmente no implican la inte-
racción en las intervenciones específicas) como la co-
laboración (que se define como la interacción entre
las dos instituciones en las intervenciones específicas).
Chapter 11. Before 1996, IEG evaluated IFC’s project per-
formance using Investment Appraisal Reports. In 1996,
a systematic system for evaluating IFC’s development
and investment results was introduced, the Expanded
Project Supervision Report (XPSR) System.
2. Prior to 2006, a number of program-level evalu-
ations were carried out, including an evaluation of four
small and medium enterprise facilities in 2004, and an
evaluation of foreign investment advisory services in
1998.
3. World Bank forthcoming.
4. This figure includes International Bank for Re-
construction and Development gross disbursements of
about $232 billion and International Development As-
sociation gross disbursements of about $110 billion, but
does not include the cost of trust funds. Except for a
spike between 1997 and 1999, International Bank for
Reconstruction and Development lending volumes fell
between 1991 and 2006 (from $16 billion to $14 billion
per year), while International Development Association
volumes increased over the same period, from around
$6 billion to $9 billion per year.
5. See IEG-IFC 2006b.
6. Determined using the Atlas Method, as of
2004.
7. Total project funding, including donor contribu-
tions.
8. Unless specifically noted, IEG means IEG-IFC in
this document.
9. While the rating seeks to examine what would
have happened without the project, there are limita-
tions to this judgment, in the sense that there is im-
perfect information about other sources of financing
available to clients, and about the opportunity cost, in
development terms, to IFC of investing in one opera-
tion and not another.
10. The fixed loan interest rate is either the actual
interest rate of a fixed-rate loan, the fixed-rate equiva-
lent of an actual variable loan, or the notional interest
rate IFC would have charged to a similar company in
the same country.
11. For example, the World Bank evaluates projects
right after disbursement while IFC does so a few years
after disbursement (at early operating maturity). The
Bank assesses results based on achievement of objec-
tives while IFC considers financial and economic results
based on market benchmarks, along with environ-
mental and social impacts as well as private sector im-
pacts beyond the project company.
12. IFC has twice strengthened its environmental and
social effects requirements for projects in the past
10 years. In 1998, IFC’s Environmental and Social Review
of Projects came into force in conjunction with the new
World Bank Group Safeguard Policies and the 1998 Pol-
lution Prevention and Abatement Handbook, which in-
I N D E P E N D E N T E VA L U AT I O N O F I F C ’ S D E V E L O P M E N T R E S U LT S 2 0 0 7
6 6
cluded many updated technical guidelines. The latest up-
date to IFC environmental and social effects requirements
took place in 2006, when the Board of Directors ap-
proved new Policy and Performance Standards, and a new
Environmental and Social Review of Projects.
13. IFC made its very first investments in Chad and
Armenia in 2000.
14. Individual evaluations suggest that IFC adopted
a speculative approach to its investments in the Inter-
net sector at this time, investing relatively small amounts
of equity in start-up companies, with minimal follow-
up supervision. IFC was not alone in this strategy and,
in common with many other investors and venture
capitalists, suffered losses on those investments with
the bursting of the technology sector bubble.
15. In the 1995–2000 approval period, 388 operations
were profiled; and in the 2002–05 approval period,
290 operations.
16. Average high-risk intensity fell from 4.00 in
1995, to 3.16 in 2005. Excluding country risk, high-risk
intensity declined from 3.35 in 1995, to 2.34 in 2005.
17. This pattern is consistent with the population
of projects from which the 2007 sample was derived,
with 43 percent of high-risk country approvals show-
ing an improvement in their country risk ratings since
approval in 2002.
18. Among the population of projects from which
the 2008 evaluation sample will be drawn, 40 percent of
high-risk country approvals have shown an improvement
in their country risk ratings since approval in 2003.
19. The correlation between investment ratings
and environmental and social effects ratings is weaker
than the correlation between investment ratings and
the other development ratings, although the correla-
tion is strong at the margins, where investment success
is rated as unsatisfactory.
20. See IFC 2005.
21. IFC 2006a.
22. IFC’s own credit review ratings trend downward
between project approval and early operating maturity,
but stabilize from early operating maturity onward. A com-
parison of expected equity returns at evaluation during
the 2002–04 period, with realized rates of return on eq-
uity at exit (carried out for the FY2005 Annual Review
of Evaluation Findings in IFC ), shows that, overall,
84 percent of the ratings IEG assigned in 2002–04 would
remain unchanged.
23. Between 1996 and 2005, IFC’s evaluated success
rates in EBRD countries were as follows: 63 percent of
operations had high development ratings, 50 percent
had high investment ratings, while 75 percent had high
work-quality ratings. EBRD does not disaggregate its per-
formance in this way. Instead, it reports an overall suc-
cess rate of 57 percent between 1996 and 2005. See
EBRD projects database at http://www.ebrd.com/
projects/eval/method.htm.
24. EBRD considers projects to be ready for evalu-
ation after at least 12 months of operations with 1 year
of audited financials, whereas IFC requires 18 months
of operations, reflected in at least 2 years of audited
financials.
25. This evaluation approach has been extended to
country, corporate, sector, thematic, and global policy
evaluations, by making suitable adjustments to the
criteria.
Chapter 21. During this time, IEG produced some 50 macro
evaluation reports with over 1,000 findings and rec-
ommendations. IEG also delivered 808 micro evalua-
tions: 627 Evaluation Notes—independent validations
of XPSRs, covering the results of IFC’s investment op-
erations—and 181 Project Completion Report Reviews—
independent validations of Project Completion Reports,
covering the results of IFC’s advisory services operations.
2. Out of 22 evaluated operations in conflict-
affected countries (defined as countries with an ongoing
conflict at the time of project approval, or a conflict in
the three years preceding approval), 64 percent
achieved high development success, which is actually
marginally higher than the 59-percent average of the
rest of IFC.
3. For more detail, see IEG 2004.
4. The private operator introduced new technology
and know-how and achieved a 234 percent increase in
productivity over a five-year period, increasing container
moves from 80,000 a year, to over 300,000, well ahead
of forecasts.
5. IEG-IFC 2007.
6. See, for example, IEG-IFC 2006a.
7. This finding is reported in previous IEG-IFC
annual reviews of IFC performance.
8. IEG-IFC forthcoming(b).
9. World Bank 2005.
E N D N O T E S
6 7

10. In 2005, a new management team, with new
control procedures and a refocused business model, was
introduced at the African Management Services Com-
pany; and the African Project Development Facility was
replaced by the Private Enterprise Partnership for Africa.
PEP-Africa has a broader mandate than APDF, and cov-
ers multiyear, sector-focused efforts based on three pil-
lars: (i) building SME capacity; (ii) improving business
climates (to reduce administrative barriers, regulatory
costs and other costs of doing business); and (iii) facil-
itating downstream IFC investments. The strategy en-
visages working in close partnership to integrate IFC
sector expertise with the PSD investment climate and
the SME development expertise of the World Bank
Group. It is expected to mobilize donor funding to
three times that of IFC funding—leading to total fund-
ing of about $160 million between 2006 and 2010.
11. IEG 2006.
12. IFC’s administrative expenses in Sub-Saharan
Africa were 4.2 percent of average investment out-
standing, compared with 2.2 percent in the rest of IFC.
13. As evidenced in a higher proportion of projects
exhibiting high-risk intensity, according to IEG-IFC’s
project risk profiling.
14. Often, the foreign, committed sponsor brings
resources and skills to raise the environmental and so-
cial effects capacity of its local partner but, also, locally
owned and managed companies have been committed
to building strong environmental management capac-
ity, especially if they export to markets with strict en-
vironmental requirements.
15. IEG-IFC forthcoming(b).
16. A proposed project is deemed to be in category
A if it is likely to have significant adverse environmen-
tal impacts that are sensitive, diverse, or unprece-
dented. These projects may affect an area broader than
the sites or facilities subject to physical works. A pro-
posed project is classified in category B if its potential
adverse environmental impacts on human populations
or environmentally important areas—including wet-
lands, forests, grasslands, and other natural habitats—
are less adverse than those of category-A projects.
17. Other steps include developing the environ-
mental management capacity in FIs that are not accus-
tomed to appraising and supervising their subprojects
from an environmental and social effects perspective.
This has been a challenge for IFC. Therefore, the new
Environmental and Social Reporting Procedures intro-
duced in 2006 demand substantial engagement during
appraisal and capacity building for FIs with environ-
mentally risky portfolios. The Sustainable Financial Mar-
kets facility to establish FI capacity began implementation
in 2003–04, and the results from this initiative are not
yet fully evident. A one-stop training facility (Competi-
tive Business Advance) was closed in 2006 because
one-stop training was insufficient for long-term capac-
ity building. IFC plans to roll out environmental and so-
cial effects training in the regions over time, but as a
permanent offering through a training partner. IFC will
invest in the partner’s capacity; currently the India and
China regional partnerships are under way and four or
five other partnerships are planned for 2008. This will,
however, not reach all IFC clients immediately. There-
fore, in 2008, the Competitive Business Advance will be
turned into a Web-based e-learning module for any
client with Internet access to obtain the training. Ad-
ditionally, various tools such as a Web-based platform
will be developed to further support client capacity
creation.
18. See, for example, IEG-IFC 2005b and 2006a.
19. See IEG-IFC 2006b,
20. The fund will begin as a pilot program, with an
initial capitalization of $30 million, which is expected
to facilitate between $100 million and $200 million of
local currency loans (see IFC 2007).
21. IEG-IFC forthcoming(c).
22. IEG-IFC forthcoming(a)
23. IEG-IFC forthcoming(c).
24. These recommendations are being implemented
by IFC Management, through the establishment of the
Development Effectiveness Unit in 2005, and the sub-
sequent introduction of a Development Outcome
Tracking System, as well as the introduction of Long-
Term Performance Awards for delivery of operations
with high development effectiveness.
Chapter 31. This was the so-called “proactive” scenario. Under
a more reactive scenario, IFC expected its approvals to
increase by about 50 percent, to $4.5 billion by 2005.
2. Between 1996 and 2006, the number of IFC in-
vestment staff based in the field increased from 256 to
501, with the proportion of field-based to headquarters-
based investment staff increasing from 13 percent to
39 percent.
3. See Kaplan and Norton 2001; and Kaplan 2004.
4. From an average of about 43 weeks, according
to the 2006 IFC Client Survey.
I N D E P E N D E N T E VA L U AT I O N O F I F C ’ S D E V E L O P M E N T R E S U LT S 2 0 0 7
6 8

5. In 2005, average private credit/GDP in high-
income countries was 167 percent, similar to the 1996–
2005 period average of 169 percent. Source: World
Bank Group, Global Development Finance database.
6. Despite representing over 4 percent of global
GDP, Latin America has less than 2 percent of the
world’s total financial assets. See McKinsey & Com-
pany 2006, p. 11. Weak banking sector depth is espe-
cially noticeable in Argentina, with 11.7 percent in
private sector credit/GDP in 2005; Paraguay, with 15.6
percent in private sector credit/GDP in 2005; and Mex-
ico, with 17.9 percent in private sector credit/GDP in
2005. Source: World Bank Group, Global Development
Finance database.
7. See IEG-WB 2006a.
8. Derived from World Bank Group, Global Devel-
opment Finance database.
9. In nonfrontier MICs, the average cost of export-
ing one container overseas is $1,100, compared with
$1,450 per container in frontier countries. Source:
Derived from the World Bank Group’s Doing Business
database indicators.
10. Shortcomings in Brazil’s port capacity in the
early 1990s (referred to in box 2.1) is a case in point.
See Farrell, Puron, and Remes 2005, on the need for a
strong enabling infrastructure and an effective regula-
tory structure in helping MICs exploit their compara-
tive advantages.
11. Informal economy output (as a percentage of
gross national income) in nonfrontier MICs averages 30
percent. This is not dissimilar to the frontier average
of 38 percent. By contrast, the informal economy out-
put in high-income countries is only 17 percent. For a
case study on the dampening effects of the informal
economy on growth in a MIC, see Elstrodt, Fergie, and
Laboissiere 2006.
12. This contrasts with IFC’s experience in low-
income countries, where development success was 15
percent with a low role and contribution, and 66 per-
cent with a high role and contribution.
13. Excluding China, which accounts for just over
20 percent of developing country GDP and 5 percent
of IFC financial sector commitments.
14. IEG-IFC forthcoming(c).
15. See IEG-WB 2006b, 2006c.
16. See IEG-IFC forthcoming(a).
17. The Africa Action Plan, approved in Septem-
ber 2005, includes, for example, targets to reduce the
costs of business and increase finance mobilization in
the region in at least nine countries by fiscal year 2008.
18. IEG-WB 2006a.
19. See IEG-IFC 2005a.
20. From a 2006 XPSR evaluation note. See also IEG-
IFC forthcoming(c).
21. See IEG-IFC forthcoming(b).
22. Remittances are today a major component of in-
ternational financial flows to developing countries, and
in the last 10 years they have grown faster than private
capital flows or overseas development assistance. Re-
mittances grew more than 300 percent between 1995
and 2005, compared with a 250 percent increase in pri-
vate capital flows (see World Bank 2006, p. 88).
23. See IEG-IFC 2006a.
24. For example, a business school and a clinic
geared toward tourists.
25. See World Bank 2007.
26. World Bank and IFC 2006.
27. See IEG-WB 2006c.
28. Cooperation is defined broadly to include any
interaction among World Bank Group institutions aimed
at improving the development impact of World Bank
Group instruments by maximizing synergies and re-
ducing duplication and inconsistencies. It includes
both coordination (efforts to integrate the strategies
of the two institutions to accomplish common objec-
tives, such as through division of labor, but which does
not necessarily involve interaction on specific inter-
ventions) and collaboration (defined as interaction
between the two institutions on specific interventions).
29. IEG’s evaluation, Improving Investment Cli-
mates: An Evaluation of World Bank Group Assis-
tance (IEG 2006), reinforces these findings. It concludes
that Bank Group coordination on business climate is-
sues has been weak, both within the Bank as well as be-
tween the Bank and IFC. Furthermore, the study found
that cooperation across the two institutions often de-
pends on personal relationships and the level of at-
tention given to cooperation by senior management.
30. In March 2007, IFC announced new procedures
for linking up IFC and Bank advisory services, including:
(i) inviting representatives from other parts of the Bank
Group to key strategy-setting meetings, where advisory
services interventions requiring coordination are dis-
cussed, for example, at the regional and sector level; (ii)
requesting that task managers seek input/advice from
Bank colleagues at the conceptual stage of a project; (iii)
sharing information about IFC’s portfolio of advisory
services operations; and (iv) reimbursement of time-costs
associated with the use of Bank staff expertise.
E N D N O T E S
6 9
31. Supervision quality was significantly above the
average for other regions during 2003–05.
32. Between 2001 and 2006, IFC commitment in
South Asia increased by 51 percent, whereas they in-
creased by 106 percent in other regions. Regulatory con-
straints in India were reportedly a factor in constraining
the level of overall investment activity in the region.
33. IEG-IFC’s forthcoming report on Ukraine con-
tains a comparison between IFC and EBRD activities in
that country in greater detail.
34. From previous annual reviews and reports by
IEG-IFC.
35. IEG-WB 2003.
36. More activities are focused on providing access
to knowledge and expertise than on ensuring that
knowledge is shared in ways that promote its adapta-
tion and use, for example, by enhancing active team-
based knowledge sharing. Also, activities have done
more to push out knowledge than to pull it in—thereby
missing opportunities to refresh the Bank’s knowledge
through ongoing field experience, to reduce “reinven-
tion of the wheel,” and to scale up successful programs.
As a result, internal knowledge-sharing activities are
not sufficiently relevant to the day-to-day operational
work of “frontline” staff.
37. IEG-IFC 2006a.
38. IFC’s most recent strategy paper (IFC 2007)
sets out a number of risk-management steps IFC is
going to take to improve client service and efficiency.
These include an ongoing business process review, to
both streamline and strengthen operational proce-
dures; a shift in credit review (and, eventually, most as-
pects of risk-management decision making) to the field;
integration of development-impact metrics with finan-
cial risk-return metrics, and enhanced tools, such as im-
proved risk-rating systems.
39. The development of new risk-mitigation prod-
ucts is in line with a World Economic Forum recom-
mendation in 2006 that development finance institutions
such as IFC expand their risk-mitigation activities. See
World Economic Forum 2006, pp. 13–16.
40. See IEG-IFC 2006b.
I N D E P E N D E N T E VA L U AT I O N O F I F C ’ S D E V E L O P M E N T R E S U LT S 2 0 0 7
7 0

7 1
EBRD (European Bank for Reconstruction and De-
velopment). Projects database. http://www
.ebrd.com/projects/eval/method.htm (evalua-
tion methodology and ratings; accessed De-
cember 2006).
Elstrodt, Heinz-Peter, Jorge A. Fergie, and Martha
A. Laboissiere. 2006. “How Brazil Can Grow.”
McKinsey Quarterly 2: 12–15.
Farrell, Diana, Antonio Puron, and Jaana K. Remes.
2005. “Beyond Cheap Labor: Lessons for De-
veloping Economies.” McKinsey Quarterly
1: 98–109.
IEG (Independent Evaluation Group). 2004. Im-
proving Investment Climates: An Evaluation
of World Bank Group Assistance. http://www
.worldbank.org/ieg/investment_climates.
———. 2006. Improving Investment Climates:
An Evaluation of World Bank Group Assis-
tance. Washington, DC: World Bank.
IEG-IFC (Independent Evaluation Group–Inter-
national Finance Corporation). 2005a. “Food &
Agribusiness: An Evaluation of IFC’s Invest-
ments in the Sector.” IEG Findings, No. 1,
World Bank, Washington, DC.
———. 2005b. “Pakistan: IFC Country Impact
Review.” IEG Findings, No. 3, World Bank,
Washington, DC.
———. 2006a. “Annual Review of FY2005 Evalu-
ation Findings in IFC.” IEG Findings, No. 6,
World Bank, Washington, DC.
———. 2006b. “Turkey: IFC Country Impact Re-
view.” IEG Findings, No. 4, World Bank, Wash-
ington, DC.
———. 2007. “IFC’s Experience in the Transport
Sector.” IEG Evaluation Brief, No. 8, World
Bank, Washington, DC.
———. Forthcoming(a). Evaluation of IFC’s Pri-
vate Enterprise Partnership Technical Assis-
tance Program in Eastern Europe and Cen-
tral Asia. Washington, DC: World Bank.
———. Forthcoming(b). Evaluation of the Ef-
fectiveness of IFC Assistance for the Environ-
ment. Washington, DC: World Bank.
———. Forthcoming(c). Financing Micro, Small,
and Medium Enterprises in Frontier Countries
through Financial Intermediaries: An Inde-
pendent Evaluation of IFC’s Experience. Wash-
ington, DC: World Bank.
———. Forthcoming(d). Ukraine: IFC Country
Impact Review. Washington, DC: World Bank.
IEG-WB (Independent Evaluation Group–World
Bank). 2003. Sharing Knowledge: Innovations
and Remaining Challenges. Washington, DC:
World Bank.
———. 2006a. Annual Review of Development
Effectiveness 2006: Getting Results. Washington,
DC: World Bank.
———. 2006b. Malawi: Country Assistance Eval-
uation. Washington, DC: World Bank.
———. 2006c. Senegal: Country Assistance Eval-
uation.Washington, DC: World Bank.
IFC (International Finance Corporation). 2005.
“Second Benchmarking Review of ECG Mem-
bers’ Evaluation Practices for Their Private Sec-
tor Investment Operations Against Their
Agreed Good Practice Standards,” by Walter I.
Cohn & Associates. Consultant report. http://
www.ifc.org/ifcext/ieg.nsf/AttachmentsByTitle/
Second+Benchmarking+Review+1.25.05_FIN
AL/ $FILE/Second+Benchmarking+Review+
1.25.05_FINAL.pdf.
———. 2006a. Annual Portfolio Performance Re-
port: FY06. http://www.ifc.org/ifcext/disclosure
.nsf/Content/Annual_Portfolio_Performance_
Review_FY06.
REFERENCES

———. 2006b. “IFC Strategic Directions: Imple-
mentation Update and FY07–FY09 Outlook.”
http://www.ifc.org/ifcext/about.nsf/Attachments
ByTitle/Strategy_Dev_Paper_2006/$FILE/
Strategy_Dev_Paper_2006.pdf.
———. 2007. “IFC Strategic Directions, FY08–10:
Creating Opportunity.” Washington, DC. http://
www.ifc.org/ifcext/disclosure.nsf/AttachmentsBy
Title/IFC_SDP_full/$FILE/IFC_SDP_full.pdf.
Kaplan, Robert S. 2004. Strategy Maps: Convert-
ing Intangible Assets into Tangible Outcomes.
Boston: Harvard Business School Press.
Kaplan, Robert S., and David P. Norton. 2001. The
Strategy-Focused Organization: How Bal-
anced Scorecard Companies Thrive in the
New Business Environment. Boston: Harvard
Business School Press.
McKinsey & Company. 2006. “Mapping the Global
Capital Market: Second Annual Report.” Mc-
Kinsey Global Institute. http://www.mckinsey
.com/mgi/publications/gcmAnnualReport.asp.
World Bank. 2005. Meeting the Challenge of
Africa’s Development: A World Bank Group
Action Plan. Africa Region. Washington, DC,
September. http://siteresources.worldbank.org/
EXTAFRREGINICOO/Resources/aap_final.pdf.
———. 2006. Global Economic Prospects 2006:
Economic Implications of Remittances and
Migration. Washington, DC: World Bank.
———. 2007. Accelerating Development Out-
comes in Africa: Progress and Change in
the Africa Action Plan. Africa Region. http://
siteresources.worldbank.org/DEVCOMMINT/
Documentation/21289631/DC2007-0008(E)-
AfricaActionPlan.pdf.
———. Forthcoming. Global Development Fi-
nance 2007: Financial Globalization of the
Corporate Sector. Washington, DC: World Bank.
World Bank and IFC. 2006. Doing Business 2007:
How to Reform. Washington, DC: World Bank.
World Bank Group. Doing Business database.
http://www.doingbusiness.org (doing business
indicators; accessed December 2006).
———. GDF Online database. http://publications
.worldbank.org/GDF (global development fi-
nance data; accessed January 2007).
World Economic Forum. 2006. Building on the
Monterrey Consensus: The Untapped Potential
of Development Finance Institutions to Cat-
alyze Private Investment. Geneva: World Eco-
nomic Forum.
I N D E P E N D E N T E VA L U AT I O N O F I F C ’ S D E V E L O P M E N T R E S U LT S 2 0 0 7
7 2

ISBN 978-0-8213-7264-7
IEG Independent Evaluation Group
Independent Evaluation Group- IFC
E-mail: [email protected]
Telephone: 202-458-2299
Facsimile: 202-974-4302
SKU 17264