public accounts and estimates committee 2015-16 … · public accounts and estimates committee: ......
TRANSCRIPT

Public Accounts and Estimates Committee: 2015-16 Financial and Performance Outcomes – Entity-Specific Questionnaire
PUBLIC ACCOUNTS AND ESTIMATES COMMITTEE
2015-16 FINANCIAL AND PERFORMANCE OUTCOMES – ENTITY-SPECIFIC QUESTIONNAIRE
DEPARTMENT OF TREASURY AND FINANCE
1
email rcvd 03/02/2017

Public Accounts and Estimates Committee: 2015-16 Financial and Performance Outcomes – Entity-Specific Questionnaire
Question 1 Program description
Please provide a list of the Department’s major programs, including for each:
(a) The name of the program
(b) The name of the Department’s output that the program is a part of
(c) The activities of the Department in providing the program
(d) The effects on the community the program is intended to achieve
(e) How the Department measures whether the aims of the program have been fulfilled.
The name of the program
Provision of advice to the Treasurer and Minister for Finance
Delivery of whole of government common services to the Victorian public sector
The name of the Department’s output that the program is a part of
2015-16 outputs Budget and Financial Policy Advice
Financial Reporting
Financial and Resource Management Frameworks
GBE Performance Monitoring and Financial Risk Management
Revenue Management Services to Government
Economic and Financial Policy
Economic Regulatory Services
Business Environment Policy Advice
Land and Infrastructure Investment Management
2015-16 outputs Resource Management Services to Government
The activities of the Department in providing the program
DTF provides advice to the Treasurer and the Minister for Finance on a range of areas including economic and financial policy as well as advice on asset management and the delivery of infrastructure.
DTF delivers whole of government common services to the Victorian public sector through the implementation and ongoing management of State Purchase Contracts (SPCs)
The Shared Service Provider (SSP) delivers facilities, accommodation management, library and car pool services to all Victorian Government departments and 23 portfolio and other agencies.
2
email rcvd 03/02/2017

Public Accounts and Estimates Committee: 2015-16 Financial and Performance Outcomes – Entity-Specific Questionnaire
The effects on the community the program is intended to achieve
DTF provides economic, financial and resource management advice to help the Victorian Government deliver its policies, which benefit the community by supporting responsible budget and financial management and the implementation of major infrastructure projects and frameworks.
Delivery of whole of government common services supports the Victorian public sector, which in turn supports the Victorian Government in delivering its policies to benefit the community.
How the Department measures whether the aims of the program have been fulfilled.
DTF policy advice is measured using objective indicators. The following DTF objective indicators from the 2015-16 Budget relate to provision of policy advice:
• Provide high quality, timely and relevant advice on the State’s finances and budget, as assessed by feedback from our key clients.
• Provide high quality, timely and relevant advice on economic policy, forecasts, legislation and frameworks as assessed by feedback from our key clients.
• Provide high quality, timely and relevant advice on asset management, the delivery of infrastructure and management of government land as assessed by feedback from our key clients.
The following DTF objective indicators from the 2015-16 Budget relate to the delivery of whole of government common services to the Victorian public sector:
• Drive productivity and efficiency by increasing the benefits delivered from government procurement contracts.
• Drive efficiency by maintaining low vacancy rates for government office accommodation.
• Provide high quality, timely and relevant advice on services to Government as assessed by feedback from our key clients.
3
email rcvd 03/02/2017
Public Accounts and Estimates Committee: 2015-16 Financial and Performance Outcomes – Entity-Specific Questionnaire
Question 2 Security upgrades Please advise how much has been spent (both as output expenditure and asset investment) on security upgrades for the Department’s premises.
Please describe any upgrades that were made during 2015-16, including identification of any (hypothetical or perceived) threats that the previous system would not have prevented that the upgraded system is able to prevent.
The security assessments undertaken in September 2014 by the department contribute to providing a baseline standard for all accommodation. By adopting a consistent approach, it will be easier to raise the security posture and approach should the alert level be further raised.
Please also describe any cost benefit analysis done by the Department in assessing security upgrades.
In September 2014, the Victorian threat level was escalated to ‘High’ as a result of a National escalation. Accordingly, the State Crisis and Resilience Council (SCRC) sought to ensure that the security of government accommodation was appropriate to meet the raised threat level. A number of high profile buildings in Melbourne CBD were assessed by Victoria Police, and these assessments included buildings on Treasury Reserve (the Reserve).
Following this assessment, which focussed on external measures only, a more detailed assessment was managed by the Shared Service Provider (SSP), which provided details and recommendations to enhance the security of all buildings on the Reserve.
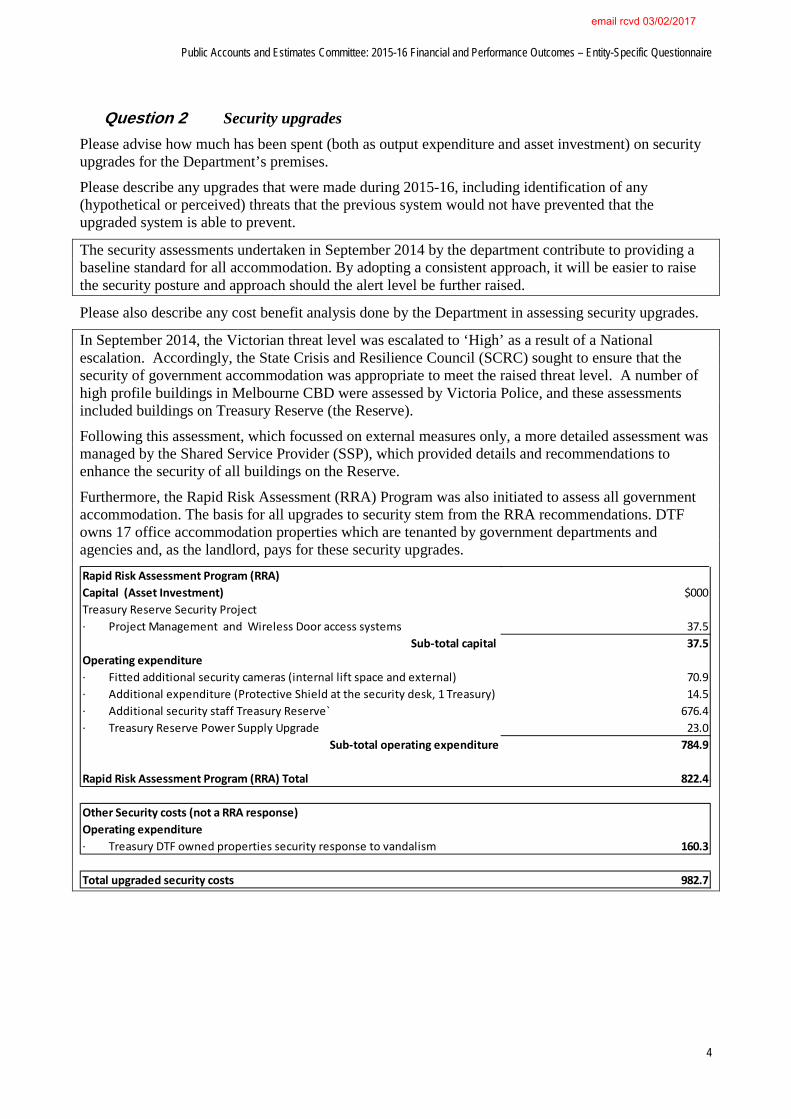
Furthermore, the Rapid Risk Assessment (RRA) Program was also initiated to assess all government accommodation. The basis for all upgrades to security stem from the RRA recommendations. DTF owns 17 office accommodation properties which are tenanted by government departments and agencies and, as the landlord, pays for these security upgrades.
Rapid Risk Assessment Program (RRA)Capital (Asset Investment) $000Treasury Reserve Security Project· Project Management and Wireless Door access systems 37.5
Sub-total capital 37.5Operating expenditure· Fitted additional security cameras (internal lift space and external) 70.9· Additional expenditure (Protective Shield at the security desk, 1 Treasury) 14.5· Additional security staff Treasury Reserve` 676.4· Treasury Reserve Power Supply Upgrade 23.0
Sub-total operating expenditure 784.9
Rapid Risk Assessment Program (RRA) Total 822.4
Other Security costs (not a RRA response)Operating expenditure· Treasury DTF owned properties security response to vandalism 160.3
Total upgraded security costs 982.7
4
email rcvd 03/02/2017

Public Accounts and Estimates Committee: 2015-16 Financial and Performance Outcomes – Entity-Specific Questionnaire
Question 3 Contractor and consultant costs Please detail the actual amount that the Department spent on contractors and consultants in 2014-15 and 2015-16. A definition of the difference between consultants and contractors is contained in FRD 22G – Standard Disclosures in the Report of Operations. Please provide figures on the same basis of consolidation for the Department as used in the budget papers.
2014-15 Actual
2015-16 Actual
($ million) ($ million)
Consultants 21.4 19.2
Contractors 18.6 19.8
5
email rcvd 03/02/2017

Public Accounts and Estimates Committee: 2015-16 Financial and Performance Outcomes – Entity-Specific Questionnaire
Question 4 Enterprise Bargaining Agreements Please list the Enterprise Bargaining Agreements (EBAs) related to the Victorian Public Sector workforce including all Departments, that were concluded in 2015-16, showing the number of employees affected and the growth in employee expenses attributable to the EBA. Please provide the information in the same format as the Department of Treasury and Finance response to the question taken on notice (Question 3a) from the PAEC 2014-15 Financial and Performance Outcomes Inquiry Hearings on 16 February 2016.
DTF response: The table below provides the list of EBAs concluded in 2015-16 including full-time equivalent employees (FTE) associated with each. These EBAs covered 22 per cent of the Victorian Public Sector workforce.
EBAs concluded in 2015-16* FTE
1 North East Water Enterprise Agreement 2015 157
2 Gippsland Water Enterprise Agreement 2015 229
3 West Gippsland Catchment Management Authority Enterprise Agreement 2015 37
1 The Melbourne Convention and Exhibition Centre Enterprise Agreement 2015 200
2 Wimmera Catchment Management Authority Enterprise Agreement 2015 25
3 Energy Safe Victoria Enterprise Agreement 2015 105
4 The Greater Metropolitan Cemeteries Trust Enterprise Agreement 2016 167
5 Places Victoria Enterprise Agreement 2016-2019 74
6 Victorian Public Service Enterprise Agreement 2016 28,446
7 Emergency Services Telecommunication Authority Operational Employees Enterprise Agreement 2015 608
8 Grampians Wimmera Mallee Water Enterprise Agreement 2015 174
9 Remembrance Parks Central Victoria Enterprise Agreement 2015-2018 8
10 Victoria Police (Police Officers (excluding Commanders), Protective Services Officers, Police Reservists and Police Recruits) Enterprise Agreement 2015
14,624
11 Federation Training Chadstone Trainers Agreement 2015 148
12 State Sport Centres Trust Enterprise Agreement 2015 162
13 Adult Multicultural Educational Services (AMES) Teachers' Enterprise Agreement 2015 322
14 Metropolitan Fire Brigade, AMWU Mechanical Engineering Workshops Enterprise Agreement 2015 47
15 The Southern Metropolitan Cemeteries Trust Indoor Enterprise Agreement 2015 48
16 Corangamite Catchment Management Authority Enterprise Agreement 2015 39
17 Royal Botanic Gardens Enterprise Agreement 2014 165
18 Victorian TAFE Teaching Staff Multi-Enterprise Agreement 2015 2,864
19 Goulburn-Murray Rural Water Corporation Enterprise Agreement 2015 750
20 Bendigo Kangan Institute PACCT Staff Enterprise Agreement 2015 415
21 Lower Murray Urban and Rural Water Corporation Enterprise Agreement 2015 168
22 The Melbourne & Olympic Parks Maintenance and Horticulture Enterprise Agreement 11
23 Goulburn Valley Water Enterprise Agreement 2015 214
6
email rcvd 03/02/2017

Public Accounts and Estimates Committee: 2015-16 Financial and Performance Outcomes – Entity-Specific Questionnaire
EBAs concluded in 2015-16* FTE
24 South East Water Employees' Enterprise Agreement 2015 447
25 Mallee Catchment Management Authority Enterprise Agreement 2015 43
26 Western Water Enterprise Agreement 2014 153
27 Gippsland Ports Enterprise Agreement 2014 44
28 East Gippsland Water Corporation Enterprise Agreement 2014 85
* Agreements approved by the Fair Work Commission in 2015-16
7
email rcvd 03/02/2017

Public Accounts and Estimates Committee: 2015-16 Financial and Performance Outcomes – Entity-Specific Questionnaire
Question 5 Economic variables
Indicate the actual results for the following economic variables in 2014-15 and 2015-16. Please provide an explanation for the variance.
Economic variable Actual 2014-15 result
Actual 2015-16 result
Variance Explanation for variances
Real gross state product growth
2.6% 3.3% +0.7ppts Stronger household consumption, dwelling investment and underlying public demand more than offset weaker underlying business investment and net international trade.
Employment growth 2.1% 2.3% +0.2ppts Stronger employment growth in 2015-16 was mainly driven by two industries: (i) health care and social assistance, consistent with the growing and ageing population; and (ii) construction, consistent with low interest rates and strong population growth supporting strong growth in building activity.
Unemployment rate 6.4% 5.9% -0.5 ppts Consistent with employment growth accelerating further above trend in 2015-16, the unemployment rate fell compared with the previous financial year.
Consumer price index growth 1.4% 1.6% +0.2ppts Growth in consumer prices remained subdued in 2015-16. Contributions to the small increase in headline inflation in 2015-16 were broad, led by the alcohol and tobacco and housing groups.
Wage price index growth 2.7% 2.3% -0.4ppts Wages growth slowed in 2015-16, consistent with subdued underlying consumer price inflation, the impact of the fall in the terms of trade, and persistently elevated levels of labour market spare capacity.
Population growth 1.8% 2.1% +0.3ppts The contributions from natural increase, net overseas migration and net interstate migration to population increase were all greater in 2015-16 compared to previous year.
Interest rates(a) 2.35% 1.96% -0.39 ppts Reflects RBA interest rate decisions over the two years. A change (decrease) in the cash rate occurred in February and May 2015 and in May 2016.
Household consumption growth
2.5% 3.2%
+0.7ppts Stronger growth in Food and Clothing and footwear sectors more than offset weaker growth in Communications and Hotels, cafes and restaurants. (Data are from 2015-16 State Accounts)
Property prices growth(a) 6.1% 9.4% +3.3ppts Higher population growth (in particular, higher net overseas migration) in 2015-16 compared to 2014-15 and relatively lower interest rates.
8
email rcvd 03/02/2017

Public Accounts and Estimates Committee: 2015-16 Financial and Performance Outcomes – Entity-Specific Questionnaire
Economic variable Actual 2014-15 result
Actual 2015-16 result
Variance Explanation for variances
Property transaction volume growth(a)
0.1% 7.7% +7.6ppts There was higher population growth in 2015-16 (including higher net interstate and overseas migration) which drove higher demand. Auction clearance rates remained stable with a higher number of properties offered at auction in 2015-16 leading to the increase in transaction volumes.
Enterprise bargaining agreement increases(a)
4.6% 6.2% +1.6ppts The base for ‘enterprise bargaining agreement increases’ sensitivity analysis is employee expenses as the 2015-16 Budget did not provide an estimate of enterprise bargaining agreement increases. Accordingly, the response provided to this questionnaire is employee expenses (excluding superannuation).
The higher growth in employee expenses in 2015-16 was largely the result of increase in resources to meet growing demand for services in areas such as health, education and community safety.
Factors that impact employee expenses growth include the size and composition of the public sector workforce, increase in salaries due to enterprise agreements and progression, as well as changes to rostering arrangements. To better reflect the sensitivity being undertaken on employee expenses, the analysis has been renamed ‘Total employee expenses’ in the 2016-17 Budget Paper No. 2 sensitivity analysis (Table A1).
Exchange rate 66.7 trade weighted index
61.9 trade weighted index
-4.8 index pts US Federal Reserve raised interest rates in December 2015. This and continuing strength in US economic data for the remainder of 2015-16 attracted capital away from Australia.
(a) As defined for the sensitivity analysis in Budget Paper No.2.
9
email rcvd 03/02/2017

Public Accounts and Estimates Committee: 2015-16 Financial and Performance Outcomes – Entity-Specific Questionnaire
Question 6 Departmental expenditure by Government Purpose Classification Regarding the department’s operating expenses in 2015-16, please compare the budget estimates provided by the Department in its response to the Committee’s 2015-16 Budget Estimates Questionnaire (question 12) to the department’s actual expenses by government purpose classification, explaining any variances greater than ±10 per cent or $100 million (please fill all blank spaces).
Government purpose classification
Initial budget estimate for
2015-16 (2015-16 Budget Estimates
Questionnaire q.12)
Actual for 2015-16
Variance from budget
estimate
Explanation for any variance greater than ±10 per cent or $100 million
($ million) ($ million) (per cent)
General public services 2,324.7 2,302.2 -1 The actual expenditure for the First Home Owners Grant (FHOG) of $111m is included here, with the budget in the sub output ‘Housing and Community Services’.
Public order and safety n/a
Education n/a
Health n/a
Social security and welfare n/a
Housing and community amenities
95.5 0 -100 The actual expenditure for the First Home Owners Grant (FHOG) of $111m is included in ‘General Public Services’ rather than the sub-output of housing concessions. FHOG is difficult to forecast as it is triggered by settlement dates on new properties, so variances in the strength of the property market and greater settlement numbers both affect the result.
Recreation and culture n/a
Fuel and energy n/a
Agriculture, forestry, fishing, and hunting
n/a
10
email rcvd 03/02/2017

Public Accounts and Estimates Committee: 2015-16 Financial and Performance Outcomes – Entity-Specific Questionnaire
Government purpose classification
Initial budget estimate for
2015-16 (2015-16 Budget Estimates
Questionnaire q.12)
Actual for 2015-16
Variance from budget
estimate
Explanation for any variance greater than ±10 per cent or $100 million
($ million) ($ million) (per cent)
Transport and communications
n/a
Other economic affairs 17.1 18.3 7
Other purposes n/a
TOTAL 2,437.5 2,320.6 -5 Overall by Government Purpose Classification (GPC) the department is underspent by $117m. This is largely caused by account classification where the budget for Melbourne Major Events is included but the inter-governmental actuals are excluded from GPC reporting.
11
email rcvd 03/02/2017

Public Accounts and Estimates Committee: 2015-16 Financial and Performance Outcomes – Entity-Specific Questionnaire
Question 7 Synchrotron The 2015-16 Financial Report noted that: ‘Total expenses were $530 million less than the revised 2015-16 estimate primarily due to the unexpected underspend across departments and the rephasing of the transfer of the Australian Synchrotron to the Commonwealth Government, which is expected to occur in 2016-17’.1 Please advise:
(a) What the original and actual dates for transfer of the Synchrotron were;
The original date for the transfer of the Synchrotron to the Commonwealth was in 2015-16.
The implementation deed was signed and the asset transferred in 2016-17.
(b) How much lower output expenses were due during 2015-16 to the alteration of the date of transfer;
Output expenses were $226.3 million lower due to the alteration of the date of the transfer of the asset.
(c) Which outputs were affected by this saving?
The Synchrotron was covered under the Industry and Enterprise Innovation output.
The impact of the asset given free of charge was a non cash item on DEDJTR’s Administered items statement and as such there was no impact on the output cost for the Industry and Enterprise Innovation output.
1 Department of Treasury and Finance, 2015-16 Financial Report (2016), p.4
12
email rcvd 03/02/2017

Public Accounts and Estimates Committee: 2015-16 Financial and Performance Outcomes – Entity-Specific Questionnaire
Question 8 Variances not associated with the Port of Melbourne lease The 2015-16 Financial Report states the primary reason for variances against the original budget for a number of items was due to ‘the revised timing from entering into a medium-term lease over the operations of the Port of Melbourne from 2015-16 to 2016-17’, without indicating how much of the variance was due to the Port of Melbourne lease. Please advise other significant reasons for variations against the original budget figures for the following items:
(a) net debt for the general government sector
The most significant contribution to the variance in net debt relates to changes in borrowings, largely due to the impact of the revised timing from entering into a medium-term lease over the operations of the Port of Melbourne. The variation in debt was less than the expected value of the lease due to higher than expected cash receipts from land transfer duty revenue in 2015-16 ($810 million) and other receipts including the payment received from Tatts following the High Court’s decision in the State’s favour relating to electronic gaming machine licenses ($567 million).
(b) net debt for the State of Victoria
The Public Financial Corporations sector also contributed to the change in the net debt outcome compared to the budget estimates. This was largely due to the impact of bond rate movements used to value the insurance claims liabilities of the TAC, WorkSafe and VMIA as well as a change in the budgeted investment returns for the State's insurer's investment portfolios. The average discount rate (bond rate) decreased by almost 1 per cent since December 2015 (the basis for the 2016-17 Budget), which resulted in an increase in claims liabilities. Weaker investment returns resulted in a combined reduction in investment revenues of approximately $1.2bn for the TAC, WorkSafe and VMIA.
(c) net cash flows from investments in financial assets for policy purposes for the general government sector
Excluding the impact of the Port of Melbourne lease, the main reason for the variance between the 2015-16 actuals and the original budget figures for net cash flows from investments in financial assets for policy purposes relates to capital repatriations, which were not factored in the original budget estimates, including $125 million from the State Electricity Commission of Victoria.
13
email rcvd 03/02/2017

Public Accounts and Estimates Committee: 2015-16 Financial and Performance Outcomes – Entity-Specific Questionnaire
Question 9 Other economic flows included in the net result – PFC sector The 2015-16 Financial Report notes that ‘other economic flows included in the net result’ for the PFC sector was -$1,641 million.2 The 2016-17 budget papers estimated that this would be $575 million.3 Please explain why this estimate changed between May 2016 (when the 2016-17 budget papers were prepared) and June 2016, including listing factors which influenced this.
There are two main factors in the change in other economic flows:
• TCV net loss on financial instruments - the 31 December 2015 actual mark-to-market position for its borrowings and derivatives was $50 million positive and was used as the starting point for the revised 2015-16 estimate for the 2016-17 Budget because movements in bond rates are not forecast for budgeting purposes. Interest rates were lower at 30 June 2016, which resulted in an unrealized loss of $1.2bn as at 30 June 2016 on TCV’s financial instruments; and
• Losses from other economic flows also reflect the impact of lower bond rates used to value insurance claims liabilities of the TAC, VWA and VMIA, the release of risk margin and claims handling expenses for the three insurers (TAC, VWA and VMIA). The average discount rate (bond rate) had decreased by almost 1 per cent since December 2015 from 2.88 per cent to 1.98 per cent, which resulted in a loss of approximately $1bn as at 30 June 2016.
2 Department of Treasury and Finance, 2015-16 Financial Report (2016), p.137 3 Department of Treasury and Finance, Budget Paper No.5: 2016-17 Statement of Finances (2016), p.59
14
email rcvd 03/02/2017

Public Accounts and Estimates Committee: 2015-16 Financial and Performance Outcomes – Entity-Specific Questionnaire
Question 10 Other movements in non-financial assets - GGS One of the main components in the calculation of net lending/borrowing is ‘other movements in non-financial assets’, which includes a recognition of finance lease arrangements as well as transfers of fixed assets to other sectors. Please disaggregate and explain the variance of this item from the original budget, as in the following table:
2015-16 Budget ($ million)
2015-16 actual ($ million)
Variance ($ million)
Explanation for variance
Recognition of finance lease arrangements
1,050.4 1,050.4 0 No variance
Transfers of fixed assets to other sectors
-1,332.4 -1,973 640.6 Variance is primarily driven by higher than budgeted transfers of fixed assets from the Department of Economic Development, Jobs, Transport and Resources to VicTrack in the PNFC sector. These fixed asset transfers are primarily in relation to rail investment mainly the Level Crossing Removal Program.
Other 39.4 -47.4 86.8 Variance is primarily driven by assets provided free of charge which were not budgeted for. The asset provided free of charge was mainly land, which was transferred as a result of the ongoing State Wide Crown Land Reconciliation Project.
Other movements in non-financial assets
-242.6 -970 727.4 The variance for Other movements in non-financial assets is comprised of the three variances shown above.
15
email rcvd 03/02/2017

Public Accounts and Estimates Committee: 2015-16 Financial and Performance Outcomes – Entity-Specific Questionnaire
Question 11 Government infrastructure investment The Committee notes the inclusion of a figure for government infrastructure investment in the 2015-16 Financial Report of $4,728.0 million. Please advise:
(a) the breakdown of this into the following components
o net cash flows from investments in non-financial assets
o net cash flows from investments in financial assets for policy purposes
o PPP infrastructure investment
o Any other component (please specify)
Cash Flow Statement category $ million
Cash flows from investments in non-financial assets 4,229
Net cash flows from investments in financial assets for policy purposes -92
PPP infrastructure cash flows 591
Total – Government infrastructure investment 4,728
(b) whether this figure is an ‘actual’ result or an updated estimate
The 2015-16 Financial Report presents the financial position, performance and cash flows for the financial year ended 30 June 2016. All components that are used to derive Government infrastructure investment in the above table are actuals, with the exception of the PPP infrastructure cash flows. The estimates for PPP projects in procurement are sourced from construction cost estimates in approved business cases. When a PPP project moves from procurement, to having a contract and being constructed, the estimates are updated and reflect the best estimate of the private sector’s construction costs for Partnership Victoria projects from contract execution.
(c) if it is an estimate, on what basis was the updated estimate made
The PPP infrastructure cash flows are updated prior to the release of financial publications to incorporate the impact of new Partnership Victoria projects and projects that have been contracted since the previous publication. Historical estimates of PPP cash flows are not updated for actual cash flows, given they reflect the private sector’s estimates contained in the contracted financial model at contract execution and the State is only obliged to pay the contracted service payment amounts.
16
email rcvd 03/02/2017

Public Accounts and Estimates Committee: 2015-16 Financial and Performance Outcomes – Entity-Specific Questionnaire
(d) where this estimate is published.
The cash flow statement in the 2015-16 Financial Report (p. 118) publishes both the cash flows from investments in non-financial assets and net cash flows from investments in financial assets for policy purposes. PPP infrastructure cash flows are not separately published.
17
email rcvd 03/02/2017

Public Accounts and Estimates Committee: 2015-16 Financial and Performance Outcomes – Entity-Specific Questionnaire
Question 12 Net asset provision and depreciation in the PNFC sector The Auditor-General uses the ratio of investment expenditure to depreciation as an indicator of how well the State is renewing or replacing assets. The Committee notes that this ratio for the PNFC sector has declined over the past decade. The 2015-16 Financial Report indicates that for 2015-16, depreciation in the PNFC sector was $2,154 million,4 and that net cash flows from non-financial assets in the sector was $2,118 million.5 Please advise:
(a) whether the Government considers that the PNFC sector is renewing or replacing assets at an acceptable rate
The Department considers that the PNFC sector is renewing/replacing assets at an acceptable rate. For the larger PNFC entities such as the 19 water corporations, VicTrack, Director of Housing, V/Line Passenger Corporation, and Places Victoria, the Department monitors proposed capital investment through the established corporate planning and quarterly performance reporting framework.
Net investing cash flows for purchase of non-financial assets ($2,118 million in 2015-16) net off sales of non-financial assets that are surplus to entities’ operational requirements ($263 million in 2015-16). Excluding these asset sales, investing cash flows for purchase of non-financial assets in the PNFC sector in 2015-16 were $2,381 million, which was higher than depreciation ($2,154 million). In 2014-15, investing cash flows for purchase of non-financial assets were $2,211 million, which was also higher than depreciation ($1,978 million).
(b) what the consequences of a prolonged period of net investment being less than depreciation would be in the sector
The ratio of investment expenditure to depreciation may serve as a very broad long-term indicator of the extent to which the service potential that is being consumed in service provision (as measured by depreciation) is being replaced/renewed. For the PNFC sector in aggregate, this indicator encompasses the capital investment decisions of a large number of individual entities. Capital investment by individual entities tends to vary from year to year, and relative to depreciation in any single year. This reflects the large number of assets in service, the different service lives of individual assets, and the quantum of investment required to replace or renew those assets that are approaching the end of their service lives.
A prolonged period of capital investment being less than depreciation may therefore reflect the timing of asset replacement/renewal needs. It may also reflect a range of other factors, including changes in technology, customer demand, and Government priorities. An assessment of the
4 Department of Treasury and Finance, 2015-16 Financial Report (2016), p.136 5 Department of Treasury and Finance, 2015-16 Financial Report (2016), p.140
18
email rcvd 03/02/2017

Public Accounts and Estimates Committee: 2015-16 Financial and Performance Outcomes – Entity-Specific Questionnaire
implications of a prolonged period of capital investment being less than depreciation is best made at the individual entity level (eg for the larger PNFC entities, through the established corporate planning and quarterly performance reporting framework).
(c) whether assets can be provided in the sector other than through net cash flows from non-financial assets, and if so, how is this shown in the financial statements
Assets can also be provided in the sector through asset transfers from other entities (e.g. from other Government departments or entities, or in the case of the water corporations from developers—developers are required to provide water supply and sewerage facilities and in some cases recycling facilities to new subdivisions, which are subsequently gifted to and maintained by the water corporations). The fair value of these assets is reported in the Operating Statement as part of “Other revenue” in accordance with Accounting Standards.
(d) whether the Government intends to adjust investment in the sector to address this situation.
The Department will continue to consider investment proposals by PNFC entities through the established corporate planning and quarterly performance reporting framework, and in accordance with the Investment Lifecycle and High Value High Risk Guidelines (available on the Department’s website).
19
email rcvd 03/02/2017

Public Accounts and Estimates Committee: 2015-16 Financial and Performance Outcomes – Entity-Specific Questionnaire
Question 13 Performance measures not included in 2015-16 Annual Report During 2015-16, the output ‘Business Environment Policy Advice’ was transferred from the Department of Premier and Cabinet to the Department of Treasury and Finance. The 2015-16 budget papers associated four non-cost performance measures with this output.6 The Committee notes that two of these measures appeared in the department’s 2015-16 Annual Report,7 and that the remaining two measures have been proposed for discontinuation for the financial year 2016-17.8 Please advise:
(a) results, variances and explanations for significant (greater than 5 per cent) variances for these performance measures in the following table:
Performance measure Target 2015-16
Actual 2015-16
Variance (per cent)
Reason for significant (>5%) variance
Completion of inquiry reports and regulatory improvement studies by due date
100 per cent
100 per cent
0 Note: The former Victorian Competition and Efficiency Commission did not receive any terms of reference there were no inquiry reports or regulatory improvement studies.
Number of inquiry reports and regulatory improvement studies submitted to Government
4 0 100 Note: The former Victorian Competition and Efficiency Commission did not receive any terms of reference there were no inquiry reports or regulatory improvement studies.
(b) the reason why these measures have not been included in the Department’s 2015-16 Annual Report
After the abolition of the Victorian Competition and Efficiency Commission (VCEC) in September 2015, the regulation review function was transferred to the newly appointed Commissioner for Better Regulation (the Commissioner), which is supported by the Department of Treasury and Finance. The DTF Annual Report provided information on performance measures that were relevant to the Commissioner's functions, which did not include certain components of the work of the abolished VCEC. The 2016-17 Budget sought to formally discontinue these redundant performance measures.
6 Department of Treasury and Finance, Budget Paper No.3, 2015-16 Service Delivery (2015), pp.312-3 7 Department of Treasury and Finance, 2015-16 Annual Report, p.31 8 Department of Treasury and Finance, Budget Paper No.3, 2016-17 Service Delivery (2016), p.360
20
email rcvd 03/02/2017

Public Accounts and Estimates Committee: 2015-16 Financial and Performance Outcomes – Entity-Specific Questionnaire
Question 14 Previous recommendations For each recommendation in the Committee’s Report on the 2013-14 and 2014-15 Financial and Performance Outcomes (report 5) or Report on the 2012-13 Financial and Performance Outcomes (report 119) that relates to an area relevant to your department or one of its portfolio agencies, please indicate:
(a) whether or not the action specified in the recommendation has been implemented
(b) if so, how it has been implemented and what publicly available information (if any) demonstrates the implementation of the recommendation
(c) if not, why the recommendation has not been implemented, or the intended date of implementation.
Note: recommendations that were not supported by the Government or that have already been determined to be implemented by the Committee have not been included in this list.
Report Recommendation Has the action specified in the recommendation been implemented?
If yes: If no:
What action has the Department taken in order to implement the recommendation?
What publicly available information, if any, shows the implementation?
Why not? When is the intended date of implementation?
5 1 Due to its significant contribution to Victoria’s gross state product, the Department of Treasury and Finance quantify the impact of household consumption on the main budget items via the sensitivity analysis in the budget papers
In progress. A review of the sensitivity analysis chapter is currently underway.
May 2017.
21
email rcvd 03/02/2017

Public Accounts and Estimates Committee: 2015-16 Financial and Performance Outcomes – Entity-Specific Questionnaire
Report Recommendation Has the action specified in the recommendation been implemented?
If yes: If no:
What action has the Department taken in order to implement the recommendation?
What publicly available information, if any, shows the implementation?
Why not? When is the intended date of implementation?
5 2 The Department of Treasury and Finance publish data on the impact of the State’s main economic variables on the public non‑financial corporations sector
In progress. A review of the sensitivity analysis chapter is currently underway. As part of this review, DTF is evaluating the capacity of its macro-models to adequately specify the economic impacts on this sector.
May 2017.
5 3 The Department of Treasury and Finance develop methods to quantify the impact of the State’s main economic variables on the public financial corporations sector
In progress. A review of the sensitivity analysis chapter is currently underway. As part of this review, DTF is evaluating the capacity of its macro-models to adequately specify the economic impacts on this sector.
May 2017.
22
email rcvd 03/02/2017

Public Accounts and Estimates Committee: 2015-16 Financial and Performance Outcomes – Entity-Specific Questionnaire
Report Recommendation Has the action specified in the recommendation been implemented?
If yes: If no:
What action has the Department taken in order to implement the recommendation?
What publicly available information, if any, shows the implementation?
Why not? When is the intended date of implementation?
5 4 Future Annual Financial Reports for the State include discussion of significant variances between budget estimates and actual results for operating expenditure by government purpose classification.
In progress.
The Government’s response to this report was provided in November 2016, after the completion of the 2015-16 Annual Financial Report. Therefore, this recommendation will be actioned, as applicable, as part of the 2016-17 Annual Financial Report in October 2017.
October 2017.
23
email rcvd 03/02/2017

Public Accounts and Estimates Committee: 2015-16 Financial and Performance Outcomes – Entity-Specific Questionnaire
Report Recommendation Has the action specified in the recommendation been implemented?
If yes: If no:
What action has the Department taken in order to implement the recommendation?
What publicly available information, if any, shows the implementation?
Why not? When is the intended date of implementation?
5 5 Transfers greater than $10.0 million by departments between capital and operating expenditure should be explained in annual reports, including:
(c) why the expenditure had been classified as it had been at the time of the budget
(d) why that had changed during the year
(e) the effect of the change on the department’s finances including its net result from transactions
In progress. This recommendation will be implemented in the 2016-17 Model Report.
May 2017.
5 7 The Department of Treasury and Finance disclose expenditure on operating public private partnership projects as a fiscal aggregate in the consolidated comprehensive operating statement in Annual Financial Reports
Under review. As detailed in the Government’s November 2016 response to this recommendation, the definition of key fiscal aggregates and what they include is defined in the Australian accounting standards, with the aggregates focussing on the reporting entities aggregate
24
email rcvd 03/02/2017

Public Accounts and Estimates Committee: 2015-16 Financial and Performance Outcomes – Entity-Specific Questionnaire
Report Recommendation Has the action specified in the recommendation been implemented?
If yes: If no:
What action has the Department taken in order to implement the recommendation?
What publicly available information, if any, shows the implementation?
Why not? When is the intended date of implementation?
financial performance and position.
Further, there is a new Australian Accounting Standard expected to be soon released by the Australian Accounting Standards Board which specifically deals with PPP’s and future PPP disclosures will be revisited in the context of this new standard once effective.
25
email rcvd 03/02/2017

Public Accounts and Estimates Committee: 2015-16 Financial and Performance Outcomes – Entity-Specific Questionnaire
Report Recommendation Has the action specified in the recommendation been implemented?
If yes: If no:
What action has the Department taken in order to implement the recommendation?
What publicly available information, if any, shows the implementation?
Why not? When is the intended date of implementation?
5 8 Future Annual Financial Reports include an actual result or an updated estimate of the value of asset investment carried out by the private sector public private partnership projects during the year. Significant variations from this figure and the initial estimate of public private partnership infrastructure investment should be explained
Completed. The 2015-16 AFR included analysis of Government Infrastructure Investment, rather than Net Infrastructure Investment. There were no significant variances in 2015-16, however, if there are any significant variations these will be included based on the best available information in the context of current contractual arrangements.
Chapter 2, 2015-16 Annual Financial Report.
5 10 Budget updates compiled by the Department of Treasury and Finance include an analysis of reprioritisations and adjustments that are made post-budget, in line with the current reporting methods used for reprioritisations that form part of Budget Paper No.2
Completed. Any post-budget reprioritisation decisions taken by Government are shown in the relevant Budget Update.
26
email rcvd 03/02/2017

Public Accounts and Estimates Committee: 2015-16 Financial and Performance Outcomes – Entity-Specific Questionnaire
Report Recommendation Has the action specified in the recommendation been implemented?
If yes: If no:
What action has the Department taken in order to implement the recommendation?
What publicly available information, if any, shows the implementation?
Why not? When is the intended date of implementation?
5 11 To assist Parliament in its analysis of how movements in ‘specific-purpose grants’ contribute to the overall budget result, the Department of Treasury and Finance should include a breakdown of the major variances in ‘specific-purpose grants’ in the Annual Financial Report in the same way as they appear in the budget papers
In progress. The Government’s response to this report was provided in November 2016, after the completion of the 2015-16 Annual Financial Report. Therefore, this recommendation will be actioned as part of the online data set on the DTF website upon release of the 2016-17 Annual Financial Report in October 2017.
27
email rcvd 03/02/2017

Public Accounts and Estimates Committee: 2015-16 Financial and Performance Outcomes – Entity-Specific Questionnaire
Report Recommendation Has the action specified in the recommendation been implemented?
If yes: If no:
What action has the Department taken in order to implement the recommendation?
What publicly available information, if any, shows the implementation?
Why not? When is the intended date of implementation?
5 12 The Department of Treasury and Finance work with other departments to improve the estimation of completion dates for asset investment projects
Yes. The Department of Treasury and Finance has worked closely with departments to improve the estimation of completion dates of capital projects. This includes measures such as improving the development of project business cases, and enhancing internal performance reporting of projects to Cabinet.
Completion dates will continue to be published in Budget Paper No. 4 of the Annual State Budget.
28
email rcvd 03/02/2017

Public Accounts and Estimates Committee: 2015-16 Financial and Performance Outcomes – Entity-Specific Questionnaire
Report Recommendation Has the action specified in the recommendation been implemented?
If yes: If no:
What action has the Department taken in order to implement the recommendation?
What publicly available information, if any, shows the implementation?
Why not? When is the intended date of implementation?
5 14 The Department of Treasury and Finance ensure that all departments provide data for departmental objective indicators in their annual reports, as required in the Model Report
In progress. DTF will continue to provide guidance and information to support departments in establishing processes to meet these requirements.
In turn, departments annually attest to the Minister for Finance on compliance with relevant ministerial directions under the Financial Management Compliance Framework.
After 2016-17.
29
email rcvd 03/02/2017

Public Accounts and Estimates Committee: 2015-16 Financial and Performance Outcomes – Entity-Specific Questionnaire
Report Recommendation Has the action specified in the recommendation been implemented?
If yes: If no:
What action has the Department taken in order to implement the recommendation?
What publicly available information, if any, shows the implementation?
Why not? When is the intended date of implementation?
5 15 The Department of Treasury and Finance amend the Model Report to require departments to include budgets adjusted for machinery-of-government changes as part of budget portfolio outcomes sections in annual reports, and discuss variations from adjusted figures
In progress. DTF, in consultation with DPC, will develop the necessary changes to WoVG annual reporting frameworks to require reporting the direct costs and outcomes of MoG changes.
May 2017.
30
email rcvd 03/02/2017

Public Accounts and Estimates Committee: 2015-16 Financial and Performance Outcomes – Entity-Specific Questionnaire
Report Recommendation Has the action specified in the recommendation been implemented?
If yes: If no:
What action has the Department taken in order to implement the recommendation?
What publicly available information, if any, shows the implementation?
Why not? When is the intended date of implementation?
5 16 The Department of Treasury and Finance alter the corporate planning guidance for government entities to require initiatives that are identified in planning documents as important to the department’s objectives during the financial year be made public at the start of that financial year
In progress. Relevant chapters of the Performance Management Framework issued by DTF are being revised to require publication of departmental corporate plans and initiatives identified as important to a department’s objectives.
March 2017
5 17 The Department of Treasury and Finance alter its guidance for the ‘initiatives and key achievements’ section of annual reports to require reporting entities to specify which initiatives discussed were identified in planning documents as important to the department’s objectives, and where the department described the initiative prior to the start of the year
In progress. This recommendation will be implemented in the 2016-17 Model Report.
May 2018.
31
email rcvd 03/02/2017

Public Accounts and Estimates Committee: 2015-16 Financial and Performance Outcomes – Entity-Specific Questionnaire
Report Recommendation Has the action specified in the recommendation been implemented?
If yes: If no:
What action has the Department taken in order to implement the recommendation?
What publicly available information, if any, shows the implementation?
Why not? When is the intended date of implementation?
5 19 To consolidate guidance for public sector entities on disclosures relating to public private partnership projects, the Department of Treasury and Finance release a financial reporting directions and guidance document that encompasses all relevant requirements, including those currently in the Model Report
Under review. As detailed in the Government’s November 2016 response to this recommendation, there is a new Australian Accounting Standard expected to be soon released by the Australian Accounting Standards Board which specifically deals with PPP’s and future PPP disclosures will be revisited in the context of this new standard once effective.
This recommendation will be revisited once the new accounting standard, to soon be released by the Australian Accounting Standards Board, dealing with PPP’s becomes effective which is likely to be in the 2019-20 financial year.
32
email rcvd 03/02/2017

Public Accounts and Estimates Committee: 2015-16 Financial and Performance Outcomes – Entity-Specific Questionnaire
Report Recommendation Has the action specified in the recommendation been implemented?
If yes: If no:
What action has the Department taken in order to implement the recommendation?
What publicly available information, if any, shows the implementation?
Why not? When is the intended date of implementation?
5 20 Future versions of the Model Report are adjusted to take into account changes to the risk management framework and processes in the Standing Directions of the Minister for Finance under the Financial Management Act 1994
In progress. The Model Report is published in April or May each year to provide sufficient time for departments to implement any revisions. Each revised Model Report includes transitional provisions to facilitate a smooth implementation of the revisions, including any changes to the risk management framework and processes incorporated in the Standing Directions.
May 2017.
33
email rcvd 03/02/2017

Public Accounts and Estimates Committee: 2015-16 Financial and Performance Outcomes – Entity-Specific Questionnaire
Report Recommendation Has the action specified in the recommendation been implemented?
If yes: If no:
What action has the Department taken in order to implement the recommendation?
What publicly available information, if any, shows the implementation?
Why not? When is the intended date of implementation?
119 1 The Department of Treasury and Finance investigate ways of changing the guidance for entities other than departments to enable the Parliament and other stakeholders to compare the actual revenue for those entities against the original forecasts that were set for the year.
Yes. DTF consider that it would be more appropriate to include a narrative in the State’s AFR in relation to PNFC sector entities to better communicate key variances for the sector against their initial estimates.
Annual Financial Report of the State of Victoria.
34
email rcvd 03/02/2017

Public Accounts and Estimates Committee: 2015-16 Financial and Performance Outcomes – Entity-Specific Questionnaire
Report Recommendation Has the action specified in the recommendation been implemented?
If yes: If no:
What action has the Department taken in order to implement the recommendation?
What publicly available information, if any, shows the implementation?
Why not? When is the intended date of implementation?
119 3 The Department of Treasury and Finance provide a further disaggregation of ‘other operating expenses’ for the public non-financial corporations sector in the Annual Financial Report and in the budget papers to the same level as is disclosed for the general government sector.
In progress. The Government response to this recommendation was to support in principle and include the disaggregation of the “other operating expenditure” for the Public Non-Financial Corporations sector in the on-line data set. This will be provided for in the 2017-18 Budget and the 2016-17 Annual Financial Report.
May 2017.
35
email rcvd 03/02/2017

Public Accounts and Estimates Committee: 2015-16 Financial and Performance Outcomes – Entity-Specific Questionnaire
Report Recommendation Has the action specified in the recommendation been implemented?
If yes: If no:
What action has the Department taken in order to implement the recommendation?
What publicly available information, if any, shows the implementation?
Why not? When is the intended date of implementation?
119 4 The Department of Treasury and Finance provide a further disaggregation of ‘other operating expenses’ for the public financial corporations sector in the Annual Financial Report and in the budget papers to the same level as is disclosed for the general government sector.
In progress. The Government response to this recommendation was to support in principle and include the disaggregation of the “other operating expenditure” for the Public Financial Corporations sector in the on-line data set. This will be provided for in the 2017-18 Budget and the 2016-17 Annual Financial Report.
May 2017.
119 5 To improve understanding of planned investment in departmental minor asset projects, and align disclosures with the public non-financial corporations sector, the Department of Treasury and Finance should also include within the budget papers the aggregate total estimated investment for such projects.
See comments. DTF has examined extending non-financial corporations disclosures to departmental minor asset projects in the budget papers.
Future budget papers will include an explanatory footnote.
36
email rcvd 03/02/2017

Public Accounts and Estimates Committee: 2015-16 Financial and Performance Outcomes – Entity-Specific Questionnaire
Report Recommendation Has the action specified in the recommendation been implemented?
If yes: If no:
What action has the Department taken in order to implement the recommendation?
What publicly available information, if any, shows the implementation?
Why not? When is the intended date of implementation?
As a result of this examination, DTF has concluded that it is not feasible to publish aggregate total estimated investment (TEI) estimates for minor departmental projects. This is because these minor investments are largely of a programmatic and/or recurring nature rather than discrete individual projects approved and known at the time of the publication of the State Budget. While annual expenditure on these projects can be estimated, the TEI (which, for some projects, may involve expenditure beyond one year) cannot be accurately determined in advance. Given the profile of minor departmental asset investments, the published annual
37
email rcvd 03/02/2017

Public Accounts and Estimates Committee: 2015-16 Financial and Performance Outcomes – Entity-Specific Questionnaire
Report Recommendation Has the action specified in the recommendation been implemented?
If yes: If no:
What action has the Department taken in order to implement the recommendation?
What publicly available information, if any, shows the implementation?
Why not? When is the intended date of implementation?
expenditure estimate is a reasonable proxy for the TEI of these projects.
119 10 Government responses supporting the Committee’s recommendations that cite proposed review action include, to the extent possible, specific details of the planned reviews and their associated timelines. This approach would assist the Parliament’s consideration of the responses.
Yes.
When contributing to Government responses supporting PAEC recommendations, DTF seeks to provide detail on when and how the recommendations will be implemented once supported.
Refer to the Government response to the 2013-14 and 2014-15 Financial and Performance Outcomes.
38
email rcvd 03/02/2017

Public Accounts and Estimates Committee: 2015-16 Financial and Performance Outcomes – Entity-Specific Questionnaire
Question 15 Expenses by government purpose classification - General Government (a) With reference to the Department of Treasury and Finance’s online financial dataset, specifically the Consolidated Government Purpose
Classification Data, only actual figures have been provided for the various sub-classification within the government purpose classification. Please provide the budget and revised figures for the sub-classification (table cells highlighted in BLUE), as in the following table:
2013-14* 2013-14* 2013-14 2014-15 2014-15 2014-15 2015-16 2015-16 2015-16
budget(d) revised(d) actual budget(d) revised (d) actual budget(d) revised (d) actual General public services(a) 361 750 1 051 891 969 2 428 1 150 1 176 2 662 Public order and safety 5 491 5 351 5 509 5 913 6 037 5 769 6 128 6 345 6 269 Primary and secondary 9 326 9893 9960 9 765 10812 10724 10 274 University .. .. .. Technical and further education 2 232 2136 2291 2 111 2273 2260 1 980 Other tertiary .. .. .. Other 1 279 915 966 1 098 957 1012 1 170 Education 13 950 12 450 12 837 12 944 13 217 12 974 14 042 13 996 13 424 Acute care institutions 10 304 10277 10166 10 719 10929 11020 11 445 Other health institutions 593 291 296 568 293 293 633 Community health services 2 112 2494 2536 2 217 2584 2715 2 380 Pharmaceutical 330 .. .. 383 .. .. 411 Other 476 1375 1517 483 1458 1397 462 Health 13 982 13 524 13 815 14 437 14 515 14 370 15 264 15 425 15 331 Social security .. .. .. Welfare services 4 112 4049 4129 4 255 4345 4408 4 539 Other .. .. .. Social security and welfare(f) 3 233 3 947 4 112 4 049 4 129 4 255 4 345 4 408 4 539 Housing and community development(b) 1 903 2438 2486 2 457 2625 2188 2 016 Water supply 151 125 125 123 123 125 120 Sanitation and protection of the environment(b) 382 453 429 359 410 404 465 Other community amenities(b) 8 6 6 8 12 10 9
39
email rcvd 03/02/2017

Public Accounts and Estimates Committee: 2015-16 Financial and Performance Outcomes – Entity-Specific Questionnaire
2013-14* 2013-14* 2013-14 2014-15 2014-15 2014-15 2015-16 2015-16 2015-16
budget(d) revised(d) actual budget(d) revised (d) actual budget(d) revised (d) actual Housing and community amenities(g) 2 092 2 167 2 444 3 022 3 046 2 948 3 170 2 727 2 611 Recreational facilities and services 297 268 285 291 264 297 386 Cultural facilities and services 390 386 391 391 383 414 415 Broadcasting and film production .. .. .. Other recreation and culture .. .. .. Recreation and culture 622 655 687 654 676 683 647 711 800 Fuel and energy(b) 20 250 123 183 167 130 185 145 128 Agriculture, forestry, fishing and hunting(b) 839 285 378 362 464 382 376 422 414 Mining, manufacturing and construction 16 .. .. .. .. .. .. .. .. Road transport 2 321 1655 1688 2215 1770 1812 1 661 Water transport 25 .. .. .. .. Rail transport 3 107 4128 4162 3832 4483 4497 4 473 Air transport .. .. .. Communications and other transport 95 57 64 87 60 43 111 Transport and communications 5 535 5 389 5 548 5 840 5 914 6 134 6 313 6 352 6 245
Source: Department of Treasury and Finance, 2015-16 Consolidated Government Purpose Classification Data (2016). Available at <www.dtf.vic.gov.au/Publications/Victoria-Economy-publications/Aggregate-financial-statements>, viewed 9 December 2016
* The amounts for the 2013-14 original published and revised budget were not captured by output in the States financial systems. Hence, the level of granularity requested in the above table is not available in the requested format.
40
email rcvd 03/02/2017

Public Accounts and Estimates Committee: 2015-16 Financial and Performance Outcomes – Entity-Specific Questionnaire
(b) With reference to the Department of Treasury and Finance’s online financial dataset, specifically the Consolidated Government Purpose Classification Data, it has been observed that general public services has been consistently and significantly under-estimated in the Government’s budget papers as shown below.
Consolidated Government Purpose Classification Data - General Public Services
2013-14 2014-15 2015-16
Budget ($ millions) 361 891 1 150
Actual ($ millions) 1 051 2 428 2 662
Variance ($ millions) 690 1 537 1 512
Source: Department of Treasury and Finance, 2015-16 Consolidated Government Purpose Classification Data (2016). Available at <www.dtf.vic.gov.au/Publications/Victoria-Economy-publications/Aggregate-financial-statements>, viewed 9 December 2016
Please provide an explanation for this under-estimation that has occurred between 2013-14 and 2015-16.
In 2013-14 the main reason for the variance relates to the different methodology used for expenses. For the original budget estimates, the allocation methodology used ratios based on historical data and the impact of policy and non-policy estimate variations to determine amounts across different government purpose classifications, whereas actual expenditure was based on actuals data fed by output that is mapped by government purpose classification.
In 2014-15 and 2015-16 the variance largely relates to the change in the classification of interest cost on defined benefit superannuation from the other purposes output to the general public services output, to more correctly reflect this item. This methodology was applied to the 2016-17 budget estimates.
41
email rcvd 03/02/2017

Public Accounts and Estimates Committee: 2015-16 Financial and Performance Outcomes – Entity-Specific Questionnaire
Question 16 Labour market indicators Indicate the budget estimates, and actual results for the following labour market indicators in 2014-15 and 2015-16. Please provide an explanation for the variance.
Budget estimate 2015-16
Actual for 2014-15 Actual for 2015-16 Explanation for variances
Annual hours worked 1.7% growth 1.3% growth 2.2% growth Consistent with stronger than expected employment growth, which was mainly driven by full-time positions, aggregate hours worked grew by 2.2 per cent in 2015-16. This was broadly in line with growth in total employment (2.3 per cent).
Unemployment rate 6.25% 6.4% 5.9% Consistent with stronger than expected employment growth, the unemployment rate fell by more than expected in 2015-16.
Labour force underutilisation rate
N/A 15.2% 14.8% This indicator is not forecast for Budget purposes. The fall in the underutilisation rate in 2015-16 was consistent with an improvement in labour market conditions, with above-trend employment growth, and falls in the unemployment and underemployment rates.
Unemployment rate 6.25 6.4% 5.9% Consistent with stronger than expected employment growth, the unemployment rate fell by more than expected in 2015-16.
Underemployment rate N/A 9.0% 8.8% This indicator is not forecast for Budget purposes. The fall in the underemployment rate was consistent with employment growth being mainly driven by full-time positions in 2015-16.
Youth unemployment rate N/A 15.1% 13.2% This indicator is not forecast for Budget purposes. The fall in the youth (15-24 years) unemployment rate in 2015-16 was driven by above average employment growth for this cohort (2.6 per cent compared with 2.3 per cent for all age cohorts).
42
email rcvd 03/02/2017

Public Accounts and Estimates Committee: 2015-16 Financial and Performance Outcomes – Entity-Specific Questionnaire
Question 17 Labour market programs/initiatives For the following programs/initiatives announced in the 2015-16 Budget, please provide details of the outcomes expected to be achieved and the outcomes actually achieved to date. Please quantify outcomes where possible.
Program/initiative Expected outcomes Actual outcomes
Back to Work Scheme
• The $100 million Back to Work Scheme provided financial assistance to the non-Government sector to increase employment levels in Victoria. It was specifically designed to help get young unemployed, retrenched workers, out-of-trade apprentices, and people who have been looking for work for more than 12 months back to work.
• The scheme is fully subscribed and closed on 18 July 2016, with almost 16,000 payments made to employers taking on disadvantaged jobs seekers since it was introduced in April 2015.
• $15 million has been set aside for dairy workers and automotive workers, who have been affected by the recent downturns in these industries.
• The scheme has also contributed $6 million to the establishment of four pilot interventions in areas of socio-economic disadvantage and workers in transition in Victoria, as well as $15 million to support disadvantaged workers through Jobs Victoria.
Future Industries Fund
• The Department of Economic Development, Jobs, Transport and Resources will provide a response to this question.
• The Department of Economic Development, Jobs, Transport and Resources will provide a response to this question.
Premier’s Jobs and Investment Panel
• The Department of Economic Development, Jobs, Transport and Resources will provide a response to this question.
• The Department of Economic Development, Jobs, Transport and Resources will provide a response to this question.
Regional Jobs Fund
• The Department of Economic Development, Jobs, Transport and Resources will provide a response to this question.
• The Department of Economic Development, Jobs, Transport and Resources will provide a response to this question.
Source: Department of Treasury and Finance, Budget Paper No.2:2015-16 Strategy and Outlook (2015), p.40
43
email rcvd 03/02/2017

Public Accounts and Estimates Committee: 2015-16 Financial and Performance Outcomes – Entity-Specific Questionnaire
Question 18 Education and Training For the following ‘education and training’ actions announced in the 2015-16 Budget, please provide details of the outcomes expected to be achieved and the outcomes actually achieved to date. Please quantify outcomes where possible and indicate what publicly available information (if any) demonstrates the implementation of the actions and actual outcomes intended.
Action Expected outcomes Actual outcomes What publicly available information, if any, shows the implementation?
Comments
Investing significantly in education and skills, including a focus on reskilling workers
Providing $300 million to complete the $320 million TAFE Rescue Fund, helping campuses across the state reopen closed buildings, upgrade workshops and classrooms and become more financially sustainable
Providing young people and displaced workers with opportunities to develop the skills they need to get a job in the
44
email rcvd 03/02/2017

Public Accounts and Estimates Committee: 2015-16 Financial and Performance Outcomes – Entity-Specific Questionnaire
Action Expected outcomes Actual outcomes What publicly available information, if any, shows the implementation?
Comments
industries that will drive Victoria’s future prosperity
Delivering community service obligations and enhancing the regulation of training provider
Source: Department of Treasury and Finance, Budget Paper No.2:2015-16 Strategy and Outlook (2015), p.40
The Department of Education and Training will provide a response to this question.
45
email rcvd 03/02/2017