ptolemy: strategic housing growth scenarios in north west ... · 5.7 impacts on the network around...
TRANSCRIPT

PTOLEMY: Strategic housing growth scenarios in North West Leicestershire North West Leicestershire District Council June 2009
`

QM
Issue/revision Issue 1 Revision 1 Revision 2 Revision 3
Remarks Draft copy for
comment.
Issue 1 Issue 2
Date 10/2/09 18/03/09 05/06/09
Prepared by Jenny Hunt Jenny Hunt
Duncan Forbes
Duncan Forbes
Signature Jenny Hunt Jenny Hunt
Duncan Forbes
Duncan Forbes
Checked by Duncan Forbes Clare Lindsay Clare Lindsay
Signature Duncan Forbes C L F Lindsay C L F Lindsay
Authorised by Duncan Forbes Duncan Forbes Duncan Forbes
Signature Duncan Forbes Duncan Forbes Duncan Forbes
Project number 11642057 11642057 11642057
File reference Draft PTOLEMY NW
Leicestershire
Results Issue
1.doc
PTOLEMY NW
Leicestershire
Results Issue
2.doc
WSP Development and Transportation 66-68 Hills Road Cambridge CB2 1LA Tel: +44 (0)1223 558050 Fax: +44 (0)1223 558051 http://www.wspgroup.com WSP UK Limited | Registered Address WSP House, 70 Chancery Lane, London, WC2A 1AF, UK | Reg No. 01383511 England | WSP Group plc | Offices worldwide

Contents
EXECUTIVE SUMMARY 1
1 Introduction 7
1.1 Background 7 1.2 Introduction and empirical basis to the PTOLEMY model 8 1.3 Definitions 9 1.4 Structure of report 10
2 Model assumptions and inputs 11
2.1 Area-wide assumptions 11 2.2 Summary of the options to be tested 17
3 Common features of the three scenarios 20
3.1 Regional context 20 3.2 The basis for common impacts 20 3.3 Mode share 21
4 Option 1 - Coalville focused dwelling development 23
4.1 Overview 23 4.2 Dwelling inputs 23 4.3 Employment impacts 25 4.4 Impact on household demand 28 4.5 Impact on the number of employed residents 28 4.6 Household car availability 29 4.7 Change in socio-economic profiles within the town 30 4.8 Impact on network traffic 32 4.9 Impacts on highway network around Coalville, Ashby, Castle Donington and
Kegworth 38 4.10 Summary of main impacts of option 1 45
5 Option 2 – Coalville focused dwelling growth with a significant amount of growth in Ashby 46
5.1 Overview 46 5.2 Dwelling inputs 46 5.3 Employment impacts 49 5.4 Impact on the number of employed residents 50 5.5 Household car availability 51 5.6 Impact on network traffic 52

4 4
5.7 Impacts on the network around Coalville, Ashby, Castle Donington and Kegworth 56
5.8 Summary of the main impacts of option 2 60
6 Option 3 – More dispersed development (Coalville, Ashby and Castle Donington) 61
6.1 Overview 61 6.2 Dwelling inputs 61 6.3 Employment impacts 64 6.4 Transport network changes 65 6.5 Impact on household demand 65 6.6 Impact on the number of employed residents 66 6.7 Household car availability 66 6.8 Change in socio-economic profiles within the towns 67 6.9 Impact on network traffic 67 6.10 Impacts on the network around Coalville, Ashby, Castle Donington and
Kegworth 71 6.11 Summary of the main impacts of option 3 85
7 References 86
Appendix A Traffic Validation
Appendix B Zone definitions for reporting land use and transport characteristics
Appendix C Model Run Location Reference
Appendix D TEMPRO Employment Forecasts
Appendices E to G bound in a separate volume

5
LIST OF TABLES
Table 1: PTOLEMY employment sectors 9 Table 2: Exogenous employment in NW Leicestershire 16 Table 3: Economically inactive households in North West Leicestershire 17 Table 4: Employed Residents and Level of employment at the workplace in the 3 cities
sub-region (PTOLEMY study area) 20 Table 5: Dwellings, Employed Residents and Employment in North West Leicestershire
20 Table 6: Average car speed and kms travelled in North West Leicestershire in 2026 21 Table 7: Mode share in 2026 (Option 1) comparing journeys to NW Leicestershire and
the surrounding counties 22 Table 8: Option 1 dwelling growth - change by zone and by aggregated zone 25 Table 9: Employment levels in 2006, 2016 and 2026 in option 1 27 Table 10: Average monthly rent indicator per dwelling (£ in 2001 prices) for 2006 and
2016 and 2026 Option 1 28 Table 11: Employed residents in 2006, option 1 2016 and 2026 and the change over
time 29 Table 12: Employed Households in GSeC 1 31 Table 13: Employed Households in GSeC 2 31 Table 14: Employed Households in GSeC 3 31 Table 15: Employed Households in GSeC 4 32 Table 16: Traffic levels for cars on the network in North West Leicestershire and the
three counties 32 Table 17: Travel statistics for journeys to and from North West Leicestershire 35 Table 18: Car traffic in North West Leicestershire district 35 Table 19: Change in average speed in the district and three counties 37 Table 20: Total delay on roads on North West Leicestershire 38 Table 21: Total car delay on roads in the towns in North West Leicestershire 38 Table 22: Distribution of trips from Coalville in the AM Peak period for 2006 and 2026 40 Table 23: Distribution of trips to Coalville in the AM Peak period for 2006 and 2026 40 Table 24: Total workplace employment by GSeC in Coalville in option 1 41 Table 25: Total employed residents by GSeC in Coalville in option 1 41 Table 26: Distribution of trips to and from Ashby in 2006 and 2026 option 1 in the AM
peak period 42 Table 27: Distribution of trips to M1 J24 SRFI and East Midlands Airport in 2006 and
option 1 2026 45 Table 28: Option 2 dwelling growth - change by zone and by aggregated zone 48 Table 29: Number of employed residents in the towns in North West Leicestershire and
the difference between options 1 and 2 51 Table 30: Delay on the different road types in options 1 and 2 in North West
Leicestershire 55

6 6
Table 31: Total delay on the roads around Coalville, Ashby, Castle Donington and Kegworth 56
Table 32: Distribution of trips from Ashby in 2026 in option 1 and 2 59 Table 33: Distribution of trips to Ashby in 2026 in option 1 and 2 59 Table 34: Option 3 dwelling growth - change by zone and by aggregated zone 63 Table 35: Average monthly rent indicator per dwelling in options 1 and 3 (£ in 2001
prices) 66 Table 36: Employed Residents in options 1 and 3 66 Table 37: Travel statistics on the different road categories in 2016 and 2026 68 Table 38: Network statistics for the differences between options 1 and 3 on the roads in
Coalville 72 Table 39: Travel statistics for trips to Coalville in options 1 and 3 73 Table 40: Distribution of trips to Coalville in 2026 in options 1 and 3 73 Table 41: Travel statistics for trips from Coalville in options 1 and 3 74 Table 42: Distribution of trips from Coalville in 2026 in options 1 and 3 74 Table 43: Travel statistics within Ashby town. Comparison between Options 1 and
3 75 Table 44: Travel statistics for trips to Ashby in options 1 and 3 76 Table 45: Distribution of trips to Ashby comparing option 1 and option 3 76 Table 46: Travel statistics for trips from Ashby in options 1 and 3 77 Table 47: Travel statistics for the town of Castle Donington. Comparison between
options 1 and 3. 79 Table 48: Travel statistics for trips to Castle Donington in options 1 and 3 80 Table 49: Travel statistics for trips from Castle Donington in options 1 and 3 80 Table 50: Distribution of trips to Castle Donington in 2026 in option 1 and 3 81 Table 51: Distribution of trips from Castle Donington in 2026 in option 1 and 3 82 Table 52: Travel statistics for the town of Kegworth. Comparison between options 1
and 3. 82 Table 53: Travel statistics for trips to Kegworth in options 1 and 3 83 Table 54: Distribution of trips to Kegworth in 2026 in option 1 and 3 83 Table 55: Travel statistics for trips from Kegworth in options 1 and 3 84 Table 56: Distribution of trips from Kegworth in 2026 in option 1 and 3 84 Table 57: Distribution of trips to East Midlands Airport and J24 SRFI in 2026 in option 1
and 3 85 Table 58: Comparison between TEMPRO 5.3 and TEMPRO 5.4 by district 105 Table 59: Comparison between TEMPRO 5.3 and 5.4 at county level 105

7
LIST OF FIGURES
Figure 1: The District of North West Leicestershire 7 Figure 2: Highway improvements coded in the 2016 and 2026 network 11 Figure 3: Castle Donington bypass (for option 3) 12 Figure 4: Bus services to the SRFI 12 Figure 5: Total employment in North West Leicestershire in 2006 14 Figure 6: Exogenous employment growth within NW Leicestershire 2006 to 2016 15 Figure 7: Exogenous employment growth within NW Leicestershire 2006 to 2026 15 Figure 8: Total dwelling growth in the three housing options 18 Figure 9: Total dwelling numbers by PTOLEMY zone in 2006 19 Figure 10: Dwelling change 2006 to 2016 23 Figure 11: Dwelling change 2006 to 2026 24 Figure 12: Change in total employment between 2006 and Option 1 2016 26 Figure 13: Change in total employment between 2006 and Option 1 2026 26 Figure 14: Car share in the towns in North West Leicestershire in 2006 and 2026 option
1 30 Figure 15: Change in flow by link between 2006 and option 1 2016 33 Figure 16: Change in flow by link between 2006 and option 1 2026 34 Figure 17: Change in speed by link between 2006 and option 1 2016 36 Figure 18: Change in speed by link between 2006 and option 1 2026 37 Figure 19: Change in speed by link in and around Coalville between 2006 and option 1
2026 39 Figure 20: Change in speed by link in and around Ashby between 2006 and option 1
2026 42 Figure 21: Change in speed by link in and around Castle Donington, Kegworth, East
Midlands Airport and J24 SRFI between 2006 and option 1 2016 43 Figure 22: Change in speed by link in and around Castle Donington, Kegworth, East
Midlands Airport and J24 SRFI between 2006 and option 1 2026 44 Figure 23: Option 2 dwelling change 2006 to 2016 47 Figure 24: Difference in dwelling change between option 1 and option 2 in 2016 47 Figure 25: Option 2 dwelling change 2006 to 2026 47 Figure 26: Difference in dwelling change between option 1 and option 2 in 2026 47 Figure 27: Difference in total employment between options 1 and 2 by zone in 2016 49 Figure 28: Difference in total employment between options 1 and 2 by zone in 2026 50 Figure 29: Household car availability in 2026 option 1 and option 2 52 Figure 30: Difference in flow by link between option 1 and option 2 in 2026 53 Figure 31: Difference in speed by link between option 1 and option 2 in 2026 54 Figure 32: Difference in average speed by zone between option 1 and option 2 in 2026
55

8 8
Figure 33: Difference in speed by link in and around Coalville between option 1 and option 2 in 2026 57
Figure 34: Difference in speed by link in and around Ashby between option 1 and option 2 in 2026 58
Figure 35: Option 3 dwelling change 2006 to 2016 62 Figure 36: Difference in dwelling input in 2016 between Option 1 and Option 3 62 Figure 37: Option 3 dwelling change 2006 to 2026 62 Figure 38: Difference in dwelling input in 2026 between Option 1 and Option 3 62 Figure 39: Difference in total employment between options 3 and 1 by zone in 2016 64 Figure 40: Difference in total employment between options 1 and 3 by zone in 2026 65 Figure 41: Household car availability in options 1 and 3 in 2026 67 Figure 42: Difference in speed by link between option 1 and option 3 in 2026 69 Figure 43: Difference in average speed by zone between option 1 and option 3 in 2026
70 Figure 44: Difference in flow by link in and around Coalville between option 3 and option
1 in 2026 71 Figure 45: Difference in speed by link in and around Coalville between option 1 and
option 3 in 2026 72 Figure 46: Difference in speed by link in and around Ashby between option 3 and option
1 in 2026 75 Figure 47: Difference in flow by link in and around Castle Donington, Kegworth, East
Midlands Airport and J24 SRFI between option 3 and option 1 in 2026 78 Figure 48: Difference in speed by link in and around Castle Donington, Kegworth, East
Midlands Airport and J24 SRFI between option 3 and option 1 in 2026 79

1
Executive Summary
BACKGROUND
WSP were commissioned by North West Leicestershire to carry out a series of runs of the PTOLEMY model in order to test the impacts of three alternative residential development scenarios for the local authority. PTOLEMY is an integrated land use and transport model which was developed by WSP for a consortium of partners including the Highways Agency, Regional Assembly (EMRA) and Development Agency (emda) as well as East Midlands Airport. The model is validated for a base year of 2006 with forecast scenarios being run for 2016 and 2026 in the the AM Peak period.
The district of North West Leicestershire is on the western edge of the PTOLEMY study area with residents looking towards Leicester and other parts of the three cities sub-region as well as travelling to the West Midlands for both employment and recreational purposes. There are three main urban areas within the district:
Coalville to the south east;
Ashby-de-la-Zouch to the west;
Castle Donington and Kegworth to the north.
The M1 motorway runs north-south through North West Leicestershire to the east of Coalville and just to the west of Kegworth, between it and Castle Donington. The impacts of widening the M1 motorway combined with increasing car ownership and longer distance travel through time have a significant impact on the traffic and congestion levels in the authority in the future.
In addition two major development sites are located at the northern end of the district. East Midlands Airport is forecast to grow by 6000 employees in the twenty year period being considered, while the development of a Strategic Rail Freight Interchange with 10,000 employees is proposed for the area - possibly close to junction 24 of the M1 motorway. Both these sites would be major employers drawing a workforce from the wider surrounding area not just locally.
SCENARIOS INVESTIGATED
Three alternative development scenarios were defined for the North West Leicestershire district and assessed using the PTOLEMY model. These scenarios considered variations in levels and patterns of residential development through time within the local authority and included one employment growth scenario for the district. The forecast assumptions for other parts of the three cities study area were held constant across the three scenarios: namely the dwellings assumptions elsewhere remain consistent with those in the East Midlands Regional Plan Proposed Changes (July 2008) and the employment allocations are in line with those in TEMPRO v5.3.
The PTOLEMY model takes as an input the assumed changes in basic employment which are those jobs not providing a service for the local population such as manufacturing, construction and agriculture industries as well as many businesses and head offices. Most of the employment growth in North West Leicestershire is assumed to be located at the airport and the strategic rail freight interchange both in the north of the district. Based on information obtained from TEMPRO and some explicit assumptions provided by North West Leicestershire, there is also assumed to be significant growth in and around Coalville with lower levels of growth in Ashby and Castle Donington as shown in Figure ES1 below. Due to the economic decline of some employment sectors such as agriculture and manufacturing combined with the relocation

to new major development sites, there are some parts of North West Leicestershire where employment levels are assumed to fall.
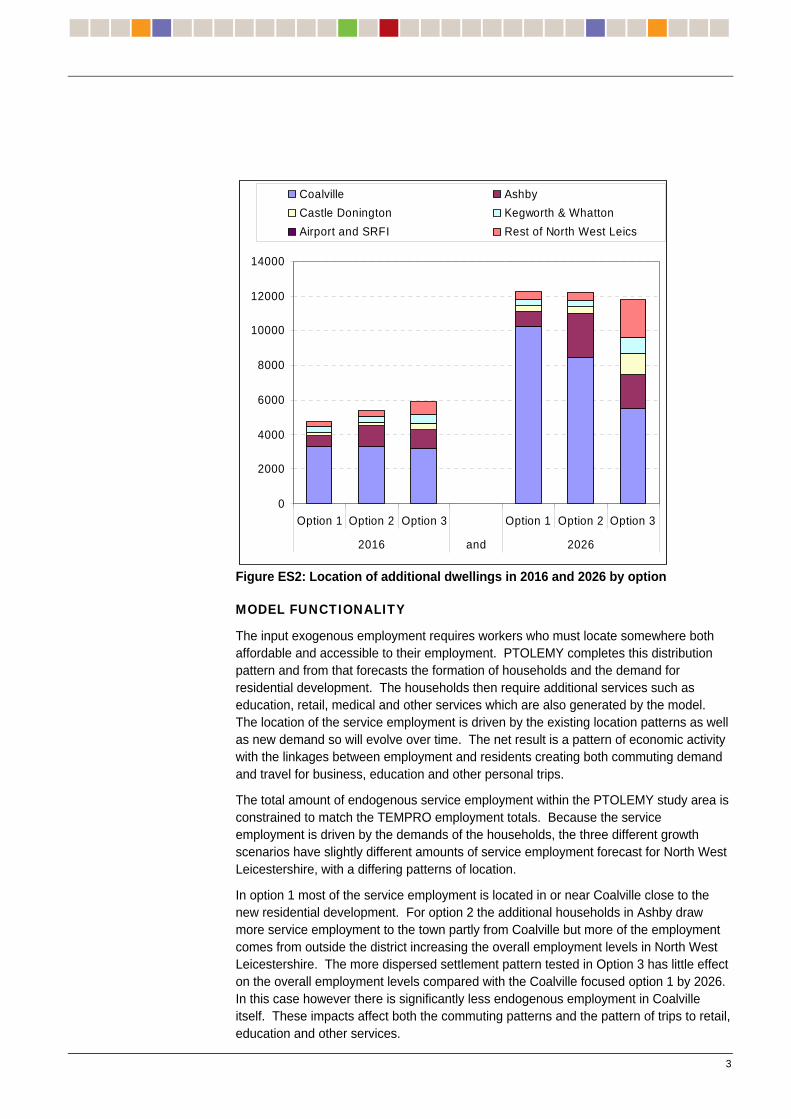
Figure ES1: Input changes in exogenous employment from 2006 to 2026 In all three of the residential development options considered, Coalville is the area with the most growth. The first option focuses 84% of the new dwellings in and around the town, which reduces to 70% of the district growth in option 2 and just under 50%in option 3. The town of Ashby grows more in option 2 while option 3 is more dispersed with some growth in Ashby as well as developments in Castle Donington and Kegworth. The relative growth patterns in the different towns within the district by year can be seen in Figure ES2 below.
The growth in the district is quite different to that for the sub-region as a whole. Employment in the district is forecast to grow more rapidly than the population, however for the three cities as a whole population growth rates are nearly twice those of employment. Comparing the relative development patterns for the residential and commercial development within the district it can be seen that the population is growing more in the south while employment grows more in the northern areas. These changes common to all three scenarios, impact significantly on the travel patterns through time with relatively small variations between the options.
2
0
2000
4000
6000
8000
10000
12000
14000
Option 1 Option 2 Option 3 Option 1 Option 2 Option 3
2016 and 2026
Coalville AshbyCastle Donington Kegworth & WhattonAirport and SRFI Rest of North West Leics
Figure ES2: Location of additional dwellings in 2016 and 2026 by option MODEL FUNCTIONALITY
The input exogenous employment requires workers who must locate somewhere both affordable and accessible to their employment. PTOLEMY completes this distribution pattern and from that forecasts the formation of households and the demand for residential development. The households then require additional services such as education, retail, medical and other services which are also generated by the model. The location of the service employment is driven by the existing location patterns as well as new demand so will evolve over time. The net result is a pattern of economic activity with the linkages between employment and residents creating both commuting demand and travel for business, education and other personal trips.
The total amount of endogenous service employment within the PTOLEMY study area is constrained to match the TEMPRO employment totals. Because the service employment is driven by the demands of the households, the three different growth scenarios have slightly different amounts of service employment forecast for North West Leicestershire, with a differing patterns of location.
In option 1 most of the service employment is located in or near Coalville close to the new residential development. For option 2 the additional households in Ashby draw more service employment to the town partly from Coalville but more of the employment comes from outside the district increasing the overall employment levels in North West Leicestershire. The more dispersed settlement pattern tested in Option 3 has little effect on the overall employment levels compared with the Coalville focused option 1 by 2026. In this case however there is significantly less endogenous employment in Coalville itself. These impacts affect both the commuting patterns and the pattern of trips to retail, education and other services.
3

4
TRAVEL PATTERNS
Since the changes in employment and dwellings are in different parts of the study area, these impact on the trip patterns for both commuting and for discretionary travel to services. In all three scenarios investigated the three main urban areas in NW Leicestershire become less self contained compared with 2006 with a higher proportion of the AM peak trips travelling to areas outside the town where they start. Although the three scenarios lead to different volumes of trips starting in each town, the patterns of travel from the town do not alter significantly.
Looking at trips arriving in each town during the AM peak period, where the residential development is reduced in Coalville fewer trips arriving there also start in the town so this area becomes less self contained. Similarly the increased residential development in Castle Donington does encourage more trips wholly within the urban area. The impact in Ashby is more varied. In Option 2 with more dwellings in Ashby but no growth to the north, the proportion of trips which are within the area increases significantly. However with development in Castle Donington as well (Option 3), this proportion does drop back and where jobs need to be filled the commuters are coming from other more rural parts of the district.
MODE SHARE
There are no rail services directly serving the towns within North West Leicestershire. Public transport provision is thus primarily bus services operating within and feeding each of the urban areas. A majority of trips to / from the district are therefore currently made by car; with walking, cycling and bus trips limited to the shorter more local trips. In 2006, 72% of the morning peak trips to the district are made by car and with increasing incomes and car ownership through time this proportion increases to 74% by 2026 remaining much higher than the 62% of trips by car for the three cities sub-region as a whole. The mode share remains constant across all the scenarios tested since the scenarios investigated did not include any public transport investment.
TRAFFIC, CONGESTION AND DELAY
Traffic growth through time is much greater in North West Leicestershire than in other parts of the three cities area. This is primarily because improvements to the M1 motorway ease congestion and allow more traffic to travel through the area. The road improvements in the area also make the district more accessible with the average trip lengths to and from the district increasing far more rapidly than the volume of trips.
All of the urban areas experience increases in congestion and delay through time, particularly between 2016 and 2026. The impacts in Coalville reduce through the options tested in line with the levels of development. The impacts in Ashby are similar in options 2 and 3 with far more congestion on the routes from the town. Delays in Castle Donington are alleviated by the opening of the bypass which is introduced at the same time as the development. Although the new infrastructure limits the delays to the same levels experienced in the other options, congestion remains higher than the 2006 levels.
Figure ES3 to Figure ES6 below show how the congestion related statistics within each of the major towns alters with the different options.

05
10152025303540
Coalville Ashby CastleDonington
Kegworth
Aver
age
spee
d (k
m/h
r)
2006
2026 Op12026 Op2
2026 Op3
Figure ES3: Average speeds in the AM Peak period
0100002000030000400005000060000700008000090000
Coalville Ashby CastleDonington
Kegworth
Veh
km
s
20062026 Op12026 Op22026 Op3
Figure ES4: Total car traffic in the AM Peak period
0100200300400500600700800
Coalville Ashby CastleDonington
Kegworth
Tota
l del
ay (v
eh m
ins) 2006
2026 Op12026 Op22026 Op3
Figure ES5: Total delay within the major towns in the AM Peak period
0.00.20.40.60.81.01.21.41.6
Coalville Ashby CastleDonington
Kegworth
Dela
y pe
r 100
km
trav
elle
d (m
ins)
20062026 Op12026 Op22026 Op3
Figure ES6: Average delay per km of highway in the AM Peak period
SUMMARY OF THE THREE OPTIONS
Option 1: Coalville focussed development
In this option 84% of the dwelling growth is located in Coalville
Coalville sees significant growth in dwellings and employed residents. These generate significant levels of traffic which a focussed towards Leicestershire and Leicester, rather than the north.
Ashby becomes more isolated from the rest of the district with congestion on the A42 and A511 restricting opportunities to travel to or from the town from the other urban centres within the district. As a consequence the town sees an increase in interaction with the West Midlands via the A42.
Kegworth sees an increase in traffic flows through the town even with the inclusion of the new bypass to the south. The socio-economic profile of its residents declines over time as it becomes attractive for the GSeC3 and 4 employees at the airport and SRFI to locate within the town.
Castle Donington sees increased congestion through the town associated with the economic activity at the airport.
The airport and SRFI draw a significant proportion of their workforce from outside the district of NW Leicestershire, particularly from Nottinghamshire, Derbyshire and external zones. Around 15% of the workforce is likely to come from within the district of NW Leicestershire.
5

6
Option 2: Coalville focussed development plus Ashby
To 2016 this scenario assumes that Coalville grows identically to that in option 1, with additional housing development within Ashby. From 2016 to 2026 the policy reduces the housing growth within Coalville compared to option 1 and substitutes it for growth in Ashby.
Overall the impacts of the different distribution of housing growth are relatively localised with the main impacts seen as slightly reduced congestion in Coalville compared to option 1, and increased congestion in Ashby.
The reduction in the growth in Coalville is not sufficient to have a significant impact on the congestion within the town.
Ashby continues to appear to be isolated from the rest of the district, and like in option 1 continues to have a significant interaction with the West Midlands via the A42.
Option 3: More distributed growth with significant development within Coalville
This is the most dispersed development pattern tested having 47% of the housing growth occurs in Coalville, with the remainder distributed around the district.
The distribution of dwelling growth in a more uniform pattern around the district has had little impact on the overall levels of traffic and delay within the district.
The impacts, where they occur, are more local with the reduced dwelling growth in Coalville resulting in less congestion than in option 1, whilst Ashby and Kegworth experiences more congestion.
The bypass at Castle Donington acts to reduce congestion within the town, however congestion on roads leading to it from the north and the south increases
The reduction in housing growth within Coalville compared to option 1 has not caused any housing pressure within the town as the demands for housing have been met from elsewhere in the district.

1 Introduction Introduction
1.1 BACKGROUND 1.1 BACKGROUND
1.1.1 WSP have been commissioned by North West Leicestershire District Council to run the PTOLEMY land use and transport model to compare the impacts of three alternative housing growth scenarios for the local authority.
1.1.1 WSP have been commissioned by North West Leicestershire District Council to run the PTOLEMY land use and transport model to compare the impacts of three alternative housing growth scenarios for the local authority.
1.1.2 This report presents the findings of these tests which have been undertaken in the forecast years of 2016 and 2026 with the transport analysis undertaken in the morning peak period (7am to 10am).
1.1.2 This report presents the findings of these tests which have been undertaken in the forecast years of 2016 and 2026 with the transport analysis undertaken in the morning peak period (7am to 10am).
1.1.3 North West Leicestershire, as its name suggests, is located in the North Western side of the county bordering on to the counties of Derbyshire and Nottinghamshire. Its administrative centre is located in the town of Coalville with other major towns at Ashby-de-la-Zouch, Castle Donington and Kegworth and numerous smaller towns and villages distributed throughout the district (see Figure 1).
1.1.3 North West Leicestershire, as its name suggests, is located in the North Western side of the county bordering on to the counties of Derbyshire and Nottinghamshire. Its administrative centre is located in the town of Coalville with other major towns at Ashby-de-la-Zouch, Castle Donington and Kegworth and numerous smaller towns and villages distributed throughout the district (see Figure 1).
Figure 1: The District of North West Leicestershire
1.1.4 In 2006, Coalville has a population of around 35,000 people whilst the town of Ashby is around one third the size, with a population of 11,500. Castle Donington has a population of about 7,000 and Kegworth 4,500. Approximately one third of the population of the district (31,000) live outside these larger towns.
1.1.5 Nottingham East Midlands airport is located towards the northern end of the district, adjacent to the M1. Both its freight and passenger business has grown
7

8
significantly since the turn of the century and is forecast to grow considerably over the next 20 years.
1.1.6 The M1 (between junction 22 at Coalville and junction 24) and the A42 are the main routes that pass within the district, both carrying a significant amount of through traffic. The A511 through Coalville and Ashby together with the A512 and A447 are the most significant A class roads within the district.
1.1.7 The railway from Leicester to Coalville, Ashby and Burton is currently open to freight traffic only, and with no other lines or stations within the district the opportunities for rail travel are limited. There has been discussion regarding the opening of the line from Leicester to Burton to passengers, although this has not been considered in these tests.
1.1.8 Adjacent to the airport at junction 24 of the M1 is the proposed site of a Strategic Rail Freight Interchange (SRFI). Once developed this is forecast to be a major employer within the district employing around 10,000 workers by 2016. This development is included in all the options tested.
1.2 INTRODUCTION AND EMPIRICAL BASIS TO THE PTOLEMY MODEL
1.2.1 PTOLEMY is a strategic, integrated land use and transport model that covers the 3-cities sub-region of the East Midlands. This area encompasses Leicestershire and large parts of Nottinghamshire and Derbyshire including the unitary authorities of Leicester, Nottingham and Derby.
1.2.2 Within North West Leicestershire the model consists of 20 zones that are defined primarily from wards, and in the more rural areas combinations of wards.
1.2.3 The primary purpose of PTOLEMY is to support the development of sub-regional spatial, economic and transport policies and Local Development Frameworks in the Three Cities area. PTOLEMY was developed on behalf of the Highways Agency (HA) and a partnership of regional and local authorities with responsibilities for planning, transport and economic development of the area. The initiative is the product of an active regional partnering arrangement which aims to develop a joined-up approach to transport and development issues.
1.2.4 The PTOLEMY model has been calibrated for the Census Year 2001 using the main existing land use and transport datasets available in the 3 Cities Sub-region. It is then run forward in forecasting mode to 2006 for model validation, see Appendix A. The model year 2006 is known as the base year of the model, and is the year against which comparisons of future year tests can be made. From the 2006 base year the model is run forward to 2016 and then to 2026 using user specified input assumptions (such as the Core Strategy housing options and their associated transport mitigation measures). These assumptions can be grouped to form different test scenarios.
1.2.5 The version of the model used for these tests is based on the version used for the 6C’s TIF Management Study but incorporates a revision of the zoning to improve the local modelling capabilities which should benefit the model runs particularly within Coalville, Whitwick and Ashby.

9
1.3 DEFINITIONS
Households, population and workers
1.3.1 The socio-economic group of the population provides a convenient way to identify individuals and households within PTOLEMY. GSeC (Grouped Socio-economic Classification) is used in PTOLEMY which is based upon the National Statistics Socio-economic Classification (NS-SeC).
1.3.2 GSeC is split into seven categories as described below:
GSeC1: Higher managerial and professionals. e.g. accountants, lawyers, senior managers and engineers etc
GSeC2: Lower managerial and professionals. e.g. teachers, secretaries, etc
GSeC3: Small employers and lower supervisory staff. e.g. plumbers, electricians, owners of small shops or businesses, etc
GSeC4: Semi routine and routine workers. e.g. construction workers, shop workers, bar staff , etc
GSeC5: The economically inactive
GSeC6: The retired
GSeC7: Student households
Employment
1.3.3 PTOLEMY separates employment into 10 broad sectors based on the Standard Industrial Classification- SIC (2003) as shown in Table 1. This segmentation allows the model to take into account the growth and decline of individual sectors of the economy such as the growth of the finance sector, and the decline of agriculture that has been observed over the past decade.
Table 1: PTOLEMY employment sectors PTOLEMY Industry
PTOLEMY industry description
1 Agriculture, forestry and fishing
2 Mining, manufacturing and utilities
3 Construction
4 Transport, storage and communication
5 Retail, catering and repairs
6 Finance and business services
7 Office employment in non-office sectors - of 1 to 6
8 Education
9 Govt and compulsory public services
10 Other services

10
1.4 STRUCTURE OF REPORT
1.4.1 Section 2 of the report will provide details of the input assumptions including assumptions that that are common to all the options to be tested. The options tested are also described in more detail in this section.
1.4.2 Outputs that are common to all the tests will then be presented in Section 3. In Sections 4 to 6 each option will be examined in turn looking at the impacts travel behaviours within the district.

2 Model assumptions and inputs
2.1 AREA-WIDE ASSUMPTIONS
2.1.1 PTOLEMY has a number of assumptions affecting both the land use and transport components of the model. This section sets out the main assumptions for the 3 cities area to which the North West Leicestershire scenarios are added.
Transport
2.1.2 The changes in transport supply being modelled in the sub-region for 2016 were agreed during the work on the 3 cities TIF in autumn 2006 and are summarised in WSP (2009a). The most significant changes that impact North West Leicestershire relate to the widening of the M1 and remodelling of junctions around J23 and J24 including the Kegworth bypass (see Figure 2 in pink) and improvements to the A453 (Figure 2 in blue).
Figure 2: Highway improvements coded in the 2016 and 2026 network Changes are highlighted in pink and blue
2.1.3 As the transport planning horizon did not extend beyond 2016 the assumptions were carried forward to 2026 without revision. For the tests undertaken in North West Leicestershire a number of revisions were required, see WSP (2009b). The schemes included are:
Bardon bypass, Coalville. (no revisions were included in PTOLEMY as this is a road realignment and will not change the road capacity)
Castle Donington bypass (see Figure 3) This is only included in option 3
11

12
Figure 3: Castle Donington bypass (for option 3)
© Crown copyright, All rights reserved. 2009 Licence number 0100031673
Figure 4: Bus services to the SRFI Figure 4: Bus services to the SRFI
2.1.4 For the SRFI public transport improvements included a tram link from East Midlands parkway station and free bus services for employees at the site. Figure 4 shows the services together with the frequency.
2.1.4 For the SRFI public transport improvements included a tram link from East Midlands parkway station and free bus services for employees at the site.
Employment levels and growth Employment levels and growth
2.1.5 In PTOLEMY the employment is split into two types: 2.1.5 In PTOLEMY the employment is split into two types:
Figure 4 shows the services together with the frequency.
Burton
2 buses/h
Loughborough
Nottingham
Derby
4 buses/h
2 buses/h
2 buses/h
6 buses/h
2 buses/h
2 buses/h

13
The exogenous employment, also called basic employment, is employment associated with businesses which have their product and service markets beyond the local areas in the sub-region. This is processed externally and input directly to the model by zone.
The endogenous employment, known as local service employment, whose activities are orientated to the local population, are treated as a separate group of industries from the exogenous employment and created internally by the model.
2.1.6 As explained earlier PTOLEMY separates employment into 10 broad categories based on the Standard Industrial Classification – SIC (2003), which can be individually adjusted by zone. In the absence of specific inputs the model determines the levels of growth in the forecast years based upon TEMPRO 5.31. Appendix D contains a summary of differences in employment forecasts between TEMPRO 5.3 and 5.4.
2.1.7 The following technical assumptions have been made in translating the TEMPRO projections to employment growth inputs for PTOLEMY at the model zone level:
We assume that the growth rate for employed persons is the same as that for jobs.
For exogenous employment (ie that employment that is specified outside of the model), the employment growth assumptions follow the TEMPRO growth rates for each industry segment, by model zone. Because the TEMPRO geographic zones are generally larger than the PTOLEMY model zones, the growth rate of each TEMPRO geographic zone applies to all model zones contained within it.
For endogenous employment (ie that employment, mainly service sector related, that is determined by the model), the employment growth assumptions follow the TEMPRO growth rates for each industry segment for the study area as a whole. The distribution of this employment among the model zones is forecast by the model, from 2006 onwards.
As the TEMPRO categories for jobs are not exactly the same as the definitions of industry types in PTOLEMY, for each PTOLEMY employment type we adopt the growth pattern for the nearest TEMPRO job category.
As there is a discrepancy between the segmentation of industries, after projecting the employment of the industry segments using individual growth rates, an overall minor adjustment is made to ensure that the overall rate of employment growth matches that of TEMPRO jobs for the study area as a whole.
2.1.8 There are two major sites which are excluded from the district growth totals, both of which are in North West Leicestershire: the SRFI at junction 24, and East Midlands Airport. If growth within the district including these two sites was constrained to TEMPRO levels, then the model would remove significant levels of employment from else where in the district to ensure the match. On the basis of no further evidence the airport and SRFI employment growth are included as an additional amount in excess of that forecast in TEMPRO.
1 It should be noted that TEMPRO provides projections of jobs, whilst PTOLEMY measures employment in terms of 'employed persons' (i.e. same as the Census). There is usually a small discrepancy between the number of jobs and employed persons due to the difference in definitions

2.1.9 The exogenous employment at the main employment growth sites in North West Leicestershire District are in the following sectors:
East Midlands Airport: retail, catering and repairs; office employment in non-office sectors, government and public services and other services (5, 7, 9 and 10).
J24 SRFI: transport, storage and communication; retail, catering and repairs; finance and business services; office employment in non-office sectors; and other services (4, 5, 6, 7 and 10).
Coalville (zone 920): retail, catering and repairs; finance and business services; and office employment in non-office sectors (5, 6 and 7)
2.1.10 Figures for exogenous growth in Coalville were provided by North West Leicestershire District Council. There are 25 hectares of new employment land predicted in zone 920 which has been split between employment categories in PTOLEMY as 50% finance and business services, 25% retail, catering and repairs and 25% office employment in non-office sectors. This equates to 945 new jobs in total in the zone between 2006 and 2016 (30% of total) and a further 2206 (70%) between 2016 and 2026 (3151 in total over the twenty years).
2.1.11 The additional jobs created in the three specified employment categories in zone 920 had to be counteracted in the model by implementing a reduction in growth elsewhere in the same industries within the district so that the district total remains in line with the TEMPRO growth, therefore the remaining areas in the district see a decline in the number of workers, particularly in 2026 since 70% of the employment created in Coalville becomes available in that year.
2.1.12 The total employment in 2006 within the district is shown in Figure 5.
Figure 5: Total employment in North West Leicestershire in 2006
14

2.1.13 Figure 6 and Figure 7 below show the level of exogenous employment growth by zone from 2006 to 2016 and 2026 respectively which is input to all three options tested. This shows the high level of growth at the airport and SRFI to the north relative to the rest of the district.
Figure 6: Exogenous employment growth within
NW Leicestershire 2006 to 2016 Colours represent the percentage change in employment whilst the number indicates the absolute change.
Figure 7: Exogenous employment growth within NW Leicestershire 2006 to 2026 Colours represent the percentage change in employment whilst the number indicates the absolute change.
2.1.14 The basic (exogenous) employment is identical in all three options, whilst the service (endogenous) industries which are calculated by the model will differ between the options being driven by the needs of the population.
2.1.15 Table 2 shows the split of the exogenous employment within North West Leicestershire. The decline in agriculture, mining and construction can be seen. The large levels of growth in transport, retail, office and government services are primarily associated with the airport and the SRFI.
15

16
Table 2: Exogenous employment in NW Leicestershire PTOLEMY
Industry Description 2006 Change to
2016 Change to
2026 1 Agriculture, forestry & fishing 429 -38% -52%2 Mining, manufacturing and utilities 8,635 -4% -5%3 Construction 2,828 -4% -5%4 Transport, storage and
communication 4,556 145% 144%
5 Retail, catering and repairs 4,816 38% 53%6 Finance and business services 4,088 15% 23%7 Office employment in non-office
sectors - Occupations: professional & administrative (2 to 4)
7,579 65% 91%
8 Education 908 -5% 4%9 Government and compulsory public
services 608 47% 89%
10 Other services 1,177 76% 151%Total Total 35,624 41% 52%
2.1.16 The endogenous employment which is generated by the model depends on the population living in each zone, which also depends on the number of dwellings and mixture of household types within that zone. Therefore the increases in dwellings implemented for these test for each zone will cause corresponding increases in the endogenous or local service employment in the local area.
2.1.17 As with the dwelling growth distribution, the overall employment growth is provided at the beginning of the relevant section for each option tested.
Dwelling growth
2.1.18 The dwellings numbers are determined from the Census in 2001, with growth to 2006 obtained from the Regional Spatial Strategy (RSS) monitoring reports. The East Midlands Regional Plan Proposed Changes, EMRA (2008), provides the proposed growth from 2006 to 2026.
For period 2001-2006--Regional Spatial Strategy (RSS) Monitor Report 05/06 together with the associated spreadsheet provides the dwelling net change per year from 2001 to 2006 in each district and unitary authority.
For period 2006-2016 and 2016-2026 -- Part 1 of Regional Strategy Policy 13 in the East Midlands Regional Plan Proposed Changes (EMRA, 2008) provides the annual dwelling growth targets by periods (2001-2006, 2006-2011, 2011-2016 and 2016-2026) in each district and unitary authority; Part 2 of Sub-regional Strategies Policy Three Cities SRS 3 in the East Midlands Regional Plan Proposed Changes (EMRA, 2008) elaborates further planned housing growth at sub-district level.
Out commuting
2.1.19 Out-commuting trips are produced by people living inside the 3 cities study area and travelling outside for work. The number of out-commuters are estimated, and

17
provided as an input to the model. The figures in 2001 are derived from Census Journey-to-work tables. The growth to future years is projected based upon the past trend between 1991 and 2001. Based on total employment, residents in study area, and the number of out-commuters, the model then calculates the total number of in-commuters (people who live outside the sub-region, but who work inside).
Non-employed households
2.1.20 The non-employed households, which include student households, retired household and households with the household reference person not in any employment, are estimated outside of the model, rather than endogenously created by model. In 2006 they make up around 30% of the total number of households. The numbers in each category are determined in 2001 from the Census and applied to each PTOLEMY zone; they are then scaled using the district level growth from TEMPRO to 2016 and 2026. Each option tested will have an identical assumption as to the number of non-employed households in each zone.
Table 3: Economically inactive households in North West Leicestershire 2006 Change
to 2016 Change to 2026
GSeC 5 Unemployed 2,392 8% 22% GSeC 6 Retired 8,713 7% 18% GSeC 7 Student 145 -1% -14%
Population growth
2.1.21 For the future years, the population projections from TEMPRO (which are in turn based on GAD and ONS projections) have been used as Study Area control totals to modify the households-population coefficients to ensure that the population growth in the study area match those forecast from TEMPRO.
2.2 SUMMARY OF THE OPTIONS TO BE TESTED
2.2.1 Three scenarios have been modelled -these are known as options 1, 2 and 3. The main difference between the three options is the distribution of new dwellings within district.
Option1: Coalville focussed development. This will be slower to bring forward, and there will be less development in 2016 than the other options.
Option2: Significant Coalville development plus remainder of allocation in the rest of the district.
Option3: Dispersed development. This will be smaller sites that will come forward earlier, and therefore there will be a larger amount of development to 2016.
2.2.2 In analysing the outputs option 1 will be compared to the situation in 2006, whilst options 2 and 3 will be compared with option 1.

2.2.3 The dwelling growth figures were provided by North West Leicestershire council and are based on current planning permissions and three different growth strategies for the district. Figure 8 shows the total dwelling growth by 2016 and 2026 for the three scenarios. For option 1 the growth from 2006 to 2016 represents a 13% increase in dwellings, whilst from 2006 to 2026 the increase is 31%.
01000
200030004000
5000600070008000
90001000011000
1200013000
2016 2026
Modelled Year
Grw
oth
in th
e nu
mbe
r of
dwel
lings
com
pare
d to
200
6
Option 1Option 2Option 3
Figure 8: Total dwelling growth in the three housing options
2.2.4 These were added to the 2006 base year dwelling numbers in the PTOLEMY model which have been obtained from the yearly net dwelling changes in the Annual monitoring reports produced by EMRA for 2001 to 2006. Figure 9 shows the dwelling totals for NW Leicestershire in 2006 by PTOLEMY zone.
18

Figure 9: Total dwelling numbers by PTOLEMY zone in 2006
2.2.5 The dwelling figures within the remainder of the PTOLEMY study area are taken from the predicted growth in the East Midlands Regional Plan proposed changes (EMRA, 2008). Details of the location of the dwelling growth in each scenario are provided in the appropriate section of this report.
19

20
3 Common features of the three scenarios
3.1 REGIONAL CONTEXT
3.1.1 The 3 cities sub region has a population of around 2.3 million in 2006 and is forecast to increase by around 5% to 2016 and 10.5% to 2026. From this population there were in 2006 around 1 million residents in either full-time or part-time employment; this is forecast to rise by around 9.9% to 2016 and 19.5% to 2026. In the same period the level of employment is forecast to only rise by 7.1% to 2016 and 10.9% to 2026. With this imbalance there will be a net increase in the number of workers forced to find employment outside of the sub-region. See Table 4.
Table 4: Employed Residents and Level of employment at the workplace in the 3 cities sub-region (PTOLEMY study area)
3 cities sub-region 2006 2016 (Option 1) 2026 (Option 1)
Employed residents 1,013,429 1,113,546 9.9% 1,210,889 19.5%
Employment 1,006,454 1,078,461 7.1% 1,116,969 10.9%
3.2 THE BASIS FOR COMMON IMPACTS
3.2.1 Although the distribution of dwelling growth varies between the scenarios there are several significant changes that impact the region and the district as a whole independently of exactly where the households are located.
3.2.2 Housing growth within the district increases the total number of dwellings to 45,875 in 2016 in Option 1 (Option2 and 3 are similar) allowing the number of employed residents as forecast by the model to increase to 49,880 (see Table 5). In the same period the amount of employment rises from around 45,000 to just over 60,000. It can be seen that in 2006 there is a slightly more employment compared to residents meaning that there is a requirement for workers from outside the district to commute here to work even if most residents worked locally. In 2016 this has been exacerbated by the growth at the airport and the SRFI meaning that there are around 10,000 more workplaces than residents of the district. These workplaces can only be filled by people travelling from outside the district to fill the jobs. By 2026 this imbalance has been reduced although there are still around 6,000 more jobs than workers. This pattern is common to all the options tested.
Table 5: Dwellings, Employed Residents and Employment in North West Leicestershire North West Leicestershire 2006 2016 2026 Dwellings 40,756 45,875 13% 53,367 31%Employed residents 43,438 49,880 15% 59,308 36%Employment 44,936 60,208 34% 65,350 45%
3.2.3 The impact of this is that whilst the different options do affect the local travel patterns within the district, there is still an over-riding need to travel from outside to service the employment.
3.2.4 This basic pattern is repeated for all three scenarios and is part of the reason that the A42 and M1 show considerable increases in traffic demand over time. The widening of the M1 also attracts extra traffic as the capacity increases, reducing congestion and making the road more attractive to use. This can be seen in Table 6 for option 1 (option 2 and 3 are very similar) showing that for the motorway within NW

21
Leicestershire (ie the M1) the average speed has increased by 4% between 2006 and 2026, despite the car traffic increasing by 81%.
3.2.5 In 2006 before the widening of the M1, the congestion on the NW Leicestershire section of the M1 is largely associated with the section between J23 and J24 with other sections relatively free flowing.
3.2.6 The M1 widening provides an additional 30% capacity, and also the free-flow motorway speed is increased from 66mph to 70mph (a 7% increase) to reflect the improvements to the junctions that are proposed.
3.2.7 In addition between J23 and J24 the A453 is improved, again with more capacity, enhancing the parallel route between the junctions and reducing the load on the J23 to J24 section of the M1.
3.2.8 The result is that the M1 becomes more evenly congested in 2026, rather than primarily congested in the J23/J24 area allowing traffic volume to increase with a reduced impact on the average road speed.
3.2.9 It could be argued that the free-flow speed of the M1 should not have been increased, but with the limited information available to us it was decided to include a small benefit to reflect the improvements to the junctions.
3.2.10 The A roads for which the A42 makes up a significant proportion do not benefit from the capacity increase and the total traffic increases by 57% to 2026 causing the average speed on A roads to fall by 10%.
Table 6: Average car speed and kms travelled in North West Leicestershire in 2026 Average Car Speed kph Total car-km 2026 Op1 2026 Op1 Roads within N W Leicestershire 2006 Value Vs 2006 2006 Value Vs 2006
Motorway 86 89 4% 247,446 447,139 81%A roads 51 46 -10% 319,350 500,952 57%B Roads 54 49 -9% 39,188 55,178 41%Minor roads 31 30 -2% 97,924 152,663 56%All roads 54 53 -3% 703,908 1,155,932 64%
3.3 MODE SHARE
3.3.1 For longer journeys that cannot be undertaken by walking or cycling the option to use public transport in North West Leicestershire is fairly limited. There are no rail services within the district, with the best opportunities for rail travel occurring between the East Midlands Parkway railway station and the SRFI or the airport. Table 7 compares the modelled mode share of journeys in the AM peak period to NW Leicestershire against the surrounding counties. This shows the dominance of car journeys within NW Leicestershire with around 74% of journeys to the district being undertaken by car. The different options on the distribution of housing were not tested with any public transport improvements and did not have a noticeable effect on the overall modal distribution.

22
Table 7: Mode share in 2026 (Option 1) comparing journeys to NW Leicestershire and the surrounding counties Trip Destination Bus /
Coach Car Train Walk /
cycle NW Leicestershire 5% 74% 1% 20% Rest of Leicestershire 9% 62% 1% 28% Nottinghamshire 9% 61% 1% 29% Derbyshire 7% 63% 1% 29% Three cities sub-region 8% 62% 1% 29%

4 Option 1 - Coalville focused dwelling development
Option 1 - Coalville focused dwelling development
4.1 OVERVIEW 4.1 OVERVIEW
4.1.1 In the first scenario option tested the dwelling growth is focused in Coalville with less growth occurring before 2016 but slightly higher total development by 2026 than the other two options considered.
4.1.1 In the first scenario option tested the dwelling growth is focused in Coalville with less growth occurring before 2016 but slightly higher total development by 2026 than the other two options considered.
4.1.2 This section will set out the dwelling and employment model inputs for this scenario and will then discuss the results from the 2016 and 2026 runs will be compared to the 2006 base run. The effects on the road network in the district and more locally in the towns of Coalville, Ashby-de-la-Zouch, Castle Donington and Kegworth and associated changes in the demography will be studied.
4.1.2 This section will set out the dwelling and employment model inputs for this scenario and will then discuss the results from the 2016 and 2026 runs will be compared to the 2006 base run. The effects on the road network in the district and more locally in the towns of Coalville, Ashby-de-la-Zouch, Castle Donington and Kegworth and associated changes in the demography will be studied.
4.2 DWELLING INPUTS 4.2 DWELLING INPUTS
4.2.1 Option 1 would see around 84% of the new development to 2026 in NW Leicestershire being in Coalville including one or more Sustainable Urban Extensions. There would be small developments in rural towns (approx 12%) split between Ashby, Castle Donington, Ibstock, Kegworth, with the remaining 4% distributed around the remainder of the district.
4.2.1 Option 1 would see around 84% of the new development to 2026 in NW Leicestershire being in Coalville including one or more Sustainable Urban Extensions. There would be small developments in rural towns (approx 12%) split between Ashby, Castle Donington, Ibstock, Kegworth, with the remaining 4% distributed around the remainder of the district.
4.2.2 Figure 10 and Figure 11 show the patterns of dwelling growth to 2016 and 2026 respectively while Table 8 shows the detailed changes assumed for each model zone.
4.2.2 Figure 10 and Figure 11 show the patterns of dwelling growth to 2016 and 2026 respectively while Table 8 shows the detailed changes assumed for each model zone.
Figure 10: Dwelling change 2006 to 2016 Colours represent the percentage growth whilst the number indicates the absolute change in the number of dwellings.
23

Figure 11: Dwelling change 2006 to 2026 Colours represent the percentage growth whilst the number indicates the absolute change in the number of dwellings. 4.2.3 Option 1 sees high percentage growth mainly in the Coalville area but also pockets of high percentage growth in part of Castle Donington (zone 373) but from a low base.
4.2.4 The growth in Kegworth and Whatton and Ibstock is all completed by 2016 whereas the growth in Ashby, Castle Donington and Measham continues to 2026.
4.2.5 The growth in the different parts of Coalville varies in rate but there are very large increases in both the number and percentage of dwellings in Whitwick (zone 579) and Hugglescote (zone 920) between 2016 and 2026.
4.2.6 In overall numbers the dwelling growth in Coalville completely eclipses the growth in the rest of the district.
24

25
Table 8: Option 1 dwelling growth - change by zone and by aggregated zone
Agg
rega
ted
Zone
Zone
Num
ber
Zone
Nam
e
2006
Tot
al
Dw
ellin
gs
2006
-201
6 A
bsol
ute
Gro
wth
2006
-201
6 Pe
rcen
tage
G
row
th
2006
-202
6 A
bsol
ute
Gro
wth
2006
-202
6 Pe
rcen
tage
G
row
th
354 Snibston 2298 927 40% 1492 65%355 Greenhill 2909 32 1% 286 10%578 Thringstone 1874 177 9% 542 29%579 Whitwick 2959 491 17% 2492 84%918 Bardon 1192 468 39% 468 39%919 Coalville 2187 287 13% 287 13%920 Hugglescote 2004 908 45% 4705 235%
Coalville
Coalville Total 15422 3290 21% 10272 67%777 Ashby Castle 1107 156 14% 317 29%778 Ashby Holywell 2021 374 19% 374 19%779 Ashby Ivanhoe 1948 119 6% 119 6%Ashby
Ashby Total 5076 649 13% 810 16%372 Castle Donington 2896 90 3% 90 3%373 Castle
Donington2 131 100 76% 275 210%Castle Donington
Castle Donington Total 3027 190 6% 365 12%
Kegworth 368 Kegworth &
Whatton 2025 335 17% 335 17%
370 NEM Airport 0 0 0% 0 0%371 SRFI 0 4 n/a 4 n/aAirport and SRFI Airport and SRFI total 0 4 n/a 4 n/a350 Ibstock&Heather 2992 136 5% 136 5%351 Measham 5234 127 2% 301 6%352 Moira 2118 22 1% 22 1%353 Valley 1787 20 1% 20 1%367 Breedon 1049 11 1% 11 1%
Rest of North West
Leicestershire Rest of North West Leicestershire Total
13180 316 2% 490 4%
Total 38731 4784 12% 12276 32%(For location of zones see Figure B.1 in 7Appendix B) 4.3 EMPLOYMENT IMPACTS
4.3.1 The employment change displayed in Figure 12 and Figure 13 is the total employment change which occurs in the model between 2006 and 2016 and 2006 and 2026. The levels of employment are shown in Table 9. This total is a sum of the exogenous employment which has been input to the model (as set out in Section 2.1) and the endogenous employment which the model has forecast.

Figure 12: Change in total employment between 2006 and Option 1 2016 Colours represent the percentage change in employment whilst the number indicates the absolute change.
Figure 13: Change in total employment between 2006 and Option 1 2026 Colours represent the percentage change in employment whilst the number indicates the absolute change.
26

27
Table 9: Employment levels in 2006, 2016 and 2026 in option 1
Zone Name 2006 refv8
2016v4 OP1 Change %
change 2026 op1v1 Change %
change Coalville 14,996 16,607 1,611 11% 19,418 4,422 29%Ashby 8,380 8,857 477 6% 8,574 194 2%Castle Donington 4,800 4,977 177 4% 4,860 60 1%Kegworth 2,059 2,128 69 3% 2,023 -36 -2%SRFI & EMA 5,789 18,789 13,000 225% 21,789 16,000 276%Rest of NW.Leic 8,912 8,850 -62 -1% 8,686 -226 -3%Rest of Leicestershire 372,657 393,769 21,112 6% 406,906 34,249 9%Nottinghamshire 317,331 333,620 16,289 5% 342,895 25,564 8%Derbyshire 271,640 290,864 19,224 7% 301,818 30,178 11%Near External 100,714 137,358 36,644 36% 207,455 106,741 106%Total Employment 1,107,278 1,215,819 108,541 10% 1,324,424 217,146 20%
4.3.2 The main growth areas for employment are in and around Coalville, at East Midlands Airport and the proposed SRFI for both of the years modelled. All the growth at the airport and SRFI is exogenous growth whereas the growth in Coalville and that predicted by TEMPRO in the rest of the district is a mixture of exogenous and endogenous.
4.3.3 There is a small amount of growth in Ashby and, as with the dwelling growth, part of Castle Donington (zone 373) sees quite a high percentage growth in the number of jobs which in absolute terms is insignificant compared to the large increases in the three main centres. Although these are small changes in real numbers zone 373 is experiencing a significant change in the number of people working and the number of people living in the zone.
4.3.4 The more residents there are in an area the more need there is for local services and this creates new endogenous employment. It can be seen from Figure 10, Figure 11, Figure 12 and Figure 13 that the zones which have increases in dwellings see corresponding increases in the local service employment.
4.3.5 The remaining areas see a decline in the number of workers, particularly by 2026 following the reallocation in the model of the predicted TEMPRO growth for the district as explained in paragraph 2.1.11.

28
4.4 IMPACT ON HOUSEHOLD DEMAND
4.4.1 The average monthly housing rent indicator for different areas provides an indication of housing pressure and the desirability of living within the particular areas. If the model finds difficulty attracting residents to a zone the housing rent indicator will be reduced, conversely a higher housing rent indicator indicates that there is competition for space. It can therefore be used as an indication of which areas are relatively more attractive to potential residents. The higher the score the more desirable the area. Table 10 shows that within North West Leicestershire, Coalville is considered less desirable than the other towns and the rest of the district. With the implementation of the strategy in Option 1, the additional dwelling supply reduces competition and the housing rent indicator in Coalville decreases to 2016, only recovering slightly in 2026. Kegworth, which in 2006 has a relatively high indicator score, also sees a fall in the housing rent indicator by 2026 indicating that there becomes less competition for dwellings in the town. Both Ashby and Castle Donington see their housing rent indicator increase as housing pressure increases in these desirable locations.
Table 10: Average monthly rent indicator per dwelling (£ in 2001 prices) for 2006 and 2016 and 2026 Option 1
Zone Name 2006 2016 Op1
Change 2006-2016
% change 2006-2016
2026 Op1
Change 2006-2026
% change 2006-2026
Coalville 322 313 -9 -3% 315 -6 -2%Ashby 426 425 -2 0% 433 7 2%Castle Donington 385 405 20 5% 425 40 10%Kegworth 414 392 -22 -5% 365 -49 -12%Rest of NW Leicestershire 420 416 -4 -1% 425 5 1%Rest of Leicestershire 346 321 -25 -7% 314 -32 -9%Nottinghamshire 313 298 -15 -5% 290 -22 -7%Derbyshire 304 296 -9 -3% 294 -11 -3%
4.5 IMPACT ON THE NUMBER OF EMPLOYED RESIDENTS
4.5.1 The numbers of non-employed households (including the retired) is determined using projections of the increases in the non-employed households and assigns them pro-rata to the zones within the model, thus the distribution of non-employed households remains the same in future years, and does not specifically take into account the levels of development within each zone.
4.5.2 This assumption results in an increase of 607 non-employed households in Coalville in the period to 2026; this accounts for approximately 30% of the growth of the non-employed households expected within the district. Even if there was a higher proportion of non-employed household growth within Coalville it would still be fairly insignificant compared to the growth of 9,039 employed households within the town.
4.5.3 The planned increase of around 10,272 dwellings in Coalville (Table 8) will create an additional 14,344 employed residents (Table 11) within the town in 2026 compared to 2006. In the same period employment in the town will increase by 4,422 (Table 9) of which 3,151 are created at the new Coalville employment site. The growth of

29
4,422 is very close to the amount forecast in TEMPRO for the whole district, and is matched by reductions in employment in more rural areas of the district; see Figure 13.
4.5.4 The result of this differential growth is that the number of employed residents within the town outnumbers the total number of jobs and thus the residents need to travel out of Coalville to find employment. Later, in section 4.7, it will be shown that the socio-economic profile of the employed residents of Coalville is also increasing leading to a higher proportion of managerial/professional workers in 2026 than in 2006. These more specialist workers tend to travel further for employment, and are hence less likely to work within the town.
4.5.5 . Conversely the policy of locating the dwellings within Coalville causes the proportion of employed residents within the areas outside the main towns to rise only slowly. This change in emphasis will have some important implications on the transport infrastructure around Coalville.
Table 11: Employed residents in 2006, option 1 2016 and 2026 and the change over time
Zone Name 2006 Refv8
2016 Op1 Change
% change
2026 Op1 Change
% change
Coalville 16,892 21,573 4,681 28% 31,236 14,344 85%Ashby 5,690 6,456 766 13% 6,413 723 13%Castle Donington 3,670 3,982 312 9% 4,090 420 11%Kegworth 2,181 2,573 392 18% 2,439 258 12%Rest of NW Leicestershire 15,005 15,296 291 2% 15,130 125 1%Rest of Leicestershire 372,708 407,679 34,971 9% 439,236 66,528 18%Nottinghamshire 305,445 331,031 25,586 8% 361,820 56,375 18%Derbyshire 291,838 324,956 33,118 11% 350,525 58,687 20%Near External 89,071 95,257 6,186 7% 110,393 21,322 24%
4.6 HOUSEHOLD CAR AVAILABILITY
4.6.1 There are decreases in the percentage of households with no cars in both the employed and non-employed households in the towns in North West Leicestershire, the rest of the district and in all three counties in the PTOLEMY study area. For the employed households the shift in most areas in the district is to having one car per adult in the household and for unemployed households the shift is to households with the adults having part share in a car between them. This is due to the fall in the cost of motoring over time. Castle Donington sees a large shift from Households with adults sharing a car to household with one car per adult by 2026 (see Figure 14 below).

0
5,000
10,000
15,000
20,000
25,000
2006
2026
Op1
2006
2026
Op1
2006
2026
Op1
2006
2026
Op1
2006
2026
Op1
Coalville Ashby CastleDonington
Kegworth Rest ofNW.Leic
Location and option number
Num
ber o
f hou
seho
lds
Full CarPart CarNo Car
Figure 14: Car share in the towns in North West Leicestershire in 2006 and 2026 option 1 4.7 CHANGE IN SOCIO-ECONOMIC PROFILES WITHIN THE TOWN
4.7.1 Within PTOLEMY persons and households are categorised within the model depending on their socio-economic grouping into 7 GSeC (Grouped Socio-economic Categories) based on the ONS NS-SeC as explain in section 1.3
4.7.2 Within the district a shift from households of GSeC 3 and 4 to the higher socio-economic groups GSeC 1 and 2 occurs over time with Ashby experiencing an increase from 25% to 32% of households in GSeC 1. Coalville starting from a much lower base sees an increase from 12% to 15%. (See Table 12, Table 13, Table 14 and Table 15).
4.7.3 Kegworth bucks the trend with the town becoming less attractive to the higher socio-economic groups and becoming more attractive to the semi-routine and routine employed residents.
30

31
Table 12: Employed Households in GSeC 1
Aggregated Zone Name
2006 Total Employed Households
2026 op1 Total Employed Households
2006 GSeC1
2026 Op1 GSeC1
% of 2006 Total
% of 2026 total
Percentage Point Change
Coalville 10,262 19,300 1,216 2,946 12% 15% 3%Ashby 3,428 3,856 848 1,216 25% 32% 7%Castle Donington 2,259 2,399 401 518 18% 22% 4%Kegworth 1,388 1,582 272 251 20% 16% -4%SRFI & EMA 0 0 0 0 N/A N/A N/ARest of NW.Leic 9,024 8,753 1,596 2,048 18% 23% 6%Rest of Leicestershire 234284 281624 35336 50732 15% 18% 3%
Table 13: Employed Households in GSeC 2
Aggregated Zone Name
2006 Total Employed Households
2026 op1 Total Employed Households
2006 GSeC2
2026 Op1 GSeC2
% of 2006 Total
% of 2026 total
Percentage Point Change
Coalville 10,262 19,300 2,564 5,824 25% 30% 5%Ashby 3,428 3,856 1,112 1,390 32% 36% 4%Castle Donington 2,259 2,399 620 724 27% 30% 3%Kegworth 1,388 1,582 394 329 28% 21% -8%SRFI & EMA 0 0 0 0 N/A N/A N/ARest of NW.Leic 9,024 8,753 2,467 2,872 27% 33% 5%Rest of Leicestershire 234284 281624 61,270 77,553 26% 28% 1%
Table 14: Employed Households in GSeC 3
Aggregated Zone Name
2006 Total Employed Households
2026 op1 Total Employed Households
2006 GSeC3
2026 Op1 GSeC3
% of 2006 Total
% of 2026 total
Percentage Point Change
Coalville 10,262 19,300 3,408 5,926 33% 31% -3%Ashby 3,428 3,856 874 796 25% 21% -5%Castle Donington 2,259 2,399 760 751 34% 31% -2%Kegworth 1,388 1,582 460 649 33% 41% 8%SRFI & EMA 0 0 0 0 N/A N/A N/ARest of NW.Leic 9,024 8,753 2,855 2,415 32% 28% -4%Rest of Leicestershire 234284 281624 74,963 88,309 32% 31% -1%

32
Table 15: Employed Households in GSeC 4
Aggregated Zone Name
2006 Total Employed Households
2026 op1 Total Employed Households
2006 GSeC4
2026 Op1 GSeC4
% of 2006 Total
% of 2026 total
Percentage Point Change
Coalville 10,262 19,300 3,074 4,604 30% 24% -6%Ashby 3,428 3,856 594 454 17% 12% -6%Castle Donington 2,259 2,399 478 406 21% 17% -4%Kegworth 1,388 1,582 262 353 19% 22% 3%SRFI & EMA 0 0 0 0 N/A N/A N/ARest of NW.Leic 9,024 8,753 2,106 1,418 23% 16% -7%Rest of Leicestershire 234284 281624 62,715 65,030 27% 23% -4%
4.8 IMPACT ON NETWORK TRAFFIC
4.8.1 The overall levels of traffic within the region increase considerably between 2006 and 2016. It can be seen from Table 16 that the district of North West Leicestershire experiences a much higher percentage increase in the total vehicle kilometres travelled on its roads in 2016 and 2026 over 2006 levels than Leicestershire as a whole, or than Nottinghamshire or Derbyshire which are lower still.
Table 16: Traffic levels for cars on the network in North West Leicestershire and the three counties Car traffic levels (Vehicle-km) 2006 2016OP1
vs 2006 2026OP1
vs 2006
NW Leics 703,908 982,755 40% 1,155,932 64%Leicestershire 3,357,634 4,130,703 23% 4,778,427 42%Derbyshire 1,978,060 2,319,326 17% 2,688,386 36%Nottinghamshire 1,989,065 2,331,226 17% 2,629,985 32%Internal PTOLEMY study area 7,324,790 8,781,286 20% 10,096,823 38%
4.8.2 The percentage changes in flow on the network links between 2006 and 2016 and between 2006 and 2026 respectively are displayed in Figure 15 and Figure 16. In these maps the width of the arrow represents the size of the total flow by link in 2016 and 2026 respectively and the colour denotes the change in flow from 2006. They show that a lot of the growth in the total vehicle kilometres travelled can be attributed to very large increases in traffic on the A42 and M1.

Figure 15: Change in flow by link between 2006 and option 1 2016
33

Figure 16: Change in flow by link between 2006 and option 1 2026 4.8.3 In the model it is assumed that the M1 has been widened by 2016, thus increasing its capacity. This extra capacity reduces congestion and encourages longer journeys within the same journey time. This is backed up by the results in Table 17 which show that although the number of trips both to and from North West Leicestershire are rising, and that people are travelling for longer, it is the average distance (trip kilometres) travelled by the car users which see large increases (33% increase in average trip length for trips to NW Leicester by 2026 compared to a increase of 15% in travel time). People are travelling further and for longer but because many of them are travelling on the motorway and other less congested stretches of road, the average speed of the journeys is also increasing.
34

35
Table 17: Travel statistics for journeys to and from North West Leicestershire 2016 Op1 2026 Op1
2006 Value Vs
2006 Value Vs
2006person trips 59,628 67,864 14% 76,354 28%trip-km 792,399 1,100,590 39% 1,347,335 70%average speed (km/h) 33.29 37.63 13% 38.38 15%average distance (km) 13.29 16.22 22% 17.65 33%average time (minutes) 23.95 25.86 8% 27.58 15%
Travel stats to NW Leics All Purpose, All mode average cost (pence
2001) 62.84 71.96 15% 77.99 24%
person trips 60,322 66,100 10% 77,340 28%trip-km 875,357 1,100,067 26% 1,453,612 66%average speed (km/h) 33.62 36.77 9% 37.86 13%average distance (km) 14.51 16.64 15% 18.8 30%average time (minutes) 25.9 27.16 5% 29.79 15%
Travel stats from NW Leics, All Purpose, All mode average cost (pence
2001) 67.02 72.55 8% 81.29 21% 4.8.4 Table 18 confirms that the majority of the increase in traffic in the district is on the Motorway, with the A roads also experiencing a large increase. The A42 and M1 both act as major through routes for traffic moving between different parts of the district and surrounding areas and for residents accessing jobs in Nottingham on the A453 which has been dualled between 2006 and 2016 and to areas external to the PTOLEMY study area south west of the district. The large increases in employment at the SRFI and East Midlands Airport both of which are easily accessible from the M1 are destinations for some of this extra traffic. By 2026 the congestion is encouraging car travellers to use alternative routes particularly on the B and minor roads.
Table 18: Car traffic in North West Leicestershire district 2016 Op1 2026 Op1 Car traffic
levels (Vehicle-km)
2006 Value Vs
2006 Value Vs
2006 Motorway 247,446 376,449 52% 447,139 81%A roads 319,350 451,438 41% 500,952 57%B Roads 39,188 41,786 7% 55,178 41%Minor roads 97,924 113,082 15% 152,663 56%All roads 703,908 982,755 40% 1,155,932 64%
4.8.5 The impact on the network of the model results can be seen in the changes in speed and delay within the district Figure 17 and Figure 18 show the change in speed by link between 2006 and 2016 and between 2006 and 2026.

Figure 17: Change in speed by link between 2006 and option 1 2016 4.8.6 It can be seen in Figure 17 that in spite of the very large increase in flow on the M1 between 2006 and 2016 the widening of the stretch running through the district which has also occurred during this period has enabled the road to absorb the increase. The results are even showing a speed up of the motorway, especially in the southbound direction. The average speed on roads in the district rises over the period to 2016 due to the increase in quantity and speed of traffic on the motorway however Figure 18 and Table 19 show that the benefits of the road widening begin to diminish by 2026 as traffic volumes increase further. The A42 sees a significant slow down in both 2016 and 2026 as the increases in volume cause more congestion.
36

Figure 18: Change in speed by link between 2006 and option 1 2026
Table 19: Change in average speed in the district and three counties
Car Average Speed (kph) 2006
2016 Op 1
Op1 2016
vs 2006
2026 Op 1
Op1 2026
vs 2006
NW Leicestershire 54 57 6% 53 -4% Leicestershire 45 47 3% 44 -2% Derbyshire 43 43 0% 41 -4% Nottinghamshire 39 42 6% 41 4% Internal area 43 44 3% 43 0%
37

38
4.8.7 As shown in Table 20, the total delay experienced to 2016 and 2026 by road users in North West Leicestershire sees a very large increase on all the road types except the motorway to 2016. Each link on the network in PTOLEMY has a free-flow time coded on it which is the time it would take for a vehicle to drive down that link in free flow conditions. When the model is run it also calculates the actual (or congested) time it would take vehicles to drive down each link based in the volume of traffic using it. The total delay is calculated by subtracting the free flow time from the congested time for each link multiplied by the number of cars travelling down that link. The large increases in volume are clearly causing significant levels of congestion around the district. These areas will be considered I more detail in the subsequent section.
Table 20: Total delay on roads on North West Leicestershire 2016 Op1 2026 Op1 Car:
Total delay (vehicle-mins) in NW Leics
2006 Value Vs
2006 Value Vs
2006 Motorway 480 467 -3% 937 95% A roads 1,677 2,604 55% 3,916 134% B Roads 99 130 32% 236 140% Minor roads 356 459 29% 748 110% All roads 2,612 3,660 40% 5,837 123%
4.9 IMPACTS ON HIGHWAY NETWORK AROUND COALVILLE, ASHBY, CASTLE DONINGTON AND KEGWORTH
4.9.1 The network traffic in the four towns of Coalville, Ashby, Castle Donington and Kegworth has been looked at separately for analysis purposes. The network links used when calculating the travel statistics in these towns can be seen in Figure B.3 in Appendix B.
4.9.2 Considering the total car delay in the towns in the district of Coalville, Ashby, Castle Donington and Kegworth as displayed in Table 21 it can be seen that in 2016 the residents of Coalville are experiencing a greater percentage increase in the delay on the roads within the town than the other major towns. By 2026 Castle Donington and Kegworth are experiencing similar percentage increases in delay with Ashby also not far behind. There is a general high increase in congestion in the towns which can be partly attributed to the increases in both the number of trips being made and the distance which people are travelling to reach their destinations. Over the 20 year period being modelled the cost of motoring decreases, which along with the increase in population contribute to this general slow down of the network.
Table 21: Total car delay on roads in the towns in North West Leicestershire 2016 Op1 2026 Op1 2006 Value Vs 2006 Value Vs 2006
Coalville 450 576 28% 758 68%Ashby 159 192 21% 232 46%Castle
Donington 30 37 26% 71 139%
Car: Total delay (veh-mins) in NW Leics Kegworth 83 151 81% 175 110%

Coalville
4.9.3 Coalville sees a large increase in flow on many roads, particularly those leading out of the town. This causes a slow down of speed on these links as shown in Figure 19.
Figure 19: Change in speed by link in and around Coalville between 2006 and option 1 2026 4.9.4 The main areas of congestion around Coalville are on the A511 eastbound out of Coalville towards the M1, there are a couple of links which see very large increases in flow and associated decrease in speed. The other major routes out of Coalville; the A511 westbound towards the A42 and Ashby and the A447 southbound also see large increases in flow and decrease in speed. The large number of new dwellings in Coalville and the associated rise in the number of residents has caused a large increase in the number of people leaving the town in the AM peak. Although both the number of dwellings and the number of jobs have risen by 2016 and 2026 in option 1 the dwelling increase is far greater than the increase in number of jobs therefore it is inevitable that some of the new residents will have to commute out of the town to get to their jobs.
39

40
4.9.5 Table 22 and Table 23 show the trip pattern of destinations of all journeys from Coalville and the origins of all journeys to Coalville in the morning peak period. It can clearly be seen that the majority of both the trips made to and from Coalville are internal trips within the town with around 62% of the trips that start within the town finish in the town in 2006. Whilst in 2026 the absolute number of people who live and work within the town increases the proportion do so falls as the increasing number of employed residents move out of the town to find employment.
Table 22: Distribution of trips from Coalville in the AM Peak period for 2006 and 2026
Destination of all trips from Coalville for all purposes in
the AM Peak period
Number of Person Trips in 2006
% of Person Trips in 2006
Number of Person Trips
in 2026 option 1
% of Person Trips
in 2026 option 1
Coalville 14,911 62% 22155 57%Ashby 403 2% 703 2%Castle Donington 54 0% 120 0%Kegworth 87 0% 149 0%SRFI&EMA 93 0% 439 1%Rest of NW Leicestershire 1,487 6% 2351 6%Rest of Leicestershire 4,902 20% 7371 19%Nottinghamshire 380 2% 766 2%Derbyshire 669 3% 1225 3%External 967 4% 3356 9%Grand Total 23,954 100% 38635 100%
4.9.6 It is clear that residents of Coalville are more likely to travel to the south to Leicestershire (including Leicester UA) rather than travel northwards. Whilst the SRFI and airport do see a rise in employees coming from Coalville this is a very small proportion of the overall employment levels at the site. Nottingham and Derby only correspond to around 2% to 3% of trips from Coalville. This propensity to travel towards Leicester certainly aids in the build up of traffic on the A511 towards the M1 in Coalville.
4.9.7 For trips to Coalville there is a similar patterns with a high proportion of trips to Coalville (16%) also coming from the rest of Leicestershire (including Leicester UA), see Table 23.
Table 23: Distribution of trips to Coalville in the AM Peak period for 2006 and 2026 Origin of all trips to
Coalville for all purposes in the AM Peak period
Number of Person Trips
in 2006
% of Person Trips in 2006
Number of Person Trips
in 2026 option 1
% of Person Trips
in 2026 option 1
Coalville 14911 61% 22155 67%Ashby 415 2% 442 1%Castle Donington 62 0% 64 0%Kegworth 80 0% 82 0%SRFI&EMA 25 0% 93 0%Rest of NW Leicestershire 2098 9% 2023 6%Rest of Leicestershire 4640 19% 5463 16%Nottinghamshire 400 2% 572 2%Derbyshire 1123 5% 1168 4%External 675 3% 1149 3%Grand Total 24428 100% 33210 100%

41
4.9.8 Whilst the towns of Ashby, Castle Donington and Kegworth do not have any significant trip making interactions with Coalville, Coalville does interact with the smaller towns and villages within the district. Some 9% of the trips to Coalville come from these smaller towns/villages and 6% of the trips from Coalville.
4.9.9 The skills profile within Coalville of both the residents and the jobs changes over time with proportionally fewer routine (GSeC4) jobs/residents and more managerial /professional GSeC1 over time (see Table 24 and Table 25). This profile is fairly consistent between the jobs and the employed residents of the town, however it can be seen in 2026 that there are 31,238 workers and only 19,417 jobs within the town.
4.9.10 Even if additional employment was provided within the town it would not necessarily be taken up by the residents as with ready access to the M1, Coalville provides a ready market for people who want to travel from Leicester, and Leicester provides a ready market for people who wish to travel from Coalville. This is particularly true of the higher socio-economic grouped workers where the more specialist nature of the jobs forces workers to travel further for employment.
Table 24: Total workplace employment by GSeC in Coalville in option 1 Persons
Percentage
Total Workplace employment in
Coalville 2006 2026 op1 2006 2026 op1
GSeC1 1,415 2,561 9.4% 13.2%GSeC2 3,606 5,580 24.0% 28.7%GSeC3 4,904 5,906 32.7% 30.4%GSeC4 5,072 5,370 33.8% 27.7%All 14,997 19,417 100.0% 100.0%
Table 25: Total employed residents by GSeC in Coalville in option 1 Persons
Percentage
Total Employed Residents in
Coalville 2006 2026 op1 2006 2026 op1 GSeC1 1,637 4,226 9.7% 13.5%GSeC2 4,265 9,771 25.3% 31.3%GSeC3 5,565 9,358 32.9% 30.0%GSeC4 5,424 7,883 32.1% 25.2%All 16,891 31,238 100.0% 100.0%
Ashby
4.9.11 The A511 into Coalville from the west sees a reduction in traffic as the route becomes less attractive to people travelling from Ashby to get to Leicester and Leicestershire due to the congestion on the stretch east of Coalville towards the M1. With the A42 towards the M1 also becoming more congested the residents of Ashby increasingly travel towards the West Midlands to zones external to the study area. In 2026 around 16% of trips from Ashby will head in this direction compared to 9% in 2006. This can be seen in Table 26.
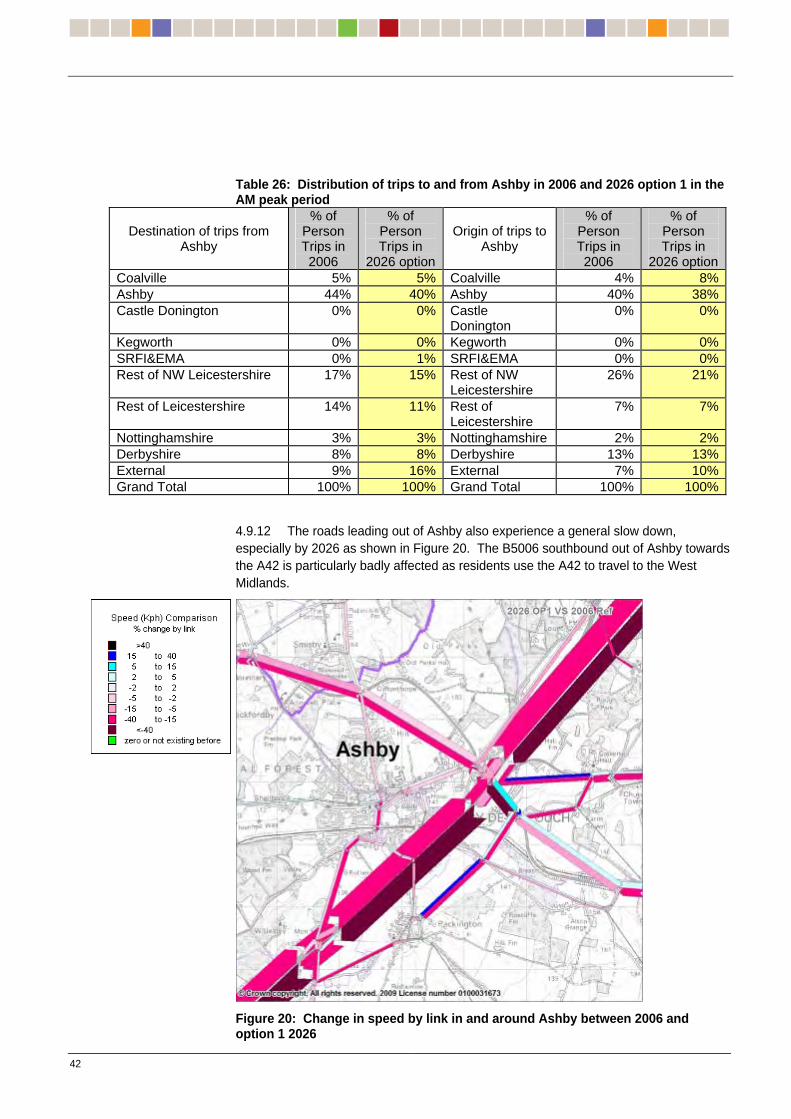
Table 26: Distribution of trips to and from Ashby in 2006 and 2026 option 1 in the AM peak period
Destination of trips from Ashby
% of Person Trips in 2006
% of Person Trips in
2026 option
Origin of trips to Ashby
% of Person Trips in 2006
% of Person Trips in
2026 optionCoalville 5% 5% Coalville 4% 8%Ashby 44% 40% Ashby 40% 38%Castle Donington 0% 0% Castle
Donington 0% 0%
Kegworth 0% 0% Kegworth 0% 0%SRFI&EMA 0% 1% SRFI&EMA 0% 0%Rest of NW Leicestershire 17% 15% Rest of NW
Leicestershire 26% 21%
Rest of Leicestershire 14% 11% Rest of Leicestershire
7% 7%
Nottinghamshire 3% 3% Nottinghamshire 2% 2%Derbyshire 8% 8% Derbyshire 13% 13%External 9% 16% External 7% 10%Grand Total 100% 100% Grand Total 100% 100%
4.9.12 The roads leading out of Ashby also experience a general slow down, especially by 2026 as shown in Figure 20. The B5006 southbound out of Ashby towards the A42 is particularly badly affected as residents use the A42 to travel to the West Midlands.
Figure 20: Change in speed by link in and around Ashby between 2006 and option 1 2026
42

Kegworth
4.9.13 Around the area of Junction 24 of the M1 there are significant improvements to the roads in 2016 associated with the M1 and A453 widening and the access to the SRFI. In this period there is also the inclusion of a new bypass to the south of Kegworth providing a direct link to the A453 adjacent to the airport. Most of the roads around this area experience very large increases in flow volumes and where the roads are not improved, decreases in speed (see Figure 21 and Figure 22). Traffic flows through Kegworth however are more complicated, with the improvements reducing the flows southbound through the town. Northbound traffic still appears to find the route through the town attractive rather than using the new alternative route via the bypass to the A453.
Figure 21: Change in speed by link in and around Castle Donington, Kegworth, East Midlands Airport and J24 SRFI between 2006 and option 1 2016
43

Figure 22: Change in speed by link in and around Castle Donington, Kegworth, East Midlands Airport and J24 SRFI between 2006 and option 1 2026
East Midlands Airport and SRFI
4.9.14 The new employment at the strategic rail freight interchange at M1 junction 24 and the large increase in employment at East Midlands Airport causes significant increase in trips undertaken to the two sites (see Table 27). Whilst the volume of trip making increases over time, the pattern of trip making remains very similar with around 15% of the trips originating within the district of NW Leicestershire, 16% within the rest of Leicestershire, 17% within Nottinghamshire, 25% with Derbyshire and 25% from outside the PTOLEMY study area.
44

45
Table 27: Distribution of trips to M1 J24 SRFI and East Midlands Airport in 2006 and option 1 2026
Origin of trips to SRFI/EMA Number of Person Trips in 2006
% of Person Trips in 2006
Number of Person Trips in 2026
option 1
% of Person Trips in 2026
option 1 Coalville 93 2% 439 3%Ashby 40 1% 86 1%Castle Donington 364 8% 866 6%Kegworth 160 3% 216 2%SRFI&EMA 0% 28 0%Rest of NW Leicestershire 256 5% 450 3%Rest of Leicestershire 813 17% 2,170 16%Nottinghamshire 717 15% 2,386 17%Derbyshire 1,192 25% 3,546 26%External 1,164 24% 3,644 26%Grand Total 4,804 100% 13,832 100%
4.10 SUMMARY OF MAIN IMPACTS OF OPTION 1
4.10.1 There is significant employment and dwelling growth within the district in this option.
4.10.2 Coalville sees significant growth in dwellings and employed residents. These generate significant levels of traffic which a focussed towards Leicestershire and Leicester, rather than the north.
4.10.3 Ashby becomes more isolated from the rest of the district with congestion on the A42 and A511 restricting opportunities to travel to or from the town from the other urban centres within the district. As a consequence the town sees an increase in interaction with the West Midlands via the A42
4.10.4 Kegworth sees an increase in traffic flows through the town even with the inclusion of the new bypass to the south. The socio-economic profile of its residents declines over time as it becomes attractive for the GSeC3 and 4 employees at the airport and SRFI to locate within the town.
4.10.5 Castle Donington sees increased congestion through the town associated with the economic activity at the airport.
4.10.6 The airport and SRFI draw a significant proportion of their workforce from outside the district of NW Leicestershire, particularly from Nottinghamshire, Derbyshire and external zones. Around 15% of the workforce is likely to come from within the district of NW Leicestershire.

46
5 Option 2 – Coalville focused dwelling growth with a significant amount of growth in Ashby
5.1 OVERVIEW
In the second scenario option tested the dwelling growth is similarly focused to the first option in Coalville in 2016 but with more growth in Ashby-de-la-Zouch. By 2026 there is less growth occurring in Coalville than option 1 and again more in Ashby. The total growth by 2026 is between that of the other two options tested.
This section sets out the dwelling inputs and employment impacts for this scenario and then discusses the results from the 2016 and 2026 runs which are compared to the results from option1. The effects on the road network in the district and more locally in the towns of Coalville, Ashby-de-la-Zouch, Castle Donington and Kegworth will be discussed.
5.2 DWELLING INPUTS
5.2.1 The majority of the dwelling development will be in Coalville, although because the levels are reduced compared to option 1 the SUE will be of reduced size. Even with this reduced level of development within the town, Coalville would still account for 70% of the residential development in this option.
5.2.2 The other main development area in this scenario would be Ashby-de-la Zouch which sees 20% of the development located there.
5.2.3 The remainder of the growth (9%) is distributed amongst Castle Donington, Kegworth and the remainder of the district.
5.2.4 The changes to 2016 can be seen in Figure 23 and Figure 24, whilst Figure 25 and Figure 26 show the changes to 2026.
5.2.5 Table 28 shows the zonal change in the dwelling numbers.

Figure 23: Option 2 dwelling change 2006 to 2016 Colours represent the percentage growth whilst the number indicates the absolute change in the number of dwellings.
Figure 24: Difference in dwelling change between option 1 and option 2 in 2016 Colour and label denote change in number of dwellings.
Figure 25: Option 2 dwelling change 2006 to 2026 Colours represent the percentage growth whilst the number indicates the absolute change in the number of dwellings.
Figure 26: Difference in dwelling change between option 1 and option 2 in 2026 Colour and label denote change in number of dwellings.
5.2.6 In 2016 the only difference between option 1 and 2 is an increase in the number of dwellings in Ashby.
47

48
5.2.7 By 2026 there is a further increase in dwelling numbers in Ashby and also a decrease in dwelling numbers in Coalville.
Table 28: Option 2 dwelling growth - change by zone and by aggregated zone
Agg
rega
ted
Zone
Zone
Num
ber
Zone
Nam
e
2006
Tot
al
Dw
ellin
gs
2006
-201
6 A
bsol
ute
Gro
wth
2006
-201
6 Pe
rcen
tage
G
row
th
2006
-202
6 A
bsol
ute
Gro
wth
2006
-202
6 Pe
rcen
tage
G
row
th
354 Snibston 2298 927 40% 1392 61%355 Greenhill 2909 32 1% 32 1%578 Thringstone 1874 177 9% 442 24%579 Whitwick 2959 491 17% 2092 71%918 Bardon 1192 468 39% 468 39%919 Coalville 2187 287 13% 287 13%920 Hugglescote 2004 908 45% 3759 188%
Coalville
Coalville Total 15422 3290 21% 8472 55%777 Ashby Castle 1107 156 14% 317 29%778 Ashby
Holywell 2021 824 41% 1619 80%
779 Ashby Ivanhoe 1948 269 14% 619 32%Ashby
Ashby Total 5076 1249 25% 2555 50%372 Castle
Donington 2896 88 3% 92 3%
373 Castle Donington2
131 100 76% 275 210%Castle Donington
Castle Donington Total 3027 188 6% 367 12%
Kegworth 368 Kegworth &
Whatton 2025 335 17% 335 17%
370 NEM Airport 0 0 0% 0 0%371 SRFI 0 4 n/a 4 n/aAirport and SRFI
Airport and SRFI total 0 4 n/a 4 n/a350 Ibstock &
Heather 2992 136 5% 136 5%
351 Measham 5234 132 3% 306 6%352 Moira 2118 22 1% 22 1%353 Valley 1787 20 1% 20 1%367 Breedon 1049 11 1% 11 1%
Rest of North West
Leicestershire
Rest of North West Leicestershire Total
13180 321 2% 495 4%
Total 38731 5387 14% 12228 32%
(For location of zones see Figure B.1 in 7Appendix B)

5.3 EMPLOYMENT IMPACTS
5.3.1 As outlined in Section 2.1, the basic (exogenous) employment is identical between the three options, however the industries that serve the local population are determined by the model and tend to follow the changes in household location. Figure 27 and Figure 28 show the difference in total employment between the two options which is made up from these changes in the service sector.
Figure 27: Difference in total employment between options 1 and 2 by zone in 2016 Colours represent the percentage difference in employment whilst the number indicates the absolute difference.
49
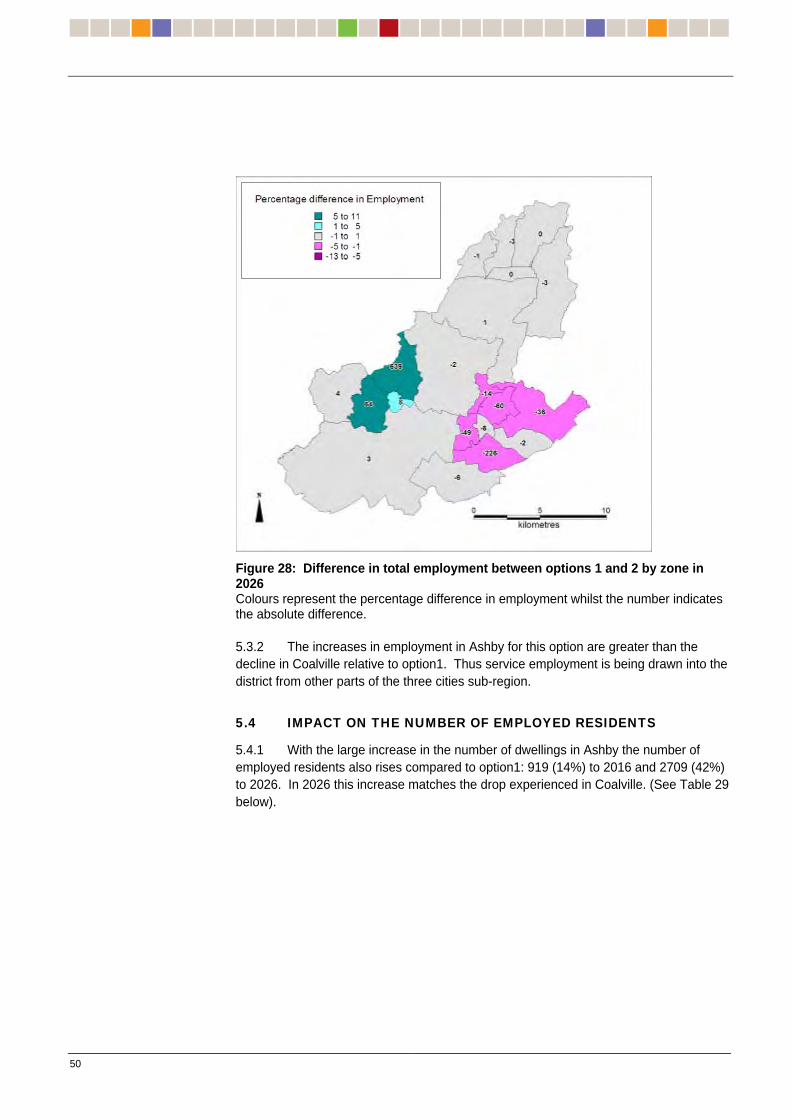
Figure 28: Difference in total employment between options 1 and 2 by zone in 2026 Colours represent the percentage difference in employment whilst the number indicates the absolute difference. 5.3.2 The increases in employment in Ashby for this option are greater than the decline in Coalville relative to option1. Thus service employment is being drawn into the district from other parts of the three cities sub-region.
5.4 IMPACT ON THE NUMBER OF EMPLOYED RESIDENTS
5.4.1 With the large increase in the number of dwellings in Ashby the number of employed residents also rises compared to option1: 919 (14%) to 2016 and 2709 (42%) to 2026. In 2026 this increase matches the drop experienced in Coalville. (See Table 29 below).
50

51
Table 29: Number of employed residents in the towns in North West Leicestershire and the difference between options 1 and 2
Zone Name 2016 OP1
2016 OP2
Change from Op 1
% change
from Op 1
2026 op1
2026 op2
Change from Op 1
% change
from Op 1
Coalville 21,573 21,567 -6 0% 31,236 28,621 -2,615 -8%Ashby 6,456 7,375 919 14% 6,413 9,122 2,709 42%Castle Donington 3,982 3,977 -5 0% 4,090 4,093 3 0%Kegworth 2,573 2,573 0 0% 2,439 2,439 0 0%Rest of NW.Leic 15,296 15,300 4 0% 15,130 15,137 7 0%Rest of Leicestershire 407,679 407,584 -95 0% 439,236 439,238 2 0%Nottinghamshire 331,031 331,003 -28 0% 361,820 361,737 -83 0%Derbyshire 324,956 324,922 -34 0% 350,525 350,460 -65 0%Near External 95,257 94,561 -696 -1% 110,393 110,506 113 0%
5.5 HOUSEHOLD CAR AVAILABILITY
5.5.1 Figure 29 shows how the number of cars available to each household varies between options 1 and 2. Within Ashby it can be seen that the growth is almost entirely within the households that have access to a car, with the number of non-car owning households remaining very similar to option 1. The decline in Coalville matches this pattern in reverse, with option 2 having slightly fewer car owning households.

0
5,000
10,000
15,000
20,000
25,000
30,000
2026
Op1
2026
Op2
2026
Op1
2026
Op2
2026
Op1
2026
Op2
2026
Op1
2026
Op2
2026
Op1
2026
Op2
Coalville Ashby CastleDonington
Kegworth Rest ofNW.Leic
Location and option number
Num
ber o
f hou
seho
lds
Full Car
Part Car
No Car
Figure 29: Household car availability in 2026 option 1 and option 2 5.6 IMPACT ON NETWORK TRAFFIC
5.6.1 The overall impact of option 2 on the network in North West Leicestershire when compared to option 1 is fairly small. The differences in flow and speed on the major roads in 2016 are virtually nil. By 2026 there are a few more significant differences. Figure 30 shows that the flow on the A42 northbound increases even further. With the increase in the number of residents in Ashby there are increases in flow around the town and there are some decreases in flow around Coalville as the number of residents decreases.
52

Figure 30: Difference in flow by link between option 1 and option 2 in 2026
5.6.2 The affect of these changes in flow on congestion and speed can be seen in Figure 31. On the major road network these are not large. There are some decreases in speed around Ashby and increases around Coalville, these will be looked at in more detail in section 5.7 below.
53

Figure 31: Difference in speed by link between option 1 and option 2 in 2026
5.6.3 Figure 32 shows the change in average zonal speed in 2026 between options 1 and 2. This map shows the flow weighted average speed within each zone, allowing systematic changes within an area to be observed. It can be clearly seen that the average speed in a few zones around Coalville is increasing whereas and a few zones in the vicinity of Ashby are conversely experiencing a similar degree of slow down.
54
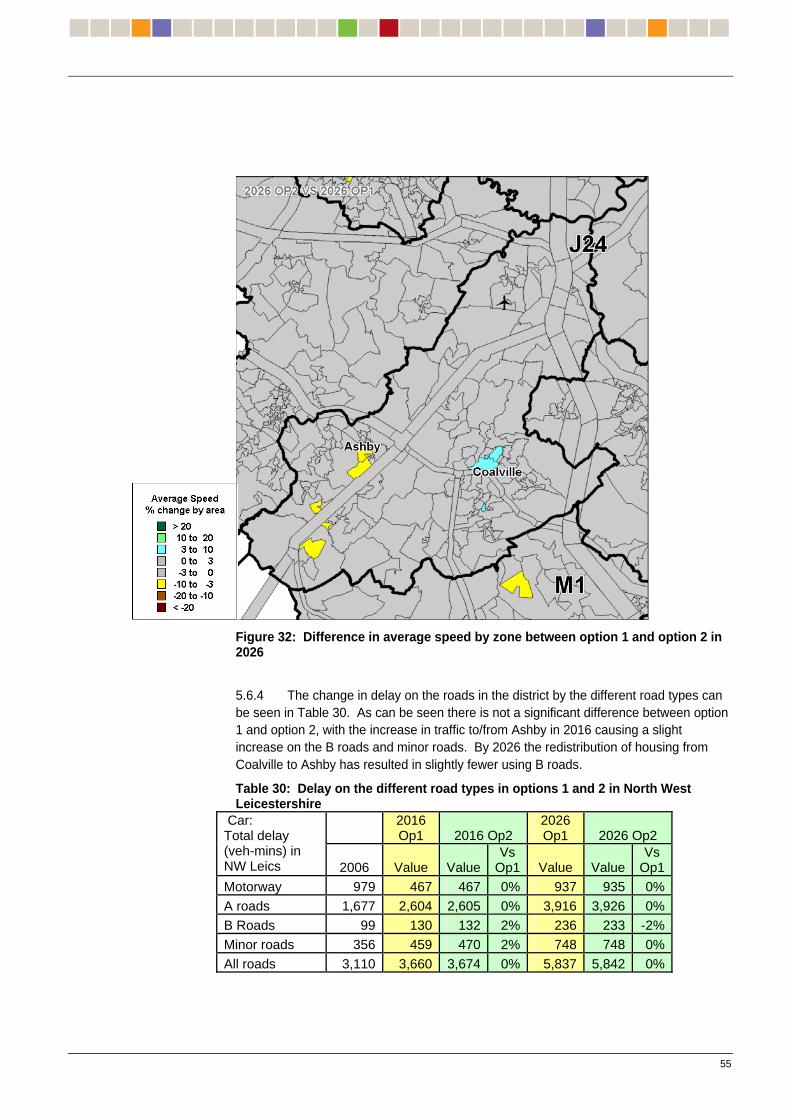
55
Figure 32: Difference in average speed by zone between option 1 and option 2 in 2026
5.6.4 The change in delay on the roads in the district by the different road types can be seen in Table 30. As can be seen there is not a significant difference between option 1 and option 2, with the increase in traffic to/from Ashby in 2016 causing a slight increase on the B roads and minor roads. By 2026 the redistribution of housing from Coalville to Ashby has resulted in slightly fewer using B roads.
Table 30: Delay on the different road types in options 1 and 2 in North West Leicestershire
2016 Op1 2016 Op2
2026 Op1 2026 Op2
Car: Total delay (veh-mins) in NW Leics 2006 Value Value
Vs Op1 Value Value
Vs Op1
Motorway 979 467 467 0% 937 935 0%A roads 1,677 2,604 2,605 0% 3,916 3,926 0%B Roads 99 130 132 2% 236 233 -2%Minor roads 356 459 470 2% 748 748 0%All roads 3,110 3,660 3,674 0% 5,837 5,842 0%

56
5.6.5 If these figures are considered in conjunction with the differences in speed on the network around Coalville in 2026 (in Figure 32 below) it can be seen that there are many B roads and minor roads around Coalville which experience small increases in speed in option 2 over option 1. The smaller increase in dwellings in Coalville between 2016 and 2026 in option 2 is leaving the minor roads and B roads around the town less congested.
5.7 IMPACTS ON THE NETWORK AROUND COALVILLE, ASHBY, CASTLE DONINGTON AND KEGWORTH
5.7.1 The changes between option 1 and 2 are small in most parts of the district with only Ashby and Coalville experiencing significant changes. Table 31 shows the differences in total delay on the network in the towns of Coalville, Ashby, Castle Donington and Kegworth in the two years modelled. There is little difference for most of the district in 2016, with a 5% increase in delay measured in Ashby compared to option 1. By 2026 the delay in Ashby has increased by 16% compared to option 1 whilst Coalville sees a decrease in delay of 6%.
Table 31: Total delay on the roads around Coalville, Ashby, Castle Donington and Kegworth
2016 Op1 2016 Op2
2026 Op1 2026 Op2
Car: Total delay (veh-mins) in NW
Leics 2006 Value ValueVs
Op1 Value Value Vs
Op1 Coalville 450 576 575 0% 758 713 -6%Ashby 159 192 201 5% 232 269 16%Castle
Donington 30 37 37 -1% 71 71 0%Kegworth 83 151 150 -1% 175 174 0%
5.7.2 The effect of the smaller number of dwellings in Coalville can be seen in Figure 33 below. In general option 2 causes a slightly smaller amount of congestion in Coalville than option 1. Some of the minor roads around the town have speeded up by between 2 and 5% compared to option 1. There are also 5 to 15% increases in speed on links westbound on the A511, to the west of the town.
5.7.3 The bad congestion on sections of the network on the A511 towards the M1 and the triangle of roads where it meets the B585 has been reduced slightly in option 2 (see Figure 33 below) although the congestion at this point was considerable in option 1 and this remains a problem area in the district.

57
Figure 33: Difference in speed by link in and around Coalville between option 1 and option 2 in 2026 5.7.4 In Ashby the increase in the number of dwellings causes an increase in congestion on the road network (see Figure 34). The main roads leading out of the town are the most badly affected, with the B5006 south of the town again suffering the worst effects. As this stretch was already experiencing a slow down of over 15% in option 1 compared to 2006 the further increase in traffic causes further congestion and speed reduction. The greater number of dwellings developed in Ashby in Option 2 is not matched by any increase in the exogenous employment in the town. Although the endogenous employment increases in local services for the extra residents this will not provide employment for all the residents of the additional dwellings and therefore option 2 causes an increase in the number of people and vehicles commuting out of the town. This in turn causes congestion on the roads out of the town with commuters heading towards the airport, SRFI, Coalville and southbound on the A42 out of the district.

Figure 34: Difference in speed by link in and around Ashby between option 1 and option 2 in 2026
5.7.5 Within option 2 there is considerable housing growth within Ashby which generates jobs in local services in the area. The increase in the town’s population and the increasing levels of congestion on roads surrounding Ashby mean that the local residents are more likely to take up jobs within Ashby in 2026 raising the levels (and proportions) of those living and working within the town and maintaining the towns relative isolation from the rest of the district and Leicestershire. However the growth in population within Ashby is greater than the increased provision of jobs, and so the local population require jobs outside of the town, whilst the total number of trips rises from 8,787 in 2006 to11,687 in 2026 the proportion of trips from Ashby remains the same (See Table 32
58

59
Table 32: Distribution of trips from Ashby in 2026 in option 1 and 2 Destination of
trips from Ashby Number of
Person Trips in
2026 option 1
Number of Person Trips in 2026
option 2
% of Person Trips in
2026 option 1
% of Person Trips in 2026
option 2 Coalville 442 577 5% 5% Ashby 3507 4836 40% 41% Castle Donington 34 46 0% 0%
Kegworth 20 26 0% 0% SRFI&EMA 86 117 1% 1% Rest of NW Leicestershire 1340 1628 15% 14%
Rest of Leicestershire 985 1324 11% 11%
Nottinghamshire 245 319 3% 3% Derbyshire 743 968 8% 8% Near External 1385 1846 16% 16% Grand Total 8787 11687 100% 100%
5.7.6 Congestion on the roads surrounding Ashby has increased the likelihood that residents of the town will take up jobs and make use of services within the town. Travellers (and potential employees) from outside are being deterred by the levels of congestion which reduces the attractiveness of the town as a destination. The result is an increase in the proportion of trips that start and finish within the town, rising from 38% in option 1 to 46% in option 2.
Table 33: Distribution of trips to Ashby in 2026 in option 1 and 2 Origin of trips to
Ashby Number of
Person Trips in 2026
option 1
Number of Person Trips in 2026
option 2
% of Person Trips in
2026 option 1
% of Person Trips in 2026
option 2 Coalville 703 637 8% 6% Ashby 3507 4836 38% 46% Castle Donington
30 30 0% 0%
Kegworth 35 34 0% 0% SRFI&EMA 12 15 0% 0% Rest of NW Leicestershire
1921 1944 21% 18%
Rest of Leicestershire
635 659 7% 6%
Nottinghamshire 226 232 2% 2% Derbyshire 1223 1230 13% 12% Near External 908 912 10% 9% Grand Total 9200 10529 100% 100%

60
5.8 SUMMARY OF THE MAIN IMPACTS OF OPTION 2
5.8.1 To 2016 this scenario assumes that Coalville grows identically to that in option 1, with additional housing development within Ashby. From 2016 to 2026 the policy reduces the housing growth within Coalville and substitutes it for growth in Ashby.
5.8.2 Overall the impacts of the different distribution of housing growth are relatively localised with the main impacts seen as slightly reduced congestion in Coalville compared to option 1, and increased congestion in Ashby.
5.8.3 The reduction in the growth in Coalville is not sufficient to have a significant impact on the congestion within the town.
5.8.4 Ashby continues to appear to be isolated from the rest of the district, and like in option 1 continues to have a significant interaction with the West Midlands via the A42.

61
6 Option 3 – More dispersed development (Coalville, Ashby and Castle Donington)
6.1 OVERVIEW
6.1.1 In the third scenario option tested the dwelling growth is more dispersed around different parts of the district than in either option 1 or 2. A significant proportion of development is still in Coalville however there is also significant development in Ashby and Castle Donington. A greater proportion of the dwelling development is completed by 2016 in option 3 than either of the other options and the total growth by 2026 is slightly lower than that of the other two options.
6.1.2 This section will set out the dwelling inputs and modelled employment impacts for this scenario and will then discuss the results from the 2016 and 2026 runs compared to the results from option1. The effects on the road network in the district and more locally in the towns of Coalville, Ashby-de-la-Zouch, Castle Donington and Kegworth will be discussed followed by the associated changes in employed residents, households and their make up.
6.2 DWELLING INPUTS
6.2.1 This is a much more dispersed policy option than the others that have been considered with the development in Coalville only representing around 47% of the growth from 2006 to 2026.
6.2.2 The development has been transferred from Coalville to Ashby (which receives 16% of the growth), Castle Donington (10%) and Kegworth (7%). There is also a significant amount of development outside of these major towns in the remainder of the district.
6.2.3 Whilst Ashby does incur significant growth, it is in fact less than that experienced in option 2.
6.2.4 Figure 35 and Figure 36 show the dwelling growth to 2016 compared to 2006 and to option 1. Figure 37 and Figure 38 show the dwelling growth to 2026 compared to 2006 and to option 1.
6.2.5 Table 34 shows the details of the dwelling increases by PTOLEMY model zone.

Figure 35: Option 3 dwelling change 2006 to 2016 Colours represent the percentage growth whilst the number indicates the absolute change in the number of dwellings.
Figure 36: Difference in dwelling input in 2016 between Option 1 and Option 3 Colour and label denote change in number of dwellings.
Figure 37: Option 3 dwelling change 2006 to 2026 Colours represent the percentage growth whilst the number indicates the absolute change in the number of dwellings.
Figure 38: Difference in dwelling input in 2026 between Option 1 and Option 3 Colour and label denote change in number of dwellings.
62

63
Table 34: Option 3 dwelling growth - change by zone and by aggregated zone A
ggre
gate
d Zo
ne
Zone
Num
ber
Zone
Nam
e
2006
Tot
al
Dw
ellin
gs
2006
-201
6 A
bsol
ute
Gro
wth
2006
-201
6 Pe
rcen
tage
G
row
th
2006
-202
6 A
bsol
ute
Gro
wth
2006
-202
6 Pe
rcen
tage
G
row
th
354 Snibston 2298 927 40% 1192 52%355 Greenhill 2909 32 1% 32 1%578 Thringstone 1874 171 9% 269 14%579 Whitwick 2959 491 17% 1152 39%918 Bardon 1192 368 31% 368 31%919 Coalville 2187 287 13% 287 13%920 Hugglescote 2004 908 45% 2209 110%
Coalville
Coalville Total 15422 3184 21% 5509 36%777 Ashby Castle 1107 156 14% 317 29%
778 Ashby Holywell 2021 674 33% 1129 56%
779 Ashby Ivanhoe 1948 269 14% 519 27%Ashby
Ashby Total 5076 1099 22% 1965 39%
372 Castle Donington 2896 113 4% 792 27%
373 Castle Donington2 131 275 210% 450 344%Castle Donington
Castle Donington Total 3027 388 13% 1242 41%
Kegworth 368 Kegworth & Whatton 2025 494 24% 899 44%
370 NEM Airport 0 0 0% 0 0%371 SRFI 0 4 n/a 4 n/aAirport and SRFI
Airport and SRFI total 0 4 n/a 4 n/a
350 Ibstock & Heather 2992 291 10% 1032 34%
351 Measham 5234 405 8% 1091 21%352 Moira 2118 22 1% 22 1%353 Valley 1787 20 1% 20 1%367 Breedon 1049 11 1% 11 1%
Rest of North West
Leicestershire
Rest of North West Leicestershire Total 13180 749 6% 2176 17%
Total 38731 5918 15% 11795 30%
(For location of zones see Figure B.1 in Appendix B)
6.2.6 In the zones which only experience very small growth, for example in Moira, valley, Greenhill and Breedon, the dwellings are all completed by 2016.
6.2.7 In most of the zones where there are large numbers of dwellings being built these are spread over the twenty year period fairly evenly.

6.3 EMPLOYMENT IMPACTS
6.3.1 The exogenous employment inputs to the model remain the same throughout all the options. These can be seen in Section 2.1 in Figure 6 and Figure 7.
6.3.2 Figure 39 and Figure 40 below show the difference in the endogenous employment which the model generates in response to the dwelling and population increases. As more residents move to the area, there will be more need for local services and therefore employment in these sectors will increase.
6.3.3 To 2016 there is only a marginal difference between option 3 and option 1 in the location of employment. By 2026, however, there is a reduction of service jobs within Coalville, balanced by increases distributed around the district.
Figure 39: Difference in total employment between options 3 and 1 by zone in 2016 Colours represent the percentage difference in employment whilst the number indicates the absolute difference.
64
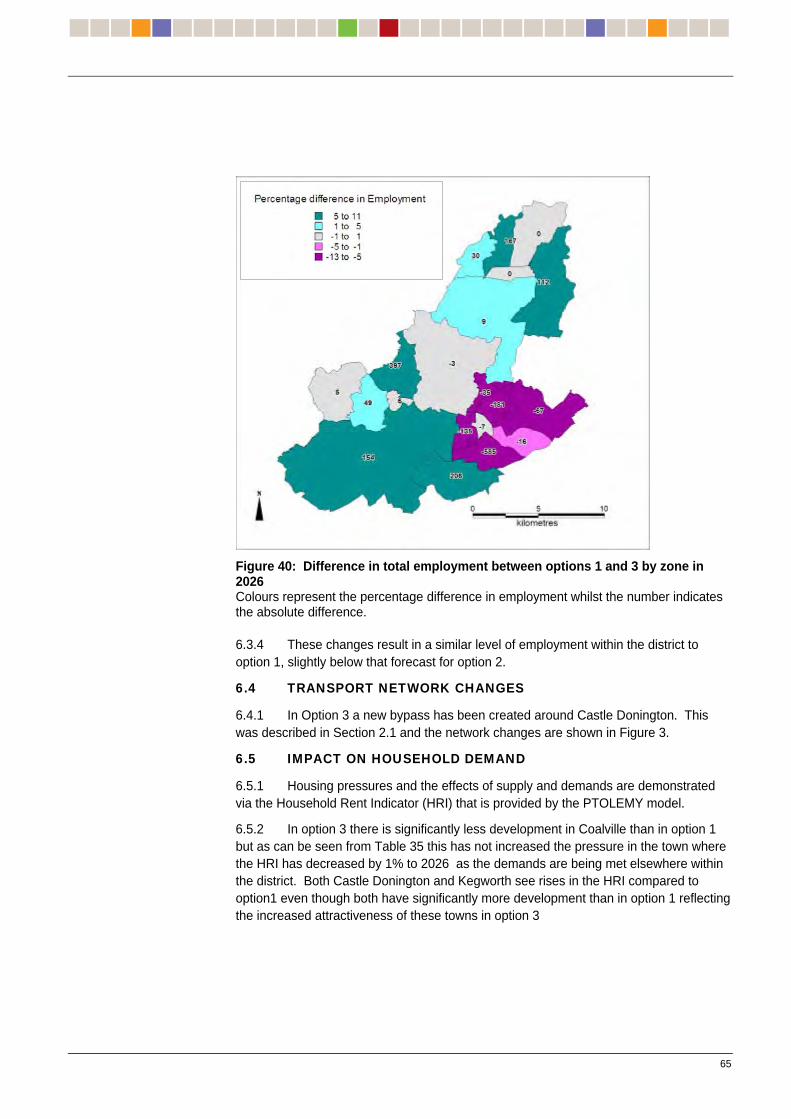
Figure 40: Difference in total employment between options 1 and 3 by zone in 2026 Colours represent the percentage difference in employment whilst the number indicates the absolute difference. 6.3.4 These changes result in a similar level of employment within the district to option 1, slightly below that forecast for option 2.
6.4 TRANSPORT NETWORK CHANGES
6.4.1 In Option 3 a new bypass has been created around Castle Donington. This was described in Section 2.1 and the network changes are shown in Figure 3.
6.5 IMPACT ON HOUSEHOLD DEMAND
6.5.1 Housing pressures and the effects of supply and demands are demonstrated via the Household Rent Indicator (HRI) that is provided by the PTOLEMY model.
6.5.2 In option 3 there is significantly less development in Coalville than in option 1 but as can be seen from Table 35 this has not increased the pressure in the town where the HRI has decreased by 1% to 2026 as the demands are being met elsewhere within the district. Both Castle Donington and Kegworth see rises in the HRI compared to option1 even though both have significantly more development than in option 1 reflecting the increased attractiveness of these towns in option 3
65

66
Table 35: Average monthly rent indicator per dwelling in options 1 and 3 (£ in 2001 prices)
Zone Name 2016 Op1
2016 Op3 Change
% change
2026 Op1
2026 Op3 Change
% change
Coalville 313 311 -2 -1% 315 312 -3 -1%Ashby 425 425 0 0% 433 437 4 1%Castle Donington 405 426 21 5% 425 442 16 4%Kegworth 392 394 2 1% 365 378 13 4%Rest of NW.Leic 416 414 -1 0% 425 425 0 0%Rest of Leicestershire 321 320 -1 0% 314 315 1 0%Nottinghamshire 298 297 -1 0% 290 290 0 0%Derbyshire 296 295 -1 0% 294 294 0 0%
6.6 IMPACT ON THE NUMBER OF EMPLOYED RESIDENTS
6.6.1 With the distribution of dwelling growth in option 3 more evenly spread within the district it can be seen from Table 36 that by 2026 the potential labour pool within Coalville is 22% less than in option 1 whilst Ashby, Castle Donington and Kegworth have increased their number of employed residents by between 28% and 34%.
Table 36: Employed Residents in options 1 and 3 Aggregated Zone Name
2016 Op1
2016 Op3 Change
% change
2026 Op1
2026 Op3 Change
% change
Coalville 21,573 21,397 -176 -1% 31,236 24,254 -6,982 -22%
Ashby 6,456 7,139 683 11% 6,413 8,206 1,793 28%Castle Donington 3,982 4,287 305 8% 4,090 5,496 1,406 34%Kegworth 2,573 2,800 227 9% 2,439 3,226 787 32%Rest of NW Leics 15,296 15,979 683 4% 15,130 17,905 2,775 18%Total in NW Leics 49,880 51,602 1,722 3% 59,308 59,087 -221 0%
6.7 HOUSEHOLD CAR AVAILABILITY
6.7.1 PTOLEMY defines household car availability in terms of three types which influence the travel behaviour of the individuals within the household.
No car: Households which do not have access to a car.
Part car: There are more adults than cars within the households.
Full car: Adults will always have a car available to them.
6.7.2 Figure 41 shows how access to cars by adults in the household varies between the options 1 and 3. The first thing to note is that there is very little difference in the number of households which do not have access to a car. This remains relatively constant as the number of households within each town varies. Coalville sees a drop of 20% in both households with adults having either part share in a car or one per person making those with no car a higher percentage of the total. The towns of Ashby, Castle Donington and Kegworth and the rest of the district all see a shift in the opposite direction with increases in the number of households with the adults having either full or part share in a car.

0
5,000
10,000
15,000
20,000
25,000
30,000
2026
Op1
2026
Op3
2026
Op1
2026
Op3
2026
Op1
2026
Op3
2026
Op1
2026
Op3
2026
Op1
2026
Op3
Coalville Ashby CastleDonington
Kegworth Rest ofNW.Leic
Location and option number
Num
ber o
f hou
seho
lds
Full Car
Part Car
No Car
Figure 41: Household car availability in options 1 and 3 in 2026 6.8 CHANGE IN SOCIO-ECONOMIC PROFILES WITHIN THE TOWNS
6.8.1 The socio-economic profiles of the residents do not change significantly with respect to option 1. As more dwellings are developed outside Coalville they are taken up by people of all income groups.
6.9 IMPACT ON NETWORK TRAFFIC
6.9.1 The mode share within the district between car travel, public transport, walking and cycle remains the same in option 3 as in options 1 and 2 with most trips being made by car. Table 7
6.9.2 The overall impact on the road network in option 3 in 2026 compared to option 1 is not large, with the majority of the impacts affecting the roads within each of the towns. As can be seen from Table 37 the average speed, total car kilometres and total car vehicle hours within the district remain unchanged between the two options, although in option 3 the total delay declines slightly by 1%.
67

68
6.9.3 In 2026 the more dispersed development is allowing slight improvement to be seen in the performance of the B class roads compared to option 1. Despite an increase in the total distance travelled by cars (+2%) and time spent by cars (+1%) on the B roads in the district there is an average speed increase on this road type of 1% and the total delay has decreased by 2%.
Table 37: Travel statistics on the different road categories in 2016 and 2026 2016 Op1 2016 Op3 2026 Op1 2026 Op3
2006 Value Vs
2006 value Vs
Op1 Value Vs
2006 value Vs
Op1 Motorway 86 96 12% 96 0% 89 4% 89 0%A roads 51 51 0% 51 0% 46 -10% 47 0%B Roads 54 52 -3% 52 0% 49 -9% 50 1%Minor roads 31 31 0% 31 0% 30 -2% 31 1%
Car: Average Speed kph
All roads 54 57 6% 57 0% 53 -3% 53 0%
Motorway 247,446 376,449 52% 376,441 0% 447,139 81% 449,637 1%A roads 319,350 451,438 41% 452,672 0% 500,952 57% 501,537 0%B Roads 39,188 41,786 7% 42,365 1% 55,178 41% 56,423 2%Minor roads 97,924 113,082 15% 116,547 3% 152,663 56% 152,926 0%
Car: Total veh-km in NW Leics
All roads 703,908 982,755 40% 988,025 1% 1,155,932 64% 1,160,523 0%
Motorway 2,884 3,903 35% 3,903 0% 5,025 74% 5,061 1%A roads 6,223 8,812 42% 8,827 0% 10,786 73% 10,785 0%B Roads 727 799 10% 810 1% 1,119 54% 1,135 1%Minor roads 3,173 3,673 16% 3,779 3% 5,027 58% 4,998 -1%
Car: Total veh-mins in NW Leics All roads 13,007 17,187 32% 17,320 1% 21,957 69% 21,979 0%
Motorway 480 467 -3% 465 0% 937 95% 947 1%A roads 1,677 2,604 55% 2,602 0% 3,916 134% 3,910 0%B Roads 99 130 32% 133 2% 236 140% 232 -2%Minor roads 356 459 29% 469 2% 748 110% 715 -4%
Car: Total delay (veh-mins) in NW Leics All roads 2,612 3,660 40% 3,668 0% 5,837 124% 5,804 -1%
6.9.4 With reference to Figure 42, which shows the difference in traffic speed on the different links between option 3 and option 1, it can be seen that it is primarily the minor roads within the district that experience a change, particularly around Coalville, Ashby and Castle Donington.

Figure 42: Difference in speed by link between option 1 and option 3 in 2026
6.9.5 The effect of this on the average zonal speeds can be seen in Figure 43. This map shows the flow weighted average speed by zone and is thus useful in highlighting areas where there are systematic changes within a particular area. There is a very clear speed up in the zones in and around Coalville compared to option 1 as the smaller number of dwellings located in Coalville reduces congestion on the roads around the town.
69

Figure 43: Difference in average speed by zone between option 1 and option 3 in 2026 6.9.6 Figure 43 also highlights an average decrease in speed in zones adjacent to the A42 in the vicinity in Ashby and near the junction where the A42 becomes the M42 as the increase in residents in these areas cause an increase in traffic trying to access the A42, increasing congestion.
6.9.7 The average speed in the zones in the centre of Castle Donington increase as traffic is diverted down the new bypass instead of through the town. There is an average decrease in speed in zones around Castle Donington and near East Midlands Airport (see section 6.10.14). Note that some rural zones contain few road links and low traffic volume. These links can on occasion cause an aberration in the flow-weighted speed changes and can be ignored.
6.9.8 These local impacts will be looked at in further detail in section 6.10 below.
70

6.10 IMPACTS ON THE NETWORK AROUND COALVILLE, ASHBY, CASTLE DONINGTON AND KEGWORTH
Coalville
6.10.1 As was seen previously, there is a general speed increase in and around Coalville in 2026 option 3 compared to option 1. The effects on the network in Coalville can be seen in greater detail in Figure 44, which shows the difference in flow between options 3 and 1, and Figure 45, which shows the corresponding change in speed. The width of the arrows in both maps represents the total volume of flow on the link in Option 3 and the colour represents the percentage change in flow and speed respectively.
Figure 44: Difference in flow by link in and around Coalville between option 3 and option 1 in 2026
6.10.2 Some of the key links which were suffering the worst congestion in option 1, for example the A511 heading eastbound out of Coalville towards the M1, the A447 heading south bound out of the town and the roads feeding these sections have experienced decreases in flow of between 2 and 30%. Although there is only between 2 and 5% decrease in flow on the A511 heading towards the M1 (see Figure 44) this produces between 15 and 40% increase in speed (see Figure 45). The mitigation of the flow difference in option 3 has such a large effect on this link because it was so heavily congested in option 1 that any change has a significant impact.
71

72
Figure 45: Difference in speed by link in and around Coalville between option 1 and option 3 in 2026
6.10.3 It can be seen in Table 38 that the total distance travelled by cars on the roads in Coalville is reduced by 7% and the total time reduced by 11%. The total delay is reduced by 15%. In option 3 the roads in Coalville experience a significant reduction in pressure compared to option 1.
Table 38: Network statistics for the differences between options 1 and 3 on the roads in Coalville Coalville 2016 Op1 2016 Op3 2026 Op1 2026 Op3
2006 Value Vs
2006 value Vs
Op1 Value Vs
2006 value Vs
Op1 Car: Average Speed kph 35 34 -4% 34 0% 32 -10% 33 4%Car: Total veh-km 68033 73367 8% 73156 0% 85215 25% 78989 -7%Car: Total veh-mins 1930 2178 13% 2163 -1% 2685 39% 2399 -11%Car: Total delay (veh-mins) 450 576 28% 568 -1% 758 68% 647 -15%
6.10.4 It can be seen in Table 39 that the number of trips to Coalville reduce by 11% in option 3 compared to option 1 but the average distance travelled by people travelling to Coalville increases by 11%. From Table 40 it is clear that it is a reduction in the shorter journeys that is increasing the average journey length as the number of trips that start and finish within the town drop from 67% in option 1 to 63% in option 3. The longer trips are still arriving in Coalville as people continue to commute into the town. The number of journeys coming from the rest of North West Leicestershire, Leicestershire, Derbyshire and external to the PTOLEMY study area all increase, making journeys from these origins a larger percentage of the total trips
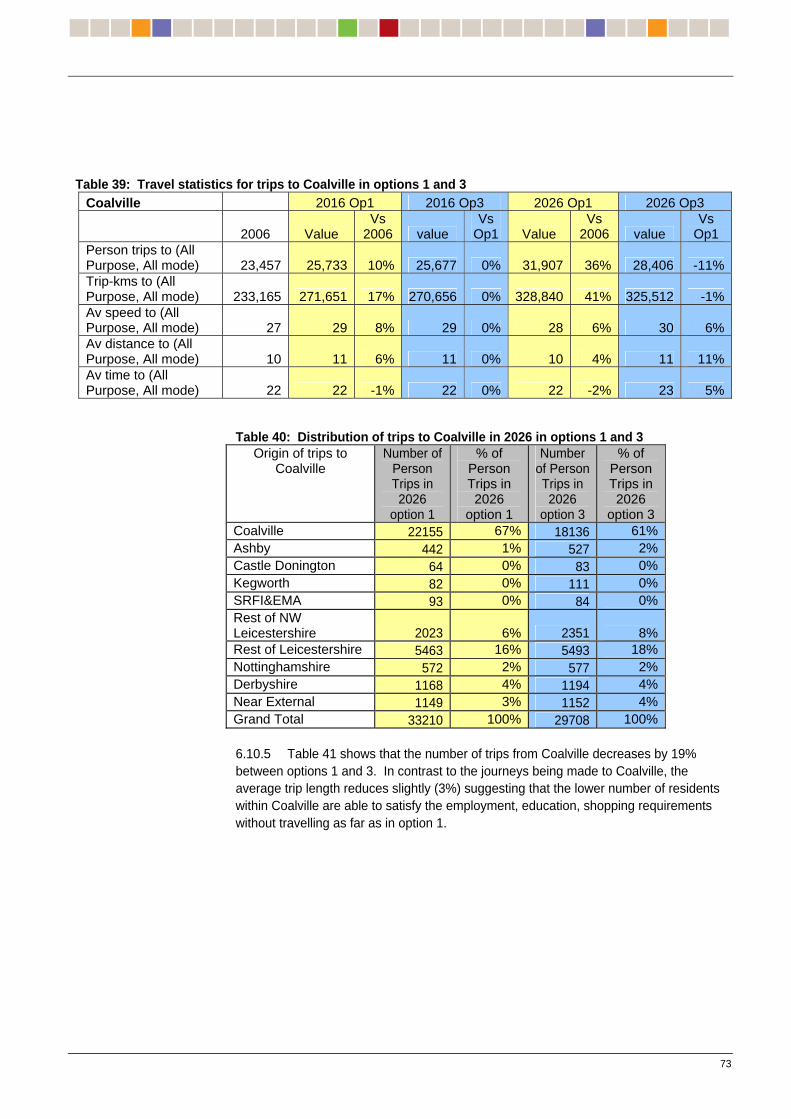
73
Table 39: Travel statistics for trips to Coalville in options 1 and 3 Coalville 2016 Op1 2016 Op3 2026 Op1 2026 Op3
2006 Value Vs
2006 value Vs
Op1 Value Vs
2006 value Vs
Op1 Person trips to (All Purpose, All mode) 23,457 25,733 10% 25,677 0% 31,907 36% 28,406 -11%Trip-kms to (All Purpose, All mode) 233,165 271,651 17% 270,656 0% 328,840 41% 325,512 -1%Av speed to (All Purpose, All mode) 27 29 8% 29 0% 28 6% 30 6%Av distance to (All Purpose, All mode) 10 11 6% 11 0% 10 4% 11 11%Av time to (All Purpose, All mode) 22 22 -1% 22 0% 22 -2% 23 5%
Table 40: Distribution of trips to Coalville in 2026 in options 1 and 3
Origin of trips to Coalville
Number of Person Trips in 2026
option 1
% of Person Trips in 2026
option 1
Number of Person Trips in 2026
option 3
% of Person Trips in 2026
option 3 Coalville 22155 67% 18136 61%Ashby 442 1% 527 2%Castle Donington 64 0% 83 0%Kegworth 82 0% 111 0%SRFI&EMA 93 0% 84 0%Rest of NW Leicestershire 2023 6% 2351 8%Rest of Leicestershire 5463 16% 5493 18%Nottinghamshire 572 2% 577 2%Derbyshire 1168 4% 1194 4%Near External 1149 3% 1152 4%Grand Total 33210 100% 29708 100% 6.10.5 Table 41 shows that the number of trips from Coalville decreases by 19% between options 1 and 3. In contrast to the journeys being made to Coalville, the average trip length reduces slightly (3%) suggesting that the lower number of residents within Coalville are able to satisfy the employment, education, shopping requirements without travelling as far as in option 1.

74
Table 41: Travel statistics for trips from Coalville in options 1 and 3 Coalville 2016 Op1 2016 Op3 2026 Op1 2026 Op3
2006 Value Vs
2006 value Vs
Op1 Value Vs
2006 value Vs
Op1 Person trips from (All Purpose, All mode) 23,046 27,238 18% 27,051 -1% 37,368 62% 30,137 -19%Trip-kms from (All Purpose, All mode) 249,832 342,599 37% 339,561 -1% 540,344 116% 422,685 -22%Av speed from (All Purpose, All mode) 29 32 9% 32 0% 33 12% 33 0%Av distance from (All Purpose, All mode) 11 13 16% 13 0% 14 33% 14 -3%Av time from (All Purpose, All mode) 22 24 6% 24 0% 26 19% 26 -3%
6.10.6 Table 42 shows that the proportion of trips from Coalville which have their destination within the town rises although the total number falls in line with the general decrease in the number of trips. The distribution of trips remains very similar between the two options as trips to all the destinations from Coalville reduce at a similar rate.
Table 42: Distribution of trips from Coalville in 2026 in options 1 and 3 Destination of
trips from Coalville
Number of Person Trips in 2026
option 1
% of Person Trips in 2026
option 1
Number of
Person Trips in 2026
option 3
% of Person Trips in 2026
option 3
Coalville 22155 57% 18136 58% Ashby 703 2% 539 2% Castle Donington 120 0% 93 0% Kegworth 149 0% 121 0% SRFI&EMA 439 1% 346 1% Rest of NW Leicestershire 2351 6% 1967 6% Rest of Leicestershire 7371 19% 6015 19% Nottinghamshire 766 2% 619 2% Derbyshire 1225 3% 1000 3% Near External 3356 9% 2569 8% Grand Total 38635 100% 31405 100%
Ashby
6.10.7 In this option, the growth in dwelling numbers in Ashby is greater than in option 1, but around 600 less than in option 2
6.10.8 Figure 46 shows that average road speeds within Ashby are lower than in option 1, especially on the roads providing access to the A42.

Figure 46: Difference in speed by link in and around Ashby between option 3 and option 1 in 2026 6.10.9 The pattern of congestion remains similar to that seen in Option 2 but the effect on the average speed is less than in option 2 with the total delay in the town only increasing by 11% over option 1 (see Table 43). In option 2, where there were an additional 600 dwellings to 2026 a 16% increase was seen (see Table 31)
Table 43: Travel statistics within Ashby town. Comparison between Options 1 and 3 Ashby 2016 Op1 2016 Op3 2026 Op1 2026 Op3
2006 Value Vs
2006 value Vs
Op1 Value Vs
2006 value Vs
Op1 Car: Average Speed kph 32 32 -3% 31 -1% 31 -5% 30 -2%Car: Total veh-km 24437 26355 8% 26908 2% 28995 19% 30458 5%Car: Total veh-mins 752 834 11% 859 3% 937 25% 1007 8%Car: Total delay (veh-mins) 159 192 21% 199 4% 232 46% 257 11%
6.10.10 There is a 10% increase in trips to the town (see Table 44) which is associated with the increased service employment and activity within the town. These are mainly shorter trips which reduce the average distance (down 8%) and time travelled (down 4%).
75

76
Table 44: Travel statistics for trips to Ashby in options 1 and 3 Ashby 2016 Op1 2016 Op3 2026 Op1 2026 Op3
2006 Value Vs
2006 value Vs
Op1 Value Vs
2006 Value Vs
Op1 Person trips to (All Purpose, All mode) 9,050 9,369 4% 9,747 4% 9,200 2% 10,148 10%Trip-kms to (All Purpose, All mode) 98,190 118,231 20% 117,426 -1% 132,313 35% 134,348 2%Av speed to (All Purpose, All mode) 30 33 8% 32 -3% 34 13% 33 -4%Av distance to (All Purpose, All mode) 11 13 16% 12 -5% 14 33% 13 -8%Av time to (All Purpose, All mode) 22 23 8% 23 -2% 25 18% 24 -4%
6.10.11 Looking at the distribution of trips to Ashby (Table 45) it can be seen that the town becomes even more self contained with 43% of trips to Ashby starting within the town. This should be compared to 38% in option 1.
Table 45: Distribution of trips to Ashby comparing option 1 and option 3 Origin of trips to Ashby % of Person
Trips in 2026 option 1
% of Person Trips in 2026
option 3 Coalville 8% 5% Ashby 38% 43% Castle Donington 0% 0% Kegworth 0% 0% SRFI&EMA 0% 0% Rest of NW Leicestershire 21% 21% Rest of Leicestershire 7% 6% Nottinghamshire 2% 2% Derbyshire 13% 12% Near External 10% 9% Grand Total 100% 100%
6.10.12 The number of trips being made from Ashby increases by 22% due to the increase in residents living in the town. The average distance of the trips from Ashby remains similar to option 1, and thus with the increased number of residents the total traffic increases by 21%. (see Table 46).

77
Table 46: Travel statistics for trips from Ashby in options 1 and 3 Ashby 2016 Op1 2016 Op3 2026 Op1 2026 Op3
2006 Value Vs
2006 value Vs
Op1 Value Vs
2006 value Vs
Op1 Person trips from (All Purpose, All mode) 8,148 8,757 7% 9,505 9% 8,787 8% 10,733 22%Trip-kms from (All Purpose, All mode) 115,131 138,185 20% 150,080 9% 159,946 39% 193,932 21%Av speed from (All Purpose, All mode) 29 32 10% 32 -1% 34 16% 33 -2%Av distance from (All Purpose, All mode) 14 16 12% 16 0% 18 29% 18 -1%Av time from (All Purpose, All mode) 29 30 2% 30 1% 32 11% 33 1%
Castle Donington
6.10.13 In Figure 47 the flow changes around Castle Donington, Kegworth, the airport and J24 SRFI can be seen. The large increase in dwellings in the area of Castle Donington is increasing flow on the roads in the area. The new bypass around the town (shown in green) is reducing flow on the old route through the town within the town itself but is increasing flow on the roads at either end of the bypass. The new bypass makes a more convenient access for traffic to East Midlands Airport and therefore draws more traffic through this route, diverting it from the route through the town.
6.10.14 There is also an increase in the flow of traffic from Castle Donington across to Junction 24 of the M1 as the extra employed residents living in the new dwellings access the trunk road network.

Figure 47: Difference in flow by link in and around Castle Donington, Kegworth, East Midlands Airport and J24 SRFI between option 3 and option 1 in 2026 6.10.15 The effect of these flow changes can be seen in Figure 48 where the increase in congestion and slow down of the roads at either end of the new bypass are very noticeable. The speeding up of the route through the town as traffic diverts to the bypass can also be seen.
78

Figure 48: Difference in speed by link in and around Castle Donington, Kegworth, East Midlands Airport and J24 SRFI between option 3 and option 1 in 2026
6.10.16 Part of the A6 northbound through the centre of Kegworth which was experiencing congestion in option 1 sees a reduction in flow and increase in speed in option 3. The reduction in speed was between 15 and 40% between 2006 and 2026 in option 1 and the increase in speed in option 3 is only between 2 and 5% therefore option 3 only has a small impact on the congestion introduced by option 1.
6.10.17 Table 47 below shows the travel statistics for the traffic on the network within Castle Donington. The totals for option 1 do not include the bypass whereas the totals for option 3 do. This makes it difficult to compare some of the results, for example the 8% increase in the total distance travelled by cars within the town is partially due to the increase in employed residents and traffic on the network but also partially due to the creation of the new stretch of road and the extra traffic which it brings through the town to the airport site.
Table 47: Travel statistics for the town of Castle Donington. Comparison between options 1 and 3. Castle Donington 2016 Op1 2016 Op3 2026 Op1 2026 Op3
2006 Value Vs
2006 value Vs
Op1 Value Vs
2006 Value Vs
Op1 Car: Average Speed kph 30 29 -3% 30 2% 27 -10% 28 5%Car: Total veh-km 8638 9207 7% 9603 4% 10897 26% 11792 8%Car: Total veh-mins 286 313 10% 320 2% 401 40% 415 3%
Car: Total delay (veh-mins) 30 37 26% 36 -5% 71 139% 61-
14%
79

80
6.10.18 There is a very clear overall decrease in delay within the town of 14% which illustrates the mitigating effect of the bypass despite the increase in traffic.
6.10.19 There are 16% more trips originating in Castle Donington due to the increase in residents as seen in Table 49 below.
6.10.20 Those travelling both to and from the town are on average travelling less far in option 3; 4% reduction in average distance of trips to the town (see Table 48) and 8% reduction in average distance of trips from the town (see Table 49). The extra dwellings within the town are being partially filled by those accessing local employment some of them taking the new endogenous employment created by the demand from the increase in residents.
Table 48: Travel statistics for trips to Castle Donington in options 1 and 3 Castle Donington 2016 Op1 2016 Op3 2026 Op1 2026 Op3
2006 Value Vs
2006 value Vs
Op1 Value Vs
2006 Value Vs
Op1 Person trips to (All Purpose, All mode) 9,965 15,386 54% 15,589 1% 17,864 79% 18,602 4%Trip-kms to (All Purpose, All mode) 263,068 490,642 87% 490,323 0% 652,701 148% 653,115 0%Av speed to (All Purpose, All mode) 45 49 8% 49 0% 50 9% 49 -1%Av distance to (All Purpose, All mode) 26 32 21% 31 -1% 37 38% 35 -4%Av time to (All Purpose, All mode) 35 39 12% 39 -1% 44 27% 43 -3%
6.10.21 Although there is an average speed increase within Castle Donington due to the introduction of the bypass there is a decrease in the average speed on journeys both to and from the town due to the slow down on roads in the surrounding areas as was seen in Figure 43.
Table 49: Travel statistics for trips from Castle Donington in options 1 and 3 Castle Donington 2016 Op1 2016 Op3 2026 Op1 2026 Op3
2006 Value Vs
2006 value Vs
Op1 Value Vs
2006 Value Vs
Op1 Person trips from (All Purpose, All mode) 6,439 7,500 16% 7,858 5% 8,761 36% 10,140 16%Trip-kms from (All Purpose, All mode) 153,556 221,637 44% 226,966 2% 300,042 95% 319,807 7%Av speed from (All Purpose, All mode) 44 48 11% 48 -1% 50 13% 48 -3%Av distance from (All Purpose, All mode) 24 30 24% 29 -2% 34 44% 32 -8%Av time from (All Purpose, All mode) 33 37 12% 36 -1% 41 27% 39 -5%
6.10.22 Table 50 shows that Castle Donington sees the number of trips that start and finish within the town rising from 37% to 43%.

81
Table 50: Distribution of trips to Castle Donington in 2026 in option 1 and 3 Origin of trips to
Castle Donington Number of
Person Trips in
2026 option 1
% of Person Trips in
2026 option 1
Number of Person Trips in
2026 option 3
% of Person Trips in
2026 option 3
Coalville 120 2% 93 2%Ashby 34 1% 42 1%Castle Donington 1917 37% 2514 43%Kegworth 106 2% 134 2%SRFI&EMA 165 3% 193 3%Rest of NW Leicestershire
192 4% 200 3%
Rest of Leicestershire
322 6% 326 6%
Nottinghamshire 462 9% 460 8%Derbyshire 1430 27% 1414 24%Near External 490 9% 492 8%Grand Total 5237 100% 5868 100%
6.10.23 There is an increase in the number of trips being made from Castle Donington in option 3 to all destinations because of the increase in residents however the distribution of these trips remains similar to that in option 1 as can be seen in Table 51 below. Many factors influence where people choose to live and work, with the lower income routine workers tending to live closer to their employment, and the higher income managerial / professional workers (who tend to be more specialised) tending to travel further. In both option 1 and option 3 the proportion of trips starting and finishing in the local area is high; 59% of trips from Castle Donington (Table 51) end in Castle Donington, Kegworth, the SRFI or the airport. These results reflect the impact of other opportunities for employment within the area, travel costs, as well as the socio-economic profile of the residents

82
Table 51: Distribution of trips from Castle Donington in 2026 in option 1 and 3 Destination of trips
from Castle Donington
Number of
Person Trips in 2026
option 1
% of Person Trips in 2026
option 1
Number of
Person Trips in 2026
option 3
% of Person Trips in 2026
option 3
Coalville 64 1 83 1 Ashby 30 1 40 1 Castle Donington 1917 40 2514 41 Kegworth 38 1 51 1 SRFI&EMA 866 18 1077 17 Rest of NW Leicestershire
250 5 316 5
Rest of Leicestershire
337 7 442 7
Nottinghamshire 304 6 379 6 Derbyshire 663 14 805 13 Near External 341 7 453 7 Grand Total 4810 100 6159 100
Kegworth
6.10.24 Most of the dwelling development in Kegworth occurs between 2016 and 2026.
6.10.25 Despite a 32% increase (compared to option 1) in the number of employed residents in Kegworth (see Table 36), the total car-kilometres travelled on the roads in the town and the total time of cars spent on the roads both drop by 4% in option 3 (see Table 52), The result of these changes is that the total delay experienced by cars in Kegworth decreases by 2% in option 3 compared to option 1.
Table 52: Travel statistics for the town of Kegworth. Comparison between options 1 and 3. Kegworth 2016 Op1 2016 Op3 2026 Op1 2026 Op3
2006 Value Vs
2006 Value Vs
Op1 Value Vs
2006 Value Vs
Op1
Car: Average Speed kph 29 26-
12% 26 1% 25 -15% 25 0%Car: Total veh-km 11754 11351 -3% 10878 -4% 11865 1% 11391 -4%Car: Total veh-mins 404 441 9% 417 -5% 481 19% 460 -4%Car: Total delay (veh-mins) 83 151 81% 146 -3% 175 110% 172 -2%
6.10.26 This reduction in traffic can be explained from Table 53 which shows that although the number of trips to Kegworth is rising by 12%, the average length of trips is 6% shorter implying that it is shorter trips that are being created within the town. Table 54 reinforces this showing that in option 3 the number of trips to Kegworth that originate within the town rise to 35% of the total in option 3 compared to 31% in option 1..

83
Table 53: Travel statistics for trips to Kegworth in options 1 and 3 Kegworth 2016 Op1 2016 Op3 2026 Op1 2026 Op3
2006 Value Vs
2006 Value Vs
Op1 Value Vs
2006 Value Vs
Op1 Person trips to (All Purpose, All mode) 2,289 2,352 3% 2,431 3% 2,278 0% 2,552 12%Trip-kms to (All Purpose, All mode) 36,893 40,043 9% 40,507 1% 40,018 8% 42,277 6%Av speed to (All Purpose, All mode) 38 39 4% 39 -1% 39 4% 38 -3%Av distance to (All Purpose, All mode) 16 17 6% 17 -2% 18 9% 17 -6%Av time to (All Purpose, All mode) 26 26 1% 26 -1% 27 5% 26 -3%
Table 54: Distribution of trips to Kegworth in 2026 in option 1 and 3
Origin of trips to Kegworth
Number of Person Trips in
2026 option 1
% of Person Trips in
2026 option 1
Number of Person Trips in
2026 option 3
% of Person Trips in
2026 option 3
Coalville 149 6% 121 5%Ashby 20 1% 26 1%Castle Donington 38 2% 51 2%Kegworth 732 31% 922 35%SRFI&EMA 51 2% 59 2%Rest of NW Leicestershire
118 5% 135 5%
Rest of Leicestershire
480 20% 513 20%
Nottinghamshire 282 12% 298 11%Derbyshire 299 13% 309 12%Near External 176 7% 186 7%Grand Total 2344 100% 2618 100%
6.10.27 Table 55 shows that the number of trips from Kegworth increases by 26% between option 1 and option 3 in 2026. The total trip kilometres travelled from the town increases in line with this with a 28% rise over option 1 and the average distance and time increase by just 1%. Table 56 indicates that the travel pattern does not change with respect to option 1, with around 36% of trips from Kegworth ending in Castle Donington, Kegworth, the SRFI or the airport

84
Table 55: Travel statistics for trips from Kegworth in options 1 and 3 Kegworth 2016 Op1 2016 Op3 2026 Op1 2026 Op3
2006 Value Vs
2006 Value Vs
Op1 Value Vs
2006 Value Vs
Op1 Person trips from (All Purpose, All mode) 2,829 2,986 6% 3,204 7% 2,802 -1% 3,537 26%Trip-kms from (All Purpose, All mode) 45,931 50,785 11% 54,516 7% 49,376 7% 63,119 28%Av speed from (All Purpose, All mode) 36 38 5% 38 0% 38 5% 38 0%Av distance from (All Purpose, All mode) 16 17 5% 17 0% 18 9% 18 1%Av time from (All Purpose, All mode) 27 27 0% 27 0% 28 4% 28 1%
Table 56: Distribution of trips from Kegworth in 2026 in option 1 and 3 Destination of trips
from Kegworth Number
of Person Trips in 2026
option 1
% of Person Trips in 2026
option 1
Number of
Person Trips in 2026
option 3
% of Person Trips in 2026
option 3
Coalville 82 3 111 3 Ashby 35 1 46 1 Castle Donington 106 4 134 4 Kegworth 732 25 922 25 SRFI&EMA 216 7 263 7 Rest of NW Leicestershire
186 6 242 7
Rest of Leicestershire
672 23 849 23
Nottinghamshire 348 12 424 12 Derbyshire 262 9 307 8 Near External 254 9 329 9 Grand Total 2892 100 3627 100
6.10.28 Table 57 shows that trips to the SRFI and East Midlands Airport are undergoing a similar shift with more local trips from towns in the surrounding area as the new residents take up some of the employment available and there are employers business trips to the airport.

85
East Midlands Airport and SRFI
6.10.29 The pattern of trip making to the airport and SRFI is not significantly affected by the different distributions of the housing within the district. From Table 57 it can be seen that the most significant change comes from Castle Donington which in option 3 supplies 8% of the workforce compared to 6% in option 1
Table 57: Distribution of trips to East Midlands Airport and J24 SRFI in 2026 in option 1 and 3 Origin of trips to East Midlands Airport and
J24 SRFI
Number of Person Trips in
2026 option 1
% of Person Trips in
2026 option 1
Number of Person Trips in
2026 option 3
% of Person Trips in
2026 option 3
Coalville 439 3% 346 2%Ashby 86 1% 105 1%Castle Donington 866 6% 1077 8%Kegworth 216 2% 263 2%SRFI&EMA 28 0% 28 0%Rest of NW Leicestershire
450 3% 471 3%
Rest of Leicestershire
2170 16% 2137 15%
Nottinghamshire 2386 17% 2360 17%Derbyshire 3546 26% 3529 25%Near External 3644 26% 3622 26%Grand Total 13832 100% 13939 100%
6.11 SUMMARY OF THE MAIN IMPACTS OF OPTION 3
6.11.1 The distribution of dwelling growth in a more uniform pattern around the district has had little impact on the overall levels of traffic and delay within the district.
6.11.2 The impacts, where they occur, are more local with the reduced dwelling growth in Coalville resulting in less congestion than in option 1, whilst Ashby experiences more congestion.
6.11.3 The reduction in housing growth within Coalville compared to option 1 has not caused any housing pressure within the town as the demands for housing have been met from elsewhere in the district.
6.11.4 The bypass at Castle Donington acts to reduce congestion within the town, however congestion on roads leading to it from the north and the south increases.

86
7 References
EMRA (2006), "East Midlands Land Provision Study." London: Roger TYM & PARTNERS.
EMRA (2008). “East Midlands Regional Plan Proposed Changes.” Part1: Regional Strategy, Policy 13, 50-51. Nottingham: East Midlands Regional Assembly.
EP (2001), "Employment Densities: A Full Guide", London: English Partnership and the Regional Development Agencies. WSP(2009a) PTOLEMY: 2016 Reference case supply inputs, TIF Technical Note WSP(2009b) WSP Technical Note TN01 Transport Assumption TN01_003_Transport Assumptions_v3.doc

Appendices, Figures & Tables


Appendix A Traffic Validation

ROAD TRAFFIC VALIDATION IN NORTH WEST LEICESTERSHIRE
The existing PTOLEMY Network Traffic Model validation has been focused upon the cordons and screenlines in the three City areas. For the local model runs further road traffic validation has been undertaken prior to the running of the housing tests. This helps to ensure that the model results are fit for purpose.
Road traffic validation consists of checking of the modelled road traffic loadings under congested traffic conditions. To carry out this validation, the PTOLEMY model is run from its calibration year (2001) to its Base Year (2006) in forecasting mode. The validation has been carried out primarily using local traffic survey data supplied by the Leicestershire County Council and data from the DfT’s rotating traffic surveys.
Given that the model is run in forecasting mode (i.e. in an identical way to running the model to produce future year forecasts) none of the surveyed data used in model validation has been used in calibrating the model. Also, the travel demand matrices used for car traffic assignment are synthesised matrices that have been forecast by the PTOLEMY travel demand sub-model using land use activity and regional economic inputs. No matrix-estimation techniques (such as used within SATURN modelling) have been applied to alter the synthesised demand matrices prior to traffic assignment.
TRAFFIC COUNTS: VALIDATION FOR CARS AND ROAD GOODS VEHICLES
The surveyed traffic count data used for the road traffic validation has been obtained from the following sources:
Local surveys of road traffic by hour for some road links in the Hinckley area (2004-2008).
This is supplemented by the DfT road traffic database, which records manually classified road traffic counts by hour for 12 hours a day on the basis of a rotating census (2000 to 2004) on a limited number of links.
At some sites there is data from both the local survey and from the DfT’s road traffic database. In such cases local survey data (which is more recent and generally considered more reliable) is always used in preference to the earlier DfT data.
The total number of trips modelled was validated in terms of car volume and total traffic in equivalent private car unit (PCU). Powered two-wheelers (motorcycles and mopeds) are included with the cars, in accordance with the definitions used for PTOLEMY modelling.
The modelled traffic flow data also includes exogenous load – which is estimated based on road counts to include the effect of goods vehicle and car traffic which are not included in the modelled, endogenous demand matrices2. The exogenous loads are calibrated along each motorway and trunk road corridor on the basis of the difference between the observed traffic counts and the assigned, endogenous road traffic.
2 This additional traffic could arise from i) traffic that is travelling right across the PTOLEMY area on major roads, ii) intra-zonal traffic within large zones which is not assigned endogenously onto the network and iii) a small amount of road goods vehicle traffic that has not been included in the good vehicle matrices; this primarily applies to areas outside the 3 Cities. Item i) implies considerable traffic volume on the trunk roads, whilst ii) and iii) are relatively minor.

All PTOLEMY model results in this section are from the model outputs for the Base Year of 2006 (version 8)
Key to modelling transport impacts of housing developments within North West Leicestershire is the assurance that traffic flows on the major roads match well with the counts. Results are presented for total vehicles in terms of the % difference between the modelled traffic counts and the observed traffic counts and the GEH statistic [see Design Manual for Roads and Bridges, Vol12, Section2, Part1]:
Figure A.1 shows the percentage difference all vehicles
Figure A.2 shows the GEH statistic for all vehicles

Figure A.1: Modelled traffic flows versus observed counts. Percentage difference

Figure A.2: Modelled traffic flows versus observed counts. GEH statistic

Appendix B Zone definitions for reporting land use and transport characteristics

Figure B.1: PTOLEMY zones in North West Leicestershire Labels denote the zone numbers.

Coalville
Ashby
Castle Donington
Kegworth
SRFI & EMA
Rest of NW.Leic
Rest of Leicestershire
Nottinghamshire
Derbyshire
External
Figure B.2: Grouping of zones for reporting purposes

Figure B.3: PTOLEMY network links included in analysis of the towns.

Appendix C Model Run Location Reference

The serial numbers of the runs reported are shown in Table C.1 below:
Table C.1: Reference location of the PTOLEMY runs 2016 Option1 PTOLEMY2057\2016\AM_v4\OP1_v1
2016 Option 2 PTOLEMY2057\2016\AM_v4\OP2_v3
2016 Option 3 PTOLEMY2057\2016\AM_v4\OP3_v3
2026 Option1 PTOLEMY2057\2026\AM_v4\OP1_v1
2026 Option2 PTOLEMY2057\2026\AM_v4\OP2_v1
2026 Option3 PTOLEMY2057\2026\AM_v4\OP3_v1


Appendix D TEMPRO Employment Forecasts

TEMPRO (Trip End Model PROgram) is a tool developed for the Department for Transport’s that is used for forecasting the growth of trips ends within Great Britain, using detailed employment, population and car ownership forecasts as an input. These inputs can be taken and used to forecast employment growth within the PTOLEMY model.
PTOLEMY makes use of version 5.3 of the model whereas the current version is 5.4,.
To retain consistency with previous model runs, the model inputs have remained based on version 5.3, but it would be expected to upgrade to version 5.4 or version 6 in the near future.
This appendix summarises the difference in employment projections between TEMPRO 5.3 and TEMPRO 5.4.
TEMPRO is used within PTOLEMY to calculate the growth in the basic industry employment within each district, and total growth in employment for the 3 cities sub-region.
TEMPRO 5.4 provides around 2.6% more employment growth within the 3 cities sub-region than TEMPRO 5.3 between 2006 and 2026, with increased growth in Nottinghamshire and Leicestershire and reduced growth in Derbyshire. In addition, it provides a greater emphasis on developments within the cities of Nottingham, Leicester and Derby.
In NW Leicestershire the difference in employment growth is around 1%. See Table 58 and Table 59 for summary details.

Table 58: Comparison between TEMPRO 5.3 and TEMPRO 5.4 by district
Employment growth
2006 to 2026 District
5.3 5.4 difference
Derby 11% 10% -1%
Amber Valley 11% 7% -4%
Bolsover 11% 7% -4%
Derbyshire Dales 11% 4% -6%
Erewash 11% 5% -6%
North East Derbyshire 10% 7% -4%
South Derbyshire 12% 4% -8%
Nottingham 8% 17% 9%
Ashfield 8% 12% 4%
Broxtowe 8% 10% 3%
Gedling 8% 14% 6%
Rushcliffe 8% 11% 3%
Leicester 9% 18% 8%
Blaby 9% 15% 6%
Charnwood 9% 10% 1%
Harborough 10% 12% 1%
Hinckley and Bosworth 9% 11% 2%
Melton 10% 11% 2%
North West Leicestershire 10% 11% 1%
Oadby and Wigston 9% 13% 4%
Grand Total 9.5% 12.2% 2.6%
Table 59: Comparison between TEMPRO 5.3 and 5.4 at county level
County 5.3 5.4 differenceDerbyshire 11% 7% -4%NottinghamShire 8% 15% 7%Leicestershire 9% 14% 5%3 cities sub area% 9.5% 12.2% 2.6%
Growth2006 to 2026
Within NW Leicestershire there are a total of 44,936 workers in 2006, and therefore with 10% growth this would be equivalent to a growth of around 4,494 workers, with 11% growth this would be 4,943 ( an increase of 449 workers).
However the difference between these two forecasts is insignificant compared to the levels of growth that are forecast for the airport and the proposed SRFI at J24 of the M1.
The airport forecasts that it will grow by 300 workers per year, and the proposed Strategic Rail Freight Interchange expects around 10,000 workers by 2016. If these levels of growth were included within the forecast growth rates then a significant amount of employment would be removed from the rest of the district which does not seem realistic. The growth at these two sites is therefore considered to be in addition to that forecast in TEMPRO.
Within NW Leicestershire this means that employment is assumed to grow from around 45,000 to 65,000 workers (an increase of 45%) see Table 5 in the main report, compared to the 10% or 11% from TEMPRO

PTOLEMY: Strategic housing growth scenarios in North West Leicestershire Appendices E to G North West Leicestershire District Council June 2009
`

QM
Issue/revision Issue 1 Revision 1 Revision 2 Revision 3
Remarks Draft copy for
comment.
Issue 1 Issue 2
Date 10/2/09 5/6/09
Prepared by Jenny Hunt Jenny Hunt
Duncan Forbes
Duncan Forbes
Signature Jenny Hunt Jenny Hunt
Duncan Forbes
Duncan Forbes
Checked by Duncan Forbes Clare Lindsay Clare Lindsay
Signature Duncan Forbes Clare Lindsay Clare Lindsay
Authorised by Duncan Forbes Duncan Forbes Duncan Forbes
Signature Duncan Forbes Duncan Forbes Duncan Forbes
Project number 11642057 11642057 11642057
File reference Appendices_issu
e1.doc
Appendices_Issu
e2
Appendix E Option 1 Vs 2006 Flow Volume And Speed Change Maps
Appendix F Option 2 Vs Option 1 Flow Volume And Speed Change Maps
Appendix G Option 3 Vs Option 1 Flow Volume And Speed Change Maps
WSP Development and Transportation 66-68 Hills Road Cambridge CB2 1LA Tel: +44 (0)1223 558050 Fax: +44 (0)1223 558051 http://www.wspgroup.com WSP UK Limited | Registered Address WSP House, 70 Chancery Lane, London, WC2A 1AF, UK | Reg No. 01383511 England | WSP Group plc | Offices worldwide

Appendices, Figures & Tables
North West Leicestershire: Strategic housing growth - Appendices


North West Leicestershire: Strategic housing growth - Appendices
Appendix E Option 1 Vs 2006 Flow Volume And Speed Change Maps


CHANGES IN FLOW VOLUME AND SPEED ON THE NETWORK IN NORTH WEST LEICESTERSHIRE
Figure E1: Change in flow by link between 2006 and option 1 2016
Figure E2: Change in flow by link between 2006 and option 1 2026
North West Leicestershire: Strategic housing growth - Appendices

Figure E3: Change in speed by link between 2006 and option 1 2016
Figure E4: Change in speed by link between 2006 and option 1 2026
North West Leicestershire: Strategic housing growth - Appendices

Figure E5: Change in average speed by zone between 2006 and option 1 2016
Figure E6: Change in average speed by zone between 2006 and option 1 2026
North West Leicestershire: Strategic housing growth - Appendices

CHANGES IN FLOW VOLUME AND SPEED IN AND AROUND COALVILLE
Figure E7: Change in flow by link in and around Coalville between 2006 and option 1 2016
Figure E8: Change in flow by link in and around Coalville between 2006 and option 1 2026
North West Leicestershire: Strategic housing growth - Appendices

Figure E9: Change in speed by link in and around Coalville between 2006 and option 1 2016
Figure E10: Change in speed by link in and around Coalville between 2006 and option 1 2026
North West Leicestershire: Strategic housing growth - Appendices

CHANGES IN FLOW VOLUME AND SPEED IN AND AROUND ASHBY
Figure E11: Change in flow by link in and around Ashby between 2006 and option 1 2016
Figure E12: Change in flow by link in and around Ashby between 2006 and option 1 2026
North West Leicestershire: Strategic housing growth - Appendices

Figure E13: Change in speed by link in and around Ashby between 2006 and option 1 2016
Figure E14: Change in speed by link in and around Ashby between 2006 and option 1 2026
North West Leicestershire: Strategic housing growth - Appendices

CHANGES IN FLOW VOLUME AND SPEED IN AND AROUND CASTLE DONINGTON, EAST MIDLANDS AIRPORT AND M1 J24 SRFI
Figure E15: Change in flow by link in and around Castle Donington between 2006 and Option 1 2016
Figure E16: Change in flow by link in and around Castle Donington between 2006 and Option 1 2026
North West Leicestershire: Strategic housing growth - Appendices

Figure E17: Change in speed by link in and around Castle Donington between 2006 and Option 1 2016
Figure E18: Change in speed by link in and around Castle Donington between 2006 and Option 1 2026
North West Leicestershire: Strategic housing growth - Appendices

North West Leicestershire: Strategic housing growth - Appendices

North West Leicestershire: Strategic housing growth - Appendices
Appendix F Option 2 Vs Option 1 Flow Volume And Speed Change Maps

CHANGES IN FLOW VOLUME AND SPEED ON THE NETWORK IN NORTH WEST LEICESTERSHIRE
Figure F1: Difference in flow by link between option 1 and option 2 in 2016
Figure F2: Difference in flow by link between option 1 and option 2 in 2026
North West Leicestershire: Strategic housing growth - Appendices

Figure F3: Difference in speed by link between option 1 and option 2 in 2016
Figure F4: Difference in speed by link between option 1 and option 2 in 2026
North West Leicestershire: Strategic housing growth - Appendices

Figure F5: Difference in average speed by zone between option 1 and option 2 in 2016
Figure F6: Difference in average speed by zone between option 1 and option 2 in 2026
North West Leicestershire: Strategic housing growth - Appendices

CHANGES IN FLOW VOLUME AND SPEED IN AND AROUND COALVILLE
Figure F7: Difference in flow by link in and around Coalville between option 1 and option 2 in 2016
Figure F8: Difference in flow by link in and around Coalville between option 1 and option 2 in 2026
North West Leicestershire: Strategic housing growth - Appendices

Figure F9: Difference in speed by link in and around Coalville between option 1 and option 2 in 2016
Figure F10: Difference in speed by link in and around Coalville between option 1 and option 2 in 2026
North West Leicestershire: Strategic housing growth - Appendices

CHANGES IN FLOW VOLUME AND SPEED IN AND AROUND ASHBY
Figure F11: Difference in flow by link in and around Ashby between option 1 and option 2 in 2016
Figure F 12: Difference in flow by link in and around Ashby between option 1 and option 2 in 2026
North West Leicestershire: Strategic housing growth - Appendices

Figure F13: Difference in speed by link in and around Ashby between option 1 and option 2 in 2016
Figure F14: Difference in speed by link in and around Ashby between option 1 and option 2 in 2026
North West Leicestershire: Strategic housing growth - Appendices

CHANGES IN FLOW VOLUME AND SPEED IN AND AROUND CASTLE DONINGTON, EAST MIDLANDS AIRPORT AND M1 J24 SRFI
Figure F15: Difference in flow by link in and around Castle Donington between option 1 and option 2 in 2016
Figure F16: Difference in flow by link in and around Castle Donington between option 1 and option 2 in 2026
North West Leicestershire: Strategic housing growth - Appendices

Figure F17: Difference in speed by link in and around Castle Donington between option 1 and option 2 in 2016
Figure F18: Difference in speed by link in and around Castle Donington between option 1 and option 2 in 2026
North West Leicestershire: Strategic housing growth - Appendices

North West Leicestershire: Strategic housing growth - Appendices
Appendix G Option 3 Vs Option 1 Flow Volume And Speed Change Maps

CHANGES IN FLOW VOLUME AND SPEED ON THE NETWORK IN NORTH WEST LEICESTERSHIRE
Figure G1: Difference in flow by link between option 1 and option 3 in 2016
Figure G2: Difference in flow by link between option 1 and option 3 in 2026
North West Leicestershire: Strategic housing growth - Appendices

Figure G3: Difference in speed by link between option 1 and option 3 in 2016
Figure G4: Difference in speed by link between option 1 and option 3 in 2026
North West Leicestershire: Strategic housing growth - Appendices

Figure G5: Difference in average speed by zone between option 1 and option 3 in 2016
Figure G6: Difference in average speed by zone between option 1 and option 3 in 2026
North West Leicestershire: Strategic housing growth - Appendices

CHANGES IN FLOW VOLUME AND SPEED IN AND AROUND COALVILLE
Figure G7: Difference in flow by link in and around Coalville between option 1 and option 3 in 2016
Figure G8: Difference in flow by link in and around Coalville between option 1 and option 3 in 2026
North West Leicestershire: Strategic housing growth - Appendices

Figure G9: Difference in speed by link in and around Coalville between option 1 and option 3 in 2016
Figure G10: Difference in speed by link in and around Coalville between Option 1 and Option 3 in 2026
North West Leicestershire: Strategic housing growth - Appendices

CHANGES IN FLOW VOLUME AND SPEED IN AND AROUND ASHBY
Figure G11: Difference in flow by link in and around Ashby between option 1 and option 3 in 2016
Figure G12: Difference in flow by link in and around Ashby between option 1 and option 3 in 2026
North West Leicestershire: Strategic housing growth - Appendices

Figure G13: Difference in speed by link in and around Ashby between option 1 and option 3 in 2016
Figure G14: Difference in speed by link in and around Ashby between option 1 and option 3 in 2026
North West Leicestershire: Strategic housing growth - Appendices

CHANGES IN FLOW VOLUME AND SPEED IN AND AROUND CASTLE DONINGTON, EAST MIDLANDS AIRPORT AND M1 J24 SRFI
Figure G15: Difference in flow by link in and around Castle Donington between option 1 and option 3 in 2016
Figure G16: Difference in flow by link in and around Castle Donington between option 1 and option 3 in 2026
North West Leicestershire: Strategic housing growth - Appendices

Figure G17: Difference in speed by link in and around Castle Donington between option 1 and option 3 in 2016
Figure G18: Difference in speed by link in and around Castle Donington between option 1 and option 3 in 2026
North West Leicestershire: Strategic housing growth - Appendices