ptfe crystallization mechanisms: insight from calorimetric
TRANSCRIPT
HAL Id: hal-02493258https://hal.archives-ouvertes.fr/hal-02493258
Submitted on 6 Apr 2020
HAL is a multi-disciplinary open accessarchive for the deposit and dissemination of sci-entific research documents, whether they are pub-lished or not. The documents may come fromteaching and research institutions in France orabroad, or from public or private research centers.
L’archive ouverte pluridisciplinaire HAL, estdestinée au dépôt et à la diffusion de documentsscientifiques de niveau recherche, publiés ou non,émanant des établissements d’enseignement et derecherche français ou étrangers, des laboratoirespublics ou privés.
PTFE crystallization mechanisms: Insight fromcalorimetric and dilatometric experiments
Gabriel Guenoun, Jean-Yvon Faou, Gilles Regnier, Nicolas Schmitt, StéphaneRoux
To cite this version:Gabriel Guenoun, Jean-Yvon Faou, Gilles Regnier, Nicolas Schmitt, Stéphane Roux. PTFE crystal-lization mechanisms: Insight from calorimetric and dilatometric experiments. Polymer, Elsevier, 2020,193, pp.1-8. �10.1016/j.polymer.2020.122333�. �hal-02493258�
PTFE crystallization mechanisms: Insight from calorimetric and dilatometricexperimentsGabriel Guenoun a,b,c,∗, Jean-Yvon Faou b, Gilles Régnier c, Nicolas Schmitt a,d, Stéphane Roux a
a Univ. Paris-Saclay, ENS-Paris-Saclay, CNRS, Laboratoire de Mécanique et Technologie, 61 Avenue du Président Wilson, 94235 Cachan Cedex, Franceb Saint-Gobain Research Paris, 39 Quai Lucien Lefranc, 93303 Aubervilliers Cedex, Francec PIMM, Arts et Métiers, CNRS, CNAM, HESAM Université, 151 boulevard de l’Hôpital, 75013 Paris, Franced INSPE, Univ. Paris-Est Créteil Val-de-Marne, Place du 8 mai, 1945 93203 Saint-Denis, France
A R T I C L E I N F O
Keywords:PTFECrystallization kineticsThermal expansion
A B S T R A C T
PTFE presents an original secondary crystallization that appears to be independent of the primary one.The conjunction of differential scanning calorimetry and dilatometry experiments has offered complementarydata to study both crystallization melted compacted powder and of recrystallized samples. The primarycrystallization is responsible for the crystallinity content variation with the cooling rate. It preserves theanisotropy induced by previous compaction that can be observed by dilatometry. Conversely, the secondarycrystallization appears to be instantaneous, reversible, kinetic-free and isotropic. It occurs over a widetemperature range between 250◦C and 310◦C.
1. Introduction
Polytetrafluoroethylene (PTFE) is a semi-crystalline polymer offer-ing many attractive properties. Its very low coefficient of friction, highthermal stability, good electrical insulation properties, hydrophobicityand biocompatibility make PTFE a material of wide usage in numerousindustrial applications [1–5].
Unlike other thermoplastics, it cannot be manufactured using con-ventional methods. Its high viscosity in the molten state precludesthe use of injection molding process. Nascent PTFE powder can beeither cold-pressed, extruded with an additional lubricant or via filmcasting [6]. After each of these processes, PTFE is generally sintered.Sintering consists in heating the part above its melting temperaturebefore cooling it down to recrystallize the polymer. The sintering stagecloses the initial porosity remaining after compaction and originat-ing from the powder state. The sintered parts exhibit a much highercohesion as particles coalesce during the thermal treatment.
A sintering cycle generates important strains in PTFE. The conceptof eigenstrain is very convenient to name the strain that would be mea-sured in a stress-free material if its microstructure and its temperaturewere spatially uniform [7]. For instance, in the case of a changeof temperature, the eigenstrain is precisely the thermal expansion orcontraction that a free solid with a uniform temperature would exhibit.PTFE overall eigenstrain originates from different physical mechanisms:thermal expansion, melting or crystallization, gas diffusion, porosity
∗ Corresponding author at: Univ. Paris-Saclay, ENS-Paris-Saclay, CNRS, Laboratoire de Mécanique et Technologie, 61 Avenue du Président Wilson, 94235Cachan Cedex, France.
E-mail address: [email protected] (G. Guenoun).
closure [8] and residual stress relaxation [9]. It was previously shownthat the eigenstrain behavior of as-polymerized PTFE follows a specificbehavior related to residual stress relaxation. The residual stresses aregenerated during the cold compaction stage. The relaxation leads toan anisotropic behavior as PTFE particles ‘‘recover’’ part of their initialconfiguration (before being pressed).
Among the mechanisms responsible for the eigenstrain, meltingand crystallization have the largest part. Crystallization and meltinggenerate large strain due to the density difference between crystallineand amorphous fraction [10]. In the case of cold-pressed PTFE sin-tering, large parts are subjected to thermal gradients. The couplingof the thermal inhomogeneity and large eigenstrain results in strainincompatibilities, and hence internal stresses, which may further leadto damage or cracking. Therefore understanding crystallization of PTFEand its kinetics is crucial to master internal stresses in a molded partduring sintering.
Several authors have shown the influence of the thermal historyon the crystallite size [11,12]. Crystal bands can be observed throughscanning electron microscopy. Their thickness increases with crystal-lization temperature and with time due to the perfection of the crystals.Crystallization kinetics was shown to be a signature of one-dimensionalgrowth [13–15]. PTFE was cooled at various cooling rates using ultrafast scanning calorimetry and it was shown that it crystallizes even atvery high cooling rates (up to 800,000 ◦C/s) [16]. Therefore crystal
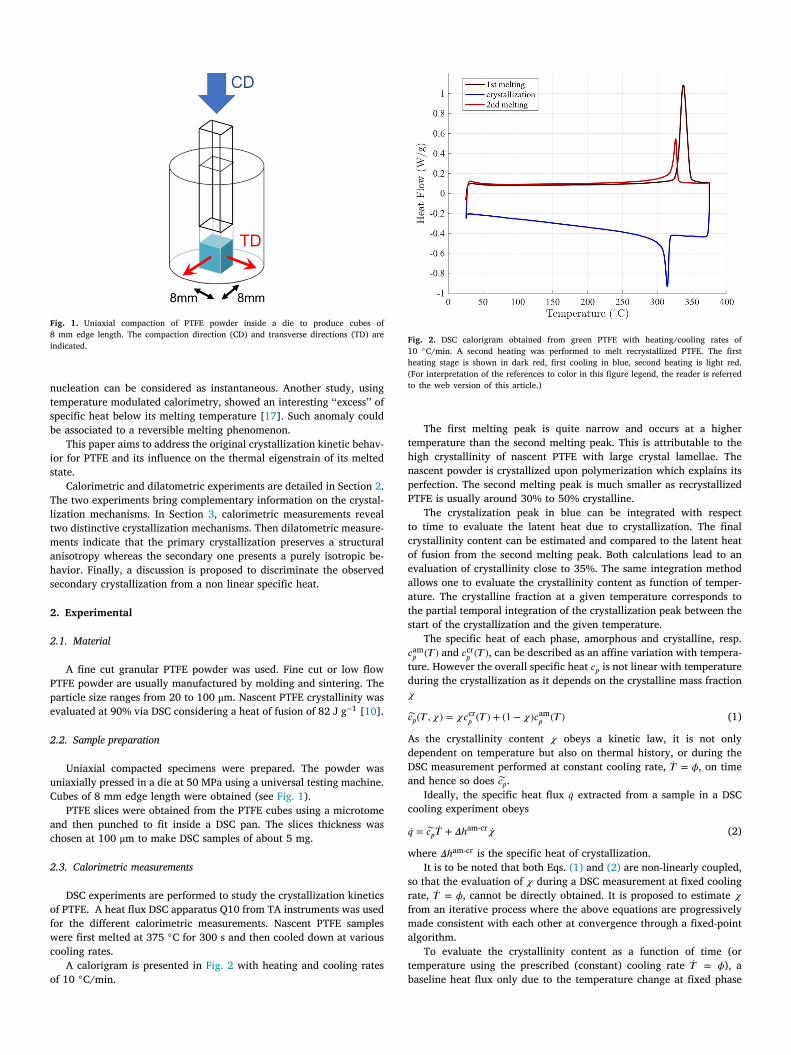
Fig. 1. Uniaxial compaction of PTFE powder inside a die to produce cubes of8 mm edge length. The compaction direction (CD) and transverse directions (TD) areindicated.
nucleation can be considered as instantaneous. Another study, usingtemperature modulated calorimetry, showed an interesting ‘‘excess’’ ofspecific heat below its melting temperature [17]. Such anomaly couldbe associated to a reversible melting phenomenon.
This paper aims to address the original crystallization kinetic behav-ior for PTFE and its influence on the thermal eigenstrain of its meltedstate.
Calorimetric and dilatometric experiments are detailed in Section 2.The two experiments bring complementary information on the crystal-lization mechanisms. In Section 3, calorimetric measurements revealtwo distinctive crystallization mechanisms. Then dilatometric measure-ments indicate that the primary crystallization preserves a structuralanisotropy whereas the secondary one presents a purely isotropic be-havior. Finally, a discussion is proposed to discriminate the observedsecondary crystallization from a non linear specific heat.
2. Experimental
2.1. Material
A fine cut granular PTFE powder was used. Fine cut or low flowPTFE powder are usually manufactured by molding and sintering. Theparticle size ranges from 20 to 100 μm. Nascent PTFE crystallinity wasevaluated at 90% via DSC considering a heat of fusion of 82 J g−1 [10].
2.2. Sample preparation
Uniaxial compacted specimens were prepared. The powder wasuniaxially pressed in a die at 50 MPa using a universal testing machine.Cubes of 8 mm edge length were obtained (see Fig. 1).
PTFE slices were obtained from the PTFE cubes using a microtomeand then punched to fit inside a DSC pan. The slices thickness waschosen at 100 μm to make DSC samples of about 5 mg.
2.3. Calorimetric measurements
DSC experiments are performed to study the crystallization kineticsof PTFE. A heat flux DSC apparatus Q10 from TA instruments was usedfor the different calorimetric measurements. Nascent PTFE sampleswere first melted at 375 ◦C for 300 s and then cooled down at variouscooling rates.
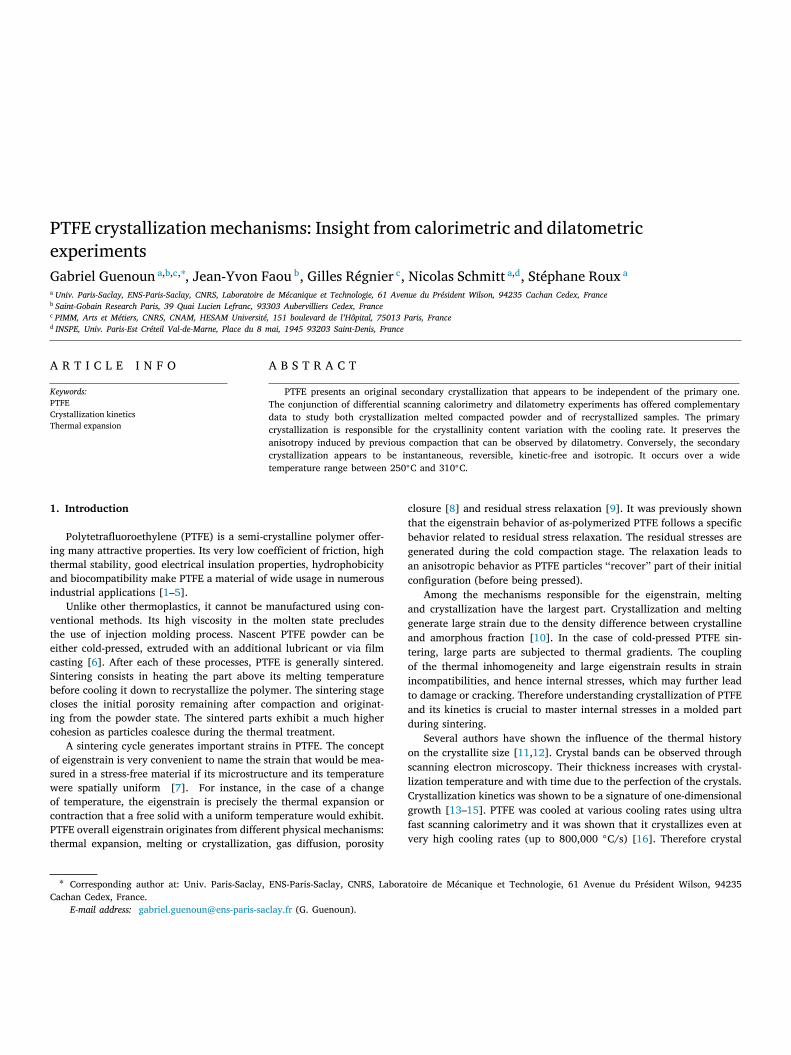
A calorigram is presented in Fig. 2 with heating and cooling ratesof 10 ◦C/min.
Fig. 2. DSC calorigram obtained from green PTFE with heating/cooling rates of10 ◦C/min. A second heating was performed to melt recrystallized PTFE. The firstheating stage is shown in dark red, first cooling in blue, second heating is light red.(For interpretation of the references to color in this figure legend, the reader is referredto the web version of this article.)
The first melting peak is quite narrow and occurs at a highertemperature than the second melting peak. This is attributable to thehigh crystallinity of nascent PTFE with large crystal lamellae. Thenascent powder is crystallized upon polymerization which explains itsperfection. The second melting peak is much smaller as recrystallizedPTFE is usually around 30% to 50% crystalline.
The crystalization peak in blue can be integrated with respectto time to evaluate the latent heat due to crystallization. The finalcrystallinity content can be estimated and compared to the latent heatof fusion from the second melting peak. Both calculations lead to anevaluation of crystallinity close to 35%. The same integration methodallows one to evaluate the crystallinity content as function of temper-ature. The crystalline fraction at a given temperature corresponds tothe partial temporal integration of the crystallization peak between thestart of the crystallization and the given temperature.
The specific heat of each phase, amorphous and crystalline, resp.𝑐am𝑝 (𝑇 ) and 𝑐cr
𝑝 (𝑇 ), can be described as an affine variation with tempera-ture. However the overall specific heat 𝑐𝑝 is not linear with temperatureduring the crystallization as it depends on the crystalline mass fraction𝜒
𝑐𝑝(𝑇 , 𝜒) = 𝜒𝑐cr𝑝 (𝑇 ) + (1 − 𝜒)𝑐am
𝑝 (𝑇 ) (1)
As the crystallinity content 𝜒 obeys a kinetic law, it is not onlydependent on temperature but also on thermal history, or during theDSC measurement performed at constant cooling rate, �̇� = 𝜙, on timeand hence so does 𝑐𝑝.
Ideally, the specific heat flux �̇� extracted from a sample in a DSCcooling experiment obeys
�̇� = 𝑐𝑝�̇� + 𝛥ℎam-cr�̇� (2)
where 𝛥ℎam-cr is the specific heat of crystallization.It is to be noted that both Eqs. (1) and (2) are non-linearly coupled,
so that the evaluation of 𝜒 during a DSC measurement at fixed coolingrate, �̇� = 𝜙, cannot be directly obtained. It is proposed to estimate 𝜒from an iterative process where the above equations are progressivelymade consistent with each other at convergence through a fixed-pointalgorithm.
To evaluate the crystallinity content as a function of time (ortemperature using the prescribed (constant) cooling rate �̇� = 𝜙), abaseline heat flux only due to the temperature change at fixed phase
Fig. 3. Computed baseline to perform the crystallization peak integration for a moltenPTFE sample cooled down at 10 ◦C/min.
mass fraction, �̇�base(𝑡) = 𝑐𝑝�̇� , is introduced. However the measurementof 𝑐cr
𝑝 for purely crystalline is not directly available for the computationof 𝑐𝑝, so the asymptotic baseline of the recrystallized state �̇�recr
base(𝑡) isused instead.
�̇�base(𝑡) =𝜒(𝑡)𝜒∞ �̇�recr
base(𝑡) +(
1 −𝜒(𝑡)𝜒∞
)
�̇�ambase(𝑡) (3)
where 𝜒∞ is the estimated asymptotic crystallinity at room temperatureevaluation of the recrystallized PTFE. �̇�recr
base(𝑡) is related to 𝑐𝑝(𝑇 , 𝜒∞) atthe end of the crystallization which is dependent on �̇� = 𝜙.
The integration of �̇�exp(𝑡) from which the baseline �̇�base(𝑡) has beensubtracted gives an evaluation of the crystallinity content 𝜒(𝑡) for agiven cooling rate 𝜙
𝜒(𝑡) = 1𝛥ℎam-cr ∫
𝑡
𝑡0
(
�̇�exp(𝑡′) − �̇�base(𝑡′))
d𝑡′ (4)
where 𝑡0 is the time of crystallization onset.To initiate the determination of 𝜒(𝑡), a first evaluation is performed
from the calorigram using a linear baseline for integration. Then, anew baseline is computed from Eq. (3), and from the latter, 𝜒(𝑡) istime integrated using Eq. (4). These two steps are repeated up toconvergence to a fixed point, which requires typically no more than2 to 3 iterations. Fig. 3 shows the crystallization peak, the baseline atconvergence and the integrated area.
2.4. Dilatometric measurements
The PTFE cubic specimens were placed inside a thermomechanicalanalyzer TMA/SDTA 840 from Mettler Toledo. The oven controls thetemperature and a probe placed on top of the sample measures itsdimension. The force exerted by the probe on the sample was setto 0.01 N. The true (or logarithmic) strain 𝜀𝑖𝑖 in direction 𝑖 can beestimated from the displacement 𝑢𝑖 and the initial size 𝐿𝑖, as
𝜀𝑖𝑖 ≡ log(
1 +𝑢𝑖𝐿𝑖
)
(5)
The temperature gradient was limited to a few degrees Celsius bychoosing heating and cooling rates of 2 ◦C/min. The assumption ofan homogeneous temperature is essential to associate the true strain𝜀𝑖𝑖 to the ‘‘eigenstrain’’ of the material. Thermal computations showedthat at this heating rate, the thermal gradient is less than 2 ◦C betweenspecimen core and skin.
The specimens were tested in the compaction direction (CD) andin the transverse direction (TD). The thermal history chosen for thedilatometry test is very similar to the one chosen for DSC. The samplewas heated up from 30 ◦C to 375 ◦C and held at this temperature for30 min. The sample is then cooled down back to 30 ◦C, held 30 minand heated up again to 375 ◦C.
The volumetric strain is defined as
𝜀𝑣 = log( 𝑉𝑉0
)
(6)
with 𝑉 the total volume and 𝑉0 the reference total volume. The crys-talline mass fraction 𝜒 is also involved in 𝜀𝑣 as 𝑉 =
(
𝜒𝜌cr
+ 1−𝜒𝜌am
)
𝑀
with 𝜌cr the density of the crystalline phase, 𝜌am the density of theamorphous phase and 𝑀 the sample mass.
It can be shown thatd𝜀𝑣d𝑇
=d𝜒d𝑇
𝛥𝜀am-cr𝑣 + 𝑓 𝛽cr + (1 − 𝑓 ) 𝛽am (7)
where 𝛥𝜀am-cr𝑣 is the volumetric strain induced by a crystallization, 𝑓
is the crystalline volume fraction related to 𝜒 via 𝑓 = 𝜒(
𝜌∕𝜌cr)
with𝜌 the current density of the sample. 𝛽cr and 𝛽am are the volumetricthermal expansion coefficient of respectively the crystalline and theamorphous phase. The dilatometric experiments allows one to measurethe displacements in the compaction and transverse directions. Due tothe uniaxial compaction, the properties of the PTFE part can be con-sidered as transverse isotropic. The volumetric strain can be computedvia the strain in CD and TD:
𝜀𝑣 = 𝜀𝐶𝐷 + 2𝜀𝑇𝐷 (8)
In addition to containing information on the crystallinity evolu-tion, dilatometric tests provide information on the strain anisotropy.Confronting results from DSC and dilatometry allows the consolidationof the observations [18] and to better understand the crystallizationprocess of PTFE.
3. Results and discussion
3.1. Crystallization dependence with cooling rate
The crystallinity content 𝜒 evolution with temperature was obtainedfor various cooling rates thanks to the DSC experiments (Fig. 4). Asalready noted in previous works [8,19], the final crystallinity contentis dependent on the cooling rate. The crystallization temperature onsetis estimated to be 318 ◦C almost independently on the cooling rate.
The crystallinity increases very rapidly over 5–10 ◦C. Basset ob-served growth of the lamellae with time spent in the similar tem-perature range [11]. At lower temperatures, the crystallinity contentcontinues to step up, but much slower over a range of 50 ◦C. Themarked difference between those two stages suggests that a secondarycrystallization mechanism takes place.
Secondary crystallization mechanisms are usually encountered asa different mechanism driven by the primary crystallization [20–22].However, surprisingly, PTFE’s secondary crystallization seems to beindependent of the primary crystallization as its contribution to crys-tallinity is observed not to depend on the cooling rate as shown inFig. 5. It appears that a mere shift of the crystallinity versus tem-perature curves, measured for the different cooling rates, so that thesame final crystallinity is reached, appears to collapse all data onto asingle master curve with a very good (although imperfect) accuracy.The curves appear to slightly fan out around 300 ◦C, however there isno systematic trend of the deviation with the cooling rates. Moreover,this difference may be due to imperfect baseline corrections, and thusno interpretation of this minute data dispersion is proposed. Rather,the good quality of the collapse is considered meaningful as the mainevolution of the crystallinity content is extremely similar below 310 ◦Cfor all cooling rates. This figure further suggests that this secondarystage (between 315 and 260 ◦C) is identical for all rates.
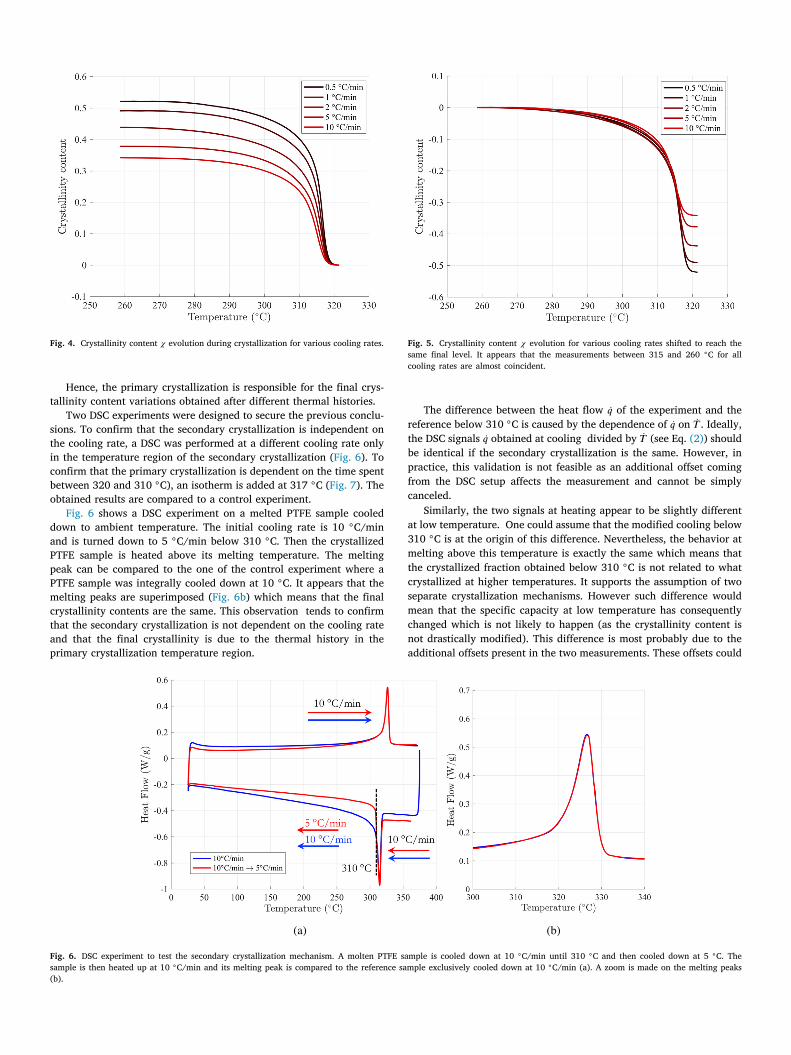
Fig. 4. Crystallinity content 𝜒 evolution during crystallization for various cooling rates.
Hence, the primary crystallization is responsible for the final crys-tallinity content variations obtained after different thermal histories.
Two DSC experiments were designed to secure the previous conclu-sions. To confirm that the secondary crystallization is independent onthe cooling rate, a DSC was performed at a different cooling rate onlyin the temperature region of the secondary crystallization (Fig. 6). Toconfirm that the primary crystallization is dependent on the time spentbetween 320 and 310 ◦C), an isotherm is added at 317 ◦C (Fig. 7). Theobtained results are compared to a control experiment.
Fig. 6 shows a DSC experiment on a melted PTFE sample cooleddown to ambient temperature. The initial cooling rate is 10 ◦C/minand is turned down to 5 ◦C/min below 310 ◦C. Then the crystallizedPTFE sample is heated above its melting temperature. The meltingpeak can be compared to the one of the control experiment where aPTFE sample was integrally cooled down at 10 ◦C. It appears that themelting peaks are superimposed (Fig. 6b) which means that the finalcrystallinity contents are the same. This observation tends to confirmthat the secondary crystallization is not dependent on the cooling rateand that the final crystallinity is due to the thermal history in theprimary crystallization temperature region.
Fig. 5. Crystallinity content 𝜒 evolution for various cooling rates shifted to reach thesame final level. It appears that the measurements between 315 and 260 ◦C for allcooling rates are almost coincident.
The difference between the heat flow �̇� of the experiment and thereference below 310 ◦C is caused by the dependence of �̇� on �̇� . Ideally,the DSC signals �̇� obtained at cooling divided by �̇� (see Eq. (2)) shouldbe identical if the secondary crystallization is the same. However, inpractice, this validation is not feasible as an additional offset comingfrom the DSC setup affects the measurement and cannot be simplycanceled.
Similarly, the two signals at heating appear to be slightly differentat low temperature. One could assume that the modified cooling below310 ◦C is at the origin of this difference. Nevertheless, the behavior atmelting above this temperature is exactly the same which means thatthe crystallized fraction obtained below 310 ◦C is not related to whatcrystallized at higher temperatures. It supports the assumption of twoseparate crystallization mechanisms. However such difference wouldmean that the specific capacity at low temperature has consequentlychanged which is not likely to happen (as the crystallinity content isnot drastically modified). This difference is most probably due to theadditional offsets present in the two measurements. These offsets could
Fig. 6. DSC experiment to test the secondary crystallization mechanism. A molten PTFE sample is cooled down at 10 ◦C/min until 310 ◦C and then cooled down at 5 ◦C. Thesample is then heated up at 10 ◦C/min and its melting peak is compared to the reference sample exclusively cooled down at 10 ◦C/min (a). A zoom is made on the melting peaks(b).
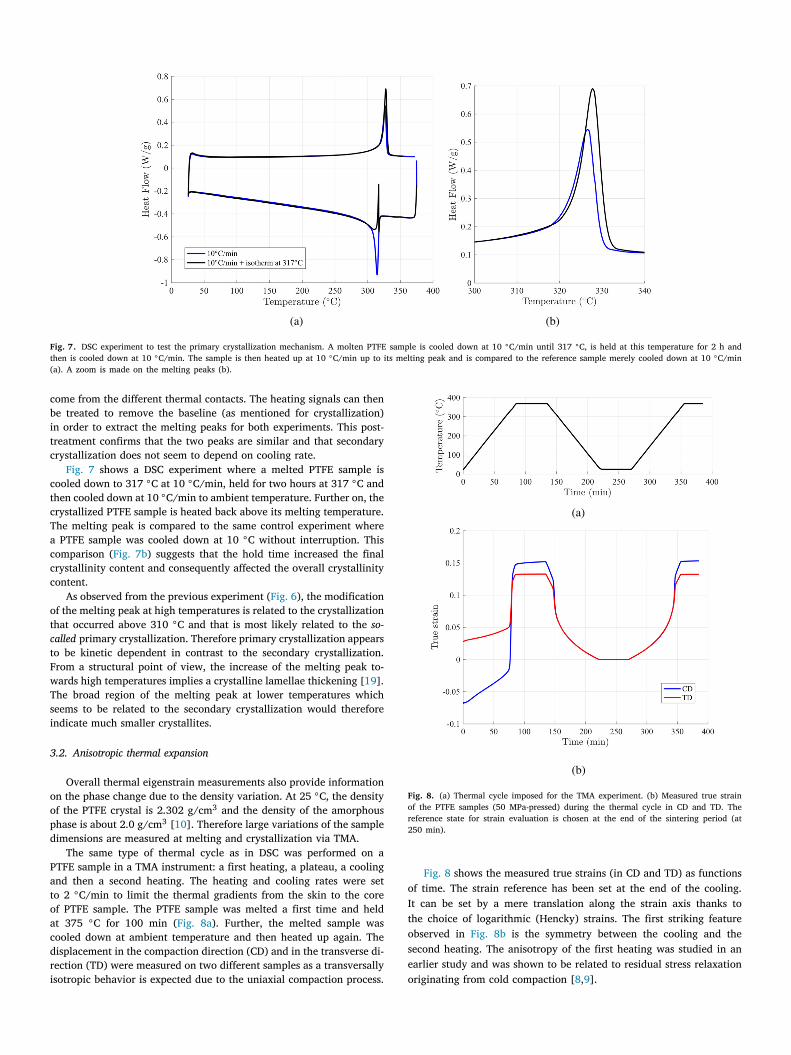
Fig. 7. DSC experiment to test the primary crystallization mechanism. A molten PTFE sample is cooled down at 10 ◦C/min until 317 ◦C, is held at this temperature for 2 h andthen is cooled down at 10 ◦C/min. The sample is then heated up at 10 ◦C/min up to its melting peak and is compared to the reference sample merely cooled down at 10 ◦C/min(a). A zoom is made on the melting peaks (b).
come from the different thermal contacts. The heating signals can thenbe treated to remove the baseline (as mentioned for crystallization)in order to extract the melting peaks for both experiments. This post-treatment confirms that the two peaks are similar and that secondarycrystallization does not seem to depend on cooling rate.
Fig. 7 shows a DSC experiment where a melted PTFE sample iscooled down to 317 ◦C at 10 ◦C/min, held for two hours at 317 ◦C andthen cooled down at 10 ◦C/min to ambient temperature. Further on, thecrystallized PTFE sample is heated back above its melting temperature.The melting peak is compared to the same control experiment wherea PTFE sample was cooled down at 10 ◦C without interruption. Thiscomparison (Fig. 7b) suggests that the hold time increased the finalcrystallinity content and consequently affected the overall crystallinitycontent.
As observed from the previous experiment (Fig. 6), the modificationof the melting peak at high temperatures is related to the crystallizationthat occurred above 310 ◦C and that is most likely related to the so-called primary crystallization. Therefore primary crystallization appearsto be kinetic dependent in contrast to the secondary crystallization.From a structural point of view, the increase of the melting peak to-wards high temperatures implies a crystalline lamellae thickening [19].The broad region of the melting peak at lower temperatures whichseems to be related to the secondary crystallization would thereforeindicate much smaller crystallites.
3.2. Anisotropic thermal expansion
Overall thermal eigenstrain measurements also provide informationon the phase change due to the density variation. At 25 ◦C, the densityof the PTFE crystal is 2.302 g/cm3 and the density of the amorphousphase is about 2.0 g/cm3 [10]. Therefore large variations of the sampledimensions are measured at melting and crystallization via TMA.
The same type of thermal cycle as in DSC was performed on aPTFE sample in a TMA instrument: a first heating, a plateau, a coolingand then a second heating. The heating and cooling rates were setto 2 ◦C/min to limit the thermal gradients from the skin to the coreof PTFE sample. The PTFE sample was melted a first time and heldat 375 ◦C for 100 min (Fig. 8a). Further, the melted sample wascooled down at ambient temperature and then heated up again. Thedisplacement in the compaction direction (CD) and in the transverse di-rection (TD) were measured on two different samples as a transversallyisotropic behavior is expected due to the uniaxial compaction process.
Fig. 8. (a) Thermal cycle imposed for the TMA experiment. (b) Measured true strainof the PTFE samples (50 MPa-pressed) during the thermal cycle in CD and TD. Thereference state for strain evaluation is chosen at the end of the sintering period (at250 min).
Fig. 8 shows the measured true strains (in CD and TD) as functionsof time. The strain reference has been set at the end of the cooling.It can be set by a mere translation along the strain axis thanks tothe choice of logarithmic (Hencky) strains. The first striking featureobserved in Fig. 8b is the symmetry between the cooling and thesecond heating. The anisotropy of the first heating was studied in anearlier study and was shown to be related to residual stress relaxationoriginating from cold compaction [8,9].
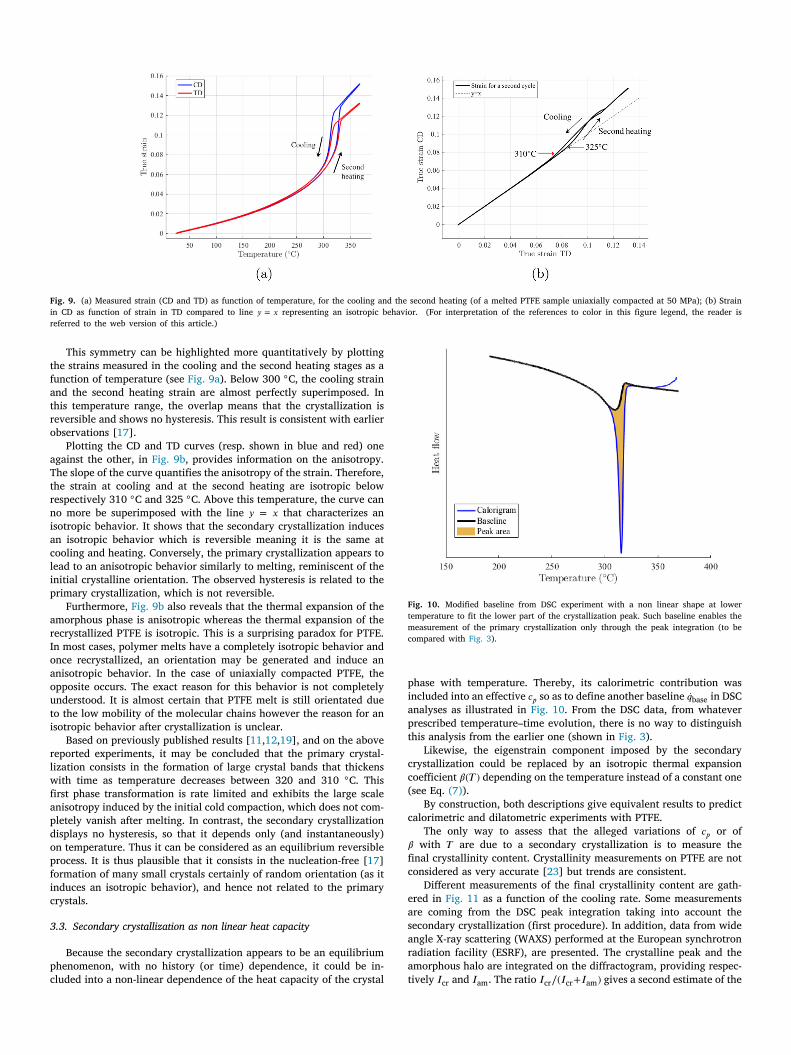
Fig. 9. (a) Measured strain (CD and TD) as function of temperature, for the cooling and the second heating (of a melted PTFE sample uniaxially compacted at 50 MPa); (b) Strainin CD as function of strain in TD compared to line 𝑦 = 𝑥 representing an isotropic behavior. (For interpretation of the references to color in this figure legend, the reader isreferred to the web version of this article.)
This symmetry can be highlighted more quantitatively by plottingthe strains measured in the cooling and the second heating stages as afunction of temperature (see Fig. 9a). Below 300 ◦C, the cooling strainand the second heating strain are almost perfectly superimposed. Inthis temperature range, the overlap means that the crystallization isreversible and shows no hysteresis. This result is consistent with earlierobservations [17].
Plotting the CD and TD curves (resp. shown in blue and red) oneagainst the other, in Fig. 9b, provides information on the anisotropy.The slope of the curve quantifies the anisotropy of the strain. Therefore,the strain at cooling and at the second heating are isotropic belowrespectively 310 ◦C and 325 ◦C. Above this temperature, the curve canno more be superimposed with the line 𝑦 = 𝑥 that characterizes anisotropic behavior. It shows that the secondary crystallization inducesan isotropic behavior which is reversible meaning it is the same atcooling and heating. Conversely, the primary crystallization appears tolead to an anisotropic behavior similarly to melting, reminiscent of theinitial crystalline orientation. The observed hysteresis is related to theprimary crystallization, which is not reversible.
Furthermore, Fig. 9b also reveals that the thermal expansion of theamorphous phase is anisotropic whereas the thermal expansion of therecrystallized PTFE is isotropic. This is a surprising paradox for PTFE.In most cases, polymer melts have a completely isotropic behavior andonce recrystallized, an orientation may be generated and induce ananisotropic behavior. In the case of uniaxially compacted PTFE, theopposite occurs. The exact reason for this behavior is not completelyunderstood. It is almost certain that PTFE melt is still orientated dueto the low mobility of the molecular chains however the reason for anisotropic behavior after crystallization is unclear.
Based on previously published results [11,12,19], and on the abovereported experiments, it may be concluded that the primary crystal-lization consists in the formation of large crystal bands that thickenswith time as temperature decreases between 320 and 310 ◦C. Thisfirst phase transformation is rate limited and exhibits the large scaleanisotropy induced by the initial cold compaction, which does not com-pletely vanish after melting. In contrast, the secondary crystallizationdisplays no hysteresis, so that it depends only (and instantaneously)on temperature. Thus it can be considered as an equilibrium reversibleprocess. It is thus plausible that it consists in the nucleation-free [17]formation of many small crystals certainly of random orientation (as itinduces an isotropic behavior), and hence not related to the primarycrystals.
3.3. Secondary crystallization as non linear heat capacity
Because the secondary crystallization appears to be an equilibriumphenomenon, with no history (or time) dependence, it could be in-cluded into a non-linear dependence of the heat capacity of the crystal
Fig. 10. Modified baseline from DSC experiment with a non linear shape at lowertemperature to fit the lower part of the crystallization peak. Such baseline enables themeasurement of the primary crystallization only through the peak integration (to becompared with Fig. 3).
phase with temperature. Thereby, its calorimetric contribution wasincluded into an effective 𝑐𝑝 so as to define another baseline �̇�base in DSCanalyses as illustrated in Fig. 10. From the DSC data, from whateverprescribed temperature–time evolution, there is no way to distinguishthis analysis from the earlier one (shown in Fig. 3).
Likewise, the eigenstrain component imposed by the secondarycrystallization could be replaced by an isotropic thermal expansioncoefficient 𝛽(𝑇 ) depending on the temperature instead of a constant one(see Eq. (7)).
By construction, both descriptions give equivalent results to predictcalorimetric and dilatometric experiments with PTFE.
The only way to assess that the alleged variations of 𝑐𝑝 or of𝛽 with 𝑇 are due to a secondary crystallization is to measure thefinal crystallinity content. Crystallinity measurements on PTFE are notconsidered as very accurate [23] but trends are consistent.
Different measurements of the final crystallinity content are gath-ered in Fig. 11 as a function of the cooling rate. Some measurementsare coming from the DSC peak integration taking into account thesecondary crystallization (first procedure). In addition, data from wideangle X-ray scattering (WAXS) performed at the European synchrotronradiation facility (ESRF), are presented. The crystalline peak and theamorphous halo are integrated on the diffractogram, providing respec-tively 𝐼cr and 𝐼am. The ratio 𝐼cr∕(𝐼cr+𝐼am) gives a second estimate of the
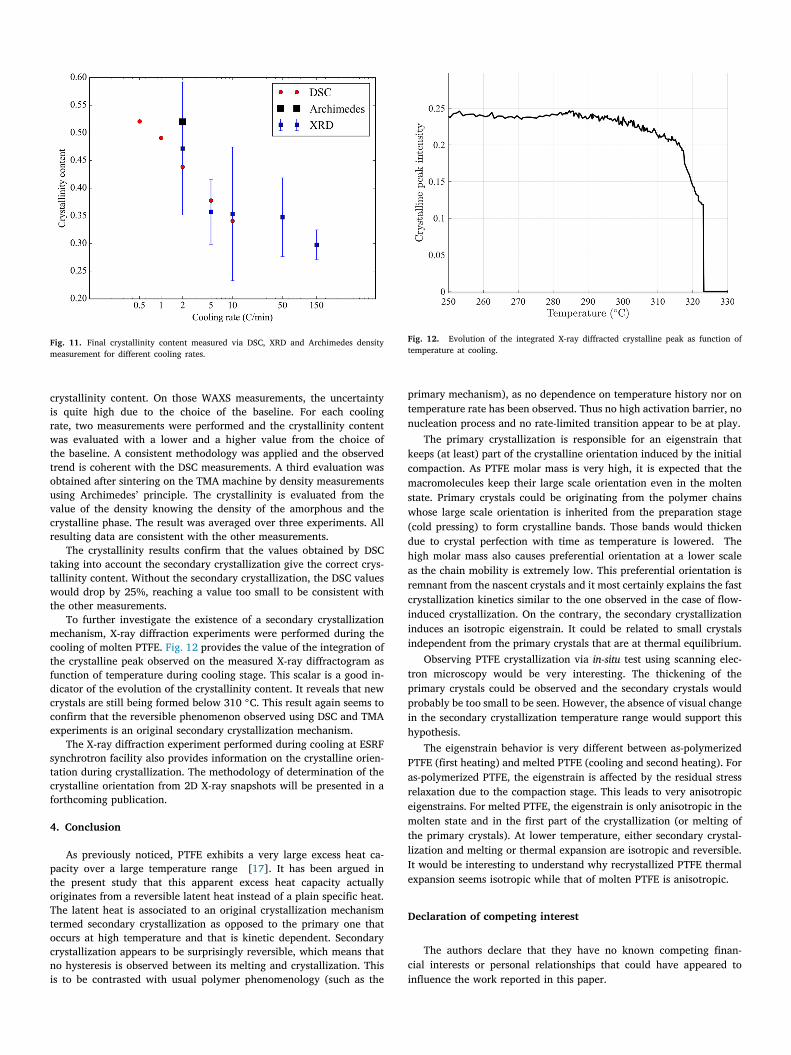
Fig. 11. Final crystallinity content measured via DSC, XRD and Archimedes densitymeasurement for different cooling rates.
crystallinity content. On those WAXS measurements, the uncertaintyis quite high due to the choice of the baseline. For each coolingrate, two measurements were performed and the crystallinity contentwas evaluated with a lower and a higher value from the choice ofthe baseline. A consistent methodology was applied and the observedtrend is coherent with the DSC measurements. A third evaluation wasobtained after sintering on the TMA machine by density measurementsusing Archimedes’ principle. The crystallinity is evaluated from thevalue of the density knowing the density of the amorphous and thecrystalline phase. The result was averaged over three experiments. Allresulting data are consistent with the other measurements.
The crystallinity results confirm that the values obtained by DSCtaking into account the secondary crystallization give the correct crys-tallinity content. Without the secondary crystallization, the DSC valueswould drop by 25%, reaching a value too small to be consistent withthe other measurements.
To further investigate the existence of a secondary crystallizationmechanism, X-ray diffraction experiments were performed during thecooling of molten PTFE. Fig. 12 provides the value of the integration ofthe crystalline peak observed on the measured X-ray diffractogram asfunction of temperature during cooling stage. This scalar is a good in-dicator of the evolution of the crystallinity content. It reveals that newcrystals are still being formed below 310 ◦C. This result again seems toconfirm that the reversible phenomenon observed using DSC and TMAexperiments is an original secondary crystallization mechanism.
The X-ray diffraction experiment performed during cooling at ESRFsynchrotron facility also provides information on the crystalline orien-tation during crystallization. The methodology of determination of thecrystalline orientation from 2D X-ray snapshots will be presented in aforthcoming publication.
4. Conclusion
As previously noticed, PTFE exhibits a very large excess heat ca-pacity over a large temperature range [17]. It has been argued inthe present study that this apparent excess heat capacity actuallyoriginates from a reversible latent heat instead of a plain specific heat.The latent heat is associated to an original crystallization mechanismtermed secondary crystallization as opposed to the primary one thatoccurs at high temperature and that is kinetic dependent. Secondarycrystallization appears to be surprisingly reversible, which means thatno hysteresis is observed between its melting and crystallization. Thisis to be contrasted with usual polymer phenomenology (such as the
Fig. 12. Evolution of the integrated X-ray diffracted crystalline peak as function oftemperature at cooling.
primary mechanism), as no dependence on temperature history nor ontemperature rate has been observed. Thus no high activation barrier, nonucleation process and no rate-limited transition appear to be at play.
The primary crystallization is responsible for an eigenstrain thatkeeps (at least) part of the crystalline orientation induced by the initialcompaction. As PTFE molar mass is very high, it is expected that themacromolecules keep their large scale orientation even in the moltenstate. Primary crystals could be originating from the polymer chainswhose large scale orientation is inherited from the preparation stage(cold pressing) to form crystalline bands. Those bands would thickendue to crystal perfection with time as temperature is lowered. Thehigh molar mass also causes preferential orientation at a lower scaleas the chain mobility is extremely low. This preferential orientation isremnant from the nascent crystals and it most certainly explains the fastcrystallization kinetics similar to the one observed in the case of flow-induced crystallization. On the contrary, the secondary crystallizationinduces an isotropic eigenstrain. It could be related to small crystalsindependent from the primary crystals that are at thermal equilibrium.
Observing PTFE crystallization via in-situ test using scanning elec-tron microscopy would be very interesting. The thickening of theprimary crystals could be observed and the secondary crystals wouldprobably be too small to be seen. However, the absence of visual changein the secondary crystallization temperature range would support thishypothesis.
The eigenstrain behavior is very different between as-polymerizedPTFE (first heating) and melted PTFE (cooling and second heating). Foras-polymerized PTFE, the eigenstrain is affected by the residual stressrelaxation due to the compaction stage. This leads to very anisotropiceigenstrains. For melted PTFE, the eigenstrain is only anisotropic in themolten state and in the first part of the crystallization (or melting ofthe primary crystals). At lower temperature, either secondary crystal-lization and melting or thermal expansion are isotropic and reversible.It would be interesting to understand why recrystallized PTFE thermalexpansion seems isotropic while that of molten PTFE is anisotropic.
Declaration of competing interest
The authors declare that they have no known competing finan-cial interests or personal relationships that could have appeared toinfluence the work reported in this paper.
CRediT authorship contribution statement
Gabriel Guenoun: Investigation, Writing - original draft. Jean-Yvon Faou: Supervision, Project administration. Gilles Régnier: Su-pervision, Writing - review & editing. Nicolas Schmitt: Supervision,Writing - review & editing. Stéphane Roux: Supervision, Writing -review & editing.
Acknowledgments
The authors would like to thank Saint-Gobain for sponsoring thiswork and especially Xavier Brajer, Monika Brodesser, François Creuzet,René Gy, Ansgar Haeger and Georges Moineau for their implication inthe project. The support of the ANRT through the CIFRE PhD grantof G.G. is gratefully acknowledged. The X-ray diffraction experimentswere performed on beamline D2AM BM02 at the European SynchrotronRadiation Facility (ESRF), Grenoble, France. We are grateful to NathalieBoudet and Nils Blanc at the ESRF for providing assistance in usingbeamline D2AM BM02.
References
[1] S. Biswas, K. Vijayan, Friction and wear of PTFE—a review, Wear 158 (1–2)(1992) 193–211.
[2] J.M. Cox, B.A. Wright, W.W. Wright, Thermal degradation of fluorine-containingpolymers. Part I. Degradation in vacuum, J. Appl. Polym. Sci. 8 (6) (1964)2935–2950.
[3] E. Giannetti, Semi-crystalline fluorinated polymers, Polym. Int. 50 (1) (2001)10–26.
[4] J. Zhang, J. Li, Y. Han, Superhydrophobic PTFE surfaces by extension, Macromol.Rapid Commun. 25 (11) (2004) 1105–1108.
[5] M.A. Golub, T. Wydeven, Reactions of atomic oxygen (O(3p)) with variouspolymer films, Polym. Degrad. Stab. 22 (4) (1988) 325–338.
[6] S. Ebnesajjad, Fluoroplastics, Volume 1: Non-melt Processible Fluoropolymers:The Definitive User’s Guide and Data Book Plastics Design Library, Elsevier,2014.
[7] T. Mura, General theory of eigenstrains, in: Micromechanics of Defects in Solids,Springer, 1987, pp. 1–73.
[8] R.B. Canto, N. Schmitt, J. De Carvalho, R. Billardon, Experimental identi-fication of the deformation mechanisms during sintering of cold compactedpolytetrafluoroethylene powders, Polym. Eng. Sci. 51 (11) (2011) 2220–2235.
[9] G. Guenoun, J.-Y. Faou, G. Régnier, N. Schmitt, S. Roux, Thermal cycling ofcold-pressed PTFE compacts: Reversible and irreversible behavior, Polym. Test.(2019).
[10] D. Kerbow, C. Sperati, in: J. Brandrup, E.H. Immergut, E.A. Grulke (Eds.), InPolymer Handbook, Wiley, New York, 1999.
[11] D. Bassett, R. Davitt, On crystallization phenomena in polytetrafluoroethylene,Polymer 15 (11) (1974) 721–728.
[12] J. Yang, K. Petersen, R. Williams, P. Geil, T. Long, P. Xu, Morphology evolutionin PTFE as a function of melt time and temperature I: High molecular weightsingle-and multi-molecule folded chain single crystals and band structures, Chin.J. Polym. Sci. 23 (02) (2005) 123–135.
[13] T. Ozawa, Nonisothermal crystallization of poly(tetrafluoroethylene), Bull. Chem.Soc. Japan 57 (4) (1984) 952–955.
[14] Y. Seo, Nonisothermal crystallization kinetics of polytetrafluoroethylene, Polym.Eng. Sci. 40 (6) (2000) 1293–1297.
[15] X.Q. Wang, D.R. Chen, J.C. Han, S.Y. Du, Crystallization behavior ofpolytetrafluoroethylene (PTFE), J. Appl. Polym. Sci. 83 (5) (2002) 990–996.
[16] N. Bosq, N. Guigo, E. Zhuravlev, N. Sbirrazzuoli, Nonisothermal crystallizationof polytetrafluoroethylene in a wide range of cooling rates, J. Phys. Chem. B117 (12) (2013) 3407–3415.
[17] R. Androsch, B. Wunderlich, H.-J. Radusch, Analysis of reversible melting inpolytetrafluoroethylene, J. Therm. Anal. Calorim. 79 (3) (2005) 615–621.
[18] A. Greco, A. Maffezzoli, Polymer melting and polymer powder sintering bythermal analysis, J. Therm. Anal. Calorim. 72 (3) (2003) 1167–1174.
[19] L. Ferry, G. Vigier, R. Vassoille, J. Bessede, Study of polytetrafluoroethylenecrystallization, Acta Polym. 46 (4) (1995) 300–306.
[20] I.H. Hillier, Modified avrami equation for the bulk crystallization kinetics ofspherulitic polymers, J. Polym. Sci. A 3 (9) (1965) 3067–3078.
[21] R. Kolb, C. Wutz, N. Stribeck, G. von Krosigk, C. Riekel, Investigation ofsecondary crystallization of polymers by means of microbeam X-ray scattering,Polymer 42 (12) (2001) 5257–5266.
[22] M.J. Jenkins, K.L. Harrison, The effect of molecular weight on the crystallizationkinetics of polycaprolactone, Polym. Adv. Technol. 17 (6) (2006) 474–478.
[23] R. Lehnert, P. Hendra, N. Everall, N. Clayden, Comparative quantitative study onthe crystallinity of poly(tetrafluoroethylene) including Raman, infra-red and 19fnuclear magnetic resonance spectroscopy, Polymer 38 (7) (1997) 1521–1535.