pt asuransi sinar mas and its subsidiary consolidated ... · pt asuransi sinar mas (the company)...
TRANSCRIPT

PT ASURANSI SINAR MAS AND ITS SUBSIDIARY TABLE OF CONTENTS Page The Directors’ Statement on the Responsibility for the Consolidated Financial Statements of PT Asuransi Sinar Mas and Its Subsidiary as of September 30, 2011 and 2010 and December 31, 2010 and for the Nine Month Periods Ended September 30, 2011 and 2010
Independent Accountants’ Review Report 1 CONSOLIDATED FINANCIAL STATEMENTS - As of September 30, 2011 and 2010 and December 31, 2010 and for the Nine Month Periods Ended September 30, 2011 and 2010
Consolidated Statements of Financial Position 2 Consolidated Statements of Comprehensive Income 3 Consolidated Statements of Changes in Equity 4 Consolidated Statements of Cash Flows 5 Notes to Consolidated Financial Statements 6


PT ASURANSI SINAR MAS AND ITS SUBSIDIARYConsolidated Statements of Financial PositionSeptember 30, 2011 and 2010 and December 31, 2010
December 31,Notes 2011 2010 2010
Rp '000 Rp '000 Rp '000
ASSETS
InvestmentsTime deposits 2d,2e,2h,3,4,20,29,33 670,929,614 584,865,377 476,654,724Statutory time deposit 2h,3,4,20,33 - - 20,000,000Marketable securities 2d,2h,3,4,20,33 892,897,201 392,759,759 522,094,647Statutory marketable securities 2h,3,4,20,33 26,004,577 19,376,730 19,157,500Units of mutual fund 2d,2e,2h,3,4,20,29,33 978,084,599 1,051,086,058 1,152,525,409Investments in shares of stock 2h,3,4,20,33 39,706,259 21,375,594 22,347,079Investment properties 2h,2i,2k,2m,3,4,20,33 6,490,721 7,051,071 6,910,983Mortgage loans 2e,2h,3,4,20,29,33 8,163,948 5,091,357 5,053,480
Total investments 2,622,276,919 2,081,605,946 2,224,743,822
Cash 2d,2e,2g,2h,3,5,20,29,33 30,608,162 27,084,419 18,368,285
Premiums receivable - net ofallowance for impairment losses ofRp 2,436,544 thousand as of September 30, 2011,Rp nil as of September 30, 2010 andRp 3,248,725 thousand as of December 31, 2010 2d,2e,2h,6,29,33 376,297,857 277,329,017 332,069,233
Reinsurance receivables - net ofallowance for impairment losses ofRp 1,258,122 thousand as of September 30, 2011,Rp nil as of September 30, 2010 andRp 1,677,497 thousand as of December 31, 2010 2d,2e,2h,2j,7,29,32,33 14,526,071 19,976,896 5,379,226
Other receivables 2d,2e,2h,3,8,20,29,33 12,177,048 18,367,134 14,187,435
Property and equipment - net of accumulated depreciation of Rp 88,738,247 thousand as of September 30, 2011,Rp 75,866,016 thousand as of September 30, 2010 and Rp 78,216,332 thousand as of December 31, 2010 2l,2m,3,9 167,426,160 155,613,817 155,571,998
Noncurrent assets held for sale 2n,10 109,629,634 - -
Other assets 2e,2h,11,20,29,33 17,817,693 16,650,526 16,156,960
TOTAL ASSETS 3,350,759,544 2,596,627,755 2,766,476,959
LIABILITIES AND EQUITY
LIABILITIESClaims payable 2d,2e,2p,12,33 5,421,538 16,647,349 16,862,278 Estimated own retention claims 2d,2e,2p,3,13,29,33 256,556,538 190,279,093 179,839,733 Unearned premiums 2d,2e,2o,3,14,29,33 594,063,309 409,719,260 459,339,028 Reinsurance payables 2d,2e,15,29,32,33 205,959,348 174,672,716 60,216,404 Commissions payable 2e,2q,16,29,33 25,377,862 19,437,277 25,363,360Premiums payable 2d,2e,2o,17,29,33 19,460,282 17,677,666 8,254,304Taxes payable 28 28,608,254 4,261,760 2,046,553Premiums received in advance 2d,18,33 722,362,638 660,108,626 770,687,459Deferred tax liabilities - net 2t,3,28 33,119,812 28,304,929 27,575,845 Other liabilities 2d,2e,19,20,29,33 97,343,828 46,097,647 39,230,665 Accrued expenses 20,33 2,602,655 1,344,712 1,511,619 Liabilities directly related to noncurrent assets
classified as held for sale 2n,10 8,221,463 - -Estimated liabilities for employees'
benefits 2s,3,30 10,973,906 10,335,309 9,558,699
Total Liabilities 2,010,071,433 1,578,886,344 1,600,485,947
EQUITY
Equity Attributable to the Equity Holders of the Parent CompanyCapital stock - Rp 1,000,000 par value per share
Authorized - 400,000 sharesIssued and fully paid-up - 200,000 shares 21 200,000,000 200,000,000 200,000,000
Differences in value arising from restructuringtransactions among entities undercommon control 2c 996,225 996,225 996,225
Other equity components 2h,4 (108,857,640) 13,983,145 84,774,169 Retained earnings 1,246,678,055 802,762,041 879,215,476
Total 1,338,816,640 1,017,741,411 1,164,985,870
Non-Controlling Interests 1,871,471 - 1,005,142
Total Equity 1,340,688,111 1,017,741,411 1,165,991,012
TOTAL LIABILITIES AND EQUITY 3,350,759,544 2,596,627,755 2,766,476,959
See accompanying notes to consolidated financial statements which are an integral part of the consolidated financial statements.
September 30, (Unaudited)
- 2 -

PT ASURANSI SINAR MAS AND ITS SUBSIDIARYConsolidated Statements of Comprehensive IncomeFor The Nine Month Periods Ended September 30, 2011 and 2010
2011 2010Notes (Nine Months) (Nine Months)
Rp '000 Rp '000
REVENUESUnderwriting revenues
Premium incomeGross premiums 2e,2o,22,29,32 2,988,171,575 2,445,005,306Reinsurance premiums (1,541,907,970) (1,383,210,577)Increase in unearned
premiums (136,006,513) (69,395,121)
Net premium income 1,310,257,092 992,399,608
Underwriting expenses 2e,2p,23,29,32Claims expense - net
Gross claims (730,560,305) (612,148,610)Reinsurance claims 16,477,139 88,279,087Increase in estimated own
retention claims (75,580,127) (64,753,204)
Net claims expense (789,663,293) (588,622,727)Net commission expense 2q,24 (283,520,543) (237,817,029)Other underwriting expenses (689,784) (2,125,079)
Total underwriting expenses (1,073,873,620) (828,564,835)
NET UNDERWRITING INCOME 236,383,472 163,834,773
Net investment income 2d,2e,25,29 318,710,071 186,199,356
Profit sharing to participant 2r - 193,014
Tabarru fund 2r - -
Operating expenses 2k,2l,2s,26 (161,691,409) (127,390,401)
INCOME FROM OPERATIONS 393,402,134 222,836,742
Other Income - Net 27 7,746,082 7,123,022
INCOME BEFORE TAX 401,148,216 229,959,764
TAX EXPENSECurrent 2t,28 (28,156,243) (3,206,749)Deferred (5,543,967) (4,727,639)
TOTAL (33,700,210) (7,934,388)
NET INCOME 367,448,006 222,025,376
OTHER COMPREHENSIVE INCOME (LOSS)Unrealized gain (loss) on change in fair value of
available for sale securities 2h,4 (193,575,415) 13,619,462Translation adjustment of a subsidiary (70,492) -
TOTAL COMPREHENSIVE INCOME (LOSS) (193,645,907) 13,619,462
TOTAL COMPREHENSIVE INCOME 173,802,099 235,644,838
Income attributable to:Equity holders of the Parent Company 367,462,579 222,025,376Non-Controlling interests 2c (14,573) -
367,448,006 222,025,376
Comprehensive income attributable to:Equity holders of the Parent Company 173,830,770 235,644,838Non-Controlling interests 2c (28,671) -
173,802,099 235,644,838
See accompanying notes to consolidated financial statements which are an integral part of the consolidated financial statements.
September 30, (Unaudited)
- 3 -

PT ASURANSI SINAR MAS AND ITS SUBSIDIARY Consolidated Statements of Changes in EquityFor The Nine Month Periods Ended September 30, 2011 and 2010
Differences in Unrealized Value Arising from Gain (Loss)
Restructuring on Change in Share in Transactions Among Fair Value of Translation
Entities Under Available for Sale Adjustment of Non-Controlling TotalCapital Stock Common Control Securities a Subsidiary Retained Earnings Total Interests Equity
Rp '000 Rp '000 Rp '000 Rp '000 Rp '000 Rp '000 Rp '000 Rp '000
Balance as of January 1, 2011 200,000,000 996,225 84,774,169 - 879,215,476 1,164,985,870 1,005,142 1,165,991,012
Purchase of shares owned by non-controlling interest - - - - - - 895,000 895,000
Other comprehensive income(Uanudited) - - (193,575,415) (56,394) 367,462,579 173,830,770 (28,671) 173,802,099
Balance as of September 30, 2011 (Unaudited) 200,000,000 996,225 (108,801,246) (56,394) 1,246,678,055 1,338,816,640 1,871,471 1,340,688,111
Differences in Unrealized Value Arising from Gain (Loss)
Restructuring on Change in Share in Transactions Among Fair Value of Translation
Entities Under Available for Sale Adjustment of Non-Controlling TotalCapital Stock Common Control Securities a Subsidiary Retained Earnings Total Interests Equity
Rp '000 Rp '000 Rp '000 Rp '000 Rp '000 Rp '000 Rp '000 Rp '000
Balance as of January 1, 2010 200,000,000 996,225 363,683 - 580,736,665 782,096,573 - 782,096,573
Other comprehensive income(Unaudited) - - 13,619,462 - 222,025,376 235,644,838 - 235,644,838
Balance as of September 30, 2010 (Unaudited) 200,000,000 996,225 13,983,145 - 802,762,041 1,017,741,411 - 1,017,741,411
See accompanying notes to consolidated financial statements which are an integral part of the consolidated financial statements.
- 4 -
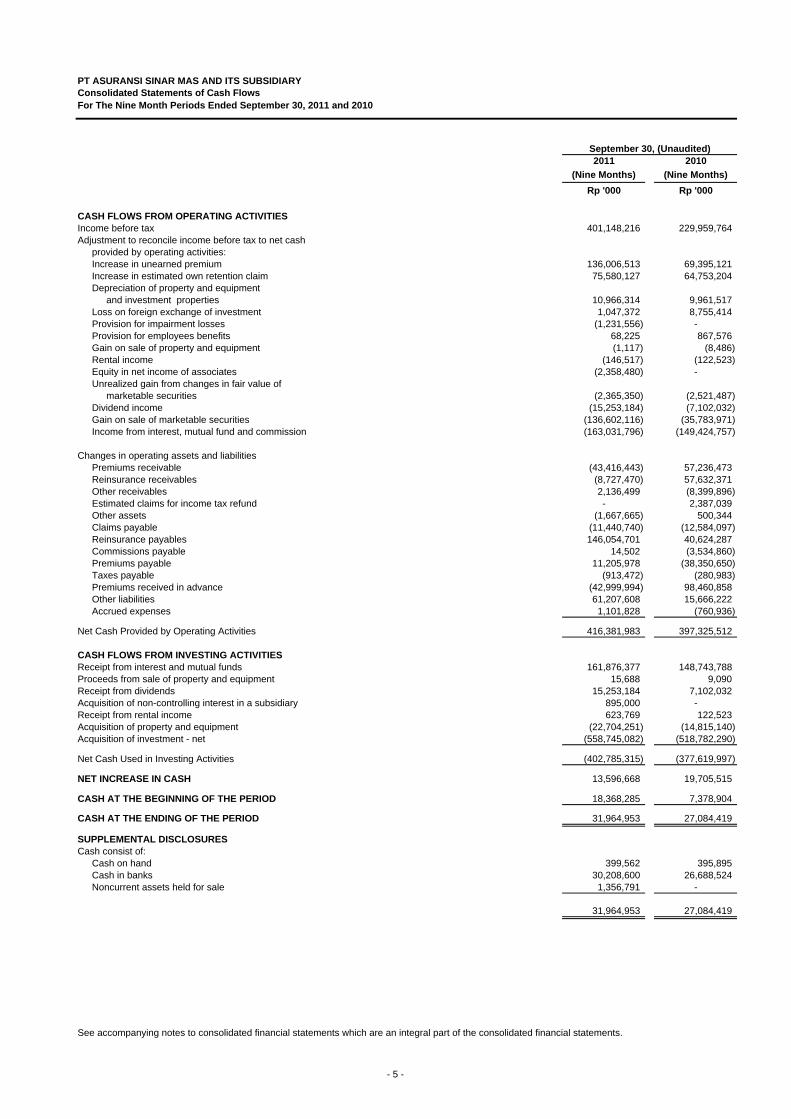
PT ASURANSI SINAR MAS AND ITS SUBSIDIARY Consolidated Statements of Cash FlowsFor The Nine Month Periods Ended September 30, 2011 and 2010
September 30, (Unaudited)2011 2010
(Nine Months) (Nine Months)Rp '000 Rp '000
CASH FLOWS FROM OPERATING ACTIVITIES Income before tax 401,148,216 229,959,764Adjustment to reconcile income before tax to net cash
provided by operating activities:Increase in unearned premium 136,006,513 69,395,121Increase in estimated own retention claim 75,580,127 64,753,204Depreciation of property and equipment
and investment properties 10,966,314 9,961,517Loss on foreign exchange of investment 1,047,372 8,755,414Provision for impairment losses (1,231,556) -Provision for employees benefits 68,225 867,576Gain on sale of property and equipment (1,117) (8,486)Rental income (146,517) (122,523)Equity in net income of associates (2,358,480) -Unrealized gain from changes in fair value of
marketable securities (2,365,350) (2,521,487)Dividend income (15,253,184) (7,102,032)Gain on sale of marketable securities (136,602,116) (35,783,971)Income from interest, mutual fund and commission (163,031,796) (149,424,757)
Changes in operating assets and liabilitiesPremiums receivable (43,416,443) 57,236,473Reinsurance receivables (8,727,470) 57,632,371Other receivables 2,136,499 (8,399,896)Estimated claims for income tax refund - 2,387,039Other assets (1,667,665) 500,344Claims payable (11,440,740) (12,584,097)Reinsurance payables 146,054,701 40,624,287Commissions payable 14,502 (3,534,860)Premiums payable 11,205,978 (38,350,650)Taxes payable (913,472) (280,983)Premiums received in advance (42,999,994) 98,460,858Other liabilities 61,207,608 15,666,222Accrued expenses 1,101,828 (760,936)
Net Cash Provided by Operating Activities 416,381,983 397,325,512
CASH FLOWS FROM INVESTING ACTIVITIES Receipt from interest and mutual funds 161,876,377 148,743,788Proceeds from sale of property and equipment 15,688 9,090Receipt from dividends 15,253,184 7,102,032Acquisition of non-controlling interest in a subsidiary 895,000 -Receipt from rental income 623,769 122,523Acquisition of property and equipment (22,704,251) (14,815,140) Acquisition of investment - net (558,745,082) (518,782,290)
Net Cash Used in Investing Activities (402,785,315) (377,619,997)
NET INCREASE IN CASH 13,596,668 19,705,515
CASH AT THE BEGINNING OF THE PERIOD 18,368,285 7,378,904
CASH AT THE ENDING OF THE PERIOD 31,964,953 27,084,419
SUPPLEMENTAL DISCLOSURES Cash consist of:
Cash on hand 399,562 395,895Cash in banks 30,208,600 26,688,524Noncurrent assets held for sale 1,356,791 -
31,964,953 27,084,419
See accompanying notes to consolidated financial statements which are an integral part of the consolidated financial statements.
- 5 -

PT ASURANSI SINAR MAS AND ITS SUBSIDIARY Notes to Consolidated Financial Statements As of September 30, 2011 and 2010 and December 31, 2010 and For the Nine Month Periods Ended September 30, 2011 and 2010
- 6 -
1. General
a. Establishment and General Information
PT Asuransi Sinar Mas (the Company) was established in Jakarta, under the name of PT Asuransi Kerugian Sinar Mas Dipta, based on Deed No. 162 dated August 30, 1984 of Benny Kristianto, S.H., notary in Jakarta and was approved by the Minister of Justice of the Republic of Indonesia in its Decision Letter No. C2-1793.HT.01.01. Th.85 dated April 1, 1985 and published in State Gazette No. 85 dated October 22, 1985, Supplement No. 1305. Based on Deed No. 356 dated November 30, 1991 of the same notary, the name of the Company was changed to PT Asuransi Sinar Mas. This amendment was approved by the Minister of Justice of the Republic of Indonesia in its Decision Letter No. C2-1139.HT.01.04. Th.93 dated February 25, 1993.
The latest amendment of the Company's Articles of Association was based on Deed No. 62 dated August 14, 2008 of Popie Savitri Martosuhardjo Pharmanto, S.H., notary in Jakarta, pursuant to Law No. 40 year 2007, Limited Liability Company Law and was approved by the Minister of Law and Human Rights of the Republic of Indonesia in its Decision Letter No. AHU-85016.AH.01.02. Year 2008 dated November 12, 2008. Based on Article 3 of the Articles of Association, the Company's scope of activities is in general insurance business. The Company obtained its business license from the Minister of Finance of the Republic of Indonesia through the Directorate General of Domestic Monetary Affairs under Decree No. Kep-2562/MD/1986 dated April 21, 1986. On June 25, 2004, the Company submitted a proposal to establish a branch office using Sharia Principles in its Letter No.05/ASM-SYARIAH/VI/2004 dated June 2, 2004 and was approved by the Minister of Finance of the Republic of Indonesia in its Decision Letter No. 253/KM.6/2004 dated June 25, 2004. The Company's domicile is in Indonesia with 31 branch offices, 51 marketing offices and 10 marketing agency offices. The Company's head office is located at Plaza Simas, JI. KH. Fachrudin No. 18, Jakarta. PT Sinar Mas Multiartha Tbk is the immediate holding company of the Company. The Company is a part of Sinar Mas Group of Companies.
b. Consolidated Subsidiary As of September 30, 2011 and 2010 and December 31, 2010, details of the consolidated subsidiary are as follows:
Year of
Operation/ December 31, December 31,Domicile Nature of Business Establishment 2011 2010 2010 2011 2010 2010
Rp '000,000 Rp '000,000 Rp '000,000
PT Asuransi Sumit Oto Jakarta Loss insurance 2010 - - 99.00% - - 100,524Sinar Mas Insurance Democratic
RepublicTimor Leste Loss insurance 2011 80.00% - - 4,609 - -
Total Assets (Before Elimination)Percentage of OwnershipSeptember 30, (Unaudited) September 30, (Unaudited)
In April 2011, PT Sinar Mas Multiartha Tbk, PT Asuransi Sinar Mas (ASM) and PT Shinta Utama established Sinar Mas Insurance, domiciled in the Democratic Republic of Timor Leste, by investing Rp 447,500 thousand, Rp 3,580,000 thousand and Rp 447,500 thousand, respectively. In October 2010, PT Sinar Mas Multiartha Tbk and ASM established PT Asuransi Sumit Oto (ASO), with direct ownership interest of 1% and 99%, respectively.

PT ASURANSI SINAR MAS AND ITS SUBSIDIARY Notes to Consolidated Financial Statements As of September 30, 2011 and 2010 and December 31, 2010 and For the Nine Month Periods Ended September 30, 2011 and 2010
- 7 -
c. Board of Commissioners, Directors, and Employees The Company's commissioners and directors as of September 30, 2011 and 2010 and December 31, 2010 are as follows:
Board of CommissionersPresident Commissioner : Ivena WidjajaIndependent Commissioners : Wahjudi PrakarsaCommissioners : Doddy Susanto
: Gandi Sulistiyanto Suherman: Kokarjadi Chandra
DirectorsPresident Director : Indra WidjajaDirectors : I Ketut Pasek Swastika
: Njoman Sudharta : Aryanto Alimin
: Dumasi Marisina Magdalena Samosir: Marten Petrus Lalamentik: Howen Widjaja
As of September 30, 2011 and 2010 and December 31, 2010, the Company had average number of 1,777, 1,440 and 1,588 employees, respectively.
The consolidated financial statements of PT Asuransi Sinar Mas and its subsidiary for the nine month period, ended September 30, 2011 were completed and authorized for issue by the Company’s Directors on October 26, 2011 and are responsible for the consolidated financial statements.
2. Summary of Significant Accounting and Financial Reporting Policies
a. Basis of Consolidated Financial Statements Preparation and Measurement
The interim consolidated financial statements have been prepared in accordance with Indonesian Financial Accounting Standards “SAK”, which comprise the statements and interpretations issued by the Board of Financial Accounting Standards of the Indonesian Institute of Accountants. As disclosed further in relevant succeeding notes, several amended and published accounting standards were adopted effective January 1, 2011. The Company and its subsidiary’s interim consolidated financial statements for the nine month period ended September 30, 2011 are in accordance with the Statements of Financial Accounting Standard (“PSAK”) No. 1 (Revised 2009), “Presentation of Financial Statements” and PSAK No. 3 (Revised 2010), “Interim Financial Statements”, both adopted on January 1, 2011. The said adoption of PSAK No. 1 (Revised 2009) and PSAK No. 3 (Revised 2010) have significant impact on the related presentation and disclosures in the interim consolidated financial statements. The accounting policies adopted in the preparation of the interim consolidated financial statements are consistent with those made in preparation of the consolidated financial statements for the year ended December 31, 2010, expect for the adoption of several amended PSAK effective January 1, 2011 as disclosed in this Note. The measurement basis used is the historical cost, except for certain accounts which are measured on the bases described in the related accounting policies. The consolidated financial statements are prepared under the accrual basis of accounting, except for the consolidated statements of cash flows.

PT ASURANSI SINAR MAS AND ITS SUBSIDIARY Notes to Consolidated Financial Statements As of September 30, 2011 and 2010 and December 31, 2010 and For the Nine Month Periods Ended September 30, 2011 and 2010
- 8 -
The consolidated statements of cash flows are prepared using the indirect method with classifications of cash flows into operating, investing and financing activities.
The reporting currency used in the preparation of the consolidated financial statements is the Indonesian Rupiah (Rupiah) which is the functional currency of the Company and its subsidiary. Unless otherwise stated, all figures presented in the consolidated financial statements are stated in thousand of Rupiah.
b. Adoption of Revised Statements of Financial Accounting Standards Effective
January 1, 2011
The Company and it’s subsidiary have adopted the following Financial Accounting Standards (PSAK) and Interpretations (ISAK) effective January 1, 2011:
(1) PSAK No. 1 (Revised 2009), “Presentation of Financial Statements”, regulates the
presentation of financial statements as to, among others, the objective, component of financial statements, fair presentation, materiality and aggregate, offsetting, distinction between current and non-current assets and short term and long-term liabilities, comparative information and consistency and introduces new disclosures such as, among others, key estimations and judgments, capital management, other comprehensive income, departures from accounting standards and statement of compliance.
This standard introduces a statement of comprehensive income that combines all items of income and expenses recognized in the profit and loss together with “other comprehensive income”. The entities may choose to present all items in one statement, or to present two linked statements, a separate statement of income and a statement of comprehensive income. The Company and its subsidiary have elected to present a single statement and have presented its prior periods’ consolidated financial statements in conformity with this PSAK to be comparative with the September 30, 2011 interim consolidated financial statements.
(2) PSAK No. 3 (Revised 2010), “Interim Financial Reporting”, regulates the minimum
presentation of interim financial statements, and also the principles of recognition and measurement in the complete or condensed interim financial statements.
(3) PSAK No. 4 (Revised 2009), “Consolidated and Separate Financial Statements”, provides for
the preparation and presentation of the consolidated financial statements for a group of entities under the control of Parent company, and the accounting for investments in subsidiary, jointly controlled, entities and associated entities when separate financial statements are prepared as additional information.
(4) PSAK No. 7 (Revised 2010), “Related Party Disclosures”, requires disclosures of related
party relationships, transactions and outstanding balances, including commitments, in the consolidated financial statements.
(5) PSAK No. 15 (Revised 2009), “Investments in Associates”, prescribes the accounting for
investments in associates as to determination of significant influence, accounting method to be applied, impairment in value of investments and separate financial statements. The adoption this revised PSAK has no significant impact on the interim consolidated financial statements.
PT ASURANSI SINAR MAS AND ITS SUBSIDIARY Notes to Consolidated Financial Statements As of September 30, 2011 and 2010 and December 31, 2010 and For the Nine Month Periods Ended September 30, 2011 and 2010
- 9 -
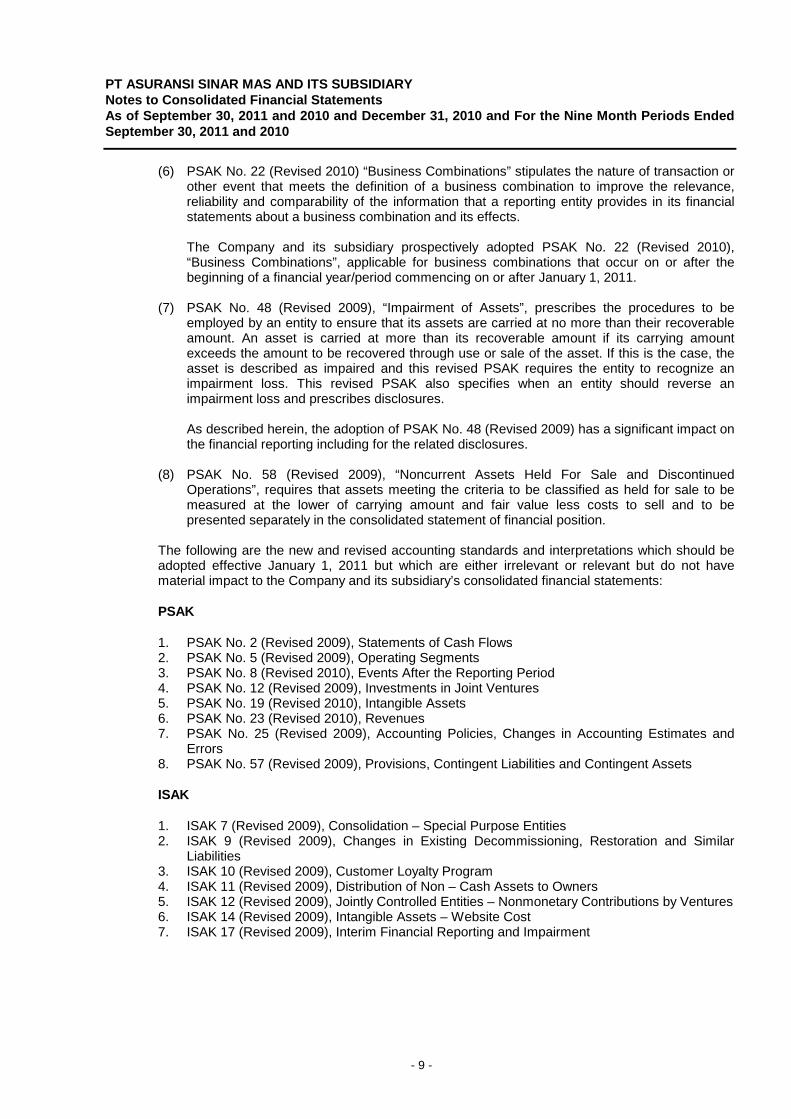
(6) PSAK No. 22 (Revised 2010) “Business Combinations” stipulates the nature of transaction or other event that meets the definition of a business combination to improve the relevance, reliability and comparability of the information that a reporting entity provides in its financial statements about a business combination and its effects.
The Company and its subsidiary prospectively adopted PSAK No. 22 (Revised 2010), “Business Combinations”, applicable for business combinations that occur on or after the beginning of a financial year/period commencing on or after January 1, 2011.
(7) PSAK No. 48 (Revised 2009), “Impairment of Assets”, prescribes the procedures to be employed by an entity to ensure that its assets are carried at no more than their recoverable amount. An asset is carried at more than its recoverable amount if its carrying amount exceeds the amount to be recovered through use or sale of the asset. If this is the case, the asset is described as impaired and this revised PSAK requires the entity to recognize an impairment loss. This revised PSAK also specifies when an entity should reverse an impairment loss and prescribes disclosures.
As described herein, the adoption of PSAK No. 48 (Revised 2009) has a significant impact on the financial reporting including for the related disclosures.
(8) PSAK No. 58 (Revised 2009), “Noncurrent Assets Held For Sale and Discontinued Operations”, requires that assets meeting the criteria to be classified as held for sale to be measured at the lower of carrying amount and fair value less costs to sell and to be presented separately in the consolidated statement of financial position.
The following are the new and revised accounting standards and interpretations which should be adopted effective January 1, 2011 but which are either irrelevant or relevant but do not have material impact to the Company and its subsidiary’s consolidated financial statements:
PSAK 1. PSAK No. 2 (Revised 2009), Statements of Cash Flows 2. PSAK No. 5 (Revised 2009), Operating Segments 3. PSAK No. 8 (Revised 2010), Events After the Reporting Period 4. PSAK No. 12 (Revised 2009), Investments in Joint Ventures 5. PSAK No. 19 (Revised 2010), Intangible Assets 6. PSAK No. 23 (Revised 2010), Revenues 7. PSAK No. 25 (Revised 2009), Accounting Policies, Changes in Accounting Estimates and
Errors 8. PSAK No. 57 (Revised 2009), Provisions, Contingent Liabilities and Contingent Assets
ISAK
1. ISAK 7 (Revised 2009), Consolidation – Special Purpose Entities 2. ISAK 9 (Revised 2009), Changes in Existing Decommissioning, Restoration and Similar
Liabilities 3. ISAK 10 (Revised 2009), Customer Loyalty Program 4. ISAK 11 (Revised 2009), Distribution of Non – Cash Assets to Owners 5. ISAK 12 (Revised 2009), Jointly Controlled Entities – Nonmonetary Contributions by Ventures 6. ISAK 14 (Revised 2009), Intangible Assets – Website Cost 7. ISAK 17 (Revised 2009), Interim Financial Reporting and Impairment

PT ASURANSI SINAR MAS AND ITS SUBSIDIARY Notes to Consolidated Financial Statements As of September 30, 2011 and 2010 and December 31, 2010 and For the Nine Month Periods Ended September 30, 2011 and 2010
- 10 -
c. Principles of Consolidation and Accounting for Business Combination Principles of Consolidation Effective January 1, 2011, the Company and its subsidiary retrospectively adopted PSAK No. 4 (Revised 2009), “Consolidated and Separate Financial Statements”, except for the following items that were applied prospectively: (i) losses of a subsidiary that result in a deficit balance to noncontrolling interests (“NCI”); (ii) loss of control over a subsidiary; (iii) change in the ownership interest in a subsidiary that does not result in a loss of control; (iv) potential voting rights in determining the existence of control; and (v) consolidation of a subsidiary that is subject to long-term restriction. Accounting Policies Effective January 1, 2011 The interim consolidated financial statements include the accounts of the Company and its Subsidiary as mentioned in Note 1b, in which the Company maintains (directly or indirectly) equity ownership of more than 50%. All significant intercompany transactions and account balances (including the related significant unrealized gains or losses) have been eliminated. Subsidiary is fully consolidated from the date of acquisitions, being the date on which the Company obtained control, and continue to be consolidated until the date such control ceases. Control is presumed to exist if the Company owns more than a half of the voting power of an entity. Losses of a non-wholly owned subsidiary are attributed to the Noncontrolling Interest (NCI) even if that results in a deficit balance. In case of loss of control over its subsidiary, the Company: • derecognizes the assets (including goodwill) and liabilities of the subsidiary; • derecognizes the carrying amount of any NCI; • derecognizes the cumulative translation differences, recorded in equity, if any; • recognizes the fair value of the consideration received; • recognizes the fair value of any investment retained; • recognizes any surplus or deficit in profit or loss; and • reclassifies the parent’s share of components previously recognized in other comprehensive
income to profit or loss or retained earnings, as appropriate.
NCI represents the portion of the profit or loss and net assets of the Subsidiary attributable to equity interests that are not owned directly or indirectly by the Company, which are presented in the interim consolidated statements of comprehensive income and under the equity section of the interim consolidated statements of financial position, respectively, separately from the corresponding portion attributable to the equity holders of the parent company. Prior to January 1, 2011, losses attributable to the NCI in certain non-wholly owned subsidiary that have exceeded the NCI’s portion in the equity of the said subsidiary were temporarily charged against the controlling shareholder unless the NCI has a binding obligation to cover these losses. Subsequent profits of the said subsidiary shall be allocated to the controlling shareholder until the NCI's share of losses previously absorbed by the controlling shareholder has been recovered.
PT ASURANSI SINAR MAS AND ITS SUBSIDIARY Notes to Consolidated Financial Statements As of September 30, 2011 and 2010 and December 31, 2010 and For the Nine Month Periods Ended September 30, 2011 and 2010
- 11 -
Business Combinations Accounting Policies Effective January 1, 2011 Business combinations are accounted for using the acquisition method. The cost of an acquisition is measured as the aggregate of the consideration transferred, measured at acquisition date fair value and the amount of any NCI in the acquiree. For each business combination, the acquirer measures the NCI in the acquiree either at fair value or at the proportionate share of the acquiree’s identifiable net assets. Acquisition costs incurred are directly expensed and included in administrative expenses. When the Company and its subsidiary acquire a business, they assess the financial assets acquired and liabilities assumed for appropriate classification and designation in accordance with the contractual terms, economic circumstances and pertinent conditions as at the acquisition date. If the business combination is achieved in stages, the acquisition date fair value of the acquirer’s previously held equity interest in the acquiree is remeasured to fair value at the acquisition date through profit or loss. Any contingent consideration to be transferred by the acquirer will be recognized at fair value at the acquisition date. Subsequent changes to the fair value of the contingent consideration which is deemed to be an asset or liability, will be recognized in accordance with PSAK No. 55 (Revised 2006) either in profit or loss or as other comprehensive income. If the contingent consideration is classified as equity, it should not be measured until it is finally settled within equity.
At acquisition date, goodwill is initially measured at cost being the excess of the aggregate of the consideration transferred and the amount recognized for NCI over the net identifiable assets acquired and liabilities assumed. If this consideration is lower than the fair value of the net assets of the subsidiary acquired, the difference is recognized in profit or loss.
After initial recognition, goodwill is measured at cost less any accumulated impairment losses. For the purpose of impairment testing, goodwill acquired in a business combination is, from the acquisition date, allocated to each of the Company and/or its subsidiary’ cash-generating units (“CGU”) that are expected to benefit from the combination, irrespective of whether other assets or liabilities of the acquired are assigned to those CGUs.
Where goodwill forms part of a CGU and part of the operation within that CGU is disposed of, the goodwill associated with the operation disposed of is included in the carrying amount of the operation when determining the gain or loss on disposal of the operation. Goodwill disposed of in this circumstance is measured based on the relative values of the operation disposed of and the portion of the CGU retained. Accounting Policies Prior to January 1, 2011 In comparison to the above, the following were the accounting policies applied on business combination prior to January 1, 2011: • business combinations were accounted for using the purchase method. Transaction costs
directly attributable to the acquisition formed part of the acquisition costs. The NCI (formerly known as minority interest) was measured at the book value of the proportionate share of the acquiree’s identifiable net assets;
PT ASURANSI SINAR MAS AND ITS SUBSIDIARY Notes to Consolidated Financial Statements As of September 30, 2011 and 2010 and December 31, 2010 and For the Nine Month Periods Ended September 30, 2011 and 2010
- 12 -
• business combinations achieved in stages were accounted for as separate steps. Any additional acquired equity interest did not affect previously recognized goodwill;
• contingent consideration was recognized if, and only if, the Company and/or its subsidiary’ had
a present obligation, the economic outflow was more likely than not and a reliable estimate was determinable. Subsequent adjustments to the contingent consideration were recognized as part of goodwill.
Restructuring Transactions Among Entities Under Common Control Acquisition of a subsidiary from entities under common control which is a reorganization of companies under common control (pooling of interest), is accounted for in accordance with PSAK No. 38 (Revised 2004) “Accounting for Restructuring Transactions among Entities Under Common Control. Based on PSAK No. 38, transfer of assets, liabilities, shares and other instruments of ownership among entities under common control do not result in a gain or loss to the group or to the individual company within the same group. Since a restructuring transaction among entities under common control does not result in a change of the economic substance of the ownership of assets, liabilities, shares and other instruments of ownership which are exchanged, assets or liabilities transferred are recorded at book values as business combination using the pooling of interest method. Any difference between the transfer price and book value of each restructuring transaction between entities under common control are recorded in the account “Difference in value arising from restructuring transaction among entities under common control,” presented as a part of equity. The balance of “Difference in value arising from restructuring transactions among entities under common control” account is taken to the consolidated statements of comprehensive income as realized gain or loss as a result of (1) lost of under common control substance, and (2) transfer of the assets, liabilities, equity or other ownerhip instruments to another party who is not under common control. On the other hand, when there are reciprocal transactions between entities under common control, the existing balance is set - off with the new transaction, hence creating a new balance of this account.
d. Foreign Currency Transactions and Balances
The books of accounts of the Company and its subsidiary are maintained in Rupiah. Transactions during the year involving foreign currencies are recorded at the rates of exchange prevailing at the time the transactions are made. At consolidated statement of financial position date, monetary assets and liabilities denominated in foreign currencies are adjusted using the Bank Indonesia’s middle rates of exchange prevailing at that date. The resulting gains or losses are credited in or charged to current operations.
The foreign exchange gains or losses on monetary items is the difference between amortized cost in Rupiah at the beginning of the period, adjusted for effective interest and payments during the period, and the amortized cost in foreign currency translated into Rupiah at the exchange rate at the end of the period.
As of September 30, 2011 and 2010 and December 31, 2010, the conversion rates used by the Company and its subsidiary were the middle rates of Bank Indonesia of Rp 8,823 and Rp 8,924 and Rp 8,991, respectively, per US$ 1.
PT ASURANSI SINAR MAS AND ITS SUBSIDIARY Notes to Consolidated Financial Statements As of September 30, 2011 and 2010 and December 31, 2010 and For the Nine Month Periods Ended September 30, 2011 and 2010
- 13 -
e. Transactions with Related Parties
Accounting Policies Effective January 1, 2011
A party is considered to be related to the Company if:
1. directly, or indirectly through one or more intermediaries, the party: a) controls, is controlled by, or is under common control with, the Company and/or its
subsidiary; b) has an interest in the Company and/or its subsidiary that gives it significant influence
over the Company and/or its subsidiary; or, c) has joint control over the Company and/or its subsidiary;
2. the party is an associate of the Company and/or its subsidiary; 3. the party is a joint venture in which the Company and/or its subsidiary is a venturer; 4. the party is a member of the key management personnel of the Company and/or its
subsidiary or its parent; 5. the party is a close member of the family of any individual referred to in (1) or (4); 6. the party is an entity that is controlled, jointly controlled or significantly influenced by or for
which significant voting power in such entity resides with, directly or indirectly, any individual referred to in (4) or (5); or
7. the party is a post employment benefit plan for the benefit of employees of the Company and/or its subsidiary, or of any entity that is a related party of the Company and/or its subsidiary.
Accounting Policies Prior to January 1, 2011
Related parties consist of the following:
1. Companies that, through one or more intermediaries, control or are controlled by, or are under common control with, the Company (including holding companies, subsidiary, and fellow subsidiary);
2. Associated companies;
3. Individuals owning, directly or indirectly, an interest in the voting power of the Company that gives them significant influence over the Company and/or its subsidiary, and close family members of such individuals (close family members are those who can influence or can be influenced by such individuals in their transactions with the Company and/or its subsidiary);
4. Key management personnel, that is, those persons having authority and responsibility for
planning, directing and controlling the activities of the Company and/or its subsidiary, including commissioners, directors and managers of the Company and/or its subsidiary and close family members of such individuals; and
5. Companies in which a substantial interest in the voting power is owned, directly or indirectly,
by any person described in (3) or (4) or over which such person is able to exercise significant influence. These include companies owned by commissioners, directors or major stockholders of the Company and/or its subsidiary, and companies that have a common member of key management with that of the Company and/or its subsidiary.
All transactions with related parties, whether or not done under similar terms and conditions as those done with third parties, are disclosed in the consolidated financial statements.
PT ASURANSI SINAR MAS AND ITS SUBSIDIARY Notes to Consolidated Financial Statements As of September 30, 2011 and 2010 and December 31, 2010 and For the Nine Month Periods Ended September 30, 2011 and 2010
- 14 -
f. Use of Estimates
The preparation of consolidated financial statements in conformity with financial accounting standards in Indonesia requires management to make estimates and assumptions that affect the reported amounts of assets and liabilities and disclosure of contingent assets and liabilities at the date of the consolidated financial statements and the reported amounts of revenues and expenses during the reporting period. Actual results could differ from those estimates.
Estimates and underlying assumptions are reviewed on an ongoing basis. Revisions to accounting estimates are recognized in the period in which the estimate is revised and in any future periods affected. Information about significant areas of estimation uncertainty and critical judgements in applying accounting policies that have significant effect on the amount recognized in the consolidated financial statements are described on Note 3 to the the consolidated financial statements.
g. Cash
Cash include cash on hand, cash in banks which are not used as collateral and are not restricted.
h. Financial Instruments The Company and its subsidiary recognize a financial asset or a financial liability in the consolidated statement of financial position, if and if only they become a party to the contractual provisions of the instrument. All regular way purchases and sales of financial instruments are recognized on the settlement date. Financial instruments are recognized initially at fair value, which is the fair value of the consideration given (in case of an asset) or received (in case of a liability). The fair value of the consideration given or received is determined by reference to the transaction price or other market prices. If such market prices are not reliably determinable, the fair value of the consideration is estimated as the sum of all future cash payments or receipts, discounted using the prevailing market rates of interest for similar instruments with similar maturities. The initial measurement of financial instruments, except for financial instruments at fair value through profit and loss (FVPL), includes transaction costs. Transaction costs include only those costs that are directly attributable to the acquisition of a financial asset or issue of financial liability and they are incremental costs that would not have been incurred if the instrument had not been acquired or issued. Such transaction costs are amortized over the terms of the instruments based on the effective interest rate method. Included in transaction costs are fees and commissions paid to agents (including employees acting as selling agents), consultants, brokerage and securities dealers, levies required by regulators and stock exchanges, as well as taxes and duties imposed on transfers made. Transaction costs do not include debt premium or discount, financing costs (financing costs), or internal administrative costs or storage costs (handling cost). Effective interest rate method is a method of calculating the amortized cost of a financial asset or a financial liability and allocating the interest income or expense over the relevant period by using an interest rate that exactly discounts estimated future cash payments or receipts through the expected life of the instruments or, when appropriate, a shorter period to the net carrying amount of the financial instruments. When calculating the effective interest, the Company and its subsidiary estimate future cash flows considering all contractual terms of the financial instruments excluding future credit losses and includes all fees and points paid or received that are an integral part of the effective interest rate.

PT ASURANSI SINAR MAS AND ITS SUBSIDIARY Notes to Consolidated Financial Statements As of September 30, 2011 and 2010 and December 31, 2010 and For the Nine Month Periods Ended September 30, 2011 and 2010
- 15 -
Amortized cost is the amount at which the financial asset or financial liability is measured at initial recognition, minus principal repayments, plus or minus the cumulative amortization using the effective interest rate method of any difference between the initial amount recognized and the maturity amount, minus any reduction for impairment. The classification of the financial instruments depends on the purpose for which the instruments were acquired and whether they are quoted in an active market. At initial recognition, the Company and its subsidiary classify their financial instruments in following categories: financial assets at FVPL, loans and receivables, held-to-maturity (HTM) investments, available for sale (AFS) financial assets, financial liabilities at FVPL and other financial liabilities; and, where allowed and appropriate, re-evaluate such classification at every reporting date. Determination of Fair Value The fair value of financial instruments traded in active markets at the consolidated statement of financial position date is based on their quoted market price or dealer price quotations (bid price for long positions and ask price for short positions), without any deduction for transaction costs. When current bid and asking prices are not available, the price of the most recent transaction is used since it provides evidence of the current fair value as long as there has not been a significant change in economic circumstances since the time of the transaction. For all other financial instruments not listed in an active market, except investment in unquoted equity securities, the fair value is determined by using appropriate valuation techniques. Valuation techniques include net present value techniques, comparison to similar instruments for which market observable prices exist, options pricing models, and other relevant valuation models. In the absence of a reliable basis for determining fair value, investments in unquoted equity securities are carried at cost net of impairment. Day 1 Profit/Loss Where the transaction price in a non-active market is different from the fair value of other observable current market transactions in the same instrument or based on a valuation technique whose variables include only data from observable market, the Company and its subsidiary recognize the difference between the transaction price and fair value (a Day 1 profit/loss) in the consolidated statement of comprehensive income unless it qualifies for recognition as some other type of asset. In cases where the data is not observable, the difference between the transaction price and model value is only recognized in the consolidated statement of comprehensive income when the inputs become observable or when the instrument is derecognized. For each transaction, the Company and/or its subsidiary determines the appropriate method of recognizing the “Day 1” profit/loss amount.
Financial Assets
1. Financial Assets at FVPL
Financial assets at FVPL include financial assets held for trading and financial assets designated upon initial recognition at FVPL. Financial assets are classified as held for trading if they are acquired for the purpose of selling in the near term. Derivatives are also classified as held for trading unless they are designated as effective hedging instruments.
Financial assets may be designated at initial recognition at FVPL if the following criteria are met:
a. the designation eliminates or significantly reduces the inconsistent treatment that would
otherwise arise from measuring the financial assets or recognizing gains or losses on them on a different basis; or

PT ASURANSI SINAR MAS AND ITS SUBSIDIARY Notes to Consolidated Financial Statements As of September 30, 2011 and 2010 and December 31, 2010 and For the Nine Month Periods Ended September 30, 2011 and 2010
- 16 -
b. the assets are part of a group of financial assets, financial liabilities or both which are managed and their performance evaluated on a fair value basis, in accordance with a documented risk management or investment strategy; or
c. the financial instruments contain an embedded derivative, unless the embedded
derivative does not significantly modify the cash flows or it is clear, with little or no analysis, that it would not be separately recorded.
Financial assets at FVPL are recorded in the consolidated statements of financial position at fair value. Changes in fair value are recognized directly in the consolidated statements of comprehensive income. Interest earned is recorded as interest income, while dividend income is recorded as part of other income according to the terms of the contract, or when the right of payment has been established.
As of September 30, 2011 and 2010 and December 31, 2010, this category includes investments (bonds, statutory marketable securities and units of mutual fund).
2. Loans and Receivables
Loans and receivables are non-derivative financial assets with fixed or determinable payments that are not quoted in an active market. They are not entered into with the intention of immediate or short-term resale and are not classified as financial assets at FVPL, HTM investments or AFS financial assets. After initial measurement, loans and receivables are subsequently measured at amortized cost using the effective interest method, less allowance for impairment. Amortized cost is calculated by taking into account any discount or premium on acquisition and fees and costs that are an integral part of the effective interest rate. The amortization is included as part of interest income in the consolidated statements of comprehensive income. The losses arising from impairment are recognized in the consolidated statements of comprehensive income. As of September 30, 2011 and 2010 and December 31, 2010, this category includes investments (time deposits, statutory time deposits and mortgage loans), cash, cash in banks and other receivables.
3. HTM Investments
HTM investments are non-derivative financial assets with fixed or determinable payments and fixed maturities for which the Company’s management has the positive intention and ability to hold to maturity. When the Company or its subsidiary sell or reclassify other than an insignificant amount of HTM investments before maturity, the entire category would be tainted and reclassified as AFS financial assets. After initial measurement, these investments are subsequently measured at amortized cost using the effective interest method, less impairment in value. Amortized cost is calculated by taking into account any discount or premium on acquisition and fees that are an integral part of the effective interest rate. The amortization is included as part of interest income in the consolidated statements of comprehensive income. Gains and losses are recognized in the consolidated statements of comprehensive income when the HTM investments are derecognized and impaired, as well as through the amortization process using effective interest method. As of September 30, 2011 and 2010 and December 31, 2010, the Company and its subsidiary have not classified any financial asset as at HTM Investments.

PT ASURANSI SINAR MAS AND ITS SUBSIDIARY Notes to Consolidated Financial Statements As of September 30, 2011 and 2010 and December 31, 2010 and For the Nine Month Periods Ended September 30, 2011 and 2010
- 17 -
4. AFS Financial Assets
AFS financial assets are those which are designated as such or not classified in any of the other categories. They are purchased and held indefinitely and may be sold in response to liquidity requirements or changes in market conditions. After initial measurement, AFS financial assets are subsequently measured at fair value. The effective yield component of AFS debt securities, as well as the impact of translation on foreign currency-denominated AFS debt securities, is reported in the consolidated statements of comprehensive income. The unrealized gains and losses arising from fair valuation of AFS financial assets are presented as part of equity section of the consolidated statement of financial position and in the consolidated statement of changes in equity with changes in balance of unrealized gains and losses recognized in consolidated statement of comprehensive income until the investment is derecognized. As of September 30, 2011 and 2010 and December 31, 2010, this category includes investments - shares that are traded in Indonesia Stock Exchange, and certain investments in shares (Note 4).
In the absence of a reliable basis for determining the fair value, the Company and its subsidiary’s certain investments in shares of stock enumerated in Note 4f are carried at cost.
Financial Liabilities
1. Financial Liabilities at FVPL Financial liabilities are classified in this category if these result from trading activities or derivative transactions that are not accounted for as accounting hedges, or when the Company and its subsidiary elect to designate a financial liability under this category. Changes in fair value are recognized directly in the consolidated statements of comprehensive income. As of September 30, 2011 and 2010 and December 31, 2010, the Company and its subsidiary have not classified any financial liability as at FVPL.
2. Other Financial Liabilities
This category pertains to financial liabilities that are not held for trading or not designated at FVPL upon the inception of the liability. Issued financial instruments or their components, which are not classified as financial liabilities at FVPL are classified as other financial liabilities, where the substance of the contractual arrangement results in the Company and its subsidiary having an obligation either to deliver cash or another financial asset to the holder, or to satisfy the obligation other than by the exchange of a fixed amount of cash or another financial asset for a fixed number of own equity shares. Other financial liabilities are recognized initially at fair value and are subsequently carried at amortized cost, taking into account the impact of applying the effective interest rate method of amortization (or accretion) for any related premium, discount and any directly attributable transaction costs. As of September 30, 2011 and 2010 and December 31, 2010, this category includes accrued expenses and other liabilities.

PT ASURANSI SINAR MAS AND ITS SUBSIDIARY Notes to Consolidated Financial Statements As of September 30, 2011 and 2010 and December 31, 2010 and For the Nine Month Periods Ended September 30, 2011 and 2010
- 18 -
Offsetting of Financial Instruments Financial assets and liabilities are offset and the net amount reported in the consolidated statement of financial position if, and only if, there is a currently enforceable right to offset the recognized amounts and there is intention to settle on a net basis, or to realize the asset and settle the liability simultaneously. Impairment of Financial Assets The Company and its subsidiary’s management assesses at each consolidated statement of financial position date whether a financial asset or group of financial assets is impaired.
1. Assets Carried at Amortized Cost
The management first assesses whether objective evidence of impairment exists individually for financial assets that are individually significant, or collectively for financial assets that are not individually significant. If the management determines that no objective evidence of impairment exists for an individually assessed financial asset, whether significant or not, the asset is included in a group of financial assets with similar credit risk characteristics and that group of financial assets is collectively assessed for impairment. Assets that are individually assessed for impairment and for which an impairment loss, is or continues to be recognized are not included in a collective assessment of impairment. If there is objective evidence that an impairment loss on loans and receivables or held to maturity investments carried at amortized cost has been incurred, the amount of the loss is measured as the difference between the asset’s carrying amount and the present value of estimated future cash flows (excluding future credit losses that have not been incurred) discounted at the financial asset’s original effective interest rate (i.e., the effective interest rate computed at initial recognition). The carrying amount of the asset is reduced either directly or through the use of an allowance account. The amount of loss is charged to the consolidated statement of comprehensive income. If, in a subsequent year, the amount of the impairment loss decreases because of an event occurring after the impairment was recognized, the previously recognized impairment loss is reversed. Any subsequent reversal of an impairment loss is recognized in the consolidated statement of comprehensive income, to the extent that the carrying value of the asset does not exceed its amortized cost at the reversal date.
2. Assets Carried at Cost
If there is objective evidence that an impairment loss has been incurred on an unquoted equity instrument that is not carried at fair value because its fair value cannot be reliably measured, the amount of the loss is measured as the difference between the asset’s carrying amount and the present value of estimated future cash flows discounted at the current market rate of return for a similar financial asset.
3. AFS Financial Assets
In case of equity investments classified as AFS, assessment of any impairment would include a significant or prolonged decline in the fair value of the investments below its cost. Where there is evidence of impairment, the cumulative loss measured as the difference between the acquisition cost and the current fair value, less any impairment loss on that financial asset previously recognized in the consolidated statement of comprehensive income is removed from equity and recognized in the consolidated statement of comprehensive income. Impairment losses on equity investments are not reversed through the consolidated statement of comprehensive income. Increases in fair value after impairment are recognized directly in equity.
PT ASURANSI SINAR MAS AND ITS SUBSIDIARY Notes to Consolidated Financial Statements As of September 30, 2011 and 2010 and December 31, 2010 and For the Nine Month Periods Ended September 30, 2011 and 2010
- 19 -
In the case of debt instruments classified as AFS, impairment is assessed based on the same criteria as financial assets carried at amortized cost. Interest continues to be accrued at the original effective interest rate on the reduced carrying amount of the asset and is recorded as part of interest income in the consolidated statement of comprehensive income. If, in subsequent year, the fair value of a debt instrument increased and the increase can be objectively related to an event occurring after the impairment loss was recognized in the consolidated statement of comprehensive income, the impairment loss is reversed through the consolidated statement of comprehensive income.
Derecognition of Financial Assets and Liabilities
1. Financial Assets
Financial asset (or, where applicable, a part of a financial asset or part of a group of similar financial assets) is derecognized when:
a. the rights to receive cash flows from the asset have expired; b. the Company and/or its subsidiary retains the right to receive cash flows from the asset,
but has assumed an obligation to pay them in full without material delay to a third party under a “pass-through” arrangement; or
c. the Company and/or its subsidiary has transferred its rights to receive cash flows from the asset and either (i) has transferred substantially all the risks and rewards of the asset, or (ii) has neither transferred nor retained substantially all the risks and rewards of the asset, but has transferred control of the asset.
Where the Company and/or its subsidiary has transferred its rights to receive cash flows from an asset or has entered into a pass-through arrangement, and has neither transferred nor retained substantially all the risks and rewards of the asset nor transferred control of the asset, the asset is recognized to the extent of the Company and/or its subsidiary continuing involvement in the asset. Continuing involvement that takes the form of a guarantee over the transferred asset is measured at the lower of the original carrying amount of the asset and the maximum amount of consideration that the Company and/or its subsidiary could be required to repay.
2. Financial Liabilities
A financial liability is derecognized when the obligation under the contract is discharged, cancelled or has expired. Where an existing financial liability is replaced by another from the same lender on substantially different terms, or the terms of an existing liability are substantially modified, such an exchange or modification is treated as a derecognition of the original liability. The recognition of a new liability and the difference in the respective carrying amounts is recognized in the consolidated statement of comprehensive income.
i. Investments in Associates Investments in associates are accounted for using the equity method of accounting and are initally recognized at cost. Associates are all entities over which the Company and/or its subsidiary has significant influence but not control, generally accompanying a shareholding of between 20% to 50% of the voting rights. These investments include goodwill identified on acquisition, net of any impairment loss. The Company and/or its subsidiary’ share of its associates’ post-acquisition profits or losses is recognized in consolidated statement of comprehensive income, and its share of post acquisition movements in other comprehensive income is recognized in other comprehensive income. The cumulative post-acquisition movements are adjusted against the carrying amount of the investment. When the Company and/or its subsidiary share of losses in an associate equals or exceeds its interest in the associate, the Company and/or its subsidiary does not recognize further losses, unless it has incurred obligations or made payments on behalf of the associate.

PT ASURANSI SINAR MAS AND ITS SUBSIDIARY Notes to Consolidated Financial Statements As of September 30, 2011 and 2010 and December 31, 2010 and For the Nine Month Periods Ended September 30, 2011 and 2010
- 20 -
Dilution gains or losses arising from investments in associates are recognized in the consolidated statement of comprehensive income. Unrealized gains on transactions between the Company and/or its subsidiary and its associates are eliminated to the extent of its interest in the associates. Unrealized losses are also eliminated unless the transaction provides evidence of an impairment of the asset transferred. Adjustments are made where necessary to conform the associate’s accounting policies with the policies adopted by the Company and/or its subsidiary.
j. Receivables
Premiums receivable consist of receivables from policyholders/agents/ brokers resulting from an insurance transaction. In conditions where the Company and its subsidiary give premium discount to policyholders, the discount is reduced directly from the related premiums receivable. Reinsurance receivables cannot be offset against reinsurance payable, unless the reinsurance contract specifically allows the right of offset. If a credit balance arises from the offsetting of the reinsurance receivables and payables, this balance is presented in the liability section as reinsurance payables. The Company and its subsidiary assess its receivables for impairment on a regular basis. If there is objective evidence that these receivables are impaired, the Company and its subsidiary reduce the carrying amounts of the receivables to their recoverable amounts and recognize that impairment loss in the consolidated statement of comprehensive income. The Company and its subsidiary gather the objective evidence that a receivable is impaired using the same process adopted for financial assets held at amortized cost. The impairment loss is also calculated following the same method used for financial assets described in Note 2h.
k. Investment Properties
Investment properties are measured at cost, including transaction costs, less accumulated depreciation and any impairment loss. The carrying amount includes the cost of replacing part of an existing investment property at the time that cost is incurred if the recognition criteria are met; and excludes the costs of day-to-day servicing of an investment property. Investment properties are derecognized when either they have been disposed of or when the investment property is permanently withdrawn from use and no future economic benefit is expected from its disposal. Any gains or losses on the retirement or disposal of an investment property are recognized in the consolidated statement of comprehensive income in the year of retirement or disposal. Investment properties are depreciated over their estimated useful life of 20 years using the straight-line method. Transfers are made to investment properties when, and only when, there is a change in use, evidenced by ending of owner-occupation, commencement of an operating lease to another party or ending of construction or development. Transfers are made from investment properties when, and only when, there is a change in use, evidenced by commencement of owner-occupation or commencement of development with a view to sale.
l. Property and Equipment
Property and equipment, except land, are carried at cost, excluding day-to-day servicing, less accumulated depreciation and any impairment in value. Land is not depreciated and is stated at cost less any impairment in value. The initial cost of property and equipment consists of its purchase price, including import duties and taxes and any directly attributable costs in bringing the property and equipment to its working condition and location for its intended use.

PT ASURANSI SINAR MAS AND ITS SUBSIDIARY Notes to Consolidated Financial Statements As of September 30, 2011 and 2010 and December 31, 2010 and For the Nine Month Periods Ended September 30, 2011 and 2010
- 21 -
Expenditures incurred after the property and equipment have been put into operations, such as repairs and maintenance costs, are normally charged to operations in the year such costs are incurred. In situations where it can be clearly demonstrated that the expenditures have resulted in an increase in the future economic benefits expected to be obtained from the use of the property and equipment beyond its originally assessed standard of performance, the expenditures are capitalized as additional costs of property and equipment. Buildings are depreciated using the straight-line method, while other property and equipment items are depreciated using the double-declining balance method over the property and equipment’s useful lives as follows:
Years Buildings 20 Motor vehicles 4 – 8 Computer equipment 4 – 8 Furniture and fixtures Partitions
4 – 8 4 – 8
The carrying values of property and equipment are reviewed for impairment when events or changes in circumstances indicate that the carrying values may not be recoverable. When each major inspection is performed, its cost is recognized in the carrying amount of the item of property and equipment as a replacement if the recognition criteria are satisfied. Such major inspection is capitalized and amortized over the next major inspection activity. When assets are sold or retired, the cost and related accumulated depreciation and any impairment loss are eliminated from the accounts. An item of property and equipment is derecognized upon disposal or when no future economic benefits are expected from its use or disposal. Any gains or loss arising from derecognition of property and equipment (calculated as the difference between the net disposal proceeds, if any, and the carrying amount of the item) is included in the consolidated statement of comprehensive income in the year the item is derecognized. The asset’s residual values, useful lives and depreciation and amortization method are reviewed and adjusted if appropriate, at each financial year end.
Construction in Progress
Construction in progress represents property and equipment under construction which is stated at cost and is not depreciated. The accumulated costs will be reclassified to the respective property and equipment account and will be depreciated when the construction is substantially complete and the asset is ready for its intended use.
m. Impairment of Non-Financial Assets The Company and its subsidiary assess at each annual reporting period whether there is an indication that an asset may be impaired. If any such indication exists, or when annual impairment testing for an asset (i.e. an intangible asset with an indefinite useful life, an intangible asset not yet available for use, or goodwill acquired in a business combination) is required, the Company and its subsidiary make an estimate of the asset’s recoverable amount.

PT ASURANSI SINAR MAS AND ITS SUBSIDIARY Notes to Consolidated Financial Statements As of September 30, 2011 and 2010 and December 31, 2010 and For the Nine Month Periods Ended September 30, 2011 and 2010
- 22 -
An asset’s recoverable amount is the higher of an asset’s or CGU’s fair value less costs to sell and its value in use, and is determined for an individual asset, unless the asset does not generate cash inflows that are largely independent of those from other assets or groups of assets. Where the carrying amount of an asset exceeds its recoverable amount, the asset is considered impaired and is written down to its recoverable amount. Impairment losses of continuing operations are recognized in the consolidated statement of comprehensive income as “impairment losses”. In assessing the value in use, the estimated net future cash flows are discounted to their present value using a pre-tax discount rate that reflects current market assessments of the time value of money and the risks specific to the asset. In determining fair value less costs to sell, recent market transactions are taken into account, if available. If no such transactions can be identified, an appropriate valuation model is used to determine the fair value of the assets. These calculations are corroborated by valuation multiples or other available fair value indicators. Impairment losses of continuing operations, if any, are recognized in the interim consolidated statements of comprehensive income under expense categories that are consistent with the functions of the impaired assets. An assessment is made at each annual reporting period as to whether there is any indication that previously recognized impairment losses recognized for an asset other than goodwill may no longer exist or may have decreased. If such indication exists, the recoverable amount is estimated. A previously recognized impairment loss for an asset other than goodwill is reversed only if there has been a change in the assumptions used to determine the asset’s recoverable amount since the last impairment loss was recognized. If that is the case, the carrying amount of the asset is increased to its recoverable amount. The reversal is limited so that the carrying amount of the assets does not exceed its recoverable amount, nor exceed the carrying amount that would have been determined, net of depreciation, had no impairment loss been recognized for the asset in prior years. Reversal of an impairment loss is recognized in the consolidated statement of comprehensive income. After such a reversal, the depreciation charge on the said asset is adjusted in future periods to allocate the asset’s revised carrying amount, less any residual value, on a systematic basis over its remaining useful life.
n. Noncurrent Assets Held for Sale Noncurrent assets and disposal groups are classified as held for sale if their carrying amount will be recovered principally through as sale transaction rather than through continuing use. All of the assets and liabilities of that subsidiary are classifed as held for sale when the criteria described above are met, regardless of whether the Company and/ or its subsidiary will retain a non-controlling interest in its former subsidiary after the sale. Noncurrent assets (and disposal groups) classified as held for sale are measured at the lower of their previous carrying amount and fair value less costs to sell.
o. Premium Income Recognition Premiums on insurance and reinsurance contracts are recognized as revenue over the policy contract period in proportion to the insurance coverage provided. Premium from coinsurance is recognized as income based on the Company and its subsidiary’s proportionate share in the premium. Premium due to reinsurance company is recognized as reinsurance premium during the period of reinsurance contract in proportion to the insurance coverage received. Unearned premiums are calculated in aggregate using a percentage in accordance with the Decision Letter of the Minister of Finance of the Republic of Indonesia No. 424/KMK.06/2003 which is minimum of 10% of net premium for insurance policy with period covering not more than one (1) month and minimum of 40% of the net premium for insurance policy with period covering more than one (1) month.

PT ASURANSI SINAR MAS AND ITS SUBSIDIARY Notes to Consolidated Financial Statements As of September 30, 2011 and 2010 and December 31, 2010 and For the Nine Month Periods Ended September 30, 2011 and 2010
- 23 -
The increase or decrease in unearned premiums represents the difference of the balances of unearned premiums between the current and the prior year. The Company and its subsidiary reinsured part of its total accepted risk to other insurance and reinsurance companies. The premium paid to the reinsurer or the insurer’s share in the premium on prospective reinsurance transaction is recognized as reinsurance premium (contra premium account) over the reinsurance contract period in proportion to the insurance coverage provided. A payment or obligation for retrospective reinsurance transaction is recognized as reinsurance receivable from the reinsurer in the amount equivalent to the payment made or recorded liability in relation to the reinsurance contract. Underwriting income in the consolidated statement of comprehensive income is presented at gross premiums, reduced by reinsurance premiums and decrease or increase in unearned premiums.
p. Claims Expense Claims consist of settled claims, claims in process, including claims incurred but not yet reported, and claim settlement expenses. Claims are recognized as expenses when the obligation to settle the claims was incurred. The portion of claims recovered from reinsurers are recorded and recognized as deduction from claim expenses in the same period when the claim expenses are recognized. Subrogation rights are recognized as deduction from claims expense upon realization. Claims in process (estimated own retention claims) are computed based on the Company and its subsidiary’s own retention share of the claims in process at consolidated statement of financial position date, including claims incurred but not yet reported. Changes in estimated own retention claims are recognized in the consolidated statements of comprehensive income at the time of change. The increase or decrease in estimated own retention claims represents the difference between the estimated own retention claims for the current year and the prior year. Claims expense represents gross claims, reduced by reinsurance claims and increase or decrease in estimated own retention claims.
q. Commission Commissions due to insurance brokers, agents and other insurance companies in connection with the insurance coverage are recorded as commission expense when incurred, whereas commissions obtained from reinsurance transactions are recorded as deduction from commission expense, and recognized when earned.
r. Accounting for Sharia In the insurance accounting system of sharia division, the Company and its subsidiary separate the funds belonging to the stockholders from those to “Takaful customers”. The reporting of the customers fund reflects the financial position, result of operations and the customers’ surplus or deficit of fund. The allocation of profit sharing (mudharabah) on the underwriting surplus and investement income is distributed to customers who never make any claims during the insurance period.
s. Employee Benefits Short-term employee benefits Short-term employee benefits are in the form of wages, salaries, bonuses, holiday allowances and social security (Jamsostek) contribution. Short-term employee benefits are recognized at its undiscounted amount as a liability, after deducting any amount already paid, in the consolidated statements of financial position and as an expense in the consolidated statements of comprehensive income.

PT ASURANSI SINAR MAS AND ITS SUBSIDIARY Notes to Consolidated Financial Statements As of September 30, 2011 and 2010 and December 31, 2010 and For the Nine Month Periods Ended September 30, 2011 and 2010
- 24 -
Post-employment benefits Post-employment benefits are funded defined-benefit plans through a certain pension fund which amounts are determined based on years of service and salaries of the employees at the time of pension. The actuarial valuation method used to determine the present value of defined-benefit reserve, related current service costs and past service costs is the Projected Unit Credit. Current service costs, interest costs, past service costs which are vested, expected return on plan assets and effects of curtailments and settlements (if any) are charged directly to current operations. Past service costs which are not yet vested and actuarial gains or losses for working (active) employees are amortized during the employees’ average remaining years of service, until the benefits become vested. The Company and its subsidiary also provide employee benefits as required under Labor Law No. 13/2003. Post-employment benefits reserve is presented at the present value of defined-benefit reserve net of unrecognized actuarial gains or losses, unrecognized past service costs and fair value of plan assets.
t. Income Tax Current tax expense is determined based on the taxable income for the year computed using prevailing tax rates. Deferred tax assets and liabilities are recognized for the future tax consequences attributable to the differences between the financial statement carrying amounts of existing assets and liabilities and their respective tax bases and the carry forward tax benefit of unused tax losses (fiscal losses). Deferred tax liabilities are recognized for all taxable temporary differences and deferred tax assets are recognized for deductible temporary differences and the carry forward tax benefit of unused fiscal losses to the extent that it is probable that taxable income will be available in future periods against which the deductible temporary differences can be utilized. The carrying amount of a deferred tax asset is reviewed at each consolidated statement of financial position date and is reduced to the extent that it is no longer probable that sufficient taxable income will be available to allow the benefit of part or all of that deferred tax assets to be utilized. Any such reduction is reversed to the extent that it becomes probable that sufficient taxable income would be available. Deferred tax is calculated at the tax rates that have been enacted or substantively enacted at consolidated statement of financial position date. Deferred tax is charged to or credited in the consolidated statements of comprehensive income, except when it relates to items charged to or credited directly in equity, in which case the deferred tax is also charged to or credited directly in equity. Deferred tax assets and liabilities are offset in the consolidated statement of financial position, except if these are for different legal entities, in the same manner the current tax assets and liabilities are presented.
u. Provisions Provisions are recognized when the Company and its subsidiary have present obligation (legal or constructive) as a result of a past event, it is probable that the Company and its subsidiary will be required to settle the obligation, and a reliable estimate can be made of the amount of the obligation. The amount recognized as a provision is the best estimate of the consideration required to settle the obligation at the reporting date, taking into account the risks and uncertainties surrounding the obligation. Where a provision is measured using the cash flows estimated to settle the present obligation, its carrying amount is the present value of those cash flows.
PT ASURANSI SINAR MAS AND ITS SUBSIDIARY Notes to Consolidated Financial Statements As of September 30, 2011 and 2010 and December 31, 2010 and For the Nine Month Periods Ended September 30, 2011 and 2010
- 25 -
When some or all of the economic benefits required to settle a provision are expected to be recovered from a third party, the receivable is recognized as an asset if it is virtually certain that reimbursement will be received and the amount of the receivable can be measured reliably.
v. Events after the Reporting Period
Post year-end events that provide additional information about the Company and its subsidiary financial position at the date of the consolidated statement of financial position (adjusting events), if any, are reflected in the consolidated financial statements. Post year-end events that are not adjusting events are disclosed in the notes to consolidated financial statements when material.
3. Management Use of Estimates, Judgments and Assumptions
In the application of the Company and its subsidiary’s accounting policies, which are described in Note 2 to the consolidated financial statements, management is required to make judgments, estimates and assumptions about the carrying amounts of assets and liabilities that are not readily apparent from other sources. The estimates and assumptions are based on historical experience and other factors that are considered to be relevant. Management believes that the following represent a summary of the significant estimates, judgments and assumptions made that affected certain reported amounts of and disclosures in the consolidated financial statements:
Fair Value of Financial Assets and Financial Liabilities PSAK No. 55 (Revised 2006), Financial Instruments: Recognition and Measurement requires that certain financial assets and financial liabilities be carried at fair value, which requires the use of accounting estimates and judgment. While significant components of fair value measurement are determined using verifiable objective evidence (i.e. foreign exchange rates, interest rates), the timing and amount of changes in fair value, would differ using a different valuation methodology.
The fair value of financial assets and financial liabilities are set out in Note 20. Financial Assets Not Quoted in Active Market
The Company and its subsidiary classify financial assets by evaluating, among others, whether the asset is quoted or not in an active market. Included in the evaluation on whether a financial asset is quoted in an active market is the determination on whether quoted prices are readily and regularly available, and whether those prices represent actual and regularly occurring market transactions on an arm’s length basis. Allowance for Impairment of Receivables
Allowance for impairment losses is maintained at a level considered adequate to provide for potentially uncollectible receivables. The Company and its subsidiary assess specifically at each consolidated statement of financial position date whether there is objective evidence that a financial asset is impaired (uncollectible). The level of allowance is based on past collection experience and other factors that may affect collectability such as the probability of insolvency or significant financial difficulties of the debtor or significant delay in payments. If there is objective evidence of impairment, timing and collectible amounts are estimated based on historical loss data. Provision for doubtful accounts is provided on accounts specifically identified as impaired. Loans and receivables written off are based on management’s decisions that the financial assets are uncollectible or cannot be realized in whatsoever actions will be taken. Evaluation of receivables to determine the total allowance to be provided, is performed periodically during the year.
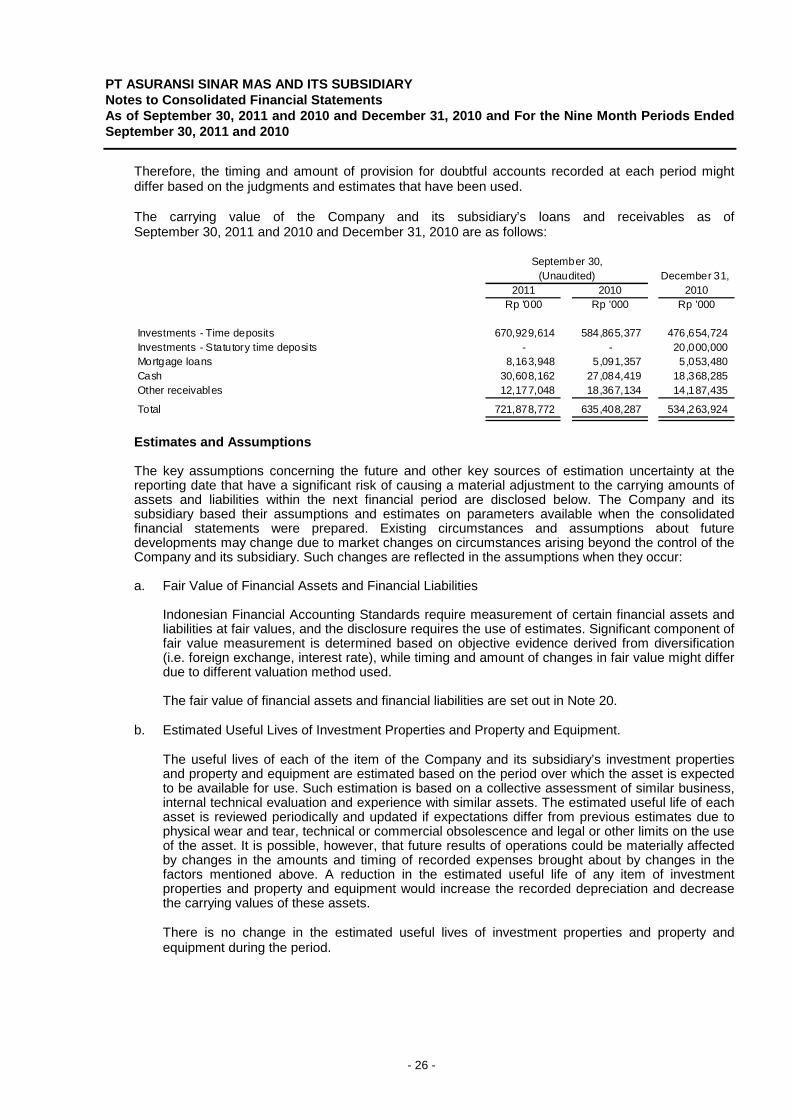
PT ASURANSI SINAR MAS AND ITS SUBSIDIARY Notes to Consolidated Financial Statements As of September 30, 2011 and 2010 and December 31, 2010 and For the Nine Month Periods Ended September 30, 2011 and 2010
- 26 -
Therefore, the timing and amount of provision for doubtful accounts recorded at each period might differ based on the judgments and estimates that have been used. The carrying value of the Company and its subsidiary’s loans and receivables as of September 30, 2011 and 2010 and December 31, 2010 are as follows:
December 31,2011 2010 2010
Rp '000 Rp '000 Rp '000
Investments - Time deposits 670,929,614 584,865,377 476,654,724 Investments - Statutory time deposi ts - - 20,000,000 Mortgage loans 8,163,948 5,091,357 5,053,480 Cash 30,608,162 27,084,419 18,368,285 Other receivables 12,177,048 18,367,134 14,187,435
Total 721,878,772 635,408,287 534,263,924
(Unaudited)September 30,
Estimates and Assumptions
The key assumptions concerning the future and other key sources of estimation uncertainty at the reporting date that have a significant risk of causing a material adjustment to the carrying amounts of assets and liabilities within the next financial period are disclosed below. The Company and its subsidiary based their assumptions and estimates on parameters available when the consolidated financial statements were prepared. Existing circumstances and assumptions about future developments may change due to market changes on circumstances arising beyond the control of the Company and its subsidiary. Such changes are reflected in the assumptions when they occur:
a. Fair Value of Financial Assets and Financial Liabilities
Indonesian Financial Accounting Standards require measurement of certain financial assets and liabilities at fair values, and the disclosure requires the use of estimates. Significant component of fair value measurement is determined based on objective evidence derived from diversification (i.e. foreign exchange, interest rate), while timing and amount of changes in fair value might differ due to different valuation method used. The fair value of financial assets and financial liabilities are set out in Note 20.
b. Estimated Useful Lives of Investment Properties and Property and Equipment. The useful lives of each of the item of the Company and its subsidiary’s investment properties and property and equipment are estimated based on the period over which the asset is expected to be available for use. Such estimation is based on a collective assessment of similar business, internal technical evaluation and experience with similar assets. The estimated useful life of each asset is reviewed periodically and updated if expectations differ from previous estimates due to physical wear and tear, technical or commercial obsolescence and legal or other limits on the use of the asset. It is possible, however, that future results of operations could be materially affected by changes in the amounts and timing of recorded expenses brought about by changes in the factors mentioned above. A reduction in the estimated useful life of any item of investment properties and property and equipment would increase the recorded depreciation and decrease the carrying values of these assets. There is no change in the estimated useful lives of investment properties and property and equipment during the period.
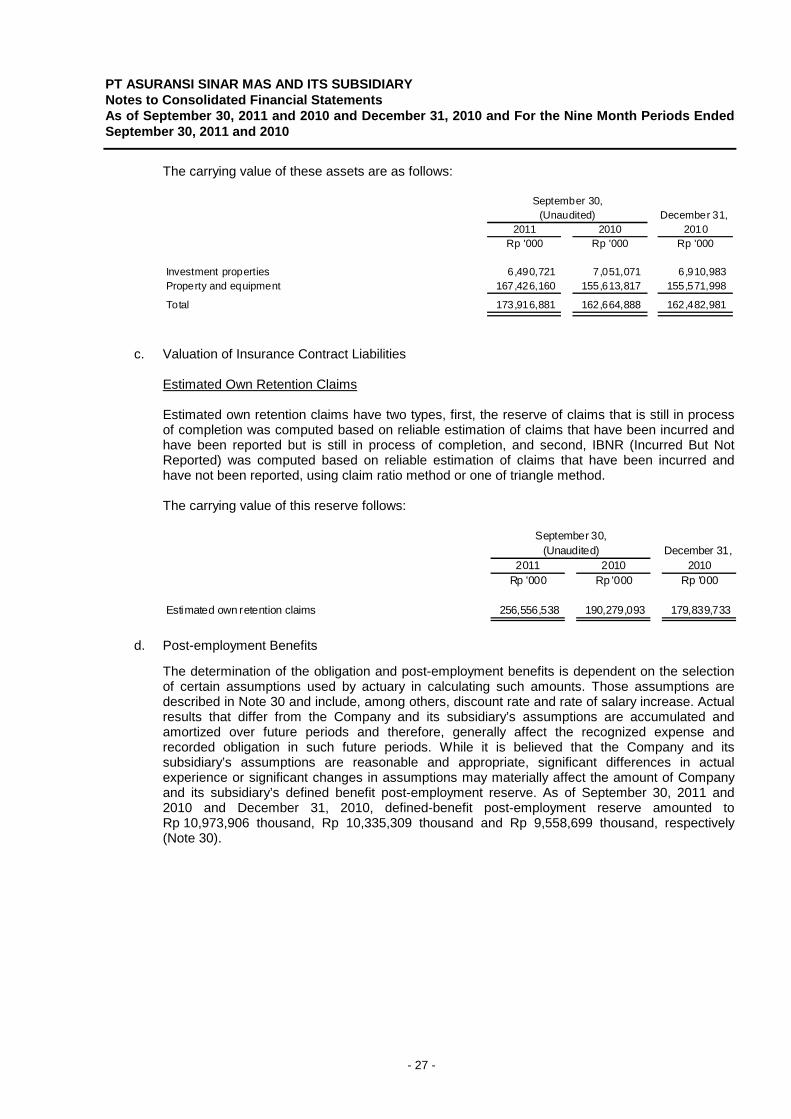
PT ASURANSI SINAR MAS AND ITS SUBSIDIARY Notes to Consolidated Financial Statements As of September 30, 2011 and 2010 and December 31, 2010 and For the Nine Month Periods Ended September 30, 2011 and 2010
- 27 -
The carrying value of these assets are as follows:
December 31,2011 2010 2010
Rp '000 Rp '000 Rp '000
Investment properties 6,490,721 7,051,071 6,910,983 Property and equipment 167,426,160 155,613,817 155,571,998
Total 173,916,881 162,664,888 162,482,981
(Unaudited)September 30,
c. Valuation of Insurance Contract Liabilities
Estimated Own Retention Claims Estimated own retention claims have two types, first, the reserve of claims that is still in process of completion was computed based on reliable estimation of claims that have been incurred and have been reported but is still in process of completion, and second, IBNR (Incurred But Not Reported) was computed based on reliable estimation of claims that have been incurred and have not been reported, using claim ratio method or one of triangle method. The carrying value of this reserve follows:
(Unaudited) December 31,2011 2010 2010
Rp '000 Rp '000 Rp '000
Estimated own retention claims 256,556,538 190,279,093 179,839,733
September 30,
d. Post-employment Benefits The determination of the obligation and post-employment benefits is dependent on the selection of certain assumptions used by actuary in calculating such amounts. Those assumptions are described in Note 30 and include, among others, discount rate and rate of salary increase. Actual results that differ from the Company and its subsidiary’s assumptions are accumulated and amortized over future periods and therefore, generally affect the recognized expense and recorded obligation in such future periods. While it is believed that the Company and its subsidiary’s assumptions are reasonable and appropriate, significant differences in actual experience or significant changes in assumptions may materially affect the amount of Company and its subsidiary’s defined benefit post-employment reserve. As of September 30, 2011 and 2010 and December 31, 2010, defined-benefit post-employment reserve amounted to Rp 10,973,906 thousand, Rp 10,335,309 thousand and Rp 9,558,699 thousand, respectively (Note 30).
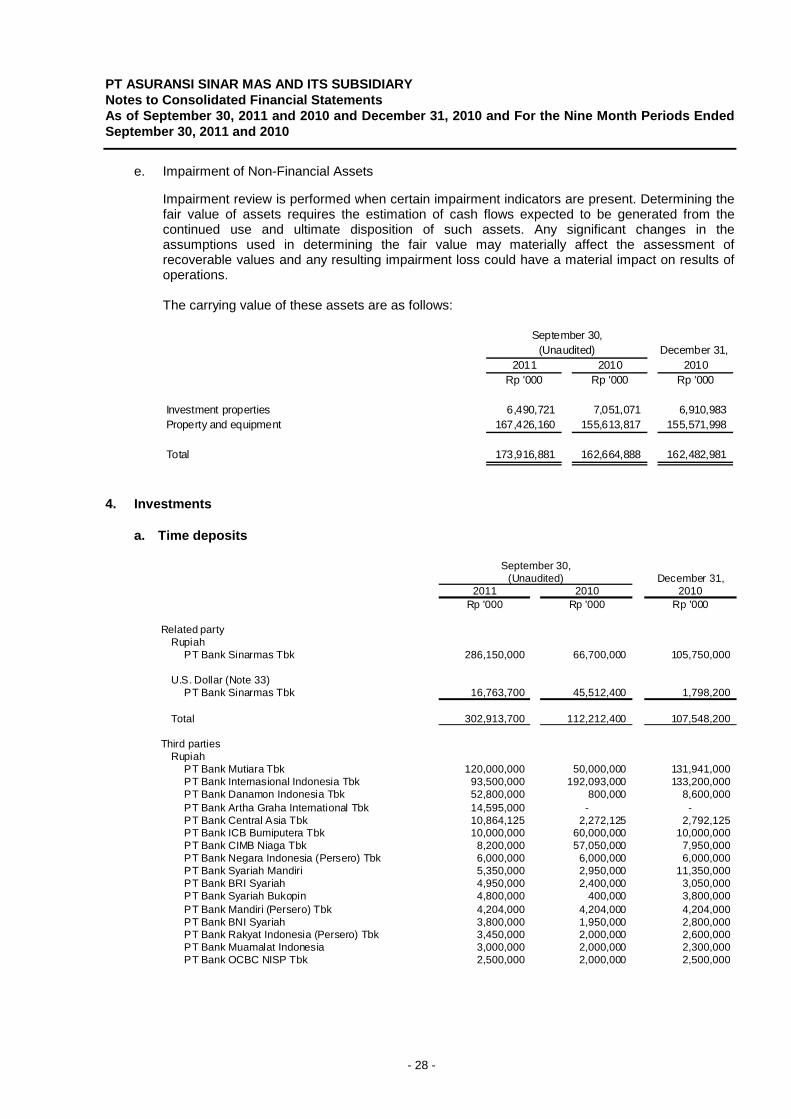
PT ASURANSI SINAR MAS AND ITS SUBSIDIARY Notes to Consolidated Financial Statements As of September 30, 2011 and 2010 and December 31, 2010 and For the Nine Month Periods Ended September 30, 2011 and 2010
- 28 -
e. Impairment of Non-Financial Assets
Impairment review is performed when certain impairment indicators are present. Determining the fair value of assets requires the estimation of cash flows expected to be generated from the continued use and ultimate disposition of such assets. Any significant changes in the assumptions used in determining the fair value may materially affect the assessment of recoverable values and any resulting impairment loss could have a material impact on results of operations. The carrying value of these assets are as follows:
(Unaudited) December 31,2011 2010 2010
Rp '000 Rp '000 Rp '000
Investment properties 6,490,721 7,051,071 6,910,983 Property and equipment 167,426,160 155,613,817 155,571,998
Total 173,916,881 162,664,888 162,482,981
September 30,
4. Investments
a. Time deposits
September 30,(Unaudited) December 31,
2011 2010 2010Rp '000 Rp '000 Rp '000
Related partyRupiah
PT Bank Sinarmas Tbk 286,150,000 66,700,000 105,750,000
U.S. Dollar (Note 33)PT Bank Sinarmas Tbk 16,763,700 45,512,400 1,798,200
Total 302,913,700 112,212,400 107,548,200
Third partiesRupiah
PT Bank Mutiara Tbk 120,000,000 50,000,000 131,941,000 PT Bank Internasional Indonesia Tbk 93,500,000 192,093,000 133,200,000 PT Bank Danamon Indonesia Tbk 52,800,000 800,000 8,600,000 PT Bank Artha Graha International Tbk 14,595,000 - -PT Bank Central Asia Tbk 10,864,125 2,272,125 2,792,125 PT Bank ICB Bumiputera Tbk 10,000,000 60,000,000 10,000,000 PT Bank CIMB Niaga Tbk 8,200,000 57,050,000 7,950,000 PT Bank Negara Indonesia (Persero) Tbk 6,000,000 6,000,000 6,000,000 PT Bank Syariah Mandiri 5,350,000 2,950,000 11,350,000 PT Bank BRI Syariah 4,950,000 2,400,000 3,050,000 PT Bank Syariah Bukopin 4,800,000 400,000 3,800,000 PT Bank Mandiri (Persero) Tbk 4,204,000 4,204,000 4,204,000 PT Bank BNI Syariah 3,800,000 1,950,000 2,800,000 PT Bank Rakyat Indonesia (Persero) Tbk 3,450,000 2,000,000 2,600,000 PT Bank Muamalat Indonesia 3,000,000 2,000,000 2,300,000 PT Bank OCBC NISP Tbk 2,500,000 2,000,000 2,500,000

PT ASURANSI SINAR MAS AND ITS SUBSIDIARY Notes to Consolidated Financial Statements As of September 30, 2011 and 2010 and December 31, 2010 and For the Nine Month Periods Ended September 30, 2011 and 2010
- 29 -
September 30,(Unaudited) December 31,
2011 2010 2010Rp '000 Rp '000 Rp '000
Third partiesRupiah
PT Bank Tabungan Negara (Persero) Tbk 2,250,000 1,350,000 1,650,000 PT Bank DKI 1,550,000 550,000 800,000 PT Bank BCA Syariah 1,500,000 1,000,000 2,000,000 PT Bank Windu Kentjana International Tbk 1,300,000 - -PT Bank Nusantara Parahyangan Tbk 1,000,000 1,000,000 1,000,000 PT Bank Permata Tbk 1,000,000 1,000,000 1,000,000 PT Bank Pembangunan Daerah Jawa Barat
Dan Banten Tbk 1,000,000 - 1,000,000 PT Bank Syariah Mega Indonesia 1,000,000 100,000 250,000 PT Bank Mayora 1,000,000 - -PT Bank Victoria Syariah 500,000 - -PT Bank Bukopin Tbk 200,000 200,000 200,000 PT Bank Mestika Dharma 200,000 200,000 200,000 PT Bank Victoria Internasional Tbk 100,000 - 20,100,000 PT Bank Jabar Banten Syariah 100,000 - 100,000 PT BPRS Dana Moneter 100,000 100,000 100,000 PT Bank Tabungan Pensiunan Nasional - 50,000,000 -Other (below Rp 100,000,000 each) 175,000 175,000 175,000
Subtotal 360,988,125 441,794,125 361,662,125
U.S. Dollar (Note 33)PT Bank Internasional Indonesia Tbk 132,345 26,102,700 2,697,300PT Bank Mandiri (Persero) Tbk 5,868,575 1,652,234 1,664,639PT Bank Syariah Mandiri 457,654 456,400 461,548PT Bank Central Asia Tbk 229,398 107,088 107,892
Subtotal 6,687,972 28,318,422 4,931,379
Singapore Dollar (Note 33)PT Bank Internasional Indonesia Tbk 339,817 2,540,430 2,513,020
Total 368,015,914 472,652,977 369,106,524
Total 670,929,614 584,865,377 476,654,724
Average interest rates per annum on time deposits are as follows:
September 30,(Unaudited) December 31,
2011 2010 2010
Rupiah 6.38% 6.54% 7.08%U.S. Dollar 0.78% 1.23% 1.40%Singapore Dollar 0.23% 0.23% 0.23%
b. Statutory Time deposits
Pursuant to the Decision of the Minister of Finance of the Republic of Indonesia No. 424/KMK.06/2003 as amended, the latest by Government Regulation of the Republic of Indonesia No. 39 Year 2008 Article 7 and the Regulation of the Minister of Finance of the Republic of Indonesia No 158/PMK.010/2008, each insurance company has to maintain a Guarantee Fund which is higher between 20% of the required paid-up capital plus 1% of net premium and 0.25% of reinsurance premium. Those guarantee funds can be in the form of deposits and/or government bonds or other commercial papers issued by the Government. As of December 31, 2010, PT Asuransi Sumit Oto, a subsidiary, has guarantee funds in the form of a statutory deposits that were placed in PT Bank Internasional Indonesia Tbk amounting to Rp 20,000,000 thousand.

PT ASURANSI SINAR MAS AND ITS SUBSIDIARY Notes to Consolidated Financial Statements As of September 30, 2011 and 2010 and December 31, 2010 and For the Nine Month Periods Ended September 30, 2011 and 2010
- 30 -
c. Marketable Securities
September 30,(Unaudited) December 31,
2011 2010 2010Rp '000 Rp '000 Rp '000
At fair value through profit and lossBonds
Third partiesU.S. Dollar (Note 33) Istana High Grade 2 18,463,778 18,675,143 18,815,350Rupiah Sukuk ljarah I Summarecon Agung, Year 2008 3,201,594 3,300,000 3,139,494 Government Bond FR 0001 1,146,100 1,184,070 1,165,600 Sukuk Ijarah PLN III Year 2009 Series A 544,375 - - Sukuk Ijarah Mitra Adiperkasa I Year 2009 Series B 5,248,330 - -
Total 28,604,177 23,159,213 23,120,444
Available for saleShares
PT Bank Mandiri (Persero) Tbk 134,391,600 6,271,200 5,011,500PT Bumi Resources Tbk 129,343,500 200,749,813 232,382,012PT Bank Negara Indonesia (Persero) Tbk 77,751,925 - 199,448,188PT Perusahaan Gas Negara (Persero) Tbk 77,498,763 20,568,625 -PT Salim Ivomas Pratama Tbk 58,337,790 - -PT Bank Danamon Indonesia Tbk 54,464,000 - -PT Indocement Tunggal Prakarsa Tbk 50,225,000 - 10,846,000PT Intraco Penta Tbk 48,581,700 - -PT Bank Rakyat Indonesia (Persero) Tbk 45,925,425 14,750,000 8,662,500PT Tambang Batubara Bukit Asam (Persero) Tbk 23,822,400 - -PT Semen Gresik (Persero) Tbk 22,663,150 16,052,850 12,157,425PT Adro Energy Tbk 18,514,080 10,226,250 -PT Holcim Indonesia Tbk 18,467,500 4,365,000 4,204,125PT Indo Tambangraya Megah Tbk 18,192,375 - -PT Borneo Lumbung Energi & Metal Tbk 17,828,035 - 2,110,500PT Bakrie Sumatra Plantation Tbk 12,705,300 23,611,130 -PT Bakrieland Development Tbk 10,370,416 68,750,066 -PT United Tractors Tbk 9,493,000 3,072,612 5,950PT Indofood CBP Sukses Makmur Tbk 9,337,800 - 7,596,875PT Krakatau Steel (Persero) Tbk 8,151,615 - -PT Jasa Marga (Persero) Tbk 7,751,250 - 7,125,713PT Indofood Sukses Makmur Tbk 7,393,200 - -PT PP London Sumatra Indonesia Tbk 3,083,200 - -PT Astra International Tbk - - 4,145,800PT Telekomunikasi Indonesia (Persero) Tbk - - 3,478,125PT Agung Podomoro Land Tbk - - 1,799,490PT Bank Tabungan Negara (Persero) Tbk - 1,183,000 -
Total 864,293,024 369,600,546 498,974,203
Total 892,897,201 392,759,759 522,094,647
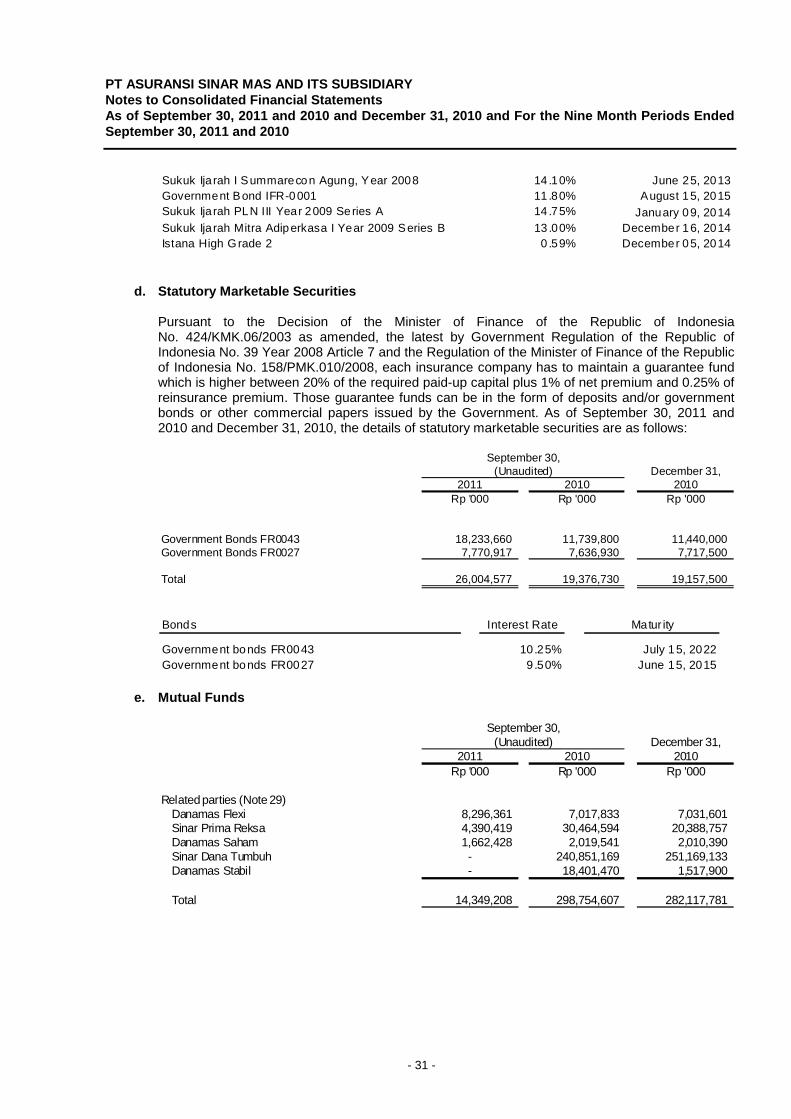
PT ASURANSI SINAR MAS AND ITS SUBSIDIARY Notes to Consolidated Financial Statements As of September 30, 2011 and 2010 and December 31, 2010 and For the Nine Month Periods Ended September 30, 2011 and 2010
- 31 -
Sukuk Ija rah I Summarecon Agung, Year 2008 14 .10% June 25, 2013Government Bond IFR-0001 11 .80% August 15, 2015Sukuk Ija rah PLN III Year 2009 Series A 14 .75% January 09, 2014Sukuk Ija rah Mitra Adiperkasa I Year 2009 Series B 13 .00% December 16, 2014Istana High Grade 2 0 .59% December 05, 2014
d. Statutory Marketable Securities
Pursuant to the Decision of the Minister of Finance of the Republic of Indonesia No. 424/KMK.06/2003 as amended, the latest by Government Regulation of the Republic of Indonesia No. 39 Year 2008 Article 7 and the Regulation of the Minister of Finance of the Republic of Indonesia No. 158/PMK.010/2008, each insurance company has to maintain a guarantee fund which is higher between 20% of the required paid-up capital plus 1% of net premium and 0.25% of reinsurance premium. Those guarantee funds can be in the form of deposits and/or government bonds or other commercial papers issued by the Government. As of September 30, 2011 and 2010 and December 31, 2010, the details of statutory marketable securities are as follows:
September 30,
(Unaudited) December 31,2011 2010 2010
Rp '000 Rp '000 Rp '000
Government Bonds FR0043 18,233,660 11,739,800 11,440,000Government Bonds FR0027 7,770,917 7,636,930 7,717,500
Total 26,004,577 19,376,730 19,157,500
Bonds Interest Rate Matur ity
Government bonds FR0043 10.25% July 15, 2022Government bonds FR0027 9.50% June 15, 2015
e. Mutual Funds
September 30,
(Unaudited) December 31,2011 2010 2010
Rp '000 Rp '000 Rp '000
Related parties (Note 29)Danamas Flexi 8,296,361 7,017,833 7,031,601Sinar Prima Reksa 4,390,419 30,464,594 20,388,757Danamas Saham 1,662,428 2,019,541 2,010,390Sinar Dana Tumbuh - 240,851,169 251,169,133Danamas Stabil - 18,401,470 1,517,900
Total 14,349,208 298,754,607 282,117,781
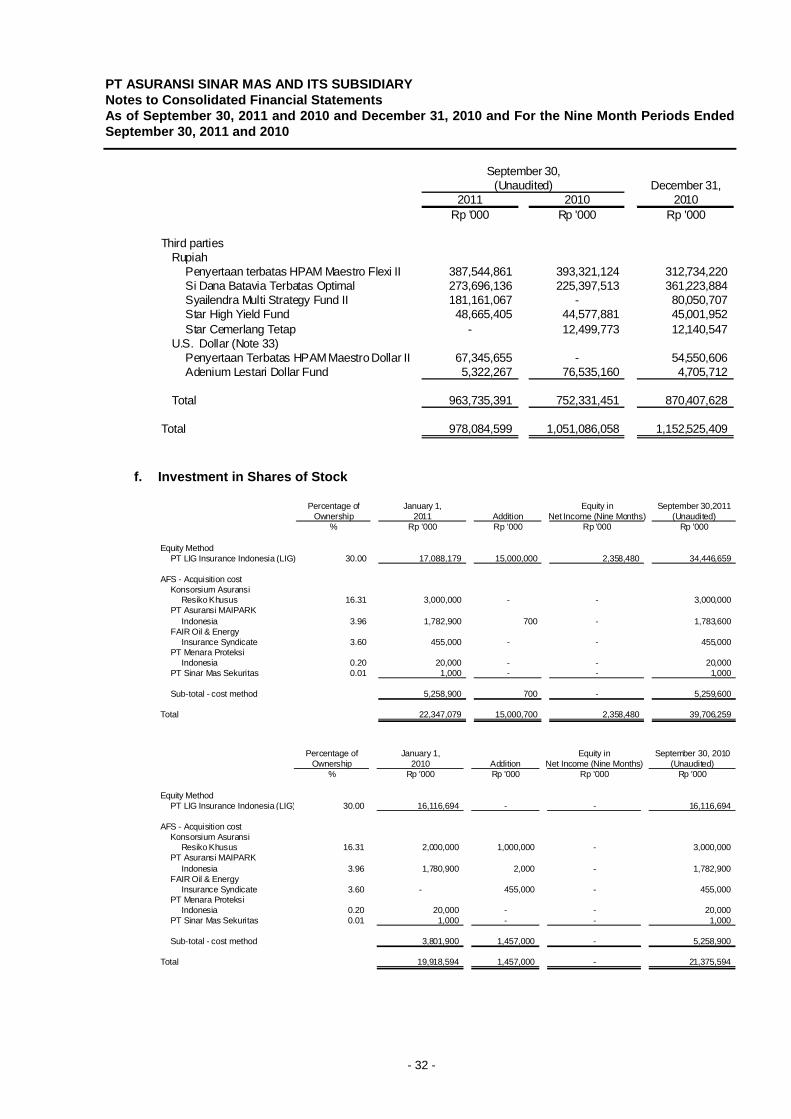
PT ASURANSI SINAR MAS AND ITS SUBSIDIARY Notes to Consolidated Financial Statements As of September 30, 2011 and 2010 and December 31, 2010 and For the Nine Month Periods Ended September 30, 2011 and 2010
- 32 -
September 30,(Unaudited) December 31,
2011 2010 2010Rp '000 Rp '000 Rp '000
Third partiesRupiah
Penyertaan terbatas HPAM Maestro Flexi II 387,544,861 393,321,124 312,734,220Si Dana Batavia Terbatas Optimal 273,696,136 225,397,513 361,223,884Syailendra Multi Strategy Fund II 181,161,067 - 80,050,707Star High Yield Fund 48,665,405 44,577,881 45,001,952Star Cemerlang Tetap - 12,499,773 12,140,547
U.S. Dollar (Note 33)Penyertaan Terbatas HPAM Maestro Dollar II 67,345,655 - 54,550,606Adenium Lestari Dollar Fund 5,322,267 76,535,160 4,705,712
Total 963,735,391 752,331,451 870,407,628
Total 978,084,599 1,051,086,058 1,152,525,409
f. Investment in Shares of Stock
Percentage of January 1, Equity in September 30,2011
Ownership 2011 Addition Net Income (Nine Months) (Unaudited) % Rp '000 Rp '000 Rp '000 Rp '000
Equity MethodPT LlG Insurance Indonesia (LIG) 30.00 17,088,179 15,000,000 2,358,480 34,446,659
AFS - Acquisition cost Konsorsium Asuransi
Resiko Khusus 16.31 3,000,000 - - 3,000,000 PT Asuransi MAIPARK
Indonesia 3.96 1,782,900 700 - 1,783,600 FAIR Oil & Energy
Insurance Syndicate 3.60 455,000 - - 455,000 PT Menara Proteksi
Indonesia 0.20 20,000 - - 20,000 PT Sinar Mas Sekuritas 0.01 1,000 - - 1,000
Sub-total - cost method 5,258,900 700 - 5,259,600
Total 22,347,079 15,000,700 2,358,480 39,706,259
Percentage of January 1, Equity in September 30, 2010
Ownership 2010 Addition Net Income (Nine Months) (Unaudited) % Rp '000 Rp '000 Rp '000 Rp '000
Equity MethodPT LlG Insurance Indonesia (LIG) 30.00 16,116,694 - - 16,116,694
AFS - Acquisition cost Konsorsium Asuransi
Resiko Khusus 16.31 2,000,000 1,000,000 - 3,000,000 PT Asuransi MAIPARK
Indonesia 3.96 1,780,900 2,000 - 1,782,900 FAIR Oil & Energy
Insurance Syndicate 3.60 - 455,000 - 455,000 PT Menara Proteksi
Indonesia 0.20 20,000 - - 20,000 PT Sinar Mas Sekuritas 0.01 1,000 - - 1,000
Sub-total - cost method 3,801,900 1,457,000 - 5,258,900
Total 19,918,594 1,457,000 - 21,375,594
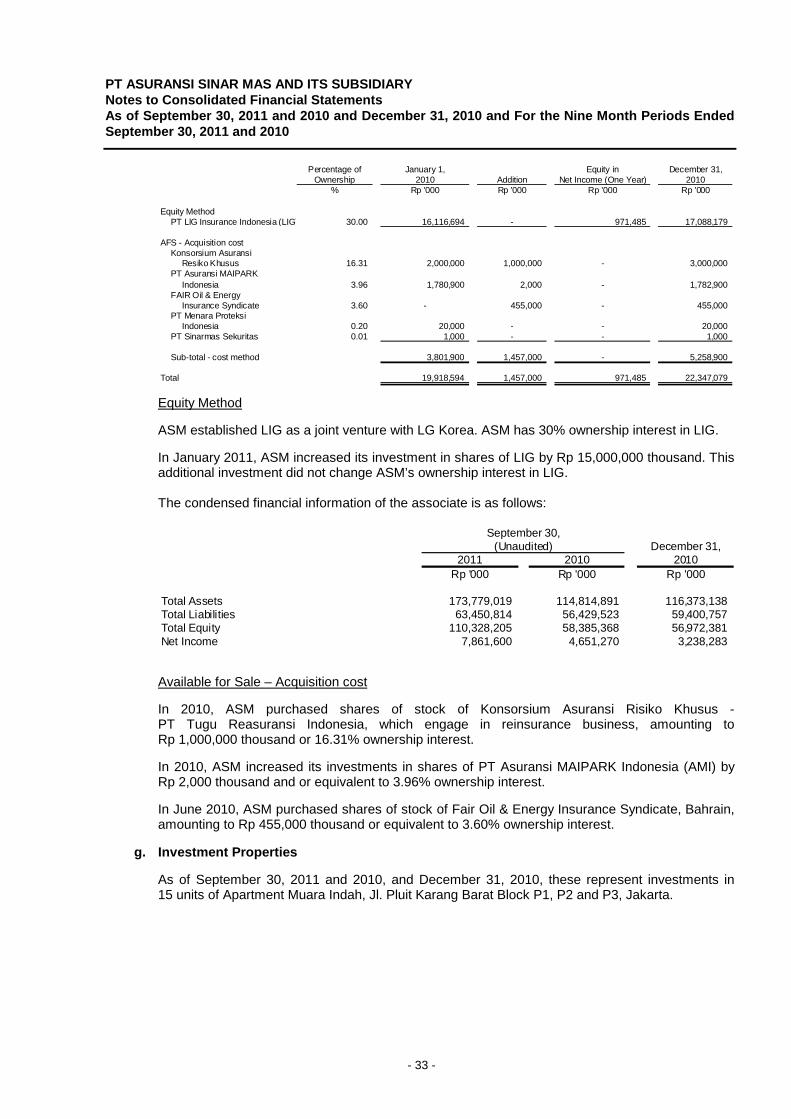
PT ASURANSI SINAR MAS AND ITS SUBSIDIARY Notes to Consolidated Financial Statements As of September 30, 2011 and 2010 and December 31, 2010 and For the Nine Month Periods Ended September 30, 2011 and 2010
- 33 -
Percentage of January 1, Equity in December 31,Ownership 2010 Addition Net Income (One Year) 2010
% Rp '000 Rp '000 Rp '000 Rp '000
Equity MethodPT LlG Insurance Indonesia (LIG) 30.00 16,116,694 - 971,485 17,088,179
AFS - Acquisition cost Konsorsium Asuransi
Resiko Khusus 16.31 2,000,000 1,000,000 - 3,000,000 PT Asuransi MAIPARK
Indonesia 3.96 1,780,900 2,000 - 1,782,900 FAIR Oil & Energy
Insurance Syndicate 3.60 - 455,000 - 455,000 PT Menara Proteksi
Indonesia 0.20 20,000 - - 20,000 PT Sinarmas Sekuritas 0.01 1,000 - - 1,000
Sub-total - cost method 3,801,900 1,457,000 - 5,258,900
Total 19,918,594 1,457,000 971,485 22,347,079
Equity Method ASM established LIG as a joint venture with LG Korea. ASM has 30% ownership interest in LIG. In January 2011, ASM increased its investment in shares of LIG by Rp 15,000,000 thousand. This additional investment did not change ASM’s ownership interest in LIG. The condensed financial information of the associate is as follows:
September 30,(Unaudited) December 31,
2011 2010 2010Rp '000 Rp '000 Rp '000
Total Assets 173,779,019 114,814,891 116,373,138 Total Liabilities 63,450,814 56,429,523 59,400,757 Total Equity 110,328,205 58,385,368 56,972,381 Net Income 7,861,600 4,651,270 3,238,283
Available for Sale – Acquisition cost In 2010, ASM purchased shares of stock of Konsorsium Asuransi Risiko Khusus - PT Tugu Reasuransi Indonesia, which engage in reinsurance business, amounting to Rp 1,000,000 thousand or 16.31% ownership interest. In 2010, ASM increased its investments in shares of PT Asuransi MAIPARK Indonesia (AMI) by Rp 2,000 thousand and or equivalent to 3.96% ownership interest. In June 2010, ASM purchased shares of stock of Fair Oil & Energy Insurance Syndicate, Bahrain, amounting to Rp 455,000 thousand or equivalent to 3.60% ownership interest.
g. Investment Properties As of September 30, 2011 and 2010, and December 31, 2010, these represent investments in 15 units of Apartment Muara Indah, Jl. Pluit Karang Barat Block P1, P2 and P3, Jakarta.

PT ASURANSI SINAR MAS AND ITS SUBSIDIARY Notes to Consolidated Financial Statements As of September 30, 2011 and 2010 and December 31, 2010 and For the Nine Month Periods Ended September 30, 2011 and 2010
- 34 -
Following are the balances of and changes in investment properties and the related accumulated depreciation:
September 30,January 1, 2011
2011 Additions Deductions (Unaudited)Rp '000 Rp '000 Rp '000 Rp '000
At CostBuildings 11,207,000 - - 11,207,000
Accumulated DepreciationBuildings 4,296,017 420,262 - 4,716,279
Net Book Value 6,910,983 6,490,721
Changes during the period (Nine Months)
September 30,January 1, 2010
2010 Additions Deductions (Unaudited)Rp '000 Rp '000 Rp '000 Rp '000
At CostBuildings 11,207,000 - - 11,207,000
Accumulated DepreciationBuildings 3,735,667 420,262 - 4,155,929
Net Book Value 7,471,333 7,051,071
Changes during the period (Nine Months)
January 1, December 31,2010 Additions Deductions 2010
Rp '000 Rp '000 Rp '000 Rp '000
At CostBuildings 11,207,000 - - 11,207,000
Accumulated DepreciationBuildings 3,735,667 560,350 - 4,296,017
Net Book Value 7,471,333 6,910,983
Changes during the year (One Year)
Depreciation expense for the nine month periods September 30, 2011 and 2010 amounted to Rp 420,262 thousand and Rp 420,262 thousand, respectively.
As of September 30, 2011 and 2010 and December 31, 2010, investment properties are insured with PT Axa Indonesia for US$ 1,237 thousand. Management believes that the insurance coverages are adequate to cover any possible losses that might arise from the assets insured.
Based on Report No. 016/IDR-AR/II/2011 dated February 11, 2011, from Ihot, Dolar & Rekan, a property appraisal, the market value of the Company and its subsidiary's investment properties, as of February 4, 2011 amounted to Rp 20,409,000 thousand.
h. Mortgage Loans
This account represents loans granted to employees which are collateralized with respective land and buildings.
The maximum amount of loans granted is equivalent to 75% of the value of the pledged house and bear interest at 6% per annum.

PT ASURANSI SINAR MAS AND ITS SUBSIDIARY Notes to Consolidated Financial Statements As of September 30, 2011 and 2010 and December 31, 2010 and For the Nine Month Periods Ended September 30, 2011 and 2010
- 35 -
5. Cash
September 30,(Unaudited) December 31,
2011 2010 2010Rp '000 Rp '000 Rp '000
Cash on handRupiah 393,000 364,000 369,483U.S. Dollar (Note 33) 6,562 31,895 3,642
399,562 395,895 373,125
Cash in banksRupiah
Related partyPT Bank Sinarmas Tbk 1,944,490 1,503,864 200,573
Third partiesPT Bank Internasional Indonesia Tbk 4,549,711 2,067,368 348,936PT Bank Central Asia Tbk 5,565,941 11,918,204 38,352PT Bank Syariah Mandiri 2,090,440 444,884 383,348PT Bank CIMB Niaga Tbk 1,707,883 593,992 595,101PT Bank Rakyat Indonesia (Persero) Tbk 1,327,226 939,520 398,639PT Bank Danamon Indonesia Tbk 746,192 2,201,214 10,249,486PT Bank Mandiri (Persero) Tbk 426,401 399,372 378,336PT Bank Negara Indonesia (Persero) Tbk 534,698 316,295 171,938PT Bank Windu Kentjana International Tbk 431,399 - -PT Bank OCBC NISP Tbk 293,866 108,752 85,856PT Bank BRI Syariah 392,694 1,011,873 65,878PT Bank BNI Syariah 369,172 925,105 355,035PT Bank DKI 173,775 24,957 53,197PT Bank Syariah Bukopin 155,065 158,821 98,028PT Bank BCA Syariah 151,943 120,599 124,688PT Bank Muamalat Indonesia 119,580 329,511 28,373PT Bank Tabungan Pensiunan Nasional Tbk 111,216 63,098 143,331PT Bank ICB Bumiputera Tbk 56,431 150,400 43,683PT Bank Mutiara Tbk - - 253,522Others (below Rp 100,000 thousand each) 505,374 190,962 188,717
Total - third parties 19,709,007 21,964,927 14,004,444Total 21,653,497 23,468,791 14,205,017
Foreign currencies (Note 33)Related party
PT Bank Sinarmas Tbk 2,171,302 1,904,197 1,018,840
Third partiesPT Bank International Indonesia Tbk 5,555,157 860,511 2,649,495PT Bank OCBC NISP Tbk 126,958 28,365 6,835PT Bank Mandiri (Persero) Tbk 115,841 - -PT Bank Central Asia Tbk 536,652 379,316 102,677Others (below Rp 100,000 thousand each) 49,193 47,344 12,296
Total - third parties 6,383,801 1,315,536 2,771,303Total 8,555,103 3,219,733 3,790,143
Total cash in banks 30,208,600 26,688,524 17,995,160
Total 30,608,162 27,084,419 18,368,285

PT ASURANSI SINAR MAS AND ITS SUBSIDIARY Notes to Consolidated Financial Statements As of September 30, 2011 and 2010 and December 31, 2010 and For the Nine Month Periods Ended September 30, 2011 and 2010
- 36 -
6. Premiums Receivable
The details of premiums receivable are as follows:
September 30,(Unaudited) December 31,
2011 2010 2010Rp '000 Rp '000 Rp '000
Related parties (Note 29) 112,727,426 59,335,778 48,921,914Third parties 266,006,975 217,993,239 286,396,044
Total 378,734,401 277,329,017 335,317,958
Allowance for impairment losses (2,436,544) - (3,248,725)
Total - Net 376,297,857 277,329,017 332,069,233
The details of consolidated premiums receivable based on its remaining period until maturity are as follows:
September 30,(Unaudited) December 31,
2011 2010 2010Rp '000 Rp '000 Rp '000
Due within 1 - 60 days 356,595,069 239,476,993 310,654,089Due within more than 60 days 22,139,332 37,852,024 24,663,869
Total 378,734,401 277,329,017 335,317,958
Allowance for impairment losses (2,436,544) - (3,248,725)
Total - net 376,297,857 277,329,017 332,069,233
Premiums receivable that are due (or more than 60 days) classified as assets which are not allowed for computation of solvency ratios. As of September 30, 2011 and 2010 and December 31, 2010, the consolidated balance of premiums receivable denominated in foreign currency amounted to US$ 14,145,839 (equivalent to Rp 124,808,742 thousand), US$ 4,413,650 (equivalent to Rp 39,387,410 thousand) and US$ 3,630,144 (equivalent to 32,638,628 thousand), respectively, (Note 33). Transaction with related parties were done under similar term and conditions as those done with third parties. Management believes that the allowance for impairment losses as of September 30, 2011 and December 31, 2010 is adequate to cover the losses which might arise from uncollectible premiums receivable, while as of September 30, 2010, management did not provide allowance for impairment losses on premiums receivable because they believe that all such receivables are collectible.

PT ASURANSI SINAR MAS AND ITS SUBSIDIARY Notes to Consolidated Financial Statements As of September 30, 2011 and 2010 and December 31, 2010 and For the Nine Month Periods Ended September 30, 2011 and 2010
- 37 -
7. Reinsurance Receivables
This account represents due from insurers and reinsurers in relation with reinsurance transactions, with details as follows:
September 30,(Unaudited) December 31,
2011 2010 2010Rp '000 Rp '000 Rp '000
Related parties (Note 29)Domestic reinsurers 764,561 4,066,540 905,747
Third partiesInternational reinsurers 1,041,539 5,427,332 1,981,878Domestic reinsurers 13,978,093 10,483,024 4,169,098
Total - third parties 15,019,632 15,910,356 6,150,976
Total 15,784,193 19,976,896 7,056,723Allowance for impairment losses (1,258,122) - (1,677,497)
Total 14,526,071 19,976,896 5,379,226
The details of consolidated reinsurance receivable based on its remaining period until maturity are as follows:
September 30,(Unaudited) December 31,
2011 2010 2010Rp '000 Rp '000 Rp '000
Due within 1 - 60 days 11,538,909 14,549,564 5,475,839Due within more than 60 days 4,245,284 5,427,332 1,580,884
Total 15,784,193 19,976,896 7,056,723Allowance for impairment losses (1,258,122) - (1,677,497)
Total - net 14,526,071 19,976,896 5,379,226
As of September 30, 2011 and 2010 and December 31, 2010, the consolidated balance of reinsurance receivables denominated in foreign currency amounted to US$ 1,194,972 (equivalent to Rp 10,543,235 thousand), US$ 1,569,769 (equivalent to Rp 14,008,618 thousand) and US$ 387,683 (equivalent to Rp 3,485,654 thousand), respectively, (Note 33). Transactions with related parties were done under similar term and conditions as those done with third parties. Management believes that the allowance for impairment losses as of September 30, 2011 and December 31, 2010 is adequate to cover the losses which might arise from uncollectible reinsurance receivables, while as of September 30, 2010, management did not provide allowance for impairment losses on reinsurance receivables because they believe that all such receivables are collectible.

PT ASURANSI SINAR MAS AND ITS SUBSIDIARY Notes to Consolidated Financial Statements As of September 30, 2011 and 2010 and December 31, 2010 and For the Nine Month Periods Ended September 30, 2011 and 2010
- 38 -
8. Other Receivables
September 30,(Unaudited) December 31,
2011 2010 2010Rp '000 Rp '000 Rp '000
Claims receivable 3,083,882 5,208,502 6,999,235Investment income receivables 1,967,872 1,468,054 1,290,404Employee receivables 1,237,782 781,637 1,091,295Advances 605,347 927,738 618,068Others 5,282,165 9,981,203 4,188,433
Total 12,177,048 18,367,134 14,187,435
Claims receivable represent the amount due from the insured since the claim paid by the Company and its subsidiary exceeded the coverage amount allowed for health insurance policy. Employee receivables bear interest at 6% per annum. As of September 30, 2011 and 2010 and December 31, 2010, the consolidated balance of other receivables from related parties amounted to Rp 1,222,451 thousand, Rp 5,149,247 thousand and Rp 326,953 thousand, respectively, (Note 29). Transac tions with related parties were done under similar term and conditions as those done with third parties. As of September 30, 2011 and 2010 and December 31, 2010, the consolidated balance of other receivables denominated in foreign currency amounted to US$ 106,129 (equivalent to Rp 936,380 thousand), US$ 93,914 (equivalent to Rp 838,089 thousand) and US$ 79,596 (equivalent to Rp 715,648 thousand), respectively, (Note 33).
9. Property and Equipment
September 30, 2011January 1, 2011 Additions Deductions Reclass ifications (Unaudited)
Rp '000 Rp '000 Rp '000 Rp '000 Rp '000
At cos tLand 57,455,288 11,508,020 - - 68,963,308 Buildings 85,919,575 225,400 - 1,770,928 87,915,903 Motor vehicles 36,500,508 5,151,022 - - 41,651,530 Computer equipm ent 30,489,452 3,751,256 (21,877) (122,988) 34,095,843 Furniture and fixtures 13,939,023 493,469 - - 14,432,492 Partitions 7,713,556 1,575,084 - (183,309) 9,105,331 Cons truction in progress 1,770,928 - - (1,770,928) -
Total 233,788,330 22,704,251 (21,877) (306,297) 256,164,407
Accumulated depreciationBuildings 19,233,296 3,226,680 - - 22,459,976 Motor vehicles 19,879,393 3,841,812 - - 23,721,205 Computer equipm ent 25,302,687 2,323,595 (7,306) (8,509) 27,610,467 Furniture and fixtures 10,548,105 849,164 - - 11,397,269 Partitions 3,252,851 304,801 - (8,322) 3,549,330
Total 78,216,332 10,546,052 (7,306) (16,831) 88,738,247
Net Book Value 155,571,998 167,426,160
Changes during 2011 (Nine Months)
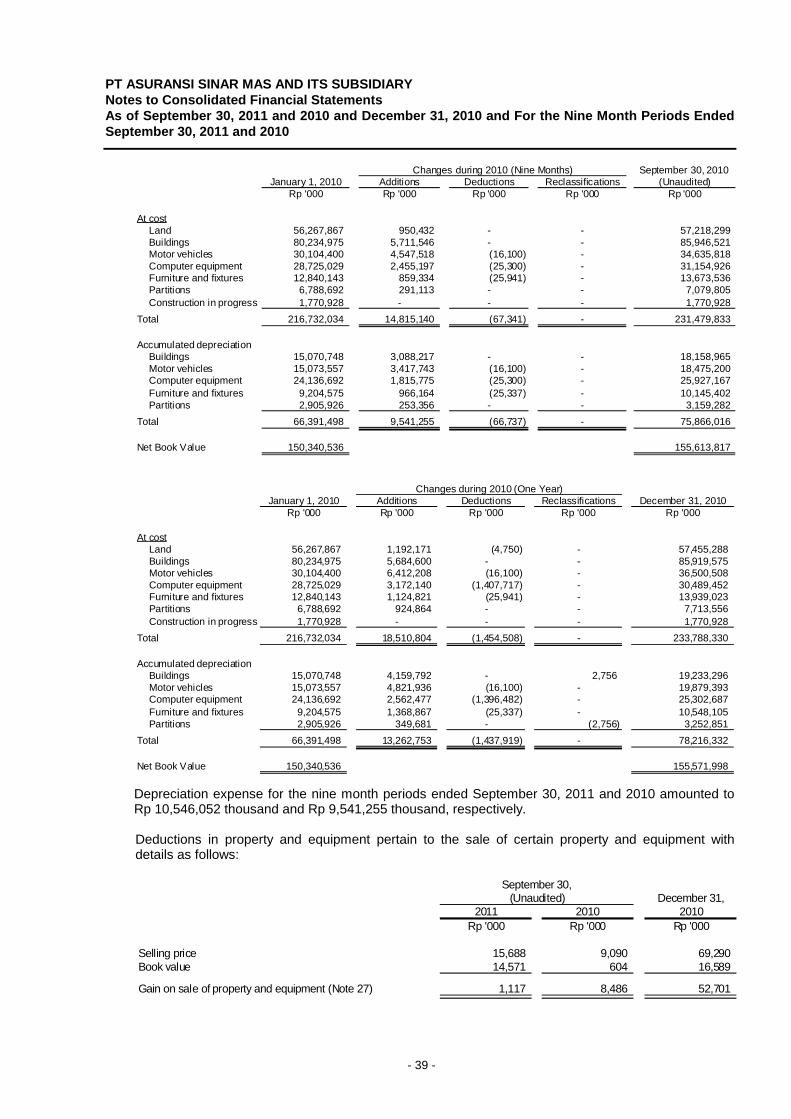
PT ASURANSI SINAR MAS AND ITS SUBSIDIARY Notes to Consolidated Financial Statements As of September 30, 2011 and 2010 and December 31, 2010 and For the Nine Month Periods Ended September 30, 2011 and 2010
- 39 -
September 30, 2010January 1, 2010 Additions Deductions Reclassifications (Unaudited)
Rp '000 Rp '000 Rp '000 Rp '000 Rp '000
At costLand 56,267,867 950,432 - - 57,218,299 Buildings 80,234,975 5,711,546 - - 85,946,521 Motor vehicles 30,104,400 4,547,518 (16,100) - 34,635,818 Computer equipment 28,725,029 2,455,197 (25,300) - 31,154,926 Furniture and fixtures 12,840,143 859,334 (25,941) - 13,673,536 Partitions 6,788,692 291,113 - - 7,079,805 Construction in progress 1,770,928 - - - 1,770,928
Total 216,732,034 14,815,140 (67,341) - 231,479,833
Accumulated depreciationBuildings 15,070,748 3,088,217 - - 18,158,965 Motor vehicles 15,073,557 3,417,743 (16,100) - 18,475,200 Computer equipment 24,136,692 1,815,775 (25,300) - 25,927,167 Furniture and fixtures 9,204,575 966,164 (25,337) - 10,145,402 Partitions 2,905,926 253,356 - - 3,159,282
Total 66,391,498 9,541,255 (66,737) - 75,866,016
Net Book Value 150,340,536 155,613,817
Changes during 2010 (Nine Months)
January 1, 2010 Additions Deductions Reclassifications December 31, 2010 Rp '000 Rp '000 Rp '000 Rp '000 Rp '000
At costLand 56,267,867 1,192,171 (4,750) - 57,455,288 Buildings 80,234,975 5,684,600 - - 85,919,575 Motor vehicles 30,104,400 6,412,208 (16,100) - 36,500,508 Computer equipment 28,725,029 3,172,140 (1,407,717) - 30,489,452 Furniture and fixtures 12,840,143 1,124,821 (25,941) - 13,939,023 Partitions 6,788,692 924,864 - - 7,713,556 Construction in progress 1,770,928 - - - 1,770,928
Total 216,732,034 18,510,804 (1,454,508) - 233,788,330
Accumulated depreciationBuildings 15,070,748 4,159,792 - 2,756 19,233,296 Motor vehicles 15,073,557 4,821,936 (16,100) - 19,879,393 Computer equipment 24,136,692 2,562,477 (1,396,482) - 25,302,687 Furniture and fixtures 9,204,575 1,368,867 (25,337) - 10,548,105 Partitions 2,905,926 349,681 - (2,756) 3,252,851
Total 66,391,498 13,262,753 (1,437,919) - 78,216,332
Net Book Value 150,340,536 155,571,998
Changes during 2010 (One Year)
Depreciation expense for the nine month periods ended September 30, 2011 and 2010 amounted to Rp 10,546,052 thousand and Rp 9,541,255 thousand, respectively. Deductions in property and equipment pertain to the sale of certain property and equipment with details as follows:
September 30,(Unaudited) December 31,
2011 2010 2010Rp '000 Rp '000 Rp '000
Selling price 15,688 9,090 69,290Book value 14,571 604 16,589
Gain on sale of property and equipment (Note 27) 1,117 8,486 52,701
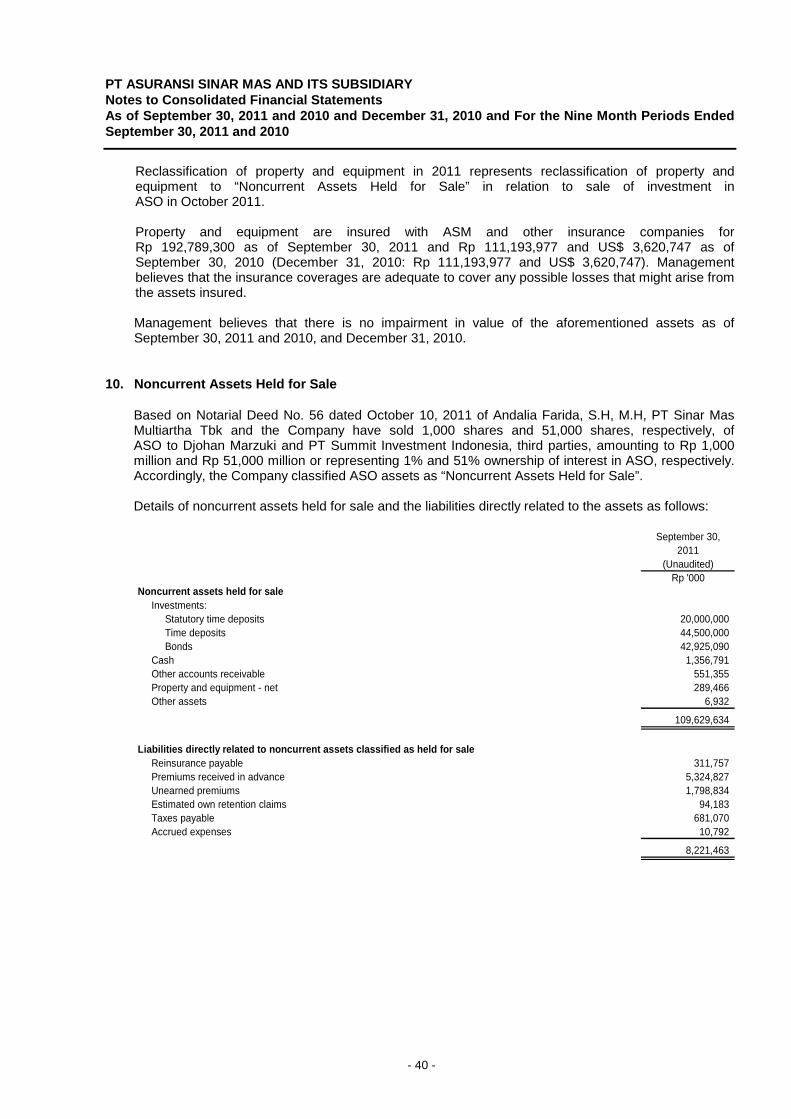
PT ASURANSI SINAR MAS AND ITS SUBSIDIARY Notes to Consolidated Financial Statements As of September 30, 2011 and 2010 and December 31, 2010 and For the Nine Month Periods Ended September 30, 2011 and 2010
- 40 -
Reclassification of property and equipment in 2011 represents reclassification of property and equipment to “Noncurrent Assets Held for Sale” in relation to sale of investment in ASO in October 2011. Property and equipment are insured with ASM and other insurance companies for Rp 192,789,300 as of September 30, 2011 and Rp 111,193,977 and US$ 3,620,747 as of September 30, 2010 (December 31, 2010: Rp 111,193,977 and US$ 3,620,747). Management believes that the insurance coverages are adequate to cover any possible losses that might arise from the assets insured.
Management believes that there is no impairment in value of the aforementioned assets as of September 30, 2011 and 2010, and December 31, 2010.
10. Noncurrent Assets Held for Sale
Based on Notarial Deed No. 56 dated October 10, 2011 of Andalia Farida, S.H, M.H, PT Sinar Mas Multiartha Tbk and the Company have sold 1,000 shares and 51,000 shares, respectively, of ASO to Djohan Marzuki and PT Summit Investment Indonesia, third parties, amounting to Rp 1,000 million and Rp 51,000 million or representing 1% and 51% ownership of interest in ASO, respectively. Accordingly, the Company classified ASO assets as “Noncurrent Assets Held for Sale”. Details of noncurrent assets held for sale and the liabilities directly related to the assets as follows:
September 30,
2011(Unaudited)
Rp '000Noncurrent assets held for sale
Investments:Statutory time deposits 20,000,000 Time deposits 44,500,000 Bonds 42,925,090
Cash 1,356,791 Other accounts receivable 551,355 Property and equipment - net 289,466 Other assets 6,932
109,629,634
Liabilities directly related to noncurrent assets classified as held for saleReinsurance payable 311,757 Premiums received in advance 5,324,827 Unearned premiums 1,798,834 Estimated own retention claims 94,183 Taxes payable 681,070 Accrued expenses 10,792
8,221,463

PT ASURANSI SINAR MAS AND ITS SUBSIDIARY Notes to Consolidated Financial Statements As of September 30, 2011 and 2010 and December 31, 2010 and For the Nine Month Periods Ended September 30, 2011 and 2010
- 41 -
11. Other Assets
September 30,(Unaudited) December 31,
2011 2010 2010Rp '000 Rp '000 Rp '000
Prepaid rental 14,117,508 15,611,496 15,046,271Membership 954,006 924,006 954,006Prepaid stamp duty 135,217 74,468 116,127Refundable deposits 40,556 40,556 40,556Prepaid tax 2,570,406 - -
Total 17,817,693 16,650,526 16,156,960
12. Claims Payable
September 30,
(Unaudited) December 31,2011 2010 2010
Rp '000 Rp '000 Rp '000
Related parties (Note 29) 446,248 1,459,312 2,151,222Third parties 4,975,290 15,188,037 14,711,056
Total 5,421,538 16,647,349 16,862,278
The details based on currency:
September 30,(Unaudited) December 31,
2011 2010 2010Rp '000 Rp '000 Rp '000
Rupiah 5,385,702 16,095,725 16,698,954U.S. Dollar (Note 33) 35,836 551,624 163,324
Total 5,421,538 16,647,349 16,862,278
13. Estimated Own Retention Claims
The details of estimated own retention claims by type of insurance are as follows:
September 30,(Unaudited) December 31,
2011 2010 2010Rp '000 Rp '000 Rp '000
Motor vehicles 119,752,192 93,566,532 67,607,978Fire 51,107,214 35,297,236 39,593,686Health 49,022,181 33,499,683 41,690,948Marine hull 10,051,874 4,182,896 5,624,164Marine cargo 5,478,067 5,182,175 6,580,857Engineering 3,919,591 3,220,901 3,596,867Miscellaneous 17,225,419 15,329,670 15,145,233
Total 256,556,538 190,279,093 179,839,733
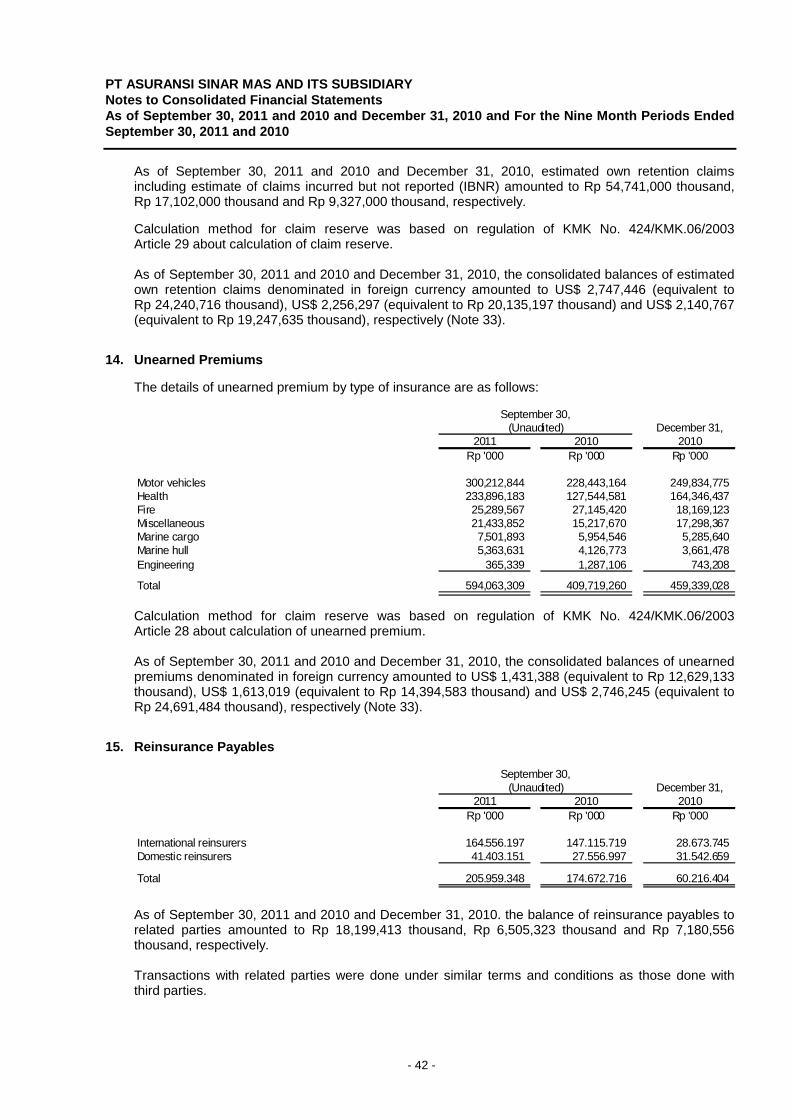
PT ASURANSI SINAR MAS AND ITS SUBSIDIARY Notes to Consolidated Financial Statements As of September 30, 2011 and 2010 and December 31, 2010 and For the Nine Month Periods Ended September 30, 2011 and 2010
- 42 -
As of September 30, 2011 and 2010 and December 31, 2010, estimated own retention claims including estimate of claims incurred but not reported (IBNR) amounted to Rp 54,741,000 thousand, Rp 17,102,000 thousand and Rp 9,327,000 thousand, respectively. Calculation method for claim reserve was based on regulation of KMK No. 424/KMK.06/2003 Article 29 about calculation of claim reserve. As of September 30, 2011 and 2010 and December 31, 2010, the consolidated balances of estimated own retention claims denominated in foreign currency amounted to US$ 2,747,446 (equivalent to Rp 24,240,716 thousand), US$ 2,256,297 (equivalent to Rp 20,135,197 thousand) and US$ 2,140,767 (equivalent to Rp 19,247,635 thousand), respectively (Note 33).
14. Unearned Premiums The details of unearned premium by type of insurance are as follows:
September 30,(Unaudited) December 31,
2011 2010 2010Rp '000 Rp '000 Rp '000
Motor vehicles 300,212,844 228,443,164 249,834,775Health 233,896,183 127,544,581 164,346,437Fire 25,289,567 27,145,420 18,169,123Miscellaneous 21,433,852 15,217,670 17,298,367Marine cargo 7,501,893 5,954,546 5,285,640Marine hull 5,363,631 4,126,773 3,661,478Engineering 365,339 1,287,106 743,208
Total 594,063,309 409,719,260 459,339,028
Calculation method for claim reserve was based on regulation of KMK No. 424/KMK.06/2003 Article 28 about calculation of unearned premium. As of September 30, 2011 and 2010 and December 31, 2010, the consolidated balances of unearned premiums denominated in foreign currency amounted to US$ 1,431,388 (equivalent to Rp 12,629,133 thousand), US$ 1,613,019 (equivalent to Rp 14,394,583 thousand) and US$ 2,746,245 (equivalent to Rp 24,691,484 thousand), respectively (Note 33).
15. Reinsurance Payables
September 30,(Unaudited) December 31,
2011 2010 2010Rp '000 Rp '000 Rp '000
International reinsurers 164.556.197 147.115.719 28.673.745Domestic reinsurers 41.403.151 27.556.997 31.542.659
Total 205.959.348 174.672.716 60.216.404
As of September 30, 2011 and 2010 and December 31, 2010. the balance of reinsurance payables to related parties amounted to Rp 18,199,413 thousand, Rp 6,505,323 thousand and Rp 7,180,556 thousand, respectively. Transactions with related parties were done under similar terms and conditions as those done with third parties.

PT ASURANSI SINAR MAS AND ITS SUBSIDIARY Notes to Consolidated Financial Statements As of September 30, 2011 and 2010 and December 31, 2010 and For the Nine Month Periods Ended September 30, 2011 and 2010
- 43 -
As of September 30, 2011 and 2010 and December 31, 2010, the consolidated balances of reinsurance payables denominated in foreign currency amounted to US$ 21,717,647 (equivalent to Rp 191,614,802 thousand), US$ 17,956,902 (equivalent to Rp 160,247,389 thousand) and US$ 5,713,643 (equivalent to Rp 51,371,367 thousand), respectively (Note 33).
16. Commissions Payable These represent commissions payable to brokers and insurance agents.
September 30,(Unaudited) December 31,
2011 2010 2010Rp '000 Rp '000 Rp '000
Related parties (Note 29) 9,257,312 7,407,454 3,216,496Third parties 16,120,550 12,029,823 22,146,864
Total 25,377,862 19,437,277 25,363,360
The details based on currency:
September 30,(Unaudited) December 31,
2011 2010 2010Rp '000 Rp '000 Rp '000
Rupiah 14,437,078 12,864,104 20,907,071US. Dollar (Note 33) 10,940,784 6,573,173 4,456,289
Total 25,377,862 19,437,277 25,363,360
17. Premiums Payable
These represent coinsurance premiums payable to coinsurance member companies arising from the insurance transactions.
September 30,(Unaudited) December 31,
2011 2010 2010Rp '000 Rp '000 Rp '000
Related parties (Note 29) 309,779 323,491 181,439Third parties 19,150,503 17,354,175 8,072,865
Total 19,460,282 17,677,666 8,254,304
The details based on currency:
September 30,(Unaudited) December 31,
2011 2010 2010Rp '000 Rp '000 Rp '000
Rupiah 6,364,716 5,350,981 3,482,410U.S. Dollar (Note 33) 13,095,566 12,326,685 4,771,894
Total 19,460,282 17,677,666 8,254,304

PT ASURANSI SINAR MAS AND ITS SUBSIDIARY Notes to Consolidated Financial Statements As of September 30, 2011 and 2010 and December 31, 2010 and For the Nine Month Periods Ended September 30, 2011 and 2010
- 44 -
18. Premiums Received in Advance These represent premiums received in advance in relation to insurance policies issued with coverage period of more than one (1) year. Premiums received in advance by type of insurance are as follows:
September 30,(Unaudited) December 31,
2011 2010 2010Rp '000 Rp '000 Rp '000
Motor Vehicles 658,387,852 593,457,870 714,536,538Fire 50,015,618 42,090,435 43,344,898Engineering 727,616 203,418 346,107Marine Hull 108,666 189,010 179,629Marine Cargo 26,952 83,956 74,774Health 31,988 10,365,816 31,988Miscellaneous 13,063,946 13,718,121 12,173,525
Total 722,362,638 660,108,626 770,687,459
19. Other Liabilities
September 30,
(Unaudited) December 31,2011 2010 2010
Rp '000 Rp '000 Rp '000
Customers' fund 82,425,584 22,898,132 27,409,195Premiums received in identification process 12,298,600 21,776,692 8,729,273Investment payable - - 1,190,533Profit sharing payables 1,633,669 662,143 1,061,521Tithe payables 98,973 61,548 148,973Deferred rental income 469,355 625,213 584,372Tabarru fund 335,213 - 35,393Others 82,434 73,919 71,405
Total 97,343,828 46,097,647 39,230,665
As of September 30, 2011 and 2010 and December 31, 2010, the consolidated balances of other liabilities from related parties amounted to Rp 5,851,362 thousand, Rp 4,541,056 thousand and Rp 849,058 thousand, respectively (Note 29). Transactions with related parties were done under similar term and conditions as those done with third parties. As of September 30, 2011 and 2010 and December 31, 2010, the consolidated balances of other liabilities denominated in foreign currency amounted to US$ 707,509 (equivalent to Rp 6,242,349 thousand), US$ 1,590,767 (equivalent to Rp 14,196,006 thousand) and US$ 93,778 (equivalent to Rp 843,154 thousand), respectively (Note 33).
20. Fair Value of Financial Assets and Financial Liabilities Fair value is defined as the amount at which the financial instruments could be exchanged in a current transaction between knowledgeable, willing parties in an arm’s length transaction, other than in a forced sale or liquidation. Fair values are obtained from quoted prices, discounted cash flows model, as appropriate.

PT ASURANSI SINAR MAS AND ITS SUBSIDIARY Notes to Consolidated Financial Statements As of September 30, 2011 and 2010 and December 31, 2010 and For the Nine Month Periods Ended September 30, 2011 and 2010
- 45 -
The following table sets forth the carrying amounts and estimated fair values of the Company and its subsidiary’s financial assets and liabilities:
Carrying value Estimated fair valueRp '000 Rp '000
Financial AssetsAt fair value through profit and loss
Investments - marketable securities - bonds 28,604,177 28,604,177Investments - statutory marketable securities 26,004,577 26,004,577Investments - marketable securities - units of mutual fund 978,084,599 978,084,599
Available for saleInvestments - marketable securities - shares 864,293,024 864,293,024Investment in shares of stock 5,259,600 5,259,600
Loans and receivablesCash 30,608,162 30,608,162 Investments - time deposits 670,929,614 670,929,614 Investments - mortgage loans 8,163,948 8,163,948 Other receivables 6,289,536 6,289,536 Other assets 40,556 40,556
Total 2,618,277,793 2,618,277,793
Financial LiabilitiesLiabilities
Accrued expenses 2,602,655 2,602,655Other liabilities 84,158,226 84,158,226
Total 86,760,881 86,760,881
September 30, 2011 (Unaudited)
Carrying value Estimated fair valueRp '000 Rp '000
Financial AssetsAt fair value through profit and loss
Investments - marketable securities - bonds 23,159,213 23,159,213Investments - statutory marketable securities 19,376,730 19,376,730Investments - marketable securities - units of mutual fund 1,051,086,058 1,051,086,058
Available for saleInvestments - marketable securities - shares 369,600,546 369,600,546Investment in shares of stock 5,258,900 5,258,900
Loans and receivablesCash 27,084,419 27,084,419 Investments - time deposits 584,865,377 584,865,377 Investments - mortgage loans 5,091,357 5,091,357 Other receivables 7,458,193 7,458,193 Other assets 40,556 40,556
Total 2,093,021,349 2,093,021,349
Financial LiabilitiesLiabilities
Accrued expenses 1,344,712 1,344,712Other liabilities 23,621,823 23,621,823
Total 24,966,535 24,966,535
September 30, 2010 (Unaudited)

PT ASURANSI SINAR MAS AND ITS SUBSIDIARY Notes to Consolidated Financial Statements As of September 30, 2011 and 2010 and December 31, 2010 and For the Nine Month Periods Ended September 30, 2011 and 2010
- 46 -
Carrying value Estimated fair valueRp '000 Rp '000
Financial AssetsAt fair value through profit and loss
Investments - marketable securities - bonds 23,120,444 23,120,444Investments - statutory marketable securities 19,157,500 19,157,500Investments - marketable securities - units of mutual fund 1,152,525,409 1,152,525,409
Available for saleInvestments - marketable securities - shares 498,974,203 498,974,203Investment in shares of stock 5,258,900 5,258,900
Loans and receivablesCash 18,368,285 18,368,285Investments - time deposits 476,654,724 476,654,724Investments - statutory time deposits 20,000,000 20,000,000Investments - mortgage loans 5,053,480 5,053,480Other receivables 9,380,934 9,380,934Other assets 40,556 40,556
Total 2,228,534,435 2,228,534,435
Financial LiabilitiesLiabilities
Accrued expenses 1,511,619 1,511,619Other liabilities 29,810,222 29,810,222
Total 31,321,841 31,321,841
December 31, 2010
Fair value of investment, segregated funds net assets - unit link, and segregated funds net assets – sharia (shares and warrant that are traded in Indonesia Stock Exchange, and bonds) based on market price, fair value of investment, segregated funds net assets - unit link, and segregated funds net assets – sharia (units of mutual fund) were based on net asset value published. There is no reliable basis for measuring the fair value of investment in shares (Note 4f) thus; the investments in shares are stated at cost. Fair value of investment (time deposits, statutory time deposit, mortgage loans), cash, other receivables, segregated funds net assets – unit link (cash in banks, time deposits, investment receivable and other receivable), segregated funds net assets – sharia (cash in banks, time deposits and investment receivable), other assets (refundable deposit), accrued expenses, and other liabilities approximates the carrying value due to short term nature of transactions.
21. Capital Stock The stockholders composition as of September 30, 2011 and 2010 and December 31, 2010 are as follows:
Number of Percentage ofShares Ownership Total
% Rp '000
PT Sinar Mas Multiartha Tbk 199,998 99.999 199,998,000PT Sinar Mas Multifinance 2 0.001 2,000
Total 200,000 100.000 200,000,000
Name of Stockholder

PT ASURANSI SINAR MAS AND ITS SUBSIDIARY Notes to Consolidated Financial Statements As of September 30, 2011 and 2010 and December 31, 2010 and For the Nine Month Periods Ended September 30, 2011 and 2010
- 47 -
22. Premium Income - Net
Decrease(increase) in
Gross Reinsurance unearned Net premiumpremiums premiums premiums incomeRp '000 Rp '000 Rp '000 Rp '000
Fire 1,211,956,286 (1,137,685,273) (7,204,404) 67,066,609Motor vehicle 891,706,910 (61,083,323) (51,669,322) 778,954,265Health 474,184,170 (14,312,404) (69,482,077) 390,389,689Marine cargo 122,689,982 (100,876,741) (2,219,474) 19,593,767Marine hull 52,925,302 (42,885,534) (1,680,493) 8,359,275Engineering 8,397,843 (6,588,923) 393,159 2,202,079Miscellaneous 226,311,082 (178,475,772) (4,143,902) 43,691,408
Total 2,988,171,575 (1,541,907,970) (136,006,513) 1,310,257,092
September 30, 2011 (Nine Months) (Unaudited)
Decrease(increase) in
Gross Reinsurance unearned Net premiumpremiums premiums premiums incomeRp '000 Rp '000 Rp '000 Rp '000
Fire 1,044,561,802 (989,909,585) 4,578,155 59,230,372Motor vehicle 749,483,132 (74,328,547) (24,476,081) 650,678,504Health 284,932,488 (5,631,885) (47,914,843) 231,385,760Marine cargo 121,439,750 (112,239,991) 702,992 9,902,751Marine hull 31,398,363 (25,828,961) (1,579,755) 3,989,647Engineering 7,867,736 (5,139,568) (418,171) 2,309,997Miscellaneous 205,322,035 (170,132,040) (287,418) 34,902,577
Total 2,445,005,306 (1,383,210,577) (69,395,121) 992,399,608
September 30, 2010 (Nine Months) (Unaudited)
23. Claims Expense - Net
Increase(decrease) in
Gross Reinsurance estimated own Claimsclaims claims retention claims expense - netRp '000 Rp '000 Rp '000 Rp '000
Fire 28,145,056 (10,714,509) 11,346,270 28,776,817Motor vehicle 377,821,045 (4,154) 51,103,661 428,920,552Health 305,780,949 (1,332,487) 7,337,367 311,785,829Marine cargo 4,638,516 (418,621) (1,102,791) 3,117,104Marine hull 4,001,955 (1,339,559) 4,427,710 7,090,106Engineering 2,321,180 (2,153,398) 332,724 500,506Miscellaneous 7,851,604 (514,411) 2,135,186 9,472,379
Total 730,560,305 (16,477,139) 75,580,127 789,663,293
September 30, 2011 (Nine Months) (Unaudited)

PT ASURANSI SINAR MAS AND ITS SUBSIDIARY Notes to Consolidated Financial Statements As of September 30, 2011 and 2010 and December 31, 2010 and For the Nine Month Periods Ended September 30, 2011 and 2010
- 48 -
Increase(decrease) in
Gross Reinsurance estimated own Claimsclaims claims retention claims expense - netRp '000 Rp '000 Rp '000 Rp '000
Fire 93,994,016 (76,556,198) 7,629,864 25,067,682Motor vehicle 339,651,948 (66,344) 36,526,780 376,112,384Health 164,804,829 (966,799) 19,928,653 183,766,683Marine cargo 4,852,713 (666,426) (2,768,973) 1,417,314Marine hull 7,346,278 (4,377,818) 1,074,999 4,043,459Engineering 4,764,713 (3,909,458) 12,733 867,988Miscellaneous (3,265,887) (1,736,044) 2,349,148 (2,652,783)
Total 612,148,610 (88,279,087) 64,753,204 588,622,727
September 30, 2010 (Nine Months) (Unaudited)
24. Commissions Expense - Net
ReinsuranceCommission commission Commission
expense income expense - netRp '000 Rp '000 Rp '000
Fire 44,694,100 (19,943,455) 24,750,645Motor vehicle 210,517,344 (4,810,714) 205,706,630Health 40,574,299 (96,077) 40,478,222Marine cargo 7,591,228 (793,284) 6,797,944Marine hull 7,200,000 (8,727,130) (1,527,130)Engineering 901,782 (127,430) 774,352Miscellaneous 7,812,737 (1,272,857) 6,539,880
Total 319,291,490 (35,770,947) 283,520,543
September 30, 2011 (Nine Months) (Unaudited)
ReinsuranceCommission commission Commission
expense income expense - netRp '000 Rp '000 Rp '000
Fire 25,169,756 (2,644,178) 22,525,578Motor vehicle 178,811,726 (7,408) 178,804,318Health 33,559,806 - 33,559,806Marine cargo 2,797,347 (3,066,369) (269,022)Marine hull 2,947,267 (4,826,451) (1,879,184)Engineering 932,129 (265,232) 666,897Miscellaneous 4,570,403 (161,767) 4,408,636
Total 248,788,434 (10,971,405) 237,817,029
September 30, 2010 (Nine Months) (Unaudited)

PT ASURANSI SINAR MAS AND ITS SUBSIDIARY Notes to Consolidated Financial Statements As of September 30, 2011 and 2010 and December 31, 2010 and For the Nine Month Periods Ended September 30, 2011 and 2010
- 49 -
25. Investment Income - Net
September 30,(Unaudited) (Nine Months)2011 2010
Rp '000 Rp '000
Gain on sale of marketable securities 136,602,116 35,783,971Gain on mutual funds 132,726,210 135,607,014Interest income:
Time deposits 26,474,300 12,388,991Bonds and promissory notes 3,041,263 1,183,219Mortgage loans 312,071 245,533
Dividend income 15,253,184 7,102,032Equity in net income of an associate (Note 4) 2,358,480 -Unrealized gain from change in fair
value of marketable securities - net 2,365,350 2,521,487Income from investment portfolio of participants fund administration 477,952 -Rental income 146,517 122,523Loss on foreign exchange (1,047,372) (8,755,414)
Total 318,710,071 186,199,356
26. Operating Expenses
September 30,
(Unaudited) (Nine Months)2011 2010
Rp '000 Rp '000
Employees' salaries and benefits 85,739,259 67,249,341General and administrative 27,107,504 22,361,338Depreciation (Notes 9 and 4g) 10,966,314 9,961,517Training and education 10,092,702 4,388,531Rental 9,212,048 8,514,484Promotion and marketing 5,007,432 3,282,639Entertainment 4,399,074 4,414,186Stationeries 5,662,467 3,754,756Repairs and maintenance 4,736,165 3,463,609Recovery from impairment losses (1,231,556) -
Total 161,691,409 127,390,401

PT ASURANSI SINAR MAS AND ITS SUBSIDIARY Notes to Consolidated Financial Statements As of September 30, 2011 and 2010 and December 31, 2010 and For the Nine Month Periods Ended September 30, 2011 and 2010
- 50 -
27. Other Income – Net The details of other income (expenses) are as follows:
September 30,(Unaudited) (Nine Months)2011 2010
Rp '000 Rp '000
Policy printing income 7,653,133 7,070,572Interest income 565,314 215,224Loss on foreign exchange - net (537,996) (249,385)Gain on sale of property and equipment (Note 9) 1,117 8,486Others 64,514 78,125
Total 7,746,082 7,123,022
28. Taxation
a. Taxes Payable
September 30,
(Unaudited) December 31,2011 2010 2010
Rp '000 Rp '000 Rp '000
Income taxesArticle 4 (2) 12,328 1,017 13,506Article 21 731,379 631,450 1,176,695Article 23 348,780 367,308 259,087Article 26 38,340 55,236 82,462Article 29 27,477,427 3,206,749 514,803
Total 28,608,254 4,261,760 2,046,553
The filing of tax returns is based on the Company and its subsidiary’s own calculation of tax liabilities (self-assessment). Based on the third amendment of the General Taxation Provisions and Procedures No. 28 Year 2007, the time limit for the tax authorities to assess or amend taxes was reduced from 10 to 5 years, subject to certain exceptions, since the tax became payable and for year 2007 and prior years, the time limit will end at the latest on fiscal year 2013.
b. Tax Expense The tax expense of the Company and its subsidiary consist of:
September 30,(Unaudi ted) (Nine Months)
2011 2010Rp '000 Rp '000
Current tax expenseParent Company 27,477,427 3,206,749Subsidiary 678,816 -Subtotal 28,156,243 3,206,749
Deferred tax expenseParent Company 5,543,967 4,727,639
Total 33,700,210 7,934,388

PT ASURANSI SINAR MAS AND ITS SUBSIDIARY Notes to Consolidated Financial Statements As of September 30, 2011 and 2010 and December 31, 2010 and For the Nine Month Periods Ended September 30, 2011 and 2010
- 51 -
Reconciliation between income before tax based on the consolidated statements of comprehensive income and fiscal losses follows:
September 30,(Unaudited) (Nine Months)2011 2010
Rp '000 Rp '000
Income before tax as shown in the consolidated statements of comprehensive income 401,148,216 229,959,728
Income before tax of Subsidiary (7,875,138) -
Income before tax - the Company 393,273,078 229,959,728
Temporary differences:Recovery from impairment losses (1,231,556) -Estimated expense for employees
benefit 1,415,207 867,577Decrease in unearned premiums (21,012,533) (18,910,556)
Permanent differences:Estimated own retention claims 45,414,000 11,846,090Motor vehicle expenses 866,577 717,143Tax expenses - 633,538Employee insurance - 167,862Rental income (146,517) (122,524)Equity in net income of an associate (2,358,480) -Interest income on bonds (1,712,677) (1,203,975)Unrealized gain from changes in
fair values of marketable securities (1,527,760) (2,521,587)Interest income on time deposits (22,112,694) (11,205,356)Income from investments subjected to
final tax (280,956,936) (171,606,202)
Taxable income 109,909,709 38,621,738
Accumulated fiscal loss at the beginning of period - (25,794,742)
Estimated taxable income 109,909,709 12,826,996
Tax expense and payablearticle 29 - the Company 27,477,427 3,206,749
Tax expense and payablearticle 29 - the Subsidiary 678,816 -
Total 28,156,243 3,206,749

PT ASURANSI SINAR MAS AND ITS SUBSIDIARY Notes to Consolidated Financial Statements As of September 30, 2011 and 2010 and December 31, 2010 and For the Nine Month Periods Ended September 30, 2011 and 2010
- 52 -
c. Deferred Tax The details of the Company and its subsidiary’s deferred tax assets and liabiliies are as follows:
Credited Credited (charged) to (charged) toconsolidated consolidated statement of statement of
comprehensive September 30, comprehensive September 30,January 1, income 2010 January 1, income 2011
2010 for the period (Unaudited) 2011 for the period (Unaudited)Rp '000 Rp '000 Rp '000 Rp '000 Rp '000 Rp '000
Allowance for impairment losses - - - 1,231,556 (307,889) 923,667Decrease in unearned premiums (25,944,223) (4,944,533) (30,888,756) (31,197,076) (5,589,879) (36,786,955)Post-employment benefits reserve 2,366,933 216,894 2,583,827 2,389,675 353,801 2,743,476
Total (23,577,290) (4,727,639) (28,304,929) (27,575,845) (5,543,967) (33,119,812)
Credited
(charged) toconsolidated statement of
comprehensiveJanuary 1, income December 31,
2010 for the period 2010Rp '000 Rp '000 Rp '000
Allowance for impairment losses - 1,231,556 1,231,556Decrease in unearned premiums (25,944,223) (5,252,852) (31,197,075)Post-employment benefits reserve 2,366,933 22,741 2,389,674
Total (23,577,290) (3,998,555) (27,575,845)
In September 2008, Law No. 7 Year 1983 regarding “Income Tax” has been revised with Law No. 36 Year 2008. The revised Law stipulates changes in corporate income tax rates, from progressive tax rates to a flat rate of 28% for fiscal year 2009 and 25% for fiscal year 2010 onwards.
According to tax regulation, fiscal losses can be carried forward and applied against the taxable income immediately within five (5) years after such fiscal losses were incurred. In 2010, the Company received a Tax Assessment Letter Conforming Overpayment (SKPLB) for tax year 2008 No. 00028/406/08/ 073/10 dated April 16, 2010. In SKPLB Directorate General of Taxes has approved the amount of overpayment from Income Tax article 23 amounting to Rp 1,422,784 thousand and departure tax (fiscal) amounting to Rp 110,000 thousand. The difference between the value from SKPLB and the carrying amount has been charged to the consolidated statements of comprehensive income. The Company also has received a decision from Tax Court No. 24877/PP/M.VI/99/2010 dated July 23, 2010, where the Tax Court has granted the total overpayment amount of Income Tax article 25/29 for the tax year 2006 amounting to Rp 842,230 thousand. A reconciliation between the total expense and the amounts computed by applying the effective tax rate to income before tax per consolidated statements of comprehensive income follows:
September 30,(Unaudited) (Nine Months)2011 2010
Rp '000 Rp '000
Income before tax as shown in the consolidated statements of comprehensive income 401,148,216 229,959,728
Income before tax of Subsidiary (7,875,138) -
Income before tax of the Company 393,273,078 229,959,728

PT ASURANSI SINAR MAS AND ITS SUBSIDIARY Notes to Consolidated Financial Statements As of September 30, 2011 and 2010 and December 31, 2010 and For the Nine Month Periods Ended September 30, 2011 and 2010
- 53 -
September 30,(Unaudited) (Nine Months)2011 2010
Rp '000 Rp '000
Tax expense at effective tax rates 98,318,270 57,489,932
Permanent differences:Estimated own retention claims 11,353,500 2,961,500Motor vehicle expenses 216,644 179,286Tax expense - 158,384Employee insurance - 41,966Rental income (36,629) (30,631)Equity in net income of an associate (589,620) -Interest income on bond (428,169) (300,994)Unrealized gain from changes in
fair value of marketable securities (381,940) (630,372)Interest income on time deposits (5,528,174) (2,801,339)Income from investments subjected to final tax (70,239,234) (42,901,551)
Net (65,633,622) (43,323,751)
Unrecognized deferred tax asset 336,746 216,893Tax effect of fiscal loss applied againt taxable income - (6,448,686)
Tax expense of the Company 33,021,394 7,934,388Tax expense of the Subsidiary 678,816 -
Total 33,700,210 7,934,388
29. Nature of Relationship and Transactions with Related Parties
Nature of Relationship The companies under the Sinar Mas Group which have the same stockholders and management with the Company and its subsidiary direct or indirectly, are recognized as related parties. Transactions with Related Parties In the normal course of business, the Company and its subsidiary entered indicate certain transactions with related parties. a. Significant balances with related parties in the consolidated statements of financial position as of
consolidated statement of financial position dates are as follows:
Percentage to Percentage to Percentage toCarrying Total Assets/ Carrying Total Assets/ Carrying Total Assets/Value Liabilities Value Liabilities Value Liabilities
Rp '000 % Rp '000 % Rp '000 %
ASSETS
InvestmentsTime deposits
PT Bank Sinarmas Tbk 302,913,700 0.09 112,212,400 0.04 107,548,200 0.04Units of mutual fund
Danamas Flexi 8,296,361 0.00 7,017,833 0.00 7,031,601 0.00Sinar Prima Reksa 4,390,419 0.00 30,464,594 0.01 20,388,757 0.01Danamas Saham 1,662,428 0.00 2,019,541 0.00 2,010,390 0.00Sinar Dana Tumbuh - - 240,851,169 0.09 251,169,133 0.09Danamas Stabil - - 18,401,470 0.01 1,517,900 0.00
Investment in shares of stockPT LIG Insurance 34,446,659 0.01 16,116,694 0.01 17,088,179 0.01
Mortgage loans 2,153,919 0.00 2,394,838 0.00 2,465,415 0.00Total 353,863,486 0.10 429,478,539 0.16 409,219,575 0.15
December 31, 2010September 30, 2010 (Unaudited)September 30, 2011 (Unaudited)

PT ASURANSI SINAR MAS AND ITS SUBSIDIARY Notes to Consolidated Financial Statements As of September 30, 2011 and 2010 and December 31, 2010 and For the Nine Month Periods Ended September 30, 2011 and 2010
- 54 -
Percentage to Percentage to Percentage toCarrying Total Assets/ Carrying Total Assets/ Carrying Total Assets/Value Liabilities Value Liabilities Value Liabilities
Rp '000 % Rp '000 % Rp '000 %
ASSETS
CashPT Bank Sinarmas Tbk 4,115,792 0.00 3,408,061 0.00 1,219,413 0.00
Premiums receivablePT Kali Besar Raya Utama 95,048,827 0.03 34,243,728 0.01 16,013,175 0.01PT Oto Multiartha 4,689,020 0.00 12,260,450 0.00 14,005,398 0.01PT Sinar Mas Multifinance 3,547,655 0.00 5,073,016 0.00 4,659,889 0.00PT Indah Kiat Pulp and Paper Tbk 230,111 0.00 200,451 0.00 2,872,567 0.00PT Cakrawala Megah Indah 280,667 0.00 35,054 0.00 1,919,874 0.00PT Sebangun Bumi Andalas 145,189 0.00 64,197 0.00 1,844,723 0.00Pulp and Paper others - - 57,598 0.00 1,378,032 0.00PT Finnantara In Tiga 276,196 0.00 1,063,331 0.00 748,146 0.00PT Arara Abadi 5,385,604 0.00 - - - -Others (below Rp 1,000 million each) 3,124,157 0.00 6,337,953 0.00 5,480,110 0.00
Total 112,727,426 0.03 59,335,778 0.01 48,921,914 0.02
Reinsurance receivablesPT Simas Reinsurance Broker 689,630 0.00 3,174,645 0.00 892,465 0.00Others 74,931 0.00 891,895 0.00 13,282 0.00
Total 764,561 0.00 4,066,540 0.00 905,747 0.00
Other receivablesInvestment income receivables
PT Bank Sinarmas Tbk 467,677 0.00 208,008 0.00 35,315 0.00Others 754,774 0.00 4,941,239 0.00 291,638 0.00
Total 1,222,451 0.00 5,149,247 0.00 326,953 0.00
Other assetsPT Sinar Mas Multiartha Tbk 13,200,000 0.00 14,575,000 0.01 14,025,000 0.01
LIABILITIES
Claims payablePT Oto Multiartha 154,535 0.00 509,410 0.00 975,655 0.00PT Arara Abadi 51,923 0.00 548,437 0.00 362,203 0.00Others 239,790 0.00 401,465 0.00 813,364 0.00
Total 446,248 0.00 1,459,312 0.00 2,151,222 0.00
Estimated own retention claims 63,545,814 0.03 48,338,688 0.03 51,980,053 0.03
Unearned premiums 118,053,638 0.06 109,715,958 0.07 141,395,308 0.09
Reinsurance payablesPT Kali Besar Raya Utama 304,854 0.00 1,136,049 0.00 953,062 0.00PT LIG Insurance 15,721 0.00 723,328 0.00 13,356 0.00PT Simas Reinsurance Broker 17,878,838 0.01 4,645,946 0.00 6,214,138 0.00
Total 18,199,413 0.01 6,505,323 0.00 7,180,556 0.00
Commissions payablePT Kali Besar Raya Utama 8,483,008 0.00 6,518,460 0.00 1,570,708 0.00PT Oto Multiartha 91,132 0.00 22,521 0.00 333,428 0.00Others 683,172 0.00 866,473 0.00 1,312,360 0.00
Total 9,257,312 0.00 7,407,454 0.00 3,216,496 0.00
December 31, 2010September 30, 2010 (Unaudited)September 30, 2011 (Unaudited)
b. For the nine month periods ended September 30, 2011 and 2010, the consolidated underwriting
income (gross premium less reinsurance premium) from related parties amounted to Rp 296,077,667 thousand and Rp 281,016,584 thousand, or 20% and 26%, respectively, of the total consolidated underwriting income.
c. For the nine month periods ended September 30, 2011 and 2010, the consolidated underwriting
expense from related parties amounted to Rp 152,306,402 thousand and Rp 134,829,268 thousand, or 14% and 16%, respectively, of the total consolidated underwriting expense.
d. For the nine month periods ended September 30, 2011 and 2010, the consolidated result of
investment income from related parties amounted to Rp 21,253,171 thousand and Rp 40,576,901 thousand, or 6.67% and 21.79%, respectively, of the consolidated result of investment income.

PT ASURANSI SINAR MAS AND ITS SUBSIDIARY Notes to Consolidated Financial Statements As of September 30, 2011 and 2010 and December 31, 2010 and For the Nine Month Periods Ended September 30, 2011 and 2010
- 55 -
e. The Company and its subsidiary provide compensation to the key management personnel as follows:
September 30, (Nine Months)
(Unaudited)2011 2010
Rp '000 Rp '000
Short-term benefits 26,630,369 19,974,743Post-employment benefits 3,444,644 3,175,831
30,075,013 23,150,574
f. Transactions with related parties are done under the same item and conditions as done with third
parties.
30. Post-Employment Benefits The Company and its subsidiary determine post-employment benefits based on Law No. 13 Year 2003, dated March 25, 2003. As of September 30, 2011 and 2010 and December 31, 2010, the actuarial valuation report on the pension fund and the defined-benefit post employment reserve of the Parent Company and subsidiary was from PT Ricky Leonard Jasatama, an independent actuary, based on its reports dated February 1, 2011. The actuarial valuation was carried out using the following key assumptions: The principal assumptions used in determining the estimated liabilities for employees’ benefits in financial statements are as follows: Pension ages 55 yearsSalary increment 5% per annumDiscount rates 13% per annumMortality rates Indonesian Mortality Table 2Disability tables 5% from Mortality TableResignation level 0% - 5% Calculation method Projected Unit Credit
No actuarial computation has been made on the reporting date considering that there was no change in these data for the nine month periods ended September 30, 2011 and 2010. The expense for this period in respect of post employment benefit obligation is for nine months of the expenses calculated for 2011 and 2010 on the basis of the actuarial assumptions as at December 31, 2010. Movements of defined-benefit post-employment reserve are as follows:
September 30,
(Unaudited) December 31,2011 2010 2010
Rp '000 Rp '000 Rp '000
Defined-benefit post-employmentreserve at beginning of the period 9,558,699 9,467,733 9,467,733
Defined-benefit post-employmentexpense during the period 1,415,207 867,576 90,966
Defined-benefit post-employmentreserve at end of the period 10,973,906 10,335,309 9,558,699

PT ASURANSI SINAR MAS AND ITS SUBSIDIARY Notes to Consolidated Financial Statements As of September 30, 2011 and 2010 and December 31, 2010 and For the Nine Month Periods Ended September 30, 2011 and 2010
- 56 -
31. Pension Fund Program The details of pension fund of the Company and its subsidiary are as follows:
September 30,(Unaudited) December 31,
2011 2010 2010Rp '000 Rp '000 Rp '000
Accumulated contribution of pension fund 5,001,344 5,682,147 5,682,147Accumulated return on pension fund 323,051 508,314 673,963
Total 5,324,395 6,190,461 6,356,110
In 2002, the Company and its subsidiary ceased its contribution of pension fund for the employees and as a substitute, the Company and its subsidiary have calculated the estimated liabilities for employees benefits in accordance with the Labor Law (Note 35).
32. Reinsurance Contracts
For the purpose of managing risks on large amount or insurance coverage with certain risks, the Company entered into proportional reinsurance contracts with local and foreign insurance and reinsurance companies. Reinsurance programs in 2011 and 2010 are as follows:
Retention Local Foreign TotalRp '000 Rp '000 Rp '000 Rp '000
Fire 12,500,000 28,000,000 222,000,000 262,500,000Marine cargo 10,000,000 15,700,000 84,300,000 110,000,000Engineering 10,000,000 13,020,000 46,980,000 70,000,000Miscellaneous 5,217,000 6,197,400 40,752,600 52,167,000
Treaty Reinsurance ProgramSeptember 30, 2011 (Unaudited)
Retention Local Foreign TotalRp '000 Rp '000 Rp '000 Rp '000
Fire 12,500,000 26,250,000 223,750,000 262,500,000Marine cargo 8,152,000 11,412,800 70,107,200 89,672,000Engineering 10,000,000 12,600,000 47,400,000 70,000,000Miscellaneous 5,217,000 6,807,750 40,142,250 52,167,000
Treaty Reinsurance ProgramSeptember 30, 2010 (Unaudited)
Retention Local Foreign TotalRp '000 Rp '000 Rp '000 Rp '000
Fire 12,500,000 26,250,000 223,750,000 262,500,000Marine cargo 8,152,000 11,412,800 70,107,200 89,672,000Engineering 10,000,000 12,600,000 47,400,000 70,000,000Miscellaneous 5,217,000 6,807,750 40,142,250 52,167,000
Treaty Reinsurance ProgramDecember 31, 2010

PT ASURANSI SINAR MAS AND ITS SUBSIDIARY Notes to Consolidated Financial Statements As of September 30, 2011 and 2010 and December 31, 2010 and For the Nine Month Periods Ended September 30, 2011 and 2010
- 57 -
33. Capital Management and Financial Risk Management Objectives and Policies
Capital Management
The primary objective of the Company and its subsidiary’s capital management is to ensure that it maintains healthy capital in order to support its business and maximize shareholder value as well as maintain an optimal capital structure to reduce the cost of capital.
The Company and its subsidiary manage their capital structure and make adjustment in light of changes in economic conditions.
The Company and its subsidiary’s capital structure consists of equity attributable to owners of the parent entity (consisting of capital stock, retained earnings and other components of equity). Financial Risk Management Objectives and Policies The main risks arising from the Company and its subsidiary’s financial instruments are interest rate risk, foreign exchange risk, credit risk and liquidity risk. The operational activities of the Company and its subsidiary are managed in a prudent manner by managing those risks to minimize potential losses.
Credit Risk Credit risk is the risk that the Company and its subsidiary will incur a loss arising from the customers or counterparties which fail to fulfill their contractual obligations. The Company and its subsidiary manage and control the credit risk by dealing only with recognized and credit worthy parties, setting internal policies on verifications and authorizations of credit, and regularly monitoring the collectibility of receivables to reduce the exposure to bad debts. The table below shows consolidated statement of financial position exposures related to credit risk:
Gross Amounts Net AmountsRp '000 Rp '000
At fair value through profit and lossInvestments - marketable securities - bonds 27,458,077 27,458,077Investments - marketable securities - units of mutual fund 978,084,599 978,084,599
Available for saleInvestments - marketable securities - shares 864,293,024 864,293,024Investment in shares of stock 5,259,600 5,259,600
Loans and receivablesCash 30,208,600 30,208,600Investments - time deposits 670,929,614 670,929,614Investments - mortgage loans 8,163,948 8,163,948Other receivables 6,289,536 6,289,536Other assets 40,556 40,556
Total 2,590,727,554 2,590,727,554
September 30, 2011 (Unaudited)

PT ASURANSI SINAR MAS AND ITS SUBSIDIARY Notes to Consolidated Financial Statements As of September 30, 2011 and 2010 and December 31, 2010 and For the Nine Month Periods Ended September 30, 2011 and 2010
- 58 -
Gross Amounts Net AmountsRp '000 Rp '000
At fair value through profit and lossInvestments - marketable securities - bonds 21,975,143 21,975,143Investments - marketable securities - units of mutual fund 1,051,086,058 1,051,086,058
Available for saleInvestments - marketable securities - shares 369,600,546 369,600,546Investment in shares of stock 5,258,900 5,258,900
Loans and receivablesCash 26,688,524 26,688,524Investments - time deposits 584,865,377 584,865,377Investments - mortgage loans 5,091,357 5,091,357Other receivables 7,458,193 7,458,193Other assets 40,556 40,556
Total 2,072,064,654 2,072,064,654
September 30, 2010 (Unaudited)
Gross Amounts Net AmountsRp '000 Rp '000
At fair value through profit and lossInvestments - marketable securities - bonds 21,954,844 21,954,844Investments - marketable securities - units of mutual fund 1,152,525,409 1,152,525,409
Available for saleInvestments - marketable securities - shares 498,974,203 498,974,203Investment in shares of stock 5,258,900 5,258,900
Loans and receivablesCash 17,995,160 17,995,160Investments - time deposits 476,654,724 476,654,724Investments - statutory time deposits 20,000,000 20,000,000Investments - mortgage loans 5,053,480 5,053,480Other receivables 9,380,934 9,380,934Other assets 40,556 40,556
Total 2,207,838,210 2,207,838,210
December 31, 2010
Interest Rate Risk
Interest rate risk is the risk that the fair value or contractual future cash flows of a financial instrument will be affected due to changes in market interest rates.
To minimize interest rate risk, the Company and its subsidiary manage interest cost through a mix of fixed-rate and variable-rate debts, by evaluating market rate trends. Management also conducts assessments among interest rates offered by banks to obtain the most favorable interest rate before taking any decision to enter a new loan agreement and in relation to its placements.

PT ASURANSI SINAR MAS AND ITS SUBSIDIARY Notes to Consolidated Financial Statements As of September 30, 2011 and 2010 and December 31, 2010 and For the Nine Month Periods Ended September 30, 2011 and 2010
- 59 -
The following table sets out the carrying amount, by maturity, of the Company and it subsidiary’s consolidated financial assets that are exposed to interest rate risk:
Average Average Average Effective Carrying Effective Carrying Effective Carrying
Interest Rate Value Interest Rate Value Interest Rate Value% Rp '000 % Rp '000 % Rp '000
Investments - time deposits 6.38 626,171,960 6.54 567,008,977 6.72 440,343,175 Investments - statutory time deposits - - - - 7.25 20,000,000 Investments - marketable securities - bonds 10.10 18,463,778 10.10 18,675,143 10.10 18,815,350 Investments - statutory marketable securities 9.88 26,004,577 9.88 19,376,730 9.88 19,157,500 Investments - mortgage loans 6.00 8,163,948 6.00 5,091,357 6.00 5,053,480 Cash 1.5 24,010,019 1.5 22,130,414 1.5 15,709,872
Total 702,814,282 632,282,621 519,079,377
(Unaudited) (Unaudited) December 31, 2010September 30, 2011 September 30, 2010
Foreign Exchange Risk
Foreign exchange rate risk is the risk that the fair value or future contractual cash flows of a financial instrument will fluctuate because of changes in foreign exchange rates. The Company and its subsidiary have transactional currency exposures which arise when the transaction is denominated in currencies other than the functional currency of the counterparty. Foreign currency risk exposure of the Company and its subsidiary is only minimal. The following table shows consolidated monetary assets and liabilities:
Foreign Equivalent in Foreign Equivalent in Foreign Equivalent inCurrency Rp '000 Currency Rp '000 Currency Rp '000
AssetsInvestment - time deposit 2,696,531 23,791,489 8,557,962 76,371,252 1,027,983 9,242,599Investment - bonds 2,092,687 18,463,778 2,092,688 18,675,143 2,092,687 18,815,350Investment - unit of mutual funds 8,236,192 72,667,922 8,576,329 76,535,160 6,590,626 59,256,318Cash 970,380 8,561,665 364,369 3,251,628 421,954 3,793,785Premiums receivable 14,145,839 124,808,742 4,413,650 39,387,410 3,630,144 32,638,628Reinsurance receivables 1,194,972 10,543,235 1,569,769 14,008,618 387,683 3,485,654Other receivables 106,129 936,380 93,914 838,089 79,596 715,648
Total 29,442,730 259,773,211 25,668,681 229,067,300 14,230,673 127,947,982
LiabilitiesClaims payable 4,062 35,836 61,814 551,624 18,165 163,324Unearned premiums 1,431,388 12,629,133 1,613,019 14,394,583 2,746,245 24,691,484Estimated own retention claims 2,747,446 24,240,716 2,256,297 20,135,197 2,140,767 19,247,635Reinsurance payables 21,717,647 191,614,802 17,956,902 160,247,389 5,713,643 51,371,367Commissions payables 1,240,030 10,940,784 736,572 6,573,173 495,639 4,456,289Premiums payable 1,484,253 13,095,566 1,381,296 12,326,685 530,741 4,771,894Premiums received in advance 47,574 419,743 49,832 444,701 2,193,827 19,724,702Other liabilities 707,509 6,242,349 1,590,767 14,196,006 93,778 843,154
Total 29,379,909 259,218,929 25,646,499 228,869,358 13,932,805 125,269,849
Net Assets 62,821 554,282 22,182 197,942 297,868 2,678,133
(Unaudited) December 31, 2010(Unaudited)September 30, 2011 September 30, 2010

PT ASURANSI SINAR MAS AND ITS SUBSIDIARY Notes to Consolidated Financial Statements As of September 30, 2011 and 2010 and December 31, 2010 and For the Nine Month Periods Ended September 30, 2011 and 2010
- 60 -
Liquidity Risk
Liquidity risk is a risk arising when the cash flow position of the Company and its subsidiary is not enough to cover the liabilities which become due.
In the management of liquidity risk, management monitors and maintains a level of cash deemed adequate to finance the Company and its subsidiary’s operations and to mitigate the effects of fluctuation in cash flows. Management also regularly evaluates the projected and actual cash flows, including loan maturity profiles, and continuously assess conditions in the financial markets for opportunities to obtain optimal funding sources.
The table below summarizes the maturity profile of consolidated financial assets and liabilities based on contractual undiscounted payments:
<= 1 year 1-2 years 2-3 years 3-4 years 4-5 years > 5 years TotalRp '000 Rp '000 Rp '000 Rp '000 Rp '000 Rp '000 Rp '000
AssetsInvestm ents
Time deposi ts 670,929,614 - - - - - 670,929,614Marketable securities - bonds 28,604,177 - - - - - 28,604,177Marketable securities - shares 864,293,024 - - - - - 864,293,024Statutory marketable securities 26,004,577 - - - - - 26,004,577Units of mutual fund 978,084,599 - - - - - 978,084,599Investment in shares of stock 5,259,600 - - - - - 5,259,600Mortgage loans 6,389 411,016 423,301 - 362,157 6,961,085 8,163,948
Cash 30,608,162 - - - - - 30,608,162Other receivables 5,416,198 274,805 315,483 151,519 131,531 - 6,289,536Other assets 40,556 - - - - - 40,556
Total 2,609,246,896 685,821 738,784 151,519 493,688 6,961,085 2,618,277,793
LiabilitiesAccrued expenses 2,602,655 - - - - - 2,602,655Other l iabili ties 84,158,226 - - - - - 84,158,226
Total 86,760,881 - - - - - 86,760,881
Maturity gap assets and liabilities 2,522,486,015 685,821 738,784 151,519 493,688 6,961,085 2,531,516,912
September 30, 2011 (Unaudited)
<= 1 year 1-2 years 2-3 years 3-4 years 4-5 years > 5 years TotalRp '000 Rp '000 Rp '000 Rp '000 Rp '000 Rp '000 Rp '000
AssetsInvestm ents
Time deposi ts 584,865,377 - - - - - 584,865,377Marketable securities - bonds 23,159,213 - - - - - 23,159,213Marketable securities - shares 369,600,546 - - - - - 369,600,546Statutory marketable securities 19,376,730 - - - - - 19,376,730Units of mutual fund 1,051,086,058 - - - - - 1,051,086,058Investment in shares of stock 5,258,900 - - - - - 5,258,900Mortgage loans 31,968 453,071 618,726 956,486 - 3,031,106 5,091,357
Cash 27,084,419 - - - - - 27,084,419Other receivables 6,776,625 124,980 231,049 241,289 84,250 7,458,193Other assets 40,556 - - - - - 40,556
Total 2,087,280,392 578,051 849,775 1,197,775 84,250 3,031,106 2,093,021,349
LiabilitiesAccrued expenses 1,344,712 - - - - - 1,344,712Other l iabili ties 23,621,823 - - - - - 23,621,823
Total 24,966,535 - - - - - 24,966,535
Maturity gap assets and liabilities 2,062,313,857 578,051 849,775 1,197,775 84,250 3,031,106 2,068,054,814
September 30, 2010 (Unaudited)

PT ASURANSI SINAR MAS AND ITS SUBSIDIARY Notes to Consolidated Financial Statements As of September 30, 2011 and 2010 and December 31, 2010 and For the Nine Month Periods Ended September 30, 2011 and 2010
- 61 -
<= 1 year 1-2 years 2-3 years 3-4 years 4-5 years > 5 years TotalRp '000 Rp '000 Rp '000 Rp '000 Rp '000 Rp '000 Rp '000
AssetsInvestm ents
Time deposi ts 476,654,724 - - - - - 476,654,724Statutory time deposits 20,000,000 - - - - - 20,000,000Marketable securities - bonds 23,120,444 - - - - - 23,120,444Marketable securities - shares 498,974,203 - - - - - 498,974,203Statutory marketable securities 19,157,500 - - - - - 19,157,500Units of mutual fund 1,152,525,409 - - - - - 1,152,525,409Investment in shares of stock 5,258,900 - - - - - 5,258,900Mortgage loans 47,537 - 558,446 532,557 - 3,914,940 5,053,480
Cash 18,368,285 - - - - - 18,368,285Other receivables 8,556,901 267,510 310,036 107,581 138,906 - 9,380,934Other assets 40,556 - - - - - 40,556
Total 2,222,704,459 267,510 868,482 640,138 138,906 3,914,940 2,228,534,435
LiabilitiesAccrued expenses 1,511,619 - - - - - 1,511,619Other l iabilties 29,810,222 - - - - - 29,810,222
Total 31,321,841 - - - - - 31,321,841
Maturity gap assets and liabilities 2,191,382,618 267,510 868,482 640,138 138,906 3,914,940 2,197,212,594
December 31, 2010
34. Prospective Accounting Pronouncements
The Indonesian Institute of Accountants has issued the following Revised Financial Accounting Standards (PSAK) and Interpretations (ISAK). These standards will be applicable to financial statements with annual period beginning on or after January 1, 2012 as follows:
PSAK
1. PSAK 10 (Revised 2010), The Effects of Changes in Foreign Exchange Rates 2. PSAK 18 (Revised 2010), Accounting and Reporting by Retirement Benefit Plans 3. PSAK 24 (Revised 2010), Employee Benefits 4. PSAK 33 (Revised 2011), Accounting of Land Stripping Activities and Environmental
Management in General Mining 5. PSAK 34 (Revised 2010), Construction Contracts 6. PSAK 45 (Revised 2011), Financial Reporting for Non-profit Organization 7. PSAK 46 (Revised 2010), Accounting for Income Taxes 8. PSAK 50 (Revised 2010), Financial Instruments: Presentation 9. PSAK 53 (Revised 2010), Share Based Payment 10. PSAK 56 (Revised 2011), Earnings per Share 11. PSAK 60, Financial Instruments: Disclosures 12. PSAK 61, Accounting of Government Grants and Disclosure of Government Assistance 13. PSAK 63, Financial Reporting in Hyperinflationary Economies 14. PSAK 64, Exploration for and Evaluation of Mineral Resources

PT ASURANSI SINAR MAS AND ITS SUBSIDIARY Notes to Consolidated Financial Statements As of September 30, 2011 and 2010 and December 31, 2010 and For the Nine Month Periods Ended September 30, 2011 and 2010
- 62 -
ISAK
1. ISAK 13 (2010), Hedges of a Net Investment in a Foreign Operation 2. ISAK 15, PSAK 24 - The Limit on a Defined Benefit Asset, Minimum Funding Requirements and
Their Interaction 3. ISAK 16, Service Concession Agreement 4. ISAK 18, Government Assistance - No Specific Relation with Operating Activity 5. ISAK 19, Applying the Restatement Approach under PSAK 63: Financial Reporting in
Hyperinflationary Economies 6. ISAK 20, Income Taxes - Changes in the Tax Status of an Entity or its Shareholders 7. ISAK 22, Service Concession Arrangements: Disclosures 8. ISAK 23, Operating Leases-Incentives 9. ISAK 24, Evaluating the Substance of Transactions Involving the Legal Form of a Lease PPSAK 1. PPSAK 8: Withdrawal of IAS 27: Accounting for Cooperatives
The Company and its subsidiary are still evaluating the effects of these revised PSAKs, PPSAKs and ISAKs and have not yet determined the related effects on the consolidated financial statements.
*********