psychometricevaluationoftheimpactofweightonquality oflife ... · methods participants participants...
TRANSCRIPT

Psychometric evaluation of the impact of weight on quality
of life-lite questionnaire (IWQOL-Lite) in a community sample
Ronette L. Kolotkin1 & Ross D. Crosby2,31Obesity and Quality of Life Consulting, Durham, NC (E-mail: [email protected]); 2NeuropsychiatricResearch Institute; 3University of North Dakota School of Medicine and Health Sciences, Fargo, ND
Accepted in revised form 13 December 2001
Abstract
The short form of impact of weight on quality of life (IWQOL)-Lite is a 31-item, self-report, obesity-specificmeasure of health-related quality of life (HRQOL) that consists of a total score and scores on each of fivescales – physical function, self-esteem, sexual life, public distress, and work – and that exhibits strongpsychometric properties. This study was undertaken in order to assess test–retest reliability and discrimi-nant validity in a heterogeneous sample of individuals not in treatment. Individuals were recruited from thecommunity to complete questionnaires that included the IWQOL-Lite, SF-36, Rosenberg self-esteem(RSE) scale, Marlowe–Crowne social desirability scale, global ratings of quality of life, and sexual func-tioning and public distress ratings. Persons currently enrolled in weight loss programs or with a body massindex (BMI) of less than 18.5 were dropped from the analyses, leaving 341 females and 153 males foranalysis, with an average BMI of 27.4. For test–retest reliability, 112 participants completed the IWQOL-Lite again. ANOVA revealed significant main effects for BMI for all IWQOL-Lite scales and total score.Females showed greater impairment than males on all scales except public distress. Internal consistencyranged from 0.816 to 0.944 for IWQOL-Lite scales and was 0.958 for total score. Test–retest reliabilityranged from 0.814 to 0.877 for scales and was 0.937 for total score. Internal consistency and test–retestresults for overweight/obese subjects were similar to those obtained for the total sample. There was strongevidence for convergent and discriminant validity of the IWQOL-Lite in overweight/obese subjects. As inprevious studies conducted on treatment-seeking obese persons, the IWQOL-Lite appears to be a reliableand valid measure of obesity-specific quality of life in overweight/obese persons not seeking treatment.
Key words: Health-related quality of life (HRQOL), IWQOL-Lite, Psychometric, Quality of life
Abbreviations: BMI – body mass index; HRQOL – health-related quality of life; IWQOL – impact ofweight on quality of life
Introduction
The use of health-related-quality of life (HRQOL)measures to assess clinical outcomes is rapidlygrowing [1, 2]. Clinical researchers, with increasingfrequency, are choosing measures of HRQOL asprimary and secondary outcomes in clinical trials[3]. As new, anti-obesity drugs are developing,there is an increasing need for the measurement of
HRQOL in obese persons participating in clinicaltrials for treatment of obesity. While genericmeasures of HRQOL can provide important in-formation about improvements in general health,it is often recommended that they be accompaniedby disease-specific instruments for the conditionunder study [2, 3]. Disease-specific HRQOL in-struments focus on the domains most relevant to aparticular disease such as obesity, as well as on the
Quality of Life Research 11: 157–171, 2002.� 2002 Kluwer Academic Publishers. Printed in the Netherlands.
157

characteristics and complaints of persons whohave the disease. In addition, disease-specific in-struments are usually more sensitive to changesthat occur in treatment than generic instruments[4].The impact of weight on quality of life (IW-
QOL) questionnaire was the first instrument spe-cifically developed to assess quality of life inobesity [5]. At the time of this instrument’s devel-opment, quality of life and the impact of obesitywas rarely assessed in obesity research or practice,with the exception of some surgical interventionsreporting quality of life improvements followingdramatic weight reduction [6]. The original IW-QOL is a self-report instrument (with five responsecategories, from ‘never true’ to ‘always true’)consisting of 74-item items that ask about the ef-fects of obesity on quality of life in eight areas(health, social/interpersonal, work, mobility, self-esteem, sexual life, activities of daily living, andcomfort with food). The IWQOL was developedby clinicians specializing in the treatment of obe-sity who catalogued patients’ concerns about theimpact of their obesity, developed items based onthese concerns, and verified with patients that theitems were comprehensive and accurate. The itemsof the IWQOL begin with the phrase ‘Because ofmy weight’ in order to assess obesity-specificquality of life. The goals in developing the IWQOLwere as follows: (1) to develop an instrument thatwould reliably and validly measure the extent towhich weight affects quality of life, (2) to be able todetermine the aspects of quality of life that aremost affected by weight, and (3) to measure im-provements in quality of life that are associatedwith weight loss or other treatment interventions[5]. Construct validity, test–retest reliability, andinternal consistency reliability were determined tobe good for this instrument [5, 7]. Furthermore,scores changed significantly in the expected direc-tion after treatment in an intensive weight lossprogram [5].A 31-item, short form of the IWQOL (IWQOL-
Lite) was developed recently [8] in order to mini-mize response burden to subjects. Correlationsbetween parallel scores on the original and shortform of the IWQOL are extremely high, rangingfrom 0.948 (sexual life) to 0.974 (total score). TheIWQOL-Lite appears to have strong psychometric
properties [8]. Internal consistency reliabilities ofthe IWQOL-Lite ranged from 0.90 to 0.94 for thefive scales and equaled 0.96 for the total score.Correlations between the IWQOL-Lite and col-lateral measures supported the validity of theIWQOL-Lite. In addition, baseline IWQOL-Litescale scores and total score increased as a functionof BMI. Changes at 1-year follow-up on the IW-QOL-Lite total score were also related strongly tochanges in BMI at the 1-year follow-up, andconfirmatory factor analysis provided strong sup-port for the adequacy of the scale structure (fivescales – physical function, self-esteem, sexual life,public distress, and work – and a total score).Furthermore, all five scales and total score showedstatistically significant correlations with percent-age of weight loss at 1-year follow-up. For threescales (physical function, self-esteem, sexual life)and total score, the relationship between weightloss and clinically meaningful change was linearand significant, with physical function and self-esteem most strongly affected by weight loss [9].Baseline scores on the IWQOL-Lite were found todiffer for obese individuals seeking treatment andobese individuals not seeking treatment (withtreatment-seekers being more impaired) and forobese persons seeking treatments of varying in-tensities (with poorer quality of life associated withmore intensive treatments) [10].In spite of the encouraging psychometric results
obtained thus far on the IWQOL-Lite, severallimitations exist. Analyses of the IWQOL-Lite todate have been based on participants’ responses tothe original 74-item IWQOL, rather than to the 31-item format. Additionally, there are no test–retestdata on the IWQOL-Lite. Furthermore, nearly allresearch subjects studied thus far have been obesepeople in treatment (e.g., only 223 out of 1987 re-search subjects were from a community sample)and Caucasian (77% of the subjects in the devel-opment and cross-validation samples were Cauca-sian) [8]). Finally, there are no data available on thediscriminant validity of the IWQOL-Lite.Because the Lite version of the IWQOL is new,
further research is needed to provide support forthe psychometric properties of this instrument.This study was undertaken to obtain further psy-chometric data on the IWQOL-Lite in a sample of‘normal’ adults.
158
Methods
Participants
Participants were individuals, age 18 and over,recruited from the community through religiousorganizations, local businesses, health clubs, andschools. There were 532 participants recruited forthis study. Data for 18 subjects were dropped dueto current involvement in a weight loss program.In addition, data for four subjects were droppeddue to failure to provide height or weight infor-mation, and 16 subjects for reporting BMI’s lessthan 18.5 (i.e., below a normal weight; [11]). Thefinal sample for analysis consisted of 494 partici-pants: 341 (69.0%) females and 153 (30.0%)males. The average age of females was 37.6 (SD:13.4; range: 18–90) and for males was 38.6 (SD:13.1; range: 18–74). A total of 297 individuals(60.1%) were Caucasian, 174 (35.2%) were Afri-can American, 10 (2.0%) were Hispanic, two(0.4%) were Asian, two (0.4%) were NativeAmerican, three (0.6%) reported their ethnicity as‘other’, and six (1.2%) failed to respond.The first 112 participants, 80 (71.4%) females
and 32 (28.6%) males provided test–retest data.The average age for females was 38.7 (SD: 12.5;range: 18–76) and for males was 40.1 (SD: 13.5;range: 20–72). Ethnic composition of test–retestparticipants included 71 (63.4%) Caucasian, 36(32.1%) African American, two (1.8%) Hispanic,one (0.9%) Native American, and two (1.8%) whofailed to provide ethnicity.
Procedures
Participants were given a packet of questionnairesto complete (described below) along with a con-sent form. They were also asked to report theirheight, weight, age, ethnicity, and whether theywere currently enrolled in a weight loss program.BMI’s of subjects were computed from their self-reported heights and weights. Participants received$10 for their participation in this study. A subsetof participants completed one of the question-naires (IWQOL-Lite) a second time. Test–retestintervals averaged 14.0 days (SD: 0.7) and rangedfrom 10 to 16 days. These participants received anadditional $10. This study received approval bythe medical center’s institutional review board and
conformed to ethical standards for research in-volving human participants.
Measures
Impact of weight on quality of life questionnaire,short-form (IWQOL-Lite)The IWQOL-Lite was administered [8]. The IW-QOL-Lite is a 31-item self-report measure thatassesses obesity-specific quality of life in obeseindividuals. The measure consists of scores on fivescales – physical function (11 items), self-esteem(seven items), sexual life (four items), public dis-tress (five items), and work (four items) – and atotal score (sum of scale scores). Participants areasked to rate items with respect to the past weekon this questionnaire (from ‘never true’ to ‘alwaystrue’). Higher scores indicate poorer quality of lifeon the IWQOL-Lite.
SF-36The SF-36 is the most widely used genericHRQOL measure. It assesses physical functioning,role limitations due to physical health problems,bodily pain, general health, vitality, social func-tioning, role limitations due to emotional prob-lems, and mental health. In addition, there are twosummary scores: a physical summary score and amental summary score [12]. For most of the SF-36items, subjects rate themselves over the past4 weeks.
Rosenberg self-esteem scaleThis scale is a widely used 10-item scale thatmeasures personal self-esteem in terms of likingand/or approving of oneself [13]. There is no timereference in the instructions for completing theRosenberg self-esteem (RSE) scale.
Sexual functioning ratingsSince most measures of sexual functioning arequite detailed and often intended to assess sexualdysfunctions, we felt that participants in this studymight find such measures intrusive. Instead, weasked participants to respond to four obesity-specific items taken from the sexual life scale of theobesity quality of life instrument [14]. The items,rated on a five-point scale, were as follows:(1) How satisfied have you been with your sex life?(2) How much of a problem for you was enjoying
159

sex? (3) How concerned were you that your weightwould cause your partner discomfort during sex?(4) How concerned were you that your weightmade you physically unattractive during sex?Subjects were asked to rate themselves with respectto the past week. The items were scored by sum-ming the responses.
Public distress ratingsIn order to provide evidence for construct validityof the IWQOL-Lite public distress scale, weneeded to assess the social stigma of obesity andthe impact of obesity on everyday functioning dueto size. We used four items from the OBQOL [14]pertaining to discrimination, judgment, and criti-cism by others: (1) How much have you beenbothered by people judging you for what you ate?(2) How much have you been bothered by peoplemaking fun of you? (3) How much have you beenbothered by criticism about your size or shape? (4)How much of the time did you feel you had toperform better than others because of your size?We added an additional item: ‘When out in public,I have difficulty fitting into my environmentphysically because of my size.’ These five itemswere rated on a five-point scale from ‘not at allbothered’ to ‘extremely bothered,’ or from ‘all ofthe time’ to ‘none of the time.’ Subjects were askedto rate themselves with respect to the past week.The items were scored by summing the responses.
Marlowe–Crowne social desirability scale form C(M–C form C)The Marlowe–Crowne social desirability scale [15]is the most widely used measure of social desir-ability. The Marlowe–Crowne assesses the ten-dency for individuals to think or act in ways thatconform to societal norms. The Marlowe–Crownesocial desirability scale and the form C short formof this scale [16] are comprised of items that de-scribe highly desirable, culturally approved be-haviors, but have a low probability of occurrence.For example, items such as, ‘No matter who I’mtalking to, I’m always a good listener’ or ‘I havenever deliberately said something that hurt some-one’s feelings’ make up the Marlowe–Crowne. Theoriginal Marlowe–Crowne scale has been criticizedby researchers as demonstrating weak discriminantability [17]. The Marlowe–Crowne form C shortform (consisting of 13 items derived from the
original Marlowe–Crowne social desirability scale)has been studied more extensively than otherMarlowe–Crowne short forms and appears to besuperior to all others [18].A measure of social desirability was included in
this study in order to provide evidence for discri-minant validity of the IWQOL-Lite. There is notime frame specified in the instructions for com-pletion of the Marlowe–Crowne.
Global ratingsSubjects were asked to make global ratings (usinga seven-point response scale, ranging from ‘notlimited at all’ to ‘severely limited’) in each of thefive content areas of the IWQOL-Lite, as well as aglobal rating of overall quality of life. There wasno time frame specified in the instructions forcompletion of the global ratings.
Hypotheses
We expected to find an association between totalscore on the IWQOL-Lite and other measures ofoverall health – global rating of overall quality oflife, and SF-36 general health, physical summary,and mental summary. The IWQOL-Lite physicalfunction scale was predicted to be associated withglobal ratings of physical function and with thefollowing SF-36 scales which measure physicalaspects of health: physical functioning, generalhealth, physical role, bodily pain, and physicalsummary. The IWQOL-Lite self-esteem scale waspredicted to be associated with measures related toself-esteem: global ratings of self-esteem, the RSEscale, and SF-36 role emotional, mental health,and mental summary scales. The IWQOL-Litesexual life scale was expected to be associated withglobal ratings of sexual functioning and sexualfunctioning ratings. The IWQOL-Lite public dis-tress scale was expected to be associated withglobal ratings of public distress and public distressratings. The IWQOL-Lite work scale was expectedto be associated with global ratings of work andwith SF-36 scales related to ability to performdaily responsibilities due to physical condition:physical role, vitality, general health, and physicalsummary. In addition, we predicted that the IW-QOL-Lite scales would not be strongly correlatedwith scores on the Marlowe–Crowne social desir-ability scale. While we were aware that overweight
160
and obese people are under some social pressure toconform to society’s standards regarding weightand appearance (and therefore, this may influencetheir scores on the social desirability scale), weexpected to find no more degree of relationshipbetween social desirability and IWQOL than be-tween social desirability and SF-36 due to the ro-bustness of the IWQOL, IWQOL-Lite and SF-36in previous research.
Data analysis
Internal consistency reliability coefficients werecomputed using Cronbach’s a. Test–retest reli-ability coefficients for the IWQOL-Lite werecomputed using intraclass correlations. Reliabilitycoefficients were computed first for all subjects andthen for overweight/obese subjects (BMI’s of 25and over). A 2 (Gender) by 5 (BMI group)ANOVA was used to examine differences in IW-QOL-Lite scores as a function of gender and BMI.Post-hoc tests for comparisons between BMIgroups were performed using Tukey’s honestlysignificant difference procedure [19] based on an acoefficient of 0.05. Construct validity was assessedby calculating Pearson correlations between IW-QOL-Lite scores and collateral measures for sub-jects with BMI’s of 25 and over.
Results
Body mass index
The average BMI for participants was 27.4 (SD:7.1; range: 18.6–73.0). BMI did not differ signifi-cantly by gender (mean BMI for females ¼ 27.1;SD: 7.3; mean BMI for males ¼ 28.0, SD: 6.7; t:1.40; df: 492; p ¼ 0:163). Two hundred twentyparticipants (44.5%) had a BMI less than 25, 146(29.6%) had a BMI between 25 and 29.9, 65(13.2%) had a BMI between 30 and 34.9, 38(7.7%) had a BMI between 35 and 39.9, and 25(5.1%) had a BMI of 40 or greater. The prevalenceof overweight (BMI between 25.0 and 29.9) andobesity (BMI greater than or equal to 30.0) in thissample is similar to that reported by the NationalCenter for Chronic Disease Prevention and HealthPromotion: 35% of US adults were reported asoverweight (vs. about 30% of our sample) and
27% of US adults were reported as obese (vs. 26%of our sample) [20].For the subset of participants who completed
the IWQOL-Lite a second time, the average BMIwas 27.9 (SD: 8.3; range: 18.9–69.6). Forty-six(41.1%) participants had a BMI less than 25, 34(30.4%) had a BMI between 25 and 29.9, 15(13.4%) had a BMI between 30 and 34.9, 9 (8.0%)had a BMI between 35 and 39.9, and 8 (7.1%) hada BMI of 40 or greater. The prevalence of over-weight and obesity in this subset was similar tothat of the total sample.
IWQOL-Lite scores
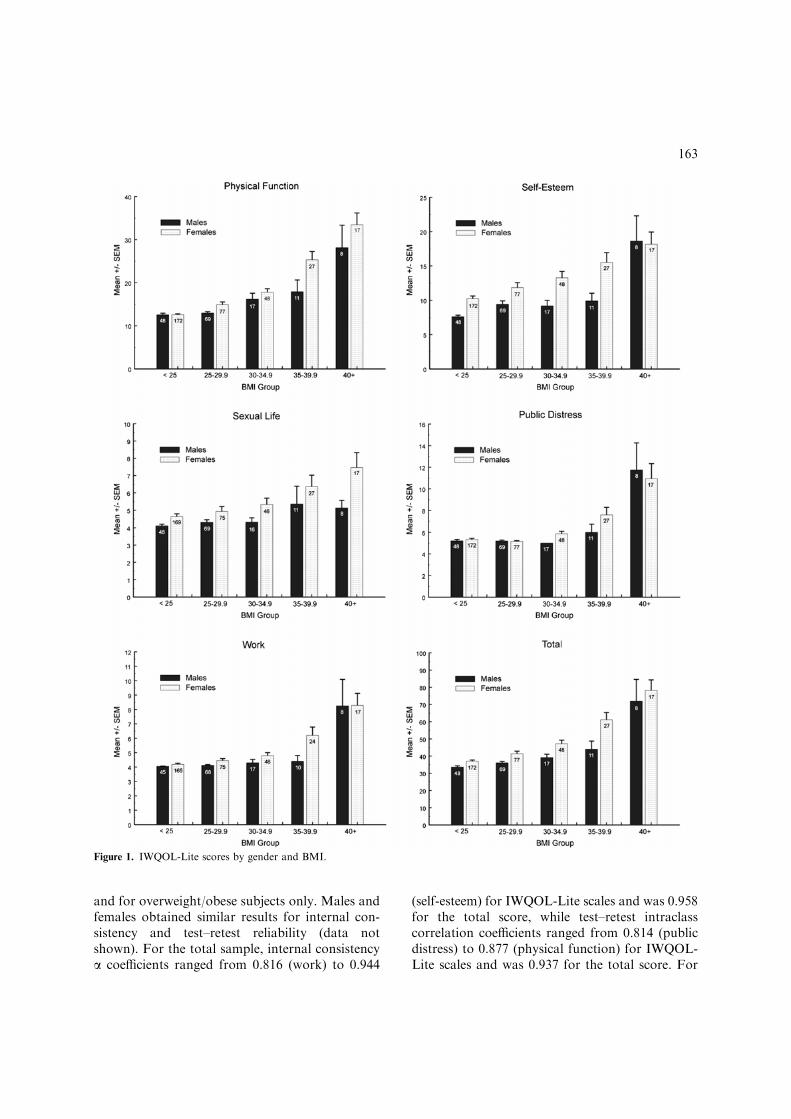
Table 1 presents IWQOL-Lite scale scores andtotal score separately by gender and BMI classifi-cation. Scores for this community sample areconsistently lower (better quality of life) than thosereported for treatment samples across comparablegender and BMI classes [8]. ANOVA revealedsignificant main effects for BMI on all five IWQOL-Lite scales (physical function: F ¼ 74:6,df ¼ 4484, p < 0:001; self-esteem: F ¼ 16:9, df ¼4484, p < 0:001; sexual life: F ¼ 6:2, df ¼ 4476,p < 0:001; public distress: F ¼ 51:5, df ¼ 4484,p < 0:001; work: F ¼ 41:4, df ¼ 4467, p < 0:001)and total score (F ¼ 56:8, df ¼ 4484, p < 0:001),with higher BMI associated with increasing im-pairment. Results of post-hoc tests for differencesbetween BMI groups revealed that, with the ex-ception of the sexual life scale, the 40þ BMI groupshowed significantly more impairment than allother BMI groups on all IWQOL-Lite scores.In addition, the 35–39.9 group was significantlymore impaired than lower BMI groups on all scalesexcept self-esteem. Finally, the 25–29.9 group didnot differ from the normal weight group (<25) onany scales or total score. Main effects for genderwere obtained for physical function (F ¼ 22:6,df ¼ 1484, p < 0:001), self-esteem (F ¼ 16:5,df ¼ 1484, p < 0:001), sexual life (F ¼ 14:6,df ¼ 1476, p < 0:001), work (F ¼ 8:1, df ¼ 1467,p ¼ 0:004), and total score (F ¼ 23:7, df ¼ 1484,p < 0:001), with females showing greater impair-ment than males. Finally, a significant BMI-by-gender interaction was obtained for physicalfunction (F ¼ 4:0, df ¼ 4484, p ¼ 0:003), where thelargest difference between females and males was inthe 35–39.9 category. Figure 1 presents graphs of
161

IWQOL-Lite scores by gender and BMI group.These graphs clearly depict the impact of increasingBMI upon diminished quality of life, particularly inthe higher BMI groups. The correlation be-tween BMI and IWQOL-Lite scores were: physi-cal function ¼ 0.681, self-esteem ¼ 0.370, sexuallife ¼ 0.281, public distress ¼ 0.518, work¼ 0.522,
and total score ¼ 0.615. All correlations were sig-nificant at p < 0:001.
IWQOL-Lite reliability
Table 2 presents reliability information for theIWQOL-Lite scales and total score for all subjects
Table 1. IWQOL-Lite scores by BMI and gender
IWQOL scale BMI
<25 25–29.9 30–34.9 35–39.9 40þ
Physical function
Females 12.6 ± 2.4 14.9 ± 5.6 17.8 ± 5.3 25.3 ± 10.0 33.5 ± 11.3
(172) (77) (48) (27) (17)
Males 12.5 ± 2.7 13.0 ± 2.6 16.2 ± 5.8 17.9 ± 9.0 28.1 ± 14.8
(48) (69) (17) (11) (8)
Total 12.6 ± 2.4a 14.0 ± 4.5a 17.4 ± 5.4b 23.2 ± 10.2c 31.8 ± 12.5d
(220) (146) (65) (38) (25)
Self-esteem
Females 10.3 ± 5.0 11.9 ± 6.2 13.3 ± 6.4 15.5 ± 7.4 18.2 ± 7.3
(172) (77) (48) (27) (17)
Males 7.6 ± 1.6 9.4 ± 4.1 9.2 ± 3.4 9.9 ± 3.8 18.6 ± 10.4
(48) (69) (17) (11) (8)
Total 9.7 ± 4.6a 10.7 ± 5.4a 12.2 ± 6.0ab 13.9 ± 7.0b 18.3 ± 8.2c
(220) (146) (65) (38) (25)
Sexual life
Females 4.6 ± 2.1 4.9 ± 2.4 5.3 ± 2.5 6.4 ± 3.4 7.5 ± 3.6
(169) (75) (46) (27) (17)
Males 4.1 ± 0.6 4.3 ± 1.3 4.3 ± 1.0 5.4 ± 3.4 5.1 ± 1.3
(48) (69) (16) (11) (8)
Total 4.5 ± 1.9a 4.6 ± 2.0a 5.1 ± 2.2a 6.1 ± 3.4b 6.7 ± 3.2b
(217) (144) (62) (38) (25)
Public distress
Females 5.3 ± 1.5 5.2 ± 0.5 5.9 ± 1.5 7.6 ± 3.6 10.9 ± 5.8
(172) (77) (48) (27) (17)
Males 5.2 ± 0.9 5.2 ± 0.7 5.0 ± 0.0 6.0 ± 2.4 11.8 ± 7.1
(48) (69) (17) (11) (8)
Total 5.3 ± 1.4a 5.2 ± 0.6a 5.7 ± 1.4a 7.1 ± 3.4b 11.2 ± 6.1c
(220) (146) (65) (38) (25)
Work
Females 4.2 ± 1.1 4.5 ± 1.2 4.8 ± 1.5 6.2 ± 2.8 8.3 ± 3.4
(165) (75) (48) (24) (17)
Males 4.0 ± 0.2 4.1 ± 0.4 4.3 ± 1.0 4.4 ± 1.3 8.3 ± 5.2
(45) (68) (17) (10) (8)
Total 4.2 ± 0.9a 4.3 ± 1.0a 4.7 ± 1.4a 5.7 ± 2.6b 8.3 ± 4.0c
(210) (143) (65) (34) (25)
IWQOL-Lite total
Females 37.1 ± 9.0 41.4 ± 12.8 47.2 ± 14.2 61.2 ± 21.5 78.3 ± 24.9
(172) (77) (48) (27) (17)
Males 33.6 ± 5.3 36.1 ± 7.4 39.2 ± 8.0 44.0 ± 15.8 71.9 ± 36.0
(48) (69) (17) (11) (8)
Total 36.3 ± 8.4a 38.9 ± 10.9a 45.1 ± 13.3b 56.2 ± 21.3c 76.2 ± 28.3d
(220) (146) (65) (38) (25)
Cell entries represent mean ± SD (n). Means with common subscripts are not significantly different based on Tukey’s hsd (p O 0:05).
162
and for overweight/obese subjects only. Males andfemales obtained similar results for internal con-sistency and test–retest reliability (data notshown). For the total sample, internal consistencya coefficients ranged from 0.816 (work) to 0.944
(self-esteem) for IWQOL-Lite scales and was 0.958for the total score, while test–retest intraclasscorrelation coefficients ranged from 0.814 (publicdistress) to 0.877 (physical function) for IWQOL-Lite scales and was 0.937 for the total score. For
Figure 1. IWQOL-Lite scores by gender and BMI.
163

the overweight/obese sub-sample, internal consis-tency coefficients ranged from 0.816 (work) to0.946 (self-esteem) for IWQOL-Lite scales and was0.962 for the total score, while test–retest intraclasscorrelation coefficients ranged from 0.840 (work)to 0.912 (sexual life) for IWQOL-Lite scales andwas 0.954 for total score. These data suggest thatthe reliability of the IWQOL-Lite scales and totalscore is excellent for both the total sample and theoverweight/obese participants.
Collateral measures
SF-36Table 3 presents SF-36 scores separately by genderand BMI classification, as well as US population
Table 2. Internal consistency and test–retest reliability for the
IWQOL-Lite
IWQOL
scale
Internal consistencya Test–retestb
All subjects BMIP25.0 All subjects BMIP25.0
N = 494 N = 274 N = 112 N = 66
Physical
function
0.935 0.940 0.877 0.898
Self-esteem 0.944 0.946 0.870 0.901
Sexual life 0.921 0.903 0.849 0.912
Public
distress
0.916 0.916 0.814 0.884
Work 0.816 0.816 0.857 0.840
Total 0.958 0.962 0.937 0.954
a a Coefficients.b Intraclass correlation coefficients.
Table 3. SF-36 scores by BMI and gender
SF-36 scale BMI
<25 25–29.9 30–34.9 35–39.9 40þ US Norms
Physical functioning
Females 93.3 ± 12.3 84.9 ± 23.5 82.8 ± 20.2 73.0 ± 22.2 62.7 ± 25.3 81.5 ± 24.6
(172) (77) (47) (27) (17) (1412)
Males 93.5 ± 13.5 91.7 ± 18.4 84.4 ± 24.9 83.2 ± 17.4 74.4 ± 28.3 87.2 ± 21.3
(48) (69) (17) (11) (8) (1055)
Total 93.4 ± 12.5a 88.1 ± 21.4ab 83.2 ± 21.4bc 75.9 ± 21.2c 66.4 ± 26.3d 84.2 ± 23.3
(220) (146) (64) (38) (25) (2474)
Role physical
Females 89.8 ± 25.5 87.2 ± 26.6 87.2 ± 26.5 78.7 ± 34.4 47.1 ± 40.4 77.8 ± 36.2
(172) (76) (47) (27) (17) (1412)
Males 95.8 ± 16.6 91.5 ± 21.9 86.8 ± 26.7 84.1 ± 32.2 78.1 ± 36.4 86.6 ± 30.9
(48) (68) (17) (11) (8) (1055)
Total 91.1 ± 23.9a 89.2 ± 24.5a 87.1 ± 26.4a 80.3 ± 33.5a 57.0 ± 41.2b 81.0 ± 34.0
(220) (144) (64) (38) (25) (2474)
Bodily pain
Females 77.2 ± 19.2 72.2 ± 23.8 67.5 ± 22.7 61.9 ± 25.3 51.8 ± 25.3 73.6 ± 24.3
(172) (77) (48) (27) (17) (1412)
Males 83.6 ± 15.2 78.0 ± 16.5 67.7 ± 28.2 72.7 ± 27.2 57.5 ± 25.5 76.9 ± 23.0
(47) (69) (17) (11) (8) (1055)
Total 78.6 ± 18.6a 74.9 ± 20.8ab 67.5 ± 24.1b 65.0 ± 26.0b 53.6 ± 25.0c 75.2 ± 23.7
(219) (146) (65) (38) (25) (2474)
General health
Females 74.9 ± 16.1 71.1 ± 18.8 66.3 ± 15.3 56.5 ± 21.2 52.4 ± 23.1 70.6 ± 21.5
(172) (77) (48) (27) (17) (1412)
Males 81.6 ± 16.8 77.2 ± 17.1 72.7 ± 15.6 72.3 ± 14.9 51.3 ± 29.5 73.5 ± 20.0
(47) (69) (17) (11) (8) (1055)
Total 76.3 ± 16.5a 74.0 ± 18.2a 67.9 ± 15.5ab 61.1 ± 20.7b 52.0 ± 24.7c 72.0 ± 20.3
(219) (146) (65) (38) (25) (2474)
Vitality
Females 60.3 ± 19.0 59.3 ± 19.9 58.8 ± 19.0 53.3 ± 23.6 45.0 ± 21.4 58.4 ± 21.5
(171) (77) (48) (27) (17) (1412)
Males 65.9 ± 18.9 67.5 ± 18.4 63.5 ± 18.6 68.2 ± 16.8 49.4 ± 30.1 63.6 ± 20.0
(47) (69) (17) (11) (8) (1055)
164

norms for comparison [12]. With increasing BMI,SF-36 scores tended to decrease as would be ex-pected [21]. At the lower BMI’s, SF-36 scores werecomparable to or better than the US populationnorms, whereas at the higher BMI’s SF-36 scoresfell below the norms.Correlations between SF-36 scores and IWQOL-
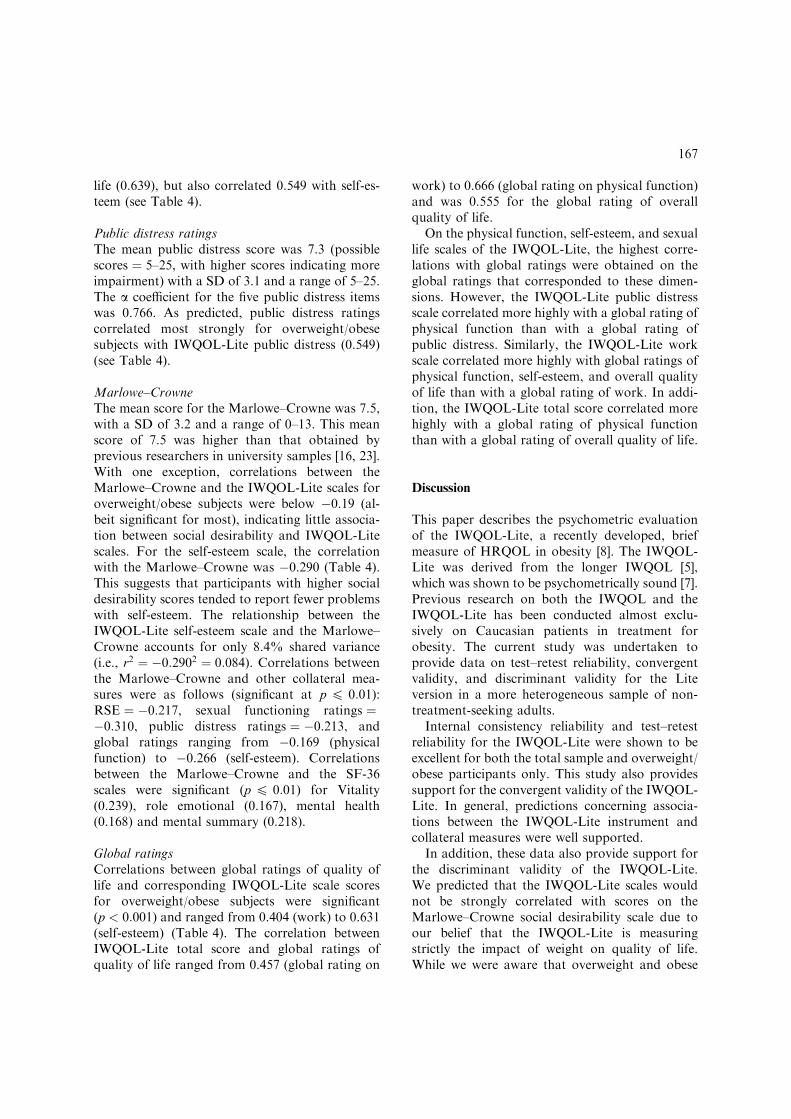
Lite scores for subjects with BMI’s of 25 and higher(i.e., overweight and obese subjects only) arepresented in Table 4. The pattern of correlations isgenerally consistent with the predictions above.
As predicted, the IWQOL-Lite total score corre-lated most strongly with general health (�0.579)and the physical summary score (�0.539) from theSF-36. However, the correlation between theIWQOL-Lite total score and the mental summaryscore from the SF-36 was lower (�0.332) than an-ticipated. Consistent with predictions, the physicalfunction score from the IWQOL-Lite correlatedgreater than 0.50 (absolute value) with the physicalsummary score (�0.674), physical functioning(�0.553), general health (�0.582), bodily pain
Table 3. (Continued)
SF-36 scale BMI
<25 25–29.9 30–34.9 35–39.9 40þ US Norms
Total 61.5 ± 19.1a 63.2 ± 19.6a 60.0 ± 18.9a 57.6 ± 22.7a 46.4 ± 24.0b 60.9 ± 21.0
(218) (146) (65) (38) (25) (2474)
Social functioning
Females 86.2 ± 18.4 85.2 ± 19.5 84.0 ± 18.7 73.3 ± 28.3 70.7 ± 26.2 81.5 ± 23.7
(172) (77) (48) (27) (17) (1412)
Males 87.9 ± 20.9 90.9 ± 15.9 83.2 ± 19.2 79.7 ± 24.4 82.9 ± 29.1 85.2 ± 21.3
(47) (69) (17) (11) (8) (1055)
Total 86.6 ± 18.9a 87.9 ± 18.1a 83.8 ± 18.7ab 75.1 ± 27.0b 74.6 ± 27.1b 83.3 ± 22.7
(219) (146) (65) (38) (25) (2474)
Role emotional
Females 78.1 ± 36.0 82.5 ± 32.0 83.7 ± 28.6 85.2 ± 25.1 60.7 ± 41.3 79.5 ± 34.4
(172) (76) (47) (27) (17) (1412)
Males 84.0 ± 33.7 87.9 ± 28.6 86.3 ± 29.0 78.8 ± 40.2 83.3 ± 31.0 83.3 ± 31.3
(48) (69) (17) (11) (8) (1055)
Total 79.4 ± 35.5a 85.1 ± 30.4a 84.4 ± 28.5a 83.3 ± 29.8a 67.9 ± 39.2a 81.3 ± 33.0
(220) (145) (64) (38) (25) (2474)
Mental health
Females 74.8 ± 16.0 76.1 ± 15.4 76.7 ± 15.8 76.7 ± 14.3 70.1 ± 16.1 73.3 ± 18.7
(171) (77) (48) (27) (17) (1412)
Males 76.9 ± 18.9 80.5 ± 13.2 79.1 ± 11.8 84.0 ± 15.8 72.0 ± 24.8 76.4 ± 17.2
(47) (69) (17) (11) (8) (1055)
Total 75.2 ± 16.7a 78.2 ± 14.5a 77.3 ± 14.8a 78.8 ± 14.9a 70.7 ± 18.8a 74.7 ± 18.1
(218) (146) (65) (38) (25) (2474)
Physical summary
Females 53.3 ± 6.5 50.0 ± 8.8 48.0 ± 6.9 43.3 ± 11.5 38.3 ± 12.5 50 ± 10
(171) (76) (47) (27) (17) (1412)
Males 55.1 ± 5.5 52.3 ± 6.3 48.8 ± 10.6 48.8 ± 7.8 42.9 ± 12.6 50 ± 10
(47) (68) (17) (11) (8) (1055)
Total 53.7 ± 6.3a 51.1 ± 7.8ab 48.3 ± 8.0bc 44.9 ± 10.8 c 39.8 ± 12.4 d 50 ± 10
(218) (144) (64) (38) (25) (2474)
Mental summary
Females 48.5 ± 10.2 50.5 ± 9.3 51.3 ± 9.2 50.8 ± 9.1 47.2 ± 9.3 50 ± 10
(171) (76) (47) (27) (17) (1412)
Males 50.1 ± 11.4 52.7 ± 9.0 52.2 ± 7.9 52.6 ± 10.8 50.1 ± 12.9 50 ± 10
(47) (68) (17) (11) (8) (1055)
Total 48.8 ± 10.5a 51.5 ± 9.2a 51.5 ± 8.8a 51.4 ± 9.5a 48.2 ± 10.4a 50 ± 10
(218) (144) (64) (38) (25) (2474)
Cell entries represent mean ± SD (n). US population norms obtained from Ware, et al. [12]; Means with common subscripts are not
significantly different based on Tukey’s hsd (p O 0:05).
165
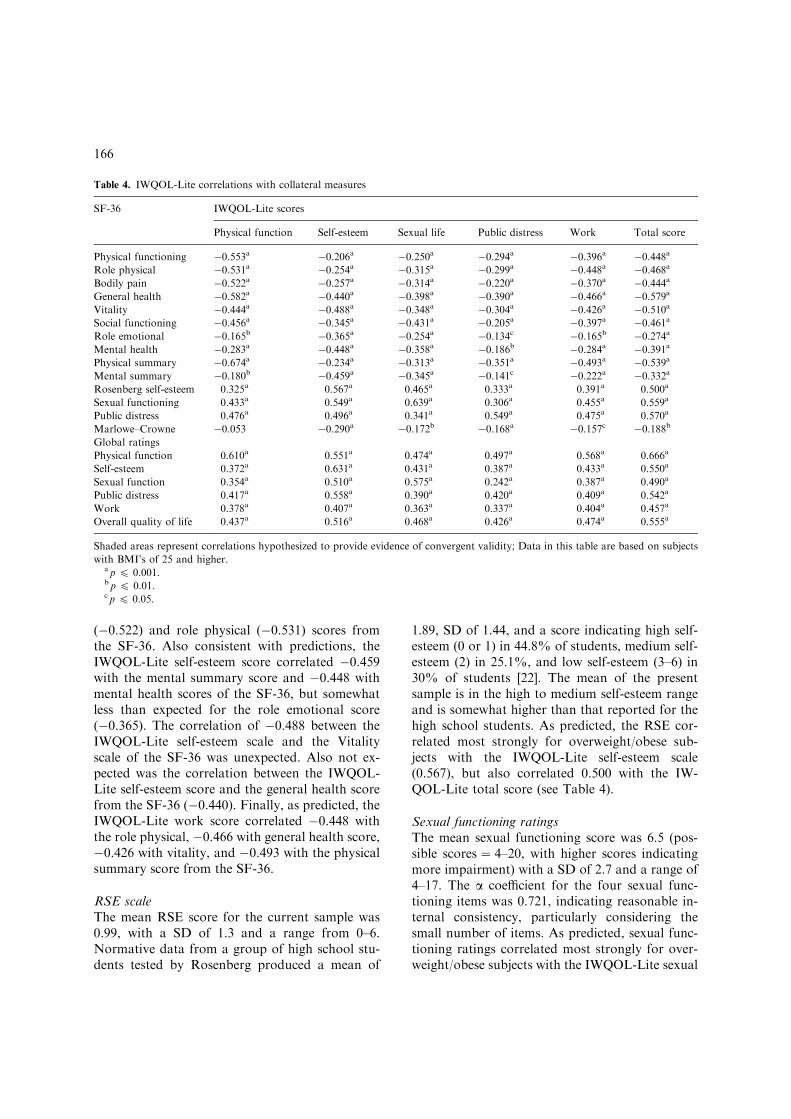
(�0.522) and role physical (�0.531) scores fromthe SF-36. Also consistent with predictions, theIWQOL-Lite self-esteem score correlated �0.459with the mental summary score and �0.448 withmental health scores of the SF-36, but somewhatless than expected for the role emotional score(�0.365). The correlation of �0.488 between theIWQOL-Lite self-esteem scale and the Vitalityscale of the SF-36 was unexpected. Also not ex-pected was the correlation between the IWQOL-Lite self-esteem score and the general health scorefrom the SF-36 (�0.440). Finally, as predicted, theIWQOL-Lite work score correlated �0.448 withthe role physical, �0.466 with general health score,�0.426 with vitality, and �0.493 with the physicalsummary score from the SF-36.
RSE scaleThe mean RSE score for the current sample was0.99, with a SD of 1.3 and a range from 0–6.Normative data from a group of high school stu-dents tested by Rosenberg produced a mean of
1.89, SD of 1.44, and a score indicating high self-esteem (0 or 1) in 44.8% of students, medium self-esteem (2) in 25.1%, and low self-esteem (3–6) in30% of students [22]. The mean of the presentsample is in the high to medium self-esteem rangeand is somewhat higher than that reported for thehigh school students. As predicted, the RSE cor-related most strongly for overweight/obese sub-jects with the IWQOL-Lite self-esteem scale(0.567), but also correlated 0.500 with the IW-QOL-Lite total score (see Table 4).
Sexual functioning ratingsThe mean sexual functioning score was 6.5 (pos-sible scores ¼ 4–20, with higher scores indicatingmore impairment) with a SD of 2.7 and a range of4–17. The a coefficient for the four sexual func-tioning items was 0.721, indicating reasonable in-ternal consistency, particularly considering thesmall number of items. As predicted, sexual func-tioning ratings correlated most strongly for over-weight/obese subjects with the IWQOL-Lite sexual
Table 4. IWQOL-Lite correlations with collateral measures
SF-36 IWQOL-Lite scores
Physical function Self-esteem Sexual life Public distress Work Total score
Physical functioning �0.553a �0.206a �0.250a �0.294a �0.396a �0.448aRole physical �0.531a �0.254a �0.315a �0.299a �0.448a �0.468aBodily pain �0.522a �0.257a �0.314a �0.220a �0.370a �0.444aGeneral health �0.582a �0.440a �0.398a �0.390a �0.466a �0.579aVitality �0.444a �0.488a �0.348a �0.304a �0.426a �0.510aSocial functioning �0.456a �0.345a �0.431a �0.205a �0.397a �0.461aRole emotional �0.165b �0.365a �0.254a �0.134c �0.165b �0.274aMental health �0.283a �0.448a �0.358a �0.186b �0.284a �0.391aPhysical summary �0.674a �0.234a �0.313a �0.351a �0.493a �0.539aMental summary �0.180b �0.459a �0.345a �0.141c �0.222a �0.332aRosenberg self-esteem 0.325a 0.567a 0.465a 0.333a 0.391a 0.500a
Sexual functioning 0.433a 0.549a 0.639a 0.306a 0.455a 0.559a
Public distress 0.476a 0.496a 0.341a 0.549a 0.475a 0.570a
Marlowe–Crowne �0.053 �0.290a �0.172b �0.168a �0.157c �0.188bGlobal ratings
Physical function 0.610a 0.551a 0.474a 0.497a 0.568a 0.666a
Self-esteem 0.372a 0.631a 0.431a 0.387a 0.433a 0.550a
Sexual function 0.354a 0.510a 0.575a 0.242a 0.387a 0.490a
Public distress 0.417a 0.558a 0.390a 0.420a 0.409a 0.542a
Work 0.378a 0.407a 0.363a 0.337a 0.404a 0.457a
Overall quality of life 0.437a 0.516a 0.468a 0.426a 0.474a 0.555a
Shaded areas represent correlations hypothesized to provide evidence of convergent validity; Data in this table are based on subjects
with BMI’s of 25 and higher.a p 6 0.001.b p 6 0.01.c p 6 0.05.
166
life (0.639), but also correlated 0.549 with self-es-teem (see Table 4).
Public distress ratingsThe mean public distress score was 7.3 (possiblescores ¼ 5–25, with higher scores indicating moreimpairment) with a SD of 3.1 and a range of 5–25.The a coefficient for the five public distress itemswas 0.766. As predicted, public distress ratingscorrelated most strongly for overweight/obesesubjects with IWQOL-Lite public distress (0.549)(see Table 4).
Marlowe–CrowneThe mean score for the Marlowe–Crowne was 7.5,with a SD of 3.2 and a range of 0–13. This meanscore of 7.5 was higher than that obtained byprevious researchers in university samples [16, 23].With one exception, correlations between theMarlowe–Crowne and the IWQOL-Lite scales foroverweight/obese subjects were below �0.19 (al-beit significant for most), indicating little associa-tion between social desirability and IWQOL-Litescales. For the self-esteem scale, the correlationwith the Marlowe–Crowne was �0.290 (Table 4).This suggests that participants with higher socialdesirability scores tended to report fewer problemswith self-esteem. The relationship between theIWQOL-Lite self-esteem scale and the Marlowe–Crowne accounts for only 8.4% shared variance(i.e., r2 ¼ �0:2902 ¼ 0:084). Correlations betweenthe Marlowe–Crowne and other collateral mea-sures were as follows (significant at p O 0:01):RSE ¼ �0.217, sexual functioning ratings ¼�0.310, public distress ratings ¼ �0.213, andglobal ratings ranging from �0.169 (physicalfunction) to �0.266 (self-esteem). Correlationsbetween the Marlowe–Crowne and the SF-36scales were significant (p O 0:01) for Vitality(0.239), role emotional (0.167), mental health(0.168) and mental summary (0.218).
Global ratingsCorrelations between global ratings of quality oflife and corresponding IWQOL-Lite scale scoresfor overweight/obese subjects were significant(p < 0:001) and ranged from 0.404 (work) to 0.631(self-esteem) (Table 4). The correlation betweenIWQOL-Lite total score and global ratings ofquality of life ranged from 0.457 (global rating on
work) to 0.666 (global rating on physical function)and was 0.555 for the global rating of overallquality of life.On the physical function, self-esteem, and sexual
life scales of the IWQOL-Lite, the highest corre-lations with global ratings were obtained on theglobal ratings that corresponded to these dimen-sions. However, the IWQOL-Lite public distressscale correlated more highly with a global rating ofphysical function than with a global rating ofpublic distress. Similarly, the IWQOL-Lite workscale correlated more highly with global ratings ofphysical function, self-esteem, and overall qualityof life than with a global rating of work. In addi-tion, the IWQOL-Lite total score correlated morehighly with a global rating of physical functionthan with a global rating of overall quality of life.
Discussion
This paper describes the psychometric evaluationof the IWQOL-Lite, a recently developed, briefmeasure of HRQOL in obesity [8]. The IWQOL-Lite was derived from the longer IWQOL [5],which was shown to be psychometrically sound [7].Previous research on both the IWQOL and theIWQOL-Lite has been conducted almost exclu-sively on Caucasian patients in treatment forobesity. The current study was undertaken toprovide data on test–retest reliability, convergentvalidity, and discriminant validity for the Liteversion in a more heterogeneous sample of non-treatment-seeking adults.Internal consistency reliability and test–retest
reliability for the IWQOL-Lite were shown to beexcellent for both the total sample and overweight/obese participants only. This study also providessupport for the convergent validity of the IWQOL-Lite. In general, predictions concerning associa-tions between the IWQOL-Lite instrument andcollateral measures were well supported.In addition, these data also provide support for
the discriminant validity of the IWQOL-Lite.We predicted that the IWQOL-Lite scales wouldnot be strongly correlated with scores on theMarlowe–Crowne social desirability scale due toour belief that the IWQOL-Lite is measuringstrictly the impact of weight on quality of life.While we were aware that overweight and obese
167

people are under some social pressure to conformto society’s standards regarding weight and ap-pearance (and therefore, this may influence theirscores on the social desirability scale), we expectedto find no more degree of relationship betweensocial desirability and IWQOL than between socialdesirability and SF-36 due to the robustness of theIWQOL, IWQOL-Lite and SF-36 in previous re-search. In the present study, the IWQOL-Liteshowed relatively low relationships with the Mar-lowe–Crowne social desirability Scale. Only thecorrelation between social desirability and IW-QOL-Lite self-esteem was above 0.20. Social de-sirability scores correlated to a similar extent withother measures of quality of life. For example,correlations between SF-36 scales and the Mar-lowe–Crowne social desirability scale (between0.167 and 0.239 for four of the 10 scales) andcorrelations between RSE and the Marlowe–Crowne social desirability scale (0.217) werecomparable to those observed between the IW-QOL-Lite and the Marlowe–Crowne. To furtherdemonstrate discriminant validity, we expectednon-shaded correlations between scales of theIWQOL-Lite and collateral measures in Table 4 tobe lower than the shaded ones (where shadedcorrelations represent those we hypothesized to bestrong a priori). In most cases, we did indeed findlower correlations in the non-shaded cells of thetable. For example, the RSE scale had the highestcorrelation with the self-esteem scale of the IW-QOL-Lite and lower correlations with other scalesof the IWQOL-Lite. Similarly, sexual functioningand public distress ratings correlated moststrongly with their respective IWQOL-Lite scalesand to a lesser degree with the other IWQOL-Litescales. On the global ratings of quality of life, thehighest correlations for IWQOL-Lite scales oc-curred for their corresponding scales for three ofthe five scales (physical function, self-esteem, andsexual life), providing evidence of discriminantvalidity for those three scales. When examiningcorrelations between the SF-36 scales and theIWQOL-Lite scales, we found that most non-shaded correlations were lower than the shadedones. Taken together, this pattern of results gen-erally supported the discriminant validity of theIWQOL-Lite.In the present study, as in previous research on
the IWQOL-Lite in a primarily clinical population
[8], high to moderate correlations were found be-tween BMI and IWQOL-Lite scores. In addition,analyses of variance revealed significant main ef-fects for BMI for all five scales of the IWQOL-Liteand total score (p < 0:001), with higher BMI as-sociated with increasing impairment. This findingof poorer HRQOL in individuals with higherBMI’s is consistent with previous reports of pop-ulation studies [24–30] and treatment studies [21,31]. As would be expected with an obesity-specificinstrument, the IWQOL-Lite differentiated be-tween BMI groups better than the SF-36. For ex-ample, individuals in the 40þ BMI group weresignificantly more impaired than those in the 35–39.9 group on five out of six IWQOL-Lite scoresbut only six of 10 SF-36 scales. Similarly, indi-viduals in the 35–39.9 BMI group were more im-paired than those in the 30–34.9 group on five outof six IWQOL-Lite scores but did not differ on anySF-36 scales.When exploring gender differences on the IW-
QOL-Lite, we found that women experienced theeffects of their weight more profoundly than didmen on five out of six IWQOL-Lite scales (all ex-cept public distress). This finding is consistent withwhat is generally known about gender differencesand body image [32]. In previous research on theIWQOL-Lite, women experienced more impairedHRQOL than men, but only on sexual life, self-esteem, and total score [8]. It is unclear whether thisdifferent pattern of results reflects true differencesbetween community and treatment-seeking sam-ples, or is merely the result of a much larger samplesize in the earlier study. In any case, it is importantto assess men and women separately when evalu-ating the impact of weight on quality of life. Twoother obesity-specific quality of life instrumentsshowed more impaired quality of life for women vs.men – obesity-related well-being scale (ORWELL97) [33] and obesity-related psychosocial problems(OP) [34]. Similarly, overweight/obese women hadlower SF-36 scores than overweight/obese men in asurvey of patients with chronic medical and psy-chiatric conditions [35]. In addition, overweight/obesity in a general population sample was asso-ciated with major depression and suicidal behav-iors for women but not for men [36].Comparison of the IWQOL-Lite scores for the
present community sample with those reported fora sample consisting primarily of participants in
168

weight reduction programs [8] suggests that thecommunity sample scores are consistently lower(i.e., less impaired) across comparable BMI andgender classifications. This is consistent with pre-vious findings of more impaired HRQOL atbaseline for treatment-seeking overweight indi-viduals than for individuals of comparable BMIwho are not seeking treatment [31]. Since theIWQOL-Lite is intended as a tool for assessingchanges in a clinical population, one might askwhether the results of the present study are gen-eralizable to those of a clinical sample. Since theresults of the present study, using a communitysample, are very similar to those obtained using aprimarily clinical sample [8], we believe that theIWQOL-Lite is applicable to any sample of over-weight or obese persons. While most users of thisinstrument would be studying a clinical sample, itis conceivable that some researchers would bestudying a non-clinical sample of overweight per-sons (e.g., an epidemiologist studying the impactof weight in a particular geographic location orsocioeconomic group; or researchers comparingthe impact of weight on quality of life for personsin treatment versus persons not in treatment).As in the previous study of the IWQOL-Lite
with a clinical sample [8], this study found nostatistically significant differences between theoverweight group (BMI between 25 and 29.9) andthe normal weight group (BMI less than 25).However, the IWQOL-Lite mean scores wereslightly higher (indicating poorer quality of life) inthe overweight group. Also consistent with previ-ous studies, the current study demonstrates thatIWQOL-Lite scores (particularly physical functionand total score) increase exponentially with in-creasing BMI. This suggests that the IWQOL-Litemay be most useful in the upper ranges of thescale, i.e. in those circumstances in which qualityof life is most impaired. Researchers who are in-terested in assessing changes in HRQOL associ-ated with weight loss treatment for persons with aBMI between 25 and 29.9 will require a largesample size in order to demonstrate statisticallysignificant improvements.A limitation of this study is that BMI groupings
are based on self-reported weights and heights.Previous research has found that self-reportedweights may be inaccurate [37], and heavier indi-viduals misreport their weight to a greater extent
than lighter persons [38, 39]. Furthermore, heighttends to be overestimated along with the tendencyto underestimate weight [40]. As a result, actualBMI values may be underestimated in the currentstudy. However, the prevalence of overweight andobesity in this sample is similar to that reported bythe National Center for Chronic Disease Preven-tion and Health Promotion, and the correlations ofBMI with IWQOL-Lite scores in the current studyare comparable to those reported in previous re-search [20]. This suggests that the self-report biashas not dramatically affected the obtained BMIvalues and the overall relationship between BMIand quality of life scores. Of interest, a study ex-amining social desirability scores in young men andwomen (mean age 28.3) of non-overweight status(mean BMI between 22.4 and 24.3) found thatwomen highest in the tendency to score in sociallydesirable ways were most likely to underreporttheir weight [41]. Since our sample had a highermean Marlowe–Crowne score than that obtainedin university samples by other researchers, it ispossible that our subjects, particularly women, hada tendency to underreport their weight.Another limitation of this study is that some
correlations between IWQOL-Lite scales and col-lateral measures were unexpectedly high. For ex-ample, the public distress scale of the IWQOL-Litecorrelated more highly with the global rating ofphysical function than with the global rating ofpublic distress and the work scale of the IWQOL-Lite correlated more highly with the global ratingof physical function than with the global rating ofwork. A possible explanation we have for thisfinding is that the time reference in the IWQOL-Lite instructions was for the past week, whereasthere was no time reference in the instructions forthe global ratings. In addition, we also foundhigher than expected correlations between IW-QOL-Lite self-esteem scores and SF-36 generalhealth and vitality and between the RSE scale andIWQOL-Lite total score. Regarding the relation-ship between IWQOL-Lite self-esteem and SF-36scores, in retrospect this relationship should not beunexpected. Correlations between medical out-comes study (MOS) measures of psychologicaldistress and SF-36 general health are approxi-mately �0.40, and between psychological distressand SF-36 vitality range from �0.51 to �0.56 [12].Since the IWQOL-Lite self-esteem score is in some
169

ways a measure of psychological distress, thesecorrelations with the SF-36 make sense. Regardingthe relationship between IWQOL-Lite total scoreand RSE, it is possible that self-esteem serves aprotective function to minimize the impact ofweight on quality of life in general.The current study was undertaken because of
the absence of data on test–retest reliability andconvergent/discriminant validity for this newlydeveloped Lite version of the IWQOL. Further-more, previous research on the IWQOL-Lite wasbased on participants’ responses to the original setof 74 IWQOL items, rather than to the 31-itemformat. Overall, psychometric properties of theIWQOL-Lite appear to be quite strong. This studydemonstrates that the IWQOL-Lite is a valid andreliable obesity-specific questionnaire that can beincluded in a clinical trial to measure the HRQOLimpact of new treatments for obesity. Data arecurrently being collected on the IWQOL-Lite inseveral placebo-controlled randomized clinicaltrials (both pharmacological and behavioral) andin clinical treatment programs. Future research isbeing planned that will develop norms for sub-groups, establish clinically meaningful changescores, and determine the psychometric propertiesof this instrument in other languages and cultures.
Acknowledgements
Financial support for this project was provided byGlaxo Smith Kline. We would like to thankKenneth Crews, Kathleen Meter, Carol Beebee,Che Che Casto, and Marya Mc Neish for theirassistance with data collection.
References
1. Spilker B. Introduction. In: Spilker B (ed), Quality of Life
and Pharmeconomics in Clinical Trials. 2nd ed. Philadel-
phia: Lippincott-Raven Publishers, 1996: p 1–10.
2. Testa MA, Simonson DC. Assessment of quality of life
outcomes. N Engl J Med 1996; 334: 833–840.
3. Guyatt GH, Feeny DH, Patrick DL. Measuring health-
related quality of life. Ann Int Med 1993; 118: 622–629.
4. Guyatt GH, Jaeschke R, Feeny DH, Patrick DL. Mea-
surements in clinical trials: Choosing the right approach.
In: Spilker B (ed), Quality of Life and Pharmacoeconomics
in Clinical Trials. 2nd ed. Philadelphia: Lippincott-Raven
Publishers, 1996: p 41–48.
5. Kolotkin RL, Head S, Hamilton MA, Tse CTJ. Assessing
impact of weight on quality of life. Obes Res 1995; 3: 49–
56.
6. Kolotkin RL, Meter K, Williams GR. Quality of life and
obesity. Obes Rev 2001; 2: 219–229.
7. Kolotkin RL, Head S, Brookhart A. Construct validity of
the impact of weight on quality of life questionnaire. Obes
Res 1997; 5: 434–441.
8. Kolotkin RL, Crosby RD, Kosloski KD, Williams GR.
Development of a brief measure to assess quality of life in
obesity. Obes Res 2001; 9: 102–111.
9. Kolotkin RL, Crosby RD, Williams GR, Hartley GG,
Nicol S. The relationship between health-related quality of
life and weight loss. Obes Res 2001; 9: 564–571.
10. Kolotkin RL, Crosby RD, Williams G. Health-related
quality of life varies among obese sub-groups. Obes Res
2001; 9: 58S.
11. National Institute of Health: The Practical Guide: Identi-
fication, Evaluation, and Treatment of Overweight and
Obesity in Adults. October, 2000, Publication number 00-
4084.
12. Ware J, Snow K, Kosinski M, Gandek B. SF-36 Health
Survey: Manual and Interpretation Guide. Boston: The
Health Institute, New England Medical Center, 1993.
13. Rosenberg M. Society and the Adolescent Self-Image.
Princeton: Princeton University Press, 1965.
14. Kolotkin RL, Woolley JM, Hays RD, Shi J, Globe D.
Development and reliability of the obesity quality of life
instrument (OBQOL). Obes Res 1999; 7: 42S.
15. Crowne DP, Marlowe D. A new scale of social desirability
independent of psychpathology. J Cons Psychol 1960; 24:
349–354.
16. Reynolds WM. Development of reliable and valid short
forms of the Marlowe–Crowne social desirability scale.
J Clin Psychol 1982; 38: 119–125.
17. Ballard R, Crino MD, Rubenfeld S. Social desirability re-
sponse bias and the Marlowe–Crowne social desirability
scale. Psychol Rep 1988; 63: 227–237.
18. Zook A, Sipps GJ. Cross-validation of a short form of the
Marlowe–Crowne social desirability scale. J Clin Psychol
1985; 41: 236–238.
19. Winer BJ. Statistical Principles in Experimental Design 2nd
ed. New York: McGraw-Hill, 1971.
20. Obesity and Overweight: A Public Health Epidemic. Na-
tional Center for Chronic Disease Prevention and Health
Promotion. [WWW document]. URL http://www.cdc.gov/
nchs/data/nhis/measure06.pdf.
21. Fontaine KR, Cheskin LJ, Barofsky I. Health-related
quality of life in obese persons seeking treatment. J Fam
Pract 1996; 43: 265–270.
22. Wylie RC. Measures of Self-Concept. Lincoln: University
of Nebraska Press, 1989.
23. Ballard R. Short forms of the Marlowe–Crowne social
desirability scale. Psychol Rep 1992; 71: 1155–1160.
24. Brown WJ, Dobson AJ, Mishra G. What is a healthy
weight for middle aged women? Int J Obes 1998; 22: 520–
528.
25. Sullivan M, Karlsson J, Sjostrom L, Taft C. Why quality of
life measures should be used in the treatment of patients
170

with obesity. In: Bjorntorp P (ed), International Textbook
of Obesity. New York: John Wiley & Sons, 2001.
26. Fine JT, Colditz GA, Coakley EH, et al. A prospective
study of weight change and health-related quality of life in
women. JAMA 1999; 282: 2136–2142.
27. Doll HA, Petersen SEK, Stewart-Brown SL. Obesity and
physical and emotional well-being: Associations between
body mass index, chronic illness, and the physical and
mental components of the SF-36 questionnaire. Obes Res
2000; 8: 160–170.
28. LePen C, Levy E, Loos F, Banzet M, Basdevant A. ‘Spe-
cific’ scale compared with ‘generic’ scale: A double mea-
surement of the quality of life in a French community
sample of obese subjects. J Epidemiol Commun Hlth 1998;
52: 445–450.
29. Ford ES, Moriarty DG, Zack MM, Mokdad AH, Chap-
man DP. Self-reported body mass index and health-related
quality of life: Findings from the Behavioral Risk Factor
Surveillance System. Obes Res 2001; 9: 21–31.
30. Richards MM, Adams TD, Hunt SC. Functional status and
emotional well-being, dietary intake, and physical activity of
severely obese subjects. J Am Diet Assoc 2000; 100: 67–75.
31. Fontaine KR, Bartlett SJ, Barofsky I. Health-related
quality of life among obese persons seeking and not cur-
rently seeking treatment. Int J Eat Dis 2000; 27: 101–105.
32. Striegel-Moore R, McAvay G, Rodin J. Psychological and
behavioral correlates of feeling fat in women. Int J Eat
Disord 1986; 5: 935–947.
33. Mannucci E, Ricca V, Barciulli E, Di Bernardo M, Trav-
aglini R, Cabras P, Rotella C. Quality of life and overweight:
The obesity related well-being (Orwell97) questionnaire.
Add Beh 1999; 24: 345–357.
34. Sullivan M, Karlsson J, Sjostrom L, Backman L, Bengtsson
C, Bouchard C, Dahlgren S, Jonsson E, Larsson B, Lind-
stedt S, Naslund I, Olbe L, Wedel H. Swedish obese sub-
jects (SOS) – an intervention study of obesity. Baseline
evaluation of health and psychosocial functioning in the
first 1743 subjects examined. Int J of Obes 1993; 1743: 503–
512.
35. Katz D, McHorney C, Atkinson R. Impact of obesity on
health-related quality of life in patients with chronic illness.
J Gen Int Med 2000; 15: 789–796.
36. Carpenter KM, Hasin DS, Allison DB, Faith MS. Rela-
tionships between obesity and DSM-IV major depressive
disorder, suicide ideation, and suicide attempts: Results
from a general population study. Am J Pub Health 2000;
90: 251–257.
37. Kuskowska-Wolk A, Bergstrom R, Bostrom G. Relation-
ship between questionnaire data and medical records of
height, weight, and body mass index. Int J Obes Rel Met
Dis 1992; 16: 1–9.
38. Rowland ML. Self-reported weight and height. Am J Clin
Nutr 1990; 52: 1125–1133.
39. DelPrete LR, Caldwell M, English C, Banspach SW, Le-
febvre C. Self-reported and measured weights and heights
of participants in community-based weight loss programs.
J Am Diet Assoc 1992; 92: 1483–1486.
40. Niedhammer I, Bugel I, Bonenfant S, Goldberg M, Leclerc
A. Validity of self-reported weight and height in the French
GAZEL cohort. Int J Obes 2000; 24: 1111–1118.
41. Larson MR. Social desirability and self-reported weight
and height. Int J Obes 2000; 24: 663–665.
Address for correspondence: Ronette L. Kolotkin, Ph.D., 1004
Norwood Avenue, Durham, NC 27707, USA
Phone: +1-919-493-9995; Fax: +1-919-493-9925
E-mail: [email protected]
171