psychometric evaluation of anxiety, depression, and sleep
TRANSCRIPT
Research ArticlePsychometric Evaluation of Anxiety, Depression, and SleepQuality after a Mild Traumatic Brain Injury: A Longitudinal Study
Hon-Ping Ma,1,2,3 Po-Shen Chen,1 Chung-Shun Wong,1,2 Cheng-Fu Chang,4,5 Ju-Chi Ou,1
Yan-Rou Tsai,6,7 Wen-Ta Chiu,7,8 Shin-Han Tsai,1,7,8 Kuo-Hsing Liao ,7,9
Yung-Hsiao Chiang ,5,6,7,10 Jia-Yi Wang,11 Kai-Yun Chen ,6,7
and John Chung-Che Wu 5,7,10
1Department of Emergency Medicine, Shuang Ho Hospital, Taipei Medical University, New Taipei City, Taiwan2Department of Emergency Medicine, School of Medicine, Taipei Medical University, Taipei, Taiwan3Graduate Institute of Injury Prevention and Control, Taipei Medical University, Taipei, Taiwan4Department of Neurosurgery, Taipei City Hospital, Zhongxiao Branch, Taiwan5Department of Surgery, College of Medicine, Taipei Medical University, Taipei, Taiwan6Graduate Institute of Neural Regenerative Medicine, College of Medical Science and Technology, Taipei, Taiwan7Center for Neurotrauma and Neuroregeneration, Taipei Medical University, Taipei, Taiwan8Institute of Injury Prevention and Control, College of Public Health and Nutrition, Taipei Medical University, Taipei, Taiwan9Department of Neurosurgery, Wan Fang Hospital, Taipei Medical University, Taipei, Taiwan10Department of Neurosurgery, Taipei Medical University Hospital, Taipei, Taiwan11Graduate Institute of Medical Sciences, College of Medicine, Taipei Medical University, Taipei, Taiwan
Correspondence should be addressed to Kai-Yun Chen; [email protected] and John Chung-Che Wu; [email protected]
Received 10 September 2018; Accepted 22 January 2019; Published 14 April 2019
Academic Editor: Norbert Kovács
Copyright © 2019 Hon-Ping Ma et al. This is an open access article distributed under the Creative Commons Attribution License,which permits unrestricted use, distribution, and reproduction in any medium, provided the original work is properly cited.
Introduction. Over 1 million mild traumatic brain injury (mTBI) cases are reported annually worldwide andmay result in cognitive,physical, and emotional deterioration; depression; anxiety; and sleep problems. However, studies on long-term mTBI effects arelimited. This study included 440 patients, and regular follow-ups of psychological assessments were performed for 2 years. Fourquestionnaires, including the Pittsburgh sleep quality index (PSQI), Epworth sleepiness scale (ESS), Beck’s anxiety inventory(BAI), and Beck’s depression inventory (BDI), were used to evaluate sleep problems, daytime sleepiness, anxiety, and depression,respectively. Results show that BAI and BDI scores considerably improved at the 6th-week, 1st-year, and 2nd-year follow-upscompared to baseline, yet these remained significantly different. In addition, anxiety and depression were prominent symptomsin a select subgroup of patients with poor initial evaluations, which improved over the 2 years. However, the ESS and PSQI scoresfluctuated only mildly over the same time span. In conclusion, the mTBI patients showed a gradual improvement of anxiety anddepression over the 2 years following injury. While anxiety and depression levels for mTBI patients in general did not return topremorbid status, improvements were observed. Sleep disorders persisted and were consistent with initial levels of distress.
1. Introduction
Traumatic brain injury (TBI) is a major public health issuelisted in the World Health Organization, and it can lead toacute and chronic long-term neuropsychiatric and cognitiondysfunction [1–3]. More than 80% of these injuries were
classified as mild [4], named mild traumatic brain injury(mTBI). An estimated 1.7 million people per year sustain aTBI, and cumulatively over 5.3 million people in the USAhave a TBI-induced disability [5, 6]. Two population-basedstudies using the Taiwan National Health Insurance Data-base indicated that TBI was associated with a 1.68 times
HindawiBehavioural NeurologyVolume 2019, Article ID 4364592, 9 pageshttps://doi.org/10.1155/2019/4364592
greater risk of dementia, and the pathogenic hazard ratio forrepeated TBI patients further increased to a 3.62 timesgreater risk of developing dementia [7, 8]. mTBI is consid-ered a significant risk factor for neurodegenerative dis-eases, including Parkinson’s disease, Alzheimer’s disease,and dementia [9–11]. Approximately 70-90% of mTBIpatients continue to experience neurocognitive dysfunc-tion, although several patients could resolve such problemswithin the first year post injury [12, 13].
TBI could result in cognitive, social, emotional, physical,and behavioral symptoms, such as headaches, sleep distur-bance, depression/anxiety, and dizziness [14–21]. Mostpatients with mTBI recovered within 6 months post injury,but some do not. The average healthcare costs of the mTBIgroup were 76% higher than those without mTBI in the 3years after injury. In addition, the costs of treating psychiatricillnesses were more than double the total cost for nonpsychi-atric patients [22].
The symptoms and related trials of mTBI were studiedprimarily in military service members and veterans forblast-related mTBI [23–25]. However, there have been nostudies on the long-term clinical effects of mTBI withblast-free etiologies. The purpose of this study is to analyzethe psychological symptoms caused by mTBI in a prospectivegroup of subjects.
2. Methods
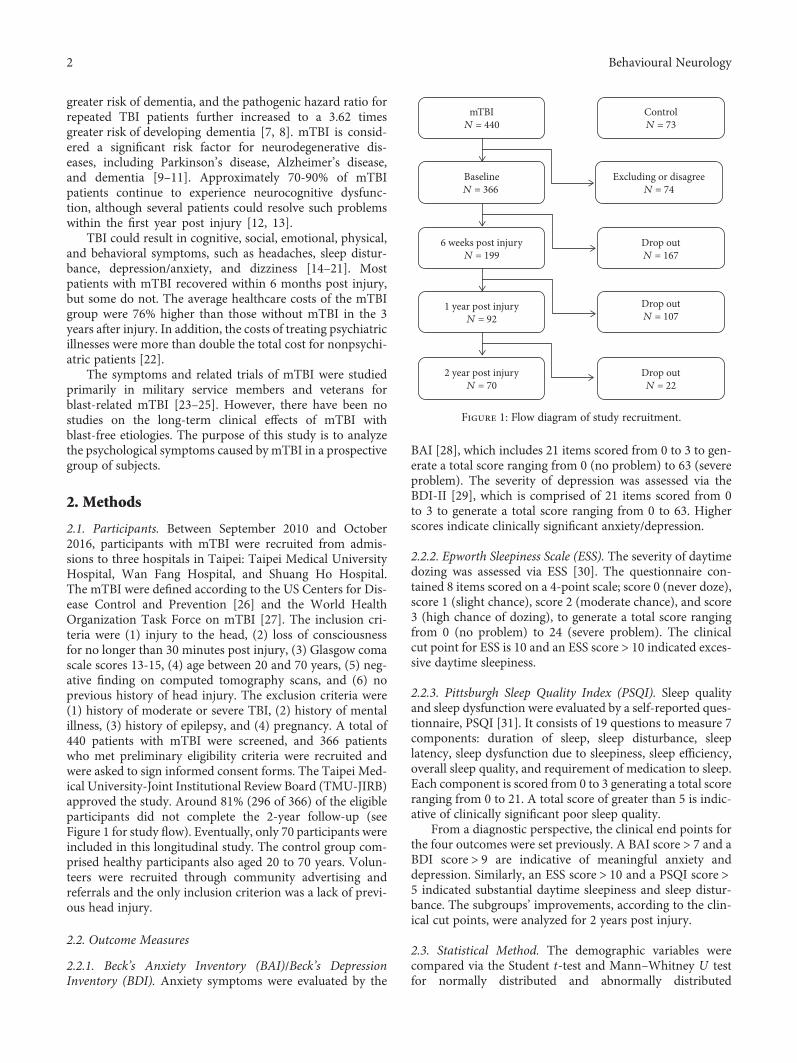
2.1. Participants. Between September 2010 and October2016, participants with mTBI were recruited from admis-sions to three hospitals in Taipei: Taipei Medical UniversityHospital, Wan Fang Hospital, and Shuang Ho Hospital.The mTBI were defined according to the US Centers for Dis-ease Control and Prevention [26] and the World HealthOrganization Task Force on mTBI [27]. The inclusion cri-teria were (1) injury to the head, (2) loss of consciousnessfor no longer than 30 minutes post injury, (3) Glasgow comascale scores 13-15, (4) age between 20 and 70 years, (5) neg-ative finding on computed tomography scans, and (6) noprevious history of head injury. The exclusion criteria were(1) history of moderate or severe TBI, (2) history of mentalillness, (3) history of epilepsy, and (4) pregnancy. A total of440 patients with mTBI were screened, and 366 patientswho met preliminary eligibility criteria were recruited andwere asked to sign informed consent forms. The Taipei Med-ical University-Joint Institutional Review Board (TMU-JIRB)approved the study. Around 81% (296 of 366) of the eligibleparticipants did not complete the 2-year follow-up (seeFigure 1 for study flow). Eventually, only 70 participants wereincluded in this longitudinal study. The control group com-prised healthy participants also aged 20 to 70 years. Volun-teers were recruited through community advertising andreferrals and the only inclusion criterion was a lack of previ-ous head injury.
2.2. Outcome Measures
2.2.1. Beck’s Anxiety Inventory (BAI)/Beck’s DepressionInventory (BDI). Anxiety symptoms were evaluated by the
BAI [28], which includes 21 items scored from 0 to 3 to gen-erate a total score ranging from 0 (no problem) to 63 (severeproblem). The severity of depression was assessed via theBDI-II [29], which is comprised of 21 items scored from 0to 3 to generate a total score ranging from 0 to 63. Higherscores indicate clinically significant anxiety/depression.
2.2.2. Epworth Sleepiness Scale (ESS). The severity of daytimedozing was assessed via ESS [30]. The questionnaire con-tained 8 items scored on a 4-point scale; score 0 (never doze),score 1 (slight chance), score 2 (moderate chance), and score3 (high chance of dozing), to generate a total score rangingfrom 0 (no problem) to 24 (severe problem). The clinicalcut point for ESS is 10 and an ESS score > 10 indicated exces-sive daytime sleepiness.
2.2.3. Pittsburgh Sleep Quality Index (PSQI). Sleep qualityand sleep dysfunction were evaluated by a self-reported ques-tionnaire, PSQI [31]. It consists of 19 questions to measure 7components: duration of sleep, sleep disturbance, sleeplatency, sleep dysfunction due to sleepiness, sleep efficiency,overall sleep quality, and requirement of medication to sleep.Each component is scored from 0 to 3 generating a total scoreranging from 0 to 21. A total score of greater than 5 is indic-ative of clinically significant poor sleep quality.
From a diagnostic perspective, the clinical end points forthe four outcomes were set previously. A BAI score > 7 and aBDI score > 9 are indicative of meaningful anxiety anddepression. Similarly, an ESS score > 10 and a PSQI score >5 indicated substantial daytime sleepiness and sleep distur-bance. The subgroups’ improvements, according to the clin-ical cut points, were analyzed for 2 years post injury.
2.3. Statistical Method. The demographic variables werecompared via the Student t-test and Mann–Whitney U testfor normally distributed and abnormally distributed
mTBIN = 440
BaselineN = 366
6 weeks post injuryN = 199
1 year post injuryN = 92
2 year post injuryN = 70
Excluding or disagreeN = 74
Drop outN = 167
Drop outN = 107
Drop outN = 22
ControlN = 73
Figure 1: Flow diagram of study recruitment.
2 Behavioural Neurology
continuous variables, respectively. The categorical variableswere compared between the two groups via the chi-squaredtest (gender and mechanism of injury). Outcome scores werecompared to the general control group scores to reveal anyimprovements. Additionally, a generalized linear mixedmodel approach was performed to analyze the participants’pattern of scores in anxiety, depression, daytime sleepiness,and sleep disturbance across the 2 years post injury for longi-tudinal investigation. The significance level was set at 0.05 forall analyses. The statistical software R version 3.4.0 (copy-right (©) 2017, The R Foundation for Statistical Computing)was employed to analyze the longitudinal data.
3. Results
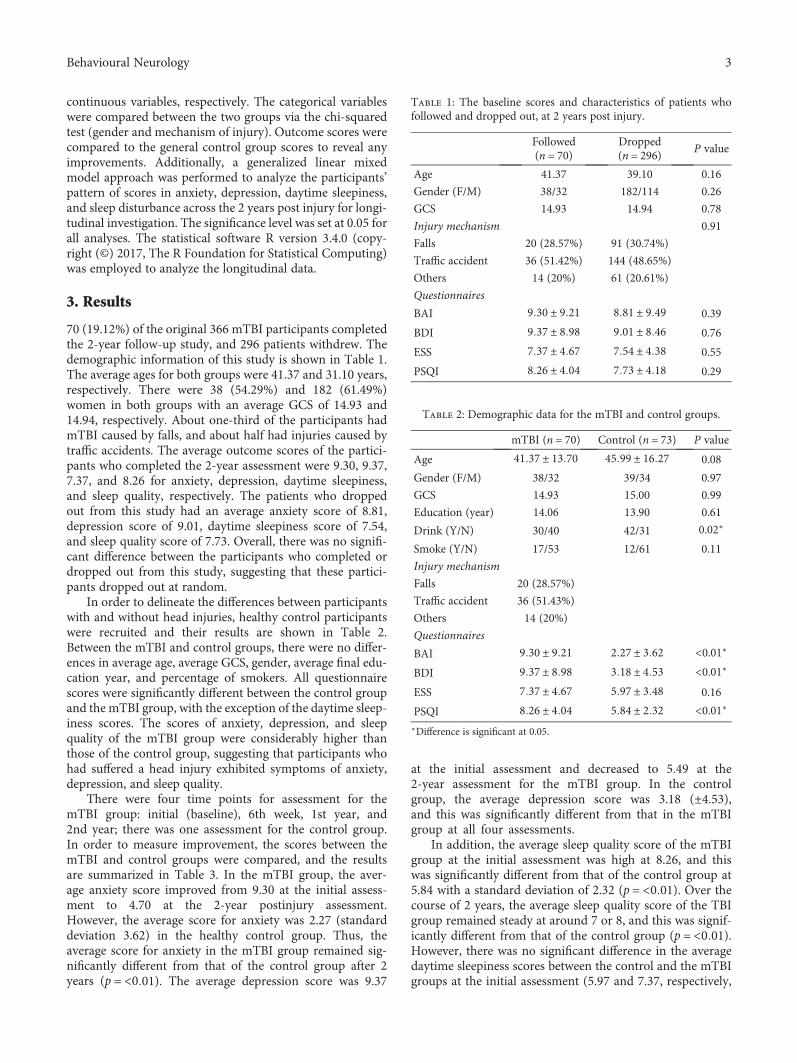
70 (19.12%) of the original 366 mTBI participants completedthe 2-year follow-up study, and 296 patients withdrew. Thedemographic information of this study is shown in Table 1.The average ages for both groups were 41.37 and 31.10 years,respectively. There were 38 (54.29%) and 182 (61.49%)women in both groups with an average GCS of 14.93 and14.94, respectively. About one-third of the participants hadmTBI caused by falls, and about half had injuries caused bytraffic accidents. The average outcome scores of the partici-pants who completed the 2-year assessment were 9.30, 9.37,7.37, and 8.26 for anxiety, depression, daytime sleepiness,and sleep quality, respectively. The patients who droppedout from this study had an average anxiety score of 8.81,depression score of 9.01, daytime sleepiness score of 7.54,and sleep quality score of 7.73. Overall, there was no signifi-cant difference between the participants who completed ordropped out from this study, suggesting that these partici-pants dropped out at random.
In order to delineate the differences between participantswith and without head injuries, healthy control participantswere recruited and their results are shown in Table 2.Between the mTBI and control groups, there were no differ-ences in average age, average GCS, gender, average final edu-cation year, and percentage of smokers. All questionnairescores were significantly different between the control groupand the mTBI group, with the exception of the daytime sleep-iness scores. The scores of anxiety, depression, and sleepquality of the mTBI group were considerably higher thanthose of the control group, suggesting that participants whohad suffered a head injury exhibited symptoms of anxiety,depression, and sleep quality.
There were four time points for assessment for themTBI group: initial (baseline), 6th week, 1st year, and2nd year; there was one assessment for the control group.In order to measure improvement, the scores between themTBI and control groups were compared, and the resultsare summarized in Table 3. In the mTBI group, the aver-age anxiety score improved from 9.30 at the initial assess-ment to 4.70 at the 2-year postinjury assessment.However, the average score for anxiety was 2.27 (standarddeviation 3.62) in the healthy control group. Thus, theaverage score for anxiety in the mTBI group remained sig-nificantly different from that of the control group after 2years (p = <0 01). The average depression score was 9.37
at the initial assessment and decreased to 5.49 at the2-year assessment for the mTBI group. In the controlgroup, the average depression score was 3.18 (±4.53),and this was significantly different from that in the mTBIgroup at all four assessments.
In addition, the average sleep quality score of the mTBIgroup at the initial assessment was high at 8.26, and thiswas significantly different from that of the control group at5.84 with a standard deviation of 2.32 (p = <0 01). Over thecourse of 2 years, the average sleep quality score of the TBIgroup remained steady at around 7 or 8, and this was signif-icantly different from that of the control group (p = <0 01).However, there was no significant difference in the averagedaytime sleepiness scores between the control and the mTBIgroups at the initial assessment (5.97 and 7.37, respectively,
Table 1: The baseline scores and characteristics of patients whofollowed and dropped out, at 2 years post injury.
Followed(n = 70)
Dropped(n = 296) P value
Age 41.37 39.10 0.16
Gender (F/M) 38/32 182/114 0.26
GCS 14.93 14.94 0.78
Injury mechanism 0.91
Falls 20 (28.57%) 91 (30.74%)
Traffic accident 36 (51.42%) 144 (48.65%)
Others 14 (20%) 61 (20.61%)
Questionnaires
BAI 9 30 ± 9 21 8 81 ± 9 49 0.39
BDI 9 37 ± 8 98 9 01 ± 8 46 0.76
ESS 7 37 ± 4 67 7 54 ± 4 38 0.55
PSQI 8 26 ± 4 04 7 73 ± 4 18 0.29
Table 2: Demographic data for the mTBI and control groups.
mTBI (n = 70) Control (n = 73) P value
Age 41 37 ± 13 70 45 99 ± 16 27 0.08
Gender (F/M) 38/32 39/34 0.97
GCS 14.93 15.00 0.99
Education (year) 14.06 13.90 0.61
Drink (Y/N) 30/40 42/31 0.02∗
Smoke (Y/N) 17/53 12/61 0.11
Injury mechanism
Falls 20 (28.57%)
Traffic accident 36 (51.43%)
Others 14 (20%)
Questionnaires
BAI 9 30 ± 9 21 2 27 ± 3 62 <0.01∗
BDI 9 37 ± 8 98 3 18 ± 4 53 <0.01∗
ESS 7 37 ± 4 67 5 97 ± 3 48 0.16
PSQI 8 26 ± 4 04 5 84 ± 2 32 <0.01∗
∗Difference is significant at 0.05.
3Behavioural Neurology
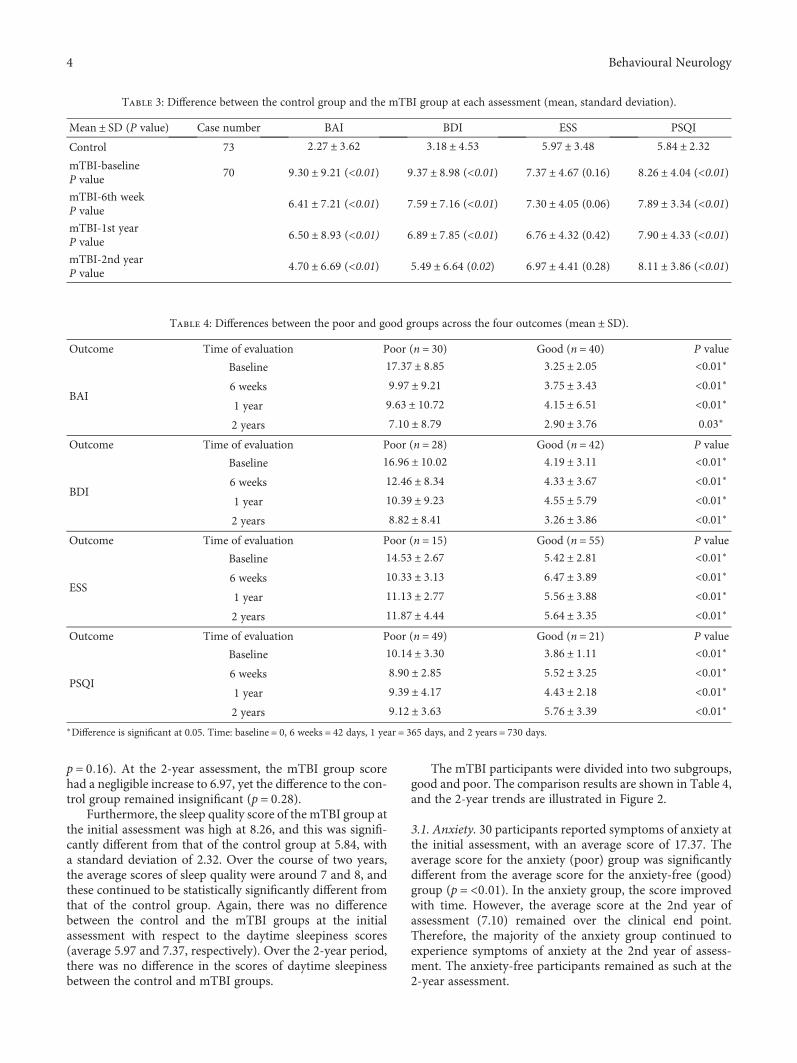
p = 0 16). At the 2-year assessment, the mTBI group scorehad a negligible increase to 6.97, yet the difference to the con-trol group remained insignificant (p = 0 28).
Furthermore, the sleep quality score of the mTBI group atthe initial assessment was high at 8.26, and this was signifi-cantly different from that of the control group at 5.84, witha standard deviation of 2.32. Over the course of two years,the average scores of sleep quality were around 7 and 8, andthese continued to be statistically significantly different fromthat of the control group. Again, there was no differencebetween the control and the mTBI groups at the initialassessment with respect to the daytime sleepiness scores(average 5.97 and 7.37, respectively). Over the 2-year period,there was no difference in the scores of daytime sleepinessbetween the control and mTBI groups.
The mTBI participants were divided into two subgroups,good and poor. The comparison results are shown in Table 4,and the 2-year trends are illustrated in Figure 2.
3.1. Anxiety. 30 participants reported symptoms of anxiety atthe initial assessment, with an average score of 17.37. Theaverage score for the anxiety (poor) group was significantlydifferent from the average score for the anxiety-free (good)group (p = <0 01). In the anxiety group, the score improvedwith time. However, the average score at the 2nd year ofassessment (7.10) remained over the clinical end point.Therefore, the majority of the anxiety group continued toexperience symptoms of anxiety at the 2nd year of assess-ment. The anxiety-free participants remained as such at the2-year assessment.
Table 3: Difference between the control group and the mTBI group at each assessment (mean, standard deviation).
Mean ± SD (P value) Case number BAI BDI ESS PSQI
Control 73 2 27 ± 3 62 3 18 ± 4 53 5 97 ± 3 48 5 84 ± 2 32mTBI-baselineP value
70 9 30 ± 9 21 (<0.01) 9 37 ± 8 98 (<0.01) 7 37 ± 4 67 (0.16) 8 26 ± 4 04 (<0.01)
mTBI-6th weekP value
6 41 ± 7 21 (<0.01) 7 59 ± 7 16 (<0.01) 7 30 ± 4 05 (0.06) 7 89 ± 3 34 (<0.01)
mTBI-1st yearP value
6 50 ± 8 93 (<0.01) 6 89 ± 7 85 (<0.01) 6 76 ± 4 32 (0.42) 7 90 ± 4 33 (<0.01)
mTBI-2nd yearP value
4 70 ± 6 69 (<0.01) 5 49 ± 6 64 (0.02) 6 97 ± 4 41 (0.28) 8 11 ± 3 86 (<0.01)
Table 4: Differences between the poor and good groups across the four outcomes (mean ± SD).
Outcome Time of evaluation Poor (n = 30) Good (n = 40) P value
BAI
Baseline 17 37 ± 8 85 3 25 ± 2 05 <0.01∗
6 weeks 9 97 ± 9 21 3 75 ± 3 43 <0.01∗
1 year 9 63 ± 10 72 4 15 ± 6 51 <0.01∗
2 years 7 10 ± 8 79 2 90 ± 3 76 0.03∗
Outcome Time of evaluation Poor (n = 28) Good (n = 42) P value
BDI
Baseline 16 96 ± 10 02 4 19 ± 3 11 <0.01∗
6 weeks 12 46 ± 8 34 4 33 ± 3 67 <0.01∗
1 year 10 39 ± 9 23 4 55 ± 5 79 <0.01∗
2 years 8 82 ± 8 41 3 26 ± 3 86 <0.01∗
Outcome Time of evaluation Poor (n = 15) Good (n = 55) P value
ESS
Baseline 14 53 ± 2 67 5 42 ± 2 81 <0.01∗
6 weeks 10 33 ± 3 13 6 47 ± 3 89 <0.01∗
1 year 11 13 ± 2 77 5 56 ± 3 88 <0.01∗
2 years 11 87 ± 4 44 5 64 ± 3 35 <0.01∗
Outcome Time of evaluation Poor (n = 49) Good (n = 21) P value
PSQI
Baseline 10 14 ± 3 30 3 86 ± 1 11 <0.01∗
6 weeks 8 90 ± 2 85 5 52 ± 3 25 <0.01∗
1 year 9 39 ± 4 17 4 43 ± 2 18 <0.01∗
2 years 9 12 ± 3 63 5 76 ± 3 39 <0.01∗
∗Difference is significant at 0.05. Time: baseline = 0, 6 weeks = 42 days, 1 year = 365 days, and 2 years = 730 days.
4 Behavioural Neurology
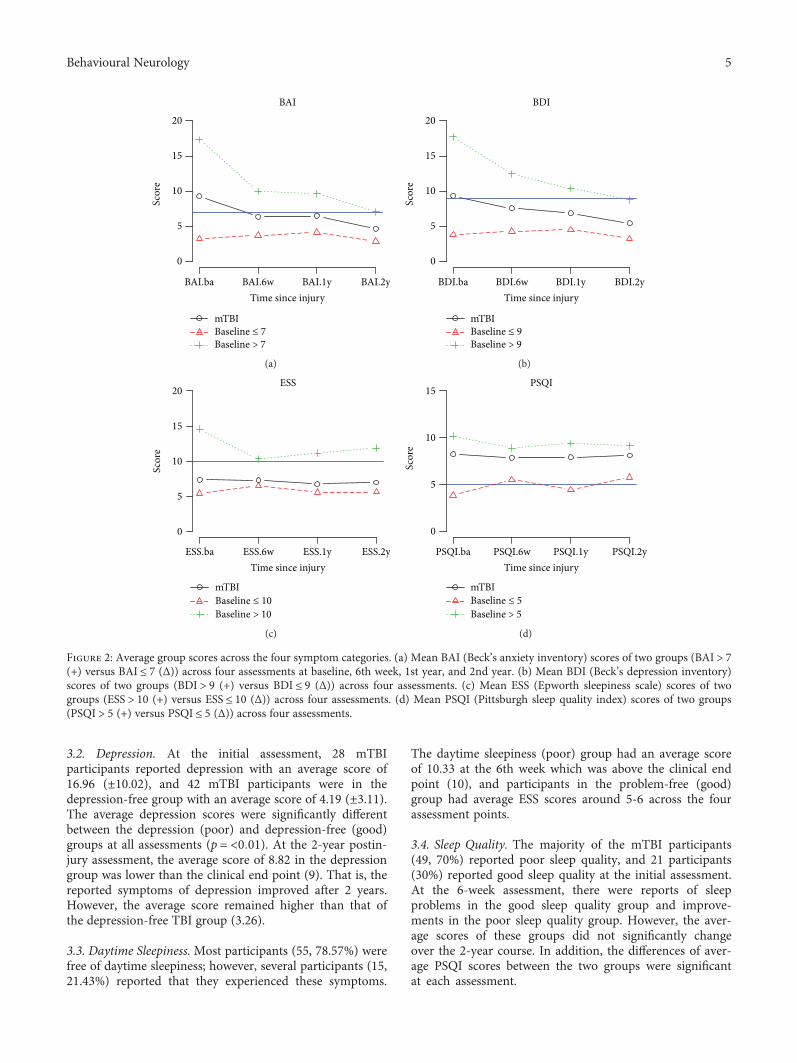
3.2. Depression. At the initial assessment, 28 mTBIparticipants reported depression with an average score of16.96 (±10.02), and 42 mTBI participants were in thedepression-free group with an average score of 4.19 (±3.11).The average depression scores were significantly differentbetween the depression (poor) and depression-free (good)groups at all assessments (p = <0 01). At the 2-year postin-jury assessment, the average score of 8.82 in the depressiongroup was lower than the clinical end point (9). That is, thereported symptoms of depression improved after 2 years.However, the average score remained higher than that ofthe depression-free TBI group (3.26).
3.3. Daytime Sleepiness. Most participants (55, 78.57%) werefree of daytime sleepiness; however, several participants (15,21.43%) reported that they experienced these symptoms.
The daytime sleepiness (poor) group had an average scoreof 10.33 at the 6th week which was above the clinical endpoint (10), and participants in the problem-free (good)group had average ESS scores around 5-6 across the fourassessment points.
3.4. Sleep Quality. The majority of the mTBI participants(49, 70%) reported poor sleep quality, and 21 participants(30%) reported good sleep quality at the initial assessment.At the 6-week assessment, there were reports of sleepproblems in the good sleep quality group and improve-ments in the poor sleep quality group. However, the aver-age scores of these groups did not significantly changeover the 2-year course. In addition, the differences of aver-age PSQI scores between the two groups were significantat each assessment.
BAI
Time since injuryBAI.ba BAI.6w BAI.1y BAI.2y
mTBIBaseline ≤ 7Baseline > 7
Scor
e 10
15
20
5
0
(a)
BDI
Time since injury
Scor
e 10
15
20
BDI.ba BDI.6w BDI.1y BDI.2y
mTBIBaseline ≤ 9Baseline > 9
5
0
(b)
Scor
e
ESS
ESS.ba ESS.6w ESS.1y ESS.2y
mTBIBaseline ≤ 10Baseline > 10
Time since injury
10
15
20
5
0
(c)
Scor
e
PSQI
Time since injuryPSQI.ba PSQI.6w PSQI.1y PSQI.2y
mTBIBaseline ≤ 5Baseline > 5
10
15
5
0
(d)
Figure 2: Average group scores across the four symptom categories. (a) Mean BAI (Beck’s anxiety inventory) scores of two groups (BAI > 7(+) versus BAI ≤ 7 (Δ)) across four assessments at baseline, 6th week, 1st year, and 2nd year. (b) Mean BDI (Beck’s depression inventory)scores of two groups (BDI > 9 (+) versus BDI ≤ 9 (Δ)) across four assessments. (c) Mean ESS (Epworth sleepiness scale) scores of twogroups (ESS > 10 (+) versus ESS ≤ 10 (Δ)) across four assessments. (d) Mean PSQI (Pittsburgh sleep quality index) scores of two groups(PSQI > 5 (+) versus PSQI ≤ 5 (Δ)) across four assessments.
5Behavioural Neurology

For each individual, the changes in all outcomes wereevaluated using an individual growth model. The physicalhealth change by group (good-poor) is demonstrated inFigure 3, and the individual growth models for longitudi-nal changes in anxiety, depression, and sleep quality aredescribed in Table 5. The intercept for scores of the day-time sleepiness and sleep quality was significant, indicatingthat individual scores varied for daytime sleepiness and
sleep quality. The variable, age, was statistically significantin the depression category only. The group effects weresignificant for all physical health outcomes, indicating thatthe longitudinal changes in anxiety, depression, daytimesleepiness, and sleep quality after mTBI were dependenton their initial status (BAI and BDI scores at baseline).In addition, the interaction effects between the groupsand postinjury time were significant in the anxiety and
3
6
9
12
0 200 400 600Time
BAI
BAI.gGoodPoor
(a)
Time
6
9
12
15
0 200 400 600
BDI
BDI.gGoodPoor
(b)
7
9
11
0 200 400 600Time
ESS
ESS.gGoodPoor
(c)
5
6
7
8
9
0 200 400 600Time
PSQ
I
PSQI.gGoodPoor
(d)
Figure 3: Estimated trends for four outcomes between the good and poor groups in the mTBI patients. (a) BAI (Beck’s anxiety inventory)score ≤ 7 (good: solid line) versus score > 7 (poor: dashed line). (b) BDI (Beck’s depression inventory) score ≤ 9 (good: solid line) versusscore > 9 (poor: dashed line). (c) ESS (Epworth sleepiness scale) score ≤ 10 (good: solid line) versus score > 10 (poor: dashed line). (d)PSQI (Pittsburgh sleep quality index) score ≤ 5 (good: solid line) versus score > 5 (poor: dashed line).
6 Behavioural Neurology
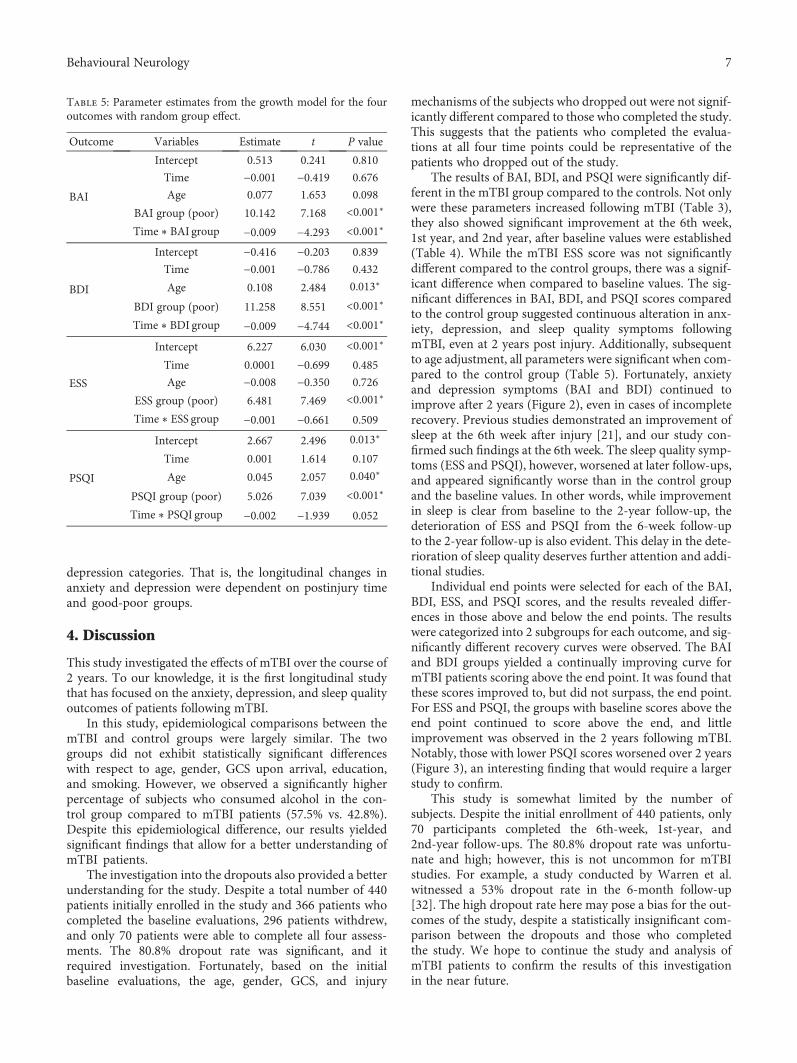
depression categories. That is, the longitudinal changes inanxiety and depression were dependent on postinjury timeand good-poor groups.
4. Discussion
This study investigated the effects of mTBI over the course of2 years. To our knowledge, it is the first longitudinal studythat has focused on the anxiety, depression, and sleep qualityoutcomes of patients following mTBI.
In this study, epidemiological comparisons between themTBI and control groups were largely similar. The twogroups did not exhibit statistically significant differenceswith respect to age, gender, GCS upon arrival, education,and smoking. However, we observed a significantly higherpercentage of subjects who consumed alcohol in the con-trol group compared to mTBI patients (57.5% vs. 42.8%).Despite this epidemiological difference, our results yieldedsignificant findings that allow for a better understanding ofmTBI patients.
The investigation into the dropouts also provided a betterunderstanding for the study. Despite a total number of 440patients initially enrolled in the study and 366 patients whocompleted the baseline evaluations, 296 patients withdrew,and only 70 patients were able to complete all four assess-ments. The 80.8% dropout rate was significant, and itrequired investigation. Fortunately, based on the initialbaseline evaluations, the age, gender, GCS, and injury
mechanisms of the subjects who dropped out were not signif-icantly different compared to those who completed the study.This suggests that the patients who completed the evalua-tions at all four time points could be representative of thepatients who dropped out of the study.
The results of BAI, BDI, and PSQI were significantly dif-ferent in the mTBI group compared to the controls. Not onlywere these parameters increased following mTBI (Table 3),they also showed significant improvement at the 6th week,1st year, and 2nd year, after baseline values were established(Table 4). While the mTBI ESS score was not significantlydifferent compared to the control groups, there was a signif-icant difference when compared to baseline values. The sig-nificant differences in BAI, BDI, and PSQI scores comparedto the control group suggested continuous alteration in anx-iety, depression, and sleep quality symptoms followingmTBI, even at 2 years post injury. Additionally, subsequentto age adjustment, all parameters were significant when com-pared to the control group (Table 5). Fortunately, anxietyand depression symptoms (BAI and BDI) continued toimprove after 2 years (Figure 2), even in cases of incompleterecovery. Previous studies demonstrated an improvement ofsleep at the 6th week after injury [21], and our study con-firmed such findings at the 6th week. The sleep quality symp-toms (ESS and PSQI), however, worsened at later follow-ups,and appeared significantly worse than in the control groupand the baseline values. In other words, while improvementin sleep is clear from baseline to the 2-year follow-up, thedeterioration of ESS and PSQI from the 6-week follow-upto the 2-year follow-up is also evident. This delay in the dete-rioration of sleep quality deserves further attention and addi-tional studies.
Individual end points were selected for each of the BAI,BDI, ESS, and PSQI scores, and the results revealed differ-ences in those above and below the end points. The resultswere categorized into 2 subgroups for each outcome, and sig-nificantly different recovery curves were observed. The BAIand BDI groups yielded a continually improving curve formTBI patients scoring above the end point. It was found thatthese scores improved to, but did not surpass, the end point.For ESS and PSQI, the groups with baseline scores above theend point continued to score above the end, and littleimprovement was observed in the 2 years following mTBI.Notably, those with lower PSQI scores worsened over 2 years(Figure 3), an interesting finding that would require a largerstudy to confirm.
This study is somewhat limited by the number ofsubjects. Despite the initial enrollment of 440 patients, only70 participants completed the 6th-week, 1st-year, and2nd-year follow-ups. The 80.8% dropout rate was unfortu-nate and high; however, this is not uncommon for mTBIstudies. For example, a study conducted by Warren et al.witnessed a 53% dropout rate in the 6-month follow-up[32]. The high dropout rate here may pose a bias for the out-comes of the study, despite a statistically insignificant com-parison between the dropouts and those who completedthe study. We hope to continue the study and analysis ofmTBI patients to confirm the results of this investigationin the near future.
Table 5: Parameter estimates from the growth model for the fouroutcomes with random group effect.
Outcome Variables Estimate t P value
BAI
Intercept 0.513 0.241 0.810
Time −0.001 −0.419 0.676
Age 0.077 1.653 0.098
BAI group (poor) 10.142 7.168 <0.001∗
Time ∗ BAI group −0.009 −4.293 <0.001∗
BDI
Intercept −0.416 −0.203 0.839
Time −0.001 −0.786 0.432
Age 0.108 2.484 0.013∗
BDI group (poor) 11.258 8.551 <0.001∗
Time ∗ BDI group −0.009 −4.744 <0.001∗
ESS
Intercept 6.227 6.030 <0.001∗
Time 0.0001 −0.699 0.485
Age −0.008 −0.350 0.726
ESS group (poor) 6.481 7.469 <0.001∗
Time ∗ ESS group −0.001 −0.661 0.509
PSQI
Intercept 2.667 2.496 0.013∗
Time 0.001 1.614 0.107
Age 0.045 2.057 0.040∗
PSQI group (poor) 5.026 7.039 <0.001∗
Time ∗ PSQI group −0.002 −1.939 0.052
7Behavioural Neurology
Understanding the prevalence of anxiety and depressionin mTBI patients is a first step to understanding the issuesfaced during treatment. Additional efforts in the treatmentof these symptoms, and modulating the mechanisms thatlead to them, requires further research.
5. Conclusion
This study shed light on mTBI with the subsequent presenta-tion of anxiety and depression sustaining a time-dependentimprovement over 2 years. The unresolved issues about thedelay in the deterioration of sleep quality, paradoxical PSQIscore, and the role of the modulating mechanism deserve fur-ther study despite the limited patient number and the currentsmall scale and limited enrollment rate.
Data Availability
The data used to support the findings of this study areavailable from the corresponding author upon request.
Disclosure
Preliminary portions of these data were presented at the 2017Society for Neuroscience Annual Conference.
Conflicts of Interest
No competing financial interests exist.
Authors’ Contributions
Hon-Ping Ma and Po-Shen Chen contributed equally tothis work.
Acknowledgments
We acknowledge Taipei Medical University Hospital, WanFang Hospital, and Shuang Ho Hospital for their help inpatient recruitment. We also acknowledge all the recruitedpatients for their participation. This study was supported bygrants from theMinistry of Science and Technology (MOST),Taiwan (104-2314-B-038-031 andDP2-107-21121-01-N-05),Taipei Medical University (TMU102-AE1-B27, TMU104-AE1-B03, and TMU105-AE1-B03), and Taipei MedicalUniversity-Shuang HoHospital (103 TMU-SHH-24).
References
[1] K. McInnes, C. L. Friesen, D. E. MacKenzie, D. A. Westwood,and S. G. Boe, “Mild Traumatic Brain Injury (mTBI) andchronic cognitive impairment: a scoping review,” PLoS One,vol. 12, no. 4, article e0174847, 2017.
[2] A. R. Mayer, D. K. Quinn, and C. L. Master, “The spectrum ofmild traumatic brain injury: a review,” Neurology, vol. 89,no. 6, pp. 623–632, 2017.
[3] B. J. Kuo, S. D. Vaca, J. R. N. Vissoci et al., “A prospective neu-rosurgical registry evaluating the clinical care of traumaticbrain injury patients presenting to Mulago National ReferralHospital in Uganda,” PLoS One, vol. 12, no. 10, articlee0182285, 2017.
[4] A. J. MacGregor, R. A. Shaffer, A. L. Dougherty et al., “Preva-lence and psychological correlates of traumatic brain injury inoperation Iraqi Freedom,” The Journal of Head Trauma Reha-bilitation, vol. 25, no. 1, pp. 1–8, 2010.
[5] J. A. Langlois, W. Rutland-Brown, and M. M. Wald, “The epi-demiology and impact of traumatic brain injury: a brief over-view,” The Journal of Head Trauma Rehabilitation, vol. 21,no. 5, pp. 375–378, 2006.
[6] M. L. Prins and C. C. Giza, “Repeat traumatic brain injury inthe developing brain,” International Journal of DevelopmentalNeuroscience, vol. 30, no. 3, pp. 185–190, 2012.
[7] H. K. Wang, S. H. Lin, P. S. Sung et al., “Population basedstudy on patients with traumatic brain injury suggestsincreased risk of dementia,” Journal of Neurology, Neurosur-gery, and Psychiatry, vol. 83, no. 11, pp. 1080–1085, 2012.
[8] S. F. Chu, W. T. Chiu, H. W. Lin, Y. H. Chiang, and T. H. Liou,“Hazard ratio and repeat injury for dementia in patients withand without a history of traumatic brain injury: apopulation-based secondary data analysis in Taiwan,” Asia--Pacific Journal of Public Health, vol. 28, no. 6, pp. 519–527,2016.
[9] C. LoBue, C. M. Cullum, N. Didehbani et al., “Neurodegener-ative dementias after traumatic brain injury,” The Journal ofNeuropsychiatry and Clinical Neurosciences, vol. 30, no. 1,pp. 7–13, 2018.
[10] D. E. Barnes, A. Kaup, K. A. Kirby, A. L. Byers, R. Diaz-Arras-tia, and K. Yaffe, “Traumatic brain injury and risk of dementiain older veterans,” Neurology, vol. 83, no. 4, pp. 312–319, 2014.
[11] R. C. Gardner, J. F. Burke, J. Nettiksimmons, A. Kaup, D. E.Barnes, and K. Yaffe, “Dementia risk after traumatic braininjury vs nonbrain trauma: the role of age and severity,” JAMANeurology, vol. 71, no. 12, pp. 1490–1497, 2014.
[12] V. G. Coronado, L. Xu, S. V. Basavaraju et al., “Surveillance fortraumatic brain injury-related deaths—United States, 1997–2007,” MMWR Surveillance Summaries, vol. 60, no. 5, pp. 1–32, 2011.
[13] T. W. McAllister, “Neurobehavioral sequelae of traumaticbrain injury: evaluation and management,” World Psychiatry,vol. 7, no. 1, pp. 3–10, 2008.
[14] J. H. Joo, E. J. Lenze, B. H. Mulsant et al., “Risk factors for fallsduring treatment of late-life depression,” The Journal of Clini-cal Psychiatry, vol. 63, no. 10, pp. 936–941, 2002.
[15] P. B. Thapa, P. Gideon, T. W. Cost, A. B. Milam, and W. A.Ray, “Antidepressants and the risk of falls among nursinghome residents,” The New England Journal of Medicine,vol. 339, no. 13, pp. 875–882, 1998.
[16] N. Kerse, L. Flicker, J. J. Pfaff et al., “Falls, depression and anti-depressants in later life: a large primary care appraisal,” PLoSOne, vol. 3, no. 6, article e2423, 2008.
[17] J. L. Vassallo, Z. Proctor-Weber, B. K. Lebowitz, G. Curtiss,and R. D. Vanderploeg, “Psychiatric risk factors for traumaticbrain injury,” Brain Injury, vol. 21, no. 6, pp. 567–573, 2007.
[18] T. Mollayeva, A. D'Souza, and S. Mollayeva, “Sleep and psy-chiatric disorders in persons with mild traumatic braininjury,” Current Psychiatry Reports, vol. 19, no. 8, p. 47,2017.
[19] T. Y. Huang, H. P. Ma, S. H. Tsai, Y. H. Chiang, C. J. Hu,and J. Ou, “Sleep duration and sleep quality following acutemild traumatic brain injury: a propensity score analysis,”Behavioural Neurology, vol. 2015, Article ID 378726, 7pages, 2015.
8 Behavioural Neurology
[20] L. F. Lin, T. H. Liou, C. J. Hu et al., “Balance function and sen-sory integration after mild traumatic brain injury,” BrainInjury, vol. 29, no. 1, pp. 41–46, 2015.
[21] H. P. Ma, J. C. Ou, C. T. Yeh et al., “Recovery from sleep dis-turbance precedes that of depression and anxiety followingmild traumatic brain injury: a 6-week follow-up study,” BMJOpen, vol. 4, no. 1, article e004205, 2014.
[22] C. M. Rockhill, K. Jaffe, C. Zhou, M. Y. Fan,W. Katon, and J. R.Fann, “Health care costs associated with traumatic brain injuryand psychiatric illness in adults,” Journal of Neurotrauma,vol. 29, no. 6, pp. 1038–1046, 2012.
[23] L. Neipert, N. J. Pastorek, M. Troyanskaya, R. S. Scheibel, N. J.Petersen, and H. S. Levin, “Effect of clinical characteristics oncognitive performance in service members and veterans withhistories of blast-related mild traumatic brain injury,” BrainInjury, vol. 28, no. 13-14, pp. 1667–1674, 2014.
[24] S. M. Lippa, R. T. Lange, L. M. French, and G. L. Iverson, “Per-formance validity, neurocognitive disorder, and post-concussion symptom reporting in service members with a his-tory of mild traumatic brain injury,” Archives of clinical neuro-psychology, vol. 33, no. 5, pp. 606–618, 2017.
[25] P. Suri, K. Stolzmann, K. M. Iverson et al., “Associationsbetween traumatic brain injury history and future headacheseverity in veterans: a longitudinal study,” Archives of PhysicalMedicine and Rehabilitation, vol. 98, no. 11, pp. 2118–2125.e1,2017, e1.
[26] National Center for Injury Prevention and Control, Report toCongress on Mild Traumatic Brain Injury in the United States:Steps to Prevent a Serious Public Health Problem, Centers forDisease Control and Prevention, Atlanta, GA, USA, 2003.
[27] L. J. Carroll, J. D. Cassidy, L. Holm, J. Kraus, and V. G. Coro-nado, “Methodological issues and research recommendationsfor mild traumatic brain injury: the WHO Collaborating Cen-tre Task Force on Mild Traumatic Brain Injury,” Journal ofRehabilitation Medicine, vol. 36, no. 43, pp. 113–125, 2004.
[28] A. T. Beck, N. Epstein, G. Brown, and R. A. Steer, “An inven-tory for measuring clinical anxiety: psychometric properties,”Journal of Consulting and Clinical Psychology, vol. 56, no. 6,pp. 893–897, 1988.
[29] A. T. Beck, R. A. Steer, R. Ball, andW. Ranieri, “Comparison ofBeck Depression Inventories-IA and -II in psychiatric outpa-tients,” Journal of Personality Assessment, vol. 67, no. 3,pp. 588–597, 1996.
[30] M. W. Johns, “A new method for measuring daytime sleepi-ness: the Epworth sleepiness scale,” Sleep, vol. 14, no. 6,pp. 540–545, 1991.
[31] D. J. Buysse, C. F. Reynolds 3rd, T. H. Monk, S. R. Berman, andD. J. Kupfer, “The Pittsburgh Sleep Quality Index: a newinstrument for psychiatric practice and research,” PsychiatryResearch, vol. 28, no. 2, pp. 193–213, 1989.
[32] A. M. Warren, A. Boals, T. R. Elliott et al., “Mild traumaticbrain injury increases risk for the development of posttrau-matic stress disorder,” Journal of Trauma and Acute CareSurgery, vol. 79, no. 6, pp. 1062–1066, 2015.
9Behavioural Neurology

Stem Cells International
Hindawiwww.hindawi.com Volume 2018
Hindawiwww.hindawi.com Volume 2018
MEDIATORSINFLAMMATION
of
EndocrinologyInternational Journal of
Hindawiwww.hindawi.com Volume 2018
Hindawiwww.hindawi.com Volume 2018
Disease Markers
Hindawiwww.hindawi.com Volume 2018
BioMed Research International
OncologyJournal of
Hindawiwww.hindawi.com Volume 2013
Hindawiwww.hindawi.com Volume 2018
Oxidative Medicine and Cellular Longevity
Hindawiwww.hindawi.com Volume 2018
PPAR Research
Hindawi Publishing Corporation http://www.hindawi.com Volume 2013Hindawiwww.hindawi.com
The Scientific World Journal
Volume 2018
Immunology ResearchHindawiwww.hindawi.com Volume 2018
Journal of
ObesityJournal of
Hindawiwww.hindawi.com Volume 2018
Hindawiwww.hindawi.com Volume 2018
Computational and Mathematical Methods in Medicine
Hindawiwww.hindawi.com Volume 2018
Behavioural Neurology
OphthalmologyJournal of
Hindawiwww.hindawi.com Volume 2018
Diabetes ResearchJournal of
Hindawiwww.hindawi.com Volume 2018
Hindawiwww.hindawi.com Volume 2018
Research and TreatmentAIDS
Hindawiwww.hindawi.com Volume 2018
Gastroenterology Research and Practice
Hindawiwww.hindawi.com Volume 2018
Parkinson’s Disease
Evidence-Based Complementary andAlternative Medicine
Volume 2018Hindawiwww.hindawi.com
Submit your manuscripts atwww.hindawi.com