psm july 2004 cososimo estimating system-of-system architecture definition and integration effort jo...
Post on 20-Dec-2015
218 views
TRANSCRIPT

USC
C S E University of Southern CaliforniaCenter for Software Engineering
PSM July 2004
COSOSIMO
Estimating System-of-System Architecture Definition and Integration Effort
Jo Ann LaneUniversity of Southern CaliforniaCenter for Software Engineering

PSM July 2004 2
USC
C S E University of Southern CaliforniaCenter for Software Engineering
Goals of This Presentation• Provide an overview of
– System-of-system concepts– The desired system-of-system activities to be covered
by the cost model– The cost model approaches, concepts, and definitions– Current issues/questions under investigation
• Present an example using current investigational version of cost model
• Solicit data for further model investigations and calibration
• Obtain feedback/suggestions on approach and data collection

PSM July 2004 3
USC
C S E University of Southern CaliforniaCenter for Software Engineering
System of Systems (SoS) Concept
SOS
SmS2S1
S11 S12 S1n S21 S22 S2n Sm1 Sm2 Smn
……
…… …… ……

PSM July 2004 4
USC
C S E University of Southern CaliforniaCenter for Software Engineering
High Level Partitioning of Cost Models
RequirementsAnalysis
PreliminaryDesign
DetailedDesign
Coding
Unit Test
Integration
Software Acceptance Test
Legend COCOMO COSYSMO COSOSIMO
SOS
SystemSystem
Integration/Test
System of System
SoftwareArchitecting
ArchitectingCOSOSIMO
COSYSMO
COCOMO II
Integration/Test

PSM July 2004 5
USC
C S E University of Southern CaliforniaCenter for Software Engineering
Constructive System-of-System Integration Cost Model (COSOSIMO)
• Parametric model to estimate the effort associated with the definition and integration of software-intensive “system of systems” components
• Includes at least one size driver and 6 exponential scale factors related to effort
• Targets input parameters that can be determined in early phases
• Goal is to have zero overlap with COCOMO II and COSYSMO

PSM July 2004 6
USC
C S E University of Southern CaliforniaCenter for Software Engineering
Key Activities Covered by Each Cost Model
COCOMO II• Application and
system software development
• Elaboration
• Construction
• Development of test tools and simulators (estimated as a separate set of software)
• Resolution of software errors detected during test activities
COSYSMO• System/sub-system
definition• Operational concepts
• Operational scenarios
• System/sub-system elaboration
• System integration and test
• Resolution of system-level errors detected during test activities
• Deployment• Maintenance
COSOSIMO• SoS architecture definition
• SoS integration activities
• Development of SoS integration lab
• Development of SoS level test plans and procedures
• Execution of test SoS test procedures
• High-level isolation of problems detected during integration

PSM July 2004 7
USC
C S E University of Southern CaliforniaCenter for Software Engineering
Model DifferencesCOCOMO II
• Software development
• Development phases
• 20+ years old• 161 calibration
points• 23 drivers• Size is driven by
effective SLOC (eSLOC)
COSOSIMO• System of Systems
architecture definition and integration
• Pre and Post COCOMO II effort
• Very new
• Only expert validation
• 6 exponential scale factors
• Candidate drivers– Effective KSLOC
(eKSLOC) – Logical interfaces at
SoS level
COSYSMO• Systems engineering• Entire life cycle• 3 years old• 11 calibration points• 18 drivers• Size is driven by
– requirements– interfaces– algorithms– operational
scenarios

PSM July 2004 8
USC
C S E University of Southern CaliforniaCenter for Software Engineering
Size Drivers
Exponential Scale FactorsSoSDefinition andIntegrationEffort
Calibration
• Interface-related eKSLOC• Number of logical
interfaces at SoS level
• Integration simplicity• Integration risk resolution• Integration stability• Component readiness• Integration capability• Integration processes
COSOSIMO Operational Concept
COSOSIMO

PSM July 2004 9
USC
C S E University of Southern CaliforniaCenter for Software Engineering
COSOSIMO Model Equations
Level 1 IPM (Si) = Ai Size (Sij) Bi
j=1
ni
Level 0 IPM (SoS) = A0 IPM (Si) B0
i=1
mi
Two level model that • First determines integration effort for first level subsystems….• Then, using subsystem integration effort and SoS characteristics, determines SoS integration effort…
SOS
SmS2S1
S11 S12 S1n S21 S22 S2n Sm1 Sm2 Smn
……
…… …… ……
Level 0
Level 1

PSM July 2004 10
USC
C S E University of Southern CaliforniaCenter for Software Engineering
COSOSIMO Model Parameters
IPM Integration effort in Person MonthsSi The ith subsystem within the SoS
A Constant derived from historical project data Size Determined by computing the weighted average of the size driver(s) ni Number of Subsystem level 2 components comprising the ith
subsystemm Number of Subsystem level 1 components comprising the SoSBi Effort exponent for the ith subsystem based on the subsystem’s 6
exponential scale factors. The sum of the scale factors results in an overall exponential effort adjustment factor to the nominal effort.
B0 Effort exponent for the SoS based on the SOS’ 6 exponential scale
factors. The sum of the scale factors results in an overall exponential effort adjustment factor to the nominal effort.

PSM July 2004 11
USC
C S E University of Southern CaliforniaCenter for Software Engineering
Current Level 1 Size Driver
• Subsystem development size measured in effective KSLOC (eKSLOC)
• eKSLOC can be calculated using COCOMO II
• Size weighted by – Complexity– Volatility– Degree of COTS/reuse
S1S2
S3
S4

PSM July 2004 12
USC
C S E University of Southern CaliforniaCenter for Software Engineering
Additional Proposed Size Drivers
• Number of major interfaces• Number of operational scenarios
S1
S2
S3
S4Each weighted by
• Complexity• Volatility• Degree of COTS/reuse

PSM July 2004 13
USC
C S E University of Southern CaliforniaCenter for Software Engineering
Proposed Size Driver Definitions

PSM July 2004 14
USC
C S E University of Southern CaliforniaCenter for Software Engineering
Subsystem Software SizeThis driver represents the software subsystem size. It is measured in terms of effective thousand lines of code (eKSLOC). eKSLOC can calculated using COCOMO II or a comparable estimation model or technique.
Easy Nominal Difficult
- Simple algorithms - Straightforward, but non-trivial algorithms
- Complex algorithms
- Basic math - Algebraic by nature - Difficult math (calculus)
- Straightforward structure - Nested structure with decision logic
- Recursive in structure with distributed control
- Simple data - Relational data - Persistent data
- Timing not an issue - Timing a constraint - Dynamic, with timing issues
PSM July 2004 15
USC
C S E University of Southern CaliforniaCenter for Software Engineering
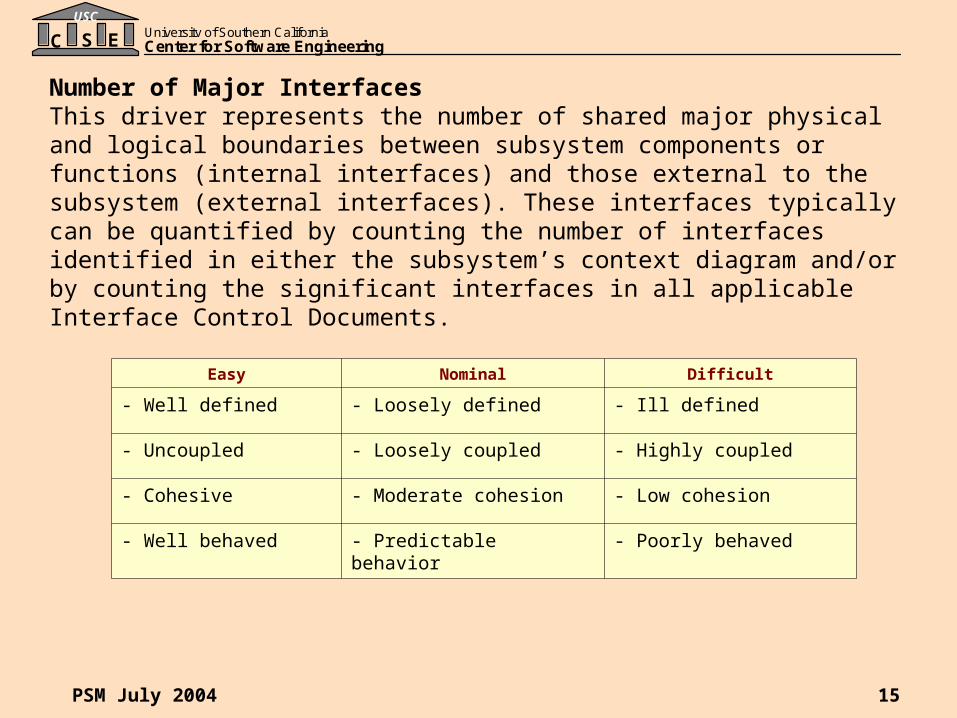
Number of Major InterfacesThis driver represents the number of shared major physical and logical boundaries between subsystem components or functions (internal interfaces) and those external to the subsystem (external interfaces). These interfaces typically can be quantified by counting the number of interfaces identified in either the subsystem’s context diagram and/or by counting the significant interfaces in all applicable Interface Control Documents.
Easy Nominal Difficult
- Well defined - Loosely defined - Ill defined
- Uncoupled - Loosely coupled - Highly coupled
- Cohesive - Moderate cohesion - Low cohesion
- Well behaved - Predictable behavior - Poorly behaved

PSM July 2004 16
USC
C S E University of Southern CaliforniaCenter for Software Engineering
Number of Operational ScenariosThis driver represents the number of operational scenarios that a system must satisfy. Such threads typically result in end-to-end test scenarios that are developed to validate the system and satisfy all of its requirements. The number of scenarios can typically be quantified by counting the number of unique end-to-end tests used to validate the system functionality and performance or by counting the number of high-level use cases developed as part of the operational architecture.
Easy Nominal Difficult
- Well defined - Loosely defined - Ill defined
- Loosely coupled - Moderately coupled - Tightly coupled or many dependencies/conflicting requirements
- Timelines not an issue - Timelines a constraint - Tight timelines through scenario network

PSM July 2004 17
USC
C S E University of Southern CaliforniaCenter for Software Engineering
Proposed Exponential Scale Factor
Definitions

PSM July 2004 18
USC
C S E University of Southern CaliforniaCenter for Software Engineering
Integration Simplicity (ISMPL)Represents a parameter which includes system component coupling, processing criticality, scope of key performance parameters, and system precedentedness.
Very Low Low Nominal High Very High Extra High
Very strong coupling
Very strong criticality
Cross-cutting key performance parameters
Highly unprecedented
Strong coupling
Strong criticality
Mostly unprecedented
Both strong & weak coupling
Mixed criticality
Partly unprecedented
Moderate coupling
Moderate criticality
Some new aspects
Weak coupling
Low criticality
Few new aspects
Very weak coupling
No cross-cutting key performance parameters
No new aspects

PSM July 2004 19
USC
C S E University of Southern CaliforniaCenter for Software Engineering
Integration Risk Resolution (IRESL)Represents a multi-attribute parameter which includes number of integration risk items, risk management/mitigation plan, compatible schedules and budgets, expert availability, tool support, level of uncertainty in integration risk areas. IRESL is the subjective weighted average of the listed characteristics.
Characteristic Very Low Low Nominal High Very High
Number and criticality of risk items
Risk mitigation activities
Schedule, budget, and internal milestones compatible with Risk Management Plan and integration scope
% of top software system integrators available to project
Tool support available for tracking issues
Level of uncertainty in integration risk area
> 10 critical
None
None
20%
None
Extreme
5-10 critical
Little
Little
40%
Little
Significant
2-4 critical
Some
Some
60%
Some
Considerable
1 critical
Risks generally covered
Generally
80%
Good
Some
<10 non-critical
Risks fully covered
Mostly
100%
Strong
Little

PSM July 2004 20
USC
C S E University of Southern CaliforniaCenter for Software Engineering
Integration Stability (ISBLY) Indicates anticipated change in integration components during system of system integration activities.
Very Low Low Nominal High Very High Extra High
10% change during integration period
7% change during integration period
4% change during integration period
2% change during integration period
1% change during integration period
No change during integration period

PSM July 2004 21
USC
C S E University of Southern CaliforniaCenter for Software Engineering
Component Readiness (CREDY)Indicates readiness of component (sub-component) for integration. Includes level of verification and validation (V&V) that has been performed prior to integration and level of subsystem integration activities that have been performed prior to integration into the SOSIL.
Very Low Low Nominal High Very High Extra High
Minimally V&V’d No pre-integration
Some V&V Minimal pre-
integration
Moderate V&V Some pre-
integration
Considerable V&V
Moderate pre-integration
Extensive V&V
Considerable pre-integration
Thoroughly V&V’d Extensive pre-
integration

PSM July 2004 22
USC
C S E University of Southern CaliforniaCenter for Software Engineering
Integration Capability (ICAPY) Represents a multi-attribute parameter which includes the integration team cooperation and cohesion, integration personnel capability and continuity, and integration personnel experience (application, language, tool, and platform). ICAPY is the subjective weighted average of the listed characteristics.
Factor Very Low Low Nominal High Very High Extra High
ITEAM
IPERS
IPREX
• Very difficult team interactions
• 35th percentile• 30% turnover
rate
5 months experience with app, lang, tools, platforms
• Some difficult team interactions
• 45th percentile• 20% turnover
rate
• 9 months experience with app, lang, tools, platforms
• Basically cooperative teams
• 55th percentile• 12% turnover
rate
• 1 year experience with app, lang, tools, platforms
• Largely cooperative teams
• 65th percentile
• 9% turnover rate
• 2 years experience with app, lang, tools, platforms
• Highly cooperative teams
• 75th percentile
• 6% turnover rate
• 4 years experience with app, lang, tools, platforms
Seamless team interactions
85th percentile
• 4% turnover rate
• 6 years experience with app, lang, tools, platforms

PSM July 2004 23
USC
C S E University of Southern CaliforniaCenter for Software Engineering
Integration Processes (IPROC) Represents a parameter that rates the maturity level and completeness of an integration team’s integration processes, plans, and the SOS integration lab (SOSIL). IPROC is the subjective weighted average of the listed characteristics.
Very Low Low Nominal High Very High Extra High
Ad-hoc integration process
Minimal SOSIL CMMI Level 1
(lower half)
Minimal integration plans
Immature core SOSIL
CMMI Level 1 (upper half)
Some integration plans
Partly mature core SOSIL
CMMI Level 2
Moderate plans
Mature core SOSIL
CMMI Level 3
Considerable plans
Partly mature extended SOSIL
CMMI Level 4
Extensive plans Fully mature
extended SOSIL CMMI Level 5

PSM July 2004 24
USC
C S E University of Southern CaliforniaCenter for Software Engineering
Current Issues

PSM July 2004 25
USC
C S E University of Southern CaliforniaCenter for Software Engineering
Issues and Questions Currently Under Investigation
• What is the best size driver• If software size used
– Should it be limited to the software performing interface operations– How should COTS product interfaces be accounted for
• If number of logical interfaces is used– Which ones to include– What level to count– How to specify complexities associated with various interfaces
• Do user scenarios and user interfaces capture additional size information needed to better estimate level of effort
• If multiple size drivers used, what is the relative weight of each• Model outputs
– Desired granularity of effort estimates– Associated schedule?

PSM July 2004 26
USC
C S E University of Southern CaliforniaCenter for Software Engineering
Issues and Questions Currently Under Investigation (continued)
• How to ensure no overlap with COSYSMO or COCOMO II models
• Are current scale factors – Relevant– Sufficient
• Are current scale factor values/range of values appropriate
• How well do the various model variations track with respect to– Expert judgment– Actual experiences/projects

PSM July 2004 27
USC
C S E University of Southern CaliforniaCenter for Software Engineering
SOS Estimation Example Using Only Software Size as the Size Driver
Hazardous Materials ResponseSystem of Systems

PSM July 2004 28
USC
C S E University of Southern CaliforniaCenter for Software Engineering
System of System Architecture Example
HazardousMaterials
Response SOS
CommandAnd
Control3000 eKSLOC
NetworkComms
800 eKSLOC
SensorData
Processing500 eKSLOC
HazMatMaterials
Identification900 eKSLOC

PSM July 2004 29
USC
C S E University of Southern CaliforniaCenter for Software Engineering
SOS Integration Calculations with Nominal Level 1 and Level 0 Drivers
Level 0 ISMPL IRESL ISBLY CREDY ICAPY IPROC B0SOS 0.000 0.000 0.000 0.000 0.000 0.000 1.030
Level 1 ISMPL IRESL ISBLY CREDY ICAPY IPROC BiCommand and Control 0.000 0.000 0.000 0.000 0.000 0.000 1.040Network Comms 0.000 0.000 0.000 0.000 0.000 0.000 1.040Sensor Data Processing 0.000 0.000 0.000 0.000 0.000 0.000 1.040HazMat Material Identification 0.000 0.000 0.000 0.000 0.000 0.000 1.040
Level 1 eKSLOC A1 Bi IPMiCommand and Control 3000 1.000 1.040 4132.436Network Comms 800 1.000 1.040 1045.234Sensor Data Processing 600 1.000 1.040 774.956HazMat Material Identification 900 1.000 1.040 1181.441
Level 0Level 1
Effort Sum A0 B0 IPM(SOS)Sum 7134 1.000 1.030 9309.736
Total SOS Integration Effort: ~9310 Person Months or 775.8 Person Years

PSM July 2004 30
USC
C S E University of Southern CaliforniaCenter for Software Engineering
Potential Range of Values for Example
CasePerson Months
% of Total Estimated Nominal Development Effort
Nominal 9310 29%
Best 6477 20%
Worst 11907 37%

PSM July 2004 31
USC
C S E University of Southern CaliforniaCenter for Software Engineering
Parametric Cost Model Critical Path Tasks and Status
Converge on preliminary cost drivers, WBS
Converge on detailed definitions and rating scales
Obtain initial exploratory dataset
Refine model based on data collection and analysis experience
Obtain IOC calibration dataset
Refine IOC model and tool

PSM July 2004 32
USC
C S E University of Southern CaliforniaCenter for Software Engineering
Upcoming Calendar of Events: 2004/2005
2004 2005
USC CSE Annual Research Review(Los Angeles, CA)
COCOMO Forum(Los Angeles, CA)
J A S O N D J F M A M J
Practical Software & Systems Measurement Workshop (Keystone, CO)
Proposed First Working Group Meeting
…
PSM July 2004 33
USC
C S E University of Southern CaliforniaCenter for Software Engineering
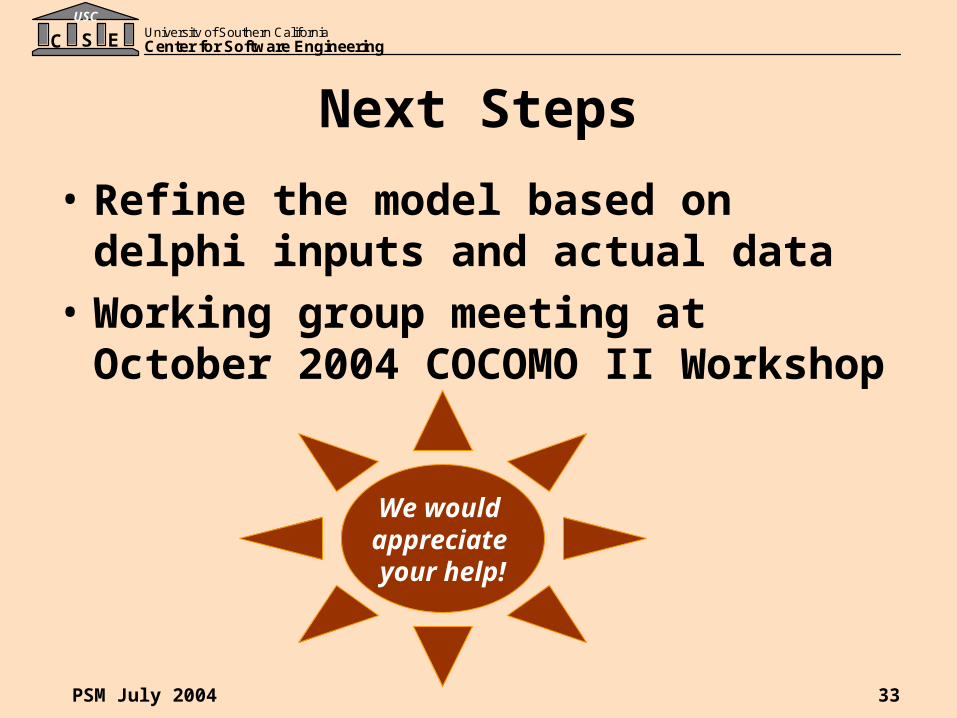
Next Steps
• Refine the model based on delphi inputs and actual data
• Working group meeting at October 2004 COCOMO II Workshop
We would appreciate your help!
PSM July 2004 34
USC
C S E University of Southern CaliforniaCenter for Software Engineering
Questions or Comments?• Jo Ann Lane
• Websites http://cse.usc.edu(COSOSIMO web site coming soon…)
• Books• Boehm, B., et al, Software Cost Estimation with COCOMOII, 1st Ed,
Prentice Hall, 2000• Boehm, B., Software Engineering Economics, 1st Ed, Prentice Hall,
1981
• Articles• Boehm, B., et al., Future Trends, Implications in Cost Estimation
Models, CrossTalk April 2000. • Gilligan, John M., Department of the Air Force, Military-Use
Software: Challenges and Opportunities, CrossTalk, January 2004.