pseudocode algorithms using sequence, selection, and repetition
TRANSCRIPT
Pseudocode Algorithms Using Sequence, Selection, and Repetition
Objectives
• In this chapter you will be able to:
• Develop solution algorithms to eight
typical programming problems using
sequence, selection, and repetition
constructs

• This chapter develops solution algorithms to eight programming problems of increasing complexity
• All the algorithms will use a combination of sequence, selection, and repetition constructs
• The algorithms have been designed to be interactive or to process sequential files
Eight Solution Algorithms

• It is important that you divide the problem
into its three components:
– Input
– Output
– Processing
1 Defining the Problem

2 The Control Structures Required
• Once the problem has been defined, write
down the control structures (sequence,
selection, and repetition) that may be
needed, as well as any extra variables that
the solution may require

3 The Solution Algorithm
• Having defined the problem and
determined the required control
structures, devise a solution algorithm
and represent it using pseudocode

4 Desk Checking
• You will need to desk check each of the
developed algorithms with two or more
test cases

Example 6.1 Process Number Pairs
• Design an algorithm that will prompt for and receive pairs of numbers from an operator at a terminal and display their sum, product, and average on the screen. If the calculated sum is over 200, an asterisk is to be displayed beside the sum. The program is to terminate when a pair of zero values is entered
• A Defining diagram (shown on page 74)

Example 6.1 Process Number Pairs
• A Defining diagram
Input Processing Output
number1 Prompt for numbers Sum
number2 Get numbers product
Calculate sum average
Calculate product *
Calculate average
Display sum, product, average
Display *

Example 6.1 Process Number Pairs
• B Solution algorithmProcess_number_pairs
Set sum to zeroPrompt for number1, number2Get number1, number2DOWHILE NOT (number1=0 AND number2=0)
sum = number1+number2product = number1*number2average = sum/2IF sum > 200 THEN
Display sum, *, product, averageELSE
Display sum, product, averageENDIF
Prompt for number1, number2Get number1, number2ENDDO
END

Example 6.2 Print Student Records
• A file of student records consists of ‘S’ records and ‘U’ records. An ‘S’ record contains the student’s number, name, age, gender, address, and attendance pattern; full-time (F/T) or part-time (P/T). A ‘U’ record contains the number and name of the unit or units in which the student has enrolled. There may be more than one ‘U’ record for each ‘S’ record. Design a solution algorithm that will read the file of student records and print only the student’s number, name, and address on a ‘STUDENT LIST’.
• A Defining Diagram (shown on page 75 of the text)

Example 6.2 Print Student Records
• A Defining Diagram
Input Processing Output
‘s’ records Print headings Heading line
• number Read student records Selected student records
• name Select ‘s’ records • number
• address Print selected records • name
• age • address
• gender
• attendance_pattern
‘u’ records

Example 6.2 Print Student Records
• B Solution algorithm
Print_student_recordsPrint ‘STUDENT LIST’ headingsRead student recordDOWHILE move records exist
IF student record = “S” record THENPrint student_number, name, address
ENDIFRead student record
ENDDOEND

Example 6.3 Print Selected Students
• Design a solution algorithm that will read the
same student file as in Example 6.2, and produce
a report of all female students who are enrolled
part-time. The report is to be headed ‘PART TIME
FEMALE STUDENTS’ and is to show the student’s
number, name, address, and age

Example 6.3 Print Selected Students
A Defining Diagram Input Processing Output
‘s’ records Print headings Heading line
• number Read student records Selected student records
• name Select P/T female students • number
• address Print selected records • name
• age • address
• gender • age
• attendance_pattern
‘u’ records

Example 6.3 Print Student Records
• B Solution algorithm – non-linear nested IF
Produce_part_time_female_listPrint ‘PART TIME FEMALE STUDENTS’ headingRead student recordDOWHILE more records
IF student record = “S” record THEN IF attendance_pattern = P/T THEN IF gender = female THEN Print student_number, name, address, age ENDIF ENDIFENDIFRead student record
ENDDOEND

Example 6.3 Print Student Records
• B Solution algorithm – nested and compound IF statement
Produce_part_time_female_listPrint ‘PART TIME FEMALE STUDENTS’ headingRead student recordDOWHILE more records
IF student record = “S” record THEN IF attendance_pattern = P/T AND gender = female THEN Print student_number, name, address, age ENDIFENDIFRead student record
ENDDOEND

Example 6.3 Print Student Records
• B Solution algorithm – compound IF
Produce_part_time_female_listPrint ‘PART TIME FEMALE STUDENTS’ headingRead student recordDOWHILE more records
IF student record = “S” record AND attendance_pattern = P/TAND gender = female THEN Print student_number, name, address, ageENDIFRead student record
ENDDOEND

Example 6.4 Print and Total Selected Students
• Design a solution algorithm that will read the same student file as in Example 6.3 and produce the same ‘PART TIME FEMALE STUDENTS’ report. In addition, you are to print at the end of the report the number of students who have been selected and listed, and the total number of students on the file
• A Defining Diagram (shown on page 78)

Example 6.4 Print and Total Selected Students
• B Control Structures Required
1. A DOWHILE loop to control the repetition
2. IF statements to select ‘S’, female, and P/T students
3. Accumulators for total_selected_students and total_students
• C Solution Algorithm
• Examine the code listed on page 78 of the textbook

Example 6.4 Print Student Records• B Solution algorithm
Produce_part_time_female_listPrint ‘FEMALE PART-TIME STUDENTS’ headingSet total_students to zeroSet total_selected_students to zeroRead student recordDOWHILE more records
IF student record = “S” record THEN increment total_students IF attendance_pattern = P/T AND gender = female THEN inrement total_selected_students Print student_number, name, address, age ENDIFENDIFRead student record
ENDDOPrint total_students, total_selected_students
END

Example 6.5 Print Student Report
• Design an algorithm that will read the same student file as in Example 6.4 and for each student, print the name, number, and attendance pattern from the ‘S’ records (student records) and the unit number and unit name from the ‘U’ records (enrolled units records) as shown on page 79 of the textbook. At the end of the report, print the total number of students enrolled
• A Defining Diagram (shown on page 79)

Example 6.5 Print Student Report
• B Control Structures Required
1. A DOWHILE loop to control the repetition
2. An IF statement to select ‘S’ or ‘U’ records
3. An accumulator for total_students
• C Solution Algorithm
• Examine the code illustrated on page 80 of the textbook for this program problem
Example 6.6 Produce Sales Report
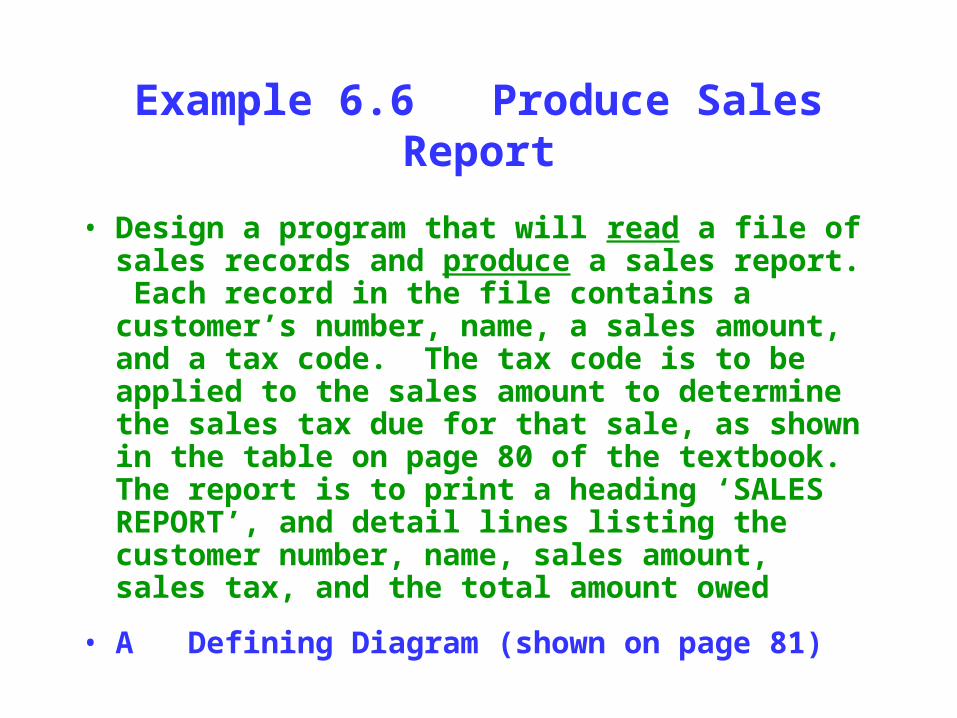
• Design a program that will read a file of sales records and produce a sales report. Each record in the file contains a customer’s number, name, a sales amount, and a tax code. The tax code is to be applied to the sales amount to determine the sales tax due for that sale, as shown in the table on page 80 of the textbook. The report is to print a heading ‘SALES REPORT’, and detail lines listing the customer number, name, sales amount, sales tax, and the total amount owed
• A Defining Diagram (shown on page 81)

Example 6.6 Produce Sales Report
• B Control Structures Required
1. A DOWHILE loop to control the repetition
2. A case statement to calculate the sales_tax
• C Solution Algorithm
• Examine the code illustrated on page 81 which is the solution for this program problem

Example 6.7 Student Test Results
• Design a solution algorithm that will read a file of student test results and produce a student test grades report. Each test record contains the student number, name, and test score (out of 50). The program is to calculate for each student the test score as a percentage and to print the student’s number, name, test score (out of 50), and letter grade on the report. The letter grade is determined using the listing on page 81 of the text
• A Defining Diagram (shown on page 82)

Example 6.7 Student test results
A Defining Diagram Input Processing Output
student test record Print headings Heading line
• student_number Read student records Student details
• name Calculate test percentage • student_number
• test_score Calculate letter grade • name
Print student details • test_score
• grade

Example 6.7 Student Test Results
• B Control Structures Required
1. A DOWHILE loop to control the repetition
2. A formula to calculate the percentage
3. A linear nested IF statement to calculate the grade. (The case construct cannot be used here, as CASE is not designed to cater for a range of values.)
• C Solution Algorithm
• Refer to the code shown on page 82 of the textbook

• B Solution algorithm
Print_student_resultsPrint ‘Student Test Grades’ headingRead student recordDOWHILE NOT EOFPercentage = test_score*2IF percentage > 89 THEN grade = AELSE IF percentage >89 THEN grade = B
ELSE IF precentage > 79 THEN grade = C
ELSE IF percentage > 69 THEN grade = D ELSE
grade = F ENDIFENDIF
ENDIFENDIF
Print studet_number, name, test_scoreRead student record ENDDOEND

Example 6.8 Gas Supply Billing
• Refer to the background of the Domestic Gas Supply
company on page 83 of the text. Design a solution
algorithm that will read the customer usage file, calculate
the amount owing for gas usage for each customer, and
print a report listing each customer’s number, name,
address, gas usage, and the amount owing. Read the
remainder of the problem specification on page 83 and at
the end of the report, print the total number of customers
and the total amount owed to the company
• A Defining Diagram (shown on page 83)

Example 6.8 Gas Supply Billing
• B Control Structures Required
1. A DOWHILE loop to control the repetition
2. An IF statement to calculate the amount_owing
3. Accumulators for total_customers and total_amount_owing
• C Solution Algorithm
• Examine the code shown on page 84 of the textbook, which shows the pseudocode for this problem
Summary
• This chapter developed solution algorithms to eight typical programming problems
• The approach to all eight problems followed the same pattern:
1. The problem was defined, using a defining diagram
2. The control structures required were written down, along with any extra variables required
3. The solution algorithm was produced, using pseudocode and the three basic control structures: sequence, selection, and repetition