psag gov paper seqjpo;[jo strat birk
TRANSCRIPT

8112019 PSAG GOV PAPER Seqjpo[jo Strat Birk
httpslidepdfcomreaderfullpsag-gov-paper-seqjpojo-strat-birk 132
Petroleum geology of South Australia Vol 2 Eromanga Basin 1
CHAPTER 7 Sequence stratigraphy
TB Cotton MF Scardigno and PJ Boult
INTRODUCTION 2
KEY CONCEPTS2
Accommodation space and sediment supply 2
Sequences and systems tracts2
Lowstand systems tract 3
Transgressive systems tract3 Highstand systems tract 3
POOLOWANNA FORMATION4
Stratigraphic traps4
HUTTON SANDSTONE 5
BIRKHEAD FORMATION6
Stratigraphic traps7
ADORI SANDSTONEWESTBOURNE FORMATION 7
NAMUR SANDSTONE 8
MURTA FORMATION 8
CADNA-OWIE FORMATION8
Wyandra Sandstone Member9
UPPER MARINE SUCCESSION9
FIGURES10
8112019 PSAG GOV PAPER Seqjpo[jo Strat Birk
httpslidepdfcomreaderfullpsag-gov-paper-seqjpojo-strat-birk 232
Chapter 7 Sequence Stratigraphy
Petroleum geology of South Australia Vol 2 Eromanga Basin 2
INTRODUCTION
Sequence stratigraphy provides a basis for the chronostratigraphic correlation of sediments and a valuable
exploration and reservoir development tool for the petroleum industry A sequence stratigraphic approach to
correlation on both a regional and field-scale coupled with an understanding of depositional environments and the
roles of accommodation space and sediment supply can aid in the reconstruction of palaeogeography and
prediction of temporal and spatial relationships between source reservoir and seal facies While the concepts of
sequence stratigraphy have been readily applied to passive margin and foreland basin settings there has been
significantly less focus on their application to intra-cratonic and fluvial-dominated basins (Posamentier and Allen
1999 Lang et al 2001)
In the Eromanga Basin sequence stratigraphy has been applied sporadically on a field and regional scale within a
lithostratigraphic framework to better understand the relationships between and distribution of key depositional
facies The relatively dense well coverage throughout the Cooper region of the Eromanga Basin in both South
Australia and Queensland forms the basis for the correlation of geophysical well logs and delineation of systems
tracts on a regional scale (eg Lanzilli 1999) The availability of high-resolution 3D seismic over producing
Eromanga Basin petroleum fields and the resultant ability to visualise facies elements through such techniques as
seismic amplitude mapping have enabled the application of sequence stratigraphic concepts on a field scale toenhance reservoir development and delineate potential stratigraphic traps (eg Nakanishi and Lang 2002)
While there has been widespread recognition of major sequence boundaries and flooding surfaces within various
studies a complete detailed sequence stratigraphic study of the entire Eromanga Basin sequences has yet to be
undertaken One of the principal reasons for the limited application of sequence stratigraphy is that exploration has
been relatively successful without the need for detailed studies of sediment distribution (Lanzilli 1999) A sequence
stratigraphic approach to the correlation of Eromanga Basin sediments together with the reconstruction and
understanding of palaeo-depositional environments has potential to provide new exploration and development
opportunities within the basin
KEY CONCEPTSThis chapter aims to review recent studies that have incorporated the use of sequence stratigraphy to better
understand and predict the spatial distribution of sedimentary facies within the Eromanga Basin sequence For a
comprehensive account of sequence stratigraphic concepts and their application to fluviolacustrine depositional
systems the reader is directed to these relevant publications Posamentier and Allen 1999 Lang et al 2001
Nakanishi and Lang 2002 There is however a need within this discussion to provide a brief review of some of the
basic concepts and ideas pertaining to the application of sequence stratigraphy within a dominantly fluviolacustrine
depositional environment
Accommodation space and sediment supply
To understand the distribution of sedimentary facies within any basin it is critical to understand the interaction
between accommodation space and sediment supply Accommodation space in fluviolacustrine settings is the
space between the ground surface (subaerial or subaqueous) and the fluvial equilibrium profile (base level) to
which sediments will potentially fill or be eroded in the case of negative accommodation (Fig 71 Posamentier and
Allen 1999) In the Eromanga Basin where marine influence and hence eustatic fluctuation was restricted to the
Early Cretaceous the dominant controls on accommodation space were largely provided by tectonically driven
periods of subsidence and uplift together A generally low accommodation space persisted in the Eromanga Basin
The rate type and amount of sediment entering the basin were influenced by a combination of factors including
provenance climate and topographic relief
Sequences and systems t racts A lsquotypicalrsquo fluviolacustrine sequence comprises a relatively conformable succession of genetically related strata
bounded by regionally significant unconformities (Posamentier and Allen 1999 Lang et al 2001) In this context
8112019 PSAG GOV PAPER Seqjpo[jo Strat Birk
httpslidepdfcomreaderfullpsag-gov-paper-seqjpojo-strat-birk 332
Chapter 7 Sequence Stratigraphy
Petroleum geology of South Australia Vol 2 Eromanga Basin 3
the entire Eromanga Basin can be considered as a single low-order JurassicndashCretaceous (JndashK) lsquosequencersquo with
relatively continuous deposition of sediments from the Early Jurassic Poolowanna Formation to the Late
Cretaceous Winton Formation and bounded by regional unconformities (Fig 72) In addition to the basin bounding
unconformities breaks in sedimentation occurred locally throughout most lithostratigraphic intervals in response to
a variety factors Thus a pragmatic approach should allow numerous higher order sequences such as K1 K2 and
K3 (Fig 72) to be defined within localised areas of the basin and in turn the identification and correlation of time
equivalent strata on a variety of scales
The concept of a systems tract allows for the division of a stratigraphic sequence in turn allowing for the prediction
of lithofacies occurrences within the basin
Lowstand systems tract
Within non-marine sequences the lowstand systems tract typically forms above a sequence boundary after a
period of negative accommodation and erosion (Fig 73) With a slow rise in fluvial accommodation incised fluvial
valleys will be filled or alternatively fluvial channels and floodplain deposits reworked into sheets of laterally
amalgamated sand (Fig 74) In the Eromanga Basin extensive sand-rich lowstand deposits within the
Algebuckina Hutton and Namur sandstones form significant reservoirs Above the basal Eromanga Basinunconformity the lower Poolowanna Formation is also in part characterised by areas of amalgamated channel
sands and isolated narrow extensions suggestive of infilled palaeovalleys (Basin Studies Subprogram 1989
Draper 2002) However the lowstand Poolowanna Formation does not contain the laterally extensive sand sheets
of the overlying formations and suggests a restriction to topographically low areas as a result of increased
sediment supply following the Late Triassic ndash Early Jurassic depositional hiatus (Fig 72)
Transgressive systems tract
The transgressive systems tract represents a period of increasing accommodation relative to sediment supply and
is separated from the lowstand systems tract by a transgressive surface (Fig 73) As relative base level begins to
rise either through an increase in the rate of accommodation creation or through a drop in sediment supply fluvialchannels will become increasingly isolated within aggrading muddy floodplain deposits (Fig 74) The obvious
implications for petroleum exploration and development are that within the transgressive systems tract reservoir
quality frequency and interconnectivity will become increasingly reduced However there will be an increase in the
deposition of finer grained facies (potential seals) together with increased potential for stratigraphic trap
development Further increases in fluvial accommodation may result in formation of extensive peat mires within
cool-temperate climates and ultimately development of floodplain lakes and swamps (Fig 74 Lang et al 2001)
At the height of fluvial accommodation extensive lake systems may develop as was the case during deposition of
the Birkhead and Murta formations when widespread lacustrine facies were deposited across the Eromanga Basin
The Eromanga sequence is characterised by several periods where major rises in relative base level led to
deposition of sediment within low-energy swamp lacustrine and shallow marine environments Deposition of theBirkhead Formation and Murta Formation culminated in the formation of extensive lake systems and regionally
identifiable flooding surfaces A further rise in base level occurred in the Early Cretaceous associated with a
significant increase in global sea level (Veevers 1984 Lang et al 2001) and led to a prolonged period of marine
conditions until the Late Cretaceous During these periods of transgression sedimentation was largely
characterised by deposition of fine-grained silts and muds in low-energy environments There was however
significant development of clean well-sorted sands in both lacustrine and marine high-energy shoreline
environments where wind and wave reworking of sediment was able to take place These shoreline sandstones
form significant productive reservoirs in many oil fields across the Eromanga Basin
Highstand systems tract
The highstand systems tract represents deposition in a period of decreasing accommodation space and is
separated from the transgressive systems tract by a maximum flooding surface (Fig 73) The maximum flooding
8112019 PSAG GOV PAPER Seqjpo[jo Strat Birk
httpslidepdfcomreaderfullpsag-gov-paper-seqjpojo-strat-birk 432
Chapter 7 Sequence Stratigraphy
Petroleum geology of South Australia Vol 2 Eromanga Basin 4
surface represents the transition from increasing to decreasing available accommodation space as the rate of
sediment supply exceeds its creation In practical terms the maximum flooding surface is defined from gamma ray
logs as a maximum peak at the transition from the generally fining upward profile of the transgressive systems tract
to a generally coarsening upward profile of the highstand systems tract As base level rise slows either through
decreased subsidence or increased sediment supply fluvial channel deposits above retreating swamp or lake
deposits become progressively more clustered with higher net sand to gross thickness ratios (Fig 74 Lang et al
2001)
POOLOWANNA FORMATION
At the onset of Poolowanna Formation deposition lowstand and early transgressive systems tract sediments were
deposited within the topographic lows above a sequence boundary that developed during the preceding period of
uplift and erosion These basal Poolowanna deposits are characterised by sheet sands with gradually more
isolated fluvial channels crevasse-splay and floodplain deposits up section The upper Poolowanna Formation
becomes even finer grained and is dominated by floodplainndashcrevasse-splay deposits and isolated thin beds of coal
Thick amalgamated lowstand channel sequences were primarily deposited west of the Birdsville Track Ridge and
in the Poolowanna Trough where the formation reaches its maximum thickness Moreover the formation thicknessis typically greater on the hanging wall of growth faults In the eastern part of the Eromanga Basin where it overlies
the Cooper Basin the Poolowanna Formation was not deposited on palaeo-geographical highs including the
Innamincka Dome and the Murteree Ridge (Alexander and Sansome 1996 Boult 1996) but where present is
dominated by generally fining upward sequences consistent with deposition during a period of transgression
Nakanishi and Lang (2002) provided a sequence stratigraphic interpretation of the Poolowanna Formation in the
Moorari and Pondrinie fields (Figs 75 76) in which they divided the Poolowanna Formation into a lower and upper
section of a transgressive systems tract based upon facies distribution and their relationship to the sequence
boundary In the Moorari Field two sections are characterised by fluvial channel facies that change laterally into
crevasse-splay and floodplain facies (Fig 75) The lower section fills the incised topographic relief before channel
abandonment and development of a laterally continuous shale-prone interval Nakanishi and Lang (2002) interpret
this interval as a transgressive systems tract brought about by elevated base level rise The upper section contains
a series of thin upward coarsening floodplain and floodplainndashcrevasse-splay complex facies with thin coals and
sands This has been interpreted as a progradational highstand systems tract succession of a crevasse-splay delta
system infilling a relatively shallow floodplain lake The sequence coarsens up before another laterally continuous
shale-prone interval which is interpreted as a second transgressive systems tract overlying a flooding surface
Correlation of wells across the Pondrinie Field (Fig 76) shows a similar distribution of sediment to that seen in the
Moorari Field Laterally discontinuous fluvial channel and crevasse-splay facies are interpreted as infilling incised
topographic relief before the development of laterally continuous shale-prone or coaly intervals in response to a
rapid base level rise or channel avulsion
Stratigraphic traps
Based on 3D seismic data visualisation techniques and gamma ray well log motifs (Figs 77 78) Nakanishi and
Lang (2002) were able to define the distribution of sedimentary facies between intra-Poolowanna Formation
seismic horizons over the Moorari and Pondrinie fields The interpreted seismic facies were then used to identify
potential stratigraphic traps and risks associated with each play
8112019 PSAG GOV PAPER Seqjpo[jo Strat Birk
httpslidepdfcomreaderfullpsag-gov-paper-seqjpojo-strat-birk 532
Chapter 7 Sequence Stratigraphy
Petroleum geology of South Australia Vol 2 Eromanga Basin 5
In the Moorari 3D survey area the mapped intra-Poolowanna horizon (Fig 79) shows
bull A meandering channel morphology in the SW which has been interpreted as part of a fluvial channel belt
bull A combined channel and sheet-like seismic facies extending from the channel belt towards the middle of the
survey area representing a crevasse-splay channel ndash delta complex
bull A sheet-like seismic facies in the NE that is also interpreted as a crevasse-splay delta incised by the base of
the overlying Hutton Sandstone
In the Pondrinie 3D survey area the mapped intra-Poolowanna horizon (Fig 78) shows a NEndashSW-elongated
amplitude pattern with wedge-shaped tributary patterns that narrow on both sides Well log motifs and high-
amplitude distribution show that the thickest Poolowanna intervals coincide with areas of high amplitude and
suggest a main incised valley through the Pondrinie area with tributaries that enter along the sides
The lateral variation of reservoir and seal properties where channel belt facies thin and pinch out within floodplain
facies is one of the key potential stratigraphic trap opportunities within the Poolowanna Formation highlighted by
Nakanishi and Lang (2002) In both Moorari and Pondrinie areas fluvial sandstones have been concentrated and
preserved within the centres of incised valleys such that there is both a potential lateral seal provided by the
pinching out of the channel belt and a potential top seal provided by the laterally continuous shale-prone or coalyintervals related to flooding surfaces (Fig 710) Crevasse-splay delta complexes sealed by floodplain deposits
also provide potential stratigraphic traps within the Poolowanna Formation however the crevasse-splay delta
sandstones tend to be thin and Nakanishi and Lang (2002) suggest that interconnected crevasse channels could
provide higher permeability conduits to gather hydrocarbons from the crevasse-splay complex
One of the principal risks to the formation of both stratigraphic and structural traps within the Poolowanna
Formation is widespread incision by the overlying Hutton Sandstone (Lanzilli 1999 Nakanishi and Lang 2001a b
Nakanishi and Lang 2002) Visualisation of the Poolowanna Formation within the Moorari Field by Nakanishi and
Lang (2002 Fig 79) has highlighted the potential for poor lateral and top seal as a result of incision by Hutton
Sandstone channels (Fig 710) and is a possible reason for limited discoveries of commercial Poolowanna
Formation reservoirs across the Eromanga Basin
HUTTON SANDSTONE
Over much of the Eromanga Basin a drop in relative base level resulted in erosion incision into the Poolowanna
Formation and creation of a widespread sequence boundary With the onset of Hutton Sandstone deposition above
this boundary equilibrium was maintained between an increased rate of sedimentation as a result of tectonic uplift
in the southwestern source area (Boult 1996) and the rate of accommodation creation This established conditions
suitable for deposition of the thick laterally extensive amalgamated lowstand systems tract sandstones that form
the principal productive reservoirs throughout the Eromanga Basin
Initial interpretations of the Hutton Sandstone were that its upper boundary is gradational or intertongues with the
transgressive systems tract deposits of the Birkhead Formation (ie Solomon and Ormsby 1984 Yew and Mills
1989 Alexander and Sansome 1996) A regional sequence stratigraphic study of the Birkhead Formation by
Lanzilli (1999) concluded that a regional sequence boundary exists near the top of the Hutton Sandstone (as
defined by lithology Fig 711) formed in response to regional tilting and uplift associated with subduction at the
eastern margin of the Australian Plate Interpretation of 2D seismic lines in the Tindilpie area and 3D seismic at
Gidgealpa reveals a palaeo-landscape of flat-topped ridges up to 97 m high between the incised river valleys that
constitute the sequence boundary (Boult et al 1998)
The lithological pick of the top of the Hutton Sandstone often varies from the sequence boundary between the
Hutton and the Birkhead It is commonly picked in wells at the first encounter of significant sand beneath the finer
grained Birkhead facies which in many cases is actually top of the basal Birkhead lowstand systems tract The real
8112019 PSAG GOV PAPER Seqjpo[jo Strat Birk
httpslidepdfcomreaderfullpsag-gov-paper-seqjpojo-strat-birk 632
Chapter 7 Sequence Stratigraphy
Petroleum geology of South Australia Vol 2 Eromanga Basin 6
sequence boundary is often cryptic with sand-on-sand contact between the two formations typical in lowstand
braided successions (Miall and Arush 2001)
BIRKHEAD FORMATION
At the onset of Birkhead Formation deposition the provenance of Eromanga Basin sediments progressively shifted
from a Gawler Craton source in the SW to a volcanic-arc source on the east Australian continental margin (Fig
712 Boult 1996 Boult et al 1998 Lanzilli 1999) The Middle Jurassic Birkhead Formation comprises lowstand
transgressive and highstand systems tract facies (Fig 711) This is in contrast to the work of Nakanishi et al
(2003) who designated the entire Birkhead Formation sequence over the Merrimelia Meranji and Pelican fields
(Fig 13) as a transgressive systems tract due to the absence of laterally continuous stacked fluvial channels within
the valley fill (Fig 713) Where the lowstand systems tract is very sandy the lithological marker for the top Hutton
Sandstone is often interpreted at the transgressive surface But if the highstand systems tract is muddy then the
sequence boundary is used for the top Hutton Sandstone In the southwestern (South Australian) region of the
Eromanga Basin a lowstand systems tract is well developed at the base of the Birkhead Formation overlying the
basal Birkhead unconformity (Boult et al 1998) Meandering fluvial channels were deposited during a period of
increased sediment supply and filled the incised topographic relief above the regional sequence boundary (Lanzilli
1999 Fig 714)
In the southwestern (South Australian) region the early Birkhead Formation sediments were initially sourced from
the southwestern cratonic areas (Fig 712) In the eastern (Queensland) region the lowstand systems tract
consists of eroded and reworked Hutton Sandstone together with labile-rich volcanic arc derived (VAD) sediments
(Fig 712) These are locally missing over palaeohighs in more proximal areas due to continued uplift and erosion
but increasingly thicken towards the basin depocentre in the northeast (Boult et al 1998 Lanzilli 1999 Fig 711)
With continued erosion and influx of volcanic-arc-derived sediments from the east the main basin drainage outlet
to the north along the Euroka Arch (Fig 11) became ever more restricted (Lanzilli 1999 Fig 715) This in turn led
to a rise in base level and deposition of fine-grained and organic-rich sediments within a low-energy meandering
fluvial swampy deltaic to lacustrine environment (Fig 716) This rise in base level marks the transgressive surface
and onset of the transgressive systems tract The transgressive surface separates the transgressive systems tract
from the lowstand systems tracts where present and is coincident with the sequence boundary where early
Birkhead deposition did not occur (Lanzilli 1999 Fig 711)
The transgressive systems tract saw an influx of lithic-rich volcanic-arc-derived sediment from the east which
initially intertongued with the waning supply of southerly sourced cratonic sediments before extending over the SW
of the basin (Lanzilli 1999) A continued rise in base level resulting from decreasing sediment supply or increased
subsidence led to flooding and widespread deposition of deltaic and lacustrine facies of lsquoLake Birkheadrsquo When the
rate of base level rise reached its peak a maximum flooding surface developed This surface marks the limit of
transgression and the maximum landward extent of lacustrine conditions within the Eromanga Basin during
Birkhead time The maximum flooding surface is identifiable regionally across the basin as a high gamma ray
spike or alternatively a sonic spike indicating the presence of an organic-rich low-density condensed section
caused by sediment starvation in the basin depocentre (Lanzilli 1999)
In the later stages of the transgressive systems tract and into the early highstand systems tract uplift of the
cratonic area to the south and SW resulted in increased supply of cratonic-derived sediments towards the basin
depocentre Tectonism and subsequent tilting during mid Birkhead Formation time might have allowed Lake
Birkhead to once again drain out through the Euroka Arch (Lanzilli 1999) The increase in sediment supply and
decrease in lake level resulted in progradation of sandier deposits towards the basin centre with a resultant
coarsening up of the sedimentary profile (Fig 716) Lanzilli (1999) interpreted a sequence boundary at the top of
the Birkhead Formation on the basis of gamma ray and sonic curves that represent a sharp change to cleancemented braided fluvial sandstones and an absence of coals In the Merrimelia and Meranji fieldsrsquo area (Fig 13)
8112019 PSAG GOV PAPER Seqjpo[jo Strat Birk
httpslidepdfcomreaderfullpsag-gov-paper-seqjpojo-strat-birk 732
Chapter 7 Sequence Stratigraphy
Petroleum geology of South Australia Vol 2 Eromanga Basin 7
Nakanishi et al (2003) determined from seismic analysis that the top of the Birkhead Formation does not show
significant undulation and cannot be considered a significant erosional surface and sequence boundary
Stratigraphic traps
Nakanishi and Lang (2002) highlighted the potential for the formation of stratigraphic traps within the Birkhead
Formation through the identification of sedimentary facies and their distribution in the Merrimelia Meranji and
Pelican fields (Fig 13) Well logs combined with 3D seismic amplitude visualisation over the middle to upper part
of the formation indicate a well developed meandering fluvial channel system including point bars and abandoned
channels (Fig 717) Correlation of wells through the area show fluvial channels that pass laterally into crevasse-
splay and floodplain facies with laterally continuous shale-prone intervals identified as flooding surfaces (Nakanishi
et al 2003 Fig 713) Point bar sandstones within the channel belt were identified as potential stratigraphic
reservoirs where they are juxtaposed against fine-grained abandoned channel facies to provide a lateral seal
Intervals that are interpreted as shale from gamma ray logs may actually turn out to be high gamma siltstones or
sandstones upon core inspection rather than being potentially extensive top and bottom seals to reservoir facies
While point bar sandstones so far drilled within the Merrimelia Meranji and Pelican fields are known to be water
wet most reservoirs in the area are lt5 m thick and consist of crevasse-splay channel and crevasse-splay delta
facies The lateral thinning of sandstones into adjacent floodplain deposits combined with the probabledevelopment of widespread shaly intervals highlights the potential for the development of Birkhead Formation
stratigraphic traps elsewhere in the basin
In the Merrimelia Field oil accumulations exist in two discrete intervals a Hutton ndash basal Birkhead reservoir and a
middle Birkhead Formation reservoir Although the basal Birkhead reservoir is scattered a common oilndashwater
contact suggests that it acts within the HuttonndashBirkhead transition as a single reservoir The middle Birkhead
reservoir shows significant lateral facies change from sandstone to shale with thin coal beds Water-bearing
sandstones occur both above and below the reservoir interval and sands at the same depth level do not always
contain oil accumulations Consequently the oil pool in the mid Birkhead Formation can be considered as a
stratigraphic trap (Nakanishi and Lang 2002 Nakanishi et al 2003)
In the Dirkala and Dirkala South fields (Fig 13) Birkhead Formation reservoirs are restricted to fluvial channel
facies A lateral change from the channel fill facies to floodplain mudstone occurs up dip within structural closure
and causes a pinch-out stratigraphic trap and thus the reservoir has both a structural and stratigraphic component
(Mackie and Gumley 1995)
ADORI SANDSTONEWESTBOURNE FORMATION
The Adori Sandstone and Westbourne Formation represent a similar couplet to that of the Hutton Sandstone and
Birkhead Formation (Wiltshire 1989 Boult 1996) However both the Adori Sandstone and Westbourne Formation
are not as extensive and are restricted to the northern part of the Cooper region and eastern most Pedirka region in
South Australia (Alexander and Sansome 1996) Where the Westbourne Formation does not exist then the Adoriand Namur sandstones are amalgamated and the entire sequence is called the Namur Sandstone
The lower part of Adori Sandstone was deposited above a sequence boundary at the top of the Birkhead Formation
and predominantly consists of amalgamated braided fluvial sandstones that represent a lowstand systems tract
The sandstones higher in the formation become fine grained with a greater prevalence of siltstone and
carbonaceous material before a conformable transition into dark grey shale siltstone and minor sandstone
interbeds of the Westbourne Formation The AdorindashWestbourne lithostratigraphic boundary is defined from an
increase in gamma ray decrease in resistivity and slower sonic log values (Grey et al 2002) However from a
sequence stratigraphic perspective a transgressive systems tract can be defined from the onset of finer grained
facies in the Adori Sandstone to a maximum flooding surface within the lacustrine deposits of the upper
Westbourne Formation Depending on the location within the basin the maximum flooding surface may not be
preserved due to erosion and development of a widespread sequence boundary at the base of the overlying Namur
Sandstone (Gorter 1994) In areas where significant uplift occurred at the time of sequence boundary
8112019 PSAG GOV PAPER Seqjpo[jo Strat Birk
httpslidepdfcomreaderfullpsag-gov-paper-seqjpojo-strat-birk 832
Chapter 7 Sequence Stratigraphy
Petroleum geology of South Australia Vol 2 Eromanga Basin 8
development ie the Nebine Ridge that separates the Eromanga from Surat Basin (Fig 11) the Adori Sandstone
Westbourne Formation and upper Birkhead Formation may have all been eroded (Boult 1996)
NAMUR SANDSTONE
The Namur Sandstone consists of lowstand braided fluvial sandstones conformable on the Birkhead Formation
across most of the basin in South Australia and intertongues with the Westbourne Formation Gorter (1994) and
Theologou (1995) both interpreted a mid Namur Sandstone sequence boundary that represents incision into the
underlying mid Namur shale (Fig 718) However the development of a lsquomid Namur shalersquo related to a base level
rise as suggested by Theologou (1995) is uncertain due to only minor amounts of fine-grained sediment being
present in many wells across the basin Whether there is in fact a significant regional sequence boundary at the
mid Namur level is also unclear since it may instead be associated with the Westbourne Formation and since the
studies by both Gorter (1994) and Theologou (1995) were limited in their areal extent Also one of the key
arguments of Gorter for a sequence boundary was correlation with the 1285 Ma global sea level fall and any
marine influence within the intracratonic Eromanga Basin at that time has not been established Despite these
uncertainties what has been classified litho-stratigraphically as the Namur Sandstone can be considered as a
lowstand systems tract with transition to the meandering fluvial and lacustrine conditions of the McKinlay Member
and Murta Formation representing a rise in base level and onset of transgressive systems tract deposition
MURTA FORMATION
The Murta Formation was deposited in meandering fluvial floodplain and lacustrine environments and represents
an increase in fluvial accommodation and reduction in depositional energy from the lowstand braided fluvial
deposits of the underlying Namur Sandstone Theologou (1995) interpreted the transitional fine sandstone and
carbonaceous siltstone of the McKinlay Member which directly overlies the Namur Sandstone to be the onset of
the transgressive systems tract It was proposed by Theologou (1995) that the thickness trends of the McKinlay
Member represent the distribution of active Namur channels just prior to onset of transgression
Lang et al (2001) interpreted the Murta Formation at Maxwell in Queensland as consisting of two transgressivendash regressive cycles separated by a wave-ravinement surface (see Posamentier and Allen 1999 Lang et al 2001)
The wave-ravinement surface occurs within lacustrine shoreface sandstones and represents the change from
decreasing to increasing accommodation This can be seen on gamma ray logs as the onset of a retrogradational
stacking pattern (Fig 719) The two maximum flooding surfaces identified by Lang et al (2001) mark the boundary
between the transgressive and highstand systems tracts and can be seen on logs and in core as condensed
sections or hard grounds These markers can be recognised regionally in the Murta Formation across the
Eromanga Basin (Fig 718)
Zoellner (1988) and Gorter (1994) also interpreted the Murta Formation in South West Queensland as containing
two major transgressivendashregressive cycles however both authors suggested the presence of a sequence boundary
separating the two Gorter (1994) argued for the presence of a sequence boundary on the basis that sandstoneswithin the upper Murta Formation were in fact incised valley fill and constituted a lowstand systems tract (Fig 720)
CADNA-OWIE FORMATION
The lower part of the Cadna-owie Formation is conformable on the Murta Formation and marks the transition from
terrestrial to marine depositional environments with inundation occurring during the Early Cretaceous global sea
level rise The most significant marine influence is evident in sediments of the lower Cadna-owie Formation and a
peak in gamma ray log values across the basin shows a maximum flooding surface at the base of the succession
(Grey et al 2002) The maximum flooding surface marks the onset of the highstand systems tract and a period of
reduced accommodation that sees a steady decrease in gamma ray log values in wells across the basin In more
distal marine environments this decrease corresponds to the gradual change from mudstone and siltstonedeposition to siltstones and labile-rich sandstones deposited at the shoreface and on the coastal plain
8112019 PSAG GOV PAPER Seqjpo[jo Strat Birk
httpslidepdfcomreaderfullpsag-gov-paper-seqjpojo-strat-birk 932
Chapter 7 Sequence Stratigraphy
Petroleum geology of South Australia Vol 2 Eromanga Basin 9
Wyandra Sandstone Member
The upper part of the Cadna-owie Formation has been termed the Wyandra Sandstone Member with its base
defined by a regional sequence boundary overlain by amalgamated fluvial distributary channel fill (Fig 721 Lang
et al 2001) The sequence stratigraphy of the Wyandra Sandstone Member in Queensland was described by Lang
et al (2001) to comprise a lowstand systems tract that in-filled fluvial channels above the sequence boundary and
a transgressive systems tract marked by the deposition of tidally influenced sediments at the onset of a further
period of marine inundation (Fig 721) In the upper section of the Wyandra Sandstone Member two higher order
flooding sequences (Fig 721) are interpreted to represent sudden palaeo-bathymetric increases and are marked
by deposition of heterolithic marine strata in the increasingly distal depositional system (Lang et al 2001)
UPPER MARINE SUCCESSION
Following deposition of the Wyandra Sandstone Member continued subsidence created further marine
transgression and sufficient accommodation space for rapid accumulation of the thick fossiliferous mudstones and
siltstones of the Bulldog Shale and Wallumbilla Formation A maximum marine transgression was reached during
deposition of the mid to upper Bulldog Shale and equivalents and corresponds to global sea level maxima for that
time (Moussavi-Harami 1996) This maximum marine flooding surface can easily be recognised in wells across the
basin as the transition from increasing to decreasing gamma ray log values
Continued regression during deposition of the upper Bulldog Shale culminated in deposition of the Coorikiana
Sandstone in a shoreline environment Worldwide sea level again rose rapidly in the late Albian with deposition of
the main marine shales and mudstones of the upper Marree Subgroup (Moussavi-Harami 1996) While smaller
order cycles of transgression and regression can be identified within the upper Cretaceous sequence
sedimentation continued predominantly within marine and marginal marine environments until in the Late
Cretaceous when the region returned to terrestrial sedimentation and deposition of the fluviolacustrine Winton
Formation of the upper Marree Subgroup The Eromanga Basin fill culminates with the Winton Formation which is
unconformably overlain by Tertiary sediments of the Lake Eyre Basin
8112019 PSAG GOV PAPER Seqjpo[jo Strat Birk
httpslidepdfcomreaderfullpsag-gov-paper-seqjpojo-strat-birk 1032
Chapter 7 Sequence Stratigraphy
Petroleum geology of South Australia Vol 2 Eromanga Basin 10
FIGURES
71 Schematic representation of positive and negative fluvial accommodation (a b) Illustrate an equilibrium
profile that corresponds to base level with no net erosion or deposition of sediment (c) A fall in equilibrium
profile resulting in erosion of sediment (d) A rise in the equilibrium profile resulting in aggradation of
sediment (After Posamentier and Allen 1999)
72 Generalised stratigraphic column and sequences of the Cooper Eromanga and Lake Eyre basins (afterMoussavi-Harami 1996)
73 Alluvial sequence stratigraphic model illustrating alluvial lowstand (LST) transgressive (TST) and
highstand (HST) systems tracts Key surfaces shown which separate systems tracts are sequence
boundaries (SB) transgressive surfaces (TS) and maximum flooding surfaces (MFS) (After Lang et al
2001)
74 Fluvial channel stacking patterns in relation to the amount and rate of available accommodation (after Lang
et al 2001 Allen et al 1996)
75 Sequence stratigraphic correlation of the Poolowanna Formation within the Moorari 3D seismic survey area
(after Nakanishi and Lang 2001a Nakanishi and Lang 2002)
76 Sequence stratigraphic correlation of the Poolowanna Formation within the Pondrinie 3D seismic surveyarea (after Nakanishi and Lang 2001b Nakanishi and Lang 2002)
77 Two-way time structure map of an intra-Poolowanna seismic horizon Moorari Field showing interpreted
sedimentary facies and gamma ray well log motifs (after Nakanishi and Lang 2001a Nakanishi and Lang
2002)
78 Two-way time structure map of an intra-Poolowanna seismic horizon Pondrinie Field showing interpreted
sedimentary facies and gamma ray well log motifs (after Nakanishi and Lang 2001b Nakanishi and Lang
2002)
79 Interpretation of sedimentary environments within of the upper Poolowanna Formation Moorari Field (after
Nakanishi and Lang 2001a Nakanishi and Lang 2002)
710 Schematic section showing potential Poolowanna Formation stratigraphic plays (a) Moorari Field (b)Pondrinie Field (After Nakanishi and Lang 2001a b Nakanishi and Lang 2002)
711 Sequence stratigraphic and chronostratigraphic summary of the Birkhead Formation (after Boult et al
1998 Lanzilli 1999)
712 Schematic 3D palaeogeography during the early phase of Birkhead deposition showing the influx of
cratonic-derived sediment from the south and volcanic-arc-derived sediment from the east (after Boult et
al 1998)
713 Sedimentary facies distribution and sequence stratigraphic correlation of the Birkhead Formation in the
Merrimelia and Meranji fieldsrsquo area (after Nakanishi et al 2003)
714 Schematic 3D palaeogeography during the deposition of the lowstand systems tract of the Birkhead
Formation in the GidgealpandashTindilpie area (after Boult et al 1998 Lanzilli 1999)
715 Palaeogeographic maps (a) Indicates palaeodrainage direction and source area below the sequence
boundary during Hutton time (b) With tilting of the Eromanga Basin and uplift of the volcanic arc
sediments of the lower Birkhead Formation were increasingly derived from the east with cessation of
supply from the southwestern cratonic source (After Boult et al 1997)
716 Generalised sequence through the Birkhead Formation and top Hutton Sandstone (after Lanzilli 1999)
717 Sedimentary facies interpretation of the middle-upper Birkhead Formation based on 3D seismic amplitude
variation and well logs within the Merrimelia Meranji and Pelican fieldsrsquo area (after Nakanishi et al 2003)
718 Regional WndashE cross-section from Gidgealpa 19 in South Australia to Maxwell 1 in Queensland showing
the relationship between the braided fluvial deposits of the Namur Sandstone and meandering fluvial-
lacustrine deposits of the Murta Formation (after Theologou 1995)
8112019 PSAG GOV PAPER Seqjpo[jo Strat Birk
httpslidepdfcomreaderfullpsag-gov-paper-seqjpojo-strat-birk 1132
Chapter 7 Sequence Stratigraphy
Petroleum geology of South Australia Vol 2 Eromanga Basin 11
719 A typical well log of the Murta Formation from the Maxwell Field showing two major transgressivendash
regressive cycles (after Lang et al 2001)
720 NndashS cross-section Maxwell 1 to Mungoora 1 in Southwest Queensland showing an interpreted Murta
Formation sequence boundary and incised valley fill that represents the lowstand systems tract (after
Gorter 1994)
721 Generalised stratigraphic log of the Wyandra Sandstone Member Cadna-owie Formation showing key
surfaces and systems tracts The sequence boundary (SB) occurs at the base of the fluvial sandstones the
transgressive surface (TS) is marked by the onset of tidal structures and the two flooding surfaces (FS)
correlate to heterolithic bioturbated marine strata (After Lang et al 2001 Root 2001)
8112019 PSAG GOV PAPER Seqjpo[jo Strat Birk
httpslidepdfcomreaderfullpsag-gov-paper-seqjpojo-strat-birk 1232
202770_108
(a)
(b)
(c)
(d)
Figure 71 Schematic representation of positive and negative fluvial accommodation (a b) Illustrate an
equilibrium profile that corresponds to base level with no net erosion or deposition of sediment
(c) A fall in equilibrium profile resulting in erosion of sediment (d) A rise in the equilibrium profile
resulting in aggradation of sediment (After Posamentier and Allen 1999)
8112019 PSAG GOV PAPER Seqjpo[jo Strat Birk
httpslidepdfcomreaderfullpsag-gov-paper-seqjpojo-strat-birk 1332
Figure 72 Generalised stratigraphic column and sequences of the Cooper Eromanga and Lake Eyre basins(after Moussavi-Harami 1996)
8112019 PSAG GOV PAPER Seqjpo[jo Strat Birk
httpslidepdfcomreaderfullpsag-gov-paper-seqjpojo-strat-birk 1432
Figure 73 Alluvial sequence stratigraphic model illustrating alluvial losystems tracts are sequence boundaries (SB) transgressive surface
8112019 PSAG GOV PAPER Seqjpo[jo Strat Birk
httpslidepdfcomreaderfullpsag-gov-paper-seqjpojo-strat-birk 1532
202770_111
(a)
(c)
(e)
(b)
(d)
Figure 74 Fluvial channel stacking patterns in relation to the amount and rate of available accommodation
(after Lang et al 2001 Allen et al 1996)
8112019 PSAG GOV PAPER Seqjpo[jo Strat Birk
httpslidepdfcomreaderfullpsag-gov-paper-seqjpojo-strat-birk 1632
-50 m
50 m
0 m
Figure 75 Sequence stratigraphic correlation of the Poolowanna Formation Moorari 3D seismi
8112019 PSAG GOV PAPER Seqjpo[jo Strat Birk
httpslidepdfcomreaderfullpsag-gov-paper-seqjpojo-strat-birk 1732
-50 m
50 m
0 m
100 m
NAP-1 NAP-2 YAL-1 N
Figure 76 Sequence stratigraphic correlation of the Poolowanna Formation Pon
8112019 PSAG GOV PAPER Seqjpo[jo Strat Birk
httpslidepdfcomreaderfullpsag-gov-paper-seqjpojo-strat-birk 1832
202770_114
Figure 77 Two-way time structure map of an intra-Poolowanna seismic horizon Moorari Field showing interpreted sedimentary facies and gamma ray well log motifs (afterNakanishi and Lang 2001a Nakanishi and Lang 2002)
8112019 PSAG GOV PAPER Seqjpo[jo Strat Birk
httpslidepdfcomreaderfullpsag-gov-paper-seqjpojo-strat-birk 1932
Figure 78 Two-way time structure map of an intra-Poolowanna seismic horizon Pondrinie Field showing interpreted sedimenta(after Nakanishi and Lang 2001b Nakanishiand Lang 2002)
8112019 PSAG GOV PAPER Seqjpo[jo Strat Birk
httpslidepdfcomreaderfullpsag-gov-paper-seqjpojo-strat-birk 2032
202770_116
Figure 79 Interpretation of sedimentary environments within the upper Poolowanna Formation Moorari Field (after Nakanishi and Lang 2001a Nakanishi 2002)
8112019 PSAG GOV PAPER Seqjpo[jo Strat Birk
httpslidepdfcomreaderfullpsag-gov-paper-seqjpojo-strat-birk 2132
Figure 710 Schematic section showing potential Poolowanna Formation stratigraphic plays (a) Moorari Field (b) Pondrinie Field (After Nakanishi and Lang 2001ab Nakanishi and Lang 2002)
8112019 PSAG GOV PAPER Seqjpo[jo Strat Birk
httpslidepdfcomreaderfullpsag-gov-paper-seqjpojo-strat-birk 2232
Chronostratigraphic Section
Figure 711 Sequence stratigraphic and chronostratigraphic summary of the Birkhead Formation
8112019 PSAG GOV PAPER Seqjpo[jo Strat Birk
httpslidepdfcomreaderfullpsag-gov-paper-seqjpojo-strat-birk 2332
Birkhead FormationUnit II (reworked Hutton)
Pre-Jurassic
Craton-derivedquartz arenites
Low energymeanderingfluvial to deltafill facies
R i f t i n g o f An t a r c t i c a
High energyaeolian braidedfluvial facies
Base BirkheaFormation Qu
N e e
b i n e
R i d g e
P T
N
T
Openlacustrinefacies
G M I R
i d g e
M
J
J
B
Q
L D
S A
Er om
anga
Basin
South
Austr
alian
High
lands
Hutt o
n S an
Figure 712 Schematic 3D palaeogeography during the early phase of Birkhead deposition showing
derived sediment from the east (after Boult et al 1998)
8112019 PSAG GOV PAPER Seqjpo[jo Strat Birk
httpslidepdfcomreaderfullpsag-gov-paper-seqjpojo-strat-birk 2432
-50 m
50 m
0 m
100 m
MERANJI-7 PELICAN-1MERANJI-4 PELICAN
Figure 713 Sedimentary facies distribution and sequence stratigraphic correlation of
8112019 PSAG GOV PAPER Seqjpo[jo Strat Birk
httpslidepdfcomreaderfullpsag-gov-paper-seqjpojo-strat-birk 2532
202770_119
Figure 714 Schematic 3D palaeogeography during the deposition of the lowstand systems tract of the Birkhea(after Boult et al 1998 Lanzilli 1999)
8112019 PSAG GOV PAPER Seqjpo[jo Strat Birk
httpslidepdfcomreaderfullpsag-gov-paper-seqjpojo-strat-birk 2632
140deg
Early Birkheadtime
BraidedHutton
Low energyand reworked
BirkheadHutton
Labile sandstonewedge (mostlylow energy inEromanga Basin)
J
20deg
30deg
M
B
Restricted outletto lsquoLake Birkheadrsquo
B i r d s
v i l l e T
R
Craton-derived
sediments
Volcanic-arc-
derived Sediments
G
lake
Sydney
Braided Hutton
Cratonic sourcearea
V o l c a n
i c A r c
140deg 150deg
20deg
30deg
40deg
500 km
Presentshoreline
Mesozoicbasin
202770 082
(a)
(b) 150
= maximum influenceof labile sediment
Cratonic source
area
l a t e
H
t t u
o n
e x i t
ear ly Hu t t o n
e x i t
Hutton time
BGJM
= Bodalla South= Gidgealpa= Jackson= Moorari
8112019 PSAG GOV PAPER Seqjpo[jo Strat Birk
httpslidepdfcomreaderfullpsag-gov-paper-seqjpojo-strat-birk 2732
202770_121
Figure 716 Generalised sequence through the Birkhead Formation and top Hutton Sandstone
(after Lanzilli 1999)
8112019 PSAG GOV PAPER Seqjpo[jo Strat Birk
httpslidepdfcomreaderfullpsag-gov-paper-seqjpojo-strat-birk 2832
202770_122
Figure 717 Sedimentary facies interpretation of the middlendashupper Birkhead Formation based on 3D seismic amplitude variation and well logs Merrimelia Meranji and Pelican fields area
(after Nakanishi et al 2003)
8112019 PSAG GOV PAPER Seqjpo[jo Strat Birk
httpslidepdfcomreaderfullpsag-gov-paper-seqjpojo-strat-birk 2932
Wantanna 1
Gidgealpa 19 Challum
Arrabury 1
Pondrinnie 1Bookaburdle 10
Tirrawarra 10Fly Lake 4
Marine
Distal LacustrineProximal Lacustrine
Lacustrinefluvialtransition
Braided fluvial
Fluvial incision
Flooding surfaceMaximum Flooding surface
Formation boundary
Figure 718 Regional WndashE cross-section from Gidgealpa 19 (South Australia) to Maxwell 1 (QueensSandstone and meandering fluvialndashlacustrine deposits of the Murta Formation (after Theologou 19
8112019 PSAG GOV PAPER Seqjpo[jo Strat Birk
httpslidepdfcomreaderfullpsag-gov-paper-seqjpojo-strat-birk 3032
202770_124
Figure 719 Typical well log of the Murta Formation from the Maxwell Field
showing two major transgressivendashregressive cycles (after Lang et al 2001)
8112019 PSAG GOV PAPER Seqjpo[jo Strat Birk
httpslidepdfcomreaderfullpsag-gov-paper-seqjpojo-strat-birk 3132
Figure 720 NndashS cross-section from Maxwell 1 to Mungoora 1 (South West Queensland) showing an interpreted Murta Formaboundary and incised valley fill that represents the lowstand systems tract (after Gorter 1994)
8112019 PSAG GOV PAPER Seqjpo[jo Strat Birk
httpslidepdfcomreaderfullpsag-gov-paper-seqjpojo-strat-birk 3232
202770_126

8112019 PSAG GOV PAPER Seqjpo[jo Strat Birk
httpslidepdfcomreaderfullpsag-gov-paper-seqjpojo-strat-birk 1132
Chapter 7 Sequence Stratigraphy
Petroleum geology of South Australia Vol 2 Eromanga Basin 11
719 A typical well log of the Murta Formation from the Maxwell Field showing two major transgressivendash
regressive cycles (after Lang et al 2001)
720 NndashS cross-section Maxwell 1 to Mungoora 1 in Southwest Queensland showing an interpreted Murta
Formation sequence boundary and incised valley fill that represents the lowstand systems tract (after
Gorter 1994)
721 Generalised stratigraphic log of the Wyandra Sandstone Member Cadna-owie Formation showing key
surfaces and systems tracts The sequence boundary (SB) occurs at the base of the fluvial sandstones the
transgressive surface (TS) is marked by the onset of tidal structures and the two flooding surfaces (FS)
correlate to heterolithic bioturbated marine strata (After Lang et al 2001 Root 2001)
8112019 PSAG GOV PAPER Seqjpo[jo Strat Birk
httpslidepdfcomreaderfullpsag-gov-paper-seqjpojo-strat-birk 1232
202770_108
(a)
(b)
(c)
(d)
Figure 71 Schematic representation of positive and negative fluvial accommodation (a b) Illustrate an
equilibrium profile that corresponds to base level with no net erosion or deposition of sediment
(c) A fall in equilibrium profile resulting in erosion of sediment (d) A rise in the equilibrium profile
resulting in aggradation of sediment (After Posamentier and Allen 1999)
8112019 PSAG GOV PAPER Seqjpo[jo Strat Birk
httpslidepdfcomreaderfullpsag-gov-paper-seqjpojo-strat-birk 1332
Figure 72 Generalised stratigraphic column and sequences of the Cooper Eromanga and Lake Eyre basins(after Moussavi-Harami 1996)
8112019 PSAG GOV PAPER Seqjpo[jo Strat Birk
httpslidepdfcomreaderfullpsag-gov-paper-seqjpojo-strat-birk 1432
Figure 73 Alluvial sequence stratigraphic model illustrating alluvial losystems tracts are sequence boundaries (SB) transgressive surface
8112019 PSAG GOV PAPER Seqjpo[jo Strat Birk
httpslidepdfcomreaderfullpsag-gov-paper-seqjpojo-strat-birk 1532
202770_111
(a)
(c)
(e)
(b)
(d)
Figure 74 Fluvial channel stacking patterns in relation to the amount and rate of available accommodation
(after Lang et al 2001 Allen et al 1996)
8112019 PSAG GOV PAPER Seqjpo[jo Strat Birk
httpslidepdfcomreaderfullpsag-gov-paper-seqjpojo-strat-birk 1632
-50 m
50 m
0 m
Figure 75 Sequence stratigraphic correlation of the Poolowanna Formation Moorari 3D seismi
8112019 PSAG GOV PAPER Seqjpo[jo Strat Birk
httpslidepdfcomreaderfullpsag-gov-paper-seqjpojo-strat-birk 1732
-50 m
50 m
0 m
100 m
NAP-1 NAP-2 YAL-1 N
Figure 76 Sequence stratigraphic correlation of the Poolowanna Formation Pon
8112019 PSAG GOV PAPER Seqjpo[jo Strat Birk
httpslidepdfcomreaderfullpsag-gov-paper-seqjpojo-strat-birk 1832
202770_114
Figure 77 Two-way time structure map of an intra-Poolowanna seismic horizon Moorari Field showing interpreted sedimentary facies and gamma ray well log motifs (afterNakanishi and Lang 2001a Nakanishi and Lang 2002)
8112019 PSAG GOV PAPER Seqjpo[jo Strat Birk
httpslidepdfcomreaderfullpsag-gov-paper-seqjpojo-strat-birk 1932
Figure 78 Two-way time structure map of an intra-Poolowanna seismic horizon Pondrinie Field showing interpreted sedimenta(after Nakanishi and Lang 2001b Nakanishiand Lang 2002)
8112019 PSAG GOV PAPER Seqjpo[jo Strat Birk
httpslidepdfcomreaderfullpsag-gov-paper-seqjpojo-strat-birk 2032
202770_116
Figure 79 Interpretation of sedimentary environments within the upper Poolowanna Formation Moorari Field (after Nakanishi and Lang 2001a Nakanishi 2002)
8112019 PSAG GOV PAPER Seqjpo[jo Strat Birk
httpslidepdfcomreaderfullpsag-gov-paper-seqjpojo-strat-birk 2132
Figure 710 Schematic section showing potential Poolowanna Formation stratigraphic plays (a) Moorari Field (b) Pondrinie Field (After Nakanishi and Lang 2001ab Nakanishi and Lang 2002)
8112019 PSAG GOV PAPER Seqjpo[jo Strat Birk
httpslidepdfcomreaderfullpsag-gov-paper-seqjpojo-strat-birk 2232
Chronostratigraphic Section
Figure 711 Sequence stratigraphic and chronostratigraphic summary of the Birkhead Formation
8112019 PSAG GOV PAPER Seqjpo[jo Strat Birk
httpslidepdfcomreaderfullpsag-gov-paper-seqjpojo-strat-birk 2332
Birkhead FormationUnit II (reworked Hutton)
Pre-Jurassic
Craton-derivedquartz arenites
Low energymeanderingfluvial to deltafill facies
R i f t i n g o f An t a r c t i c a
High energyaeolian braidedfluvial facies
Base BirkheaFormation Qu
N e e
b i n e
R i d g e
P T
N
T
Openlacustrinefacies
G M I R
i d g e
M
J
J
B
Q
L D
S A
Er om
anga
Basin
South
Austr
alian
High
lands
Hutt o
n S an
Figure 712 Schematic 3D palaeogeography during the early phase of Birkhead deposition showing
derived sediment from the east (after Boult et al 1998)
8112019 PSAG GOV PAPER Seqjpo[jo Strat Birk
httpslidepdfcomreaderfullpsag-gov-paper-seqjpojo-strat-birk 2432
-50 m
50 m
0 m
100 m
MERANJI-7 PELICAN-1MERANJI-4 PELICAN
Figure 713 Sedimentary facies distribution and sequence stratigraphic correlation of
8112019 PSAG GOV PAPER Seqjpo[jo Strat Birk
httpslidepdfcomreaderfullpsag-gov-paper-seqjpojo-strat-birk 2532
202770_119
Figure 714 Schematic 3D palaeogeography during the deposition of the lowstand systems tract of the Birkhea(after Boult et al 1998 Lanzilli 1999)
8112019 PSAG GOV PAPER Seqjpo[jo Strat Birk
httpslidepdfcomreaderfullpsag-gov-paper-seqjpojo-strat-birk 2632
140deg
Early Birkheadtime
BraidedHutton
Low energyand reworked
BirkheadHutton
Labile sandstonewedge (mostlylow energy inEromanga Basin)
J
20deg
30deg
M
B
Restricted outletto lsquoLake Birkheadrsquo
B i r d s
v i l l e T
R
Craton-derived
sediments
Volcanic-arc-
derived Sediments
G
lake
Sydney
Braided Hutton
Cratonic sourcearea
V o l c a n
i c A r c
140deg 150deg
20deg
30deg
40deg
500 km
Presentshoreline
Mesozoicbasin
202770 082
(a)
(b) 150
= maximum influenceof labile sediment
Cratonic source
area
l a t e
H
t t u
o n
e x i t
ear ly Hu t t o n
e x i t
Hutton time
BGJM
= Bodalla South= Gidgealpa= Jackson= Moorari
8112019 PSAG GOV PAPER Seqjpo[jo Strat Birk
httpslidepdfcomreaderfullpsag-gov-paper-seqjpojo-strat-birk 2732
202770_121
Figure 716 Generalised sequence through the Birkhead Formation and top Hutton Sandstone
(after Lanzilli 1999)
8112019 PSAG GOV PAPER Seqjpo[jo Strat Birk
httpslidepdfcomreaderfullpsag-gov-paper-seqjpojo-strat-birk 2832
202770_122
Figure 717 Sedimentary facies interpretation of the middlendashupper Birkhead Formation based on 3D seismic amplitude variation and well logs Merrimelia Meranji and Pelican fields area
(after Nakanishi et al 2003)
8112019 PSAG GOV PAPER Seqjpo[jo Strat Birk
httpslidepdfcomreaderfullpsag-gov-paper-seqjpojo-strat-birk 2932
Wantanna 1
Gidgealpa 19 Challum
Arrabury 1
Pondrinnie 1Bookaburdle 10
Tirrawarra 10Fly Lake 4
Marine
Distal LacustrineProximal Lacustrine
Lacustrinefluvialtransition
Braided fluvial
Fluvial incision
Flooding surfaceMaximum Flooding surface
Formation boundary
Figure 718 Regional WndashE cross-section from Gidgealpa 19 (South Australia) to Maxwell 1 (QueensSandstone and meandering fluvialndashlacustrine deposits of the Murta Formation (after Theologou 19
8112019 PSAG GOV PAPER Seqjpo[jo Strat Birk
httpslidepdfcomreaderfullpsag-gov-paper-seqjpojo-strat-birk 3032
202770_124
Figure 719 Typical well log of the Murta Formation from the Maxwell Field
showing two major transgressivendashregressive cycles (after Lang et al 2001)
8112019 PSAG GOV PAPER Seqjpo[jo Strat Birk
httpslidepdfcomreaderfullpsag-gov-paper-seqjpojo-strat-birk 3132
Figure 720 NndashS cross-section from Maxwell 1 to Mungoora 1 (South West Queensland) showing an interpreted Murta Formaboundary and incised valley fill that represents the lowstand systems tract (after Gorter 1994)
8112019 PSAG GOV PAPER Seqjpo[jo Strat Birk
httpslidepdfcomreaderfullpsag-gov-paper-seqjpojo-strat-birk 3232
202770_126
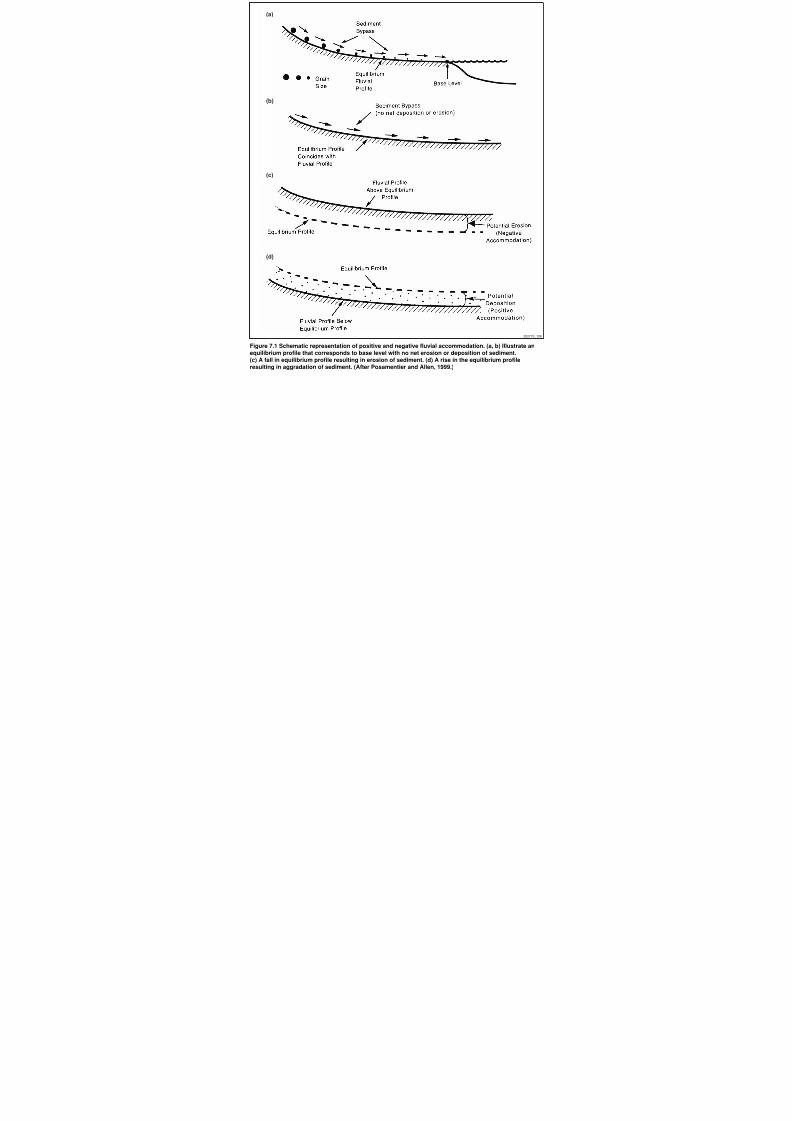
8112019 PSAG GOV PAPER Seqjpo[jo Strat Birk
httpslidepdfcomreaderfullpsag-gov-paper-seqjpojo-strat-birk 1232
202770_108
(a)
(b)
(c)
(d)
Figure 71 Schematic representation of positive and negative fluvial accommodation (a b) Illustrate an
equilibrium profile that corresponds to base level with no net erosion or deposition of sediment
(c) A fall in equilibrium profile resulting in erosion of sediment (d) A rise in the equilibrium profile
resulting in aggradation of sediment (After Posamentier and Allen 1999)
8112019 PSAG GOV PAPER Seqjpo[jo Strat Birk
httpslidepdfcomreaderfullpsag-gov-paper-seqjpojo-strat-birk 1332
Figure 72 Generalised stratigraphic column and sequences of the Cooper Eromanga and Lake Eyre basins(after Moussavi-Harami 1996)
8112019 PSAG GOV PAPER Seqjpo[jo Strat Birk
httpslidepdfcomreaderfullpsag-gov-paper-seqjpojo-strat-birk 1432
Figure 73 Alluvial sequence stratigraphic model illustrating alluvial losystems tracts are sequence boundaries (SB) transgressive surface
8112019 PSAG GOV PAPER Seqjpo[jo Strat Birk
httpslidepdfcomreaderfullpsag-gov-paper-seqjpojo-strat-birk 1532
202770_111
(a)
(c)
(e)
(b)
(d)
Figure 74 Fluvial channel stacking patterns in relation to the amount and rate of available accommodation
(after Lang et al 2001 Allen et al 1996)
8112019 PSAG GOV PAPER Seqjpo[jo Strat Birk
httpslidepdfcomreaderfullpsag-gov-paper-seqjpojo-strat-birk 1632
-50 m
50 m
0 m
Figure 75 Sequence stratigraphic correlation of the Poolowanna Formation Moorari 3D seismi
8112019 PSAG GOV PAPER Seqjpo[jo Strat Birk
httpslidepdfcomreaderfullpsag-gov-paper-seqjpojo-strat-birk 1732
-50 m
50 m
0 m
100 m
NAP-1 NAP-2 YAL-1 N
Figure 76 Sequence stratigraphic correlation of the Poolowanna Formation Pon
8112019 PSAG GOV PAPER Seqjpo[jo Strat Birk
httpslidepdfcomreaderfullpsag-gov-paper-seqjpojo-strat-birk 1832
202770_114
Figure 77 Two-way time structure map of an intra-Poolowanna seismic horizon Moorari Field showing interpreted sedimentary facies and gamma ray well log motifs (afterNakanishi and Lang 2001a Nakanishi and Lang 2002)
8112019 PSAG GOV PAPER Seqjpo[jo Strat Birk
httpslidepdfcomreaderfullpsag-gov-paper-seqjpojo-strat-birk 1932
Figure 78 Two-way time structure map of an intra-Poolowanna seismic horizon Pondrinie Field showing interpreted sedimenta(after Nakanishi and Lang 2001b Nakanishiand Lang 2002)
8112019 PSAG GOV PAPER Seqjpo[jo Strat Birk
httpslidepdfcomreaderfullpsag-gov-paper-seqjpojo-strat-birk 2032
202770_116
Figure 79 Interpretation of sedimentary environments within the upper Poolowanna Formation Moorari Field (after Nakanishi and Lang 2001a Nakanishi 2002)
8112019 PSAG GOV PAPER Seqjpo[jo Strat Birk
httpslidepdfcomreaderfullpsag-gov-paper-seqjpojo-strat-birk 2132
Figure 710 Schematic section showing potential Poolowanna Formation stratigraphic plays (a) Moorari Field (b) Pondrinie Field (After Nakanishi and Lang 2001ab Nakanishi and Lang 2002)
8112019 PSAG GOV PAPER Seqjpo[jo Strat Birk
httpslidepdfcomreaderfullpsag-gov-paper-seqjpojo-strat-birk 2232
Chronostratigraphic Section
Figure 711 Sequence stratigraphic and chronostratigraphic summary of the Birkhead Formation
8112019 PSAG GOV PAPER Seqjpo[jo Strat Birk
httpslidepdfcomreaderfullpsag-gov-paper-seqjpojo-strat-birk 2332
Birkhead FormationUnit II (reworked Hutton)
Pre-Jurassic
Craton-derivedquartz arenites
Low energymeanderingfluvial to deltafill facies
R i f t i n g o f An t a r c t i c a
High energyaeolian braidedfluvial facies
Base BirkheaFormation Qu
N e e
b i n e
R i d g e
P T
N
T
Openlacustrinefacies
G M I R
i d g e
M
J
J
B
Q
L D
S A
Er om
anga
Basin
South
Austr
alian
High
lands
Hutt o
n S an
Figure 712 Schematic 3D palaeogeography during the early phase of Birkhead deposition showing
derived sediment from the east (after Boult et al 1998)
8112019 PSAG GOV PAPER Seqjpo[jo Strat Birk
httpslidepdfcomreaderfullpsag-gov-paper-seqjpojo-strat-birk 2432
-50 m
50 m
0 m
100 m
MERANJI-7 PELICAN-1MERANJI-4 PELICAN
Figure 713 Sedimentary facies distribution and sequence stratigraphic correlation of
8112019 PSAG GOV PAPER Seqjpo[jo Strat Birk
httpslidepdfcomreaderfullpsag-gov-paper-seqjpojo-strat-birk 2532
202770_119
Figure 714 Schematic 3D palaeogeography during the deposition of the lowstand systems tract of the Birkhea(after Boult et al 1998 Lanzilli 1999)
8112019 PSAG GOV PAPER Seqjpo[jo Strat Birk
httpslidepdfcomreaderfullpsag-gov-paper-seqjpojo-strat-birk 2632
140deg
Early Birkheadtime
BraidedHutton
Low energyand reworked
BirkheadHutton
Labile sandstonewedge (mostlylow energy inEromanga Basin)
J
20deg
30deg
M
B
Restricted outletto lsquoLake Birkheadrsquo
B i r d s
v i l l e T
R
Craton-derived
sediments
Volcanic-arc-
derived Sediments
G
lake
Sydney
Braided Hutton
Cratonic sourcearea
V o l c a n
i c A r c
140deg 150deg
20deg
30deg
40deg
500 km
Presentshoreline
Mesozoicbasin
202770 082
(a)
(b) 150
= maximum influenceof labile sediment
Cratonic source
area
l a t e
H
t t u
o n
e x i t
ear ly Hu t t o n
e x i t
Hutton time
BGJM
= Bodalla South= Gidgealpa= Jackson= Moorari
8112019 PSAG GOV PAPER Seqjpo[jo Strat Birk
httpslidepdfcomreaderfullpsag-gov-paper-seqjpojo-strat-birk 2732
202770_121
Figure 716 Generalised sequence through the Birkhead Formation and top Hutton Sandstone
(after Lanzilli 1999)
8112019 PSAG GOV PAPER Seqjpo[jo Strat Birk
httpslidepdfcomreaderfullpsag-gov-paper-seqjpojo-strat-birk 2832
202770_122
Figure 717 Sedimentary facies interpretation of the middlendashupper Birkhead Formation based on 3D seismic amplitude variation and well logs Merrimelia Meranji and Pelican fields area
(after Nakanishi et al 2003)
8112019 PSAG GOV PAPER Seqjpo[jo Strat Birk
httpslidepdfcomreaderfullpsag-gov-paper-seqjpojo-strat-birk 2932
Wantanna 1
Gidgealpa 19 Challum
Arrabury 1
Pondrinnie 1Bookaburdle 10
Tirrawarra 10Fly Lake 4
Marine
Distal LacustrineProximal Lacustrine
Lacustrinefluvialtransition
Braided fluvial
Fluvial incision
Flooding surfaceMaximum Flooding surface
Formation boundary
Figure 718 Regional WndashE cross-section from Gidgealpa 19 (South Australia) to Maxwell 1 (QueensSandstone and meandering fluvialndashlacustrine deposits of the Murta Formation (after Theologou 19
8112019 PSAG GOV PAPER Seqjpo[jo Strat Birk
httpslidepdfcomreaderfullpsag-gov-paper-seqjpojo-strat-birk 3032
202770_124
Figure 719 Typical well log of the Murta Formation from the Maxwell Field
showing two major transgressivendashregressive cycles (after Lang et al 2001)
8112019 PSAG GOV PAPER Seqjpo[jo Strat Birk
httpslidepdfcomreaderfullpsag-gov-paper-seqjpojo-strat-birk 3132
Figure 720 NndashS cross-section from Maxwell 1 to Mungoora 1 (South West Queensland) showing an interpreted Murta Formaboundary and incised valley fill that represents the lowstand systems tract (after Gorter 1994)
8112019 PSAG GOV PAPER Seqjpo[jo Strat Birk
httpslidepdfcomreaderfullpsag-gov-paper-seqjpojo-strat-birk 3232
202770_126
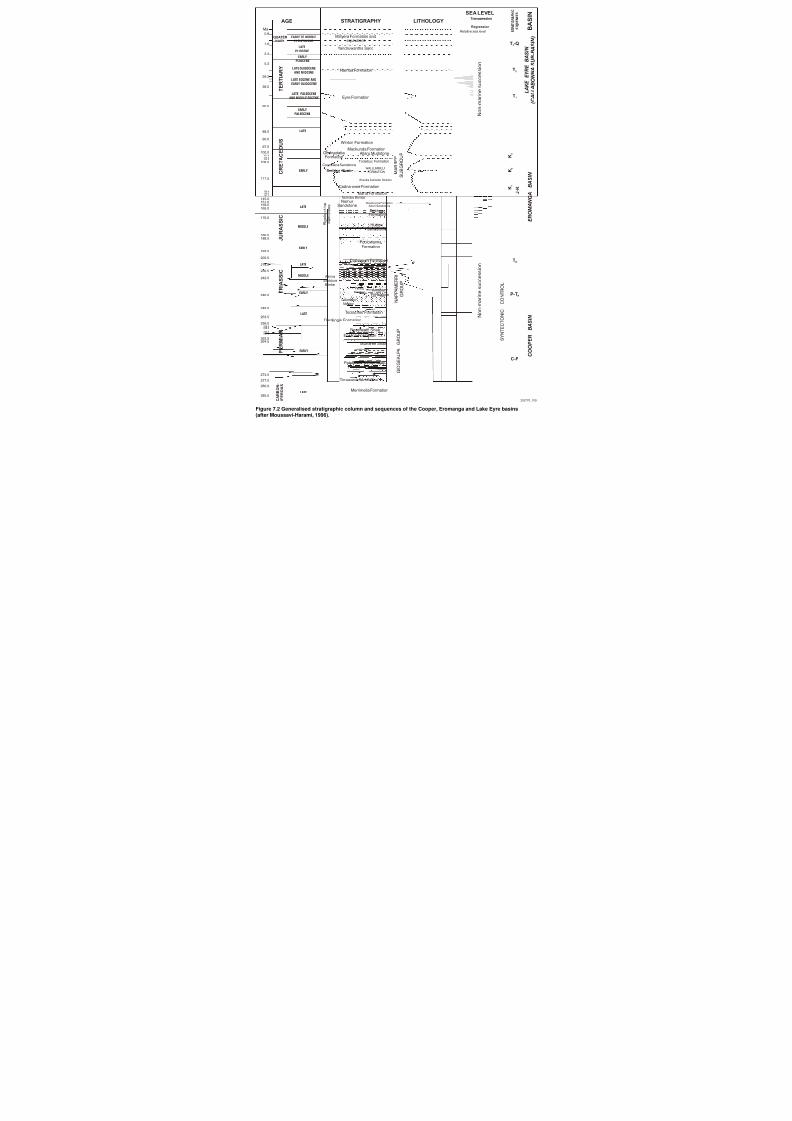
8112019 PSAG GOV PAPER Seqjpo[jo Strat Birk
httpslidepdfcomreaderfullpsag-gov-paper-seqjpojo-strat-birk 1432
Figure 73 Alluvial sequence stratigraphic model illustrating alluvial losystems tracts are sequence boundaries (SB) transgressive surface
8112019 PSAG GOV PAPER Seqjpo[jo Strat Birk
httpslidepdfcomreaderfullpsag-gov-paper-seqjpojo-strat-birk 1532
202770_111
(a)
(c)
(e)
(b)
(d)
Figure 74 Fluvial channel stacking patterns in relation to the amount and rate of available accommodation
(after Lang et al 2001 Allen et al 1996)
8112019 PSAG GOV PAPER Seqjpo[jo Strat Birk
httpslidepdfcomreaderfullpsag-gov-paper-seqjpojo-strat-birk 1632
-50 m
50 m
0 m
Figure 75 Sequence stratigraphic correlation of the Poolowanna Formation Moorari 3D seismi
8112019 PSAG GOV PAPER Seqjpo[jo Strat Birk
httpslidepdfcomreaderfullpsag-gov-paper-seqjpojo-strat-birk 1732
-50 m
50 m
0 m
100 m
NAP-1 NAP-2 YAL-1 N
Figure 76 Sequence stratigraphic correlation of the Poolowanna Formation Pon
8112019 PSAG GOV PAPER Seqjpo[jo Strat Birk
httpslidepdfcomreaderfullpsag-gov-paper-seqjpojo-strat-birk 1832
202770_114
Figure 77 Two-way time structure map of an intra-Poolowanna seismic horizon Moorari Field showing interpreted sedimentary facies and gamma ray well log motifs (afterNakanishi and Lang 2001a Nakanishi and Lang 2002)
8112019 PSAG GOV PAPER Seqjpo[jo Strat Birk
httpslidepdfcomreaderfullpsag-gov-paper-seqjpojo-strat-birk 1932
Figure 78 Two-way time structure map of an intra-Poolowanna seismic horizon Pondrinie Field showing interpreted sedimenta(after Nakanishi and Lang 2001b Nakanishiand Lang 2002)
8112019 PSAG GOV PAPER Seqjpo[jo Strat Birk
httpslidepdfcomreaderfullpsag-gov-paper-seqjpojo-strat-birk 2032
202770_116
Figure 79 Interpretation of sedimentary environments within the upper Poolowanna Formation Moorari Field (after Nakanishi and Lang 2001a Nakanishi 2002)
8112019 PSAG GOV PAPER Seqjpo[jo Strat Birk
httpslidepdfcomreaderfullpsag-gov-paper-seqjpojo-strat-birk 2132
Figure 710 Schematic section showing potential Poolowanna Formation stratigraphic plays (a) Moorari Field (b) Pondrinie Field (After Nakanishi and Lang 2001ab Nakanishi and Lang 2002)
8112019 PSAG GOV PAPER Seqjpo[jo Strat Birk
httpslidepdfcomreaderfullpsag-gov-paper-seqjpojo-strat-birk 2232
Chronostratigraphic Section
Figure 711 Sequence stratigraphic and chronostratigraphic summary of the Birkhead Formation
8112019 PSAG GOV PAPER Seqjpo[jo Strat Birk
httpslidepdfcomreaderfullpsag-gov-paper-seqjpojo-strat-birk 2332
Birkhead FormationUnit II (reworked Hutton)
Pre-Jurassic
Craton-derivedquartz arenites
Low energymeanderingfluvial to deltafill facies
R i f t i n g o f An t a r c t i c a
High energyaeolian braidedfluvial facies
Base BirkheaFormation Qu
N e e
b i n e
R i d g e
P T
N
T
Openlacustrinefacies
G M I R
i d g e
M
J
J
B
Q
L D
S A
Er om
anga
Basin
South
Austr
alian
High
lands
Hutt o
n S an
Figure 712 Schematic 3D palaeogeography during the early phase of Birkhead deposition showing
derived sediment from the east (after Boult et al 1998)
8112019 PSAG GOV PAPER Seqjpo[jo Strat Birk
httpslidepdfcomreaderfullpsag-gov-paper-seqjpojo-strat-birk 2432
-50 m
50 m
0 m
100 m
MERANJI-7 PELICAN-1MERANJI-4 PELICAN
Figure 713 Sedimentary facies distribution and sequence stratigraphic correlation of
8112019 PSAG GOV PAPER Seqjpo[jo Strat Birk
httpslidepdfcomreaderfullpsag-gov-paper-seqjpojo-strat-birk 2532
202770_119
Figure 714 Schematic 3D palaeogeography during the deposition of the lowstand systems tract of the Birkhea(after Boult et al 1998 Lanzilli 1999)
8112019 PSAG GOV PAPER Seqjpo[jo Strat Birk
httpslidepdfcomreaderfullpsag-gov-paper-seqjpojo-strat-birk 2632
140deg
Early Birkheadtime
BraidedHutton
Low energyand reworked
BirkheadHutton
Labile sandstonewedge (mostlylow energy inEromanga Basin)
J
20deg
30deg
M
B
Restricted outletto lsquoLake Birkheadrsquo
B i r d s
v i l l e T
R
Craton-derived
sediments
Volcanic-arc-
derived Sediments
G
lake
Sydney
Braided Hutton
Cratonic sourcearea
V o l c a n
i c A r c
140deg 150deg
20deg
30deg
40deg
500 km
Presentshoreline
Mesozoicbasin
202770 082
(a)
(b) 150
= maximum influenceof labile sediment
Cratonic source
area
l a t e
H
t t u
o n
e x i t
ear ly Hu t t o n
e x i t
Hutton time
BGJM
= Bodalla South= Gidgealpa= Jackson= Moorari
8112019 PSAG GOV PAPER Seqjpo[jo Strat Birk
httpslidepdfcomreaderfullpsag-gov-paper-seqjpojo-strat-birk 2732
202770_121
Figure 716 Generalised sequence through the Birkhead Formation and top Hutton Sandstone
(after Lanzilli 1999)
8112019 PSAG GOV PAPER Seqjpo[jo Strat Birk
httpslidepdfcomreaderfullpsag-gov-paper-seqjpojo-strat-birk 2832
202770_122
Figure 717 Sedimentary facies interpretation of the middlendashupper Birkhead Formation based on 3D seismic amplitude variation and well logs Merrimelia Meranji and Pelican fields area
(after Nakanishi et al 2003)
8112019 PSAG GOV PAPER Seqjpo[jo Strat Birk
httpslidepdfcomreaderfullpsag-gov-paper-seqjpojo-strat-birk 2932
Wantanna 1
Gidgealpa 19 Challum
Arrabury 1
Pondrinnie 1Bookaburdle 10
Tirrawarra 10Fly Lake 4
Marine
Distal LacustrineProximal Lacustrine
Lacustrinefluvialtransition
Braided fluvial
Fluvial incision
Flooding surfaceMaximum Flooding surface
Formation boundary
Figure 718 Regional WndashE cross-section from Gidgealpa 19 (South Australia) to Maxwell 1 (QueensSandstone and meandering fluvialndashlacustrine deposits of the Murta Formation (after Theologou 19
8112019 PSAG GOV PAPER Seqjpo[jo Strat Birk
httpslidepdfcomreaderfullpsag-gov-paper-seqjpojo-strat-birk 3032
202770_124
Figure 719 Typical well log of the Murta Formation from the Maxwell Field
showing two major transgressivendashregressive cycles (after Lang et al 2001)
8112019 PSAG GOV PAPER Seqjpo[jo Strat Birk
httpslidepdfcomreaderfullpsag-gov-paper-seqjpojo-strat-birk 3132
Figure 720 NndashS cross-section from Maxwell 1 to Mungoora 1 (South West Queensland) showing an interpreted Murta Formaboundary and incised valley fill that represents the lowstand systems tract (after Gorter 1994)
8112019 PSAG GOV PAPER Seqjpo[jo Strat Birk
httpslidepdfcomreaderfullpsag-gov-paper-seqjpojo-strat-birk 3232
202770_126
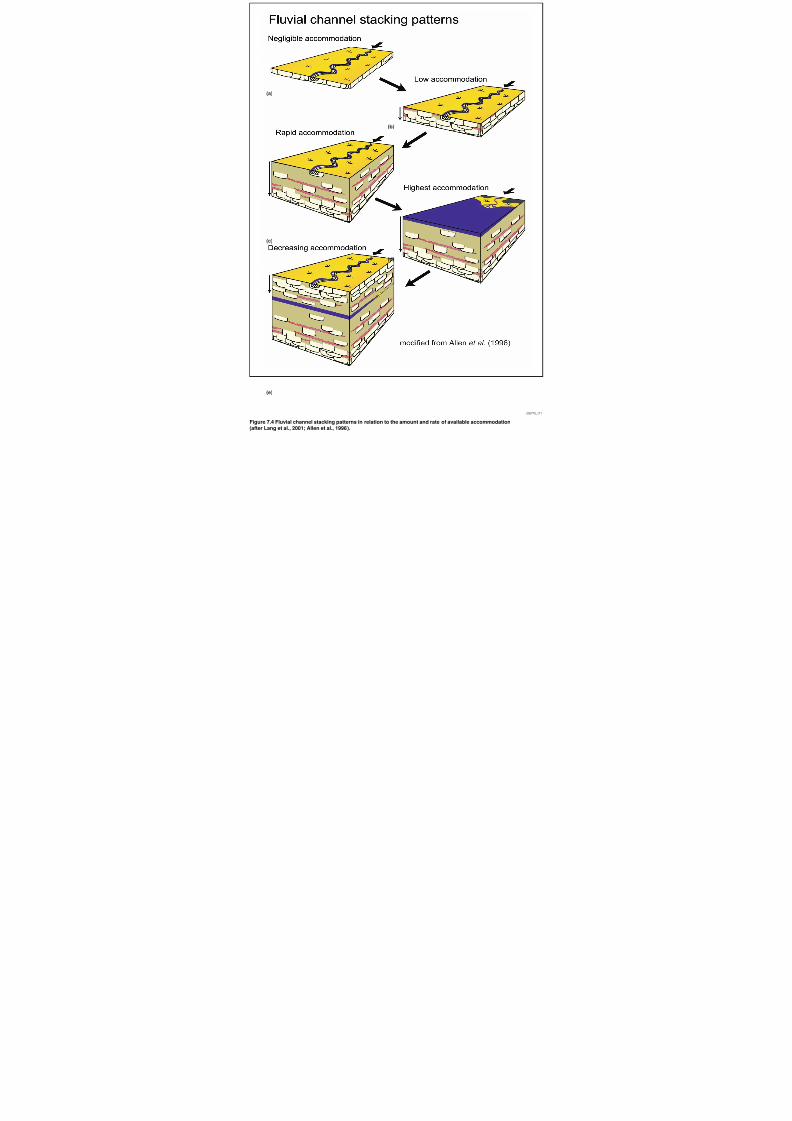
8112019 PSAG GOV PAPER Seqjpo[jo Strat Birk
httpslidepdfcomreaderfullpsag-gov-paper-seqjpojo-strat-birk 1532
202770_111
(a)
(c)
(e)
(b)
(d)
Figure 74 Fluvial channel stacking patterns in relation to the amount and rate of available accommodation
(after Lang et al 2001 Allen et al 1996)
8112019 PSAG GOV PAPER Seqjpo[jo Strat Birk
httpslidepdfcomreaderfullpsag-gov-paper-seqjpojo-strat-birk 1632
-50 m
50 m
0 m
Figure 75 Sequence stratigraphic correlation of the Poolowanna Formation Moorari 3D seismi
8112019 PSAG GOV PAPER Seqjpo[jo Strat Birk
httpslidepdfcomreaderfullpsag-gov-paper-seqjpojo-strat-birk 1732
-50 m
50 m
0 m
100 m
NAP-1 NAP-2 YAL-1 N
Figure 76 Sequence stratigraphic correlation of the Poolowanna Formation Pon
8112019 PSAG GOV PAPER Seqjpo[jo Strat Birk
httpslidepdfcomreaderfullpsag-gov-paper-seqjpojo-strat-birk 1832
202770_114
Figure 77 Two-way time structure map of an intra-Poolowanna seismic horizon Moorari Field showing interpreted sedimentary facies and gamma ray well log motifs (afterNakanishi and Lang 2001a Nakanishi and Lang 2002)
8112019 PSAG GOV PAPER Seqjpo[jo Strat Birk
httpslidepdfcomreaderfullpsag-gov-paper-seqjpojo-strat-birk 1932
Figure 78 Two-way time structure map of an intra-Poolowanna seismic horizon Pondrinie Field showing interpreted sedimenta(after Nakanishi and Lang 2001b Nakanishiand Lang 2002)
8112019 PSAG GOV PAPER Seqjpo[jo Strat Birk
httpslidepdfcomreaderfullpsag-gov-paper-seqjpojo-strat-birk 2032
202770_116
Figure 79 Interpretation of sedimentary environments within the upper Poolowanna Formation Moorari Field (after Nakanishi and Lang 2001a Nakanishi 2002)
8112019 PSAG GOV PAPER Seqjpo[jo Strat Birk
httpslidepdfcomreaderfullpsag-gov-paper-seqjpojo-strat-birk 2132
Figure 710 Schematic section showing potential Poolowanna Formation stratigraphic plays (a) Moorari Field (b) Pondrinie Field (After Nakanishi and Lang 2001ab Nakanishi and Lang 2002)
8112019 PSAG GOV PAPER Seqjpo[jo Strat Birk
httpslidepdfcomreaderfullpsag-gov-paper-seqjpojo-strat-birk 2232
Chronostratigraphic Section
Figure 711 Sequence stratigraphic and chronostratigraphic summary of the Birkhead Formation
8112019 PSAG GOV PAPER Seqjpo[jo Strat Birk
httpslidepdfcomreaderfullpsag-gov-paper-seqjpojo-strat-birk 2332
Birkhead FormationUnit II (reworked Hutton)
Pre-Jurassic
Craton-derivedquartz arenites
Low energymeanderingfluvial to deltafill facies
R i f t i n g o f An t a r c t i c a
High energyaeolian braidedfluvial facies
Base BirkheaFormation Qu
N e e
b i n e
R i d g e
P T
N
T
Openlacustrinefacies
G M I R
i d g e
M
J
J
B
Q
L D
S A
Er om
anga
Basin
South
Austr
alian
High
lands
Hutt o
n S an
Figure 712 Schematic 3D palaeogeography during the early phase of Birkhead deposition showing
derived sediment from the east (after Boult et al 1998)
8112019 PSAG GOV PAPER Seqjpo[jo Strat Birk
httpslidepdfcomreaderfullpsag-gov-paper-seqjpojo-strat-birk 2432
-50 m
50 m
0 m
100 m
MERANJI-7 PELICAN-1MERANJI-4 PELICAN
Figure 713 Sedimentary facies distribution and sequence stratigraphic correlation of
8112019 PSAG GOV PAPER Seqjpo[jo Strat Birk
httpslidepdfcomreaderfullpsag-gov-paper-seqjpojo-strat-birk 2532
202770_119
Figure 714 Schematic 3D palaeogeography during the deposition of the lowstand systems tract of the Birkhea(after Boult et al 1998 Lanzilli 1999)
8112019 PSAG GOV PAPER Seqjpo[jo Strat Birk
httpslidepdfcomreaderfullpsag-gov-paper-seqjpojo-strat-birk 2632
140deg
Early Birkheadtime
BraidedHutton
Low energyand reworked
BirkheadHutton
Labile sandstonewedge (mostlylow energy inEromanga Basin)
J
20deg
30deg
M
B
Restricted outletto lsquoLake Birkheadrsquo
B i r d s
v i l l e T
R
Craton-derived
sediments
Volcanic-arc-
derived Sediments
G
lake
Sydney
Braided Hutton
Cratonic sourcearea
V o l c a n
i c A r c
140deg 150deg
20deg
30deg
40deg
500 km
Presentshoreline
Mesozoicbasin
202770 082
(a)
(b) 150
= maximum influenceof labile sediment
Cratonic source
area
l a t e
H
t t u
o n
e x i t
ear ly Hu t t o n
e x i t
Hutton time
BGJM
= Bodalla South= Gidgealpa= Jackson= Moorari
8112019 PSAG GOV PAPER Seqjpo[jo Strat Birk
httpslidepdfcomreaderfullpsag-gov-paper-seqjpojo-strat-birk 2732
202770_121
Figure 716 Generalised sequence through the Birkhead Formation and top Hutton Sandstone
(after Lanzilli 1999)
8112019 PSAG GOV PAPER Seqjpo[jo Strat Birk
httpslidepdfcomreaderfullpsag-gov-paper-seqjpojo-strat-birk 2832
202770_122
Figure 717 Sedimentary facies interpretation of the middlendashupper Birkhead Formation based on 3D seismic amplitude variation and well logs Merrimelia Meranji and Pelican fields area
(after Nakanishi et al 2003)
8112019 PSAG GOV PAPER Seqjpo[jo Strat Birk
httpslidepdfcomreaderfullpsag-gov-paper-seqjpojo-strat-birk 2932
Wantanna 1
Gidgealpa 19 Challum
Arrabury 1
Pondrinnie 1Bookaburdle 10
Tirrawarra 10Fly Lake 4
Marine
Distal LacustrineProximal Lacustrine
Lacustrinefluvialtransition
Braided fluvial
Fluvial incision
Flooding surfaceMaximum Flooding surface
Formation boundary
Figure 718 Regional WndashE cross-section from Gidgealpa 19 (South Australia) to Maxwell 1 (QueensSandstone and meandering fluvialndashlacustrine deposits of the Murta Formation (after Theologou 19
8112019 PSAG GOV PAPER Seqjpo[jo Strat Birk
httpslidepdfcomreaderfullpsag-gov-paper-seqjpojo-strat-birk 3032
202770_124
Figure 719 Typical well log of the Murta Formation from the Maxwell Field
showing two major transgressivendashregressive cycles (after Lang et al 2001)
8112019 PSAG GOV PAPER Seqjpo[jo Strat Birk
httpslidepdfcomreaderfullpsag-gov-paper-seqjpojo-strat-birk 3132
Figure 720 NndashS cross-section from Maxwell 1 to Mungoora 1 (South West Queensland) showing an interpreted Murta Formaboundary and incised valley fill that represents the lowstand systems tract (after Gorter 1994)
8112019 PSAG GOV PAPER Seqjpo[jo Strat Birk
httpslidepdfcomreaderfullpsag-gov-paper-seqjpojo-strat-birk 3232
202770_126
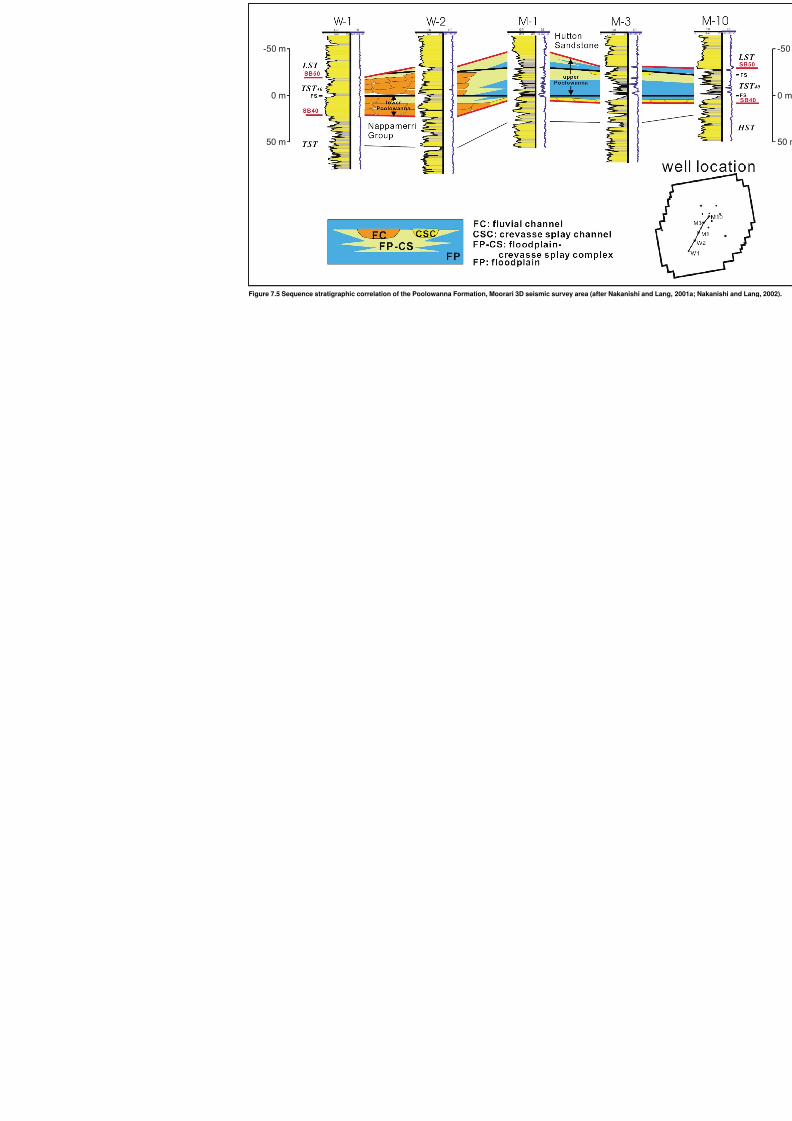
8112019 PSAG GOV PAPER Seqjpo[jo Strat Birk
httpslidepdfcomreaderfullpsag-gov-paper-seqjpojo-strat-birk 1632
-50 m
50 m
0 m
Figure 75 Sequence stratigraphic correlation of the Poolowanna Formation Moorari 3D seismi
8112019 PSAG GOV PAPER Seqjpo[jo Strat Birk
httpslidepdfcomreaderfullpsag-gov-paper-seqjpojo-strat-birk 1732
-50 m
50 m
0 m
100 m
NAP-1 NAP-2 YAL-1 N
Figure 76 Sequence stratigraphic correlation of the Poolowanna Formation Pon
8112019 PSAG GOV PAPER Seqjpo[jo Strat Birk
httpslidepdfcomreaderfullpsag-gov-paper-seqjpojo-strat-birk 1832
202770_114
Figure 77 Two-way time structure map of an intra-Poolowanna seismic horizon Moorari Field showing interpreted sedimentary facies and gamma ray well log motifs (afterNakanishi and Lang 2001a Nakanishi and Lang 2002)
8112019 PSAG GOV PAPER Seqjpo[jo Strat Birk
httpslidepdfcomreaderfullpsag-gov-paper-seqjpojo-strat-birk 1932
Figure 78 Two-way time structure map of an intra-Poolowanna seismic horizon Pondrinie Field showing interpreted sedimenta(after Nakanishi and Lang 2001b Nakanishiand Lang 2002)
8112019 PSAG GOV PAPER Seqjpo[jo Strat Birk
httpslidepdfcomreaderfullpsag-gov-paper-seqjpojo-strat-birk 2032
202770_116
Figure 79 Interpretation of sedimentary environments within the upper Poolowanna Formation Moorari Field (after Nakanishi and Lang 2001a Nakanishi 2002)
8112019 PSAG GOV PAPER Seqjpo[jo Strat Birk
httpslidepdfcomreaderfullpsag-gov-paper-seqjpojo-strat-birk 2132
Figure 710 Schematic section showing potential Poolowanna Formation stratigraphic plays (a) Moorari Field (b) Pondrinie Field (After Nakanishi and Lang 2001ab Nakanishi and Lang 2002)
8112019 PSAG GOV PAPER Seqjpo[jo Strat Birk
httpslidepdfcomreaderfullpsag-gov-paper-seqjpojo-strat-birk 2232
Chronostratigraphic Section
Figure 711 Sequence stratigraphic and chronostratigraphic summary of the Birkhead Formation
8112019 PSAG GOV PAPER Seqjpo[jo Strat Birk
httpslidepdfcomreaderfullpsag-gov-paper-seqjpojo-strat-birk 2332
Birkhead FormationUnit II (reworked Hutton)
Pre-Jurassic
Craton-derivedquartz arenites
Low energymeanderingfluvial to deltafill facies
R i f t i n g o f An t a r c t i c a
High energyaeolian braidedfluvial facies
Base BirkheaFormation Qu
N e e
b i n e
R i d g e
P T
N
T
Openlacustrinefacies
G M I R
i d g e
M
J
J
B
Q
L D
S A
Er om
anga
Basin
South
Austr
alian
High
lands
Hutt o
n S an
Figure 712 Schematic 3D palaeogeography during the early phase of Birkhead deposition showing
derived sediment from the east (after Boult et al 1998)
8112019 PSAG GOV PAPER Seqjpo[jo Strat Birk
httpslidepdfcomreaderfullpsag-gov-paper-seqjpojo-strat-birk 2432
-50 m
50 m
0 m
100 m
MERANJI-7 PELICAN-1MERANJI-4 PELICAN
Figure 713 Sedimentary facies distribution and sequence stratigraphic correlation of
8112019 PSAG GOV PAPER Seqjpo[jo Strat Birk
httpslidepdfcomreaderfullpsag-gov-paper-seqjpojo-strat-birk 2532
202770_119
Figure 714 Schematic 3D palaeogeography during the deposition of the lowstand systems tract of the Birkhea(after Boult et al 1998 Lanzilli 1999)
8112019 PSAG GOV PAPER Seqjpo[jo Strat Birk
httpslidepdfcomreaderfullpsag-gov-paper-seqjpojo-strat-birk 2632
140deg
Early Birkheadtime
BraidedHutton
Low energyand reworked
BirkheadHutton
Labile sandstonewedge (mostlylow energy inEromanga Basin)
J
20deg
30deg
M
B
Restricted outletto lsquoLake Birkheadrsquo
B i r d s
v i l l e T
R
Craton-derived
sediments
Volcanic-arc-
derived Sediments
G
lake
Sydney
Braided Hutton
Cratonic sourcearea
V o l c a n
i c A r c
140deg 150deg
20deg
30deg
40deg
500 km
Presentshoreline
Mesozoicbasin
202770 082
(a)
(b) 150
= maximum influenceof labile sediment
Cratonic source
area
l a t e
H
t t u
o n
e x i t
ear ly Hu t t o n
e x i t
Hutton time
BGJM
= Bodalla South= Gidgealpa= Jackson= Moorari
8112019 PSAG GOV PAPER Seqjpo[jo Strat Birk
httpslidepdfcomreaderfullpsag-gov-paper-seqjpojo-strat-birk 2732
202770_121
Figure 716 Generalised sequence through the Birkhead Formation and top Hutton Sandstone
(after Lanzilli 1999)
8112019 PSAG GOV PAPER Seqjpo[jo Strat Birk
httpslidepdfcomreaderfullpsag-gov-paper-seqjpojo-strat-birk 2832
202770_122
Figure 717 Sedimentary facies interpretation of the middlendashupper Birkhead Formation based on 3D seismic amplitude variation and well logs Merrimelia Meranji and Pelican fields area
(after Nakanishi et al 2003)
8112019 PSAG GOV PAPER Seqjpo[jo Strat Birk
httpslidepdfcomreaderfullpsag-gov-paper-seqjpojo-strat-birk 2932
Wantanna 1
Gidgealpa 19 Challum
Arrabury 1
Pondrinnie 1Bookaburdle 10
Tirrawarra 10Fly Lake 4
Marine
Distal LacustrineProximal Lacustrine
Lacustrinefluvialtransition
Braided fluvial
Fluvial incision
Flooding surfaceMaximum Flooding surface
Formation boundary
Figure 718 Regional WndashE cross-section from Gidgealpa 19 (South Australia) to Maxwell 1 (QueensSandstone and meandering fluvialndashlacustrine deposits of the Murta Formation (after Theologou 19
8112019 PSAG GOV PAPER Seqjpo[jo Strat Birk
httpslidepdfcomreaderfullpsag-gov-paper-seqjpojo-strat-birk 3032
202770_124
Figure 719 Typical well log of the Murta Formation from the Maxwell Field
showing two major transgressivendashregressive cycles (after Lang et al 2001)
8112019 PSAG GOV PAPER Seqjpo[jo Strat Birk
httpslidepdfcomreaderfullpsag-gov-paper-seqjpojo-strat-birk 3132
Figure 720 NndashS cross-section from Maxwell 1 to Mungoora 1 (South West Queensland) showing an interpreted Murta Formaboundary and incised valley fill that represents the lowstand systems tract (after Gorter 1994)
8112019 PSAG GOV PAPER Seqjpo[jo Strat Birk
httpslidepdfcomreaderfullpsag-gov-paper-seqjpojo-strat-birk 3232
202770_126
8112019 PSAG GOV PAPER Seqjpo[jo Strat Birk
httpslidepdfcomreaderfullpsag-gov-paper-seqjpojo-strat-birk 1732
-50 m
50 m
0 m
100 m
NAP-1 NAP-2 YAL-1 N
Figure 76 Sequence stratigraphic correlation of the Poolowanna Formation Pon
8112019 PSAG GOV PAPER Seqjpo[jo Strat Birk
httpslidepdfcomreaderfullpsag-gov-paper-seqjpojo-strat-birk 1832
202770_114
Figure 77 Two-way time structure map of an intra-Poolowanna seismic horizon Moorari Field showing interpreted sedimentary facies and gamma ray well log motifs (afterNakanishi and Lang 2001a Nakanishi and Lang 2002)
8112019 PSAG GOV PAPER Seqjpo[jo Strat Birk
httpslidepdfcomreaderfullpsag-gov-paper-seqjpojo-strat-birk 1932
Figure 78 Two-way time structure map of an intra-Poolowanna seismic horizon Pondrinie Field showing interpreted sedimenta(after Nakanishi and Lang 2001b Nakanishiand Lang 2002)
8112019 PSAG GOV PAPER Seqjpo[jo Strat Birk
httpslidepdfcomreaderfullpsag-gov-paper-seqjpojo-strat-birk 2032
202770_116
Figure 79 Interpretation of sedimentary environments within the upper Poolowanna Formation Moorari Field (after Nakanishi and Lang 2001a Nakanishi 2002)
8112019 PSAG GOV PAPER Seqjpo[jo Strat Birk
httpslidepdfcomreaderfullpsag-gov-paper-seqjpojo-strat-birk 2132
Figure 710 Schematic section showing potential Poolowanna Formation stratigraphic plays (a) Moorari Field (b) Pondrinie Field (After Nakanishi and Lang 2001ab Nakanishi and Lang 2002)
8112019 PSAG GOV PAPER Seqjpo[jo Strat Birk
httpslidepdfcomreaderfullpsag-gov-paper-seqjpojo-strat-birk 2232
Chronostratigraphic Section
Figure 711 Sequence stratigraphic and chronostratigraphic summary of the Birkhead Formation
8112019 PSAG GOV PAPER Seqjpo[jo Strat Birk
httpslidepdfcomreaderfullpsag-gov-paper-seqjpojo-strat-birk 2332
Birkhead FormationUnit II (reworked Hutton)
Pre-Jurassic
Craton-derivedquartz arenites
Low energymeanderingfluvial to deltafill facies
R i f t i n g o f An t a r c t i c a
High energyaeolian braidedfluvial facies
Base BirkheaFormation Qu
N e e
b i n e
R i d g e
P T
N
T
Openlacustrinefacies
G M I R
i d g e
M
J
J
B
Q
L D
S A
Er om
anga
Basin
South
Austr
alian
High
lands
Hutt o
n S an
Figure 712 Schematic 3D palaeogeography during the early phase of Birkhead deposition showing
derived sediment from the east (after Boult et al 1998)
8112019 PSAG GOV PAPER Seqjpo[jo Strat Birk
httpslidepdfcomreaderfullpsag-gov-paper-seqjpojo-strat-birk 2432
-50 m
50 m
0 m
100 m
MERANJI-7 PELICAN-1MERANJI-4 PELICAN
Figure 713 Sedimentary facies distribution and sequence stratigraphic correlation of
8112019 PSAG GOV PAPER Seqjpo[jo Strat Birk
httpslidepdfcomreaderfullpsag-gov-paper-seqjpojo-strat-birk 2532
202770_119
Figure 714 Schematic 3D palaeogeography during the deposition of the lowstand systems tract of the Birkhea(after Boult et al 1998 Lanzilli 1999)
8112019 PSAG GOV PAPER Seqjpo[jo Strat Birk
httpslidepdfcomreaderfullpsag-gov-paper-seqjpojo-strat-birk 2632
140deg
Early Birkheadtime
BraidedHutton
Low energyand reworked
BirkheadHutton
Labile sandstonewedge (mostlylow energy inEromanga Basin)
J
20deg
30deg
M
B
Restricted outletto lsquoLake Birkheadrsquo
B i r d s
v i l l e T
R
Craton-derived
sediments
Volcanic-arc-
derived Sediments
G
lake
Sydney
Braided Hutton
Cratonic sourcearea
V o l c a n
i c A r c
140deg 150deg
20deg
30deg
40deg
500 km
Presentshoreline
Mesozoicbasin
202770 082
(a)
(b) 150
= maximum influenceof labile sediment
Cratonic source
area
l a t e
H
t t u
o n
e x i t
ear ly Hu t t o n
e x i t
Hutton time
BGJM
= Bodalla South= Gidgealpa= Jackson= Moorari
8112019 PSAG GOV PAPER Seqjpo[jo Strat Birk
httpslidepdfcomreaderfullpsag-gov-paper-seqjpojo-strat-birk 2732
202770_121
Figure 716 Generalised sequence through the Birkhead Formation and top Hutton Sandstone
(after Lanzilli 1999)
8112019 PSAG GOV PAPER Seqjpo[jo Strat Birk
httpslidepdfcomreaderfullpsag-gov-paper-seqjpojo-strat-birk 2832
202770_122
Figure 717 Sedimentary facies interpretation of the middlendashupper Birkhead Formation based on 3D seismic amplitude variation and well logs Merrimelia Meranji and Pelican fields area
(after Nakanishi et al 2003)
8112019 PSAG GOV PAPER Seqjpo[jo Strat Birk
httpslidepdfcomreaderfullpsag-gov-paper-seqjpojo-strat-birk 2932
Wantanna 1
Gidgealpa 19 Challum
Arrabury 1
Pondrinnie 1Bookaburdle 10
Tirrawarra 10Fly Lake 4
Marine
Distal LacustrineProximal Lacustrine
Lacustrinefluvialtransition
Braided fluvial
Fluvial incision
Flooding surfaceMaximum Flooding surface
Formation boundary
Figure 718 Regional WndashE cross-section from Gidgealpa 19 (South Australia) to Maxwell 1 (QueensSandstone and meandering fluvialndashlacustrine deposits of the Murta Formation (after Theologou 19
8112019 PSAG GOV PAPER Seqjpo[jo Strat Birk
httpslidepdfcomreaderfullpsag-gov-paper-seqjpojo-strat-birk 3032
202770_124
Figure 719 Typical well log of the Murta Formation from the Maxwell Field
showing two major transgressivendashregressive cycles (after Lang et al 2001)
8112019 PSAG GOV PAPER Seqjpo[jo Strat Birk
httpslidepdfcomreaderfullpsag-gov-paper-seqjpojo-strat-birk 3132
Figure 720 NndashS cross-section from Maxwell 1 to Mungoora 1 (South West Queensland) showing an interpreted Murta Formaboundary and incised valley fill that represents the lowstand systems tract (after Gorter 1994)
8112019 PSAG GOV PAPER Seqjpo[jo Strat Birk
httpslidepdfcomreaderfullpsag-gov-paper-seqjpojo-strat-birk 3232
202770_126

8112019 PSAG GOV PAPER Seqjpo[jo Strat Birk
httpslidepdfcomreaderfullpsag-gov-paper-seqjpojo-strat-birk 2332
Birkhead FormationUnit II (reworked Hutton)
Pre-Jurassic
Craton-derivedquartz arenites
Low energymeanderingfluvial to deltafill facies
R i f t i n g o f An t a r c t i c a
High energyaeolian braidedfluvial facies
Base BirkheaFormation Qu
N e e
b i n e
R i d g e
P T
N
T
Openlacustrinefacies
G M I R
i d g e
M
J
J
B
Q
L D
S A
Er om
anga
Basin
South
Austr
alian
High
lands
Hutt o
n S an
Figure 712 Schematic 3D palaeogeography during the early phase of Birkhead deposition showing
derived sediment from the east (after Boult et al 1998)
8112019 PSAG GOV PAPER Seqjpo[jo Strat Birk
httpslidepdfcomreaderfullpsag-gov-paper-seqjpojo-strat-birk 2432
-50 m
50 m
0 m
100 m
MERANJI-7 PELICAN-1MERANJI-4 PELICAN
Figure 713 Sedimentary facies distribution and sequence stratigraphic correlation of
8112019 PSAG GOV PAPER Seqjpo[jo Strat Birk
httpslidepdfcomreaderfullpsag-gov-paper-seqjpojo-strat-birk 2532
202770_119
Figure 714 Schematic 3D palaeogeography during the deposition of the lowstand systems tract of the Birkhea(after Boult et al 1998 Lanzilli 1999)
8112019 PSAG GOV PAPER Seqjpo[jo Strat Birk
httpslidepdfcomreaderfullpsag-gov-paper-seqjpojo-strat-birk 2632
140deg
Early Birkheadtime
BraidedHutton
Low energyand reworked
BirkheadHutton
Labile sandstonewedge (mostlylow energy inEromanga Basin)
J
20deg
30deg
M
B
Restricted outletto lsquoLake Birkheadrsquo
B i r d s
v i l l e T
R
Craton-derived
sediments
Volcanic-arc-
derived Sediments
G
lake
Sydney
Braided Hutton
Cratonic sourcearea
V o l c a n
i c A r c
140deg 150deg
20deg
30deg
40deg
500 km
Presentshoreline
Mesozoicbasin
202770 082
(a)
(b) 150
= maximum influenceof labile sediment
Cratonic source
area
l a t e
H
t t u
o n
e x i t
ear ly Hu t t o n
e x i t
Hutton time
BGJM
= Bodalla South= Gidgealpa= Jackson= Moorari
8112019 PSAG GOV PAPER Seqjpo[jo Strat Birk
httpslidepdfcomreaderfullpsag-gov-paper-seqjpojo-strat-birk 2732
202770_121
Figure 716 Generalised sequence through the Birkhead Formation and top Hutton Sandstone
(after Lanzilli 1999)
8112019 PSAG GOV PAPER Seqjpo[jo Strat Birk
httpslidepdfcomreaderfullpsag-gov-paper-seqjpojo-strat-birk 2832
202770_122
Figure 717 Sedimentary facies interpretation of the middlendashupper Birkhead Formation based on 3D seismic amplitude variation and well logs Merrimelia Meranji and Pelican fields area
(after Nakanishi et al 2003)
8112019 PSAG GOV PAPER Seqjpo[jo Strat Birk
httpslidepdfcomreaderfullpsag-gov-paper-seqjpojo-strat-birk 2932
Wantanna 1
Gidgealpa 19 Challum
Arrabury 1
Pondrinnie 1Bookaburdle 10
Tirrawarra 10Fly Lake 4
Marine
Distal LacustrineProximal Lacustrine
Lacustrinefluvialtransition
Braided fluvial
Fluvial incision
Flooding surfaceMaximum Flooding surface
Formation boundary
Figure 718 Regional WndashE cross-section from Gidgealpa 19 (South Australia) to Maxwell 1 (QueensSandstone and meandering fluvialndashlacustrine deposits of the Murta Formation (after Theologou 19
8112019 PSAG GOV PAPER Seqjpo[jo Strat Birk
httpslidepdfcomreaderfullpsag-gov-paper-seqjpojo-strat-birk 3032
202770_124
Figure 719 Typical well log of the Murta Formation from the Maxwell Field
showing two major transgressivendashregressive cycles (after Lang et al 2001)
8112019 PSAG GOV PAPER Seqjpo[jo Strat Birk
httpslidepdfcomreaderfullpsag-gov-paper-seqjpojo-strat-birk 3132
Figure 720 NndashS cross-section from Maxwell 1 to Mungoora 1 (South West Queensland) showing an interpreted Murta Formaboundary and incised valley fill that represents the lowstand systems tract (after Gorter 1994)
8112019 PSAG GOV PAPER Seqjpo[jo Strat Birk
httpslidepdfcomreaderfullpsag-gov-paper-seqjpojo-strat-birk 3232
202770_126
8112019 PSAG GOV PAPER Seqjpo[jo Strat Birk
httpslidepdfcomreaderfullpsag-gov-paper-seqjpojo-strat-birk 2432
-50 m
50 m
0 m
100 m
MERANJI-7 PELICAN-1MERANJI-4 PELICAN
Figure 713 Sedimentary facies distribution and sequence stratigraphic correlation of
8112019 PSAG GOV PAPER Seqjpo[jo Strat Birk
httpslidepdfcomreaderfullpsag-gov-paper-seqjpojo-strat-birk 2532
202770_119
Figure 714 Schematic 3D palaeogeography during the deposition of the lowstand systems tract of the Birkhea(after Boult et al 1998 Lanzilli 1999)
8112019 PSAG GOV PAPER Seqjpo[jo Strat Birk
httpslidepdfcomreaderfullpsag-gov-paper-seqjpojo-strat-birk 2632
140deg
Early Birkheadtime
BraidedHutton
Low energyand reworked
BirkheadHutton
Labile sandstonewedge (mostlylow energy inEromanga Basin)
J
20deg
30deg
M
B
Restricted outletto lsquoLake Birkheadrsquo
B i r d s
v i l l e T
R
Craton-derived
sediments
Volcanic-arc-
derived Sediments
G
lake
Sydney
Braided Hutton
Cratonic sourcearea
V o l c a n
i c A r c
140deg 150deg
20deg
30deg
40deg
500 km
Presentshoreline
Mesozoicbasin
202770 082
(a)
(b) 150
= maximum influenceof labile sediment
Cratonic source
area
l a t e
H
t t u
o n
e x i t
ear ly Hu t t o n
e x i t
Hutton time
BGJM
= Bodalla South= Gidgealpa= Jackson= Moorari
8112019 PSAG GOV PAPER Seqjpo[jo Strat Birk
httpslidepdfcomreaderfullpsag-gov-paper-seqjpojo-strat-birk 2732
202770_121
Figure 716 Generalised sequence through the Birkhead Formation and top Hutton Sandstone
(after Lanzilli 1999)
8112019 PSAG GOV PAPER Seqjpo[jo Strat Birk
httpslidepdfcomreaderfullpsag-gov-paper-seqjpojo-strat-birk 2832
202770_122
Figure 717 Sedimentary facies interpretation of the middlendashupper Birkhead Formation based on 3D seismic amplitude variation and well logs Merrimelia Meranji and Pelican fields area
(after Nakanishi et al 2003)
8112019 PSAG GOV PAPER Seqjpo[jo Strat Birk
httpslidepdfcomreaderfullpsag-gov-paper-seqjpojo-strat-birk 2932
Wantanna 1
Gidgealpa 19 Challum
Arrabury 1
Pondrinnie 1Bookaburdle 10
Tirrawarra 10Fly Lake 4
Marine
Distal LacustrineProximal Lacustrine
Lacustrinefluvialtransition
Braided fluvial
Fluvial incision
Flooding surfaceMaximum Flooding surface
Formation boundary
Figure 718 Regional WndashE cross-section from Gidgealpa 19 (South Australia) to Maxwell 1 (QueensSandstone and meandering fluvialndashlacustrine deposits of the Murta Formation (after Theologou 19
8112019 PSAG GOV PAPER Seqjpo[jo Strat Birk
httpslidepdfcomreaderfullpsag-gov-paper-seqjpojo-strat-birk 3032
202770_124
Figure 719 Typical well log of the Murta Formation from the Maxwell Field
showing two major transgressivendashregressive cycles (after Lang et al 2001)
8112019 PSAG GOV PAPER Seqjpo[jo Strat Birk
httpslidepdfcomreaderfullpsag-gov-paper-seqjpojo-strat-birk 3132
Figure 720 NndashS cross-section from Maxwell 1 to Mungoora 1 (South West Queensland) showing an interpreted Murta Formaboundary and incised valley fill that represents the lowstand systems tract (after Gorter 1994)
8112019 PSAG GOV PAPER Seqjpo[jo Strat Birk
httpslidepdfcomreaderfullpsag-gov-paper-seqjpojo-strat-birk 3232
202770_126

8112019 PSAG GOV PAPER Seqjpo[jo Strat Birk
httpslidepdfcomreaderfullpsag-gov-paper-seqjpojo-strat-birk 2532
202770_119
Figure 714 Schematic 3D palaeogeography during the deposition of the lowstand systems tract of the Birkhea(after Boult et al 1998 Lanzilli 1999)
8112019 PSAG GOV PAPER Seqjpo[jo Strat Birk
httpslidepdfcomreaderfullpsag-gov-paper-seqjpojo-strat-birk 2632
140deg
Early Birkheadtime
BraidedHutton
Low energyand reworked
BirkheadHutton
Labile sandstonewedge (mostlylow energy inEromanga Basin)
J
20deg
30deg
M
B
Restricted outletto lsquoLake Birkheadrsquo
B i r d s
v i l l e T
R
Craton-derived
sediments
Volcanic-arc-
derived Sediments
G
lake
Sydney
Braided Hutton
Cratonic sourcearea
V o l c a n
i c A r c
140deg 150deg
20deg
30deg
40deg
500 km
Presentshoreline
Mesozoicbasin
202770 082
(a)
(b) 150
= maximum influenceof labile sediment
Cratonic source
area
l a t e
H
t t u
o n
e x i t
ear ly Hu t t o n
e x i t
Hutton time
BGJM
= Bodalla South= Gidgealpa= Jackson= Moorari
8112019 PSAG GOV PAPER Seqjpo[jo Strat Birk
httpslidepdfcomreaderfullpsag-gov-paper-seqjpojo-strat-birk 2732
202770_121
Figure 716 Generalised sequence through the Birkhead Formation and top Hutton Sandstone
(after Lanzilli 1999)
8112019 PSAG GOV PAPER Seqjpo[jo Strat Birk
httpslidepdfcomreaderfullpsag-gov-paper-seqjpojo-strat-birk 2832
202770_122
Figure 717 Sedimentary facies interpretation of the middlendashupper Birkhead Formation based on 3D seismic amplitude variation and well logs Merrimelia Meranji and Pelican fields area
(after Nakanishi et al 2003)
8112019 PSAG GOV PAPER Seqjpo[jo Strat Birk
httpslidepdfcomreaderfullpsag-gov-paper-seqjpojo-strat-birk 2932
Wantanna 1
Gidgealpa 19 Challum
Arrabury 1
Pondrinnie 1Bookaburdle 10
Tirrawarra 10Fly Lake 4
Marine
Distal LacustrineProximal Lacustrine
Lacustrinefluvialtransition
Braided fluvial
Fluvial incision
Flooding surfaceMaximum Flooding surface
Formation boundary
Figure 718 Regional WndashE cross-section from Gidgealpa 19 (South Australia) to Maxwell 1 (QueensSandstone and meandering fluvialndashlacustrine deposits of the Murta Formation (after Theologou 19
8112019 PSAG GOV PAPER Seqjpo[jo Strat Birk
httpslidepdfcomreaderfullpsag-gov-paper-seqjpojo-strat-birk 3032
202770_124
Figure 719 Typical well log of the Murta Formation from the Maxwell Field
showing two major transgressivendashregressive cycles (after Lang et al 2001)
8112019 PSAG GOV PAPER Seqjpo[jo Strat Birk
httpslidepdfcomreaderfullpsag-gov-paper-seqjpojo-strat-birk 3132
Figure 720 NndashS cross-section from Maxwell 1 to Mungoora 1 (South West Queensland) showing an interpreted Murta Formaboundary and incised valley fill that represents the lowstand systems tract (after Gorter 1994)
8112019 PSAG GOV PAPER Seqjpo[jo Strat Birk
httpslidepdfcomreaderfullpsag-gov-paper-seqjpojo-strat-birk 3232
202770_126
8112019 PSAG GOV PAPER Seqjpo[jo Strat Birk
httpslidepdfcomreaderfullpsag-gov-paper-seqjpojo-strat-birk 2732
202770_121
Figure 716 Generalised sequence through the Birkhead Formation and top Hutton Sandstone
(after Lanzilli 1999)
8112019 PSAG GOV PAPER Seqjpo[jo Strat Birk
httpslidepdfcomreaderfullpsag-gov-paper-seqjpojo-strat-birk 2832
202770_122
Figure 717 Sedimentary facies interpretation of the middlendashupper Birkhead Formation based on 3D seismic amplitude variation and well logs Merrimelia Meranji and Pelican fields area
(after Nakanishi et al 2003)
8112019 PSAG GOV PAPER Seqjpo[jo Strat Birk
httpslidepdfcomreaderfullpsag-gov-paper-seqjpojo-strat-birk 2932
Wantanna 1
Gidgealpa 19 Challum
Arrabury 1
Pondrinnie 1Bookaburdle 10
Tirrawarra 10Fly Lake 4
Marine
Distal LacustrineProximal Lacustrine
Lacustrinefluvialtransition
Braided fluvial
Fluvial incision
Flooding surfaceMaximum Flooding surface
Formation boundary
Figure 718 Regional WndashE cross-section from Gidgealpa 19 (South Australia) to Maxwell 1 (QueensSandstone and meandering fluvialndashlacustrine deposits of the Murta Formation (after Theologou 19
8112019 PSAG GOV PAPER Seqjpo[jo Strat Birk
httpslidepdfcomreaderfullpsag-gov-paper-seqjpojo-strat-birk 3032
202770_124
Figure 719 Typical well log of the Murta Formation from the Maxwell Field
showing two major transgressivendashregressive cycles (after Lang et al 2001)
8112019 PSAG GOV PAPER Seqjpo[jo Strat Birk
httpslidepdfcomreaderfullpsag-gov-paper-seqjpojo-strat-birk 3132
Figure 720 NndashS cross-section from Maxwell 1 to Mungoora 1 (South West Queensland) showing an interpreted Murta Formaboundary and incised valley fill that represents the lowstand systems tract (after Gorter 1994)
8112019 PSAG GOV PAPER Seqjpo[jo Strat Birk
httpslidepdfcomreaderfullpsag-gov-paper-seqjpojo-strat-birk 3232
202770_126

8112019 PSAG GOV PAPER Seqjpo[jo Strat Birk
httpslidepdfcomreaderfullpsag-gov-paper-seqjpojo-strat-birk 2832
202770_122
Figure 717 Sedimentary facies interpretation of the middlendashupper Birkhead Formation based on 3D seismic amplitude variation and well logs Merrimelia Meranji and Pelican fields area
(after Nakanishi et al 2003)
8112019 PSAG GOV PAPER Seqjpo[jo Strat Birk
httpslidepdfcomreaderfullpsag-gov-paper-seqjpojo-strat-birk 2932
Wantanna 1
Gidgealpa 19 Challum
Arrabury 1
Pondrinnie 1Bookaburdle 10
Tirrawarra 10Fly Lake 4
Marine
Distal LacustrineProximal Lacustrine
Lacustrinefluvialtransition
Braided fluvial
Fluvial incision
Flooding surfaceMaximum Flooding surface
Formation boundary
Figure 718 Regional WndashE cross-section from Gidgealpa 19 (South Australia) to Maxwell 1 (QueensSandstone and meandering fluvialndashlacustrine deposits of the Murta Formation (after Theologou 19
8112019 PSAG GOV PAPER Seqjpo[jo Strat Birk
httpslidepdfcomreaderfullpsag-gov-paper-seqjpojo-strat-birk 3032
202770_124
Figure 719 Typical well log of the Murta Formation from the Maxwell Field
showing two major transgressivendashregressive cycles (after Lang et al 2001)
8112019 PSAG GOV PAPER Seqjpo[jo Strat Birk
httpslidepdfcomreaderfullpsag-gov-paper-seqjpojo-strat-birk 3132
Figure 720 NndashS cross-section from Maxwell 1 to Mungoora 1 (South West Queensland) showing an interpreted Murta Formaboundary and incised valley fill that represents the lowstand systems tract (after Gorter 1994)
8112019 PSAG GOV PAPER Seqjpo[jo Strat Birk
httpslidepdfcomreaderfullpsag-gov-paper-seqjpojo-strat-birk 3232
202770_126
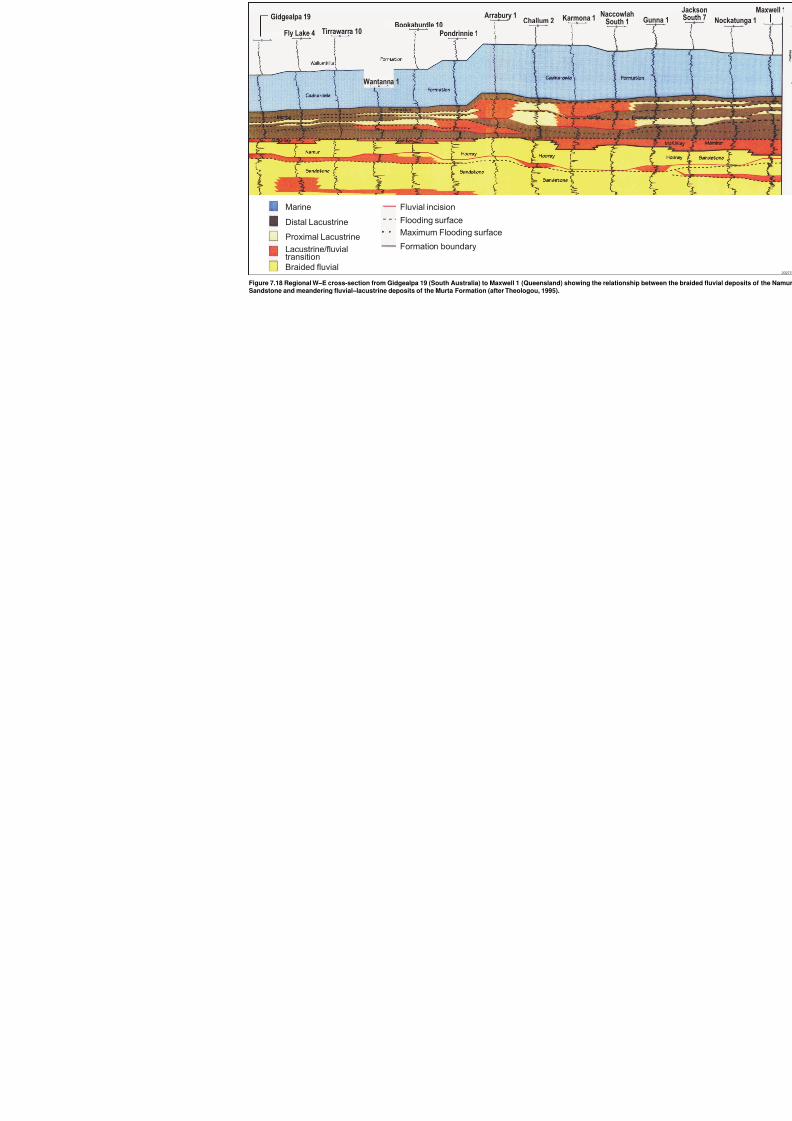
8112019 PSAG GOV PAPER Seqjpo[jo Strat Birk
httpslidepdfcomreaderfullpsag-gov-paper-seqjpojo-strat-birk 2932
Wantanna 1
Gidgealpa 19 Challum
Arrabury 1
Pondrinnie 1Bookaburdle 10
Tirrawarra 10Fly Lake 4
Marine
Distal LacustrineProximal Lacustrine
Lacustrinefluvialtransition
Braided fluvial
Fluvial incision
Flooding surfaceMaximum Flooding surface
Formation boundary
Figure 718 Regional WndashE cross-section from Gidgealpa 19 (South Australia) to Maxwell 1 (QueensSandstone and meandering fluvialndashlacustrine deposits of the Murta Formation (after Theologou 19
8112019 PSAG GOV PAPER Seqjpo[jo Strat Birk
httpslidepdfcomreaderfullpsag-gov-paper-seqjpojo-strat-birk 3032
202770_124
Figure 719 Typical well log of the Murta Formation from the Maxwell Field
showing two major transgressivendashregressive cycles (after Lang et al 2001)
8112019 PSAG GOV PAPER Seqjpo[jo Strat Birk
httpslidepdfcomreaderfullpsag-gov-paper-seqjpojo-strat-birk 3132
Figure 720 NndashS cross-section from Maxwell 1 to Mungoora 1 (South West Queensland) showing an interpreted Murta Formaboundary and incised valley fill that represents the lowstand systems tract (after Gorter 1994)
8112019 PSAG GOV PAPER Seqjpo[jo Strat Birk
httpslidepdfcomreaderfullpsag-gov-paper-seqjpojo-strat-birk 3232
202770_126
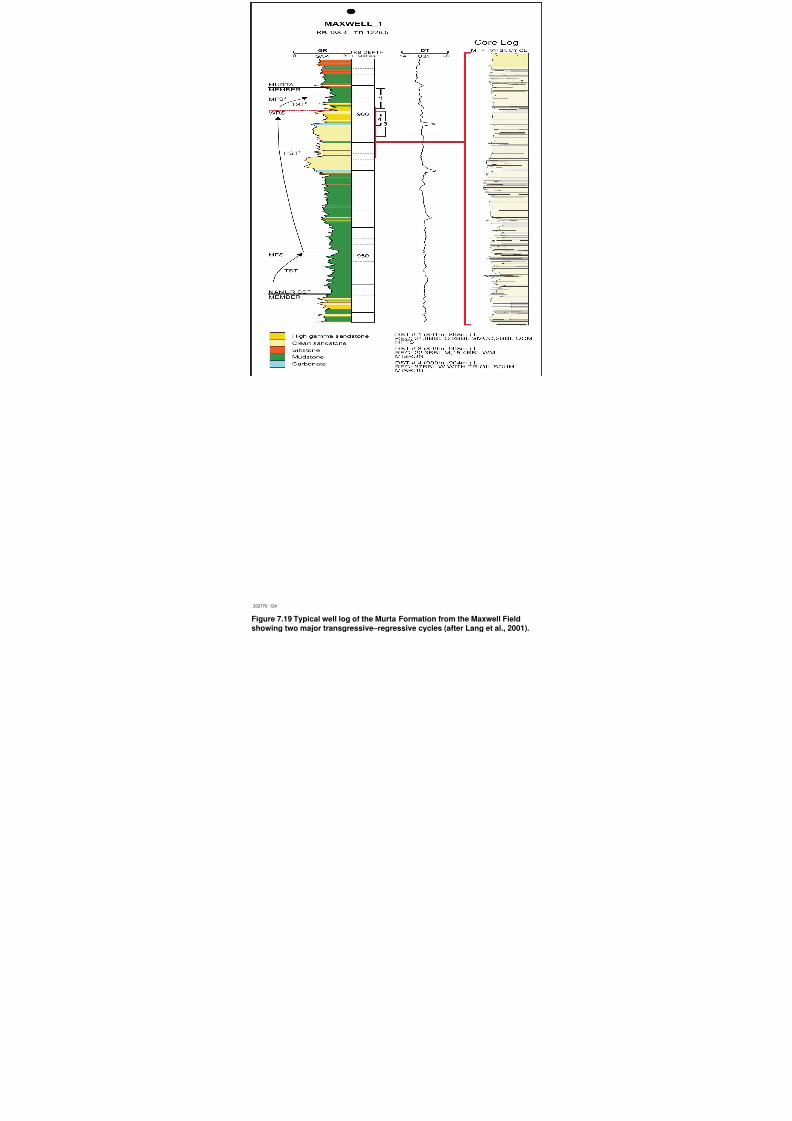
8112019 PSAG GOV PAPER Seqjpo[jo Strat Birk
httpslidepdfcomreaderfullpsag-gov-paper-seqjpojo-strat-birk 3132
Figure 720 NndashS cross-section from Maxwell 1 to Mungoora 1 (South West Queensland) showing an interpreted Murta Formaboundary and incised valley fill that represents the lowstand systems tract (after Gorter 1994)
8112019 PSAG GOV PAPER Seqjpo[jo Strat Birk
httpslidepdfcomreaderfullpsag-gov-paper-seqjpojo-strat-birk 3232
202770_126
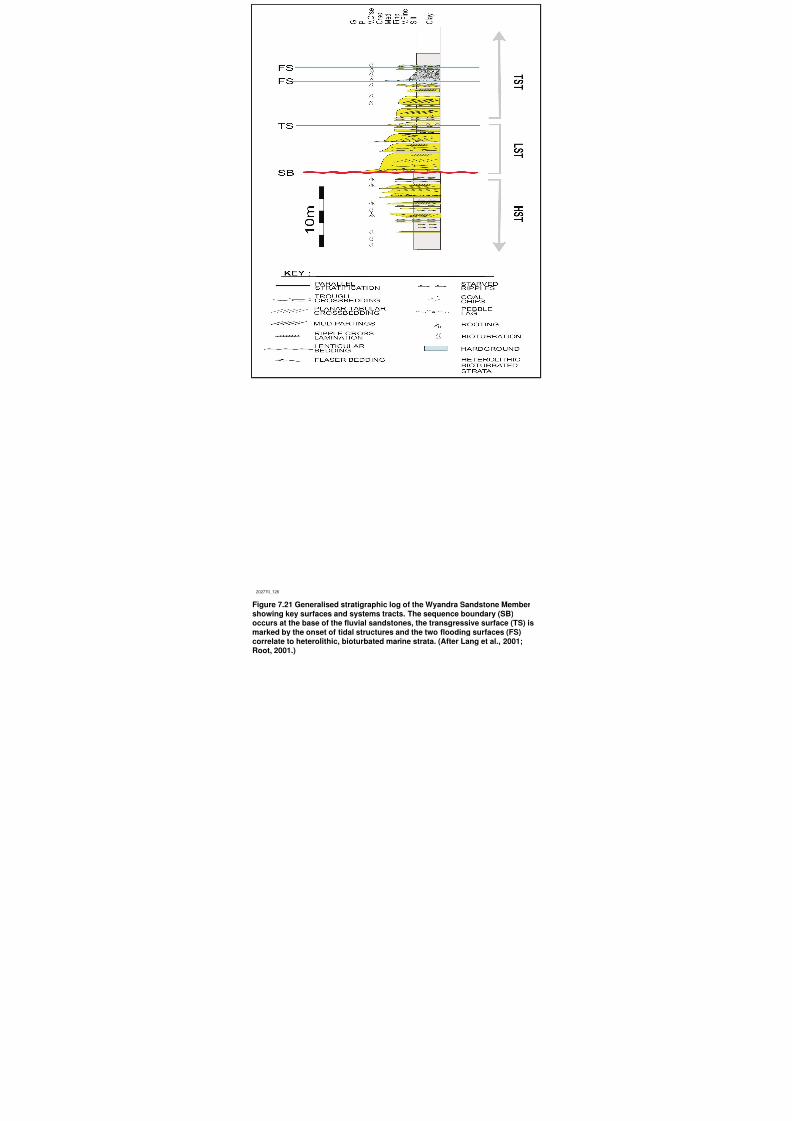
8112019 PSAG GOV PAPER Seqjpo[jo Strat Birk
httpslidepdfcomreaderfullpsag-gov-paper-seqjpojo-strat-birk 3232
202770_126