prudential’s variable universal life insurance
TRANSCRIPT

Prospectus – May 1, 2002
®
Prudential’s Variable Universal Life InsuranceThe Prudential Variable Appreciable Account

The Prudential Variable Appreciable Account
with respect to
Variable Appreciable Life ContractsVariable Universal Life Contracts
Survivorship Variable Universal Life Contracts
The Report of Independent Accountants on Page B-41 of the prospectus for the above-mentionedPrudential contracts is hereby amended to include the signature of PricewaterhouseCoopers, LLP,and now reads as follows:
REPORT OF INDEPENDENT ACCOUNTANTS
To the Board of Directors and Stockholder ofThe Prudential Insurance Company of America
In our opinion, the accompanying consolidated statements of financial position and the relatedconsolidated statements of operations, of stockholder’s equity and of cash flows present fairly, inall material respects, the financial position of The Prudential Insurance Company of America andits subsidiaries at December 31, 2001 and 2000, and the results of their operations and their cashflows for each of the three years in the period ended December 31, 2001, in conformity withaccounting principles generally accepted in the United States of America. These financialstatements are the responsibility of the Company’s management; our responsibility is to expressan opinion on these financial statements based on our audits. We conducted our audits of thesestatements in accordance with auditing standards generally accepted in the United States ofAmerica, which require that we plan and perform the audit to obtain reasonable assurance aboutwhether the financial statements are free of material misstatement. An audit includes examining,on a test basis, evidence supporting the amounts and disclosures in the financial statements,assessing the accounting principles used and significant estimates made by management, andevaluating the overall financial statement presentation. We believe that our audits provide areasonable basis for our opinion.
PricewaterhouseCoopers LLPNew York, New YorkFebruary 12, 2002
RIASUP Ed. 8-2002

PROSPECTUSMay 1, 2002
PRUCO LIFE VARIABLE APPRECIABLE ACCOUNT
Variable Universal LifeThis prospectus describes an individual flexible premium variable universal life insurance contract (the "Contract")offered by Pruco Life Insurance Company ("Pruco Life," "us," "we," or "our"). The Contract provides life insurancecoverage with flexible premium payments.
As of December 12, 2001, Pruco Life no longer offered these Contracts for sale.
Investment Choices:
Variable Universal Life offers a wide variety of investment choices, including 35 variable investment options that investin mutual funds managed by these leading asset managers:
• Prudential Investments LLC
• A I M Advisors, Inc.
• American Century Investment Management, Inc.
• Janus Capital Management LLC
• MFS Investment Management7
• T. Rowe Price International, Inc.
For a complete list of the 35 available variable investment options and their investment objectives, see The Funds,page 7.
You may also choose to invest your Contract’s premiums and its earnings in the fixed-rate option which pays aguaranteed interest rate. See The Fixed-Rate Option, page 12.
This prospectus describes the Contract generally and the Pruco Life Variable Appreciable Account (the "Account").The attached prospectuses for the Funds and their related statements of additional information describe theinvestment objectives and the risks of investing in the Fund portfolios. Pruco Life may add additional investmentoptions in the future. Please read this prospectus and keep it for future reference.
The Securities and Exchange Commission ("SEC") maintains a Web site (http://www.sec.gov) that contains materialincorporated by reference and other information regarding registrants that file electronically with the SEC.
Neither the Securities and Exchange Commission nor any state securities commission has approved ordisapproved of these securities or determined if this prospectus is accurate or complete. Any representationto the contrary is a criminal offense.
The Contract may be purchased through registered representatives located in banks and other financialinstitutions. An investment in the Contract is not a bank deposit and is not insured or guaranteed by theFederal Deposit Insurance Corporation ("FDIC") or any other governmental agency and may lose value. Aninvestment is also not a condition to the provision or term of any banking service or activity. Theparticipating bank is not a registered broker-dealer and is not affiliated with Pruco Securities Corporation.
Pruco Life Insurance Company213 Washington Street
Newark, New Jersey 07102-2992 Telephone: (800) 778-2255

����������������Page
DEFINITIONS OF SPECIAL TERMS USED IN THIS PROSPECTUS..............................................................................1
INTRODUCTION AND SUMMARY ...................................................................................................................................2Brief Description of the Contract ................................................................................................................................2Charges..........................................................................................................................................................................2Types of Death Benefit .................................................................................................................................................5Premium Payments.......................................................................................................................................................5Refund............................................................................................................................................................................6
GENERAL INFORMATION ABOUT PRUCO LIFE INSURANCE COMPANY, THE PRUCO LIFE VARIABLEAPPRECIABLE ACCOUNT, AND THE VARIABLE INVESTMENT OPTIONS AVAILABLEUNDER THE CONTRACT .................................................................................................................................................7
Pruco Life Insurance Company ...................................................................................................................................7The Pruco Life Variable Appreciable Account ...........................................................................................................7The Funds......................................................................................................................................................................7Voting Rights...............................................................................................................................................................12The Fixed-Rate Option ...............................................................................................................................................12Which Investment Option Should Be Selected?......................................................................................................13
DETAILED INFORMATION FOR PROSPECTIVE CONTRACT OWNERS ...................................................................13Charges and Expenses ..............................................................................................................................................13Requirements for Issuance of a Contract ................................................................................................................18Short-Term Cancellation Right or "Free-Look" .......................................................................................................18Types of Death Benefit ...............................................................................................................................................18Changing the Type of Death Benefit .........................................................................................................................19Contract Date ..............................................................................................................................................................19Premiums.....................................................................................................................................................................19Allocation of Premiums..............................................................................................................................................20Death Benefit Guarantee ............................................................................................................................................21Transfers......................................................................................................................................................................22Dollar Cost Averaging ................................................................................................................................................23Auto-Rebalancing .......................................................................................................................................................23How a Contract’s Cash Surrender Value Will Vary..................................................................................................23How a Type A (Fixed) Contract’s Death Benefit Will Vary ......................................................................................24How a Type B (Variable) Contract’s Death Benefit Will Vary..................................................................................24Surrender of a Contract..............................................................................................................................................25Withdrawals.................................................................................................................................................................25Increases in Basic Insurance Amount ......................................................................................................................26Decreases in Basic Insurance Amount ....................................................................................................................27When Proceeds Are Paid ...........................................................................................................................................27Living Needs Benefit ..................................................................................................................................................28Illustrations of Cash Surrender Values, Death Benefits, and Accumulated Premiums.......................................28Contract Loans............................................................................................................................................................30Sale of the Contract and Sales Commissions .........................................................................................................31Tax Treatment of Contract Benefits ..........................................................................................................................31Lapse and Reinstatement ..........................................................................................................................................33Legal Considerations Relating to Sex-Distinct Premiums and Benefits...............................................................33Other General Contract Provisions...........................................................................................................................34Riders...........................................................................................................................................................................34Substitution of Fund Shares......................................................................................................................................34Reports to Contract Owners ......................................................................................................................................35State Regulation..........................................................................................................................................................35Experts.........................................................................................................................................................................35Litigation and Regulatory Proceedings ....................................................................................................................35

Additional Information ...............................................................................................................................................36Financial Statements ..................................................................................................................................................36
DIRECTORS AND OFFICERS ........................................................................................................................................37
FINANCIAL STATEMENTS OF THE VARIABLE UNIVERSAL LIFE SUBACCOUNTS OF THE PRUCO LIFEVARIABLE APPRECIABLE ACCOUNT..........................................................................................................................A1
CONSOLIDATED FINANCIAL STATEMENTS OF PRUCO LIFE INSURANCE COMPANY AND SUBSIDIARIES.....B1

1
��� � �������� ������� ���� �� �����������
accumulated net payments The actual premiumpayments you make accumulated at an effectiveannual rate of 4%, less any withdrawals you make,accumulated at an effective annual rate of 4%.
attained age The insured’s age on the Contractdate plus the number of years since then.
basic insurance amount The amount of lifeinsurance as shown in the Contract, not includingriders. Also referred to as "face amount."
cash surrender value The amount payable to theContract owner upon surrender of the Contract. It isequal to the Contract Fund minus any Contract debtand, during the first 10 Contract years, minus theapplicable surrender charge. Also referred to in theContract as "Net Cash Value."
Contract The variable universal life insurance policydescribed in this prospectus.
Contract anniversary The same date as theContract date in each later year.
Contract date The date the Contract is effective, asspecified in the Contract.
Contract debt The principal amount of alloutstanding loans plus any interest accrued thereon.
Contract Fund The total amount credited to aspecific Contract. On any date it is equal to the sum ofthe amounts in all the variable investment options andthe fixed-rate option, and the principal amount of anyContract debt plus any interest earned thereon.
Contract owner You. Unless a different owner isnamed in the application, the owner of the Contract isthe insured.
Contract year A year that starts on the Contractdate or on a Contract anniversary. For any portion of aContract representing an increase (see page 26),“Contract year” is a year that starts on the effectivedate of the increase.
death benefit If the Contract is not in default, this isthe amount we will pay upon the death of the insured,assuming no Contract debt.
fixed-rate option An investment option under whichinterest is accrued daily at a rate that Pruco Lifedeclares periodically, but not less than an effectiveannual rate of 4%.
Funds Mutual funds with separate portfolios. Oneor more of the available Fund portfolios may be chosenas an underlying investment for the Contract.
Lifetime Death Benefit Guarantee period Thelifetime of the Contract, during which time the LifetimeDeath Benefit Guarantee is available if sufficientpremiums are paid. Lifetime Death Benefit Guaranteenot available in Massachusetts. See Death BenefitGuarantee, page 21.
Limited Death Benefit Guarantee period A periodwhich is determined on a case-by-case basis, duringwhich time the Limited Death Benefit Guarantee isavailable if sufficient premiums are paid. See DeathBenefit Guarantee, page 21. The period applicable toyour Contract is shown on the Contract data pages.
Monthly date The Contract date and the same datein each subsequent month.
Pruco Life Insurance Company Us, we, our,Pruco Life. The company offering the Contract.
separate account � Amounts under the Contractthat are allocated to the variable investment optionsheld by us in a separate account called the Pruco LifeVariable Appreciable Account (the "Account"). Theseparate account is set apart from all of the generalassets of Pruco Life Insurance Company.
valuation period The period of time from onedetermination of the value of the amount invested in avariable investment option to the next. Suchdeterminations are made when the net asset values ofthe portfolios of the Funds are calculated, which isgenerally at 4:00 p.m. Eastern time on each day duringwhich the New York Stock Exchange is open.
variable investment options the 35 mutual fundsavailable under this Contract, whose shares are held inthe separate account.
you The owner of the Contract.

2
������� ����������
This Summary provides a brief overview of the more significant aspects of the Contract. We provide further detail inthe subsequent sections of this prospectus and in the Contract.
�����������������������������
As of December 12, 2001, Pruco Life no longer offered these Contracts for sale.
The Contract is a form of variable universal life insurance. It is based on a Contract Fund, the value of which changesevery day. The chart below describes how the value of your Contract Fund changes.
A broad objective of the Contract is to provide benefits that will increase in value if favorable investment results areachieved. You may invest premiums in one or more of the 35 available variable investment options (in states wherethey are approved) or in the fixed-rate option. Your Contract Fund value changes every day depending upon thechange in the value of the particular investment options that you have selected.
Although the value of your Contract Fund will increase if there is favorable investment performance in the variableinvestment options you select, investment returns in the variable investment options are NOT guaranteed. There is arisk that investment performance will be unfavorable and that the value of your Contract Fund will decrease. The riskwill be different, depending upon which investment options you choose. See Which Investment Option Should BeSelected?, page 13. If you select the fixed-rate option, Pruco Life credits your account with a declared rate or rates ofinterest but you assume the risk that the rate may change, although it will never be lower than an effective annual rateof 4%.
Variable life insurance contracts are unsuitable as short-term savings vehicles. Withdrawals and loans will negate anyguarantee against lapse and may result in adverse tax consequences. See Death Benefit Guarantee, page 21, andTax Treatment of Contract Benefits, page 31.
The replacement of life insurance is generally not in your best interest. In most cases, if you requireadditional coverage, the benefits of your existing contract can be protected by purchasing additionalinsurance or a supplemental contract. If you are considering replacing a contract, you should compare thebenefits and costs of supplementing your existing contract with the benefits and costs of purchasing theContract described in this prospectus and you should consult with a qualified tax adviser.
This prospectus may only be offered in jurisdictions in which the offering is lawful. No person is authorizedto make any representations in connection with this offering other than those contained in this prospectusand in the prospectuses and statements of additional information for the Funds.
���� ��
The following chart outlines the components of your Contract Fund and the adjustments which may be made includingthe maximum charges which may be deducted from each premium payment and from the amounts held in thedesignated investment options. These charges are largely designed to cover insurance costs and risks as well assales and administrative expenses.
The maximum charges shown in the chart, as well as the current lower charges, are fully described under Chargesand Expenses, page 13.

3
���!�"!��#!���
• less a charge of up to 7.5% of the premiums paid fortaxes attributable to premiums. In Oregon this iscalled a premium based administrative charge.
• less a charge for sales expenses of up to 4% of thepremiums paid.
�$����%���!�"!�!�"��To be invested in one or a combination of:
• 35 variable investment options• The fixed-rate option
���������"�%On the Contract Date, the Contract Fund is equal to the invested premium amountminus any of the charges described below which may be due on that date. Thereafter,the value of the Contract Fund changes daily.
��"�������%&"���������������"�%���'• Addition of any new invested premium amounts.• Addition of any increase due to investment results of the chosen variable investment options.• Addition of guaranteed interest at an effective annual rate of 4% (plus any excess interest if
applicable) on the portion of the Contract Fund allocated to the fixed-rate option.• Addition of guaranteed interest at an effective annual rate of 4% on the amount of any
Contract loan. (Separately, interest charged on the loan accrues at an effective annual rate of4.5% or 5%. See Contract Loans, page 30.)
• Subtraction of any decrease due to investment results of the chosen variable investmentoptions.
• Subtraction of any amount withdrawn.• Subtraction of the charges listed below, as applicable.
���(#���� ��
• Management fees and expenses are deducted from the Fund assets. See UnderlyingPortfolio Expenses chart, below.
• We deduct a daily mortality and expense risk charge, equivalent to an annual rate of up to0.9%, from the assets in the variable investment options.
�����(#���� ��• We reduce the Contract Fund by a monthly administrative charge of up to $10 plus $0.07 per
$1,000 ($10 plus $0.08 per $1,000 in Massachusetts) of the basic insurance amount; after thefirst Contract year, the $0.07 per $1,000 ($0.08 per $1,000 in Massachusetts) portion of thecharge is reduced to $0.01 per $1,000 ($0.02 per $1,000 in Massachusetts) of the basicinsurance amount.
• We deduct a cost of insurance ("COI") charge.• We reduce the Contract Fund by a Death Benefit Guarantee risk charge of $0.01 per $1,000
of the basic insurance amount (not applicable in Massachusetts).• If the Contract includes riders, we deduct rider charges from the Contract Fund.• If the rating class of an insured results in an extra charge, we will deduct that charge from the
Contract Fund.

4
�����)(��%%������(���� ��• During the first 10 Contract years, we will assess a contingent deferred sales charge if the
Contract lapses, is surrendered, or the basic insurance amount is decreased (including as aresult of a withdrawal or a death benefit type change). For insureds age 76 or less at issue,the maximum contingent deferred sales charge is 26% of the lesser of the target levelpremium or the actual premiums paid (see Premiums, page 19) for the Contract. The chargeis level for six years and then declines monthly to zero at the end of the 10th Contract year.For insureds age 77 or over at issue, the maximum charge will be a lesser percentage of thetarget level premium for the Contract or the actual premiums paid.
• During the first 10 Contract years, we will assess a contingent deferred administrative chargeif the Contract lapses, is surrendered or the basic insurance amount is decreased (includingas a result of a withdrawal or a death benefit type change). This charge equals the lesser of:(a) $5 per $1,000 of basic insurance amount; and (b) $500. It is level for six years and thendeclines monthly until it reaches zero at the end of the 10th Contract year.
• We assess an administrative charge of up to $25 for any withdrawals.• We may assess an administrative charge of up to $25 for any change in basic insurance
amount.• We assess an administrative charge of up to $25 for each transfer exceeding 12 in any
Contract year.
��%��(#�� ������(���*������
The Prudential Series Fund, Inc.Portfolios
InvestmentAdvisory
Fees
OtherExpenses
TotalContractualExpenses
Total ActualExpenses*
Conservative Balanced Diversified Bond Equity Flexible Managed Global High Yield Bond Jennison Money Market Stock Index Value SP Aggressive Growth Asset Allocation (1) SP AIM Aggressive Growth SP AIM Core Equity SP Alliance Large Cap Growth SP Alliance Technology SP Balanced Asset Allocation (1) SP Conservative Asset Allocation (1) SP Davis Value SP Deutsche International Equity SP Growth Asset Allocation (1) SP INVESCO Small Company Growth SP Jennison International Growth SP Large Cap Value SP MFS Capital Opportunities SP MFS Mid-Cap Growth SP PIMCO High Yield SP PIMCO Total Return SP Prudential U.S. Emerging Growth SP Small/Mid Cap Value SP Strategic Partners Focused Growth
0.55%0.40%0.45%0.60%0.75%0.55%0.60%0.40%0.35%0.40%0.84%0.95%0.85%0.90%1.15%0.75%0.71%0.75%0.90%0.80%0.95%0.85%0.80%0.75%0.80%0.60%0.60%0.60%0.90%0.90%
0.03%0.04%0.04%0.04%0.09%0.05%0.04%0.03%0.04%0.04%0.90%2.50%1.70%0.67%2.01%0.52%0.35%0.28%2.37%0.66%1.89%1.01%1.18%2.29%1.31%0.48%0.22%0.81%0.66%1.71%
0.58%0.44%0.49%0.64%0.84%0.60%0.64%0.43%0.39%0.44%1.74%3.45%2.55%1.57%3.16%1.27%1.06%1.03%3.27%1.46%2.84%1.86%1.98%3.04%2.11%1.08%0.82%1.41%1.56%2.61%
0.58%0.44%0.49%0.64%0.84%0.60%0.64%0.43%0.39%0.44%1.04%1.07%1.00%1.10%1.30%0.92%0.87%0.83%1.10%0.97%1.15%1.24%0.90%1.00%1.00%0.82%0.76%0.90%1.05%1.01%
* Reflects fee waivers, reimbursement of expenses, and expense reductions, if any.

5
��%��(#�� ������(���*������
PortfoliosInvestmentAdvisory
Fees
OtherExpenses
TotalContractualExpenses
TotalActual
Expenses*AIM Variable Insurance Funds AIM V.I. Premier Equity Fund - Series I shares 0.60% 0.25% 0.85% 0.85%
American Century Variable Portfolios, Inc. (2) VP Value Fund 0.97% 0.00% 0.97% 0.97%
Janus Aspen Series (3) Growth Portfolio - Institutional Shares 0.65% 0.01% 0.66% 0.66%
MFS7 Variable Insurance TrustK (4) Emerging Growth Series 0.75% 0.12% 0.87% 0.86%
T. Rowe Price International Series, Inc. (5) International Stock Portfolio 1.05% 0.00% 1.05% 1.05%
* Reflects fee waivers, reimbursement of expenses, and expense reductions, if any.
(1) Prudential Series Fund, Inc. Each Asset Allocation Portfolio invests shares in other Fund Portfolios. The Advisory Fees for the Asset Allocation
Portfolios are the product of a blend of the Advisory Fees of those other Fund Portfolios, plus a 0.05% annual advisory feepayable to PI.
(2) American Century Variable Portfolios, Inc. The “Investment Advisory Fees” include ordinary expenses of managing and operating the Fund, except brokerage
expenses, taxes, interest, fees and expenses of the independent directors (including legal counsel fees), and extraordinaryexpenses. The Fund has a stepped fee schedule. As a result, the Fund’s management fee rate decreases as the Fund’sassets increase.
(3) Janus Aspen Series The table reflects expenses for the fiscal year ended December 31, 2001. All expenses are shown without the effect of any
offset arrangements.(4) MFS® Variable Insurance Trust SM
An expense offset arrangement with the Fund’s custodian resulted in a reduction in “Other Expenses” by 0.01% and isreflected in the “Total Actual Expenses.”
(5) T. Rowe Price International Series, Inc.The “Investment Advisory Fees” include ordinary recurring operating expenses of the Funds.
The expenses relating to the Funds (other than those of the Series Fund) have been provided to Pruco Life bythe Funds. Pruco Life has not independently verified them.
�#�����������������
There are two types of death benefit available. You may choose a Contract with a Type A (fixed) death benefit underwhich the cash surrender value varies daily with investment experience, and the death benefit generally remains at thebasic insurance amount you initially chose. However, the Contract Fund may grow to a point where the death benefitmay increase and vary with investment experience. If you choose a Contract with a Type B (variable) death benefit,the cash surrender value and the death benefit both vary with investment experience. For either type of death benefit,as long as the Contract is in-force, the death benefit will never be less than the basic insurance amount shown in yourContract. See Types of Death Benefit, page 18.
���!�"!��#!����
The Contract is a flexible premium contract – there are no scheduled premiums. Except for the minimum initialpremium, and subject to a minimum of $25 per subsequent payment, you choose the timing and amount of premiumpayments. The Contract will remain in-force if the Contract Fund less any applicable surrender charges is greater thanzero and more than any Contract debt. Paying insufficient premiums, poor investment results, or the taking of loans orwithdrawals from the Contract will increase the possibility that the Contract will lapse. However, if the accumulatedpremiums you pay are high enough, and Contract debt does not equal or exceed the Contract Fund less anyapplicable surrender charges, Pruco Life guarantees that your Contract will not lapse even if investment experience isvery unfavorable and the Contract Fund drops below zero. Each Contract generally provides two guarantees, one thatlasts for the lifetime of the Contract and another that lasts for a stated, reasonably lengthy period. The guarantee for

6
the life of the Contract requires higher premium payments. In Massachusetts, only one death benefit guarantee isavailable. The length of this death benefit guarantee is generally five Contract years, however, for some Contracts, itmay be shorter. See Premiums, page 19, Death Benefit Guarantee, page 21 and Lapse and Reinstatement, page33.
We offer and suggest regular billing of premiums even though you decide when to make premium payments and,subject to a $25 minimum, in what amounts. You should discuss your billing options with your Pruco Liferepresentative when you apply for the Contract. See Premiums, page 19.
���"�%
For a limited time, you may return your Contract for a refund in accordance with the terms of its "Free-Look" provision. See Short-Term Cancellation Right or "Free-Look," page 18.
For the DEFINITIONS OF SPECIAL TERMS USED IN THIS PROSPECTUS, see page 1.

7
+����� ������ ������������ �� ������������,��������� ��-�� ���������� ����������,�����-�� ���� -��������� ��
�-� �������������������
��"������ ��"�������!���#
Pruco Life Insurance Company ("Pruco Life") is a stock life insurance company, organized in 1971 under the laws ofthe State of Arizona. It is licensed to sell life insurance and annuities in the District of Columbia, Guam, and in allstates except New York.
Pruco Life is a wholly-owned subsidiary of The Prudential Insurance Company of America ("Prudential"), a New Jerseystock life insurance company that has been doing business since 1875. Prudential is an indirect wholly-ownedsubsidiary of Prudential Financial, Inc. (“Prudential Financial”), a New Jersey insurance holding company. As PrucoLife’s ultimate parent, Prudential Financial exercises significant influence over the operations and capital structure ofPruco Life and Prudential. However, neither Prudential Financial, Prudential, nor any other related company has anylegal responsibility to pay amounts that Pruco Life may owe under the contract or policy.
Pruco Life's consolidated financial statements begin on page B1 and should be considered only as bearing upon PrucoLife's ability to meet its obligations under the Contracts.
�����"������-����)(���������)(�����"��
We have established a separate account, the Pruco Life Variable Appreciable Account (the "Account") to hold theassets that are associated with the Contracts. The Account was established on January 13, 1984 under Arizona lawand is registered with the Securities and Exchange Commission (“SEC”) under the Investment Company Act of 1940as a unit investment trust, which is a type of investment company. The Account meets the definition of a "separateaccount" under the federal securities laws. The Account holds assets that are segregated from all of Pruco Life's otherassets.
Pruco Life is the legal owner of the assets in the Account. Pruco Life will maintain assets in the Account with a totalmarket value at least equal to the reserve and other liabilities relating to the variable benefits attributable to theAccount. These assets may not be charged with liabilities which arise from any other business Pruco Life conducts. Inaddition to these assets, the Account's assets may include funds contributed by Pruco Life to commence operation ofthe Account and may include accumulations of the charges Pruco Life makes against the Account. From time to timethese additional assets will be transferred to Pruco Life's general account. Pruco Life will consider any possibleadverse impact the transfer might have on the Account before making any such transfer.
The obligations to Contract owners and beneficiaries arising under the Contracts are general corporate obligations ofPruco Life.
Currently, in states where they are approved, you may invest in one or a combination of 35 available variableinvestment options. When you choose a variable investment option, we purchase shares of a mutual fund which areheld as an investment for that option. We hold these shares in the separate account. The division of the separateaccount of Pruco Life that invests in a particular mutual fund is referred to in your Contract as the subaccount. PrucoLife may add additional variable investment options in the future. The Account's financial statements begin on pageA1.
����"�%�
Listed below are the mutual funds (the “Funds”) in which the variable investment options invest, the investmentobjectives, and investment advisers.
Each Fund has a separate prospectus that is provided with this prospectus. You should read the Fundprospectus before you decide to allocate assets to the variable investment option using that Fund. There isno assurance that the investment objectives of the Funds will be met.

8
The Prudential Series Fund, Inc. (the "Series Fund"):
• Conservative Balanced Portfolio: The investment objective is a total investment return consistent with aconservatively managed diversified portfolio. The Portfolio invests in a mix of equity securities, debt obligationsand money market instruments.
• Diversified Bond Portfolio: The investment objective is a high level of income over a longer term while providingreasonable safety of capital. The Portfolio normally invests at least 80% of its investable assets in higher gradedebt obligations and high quality money market investments.
• Equity Portfolio: The investment objective is capital appreciation. The Portfolio normally invests at least 80% ofits investable assets in common stocks of major established corporations as well as smaller companies that webelieve offer attractive prospects of appreciation.
• Flexible Managed Portfolio: The investment objective is a high total return consistent with an aggressivelymanaged diversified portfolio. The Portfolio invests in a mix of equity securities, debt obligations and moneymarket instruments.
• Global Portfolio: The investment objective is long-term growth of capital. The Portfolio invests primarily incommon stocks (and their equivalents) of foreign and U.S. companies.
• High Yield Bond Portfolio: The investment objective is a high total return. The Portfolio normally invests at least80% of its investable assets in high yield/high risk debt securities.
• Jennison Portfolio (formerly Prudential Jennison Portfolio): The investment objective is long-term growth of
capital. The Portfolio invests primarily in equity securities of major, established corporations that we believe offerabove-average growth prospects.
• Money Market Portfolio: The investment objective is maximum current income consistent with the stability ofcapital and the maintenance of liquidity. The Portfolio invests in high quality short-term money market instrumentsissued by the U.S. government or its agencies, as well as domestic and foreign corporations and banks.
• Stock Index Portfolio: The investment objective is investment results that generally correspond to the
performance of publicly-traded common stocks. The Portfolio attempts to duplicate the price and yieldperformance of the Standard & Poor’s 500 Composite Stock Price Index (the “S&P 500”) by investing at least 80%of its investable assets in S&P 500 stocks.
• Value Portfolio: The investment objective is capital appreciation. The Portfolio invests primarily in commonstocks that are trading below their underlying asset value, cash generating ability, and overall earnings andearnings growth.
• SP Aggressive Growth Asset Allocation Portfolio: The investment objective is capital appreciation. The
Portfolio invests primarily in large cap equity portfolios, international portfolios, and small/mid-cap equity portfolios. • SP AIM Aggressive Growth Portfolio: The investment objective is to achieve long-term growth of capital. The
portfolio seeks to meet this objective by investing primarily in the common stocks of companies whose earningsthe advisers expect to grow more than 15% per year.
• SP AIM Core Equity Portfolio (formerly SP AIM Growth and Income Portfolio): The investment objective is
growth of capital with a secondary objective of current income. The Portfolio invests as least 80% of its investableassets plus any borrowings made for investment purposes in securities of established companies that have long-term above-average growth earnings and dividends, and growth companies that the Portfolio managers believehave the potential for above-average growth earnings and dividends.

9
• SP Alliance Large Cap Growth Portfolio: The investment objective is growth of capital. The Portfolio will pursueaggressive investment policies by investing at least 80% of the Portfolio’s investable assets in stocks of companiesconsidered to have large capitalizations.
• SP Alliance Technology Portfolio: The investment objective is growth of capital. The Portfolio normally invests
at least 80% of its investable assets in securities of companies that use technology extensively in the developmentof new or improved products or processes.
• SP Balanced Asset Allocation Portfolio: The investment objective is to provide a balance between current
income and growth of capital. The Portfolio invests primarily in fixed income portfolios, large cap equity portfolios,small/mid-cap equity portfolios, and international equity portfolios.
• SP Conservative Asset Allocation Portfolio: The investment objective is to provide current income with low to
moderate capital appreciation. The Portfolio invests primarily in fixed income portfolios, large cap equity portfolios,and small/mid-cap equity portfolios.
• SP Davis Value Portfolio: The investment objective is growth of capital. The Portfolio invests primarily in
common stock of U.S. companies with market capitalizations of at least $5 billion. • SP Deutsche International Equity Portfolio: The investment objective is to invest for long-term capital
appreciation. The portfolio normally invests at least 80% of its investable assets in the stocks and other equitysecurities of companies in developed countries outside the United States.
• SP Growth Asset Allocation Portfolio: The investment objective is to provide long-term growth of capital with
consideration also given to current income. The Portfolio invests at least 80% of its investable assets in large-capequity portfolios, fixed income portfolios, international equity portfolios, and small/mid-cap equity portfolios.
• SP INVESCO Small Company Growth Portfolio: The investment objective is long-term capital growth. The
Portfolio invests at least 80% of its investable assets in small-capitalization companies - those which are includedin the Russell 2000 Growth Index at the time of purchase, or if not included in that index, have marketcapitalizations of $2.5 billion or below at the time of purchase.
• SP Jennison International Growth Portfolio: The investment objective is long-term growth of capital. Under
normal circumstances, the Portfolio invests at least 65% of its total assets in the common stock of large tomedium-sized foreign companies operating or based in at least five different countries.
• SP Large Cap Value Portfolio: The investment objective is long-term growth of capital. The Portfolio normally
invests at least 80% of its investable assets in securities of companies with large market capitalizations (those withmarket capitalizations similar to companies in the Standard & Poor’s 500 Composite Stock Price Index or theRussell 1000 Index).
• SP MFS Capital Opportunities Portfolio: The investment objective is capital appreciation. The Portfolio invests,
under normal market conditions, at least 65% of its net assets in common stocks and related securities, such aspreferred stocks, convertible securities, and depositary receipts for those securities.
• SP MFS Mid-Cap Growth Portfolio: The investment objective is long-term capital growth. The Portfolio invests,
under normal market conditions, at least 80% of its investable assets in common stocks and related securities,such as preferred stocks, convertible securities, and depositary receipts for those securities.
• SP PIMCO High Yield Portfolio: The investment objective is maximum total return, consistent with preservation
of capital and prudent investment management. Under normal circumstances, the Portfolio invests at least 80% ofits investable assets in a diversified portfolio of high yield securities (“junk bonds”) rated below investment grade,but rated at least B by Moody’s Investor Service, Inc. or Standard & Poor’s Ratings Group, and investment gradefixed income instruments.

10
• SP PIMCO Total Return Portfolio: The investment objective is to seek maximum total return, consistent withpreservation of capital and prudent investment management. Under normal circumstances, the Portfolio invests atleast 65% of its assets in a diversified portfolio of fixed income instruments of varying maturities.
• SP Prudential U.S. Emerging Growth Portfolio: The investment objective is long-term capital appreciation. The
Portfolio normally invests at least 80% of its investable assets in equity securities of small and medium sized U.S.companies.
• SP Small/Mid Cap Value Portfolio: The investment objective is long-term growth of capital. The Portfolio
normally invests at least 80% of its investable assets in securities of companies with small to medium marketcapitalizations.
• SP Strategic Partners Focused Growth Portfolio: The investment objective is long-term growth of capital. The
Portfolio normally invests at least 65% of its total assets in equity-related securities of U.S. companies that theadviser believes to have strong capital appreciation potential.
Prudential Investments LLC (“PI”), an indirect wholly-owned subsidiary of Prudential Financial, serves as the overallinvestment adviser for the Series Fund. PI will furnish investment advisory services in connection with themanagement of the Series Fund portfolios under a “manager-of-managers” approach. Under this structure, PI isauthorized to select (with approval of the Series Fund’s independent directors) one or more sub-advisers to handle theactual day-to-day investment management of each Portfolio. Ultimately, PI serves as the investment adviser for theSP Aggressive Growth Asset Allocation, the SP Balanced Asset Allocation, the SP Conservative Asset Allocation, andthe SP Growth Asset Allocation Portfolios. PI’s business address is 100 Mulberry Street, Gateway Center Three,Newark, New Jersey 07102.
Jennison Associates LLC (“Jennison”), also an indirect wholly-owned subsidiary of Prudential Financial, serves as thesole sub-adviser for the Global, the Jennison, the SP Jennison International Growth, and the SP Prudential U.S.Emerging Growth Portfolios. Jennison serves as a sub-adviser for a portion of the assets of the Equity, the Value, andthe SP Strategic Partners Focused Growth Portfolios. Jennison’s business address is 466 Lexington Avenue, NewYork, New York 10017.
Prudential Investment Management, Inc. (“PIM”), also an indirect wholly-owned subsidiary of Prudential Financial,serves as the sole sub-adviser for the Conservative Balanced, the Diversified Bond, the Flexible Managed, the HighYield Bond, the Money Market, and the Stock Index Portfolios. PIM’s business address is 100 Mulberry Street,Gateway Center Two, Newark, New Jersey 07102.
A I M Capital Management, Inc. ("A I M Capital") serves as the sub-adviser to the SP AIM Aggressive Growth Portfolioand the SP AIM Core Equity Portfolio. A I M Capital's principal business address is 11 Greenway Plaza, Suite 100,Houston, Texas 77046-1173.
Alliance Capital Management, L.P. ("Alliance") serves as the sub-adviser to the SP Alliance Large Cap GrowthPortfolio, the SP Alliance Technology Portfolio, and the SP Strategic Partners Focused Growth Portfolio. The sub-adviser is located at 1345 Avenue of the Americas, New York, New York 10105.
Davis Selected Advisers, L.P. (“Davis”) serves as the sub-adviser to the SP Davis Value Portfolio. The sub-adviser islocated at 2429 East Elvira Road, Suite 101, Tucson, Arizona 85706.
Deutsche Asset Management, Inc. (“DAMI”) serves as a sub-adviser to the SP Deutsche International Equity Portfolioand as a sub-adviser for approximately 25% of the assets of the Value Portfolio. DAMI is a wholly-owned subsidiary ofDeutsche Bank AG. DAMI’s business address is 280 Park Avenue, New York, New York 10017.
Fidelity Management & Research Company ("FMR") serves as the sub-adviser to the SP Large Cap Value Portfolioand the SP Small/Mid Cap Value Portfolio. FMR’s business address is 82 Devonshire Street, Boston, Massachusetts02109.
GE Asset Management Incorporated (“GEAM”) serves as a sub-adviser to approximately 25% of the assets of theEquity Portfolio. GEAM’s ultimate parent is General Electric Corporation. GEAM’s business address is 3003 SummerStreet, Stamford, Connecticut 06904.

11
INVESCO Funds Group, Inc. ("INVESCO’) serves as the sub-adviser to the SP INVESCO Small Company GrowthPortfolio. INVESCO’s principal business address is 4350 South Monaco Street, Denver, Colorado 80237.
Massachusetts Financial Services Company ("MFS") serves as the sub-adviser for the SP MFS Capital OpportunitiesPortfolio and the SP MFS Mid-Cap Growth Portfolio. The principal business address for MFS is 500 Boylston Street,Boston, Massachusetts 02116.
Pacific Investment Management Company LLC (“PIMCO”) serves as the sub-adviser for the SP PIMCO High YieldPortfolio and the SP PIMCO Total Return Portfolio. PIMCO is a subsidiary of Allianz Dresdner Asset Management ofAmerica L.P., formerly PIMCO Advisors L.P. PIMCO’s principal business address is 840 Newport Center Drive,Newport Beach, California 92660.
Salomon Brothers Asset Management, Inc. (“Salomon”) serves as a sub-adviser for a portion of the assets of theEquity Portfolio. It is expected that under normal circumstances Salomon will manage approximately 25% of thePortfolio. Salomon is a part of the global asset management arm of Citigroup, Inc. which was formed in 1998 as aresult of the merger of Travelers Group and Citicorp, Inc. Salomon’s business address is 388 Greenwich Street, NewYork, New York 10013.
Victory Capital Management, Inc. (“Victory”) (formerly Key Asset Management, Inc.) serves as a sub-adviser forapproximately 25% of the assets of the Value Portfolio. Victory is a wholly-owned subsidiary of KeyCorp, Inc. Victory’sbusiness address is 127 Public Square, Cleveland, Ohio 44114.
As an investment adviser, PI charges the Series Fund a daily investment management fee as compensation for itsservices. PI pays each sub-adviser out of the fee that PI receives from the Series Fund. See Deductions fromPortfolios, page 14.
AIM Variable Insurance Funds:
• AIM V.I. Premier Equity Fund- Series I shares (formerly AIM V.I. Value Fund). Seeks to achieve long-termgrowth of capital. Income is a secondary objective.
A I M Advisors, Inc. ("AIM") is the investment adviser for this fund. The principal business address for AIM is 11Greenway Plaza, Suite 100, Houston, Texas 77046-1173.
American Century Variable Portfolios, Inc.:
• American Century VP Value Fund. Seeks long-term capital growth with income as a secondary objective. TheFund seeks to achieve its objective by investing primarily in equity securities of well-established companies withintermediate-to-large market capitalizations that are believed by management to be undervalued at the time ofpurchase.
American Century Investment Management, Inc. ("ACIM") is the investment adviser for this fund. ACIM's principalbusiness address is American Century Tower, 4500 Main Street, Kansas City, Missouri 64111. The principalunderwriter of the Fund is American Century Investment Services, Inc., located at 4500 Main Street, Kansas City,Missouri 64111.
Janus Aspen Series:
• Growth Portfolio- Institutional Shares. Seeks long-term growth of capital in a manner consistent with thepreservation of capital. The Portfolio normally invests in common stocks of larger, more established companies.
Janus Capital Management LLC is the investment adviser and is responsible for the day-to-day management of the portfolio and other business affairs of the portfolio. Janus Capital Corporation's principal business address is 100Fillmore Street, Denver, Colorado 80206-4928.

12
MFS® Variable Insurance TrustSM:
• Emerging Growth Series. Seeks long-term growth of capital. The Series invests, under normal marketconditions, at least 65% of its total assets in common stocks and related securities, such as preferred stock,convertible securities and depositary receipts of those securities, of emerging growth companies.
MFS Investment Management7 (“Massachusetts Financial Services Company”), a Delaware corporation, is theinvestment adviser to this MFS Series. The principal business address for the Massachusetts Financial ServicesCompany is 500 Boylston Street, Boston, Massachusetts 02116.
T. Rowe Price International Series, Inc.:
• International Stock Portfolio. Seeks long-term growth of capital through investments primarily in common stocksof established, non-U.S. companies.
T. Rowe Price International, Inc. is the investment manager for this fund. The principal business address for T. RowePrice International, Inc. is 100 East Pratt Street, Baltimore, Maryland 21202.
The investment advisers for the Funds charge a daily investment management fee as compensation for their services.These fees are described in the table under Deductions from Portfolios in the Charges and Expenses section, seepage 13, and are more fully described in the prospectus for each Fund.
In the future it may become disadvantageous for both variable life insurance and variable annuity contract separateaccounts to invest in the same underlying mutual funds. Although neither of the companies that invest in the Fundsnor the Funds currently foresee any such disadvantage, the Board of Directors for each Fund intends to monitorevents in order to identify any material conflict between variable life insurance and variable annuity contract ownersand to determine what action, if any, should be taken. Material conflicts could result from such things as:
(1) changes in state insurance law;(2) changes in federal income tax law;(3) changes in the investment management of any portfolio of the Funds; or(4) differences between voting instructions given by variable life insurance and variable annuity contract owners.
An affiliate of each of the Funds may compensate Pruco Life based upon an annual percentage of the average assetsheld in the Fund by Pruco Life under the Contracts. These percentages may vary by Fund and/or Portfolio, and reflectadministrative and other services we provide.
-���� �� ���
We are the legal owner of the Fund shares associated with the variable investment options. However, we vote theshares in the Fund according to voting instructions we receive from Contract owners. We will mail you a proxy, whichis a form you need to complete and return to us to tell us how you wish us to vote. When we receive thoseinstructions, we will vote all of the shares we own on your behalf in accordance with those instructions. We will votethe shares for which we do not receive instructions and shares that we own, in the same proportion as the shares forwhich instructions are received. We may change the way your voting instructions are calculated if it is required byfederal or state regulation. Should the applicable federal securities laws or regulations, or their current interpretation,change so as to permit Pruco Life to vote shares of the Funds in its own right, it may elect to do so.
�����*�%.����������
Because of exemptive and exclusionary provisions, interests in the fixed-rate option under the Contract havenot been registered under the Securities Act of 1933 and the general account has not been registered as aninvestment company under the Investment Company Act of 1940. Accordingly, interests in the fixed-rateoption are not subject to the provisions of these Acts, and Pruco Life has been advised that the staff of theSEC has not reviewed the disclosure in this prospectus relating to the fixed-rate option. Any inaccurate ormisleading disclosure regarding the fixed-rate option may, however, be subject to certain generally applicableprovisions of federal securities laws.

13
You may choose to invest, either initially or by transfer, all or part of your Contract Fund to a fixed-rate option. Thisamount becomes part of Pruco Life’s general account. The general account consists of all assets owned by Pruco Lifeother than those in the Account and in other separate accounts that have been or may be established by Pruco Life.Subject to applicable law, Pruco Life has sole discretion over the investment of the general account assets, andContract owners do not share in the investment experience of those assets. Instead, Pruco Life guarantees that thepart of the Contract Fund allocated to the fixed-rate option will accrue interest daily at an effective annual rate thatPruco Life declares periodically, but not less than an effective annual rate of 4%. Pruco Life is not obligated to creditinterest at a rate higher than an effective annual rate of 4%, although we may do so.
Transfers from the fixed-rate option are subject to strict limits, see Transfers, page 22. The payment of any cashsurrender value attributable to the fixed-rate option may be delayed up to six months. See When Proceeds are Paid,page 27.
/���� �$���!������������"(%����(����%0
Historically, for investments held over relatively long periods, the investment performance of common stocks hasgenerally been superior to that of short or long-term debt securities, even though common stocks have been subject tomuch more dramatic changes in value over short periods of time. Accordingly, portfolios such as the Equity, Global,Jennison, Stock Index, Value, AIM V.I. Premier Equity Fund, American Century VP Value Fund, Janus Growth, MFSEmerging Growth Series, or T. Rowe Price International Stock, for example, may be desirable options if you are willingto accept such volatility in your Contract values. Each of these equity portfolios involves different policies andinvestment risks. See The Funds, page 7, for additional equity portfolios available under the Contract and theirspecific investment objectives.
You may prefer the somewhat greater protection against loss of principal (and reduced chance of high total return)provided by the Diversified Bond Portfolio. You may want even greater safety of principal and may prefer the MoneyMarket Portfolio or the fixed-rate option, recognizing that the level of short-term rates may change rather rapidly. If youare willing to take risks and possibly achieve a higher total return, you may prefer the High Yield Bond Portfolio,recognizing that the risks are greater for lower quality bonds with normally higher yields.
You may wish to obtain diversification by relying on Prudential’s judgment for an appropriate asset mix by choosing theConservative Balanced Portfolio, the Flexible Managed Portfolio, the SP Aggressive Growth Asset Allocation Portfolio,the SP Balanced Asset Allocation Portfolio, the SP Conservative Asset Allocation Portfolio, or the SP Growth AssetAllocation Portfolio.
You may wish to divide your invested premium among two or more of the Portfolios. Your choice should take intoaccount your willingness to accept investment risks, how your other assets are invested, and what investment resultsyou may experience in the future. You should consult your Pruco Life representative from time to time about thechoices available to you under the Contract. Pruco Life recommends against frequent transfers among the severaloptions. Experience generally indicates that "market timing" investing, particularly by non-professional investors, islikely to prove unsuccessful.
���� ��� ������ ������������ -���������/���
���� ����%�*������
The total amount invested at any time in the Contract Fund consists of the sum of the amount credited to the variableinvestment options, the amount allocated to the fixed-rate option, and the principal amount of any Contract loan plusthe amount of interest credited to the Contract upon that loan. See Contract Loans, page 30. Most charges,although not all, are made by reducing the Contract Fund.
This section provides a more detailed description of each charge that is described briefly in the chart on page 3.
In several instances we will use the terms "maximum charge" and "current charge." The "maximum charge," in eachinstance, is the highest charge that Pruco Life is entitled to make under the Contract. The "current charge" is the lower

14
amount that Pruco Life is now charging. If circumstances change, we reserve the right to increase each currentcharge, up to the maximum charge, without giving any advance notice.
Deductions from Premium Payments
(a) We charge up to 7.5% for taxes attributable to premiums ( in Oregon this is called a premium based administrativecharge). For these purposes, "taxes attributable to premiums" shall include any federal, state or local income,premium, excise, business or any other type of tax (or component thereof) measured by or based upon theamount of premium received by Pruco Life. That charge is made up of two parts which currently equal a total of3.75% of the premiums received. The first part is a charge for state and local premium taxes. The currentamount for this first part is 2.5% of the premium and is Pruco Life’s estimate of the average burden of state taxesgenerally. Tax rates vary from jurisdiction to jurisdiction and generally range from 0% to 5%. The rate appliesuniformly to all policyholders without regard to state of residence. Pruco Life may collect more for this charge thanit actually pays for state and local premium taxes. The second part is for federal income taxes measured bypremiums, and it is currently equal to 1.25% of premiums. We believe that this charge is a reasonable estimate ofan increase in its federal income taxes resulting from a 1990 change in the Internal Revenue Code. It is intendedto recover this increased tax. During 2001, 2000, and 1999, Pruco Life deducted a total of approximately$10,152,000, $10,774,000, and $17,466,000, respectively, in taxes attributable to premiums.
(b) We charge up to 4% for sales expenses. This charge, often called a “sales load”, is deducted to compensate usfor the costs of selling the Contracts, including commissions, advertising and the printing and distribution ofprospectuses and sales literature.
Currently, the charge is equal to 4% of premiums paid in each Contract year up to the amount of the targetpremium (see Premiums, page 19) and 0% of premiums paid in excess of this amount. Consequently, payingmore than this amount in any Contract year could reduce your total sales load. For example, assume that aContract with no riders or extra insurance charges has a target premium of $884 and the Contract owner wouldlike to pay 10 target premiums. If the Contract owner paid $1,768 (two times the amount of the target premium)in every other Contract year up to the ninth year (i.e. in years 1, 3, 5, 7, 9), the sales load charge would be$176.80. If the Contract owner paid $884 in each of the first 10 Contract years, the total sales load would be$353.60. For additional information, see Increases in Basic Insurance Amount, page 26.
Attempting to structure the timing and amount of premium payments to reduce the potential sales load mayincrease the risk that your Contract will lapse without value. Delaying the payment of target premium amounts tolater years will adversely affect the Death Benefit Guarantee if the accumulated premium payments do not reachthe accumulated values shown under your Contract's Limited Death Benefit Guarantee Values. See DeathBenefit Guarantee, page 21. In addition, there are circumstances where payment of premiums that are too largemay cause the Contract to be characterized as a Modified Endowment Contract, which could be significantlydisadvantageous. See Tax Treatment of Contract Benefits, page 31. During 2001, 2000, and 1999, PrucoLife received a total of approximately $7,302,000, $6,622,000, and $4,458,000, respectively, in sales charges.
Deductions from Portfolios
We deduct an investment advisory fee daily from each portfolio of the Funds at a rate, on an annualized basis, rangingfrom 0.35% for the Series Fund Stock Index Portfolio to 1.15% for the SP Alliance Technology Portfolio. The expensesincurred in conducting the investment operations of the portfolios (such as custodian fees and preparation anddistribution of annual reports) are paid out of the portfolio's income. These expenses also vary from portfolio toportfolio.
The total expenses of each portfolio for the year ended December 31, 2001, expressed as a percentage of the averageassets during the year, are shown below:

15
���������������� �����
The Prudential Series Fund, Inc.Portfolios
InvestmentAdvisory
Fees
OtherExpenses
TotalContractualExpenses
Total ActualExpenses*
Conservative Balanced Diversified Bond Equity Flexible Managed Global High Yield Bond Jennison Money Market Stock Index Value SP Aggressive Growth Asset Allocation (1) SP AIM Aggressive Growth SP AIM Core Equity SP Alliance Large Cap Growth SP Alliance Technology SP Balanced Asset Allocation (1) SP Conservative Asset Allocation (1) SP Davis Value SP Deutsche International Equity SP Growth Asset Allocation (1) SP INVESCO Small Company Growth SP Jennison International Growth SP Large Cap Value SP MFS Capital Opportunities SP MFS Mid-Cap Growth SP PIMCO High Yield SP PIMCO Total Return SP Prudential U.S. Emerging Growth SP Small/Mid Cap Value SP Strategic Partners Focused Growth
0.55%0.40%0.45%0.60%0.75%0.55%0.60%0.40%0.35%0.40%0.84%0.95%0.85%0.90%1.15%0.75%0.71%0.75%0.90%0.80%0.95%0.85%0.80%0.75%0.80%0.60%0.60%0.60%0.90%0.90%
0.03%0.04%0.04%0.04%0.09%0.05%0.04%0.03%0.04%0.04%0.90%2.50%1.70%0.67%2.01%0.52%0.35%0.28%2.37%0.66%1.89%1.01%1.18%2.29%1.31%0.48%0.22%0.81%0.66%1.71%
0.58%0.44%0.49%0.64%0.84%0.60%0.64%0.43%0.39%0.44%1.74%3.45%2.55%1.57%3.16%1.27%1.06%1.03%3.27%1.46%2.84%1.86%1.98%3.04%2.11%1.08%0.82%1.41%1.56%2.61%
0.58%0.44%0.49%0.64%0.84%0.60%0.64%0.43%0.39%0.44%1.04%1.07%1.00%1.10%1.30%0.92%0.87%0.83%1.10%0.97%1.15%1.24%0.90%1.00%1.00%0.82%0.76%0.90%1.05%1.01%
* Reflects fee waivers, reimbursement of expenses, and expense reductions, if any.
PortfoliosInvestmentAdvisory
Fees
OtherExpenses
TotalContractualExpenses
TotalActual
Expenses*AIM Variable Insurance Funds AIM V.I. Premier Equity Fund - Series I shares 0.60% 0.25% 0.85% 0.85%
American Century Variable Portfolios, Inc. (2) VP Value Fund 0.97% 0.00% 0.97% 0.97%
Janus Aspen Series (3) Growth Portfolio - Institutional Shares 0.65% 0.01% 0.66% 0.66%
MFS7 Variable Insurance TrustK (4) Emerging Growth Series 0.75% 0.12% 0.87% 0.86%
T. Rowe Price International Series, Inc. (5) International Stock Portfolio 1.05% 0.00% 1.05% 1.05%
* Reflects fee waivers, reimbursement of expenses, and expense reductions, if any.

16
(1) Prudential Series Fund, Inc. Each Asset Allocation Portfolio invests shares in other Fund Portfolios. The Advisory Fees for the Asset Allocation
Portfolios are the product of a blend of the Advisory Fees of those other Fund Portfolios, plus a 0.05% annual advisoryfee payable to PI.
(2) American Century Variable Portfolios, Inc. The “Investment Advisory Fees” include ordinary expenses of managing and operating the Fund, except brokerage
expenses, taxes, interest, fees and expenses of the independent directors (including legal counsel fees), andextraordinary expenses. The Fund has a stepped fee schedule. As a result, the Fund’s management fee ratedecreases as the Fund’s assets increase.
(3) Janus Aspen SeriesThe table reflects expenses for the fiscal year ended December 31, 2001. All expenses are shown without the effect ofany offset arrangements.
(4) MFS® Variable Insurance Trust SM
An expense offset arrangement with the Fund’s custodian resulted in a reduction in “Other Expenses” by 0.01% and isreflected in the “Total Actual Expenses.”
(5) T. Rowe Price International Series, Inc.The “Investment Management Fees” include ordinary recurring operating expenses of the Funds.
The expenses relating to the Funds (other than those of the Series Fund) have been provided to Pruco Life bythe Funds. Pruco Life has not independently verified them.
Daily Deduction from the Contract Fund
Each day we deduct a charge from the assets of each of the variable investment options in an amount equivalent to aneffective annual rate of up to 0.9%. Currently, we charge 0.6%. This charge is intended to compensate Pruco Life forassuming mortality and expense risks under the Contract. The mortality risk assumed is that insureds may live forshorter periods of time than Pruco Life estimated when it determined what mortality charge to make. The expense riskassumed is that expenses incurred in issuing and administering the Contract will be greater than Pruco Life estimatedin fixing its administrative charges. During 2001, 2000, and 1999, Pruco Life received a total of approximately$5,796,000, $5,378,000, and $3,352,000, respectively, in mortality and expense risk charges. This charge is notassessed against amounts allocated to the fixed-rate option.
Monthly Deductions from the Contract Fund
Pruco Life deducts the following monthly charges proportionately from the dollar amounts held in each of the choseninvestment option[s].
(a) An administrative charge based on the basic insurance amount is deducted. The charge is intended tocompensate us for things like processing claims, keeping records and communicating with Contract owners.Currently, the charge is equal to $10 per Contract plus $0.07 per $1,000 ($10 per Contract plus $0.08 per $1,000in Massachusetts) of basic insurance amount in the first Contract year and $5 per Contract plus $0.01 per $1,000($5 per Contract plus $0.02 per $1,000 in Massachusetts) of basic insurance amount in all subsequent years.Pruco Life reserves the right, however to charge up to $10 per Contract plus $0.07 per $1,000 ($10 per Contractplus $0.08 per $1,000 in Massachusetts) of basic insurance amount in the first Contract year and $10 per Contractplus $0.01 per $1,000 ($10 per Contract plus $0.02 per $1,000 in Massachusetts) of basic insurance amount in allsubsequent years.
For example, a Contract with a basic insurance amount of $100,000 would currently have a charge equal to $10
plus $7 for a total of $17 ($10 plus $8 for a total of $18 in Massachusetts) per month for the first Contract year and$5 plus $1 for a total of $6 ($5 plus $2 for a total of $7 in Massachusetts) per month in all later years. Themaximum charge for this same Contract would be $10 plus $7 for a total of $17 ($10 plus $8 for a total of $18 inMassachusetts) per month during the first Contract year. In later years, the maximum charge would be $10 plus$1 for a total of $11 ($10 plus $2 for a total of $12 in Massachusetts) per month. During 2001, 2000, and 1999,Pruco Life received a total of approximately $14,662,000, $12,246,000, and $6,294,000, respectively, in monthlyadministrative charges.
(b) A cost of insurance ("COI") charge is deducted. When an insured dies, the amount payable to the beneficiary
(assuming there is no Contract debt) is larger than the Contract Fund - significantly larger if the insured dies in theearly years of a Contract. The cost of insurance charges collected from all Contract owners enables Pruco Life to

17
pay this larger death benefit. The maximum COI charge is determined by multiplying the "net amount at risk"under a Contract (the amount by which the Contract’s death benefit exceeds the Contract Fund) by maximum COIrates. The maximum COI rates are based upon the 1980 Commissioners Standard Ordinary ("CSO") Tables andan insured’s current attained age, sex (except where unisex rates apply), smoker/non-smoker status, and extrarating class, if any. At most ages, Pruco Life’s current COI rates are lower than the maximum rates. For additionalinformation, see Increases in Basic Insurance Amount, page 26.
(c) A charge of $0.01 per $1,000 of basic insurance amount is made to compensate Pruco Life for the risk we assume
by providing the Death Benefit Guarantee feature (not applicable in Massachusetts). See Death BenefitGuarantee, page 21. During 2001, 2000, and 1999 , Pruco Life received a total of approximately $2,344,000,$2,798,000, and $1,314,000, respectively, for this risk charge.
(d) You may add one or more of several riders to the Contract. Some riders are charged for separately. If you add
such a rider to the basic Contract, additional charges will be deducted. (e) If an insured is in a substandard risk classification (for example, a person in a hazardous occupation), additional
charges will be deducted. (f) A charge may be deducted to cover federal, state or local taxes (other than “taxes attributable to premiums”
described above, in Oregon this is called a premium based administrative charge) that are imposed upon theoperations of the Account. At present no such taxes are imposed and no charge is made.
The earnings of the Account are taxed as part of the operations of Pruco Life. Currently, no charge is being madeto the Account for Pruco Life’s federal income taxes, other than the 1.25% charge for federal income taxesmeasured by premiums. See Deductions from Premiums, page 14. Pruco Life periodically reviews the questionof a charge to the Account for Company federal income taxes. We may make such a charge in the future for anyfederal income taxes that would be attributable to the Contracts.
Surrender Charges
(a) An additional sales load is charged if during the first 10 Contract years the Contract lapses, is surrendered or ifthe basic insurance amount is decreased. It is not deducted from the death benefit if the insured should dieduring this period. For issue ages 76 or less, this contingent deferred charge will be 26% of the lesser of: (a) thetarget level premium for the Contract; and (b) the actual premiums paid (see Premiums, page 19). The rate usedin the calculation of this contingent deferred charge will be 22% for issue ages 77-79, 16% for issue ages 80-83and 13% for issue ages 84-85. The rate used in the calculation of this contingent deferred charge will remainlevel for six years. After six years, this charge will reduce monthly at a constant rate until it reaches zero at theend of the 10th year.
(b) If during the first 10 Contract years the Contract lapses, is surrendered or if the basic insurance amount is
decreased, an administrative charge is deducted to cover the cost of processing applications, conducting medicalexaminations, determining insurability and the insured's rating class, and establishing records. The charge isequal to the lesser of: (a) $5 per $1,000 of basic insurance amount; and (b) $500. This charge is level for sixyears. After six years, this charge will be reduced monthly at a constant rate until it reaches zero at the end of the10th year.
We will show a surrender charge threshold amount in the Contract data pages. This threshold amount is the lowestbasic insurance amount since issue. If during the first 10 Contract years, the basic insurance amount is decreased[including as a result of a withdrawal or a change in type of death benefit from Type A (fixed) to Type B (variable)], andthe new basic insurance amount is below the threshold, we will deduct a percentage of the surrender charge. Thepercentage will be the amount by which the new basic insurance amount is less than the threshold, divided by thethreshold. After this transaction, the threshold will be updated and a corresponding new surrender charge schedulewill also be determined to reflect that portion of surrender charges deducted in the past. During 2001, 2000, and 1999,Pruco Life received a total of approximately $6,001,000, $2,578,000, and $1,519,000 respectively, from surrenderedor lapsed Contracts.

18
Transaction Charges
(a) We currently charge an administrative processing fee equal to the lesser of $25 or 2% of the withdrawal amount inconnection with each withdrawal.
(b) We currently do not charge an administrative processing fee in connection with a change in basic insurance
amount. We reserve the right to make such a charge in an amount of up to $25 for any change in basic insuranceamount.
(c) We currently charge an administrative processing fee of up to $25 for each transfer exceeding 12 in any Contract
year.
��1"���!������� ��"���������������
As of December 12, 2001, Pruco Life no longer offered these Contracts for sale. The Contract was generally issuedon insureds below the age of 81. Generally, the minimum basic insurance amount was $100,000. Pruco Life requiredevidence of insurability, which may have included a medical examination, before issuing any Contract. Non-smokerswere offered the most favorable cost of insurance rates. We charge a higher cost of insurance rate and/or anadditional amount if an extra mortality risk is involved. These are the current underwriting requirements. We reservethe right to change them on a non-discriminatory basis.
�����.���!�����((������� ����2����.���32
Generally, you may return the Contract for a refund within 10 days after you receive it. Some states allow a longerperiod of time during which a Contract may be returned for a refund. You can request a refund by mailing or deliveringthe Contract to the representative who sold it or to the Home Office specified in the Contract. A Contract returnedaccording to this provision shall be deemed void from the beginning. You will then receive a refund of all premiumpayments made, plus or minus any change due to investment experience. However, if applicable law so requires andyou exercise your short-term cancellation right, you will receive a refund of all premium payments made, with noadjustment for investment experience.
�#�����������������
You may select either of two types of death benefit. Generally, a Contract with a Type A (fixed) death benefit has adeath benefit equal to the basic insurance amount. This type of death benefit does not vary with the investmentperformance of the investment options you selected, except in certain circumstances. See How a Type A (Fixed)Contract’s Death Benefit Will Vary, page 24. The payment of additional premiums and favorable investment resultsof the variable investment options to which the assets are allocated will generally increase the cash surrender value.See How a Contract’s Cash Surrender Value Will Vary, page 23.
A Contract with a Type B (variable) death benefit has a death benefit which will generally equal the basic insuranceamount plus the Contract Fund. Since the Contract Fund is a part of the death benefit, favorable investmentperformance and payment of additional premiums generally result in an increase in the death benefit as well as in thecash surrender value. Over time, however, the increase in the cash surrender value will be less than under a Type A(fixed) Contract. This is because, given two Contracts with the same basic insurance amount and equal ContractFunds, generally the cost of insurance charge for a Type B (variable) Contract will be greater. See How a Contract’sCash Surrender Value Will Vary, page 23 and How a Type B (Variable) Contract’s Death Benefit Will Vary, page24. Unfavorable investment performance will result in decreases in the death benefit and in the cash surrender value.But, as long as the Contract is not in default, the death benefit may not fall below the basic insurance amount stated inthe Contract.
In choosing a death benefit type, you should also consider whether you intend to use the withdrawal feature. Contractowners of Type A (fixed) Contracts should note that any withdrawal may result in a reduction of the basic insuranceamount and the deduction of any applicable surrender charges. In addition, we will not allow you to make a withdrawalthat will decrease the basic insurance amount below the minimum basic insurance amount. See Withdrawals, page25.

19
���� �� ����#����������������
You may change the type of death benefit on or after the first Contract anniversary and subject to Pruco Life’sapproval. We will increase or decrease the basic insurance amount so that the death benefit immediately after thechange matches the death benefit immediately before the change.
If you are changing your Contract’s type of death benefit from Type A (fixed) to Type B (variable), we will reduce thebasic insurance amount by the amount in your Contract Fund on the date the change takes place. The basicinsurance amount after the change may not be lower than the minimum basic insurance amount applicable to theContract. If you are changing from a Type B (variable) to a Type A (fixed) death benefit, we will increase the basicinsurance amount by the amount in your Contract Fund on the date the change takes place. This is illustrated in thefollowing chart.
���� �� ������������������!
�#����
�#���
4��*�%54-����)(�5
���� �� ������������������!
�#����
�#���
4-����)(�54��*�%5
����� ��"������!�"�� $300,000 ��$250,000 $250,000 ��$300,000
���������"�% $50,000 ��$50,000 $50,000 ��$50,000
������������ $300,000 ��$300,000 $300,000 ��$300,000
Changing your Contract’s type of death benefit from Type A (fixed) to Type B (variable) during the first 10 Contractyears may result in the assessment of surrender charges. In addition, we reserve the right to make an administrativeprocessing charge of up to $25 for any change in basic insurance amount, although we do not currently do so. SeeCharges and Expenses, page 13.
To request a change, fill out an application for change which can be obtained from your Pruco Life representative or aHome Office. If the change is approved, we will recompute the Contract’s charges and appropriate tables and sendyou new Contract data pages. We may require you to send us your Contract before making the change.
������������
When the first premium payment is paid with the application for a Contract, the Contract date will ordinarily be the laterof the application date or the medical examination date. If the first premium is not paid with the application, theContract date will be the date on which the first premium is paid and the Contract is delivered. Under certaincircumstances, we may allow the Contract to be backdated for the purpose of lowering the insured’s issue age, butonly to a date not earlier than six months prior to the application date. This may be advantageous for some Contractowners as a lower issue age may result in lower current charges. For a Contract that is backdated, we will credit theinitial premium as of the date of receipt and will deduct any charges due on or before that date.
���!�"!�
The Contract is a flexible premium contract. The minimum initial premium is due on or before the Contract date.Thereafter, you decide when to make premium payments and, subject to a $25 minimum, in what amounts. Wereserve the right to refuse to accept any payment that increases the death benefit by more than it increases theContract Fund. See How a Type A (Fixed) Contract’s Death Benefit Will Vary, page 24 and How a Type B(Variable) Contract’s Death Benefit Will Vary, page 24. There are circumstances under which the payment ofpremiums in amounts that are too large may cause the Contract to be characterized as a Modified EndowmentContract, which could be significantly disadvantageous. See Tax Treatment of Contract Benefits, page 31.
The Contract has several types of "premiums" which are described below. Understanding them will help youunderstand how the Contract works.

20
Minimum initial premium the premium needed to start the Contract. There is no insurance under theContract unless the minimum initial premium is paid.
Guideline premiums (not applicable in Massachusetts) the premiums that, if paid at the beginning of eachContract year, will keep the Contract in-force for the lifetime of the insured regardless of investment performance,assuming no loans or withdrawals. These guideline premiums will be higher for a Type B (variable) Contract thanfor a Type A (fixed) Contract. For a Contract with no riders or extra risk charges, these premiums will be level. Ifcertain riders are included, the guideline premium may increase each year. Payment of guideline premiums atthe beginning of each Contract year is one way to achieve the Lifetime Death Benefit Guarantee Values shown onthe Contract data pages. See Death Benefit Guarantee, below. When you purchase a Contract, your PrucoLife representative can tell you the amount[s] of the guideline premium.
Target premiums the premiums that, if paid at the beginning of each Contract year, will keep the Contract in-force during the Limited Death Benefit Guarantee period regardless of investment performance, assuming noloans or withdrawals. As is the case with the guideline premium, for a Contract with no riders or extra riskcharges, these premiums will be level. If certain riders are included, the target premium may increase each year.Payment of target premiums at the beginning of each Contract year is one way to achieve the Limited DeathBenefit Guarantee Values shown on the Contract data pages. At the end of the Limited Death Benefit Guaranteeperiod, continuation of the Contract will depend on the Contract Fund having sufficient money to cover all chargesor meeting the conditions of the Lifetime Death Benefit Guarantee. See Death Benefit Guarantee, below. Whenyou purchase a Contract, your Pruco Life representative can tell you the amount[s] of the target premium.
Target Level Premium the target premium at issue minus any premiums associated with riders or withaviation, avocation, occupational or temporary extra insurance charges. We use the target level premium incalculating the contingent deferred sales charges. See Charges and Expenses, page 13.
We can bill you for the amount you select annually, semi-annually, quarterly or monthly. Because the Contract is aflexible premium contract, there are no scheduled premium due dates. When you receive a premium notice, you arenot required to pay this amount. The Contract will remain in-force if: (1) the Contract Fund, less any applicablesurrender charges, is greater than zero and more than any Contract debt or (2) you have paid sufficient premiums, onan accumulated basis, to meet the Death Benefit Guarantee conditions and Contract debt is not equal to or greaterthan the Contract Fund, less any applicable surrender charges. You may also pay premiums automatically throughpre-authorized monthly transfers from a bank checking account. If you elect to use this feature, you choose the day ofthe month on which premiums will be paid and the amount of the premiums paid.
When you apply for the Contract, you should discuss with your Pruco Life representative how frequently you would liketo be billed (if at all) and for what amount.
�((������������!�"!�
On the Contract date, we deduct the charge for sales expenses and the charge for taxes attributable to premiums (inOregon this is called a premium based administrative charge) from the initial premium. The remainder of the initialpremium will be allocated on the Contract date among the variable investment options and/or the fixed-rate optionaccording to your desired allocation as specified in the application form and the first monthly deductions are made. Ifthe first premium is received before the Contract date, there will be a period during which the Contract owner’s initialpremium will not be invested. See Charges and Expenses, page 13.
The charge for sales expenses and the charge for taxes attributable to premiums also apply to all subsequent premiumpayments. The remainder will be invested as of the end of the valuation period in which it is received at a HomeOffice, in accordance with the allocation you previously designated. Provided the Contract is not in default, you maychange the way in which subsequent premiums are allocated by giving written notice to a Home Office or bytelephoning a Home Office, provided you are enrolled to use the Telephone Transfer System. There is no charge forreallocating future premiums. All percentage allocations must be in whole numbers. For example, 33% can beselected but 33�% cannot. Of course, the total allocation to all selected investment options must equal 100%.

21
������������+"�������
Although you decide what premium amounts you wish to pay, sufficient premium payments, on an accumulated basis,will guarantee that your Contract will not lapse and a death benefit will be paid upon the death of the insured. This willbe true even if, because of unfavorable investment experience, your Contract Fund value drops to zero. However, theguarantee is contingent upon Contract debt not being equal to or greater than the Contract Fund less any applicablesurrender charges. See Contract Loans, page 30. You should consider the importance of the Death BenefitGuarantee to you when deciding what amounts of premiums to pay into the Contract.
For purposes of determining this guarantee, we generally calculate, and show in the Contract data pages, two sets ofvalues the Lifetime Death Benefit Guarantee Values (not applicable in Massachusetts) and Limited Death BenefitGuarantee Values. These are not cash values that you can realize by surrendering the Contract, nor are they payabledeath benefits. They are values used solely to determine if a Death Benefit Guarantee is in effect. The Lifetime DeathBenefit Guarantee Values are shown for the lifetime of the Contract and are the end-of-year accumulations ofGuideline Premiums at 4% annual interest assuming premiums are paid at the beginning of each Contract year. TheLimited Death Benefit Guarantee Values are lower, but only apply for the length of the Limited Death BenefitGuarantee period. They are the end-of-year accumulations of Target Premiums at 4% annual interest assumingpremiums are paid at the beginning of each Contract year.
The length of the Limited Death Benefit Guarantee period is determined on a case by case basis depending on thingslike the insured’s age, sex (except where unisex rates apply), smoker/non-smoker status, death benefit type and extrarating class, if any. In Massachusetts, the length of the Limited Death Benefit Guarantee period is generally five years.The length of the Limited Death Benefit Guarantee period applicable to your particular Contract is shown on theContract data pages. For certain insureds, generally those who are older and/or in a substandard risk classification,the Limited Death Benefit Guarantee period may be shorter in duration.
At the Contract date, and on each Monthly date, we calculate your Contract’s "Accumulated Net Payments" as of thatdate. Accumulated Net Payments equal the premiums you paid, accumulated at an effective annual rate of 4%, lesswithdrawals also accumulated at 4%.
At each Monthly date within the Limited Death Benefit Guarantee period, we will compare your Accumulated NetPayments to the Limited Death Benefit Guarantee Value as of that date. At each Monthly date after the Limited DeathBenefit Guarantee period, we will compare your Accumulated Net Payments to the Lifetime Death Benefit GuaranteeValue as of that date (not applicable in Massachusetts). If your Accumulated Net Payments equal or exceed theapplicable (Lifetime or Limited) Death Benefit Guarantee Value and Contract debt does not equal or exceed theContract Fund less any applicable surrender charges, then the Contract is kept in-force, regardless of the amount inthe Contract Fund.
The Contract data pages show Lifetime Death Benefit Guarantee Values and Limited Death Benefit Guarantee Valuesas of Contract anniversaries. Values for non-anniversary Monthly dates will reflect the number of months elapsedbetween Contract anniversaries.
Guideline and target premiums are premium levels that, if paid at the start of each Contract year, correspond to theLifetime and Limited Death Benefit Guarantee Values, respectively (assuming no withdrawals or loans). SeePremiums, page 19. They are one way of reaching the Death Benefit Guarantee Values; they are certainly not theonly way.
Here is a table of typical guideline and target premiums along with corresponding Limited Death Benefit Guaranteeperiods. The examples assume the insured is a male, non-smoker, with no extra risk or substandard ratings, and noextra benefit riders added to the Contract.

22
����� ��"������!�"��6788,888 (("������$����"�(���!�"!�
� ������"��%�����"�
�#����������������������
+"�%�(������!�"!���������%�� �����
������!�������������+"�������
-�("���
��� �����!�"!���������%�� �������!���%������������+"�������-�("����%�"!)����#������
"�������
35
35
45
45
55
55
Type A (fixed)
Type B (variable)
Type A (fixed)
Type B (variable)
Type A (fixed)
Type B (variable)
$
$
$
$
$
$
1,494
4,896
2,266
6,940
3,640
10,324
$
$
$
$
$
$
884 for 35 years**
884 for 33 years**
1,272 for 25 years**
1,272 for 23 years**
2,389 for 20 years**
2,389 for 18 years**
* not applicable in Massachusetts** for 5 years in Massachusetts
You should consider carefully the value of maintaining the Death Benefit Guarantee. If you desire the Death BenefitGuarantee for lifetime protection, you may prefer to pay generally higher premiums in all years, rather than trying tomake such payments on an as needed basis. For example, if you pay only enough premium to meet the Limited DeathBenefit Guarantee Values, a substantial amount may be required to meet the Lifetime Death Benefit Guarantee Valuesin order to continue the guarantee at the end of the Limited Death Benefit Guarantee period (not applicable inMassachusetts). In addition, it is possible that the payment required to continue the guarantee after the Limited DeathBenefit Guarantee period could cause the Contract to become a Modified Endowment Contract. See Tax Treatmentof Contract Benefits, page 31.
The Death Benefit Guarantee allows considerable flexibility as to the timing of premium payments. Your Pruco Liferepresentative can supply sample illustrations of various premium amount and frequency combinations that correspondto the Death Benefit Guarantee Values.
���������
You may, up to 12 times each Contract year, transfer amounts from one variable investment option to another variableinvestment option or to the fixed-rate option without charge. There is an administrative charge of up to $25 for eachtransfer made exceeding 12 in any Contract year. All or a portion of the amount credited to a variable investmentoption may be transferred.
Transfers will take effect as of the end of the valuation period in which a proper transfer request is received at a HomeOffice. The request may be in terms of dollars, such as a request to transfer $5,000 from one variable investmentoption to another, or may be in terms of a percentage reallocation among variable investment options. In the lattercase, as with premium reallocations, the percentages must be in whole numbers. You may transfer amounts by properwritten notice to a Home Office or by telephone, provided you are enrolled to use the Telephone Transfer System. Youwill automatically be enrolled to use the Telephone Transfer System unless the Contract is jointly owned or you electnot to have this privilege. Telephone transfers may not be available on Contracts that are assigned (see Assignment,page 34), depending on the terms of the assignment.
We will use reasonable procedures, such as asking you to provide certain personal information provided on yourapplication for insurance, to confirm that instructions given by telephone are genuine. We will not be held liable forfollowing telephone instructions that we reasonably believe to be genuine. Pruco Life cannot guarantee that you will beable to get through to complete a telephone transfer during peak periods such as periods of drastic economic ormarket change.
Only one transfer from the fixed-rate option will be permitted during each Contract year. The maximum amount whichmay be transferred out of the fixed-rate option each year is the greater of: (a) 25% of the amount in the fixed-rateoption; and (b) $2,000. Pruco Life may change these limits in the future. We may waive these restrictions for limitedperiods of time in a non-discriminatory way, (e.g., when interest rates are declining).

23
The Contract was not designed for professional market timing organizations, other organizations, or individuals usingprogrammed, large, or frequent transfers. A pattern of exchanges that coincides with a “market timing” strategy maybe disruptive to the investment option or to the disadvantage of other contract owners. If such a pattern were to befound, we may modify your right to make transfers by restricting the number, timing, and amount of transfers. We alsoreserve the right to prohibit transfer requests made by an individual acting under a power of attorney on behalf of morethan one contract owner.
��((�������$��� ��
As an administrative practice, we are currently offering a feature called Dollar Cost Averaging ("DCA"). Under thisfeature, either fixed dollar amounts or a percentage of the amount designated for use under the DCA option will betransferred periodically from the DCA Money Market investment option into other variable investment options availableunder the Contract, excluding the fixed-rate option. You may choose to have periodic transfers made monthly orquarterly. DCA transfers will not begin until the end of the “free-look” period.
Each automatic transfer will take effect as of the end of the valuation period on the date coinciding with the periodictiming you designate provided the New York Stock Exchange is open on that date. If the New York Stock Exchange isnot open on that date, or if the date does not occur in that particular month, the transfer will take effect as of the end ofthe valuation period which immediately follows that date. Automatic transfers will continue until: (1) $50 or lessremains of the amount designated for Dollar Cost Averaging, at which time the remaining amount will be transferred; or(2) you give us notification of a change in DCA allocation or cancellation of the feature. Currently, a transfer thatoccurs under the DCA feature is not counted towards the 12 free transfers permitted each Contract year. We reservethe right to change this practice, modify the requirements, or discontinue the feature.
�"��.��)�(�����
As an administrative practice, we are currently offering a feature called Auto-Rebalancing. This feature allows you toautomatically rebalance variable investment option assets at specified intervals based on percentage allocations thatyou choose. For example, suppose your initial investment allocation of variable investment options X and Y is split 40%and 60%, respectively. Then, due to investment results, that split changes. You may instruct that those assets berebalanced to your original or different allocation percentages.
Auto-Rebalancing can be performed on a quarterly, semi-annual, or annual basis. Each rebalance will take effect as ofthe end of the valuation period on the date coinciding with the periodic timing you designate, provided the New YorkStock Exchange is open on that date. If the New York Stock Exchange is not open on that date, or if the date does notoccur in that particular month, the transfer will take effect as of the end of the valuation period which immediatelyfollows that date. The fixed-rate option cannot participate in this administrative procedure. Currently, a transfer thatoccurs under the Auto-Rebalancing feature is not counted towards the 12 free transfers permitted each Contract year.We reserve the right to change this practice, modify the requirements, or discontinue the feature.
��9���������:������"����%��-�("�/�((-��#
You may surrender the Contract for its cash surrender value (referred to as net cash value in the Contract). TheContract's cash surrender value on any date will be the Contract Fund less any applicable surrender charges and lessany Contract debt. See Contract Loans, page 30. The Contract Fund value changes daily, reflecting: (1) increasesor decreases in the value of the variable investment options; (2) interest credited on any amounts allocated to thefixed-rate option; (3) interest credited on any loan; and (4) the daily asset charge for mortality and expense risksassessed against the variable investment options. The Contract Fund value also changes to reflect the receipt ofpremium payments and the monthly deductions described under Charges and Expenses, page 13. Upon request,Pruco Life will tell you the cash surrender value of your Contract. It is possible for the cash surrender value of aContract to decline to zero because of unfavorable investment performance or outstanding Contract debt.
The tables on pages T1 through T4 (M1 through M4 in Massachusetts) of this prospectus illustrate approximately whatthe cash surrender values would be for representative Contracts paying target premium amounts (see Premiums,page 19), assuming hypothetical uniform investment results in the Fund portfolios. Two of the tables assume currentcharges will be made throughout the lifetime of the Contract and two tables assume maximum charges will be made.See Illustrations of Cash Surrender Values, Death Benefits, and Accumulated Premiums, page 28.

24
��9��#���4��*�%5��������:�������������/�((-��#
As described earlier, there are two types of death benefit available under the Contract: Type A, a generally fixed deathbenefit and Type B, a variable death benefit. A Type B (variable) death benefit varies with investment performancewhile a Type A (fixed) death benefit does not, unless it must be increased to comply with the Internal Revenue Code’sdefinition of life insurance.
Under a Type A (fixed) Contract, the death benefit is generally equal to the basic insurance amount. See ContractLoans, page 30. If the Contract is kept in-force for several years, depending on how much premium you pay, and/or ifinvestment performance is reasonably favorable, the Contract Fund may grow to the point where Pruco Life willincrease the death benefit in order to ensure that the Contract will satisfy the Internal Revenue Code’s definition of lifeinsurance.
The death benefit under a Type A (fixed) Contract will always be the greater of:
(1) the basic insurance amount; and
(2) the Contract Fund before the deduction of any monthly charges due on that date, multiplied bythe attained age factor that applies.
A listing of attained age factors can be found on your Contract data pages. The latter provision ensures that theContract will always have a death benefit large enough so that the Contract will be treated as life insurance for taxpurposes under current law.
The following table illustrates at different ages how the attained age factor affects the death benefit for differentContract Fund amounts. The table assumes a $100,000 Type A (fixed) Contract was issued when the insured was amale nonsmoker, age 35, and there is no contract debt.
�� ������������������������ ����
������"��%��
� �
��%������������"�%��
����������%� �������
��
������������"�%!"(���(��%)#���
�������%� ���������
��%��������
���������
40
40
40
$ 10,000
$ 30,000
$ 50,000
3.64
3.64
3.64
$ 36,400
$ 109,200
$ 182,000
$ 100,000
$ 109,200*
$ 182,000*
60
60
60
$ 30,000
$ 50,000
$ 70,000
1.96
1.96
1.96
$ 58,800
$ 98,000
$ 137,200
$ 100,000
$ 100,000
$ 137,200*
80
80
80
$ 50,000
$ 80,000
$ 90,000
1.28
1.28
1.28
$ 64,000
$ 102,400
$ 115,200
$ 100,000
$ 102,400*
$ 115,200*
* Note that the death benefit has been increased to comply with the Internal Revenue Code’s definition of life insurance.
This means, for example, that if the insured has reached the age of 60, and the Contract Fund is $70,000, the deathbenefit will be $137,200, even though the original basic insurance amount was $100,000. In this situation, for every $1increase in the Contract Fund, the death benefit will be increased by $1.96. We reserve the right to refuse to acceptany premium payment that increases the death benefit by more than it increases the Contract Fund. If we exercisethis right, it may in certain situations result in the loss of the death benefit guarantee.
��9��#���4-����)(�5��������:�������������/�((-��#
Under a Type B (variable) Contract, while the Contract is in-force, the death benefit will never be less than the basicinsurance amount, but will also vary, immediately after it is issued, with the investment results of the selected

25
investment options. The death benefit may be further increased to ensure that the Contract will satisfy the InternalRevenue Code’s definition of life insurance.
The death benefit under a Type B (variable) Contract will always be the greater of:
(1) the basic insurance amount plus the Contract Fund before the deduction of any monthlycharges due on that date; and
(2) the Contract Fund before the deduction of any monthly charges due on that date, multiplied bythe attained age factor that applies.
For purposes of computing the death benefit, if the Contract Fund is less than zero we will consider it to be zero. Alisting of attained age factors can be found on your Contract data pages. The latter provision ensures that the Contractwill always have a death benefit large enough so that the Contract will be treated as life insurance for tax purposesunder current law.
The following table illustrates various attained age factors and Contract Funds and the corresponding death benefits.The table assumes a $100,000 Type B (variable) Contract was issued when the insured was a male nonsmoker, age35, and there is no contract debt.
�� ��������������������������� ����
������"��%��
� �
��%������������"�%��
����������%� �������
��
������������"�%!"(���(��%)#���
�������%� ���������
��%��������
���������
404040
$ 10,000
$ 30,000
$ 50,000
3.64
3.64
3.64
$ 36,400
$ 109,200
$ 182,000
$ 110,000
$ 130,000
$ 182,000*
606060
$ 30,000
$ 50,000
$ 70,000
1.96
1.96
1.96
$ 58,800
$ 98,800
$ 137,200
$ 130,000
$ 150,000
$ 170,000
808080
$ 50,000
$ 80,000
$ 90,000
1.28
1.28
1.28
$ 64,000
$ 102,400
$ 115,200
$ 150,000
$ 180,000
$ 190,000
* Note that the death benefit has been increased to comply with the Internal Revenue Code’s definition of life insurance.
This means, for example, that if the insured has reached the age of 40, and the Contract Fund is $50,000, the deathbenefit will be $182,000, even though the original basic insurance amount was $100,000. In this situation, for every $1increase in the Contract Fund, the death benefit will be increased by $3.64. We reserve the right to refuse to acceptany premium payment that increases the death benefit by more than it increases the Contract Fund. If we exercisethis right, it may in certain situations result in the loss of the death benefit guarantee.
�"����%�������������
A Contract may be surrendered for its cash surrender value while the insured is living. To surrender a Contract, wemay require you to deliver or mail the Contract with a written request in a form that meets Pruco Life’s needs, to aHome Office. The cash surrender value of a surrendered Contract will be determined as of the end of the valuationperiod in which such a request is received in a Home Office. Surrender of a Contract may have tax consequences.See Tax Treatment of Contract Benefits, page 31.
/���%��9�(�
Under certain circumstances, you may withdraw a portion of the Contract's cash surrender value without surrenderingthe Contract. The withdrawal amount is limited by the requirement that the cash surrender value after the withdrawalmay not be zero or less than zero after deducting the withdrawal charges. The amount withdrawn must be at least$500. There is an administrative processing fee for each withdrawal which is the lesser of: (a) $25 and; (b) 2% of the

26
withdrawal amount. An amount withdrawn may not be repaid except as a premium subject to the applicable charges.Upon request, we will tell you how much you may withdraw. Withdrawal of the cash surrender value may have taxconsequences. See Tax Treatment of Contract Benefits, page 31.
Whenever a withdrawal is made, the death benefit will immediately be reduced by at least the amount of thewithdrawal. For a Type B (variable) Contract, this will not change the basic insurance amount. However, under a TypeA (fixed) Contract, the resulting reduction in death benefit usually requires a reduction in the basic insurance amount. If the basic insurance amount is decreased to an amount less than the basic insurance amount at issue, a surrendercharge may be deducted. See Charges and Expenses, page 13. No withdrawal will be permitted under a Type A(fixed) Contract if it would result in a basic insurance amount of less than the minimum basic insurance amount. It isimportant to note, however, that if the basic insurance amount is decreased, there is a possibility that the Contractmight be classified as a Modified Endowment Contract. See Tax Treatment of Contract Benefits, page 31. Beforemaking any withdrawal which causes a decrease in basic insurance amount, you should consult with your tax adviserand your Pruco Life representative.
When a withdrawal is made, the Contract Fund is reduced by the sum of the cash withdrawn and the withdrawal fee.An amount equal to the reduction in the Contract Fund will be withdrawn proportionally from the investment optionsunless you direct otherwise.
Withdrawal of the cash surrender value increases the risk that the Contract Fund may be insufficient to provideContract benefits. If such a withdrawal is followed by unfavorable investment experience, the Contract may go intodefault. Withdrawals may also affect whether a Contract is kept in-force under the Death Benefit Guarantee, sincewithdrawals decrease the accumulated net payments. See Death Benefit Guarantee, page 21.
��������������� ��"������!�"��
Subject to state approval and subject to the underwriting requirements determined by Pruco Life, on or after the firstContract anniversary, you may increase the amount of insurance by increasing the basic insurance amount of theContract. The following conditions must be met:
(1) you must ask for the change in a form that meets Pruco Life’s needs;(2) the amount of the increase must be at least equal to the minimum increase in basic insurance amount shown
under Contract Limitations in your Contract data pages;(3) you must prove to us that the insured is insurable for any increase;(4) the Contract must not be in default;(5) we must not be paying premiums into the Contract as a result of the insured’s total disability; and(6) if we ask you to do so, you must send us the Contract to be endorsed.
If we approve the change, we will send you new Contract data pages showing the amount and effective date of thechange and the recomputed charges, values and limitations. If the insured is not living on the effective date, thechange will not take effect. No administrative processing charge is currently being made in connection with anincrease in basic insurance amount. We reserve the right to make such a charge in an amount of up to $25.
For sales load purposes, the target premium is calculated separately for each basic insurance amount segment. Thetarget premium for each segment also includes the premium for extra insurance charges associated to that segment.When premiums are paid, each payment is allocated to each basic insurance amount segment based on the proportionof the target premium in each segment to the total target premiums of all segments. Currently, the sales load chargefor each segment is equal to 4% of the allocated premium paid in each Contract year up to the target premium and 0%of allocated premiums paid in excess of the target premium. See the definition of Contract year for an increase inbasic insurance amount in DEFINITIONS OF SPECIAL TERMS USED IN THIS PROSPECTUS, page 1.
The COI rates for an increase in basic insurance amount are based upon 1980 CSO Tables, the age at the increaseeffective date and the number of years since then, sex (except where unisex rates apply); smoker/nonsmoker status,and extra rating class, if any. The net amount at risk for the whole contract (the death benefit minus the ContractFund) is allocated to each basic insurance amount segment based on the proportion of its basic insurance amount tothe total of all basic insurance amount segments. In addition, the attained age factor for a Contract with an increase inbasic insurance amount is based on the Insured’s attained age for the initial basic insurance amount segment. For a

27
description of attained age factor, see How a Type A (Fixed) Contract’s Death Benefit Will Vary, page 24 and Howa Type B (Variable) Contract’s Death Benefit Will Vary, page 24.
Each Contract owner who elects to increase the basic insurance amount of his or her Contract will receive a "free-look"right which will apply only to the increase in basic insurance amount, not the entire Contract. This right is comparableto the right afforded to a purchaser of a new Contract except that, any cost of insurance charge for the increase in thebasic insurance amount will be returned to the Contract Fund instead of a refund of premium. See Short-TermCancellation Right or "Free-Look", page 18. Generally, the "free-look" right would have to be exercised no laterthan 10 days after receipt of the Contract as increased.
An increase in basic insurance amount may cause the Contract to be classified as a Modified Endowment Contract.See Tax Treatment of Contract Benefits, page 31. Therefore, before increasing the basic insurance amount, youshould consult with your tax adviser and your Pruco Life representative.
���������������� ��"������!�"��
As explained earlier, you may make a withdrawal (see Withdrawals, page 25). On or after the first Contractanniversary, you also have the option of decreasing the basic insurance amount of your Contract without withdrawingany cash surrender value. Contract owners who conclude that, because of changed circumstances, the amount ofinsurance is greater than needed will be able to decrease their amount of insurance protection, and the monthlydeductions for the cost of insurance. The amount of the decrease must be at least equal to the minimum decrease inbasic insurance amount shown under Contract Limitations in your Contract data pages. In addition, the basicinsurance amount after the decrease must be at least equal to the minimum basic insurance amount shown underContract Limitations in your Contract data pages. If the basic insurance amount is decreased to an amount less thanthe lowest basic insurance amount since issue, a surrender charge may be deducted. No administrative processingcharge is currently being made in connection with a decrease in basic insurance amount. We reserve the right to makesuch a charge in an amount of up to $25. See Charges and Expenses, page 13. If we ask you to, you must send usyour Contract to be endorsed. The Contract will be amended to show the new basic insurance amount, charges,values in the appropriate tables and the effective date of the decrease.
We may decline a reduction if we determine it would cause the Contract to fail to qualify as "life insurance" forpurposes of Section 7702 of the Internal Revenue Code. A decrease will not take effect if the insured is not living onthe effective date.
It is important to note, however, that if the basic insurance amount is decreased, there is a possibility that the Contractmight be classified as a Modified Endowment Contract. See Tax Treatment of Contract Benefits, page 31. Beforerequesting any decrease in basic insurance amount, you should consult with your tax adviser and your Pruco Liferepresentative.
/���������%�������%
Pruco Life will generally pay any death benefit, cash surrender value, loan proceeds or withdrawal within seven daysafter all the documents required for such a payment are received at a Home Office. Other than the death benefit,which is determined as of the date of death, the amount will be determined as of the end of the valuation period inwhich the necessary documents are received at a Home Office. However, Pruco Life may delay payment of proceedsfrom the variable investment option[s] and the variable portion of the death benefit due under the Contract if thedisposal or valuation of the Account’s assets is not reasonably practicable because the New York Stock Exchange isclosed for other than a regular holiday or weekend, trading is restricted by the SEC, or the SEC declares that anemergency exists.
With respect to the amount of any cash surrender value allocated to the fixed-rate option, Pruco Life expects to pay thecash surrender value promptly upon request. However, Pruco Life has the right to delay payment of such cashsurrender value for up to six months (or a shorter period if required by applicable law). Pruco Life will pay interest of atleast 3% a year if it delays such a payment for 30 days or more (or a shorter period if required by applicable law).

28
��$�� ��%��������
The Living Needs Benefit� is available on your Contract. The benefit may vary by state. There is no charge foradding the benefit to a Contract. However, an administrative charge (not to exceed $150) will be made at the time theLiving Needs Benefit is paid.
Subject to state regulatory approval, the Living Needs Benefit allows you to elect to receive an accelerated paymentof all or part of the Contract’s death benefit, adjusted to reflect current value, at a time when certain special needsexist. The adjusted death benefit will always be less than the death benefit, but will generally be greater than theContract’s cash surrender value. One or both of the following options may be available. A Pruco Life representativeshould be consulted as to whether additional options may be available.
Terminal Illness Option. This option is available if the insured is diagnosed as terminally ill with a life expectancy ofsix months or less. When satisfactory evidence is provided, Pruco Life will provide an accelerated payment of theportion of the death benefit selected by the Contract owner as a Living Needs Benefit. The Contract owner may (1)elect to receive the benefit in a single sum or (2) receive equal monthly payments for six months. If the insured diesbefore all the payments have been made, the present value of the remaining payments will be paid to the beneficiarydesignated in the Living Needs Benefit claim form in a single sum.
Nursing Home Option. This option is available after the insured has been confined to an eligible nursing home forsix months or more. When satisfactory evidence is provided, including certification by a licensed physician, that theinsured is expected to remain in the nursing home until death, Pruco Life will provide an accelerated payment of theportion of the death benefit selected by the Contract owner as a Living Needs Benefit. The Contract owner may(1) elect to receive the benefit in a single sum or (2) receive equal monthly payments for a specified number of years(not more than 10 nor less than 2), depending upon the age of the insured. If the insured dies before all of thepayments have been made, the present value of the remaining payments will be paid to the beneficiary designated inthe Living Needs Benefit claim form in a single sum.
Subject to state approval, all or part of the Contract’s death benefit may be accelerated under the Living NeedsBenefit. If the benefit is only partially accelerated, a death benefit of at least $25,000 must remain under the Contract.Pruco Life reserves the right to determine the minimum amount that may be accelerated.
No benefit will be payable if you are required to elect it in order to meet the claims of creditors or to obtain agovernment benefit. Pruco Life can furnish details about the amount of Living Needs Benefit that is available to aneligible Contract owner, and the effect on the Contract if less than the entire death benefit is accelerated.
You should consider whether adding this settlement option is appropriate in your given situation. Adding the LivingNeeds Benefit to the Contract has no adverse consequences; however, electing to use it could. With the exception ofcertain business-related Contracts, the Living Needs Benefit is excluded from income if the insured is terminally ill orchronically ill as defined in the tax law (although the exclusion in the latter case may be limited). You should consult aqualified tax adviser before electing to receive this benefit. Receipt of a Living Needs Benefit payment may alsoaffect your eligibility for certain government benefits or entitlements.
(("����������������"����%��-�("��,�������������,��%���"!"(���%���!�"!�
The following six tables (pages T1 through T6; M1 through M6 in Massachusetts) show how a Contract’s death benefitand cash surrender values change with the investment experience of the Account. They are "hypothetical" becausethey are based, in part, upon several assumptions, which are described below. All six tables assume the following:
• a Contract with a basic insurance amount of $100,000 bought by a 35 year old male, select, non-smoker, with noextra risks or substandard ratings, and no extra benefit riders added to the Contract.
• the target premium amount (see Premiums, page 19) is paid on each Contract anniversary and no loans aretaken.
• the Contract Fund has been invested in equal amounts in each of the 35 portfolios of the Funds and no portion ofthe Contract Fund has been allocated to the fixed-rate option.

29
The first table (page T1; M1 in Massachusetts) assumes a Type A (fixed) Contract has been purchased and thesecond table (page T2; M2 in Massachusetts) assumes a Type B (variable) Contract has been purchased. Bothassume the current charges will continue for the indefinite future. The third and fourth tables (pages T3 and T4; M3and M4 in Massachusetts) are based upon the same assumptions except it is assumed the maximum contractualcharges have been made from the beginning. See Charges and Expenses, page 13.
Under the Type B (variable) Contract the death benefit changes to reflect investment returns. Under the Type A (fixed)Contract, the death benefit increases only if the Contract Fund becomes large enough that an increase in the deathbenefit is necessary for the Contract to satisfy the Internal Revenue Code’s definition of life insurance. See Types ofDeath Benefit, page 18.
Finally, there are four assumptions, shown separately, about the average investment performance of the portfolios.The first is that there will be a uniform 0% gross rate of return with the average value of the Contract Fund uniformlyadversely affected by very unfavorable investment performance. The other three assumptions are that investmentperformance will be at a uniform gross annual rate of 4%, 8% and 12%. Actual returns will fluctuate from year to year.In addition, death benefits and cash surrender values would be different from those shown if investment returnsaveraged 0%, 4%, 8% and 12% but fluctuated from those averages throughout the years. Nevertheless, theseassumptions help show how the Contract values will change with investment experience.
The first column in the following illustrations (pages T1 through T4; M1 through M4 in Massachusetts) shows theContract year. The second column, to provide context, shows what the aggregate amount would be if the premiumshad been invested to earn interest, after taxes, at 4% compounded annually. The next four columns show the deathbenefit payable in each of the years shown for the four different assumed investment returns. The last four columnsshow the cash surrender value payable in each of the years shown for the four different assumed investment returns.The cash surrender values in the first 10 years reflect the surrender charges that would be deducted if the Contractwere surrendered in those years.
A gross return (as well as the net return) is shown at the top of each column. The gross return represents thecombined effect of investment income and capital gains and losses, realized or unrealized, of the portfolios before anyreduction is made for investment advisory fees or other Fund expenses. The net return reflects average total annualexpenses of the 35 portfolios of 0.85%, and the daily deduction from the Contract Fund of 0.60% per year for thetables based on current charges and 0.90% per year for the tables based on maximum charges. Thus, assumingcurrent charges, gross returns of 0%, 4%, 8% and 12% are the equivalent of net returns of -1.45%, 2.55%, 6.55% and10.55%, respectively. Assuming maximum charges, gross returns of 0%, 4%, 8% and 12% are the equivalent of netreturns of -1.75%, 2.25%, 6.25% and 10.25%, respectively. The actual fees and expenses of the portfolios associatedwith a particular Contract may be more or less than 0.85% and will depend on which variable investment options areselected. The death benefits and cash surrender values shown reflect the deduction of all expenses and charges bothfrom the Funds and under the Contract.
If you are considering the purchase of a variable life insurance contract from another insurance company, you shouldnot rely upon these tables for comparison purposes. A comparison between two tables, each showing values for a 35year old man, may be useful for a 35 year old man but would be inaccurate if made for insureds of other ages, sex, orrating class. Your Pruco Life representative can provide you with a hypothetical illustration for your own age, sex, andrating class.

VARIABLE UNIVERSAL LIFETYPE A (FIXED) DEATH BENEFITMALE NON-SMOKER SELECT AGE 35
$100,000.00 BASIC INSURANCE AMOUNT$884.00 ANNUAL PREMIUM PAYMENT
USING CURRENT CONTRACTUAL CHARGES
Death Benefit (1) Cash Surrender Value (1)--------------------------------------------------------- ---------------------------------------------------------
Assuming Hypothetical Gross (and Net) Assuming Hypothetical Gross (and Net)Premiums Annual Investment Return of Annual Investment Return of
End of Accumulated --------------------------------------------------------- ---------------------------------------------------------Policy at 4% 0% Gross 4% Gross 8% Gross 12% Gross 0% Gross 4% Gross 8% Gross 12% GrossYear Per Year (-1.45 Net) (2.55 Net) (6.55 Net) (10.55% Net) (-1.45 Net) (2.55 Net) (6.55 Net) (10.55% Net)------ ----------- ----------- ----------- ----------- ------------ ----------- ----------- ----------- ------------
1 $ 919 $100,000 $100,000 $100,000 $ 100,000 $ 0 $ 0 $ 0(2) $ 0(2)2 $ 1,875 $100,000 $100,000 $100,000 $ 100,000 $ 267 $ 337 $ 409 $ 4843 $ 2,870 $100,000 $100,000 $100,000 $ 100,000 $ 816 $ 956 $ 1,103 $ 1,2594 $ 3,904 $100,000 $100,000 $100,000 $ 100,000 $ 1,354 $ 1,587 $ 1,839 $ 2,1125 $ 4,980 $100,000 $100,000 $100,000 $ 100,000 $ 1,881 $ 2,231 $ 2,620 $ 3,0536 $ 6,098 $100,000 $100,000 $100,000 $ 100,000 $ 2,395 $ 2,886 $ 3,447 $ 4,0887 $ 7,261 $100,000 $100,000 $100,000 $ 100,000 $ 3,078 $ 3,734 $ 4,505 $ 5,4098 $ 8,471 $100,000 $100,000 $100,000 $ 100,000 $ 3,745 $ 4,592 $ 5,613 $ 6,8449 $ 9,729 $100,000 $100,000 $100,000 $ 100,000 $ 4,397 $ 5,458 $ 6,774 $ 8,40410 $ 11,038 $100,000 $100,000 $100,000 $ 100,000 $ 5,031 $ 6,331 $ 7,989 $ 10,09915 $ 18,409 $100,000 $100,000 $100,000 $ 100,000 $ 6,985 $ 9,850 $ 14,059 $ 20,25120 $ 27,377 $100,000 $100,000 $100,000 $ 100,000 $ 8,617 $13,669 $ 22,267 $ 36,99425 $ 38,288 $100,000 $100,000 $100,000 $ 129,917 $ 9,805 $17,717 $ 33,398 $ 64,63630 $ 51,562 $100,000 $100,000 $100,000 $ 191,259 $ 9,719 $21,213 $ 48,025 $ 108,67035 $ 67,713 $100,000 $100,000 $106,349 $ 279,982 $ 7,802 $23,609 $ 67,739 $ 178,33240 $ 87,363 $100,000 $100,000 $131,593 $ 404,080 $ 1,961 $22,990 $ 93,328 $ 286,58245 $111,270 $ 0(2) $100,000 $163,160 $ 588,043 $ 0(2) $16,028 $125,508 $ 452,34150 $140,356 $ 0 $ 0(2) $201,904 $ 858,208 $ 0 $ 0(2) $165,495 $ 703,44955 $175,744 $ 0 $ 0 $248,424 $1,250,021 $ 0 $ 0 $214,158 $1,077,60560 $218,799 $ 0 $ 0 $303,246 $1,811,589 $ 0 $ 0 $273,194 $1,632,06265 $271,182 $ 0 $ 0 $372,776 $2,650,318 $ 0 $ 0 $355,025 $2,524,112
(1) Assumes no Contract loan has been made.(2) Based on a gross return of 0% the cash surrender value would go to zero in year 1 and in year 42 and later. Because the Target Premium is being paid,
the Contract is kept inforce through the Limited Death Benefit Guarantee Period of 35 years. The contract would be in default at the beginning of year42. Based on a gross return of 4% the cash surrender value would go to zero in year 1 and in year 50 and later. Because the Target Premium is beingpaid, the Contract is kept inforce through the Limited Death Benefit Guarantee Period of 35 years. The contract would be in default at the beginningof year 50. Based on a gross return of 8% the cash surrender value would go to zero in year 1. Because the Target Premium is being paid, the Contractis kept inforce through the Limited Death Benefit Guarantee Period of 35 years. Based on a gross return of 12% the cash surrender value would go tozero in year 1. Because the Target Premium is being paid, the Contract is kept inforce through the Limited Death Benefit Guarantee Period of 35 years.
The hypothetical investment rates of return shown above and elsewhere in this prospectus are illustrative only and should not be deemed a representation ofpast or future investment rates of return. Actual rates of return may be more or less than those shown and will depend on a number of factors including theinvestment allocations made by an owner, prevailing interest rates, and rate of inflation. The Death Benefit and Cash Surrender Value for a contract wouldbe different from those shown if the actual rates of return average 0%, 4%, 8%, and 12% over a period of years but also fluctuated above or below thoseaverages for individual contract years. No representations can be made by Prudential or the funds that these hypothetical rates of return can be achievedfor any one year or sustained over any period of time.
T1
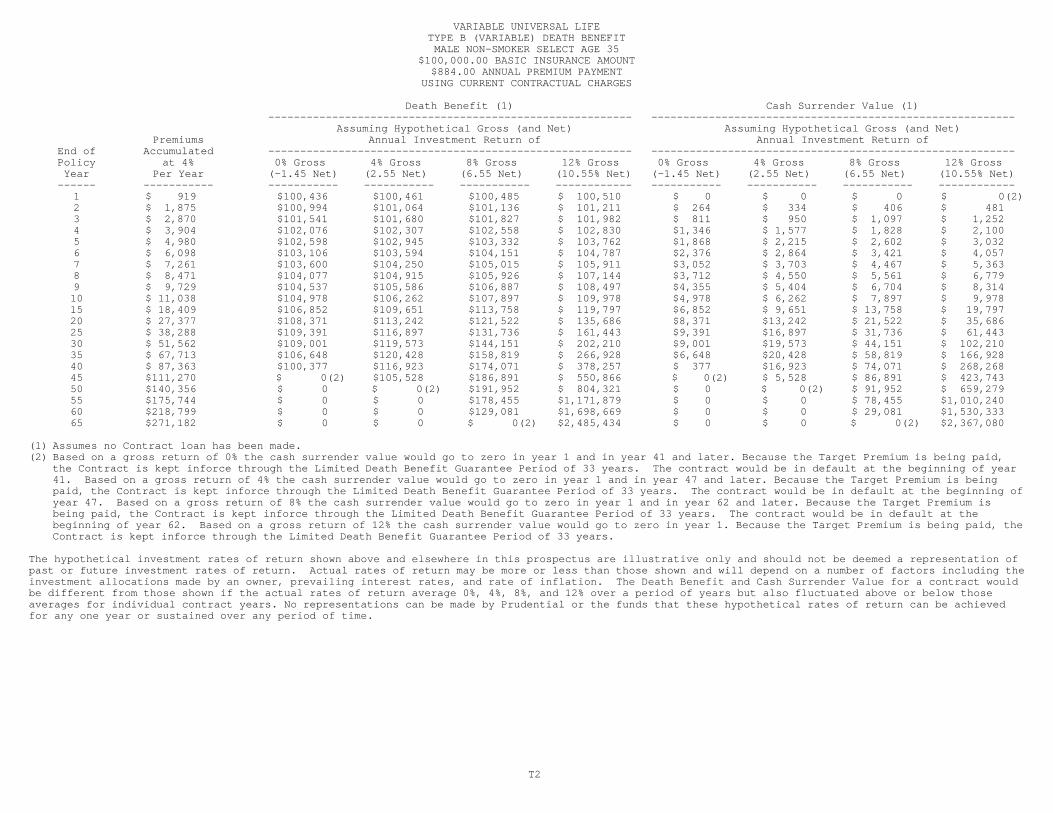
VARIABLE UNIVERSAL LIFETYPE B (VARIABLE) DEATH BENEFITMALE NON-SMOKER SELECT AGE 35
$100,000.00 BASIC INSURANCE AMOUNT$884.00 ANNUAL PREMIUM PAYMENT
USING CURRENT CONTRACTUAL CHARGES
Death Benefit (1) Cash Surrender Value (1)--------------------------------------------------------- ---------------------------------------------------------
Assuming Hypothetical Gross (and Net) Assuming Hypothetical Gross (and Net)Premiums Annual Investment Return of Annual Investment Return of
End of Accumulated --------------------------------------------------------- ---------------------------------------------------------Policy at 4% 0% Gross 4% Gross 8% Gross 12% Gross 0% Gross 4% Gross 8% Gross 12% GrossYear Per Year (-1.45 Net) (2.55 Net) (6.55 Net) (10.55% Net) (-1.45 Net) (2.55 Net) (6.55 Net) (10.55% Net)------ ----------- ----------- ----------- ----------- ------------ ----------- ----------- ----------- ------------
1 $ 919 $100,436 $100,461 $100,485 $ 100,510 $ 0 $ 0 $ 0 $ 0(2)2 $ 1,875 $100,994 $101,064 $101,136 $ 101,211 $ 264 $ 334 $ 406 $ 4813 $ 2,870 $101,541 $101,680 $101,827 $ 101,982 $ 811 $ 950 $ 1,097 $ 1,2524 $ 3,904 $102,076 $102,307 $102,558 $ 102,830 $1,346 $ 1,577 $ 1,828 $ 2,1005 $ 4,980 $102,598 $102,945 $103,332 $ 103,762 $1,868 $ 2,215 $ 2,602 $ 3,0326 $ 6,098 $103,106 $103,594 $104,151 $ 104,787 $2,376 $ 2,864 $ 3,421 $ 4,0577 $ 7,261 $103,600 $104,250 $105,015 $ 105,911 $3,052 $ 3,703 $ 4,467 $ 5,3638 $ 8,471 $104,077 $104,915 $105,926 $ 107,144 $3,712 $ 4,550 $ 5,561 $ 6,7799 $ 9,729 $104,537 $105,586 $106,887 $ 108,497 $4,355 $ 5,404 $ 6,704 $ 8,31410 $ 11,038 $104,978 $106,262 $107,897 $ 109,978 $4,978 $ 6,262 $ 7,897 $ 9,97815 $ 18,409 $106,852 $109,651 $113,758 $ 119,797 $6,852 $ 9,651 $ 13,758 $ 19,79720 $ 27,377 $108,371 $113,242 $121,522 $ 135,686 $8,371 $13,242 $ 21,522 $ 35,68625 $ 38,288 $109,391 $116,897 $131,736 $ 161,443 $9,391 $16,897 $ 31,736 $ 61,44330 $ 51,562 $109,001 $119,573 $144,151 $ 202,210 $9,001 $19,573 $ 44,151 $ 102,21035 $ 67,713 $106,648 $120,428 $158,819 $ 266,928 $6,648 $20,428 $ 58,819 $ 166,92840 $ 87,363 $100,377 $116,923 $174,071 $ 378,257 $ 377 $16,923 $ 74,071 $ 268,26845 $111,270 $ 0(2) $105,528 $186,891 $ 550,866 $ 0(2) $ 5,528 $ 86,891 $ 423,74350 $140,356 $ 0 $ 0(2) $191,952 $ 804,321 $ 0 $ 0(2) $ 91,952 $ 659,27955 $175,744 $ 0 $ 0 $178,455 $1,171,879 $ 0 $ 0 $ 78,455 $1,010,24060 $218,799 $ 0 $ 0 $129,081 $1,698,669 $ 0 $ 0 $ 29,081 $1,530,33365 $271,182 $ 0 $ 0 $ 0(2) $2,485,434 $ 0 $ 0 $ 0(2) $2,367,080
(1) Assumes no Contract loan has been made.(2) Based on a gross return of 0% the cash surrender value would go to zero in year 1 and in year 41 and later. Because the Target Premium is being paid,
the Contract is kept inforce through the Limited Death Benefit Guarantee Period of 33 years. The contract would be in default at the beginning of year41. Based on a gross return of 4% the cash surrender value would go to zero in year 1 and in year 47 and later. Because the Target Premium is beingpaid, the Contract is kept inforce through the Limited Death Benefit Guarantee Period of 33 years. The contract would be in default at the beginning ofyear 47. Based on a gross return of 8% the cash surrender value would go to zero in year 1 and in year 62 and later. Because the Target Premium isbeing paid, the Contract is kept inforce through the Limited Death Benefit Guarantee Period of 33 years. The contract would be in default at thebeginning of year 62. Based on a gross return of 12% the cash surrender value would go to zero in year 1. Because the Target Premium is being paid, theContract is kept inforce through the Limited Death Benefit Guarantee Period of 33 years.
The hypothetical investment rates of return shown above and elsewhere in this prospectus are illustrative only and should not be deemed a representation ofpast or future investment rates of return. Actual rates of return may be more or less than those shown and will depend on a number of factors including theinvestment allocations made by an owner, prevailing interest rates, and rate of inflation. The Death Benefit and Cash Surrender Value for a contract wouldbe different from those shown if the actual rates of return average 0%, 4%, 8%, and 12% over a period of years but also fluctuated above or below thoseaverages for individual contract years. No representations can be made by Prudential or the funds that these hypothetical rates of return can be achievedfor any one year or sustained over any period of time.
T2

VARIABLE UNIVERSAL LIFETYPE A (FIXED) DEATH BENEFITMALE NON-SMOKER SELECT AGE 35
$100,000.00 BASIC INSURANCE AMOUNT$884.00 ANNUAL PREMIUM PAYMENT
USING MAXIMUM CONTRACTUAL CHARGES
Death Benefit (1) Cash Surrender Value (1)--------------------------------------------------------- ---------------------------------------------------------
Assuming Hypothetical Gross (and Net) Assuming Hypothetical Gross (and Net)Premiums Annual Investment Return of Annual Investment Return of
End of Accumulated --------------------------------------------------------- ---------------------------------------------------------Policy at 4% 0% Gross 4% Gross 8% Gross 12% Gross 0% Gross 4% Gross 8% Gross 12% GrossYear Per Year (-1.75 Net) (2.25 Net) (6.25 Net) (10.25% Net) (-1.75 Net) (2.25 Net) (6.25 Net) (10.25% Net)------ ----------- ----------- ----------- ----------- ------------ ----------- ----------- ----------- ------------
1 $ 919 $100,000 $100,000 $100,000 $100,000 $ 0 $ 0 $ 0 $ 0(2)2 $ 1,875 $100,000 $100,000 $100,000 $100,000 $ 96 $ 160 $ 225 $ 2923 $ 2,870 $100,000 $100,000 $100,000 $100,000 $ 519 $ 641 $ 770 $ 9074 $ 3,904 $100,000 $100,000 $100,000 $100,000 $ 923 $1,122 $ 1,338 $ 1,5735 $ 4,980 $100,000 $100,000 $100,000 $100,000 $1,307 $1,600 $ 1,928 $ 2,2956 $ 6,098 $100,000 $100,000 $100,000 $100,000 $1,668 $2,074 $ 2,540 $ 3,0757 $ 7,261 $100,000 $100,000 $100,000 $100,000 $2,189 $2,724 $ 3,356 $ 4,1018 $ 8,471 $100,000 $100,000 $100,000 $100,000 $2,688 $3,368 $ 4,194 $ 5,1979 $ 9,729 $100,000 $100,000 $100,000 $100,000 $3,161 $4,003 $ 5,056 $ 6,36910 $ 11,038 $100,000 $100,000 $100,000 $100,000 $3,608 $4,627 $ 5,939 $ 7,62415 $ 18,409 $100,000 $100,000 $100,000 $100,000 $4,475 $6,590 $ 9,755 $ 14,48920 $ 27,377 $100,000 $100,000 $100,000 $100,000 $4,292 $7,773 $13,930 $ 24,79825 $ 38,288 $100,000 $100,000 $100,000 $100,000 $2,333 $7,261 $17,886 $ 40,45630 $ 51,562 $100,000 $100,000 $100,000 $114,450 $ 0 $3,412 $20,480 $ 65,02835 $ 67,713 $100,000 $100,000 $100,000 $159,024 $ 0 $ 0 $19,078 $101,28940 $ 87,363 $ 0(2) $ 0(2) $100,000 $215,272 $ 0(2) $ 0(2) $ 7,383 $152,67545 $111,270 $ 0 $ 0 $ 0(2) $290,121 $ 0 $ 0 $ 0(2) $223,17050 $140,356 $ 0 $ 0 $ 0 $388,601 $ 0 $ 0 $ 0 $318,52555 $175,744 $ 0 $ 0 $ 0 $516,449 $ 0 $ 0 $ 0 $445,21560 $218,799 $ 0 $ 0 $ 0 $686,710 $ 0 $ 0 $ 0 $618,65865 $271,182 $ 0 $ 0 $ 0 $878,058 $ 0 $ 0 $ 0 $836,246
(1) Assumes no Contract loan has been made.(2) Based on a gross return of 0% the cash surrender value would go to zero in year 1 and in year 28 and later, but because the Target Premium is being
paid, the Contract is kept inforce through the Limited Death Benefit Guarantee Period of 35 years. The contract would be in default at the beginning ofyear 36. Based on a gross return of 4% the cash surrender value would go to zero in year 1 and in year 33 and later, but because the Target Premium isbeing paid, the Contract is kept inforce through the Limited Death Benefit Guarantee Period of 35 years. The contract would be in default at thebeginning of year 36. Based on a gross return of 8% the cash surrender value would go to zero in year 1 and in year 42 and later. Because the TargetPremium is being paid, the Contract is kept inforce through the Limited Death Benefit Guarantee Period of 35 years. The contract would be in defaultat the beginning of year 42. Based on a gross return of 12% the cash surrender value would go to zero in year 1. Because the Target Premium is beingpaid, the Contract is kept inforce through the Limited Death Benefit Guarantee Period of 35 years.
The hypothetical investment rates of return shown above and elsewhere in this prospectus are illustrative only and should not be deemed a representation ofpast or future investment rates of return. Actual rates of return may be more or less than those shown and will depend on a number of factors including theinvestment allocations made by an owner, prevailing interest rates, and rate of inflation. The Death Benefit and Cash Surrender Value for a contract wouldbe different from those shown if the actual rates of return average 0%, 4%, 8%, and 12% over a period of years but also fluctuated above or below thoseaverages for individual contract years. No representations can be made by Prudential or the funds that these hypothetical rates of return can be achievedfor any one year or sustained over any period of time.
T3

VARIABLE UNIVERSAL LIFETYPE B (VARIABLE) DEATH BENEFITMALE NON-SMOKER SELECT AGE 35
$100,000.00 BASIC INSURANCE AMOUNT$884.00 ANNUAL PREMIUM PAYMENT
USING MAXIMUM CONTRACTUAL CHARGES
Death Benefit (1) Cash Surrender Value (1)--------------------------------------------------------- ---------------------------------------------------------
Assuming Hypothetical Gross (and Net) Assuming Hypothetical Gross (and Net)Premiums Annual Investment Return of Annual Investment Return of
End of Accumulated --------------------------------------------------------- ---------------------------------------------------------Policy at 4% 0% Gross 4% Gross 8% Gross 12% Gross 0% Gross 4% Gross 8% Gross 12% GrossYear Per Year (-1.75 Net) (2.25 Net) (6.25 Net) (10.25% Net) (-1.75 Net) (2.25 Net) (6.25 Net) (10.25% Net)------ ----------- ----------- ----------- ----------- ------------ ----------- ----------- ----------- ------------
1 $ 919 $100,384 $100,407 $100,430 $100,453 $ 0 $ 0 $ 0 $ 02 $ 1,875 $100,823 $100,886 $100,952 $101,019 $ 94 $ 157 $ 222 $ 2893 $ 2,870 $101,244 $101,365 $101,494 $101,630 $ 514 $ 635 $ 764 $ 9004 $ 3,904 $101,644 $101,841 $102,056 $102,290 $ 914 $1,111 $ 1,326 $ 1,5605 $ 4,980 $102,023 $102,314 $102,639 $103,003 $1,293 $1,584 $ 1,910 $ 2,2736 $ 6,098 $102,378 $102,780 $103,242 $103,771 $1,648 $2,050 $ 2,512 $ 3,0417 $ 7,261 $102,710 $103,238 $103,863 $104,599 $2,163 $2,691 $ 3,315 $ 4,0528 $ 8,471 $103,017 $103,688 $104,503 $105,492 $2,652 $3,323 $ 4,139 $ 5,1279 $ 9,729 $103,298 $104,127 $105,162 $106,455 $3,116 $3,944 $ 4,980 $ 6,27210 $ 11,038 $103,552 $104,552 $105,839 $107,492 $3,552 $4,552 $ 5,839 $ 7,49215 $ 18,409 $104,335 $106,376 $109,427 $113,987 $4,335 $6,376 $ 9,427 $ 13,98720 $ 27,377 $104,019 $107,282 $113,046 $123,209 $4,019 $7,282 $13,046 $ 23,20925 $ 38,288 $101,898 $106,285 $115,739 $135,811 $1,898 $6,285 $15,739 $ 35,81130 $ 51,562 $100,000 $101,797 $115,691 $152,298 $ 0 $1,797 $15,691 $ 52,29835 $ 67,713 $ 0(2) $ 0(2) $109,326 $172,254 $ 0(2) $ 0(2) $ 9,326 $ 72,25440 $ 87,363 $ 0 $ 0 $ 0(2) $193,367 $ 0 $ 0 $ 0(2) $ 93,36745 $111,270 $ 0 $ 0 $ 0 $208,903 $ 0 $ 0 $ 0 $108,90350 $140,356 $ 0 $ 0 $ 0 $206,697 $ 0 $ 0 $ 0 $106,69755 $175,744 $ 0 $ 0 $ 0 $161,975 $ 0 $ 0 $ 0 $ 61,97560 $218,799 $ 0 $ 0 $ 0 $ 0(2) $ 0 $ 0 $ 0 $ 0(2)65 $271,182 $ 0 $ 0 $ 0 $ 0 $ 0 $ 0 $ 0 $ 0
(1) Assumes no Contract loan has been made.(2) Based on a gross return of 0% the cash surrender value would go to zero in year 1 and in year 28 and later, but because the Target Premium is being
paid, the Contract is kept inforce through the Limited Death Benefit Guarantee Period of 33 years. The contract would be in default at the beginning ofyear 34. Based on a gross return of 4% the cash surrender value would go to zero in year 1 and in year 32 and later, but because the Target Premium isbeing paid, the Contract is kept inforce through the Limited Death Benefit Guarantee Period of 33 years. The contract would be in default at thebeginning of year 34. Based on a gross return of 8% the cash surrender value would go to zero in year 1 and in year 39 and later. Because the TargetPremium is being paid, the Contract is kept inforce through the Limited Death Benefit Guarantee Period of 33 years. The contract would be in default atthe beginning of year 39. Based on a gross return of 12% the cash surrender value would go to zero in year 1 and in year 59 and later. Because theTarget Premium is being paid, the Contract is kept inforce through the Limited Death Benefit Guarantee Period of 33 years. The contract would be indefault at the beginning of year 59.
The hypothetical investment rates of return shown above and elsewhere in this prospectus are illustrative only and should not be deemed a representation ofpast or future investment rates of return. Actual rates of return may be more or less than those shown and will depend on a number of factors including theinvestment allocations made by an owner, prevailing interest rates, and rate of inflation. The Death Benefit and Cash Surrender Value for a contract wouldbe different from those shown if the actual rates of return average 0%, 4%, 8%, and 12% over a period of years but also fluctuated above or below thoseaverages for individual contract years. No representations can be made by Prudential or the funds that these hypothetical rates of return can be achievedfor any one year or sustained over any period of time.
T4

30
�������������
You may borrow from Pruco Life an amount up to the current loan value of your Contract less any existing Contractdebt using the Contract as the only security for the loan. The loan value at any time is equal to the sum of (1) 90% ofthe portion of the cash value attributable to the variable investment options, and (2) the balance of the cash value,provided the Contract is not in default. The cash value is equal to the Contract Fund less any surrender charge. AContract in default has no loan value. The minimum loan amount you may borrow is $200.
Interest charged on a loan accrues daily. Interest is due on each Contract anniversary or when the loan is paid back,whichever comes first. If interest is not paid when due, it becomes part of the loan and we will charge interest on it,too. Except in the case of preferred loans, we charge interest at an effective annual rate of 5%.
A portion of any amount you borrow on or after the 10th Contract anniversary may be considered a preferred loan.The maximum preferred loan amount is the total amount you may borrow minus the total net premiums paid (netpremiums equal premiums paid less total withdrawals, if any). If the net premium amount is less than zero, we will, forpurposes of this calculation, consider it to be zero. Only new loans borrowed after the 10th Contract anniversary maybe considered preferred loans. Standard loans will not automatically be converted into preferred loans. Preferredloans are charged interest at an effective annual rate of 4.5%.
The Contract debt is the amount of all outstanding loans plus any interest accrued but not yet due. If at any time theContract debt equals or exceeds the Contract Fund less any applicable surrender charges, the Contract will go intodefault. See Lapse and Reinstatement, page 33. If the Contract debt equals or exceeds the Contract Fund less anyapplicable surrender charges and you fail to keep the Contract in-force, the amount of unpaid Contract debt will betreated as a distribution and will be immediately taxable to the extent of gain in the contract. Reinstatement of thecontract after lapse will not eliminate the taxable income which we are required to report to the Internal RevenueService. See Tax Treatment of Contract Benefits, page 31.
When a loan is made, an amount equal to the loan proceeds is transferred out of the Account and/or the fixed-rateoption, as applicable. Unless you ask us to take the loan amount from specific investment options and we agree, thereduction will be made in the same proportions as the value in each variable investment option and the fixed-rateoption bears to the total value of the Contract. While a loan is outstanding, the amount that was so transferred willcontinue to be treated as part of the Contract Fund. It will be credited with an effective annual rate of return of 4%. Oneach Monthly date, we will increase the portion of the Contract Fund in the investment options by interest creditsaccrued on the loan since the last Monthly date. The net cost of a standard loan is 1% and the net cost of a preferredloan is ½%.
A loan will not cause the Contract to lapse as long as Contract debt does not equal or exceed the Contract Fund, lessany applicable surrender charges. Loans from Modified Endowment Contracts may be treated for tax purposes asdistributions of income. See Tax Treatment of Contract Benefits, page 31.
Loans you take against the Contract are ordinarily treated as debt and are not considered distributions subject to tax.However, you should know that the Internal Revenue Service may take the position that the loan should be treated asa distribution for tax purposes because of the relatively low differential between the loan interest rate and theContract’s crediting rate. Distributions are subject to income tax. Were the Internal Revenue Service to take thisposition, Prudential would take reasonable steps to attempt to avoid this result, including modifying the Contract’s loanprovisions, but cannot guarantee that such efforts would be successful.
Any Contract debt will directly reduce a Contract's cash surrender value and will be subtracted from the death benefitto determine the amount payable. In addition, even if the loan is fully repaid, it may have an effect on future deathbenefits because the investment results of the selected investment options will apply only to the amount remaininginvested under those options. The longer the loan is outstanding, the greater the effect is likely to be. The effect couldbe favorable or unfavorable. If investment results are greater than the rate being credited on the amount of the loanwhile the loan is outstanding, values under the Contract will not increase as rapidly as they would have if no loan hadbeen made. If investment results are below that rate, Contract values will be higher than they would have been had noloan been made.
When you repay all or part of a loan, we will increase the portion of the Contract Fund in the investment options by theamount of the loan you repay using the investment allocation for future premium payments as of the loan payment
31
date, plus interest credits accrued on the loan since the last transaction date. If loan interest is paid when due, it willnot change the portion of the Contract Fund allocated to the investment options. We reserve the right to change themanner in which we allocate loan repayments.
��(����������������%��(����!!�������
Pruco Securities Corporation ("Prusec"), an indirect wholly-owned subsidiary of Prudential, acts as the principalunderwriter of the Contract. Prusec, organized in 1971 under New Jersey law, is registered as a broker and dealerunder the Securities Exchange Act of 1934 and is a member of the National Association of Securities Dealers, Inc.Prusec’s principal business address is 751 Broad Street, Newark, New Jersey 07102-3777. The Contract is sold byregistered representatives of Prusec who are also authorized by state insurance departments to do so. The Contractmay also be sold through other broker-dealers authorized by Prusec and applicable law to do so. Registeredrepresentatives of such other broker-dealers may be paid on a different basis than described below.
Generally, representatives will receive a commission of no more than:
(1) 50% of the premiums received in the first year on premiums up to the target premium (see Premiums, page19);
(2) 5% of premiums received in years two through 10 on premiums up to the target premium; and (3) 3% onpremiums received in the first 10 years in excess of the target premium or received after 10 years.
If the basic insurance amount is increased, representatives will generally receive a commission of no more than:
(1) 25% of the premiums received up to the target premium for the increase received in the first year;(2) 5% of the premiums received up to the target premium for years two through 10; and(3) 3% on other premiums received for the increase.
Moreover, trail commissions of up to 0.025% of an amount determined by averaging the Contract Fund less alloutstanding loans as of the first and last day of each calendar quarter may be paid.
Representatives with less than four years of service may receive compensation on a different basis. Representativeswho meet certain productivity or persistency standards may be eligible for additional compensation.
��*�����!���������������������
This summary provides general information on the federal income tax treatment of the Contract. It is not a completestatement of what the federal income taxes will be in all circumstances. It is based on current law and interpretations,which may change. It does not cover state taxes or other taxes. It is not intended as tax advice. You should consultyour own qualified tax adviser for complete information and advice.
Treatment as Life Insurance. The Contract must meet certain requirements to qualify as life insurance for taxpurposes. These requirements include certain definitional tests and rules for diversification of the Contract’sinvestments. For further information on the diversification requirements, see Taxation of the Fund in the statement ofadditional information for the Series Fund.
We believe we have taken adequate steps to insure that the Contract qualifies as life insurance for tax purposes.Generally speaking, this means that:
• you will not be taxed on the growth of the funds in the Contract, unless you receive a distribution from theContract,
• the Contract’s death benefit will be income tax free to your beneficiary.
Although we believe that the Contract should qualify as life insurance for tax purposes, there are some uncertainties,particularly because the Secretary of Treasury has not yet issued permanent regulations that bear on this question.Accordingly, we reserve the right to make changes -- which will be applied uniformly to all Contract owners afteradvance written notice -- that we deem necessary to insure that the Contract will qualify as life insurance.
32
Pre-Death Distributions. The tax treatment of any distribution you receive before the insured’s death depends onwhether the Contract is classified as a Modified Endowment Contract.
Contracts Not Classified as Modified Endowment Contracts.
• If you surrender the Contract or allow it to lapse, you will be taxed on the amount you receive inexcess of the premiums you paid less the untaxed portion of any prior withdrawals. For this purpose,you will be treated as receiving any portion of the cash surrender value used to repay Contract debt.In other words, you will immediately have taxable income to the extent of gain in the Contract.Reinstatement of the contract after lapse will not eliminate the taxable income which we are requiredto report to the Internal Revenue Service. The tax consequences of a surrender may differ if you takethe proceeds under an income payment settlement option.
• Generally, you will be taxed on a withdrawal to the extent the amount you receive exceeds the
premiums you paid for the Contract less the untaxed portion of any prior withdrawals. However, undersome limited circumstances, in the first 15 Contract years, all or a portion of a withdrawal may betaxed if the Contract Fund exceeds the total premiums paid less the untaxed portions of any priorwithdrawals, even if total withdrawals do not exceed total premiums paid.
• Extra premiums for optional benefits and riders generally do not count in computing the premiums paid
for the Contract for the purposes of determining whether a withdrawal is taxable. • Loans you take against the Contract are ordinarily treated as debt and are not considered distributions
subject to tax. However, there is some risk the Internal Revenue Service might assert that thepreferred loan should be treated as a distribution for tax purposes because of the relatively lowdifferential between the loan interest rate and Contract’s crediting rate. Were the Internal RevenueService to take this position, Pruco Life would take reasonable steps to avoid this result, includingmodifying the Contract’s loan provisions.
Modified Endowment Contracts.
• The rules change if the Contract is classified as a Modified Endowment Contract. The Contract couldbe classified as a Modified Endowment Contract if premiums in amounts that are too large are paid ora decrease in the face amount of insurance is made (or a rider removed). The addition of a rider oran increase in the face amount of insurance may also cause the Contract to be classified as aModified Endowment Contract. You should first consult a qualified tax adviser and your Pruco Liferepresentative if you are contemplating any of these steps.
• If the Contract is classified as a Modified Endowment Contract, then amounts you receive under the
Contract before the insured's death, including loans and withdrawals, are included in income to theextent that the Contract Fund before surrender charges exceeds the premiums paid for the Contractincreased by the amount of any loans previously included in income and reduced by any untaxedamounts previously received other than the amount of any loans excludible from income. Anassignment of a Modified Endowment Contract is taxable in the same way. These rules also apply topre-death distributions, including loans and assignments, made during the two-year period before thetime that the Contract became a Modified Endowment Contract.
• Any taxable income on pre-death distributions (including full surrenders) is subject to a penalty of 10
percent unless the amount is received on or after age 59½, on account of your becoming disabled oras a life annuity. It is presently unclear how the penalty tax provisions apply to Contracts owned bybusinesses.
• All Modified Endowment Contracts issued by us to you during the same calendar year are treated as
a single Contract for purposes of applying these rules.
Investor Control. Treasury Department regulations do not provide guidance concerning the extent to which you maydirect your investment in the particular variable investment options without causing you, instead of Pruco Life, to beconsidered the owner of the underlying assets. Because of this uncertainty, Pruco Life reserves the right to make such
33
changes as it deems necessary to assure that the Contract qualifies as life insurance for tax purposes. Any suchchanges will apply uniformly to affected Contract owners and will be made with such notice to affected Contract ownersas is feasible under the circumstances.
Withholding. You must affirmatively elect that no taxes be withheld from a pre-death distribution. Otherwise, thetaxable portion of any amounts you receive will be subject to withholding. You are not permitted to elect out ofwithholding if you do not provide a social security number or other taxpayer identification number. You may be subjectto penalties under the estimated tax payment rules if your withholding and estimated tax payments are insufficient tocover the tax due.
Other Tax Considerations. If you transfer or assign the Contract to someone else, there may be gift, estate and/orincome tax consequences. If you transfer the Contract to a person two or more generations younger than you (ordesignate such a younger person as a beneficiary), there may be Generation Skipping Transfer tax consequences.Deductions for interest paid or accrued on Contract debt or on other loans that are incurred or continued to purchaseor carry the Contract may be denied. Your individual situation or that of your beneficiary will determine the federalestate taxes and the state and local estate, inheritance and other taxes due if you or the insured dies.
Business-Owned Life Insurance. If a business, rather than an individual, is the owner of the Contract, there aresome additional rules. Business Contract owners generally cannot deduct premium payments. Business Contractowners generally cannot take tax deductions for interest on Contract debt paid or accrued after October 13, 1995. Anexception permits the deduction of interest on policy loans on Contracts for up to 20 key persons. The interestdeduction for Contract debt on these loans is limited to a prescribed interest rate and a maximum aggregate loanamount of $50,000 per key insured person. The corporate alternative minimum tax also applies to business-owned lifeinsurance. This is an indirect tax on additions to the Contract Fund or death benefits received under business-ownedlife insurance policies.
�������%���������!���
Pruco Life will determine the value of the Contract Fund on each Monthly date. If the Contract Fund less anyapplicable surrender charges is zero or less, the Contract is in default unless it remains in-force under the DeathBenefit Guarantee. See Death Benefit Guarantee, page 21. If the Contract debt ever grows to be equal to or morethan the Contract Fund less any applicable surrender charges, the Contract will be in default. Should this happen,Pruco Life will send you a notice of default setting forth the payment which we estimate will keep the Contract in-forcefor three months from the date of default. This payment must be received at a Home Office within the 61-day graceperiod after the notice of default is mailed or the Contract will end and have no value. A Contract that lapses with anoutstanding Contract loan may have tax consequences. See Tax Treatment of Contract Benefits, page 31.
A Contract that ended in default may be reinstated within 5 years after the date of default if the following conditions aremet: (1) renewed evidence of insurability is provided on the insured; (2) submission of certain payments sufficient tobring the Contract up to date plus a premium that we estimate will cover all charges and deductions for the next threemonths; and (3) any Contract debt with interest to date must be restored or paid back. If the Contract debt is restoredand the debt with interest would exceed the loan value of the reinstated Contract, the excess must be paid to us beforereinstatement. The reinstatement date will be the Monthly date that coincides with or next follows the date we approveyour request. We will deduct all required charges from your payment and the balance will be placed into your ContractFund. If we approve the reinstatement, we will credit the Contract Fund with an amount equal to the surrender chargeapplicable as of the date of reinstatement.
�� �(�����%����������(���� ����*.�����������!�"!���%��������
The Contract generally employs mortality tables that distinguish between males and females. Thus, premiums andbenefits differ under Contracts issued on males and females of the same age. However, in those states that haveadopted regulations prohibiting sex-distinct insurance rates, premiums and cost of insurance charges will be based onmale rates, whether the insureds are male or female. In addition, employers and employee organizations consideringpurchase of a Contract should consult their legal advisers to determine whether purchase of a Contract based onsex-distinct actuarial tables is consistent with Title VII of the Civil Rights Act of 1964 or other applicable law.

34
�����+�����(�����������$������
Assignment. This Contract may not be assigned if the assignment would violate any federal, state or local law orregulation prohibiting sex distinct rates for insurance. Generally, the Contract may not be assigned to an employeebenefit plan or program without Pruco Life’s consent. Pruco Life assumes no responsibility for the validity or sufficiencyof any assignment. We will not be obligated to comply with any assignment unless we receive a copy at a HomeOffice.
Beneficiary. You designate and name your beneficiary in the application. Thereafter, you may change the beneficiary,provided it is in accordance with the terms of the Contract. Should the insured die with no surviving beneficiary, theinsured’s estate will become the beneficiary.
Incontestability. We will not contest the Contract after it has been in-force during the insured’s lifetime for two yearsfrom the issue date except when any change is made in the Contract that requires Pruco Life's approval and wouldincrease our liability. We will not contest such change after it has been in effect for two years during the lifetime of theinsured.
Misstatement of Age or Sex. If the insured's stated age or sex or both are incorrect in the Contract, Pruco Life willadjust the death benefit payable and any amount to be paid, as required by law, to reflect the correct age and sex. Anysuch benefit will be based on what the most recent deductions from the Contract Fund would have provided at theinsured's correct age and sex.
Settlement Options. The Contract grants to most owners, or to the beneficiary, a variety of optional ways of receivingContract proceeds, other than in a lump sum. Any Pruco Life representative authorized to sell this Contract canexplain these options upon request.
Suicide Exclusion. Generally, if the insured, whether sane or insane, dies by suicide within two years from theContract date, the Contract will end and Pruco Life will return the premiums paid, less any Contract debt, and less anywithdrawals. Generally, if the insured, whether sane or insane, dies by suicide after two years from the issue date, butwithin two years of the effective date of an increase in the basic insurance amount, we will pay, as to the increase inamount, no more than the sum of the premiums paid on and after the effective date of an increase.
��%���
Contract owners may be able to obtain extra fixed benefits which may require an additional premium. These optionalinsurance benefits will be described in what is known as a "rider" to the Contract. Charges applicable to the riders willbe deducted from the Contract Fund on each Monthly date.
One rider pays certain premiums into the Contract if the insured is totally disabled within the meaning of the provision.Others pay an additional amount if the insured dies within a stated number of years after issue; similar benefits may beavailable if the insured's spouse or child should die. The amounts of these benefits are fully guaranteed at issue; theydo not depend on the performance of the Account, although they will no longer be available if the Contract lapses.Certain restrictions may apply; they are clearly described in the applicable rider.
Any Pruco Life representative authorized to sell the Contract can explain these extra benefits further. Samples of theprovisions are available from Pruco Life upon written request.
�")����"�������"�%������
Although Pruco Life believes it to be unlikely, it is possible that in the judgment of its management, one or more of theportfolios of the Funds may become unsuitable for investment by Contract owners because of investment policychanges, tax law changes, or the unavailability of shares for investment. In that event, Pruco Life may seek tosubstitute the shares of another portfolio or of an entirely different mutual fund. Before this can be done, the approvalof the SEC, and possibly one or more state insurance departments, may be required. Contract owners will be notifiedof any such substitution.

35
������������������9����
Once each year, Pruco Life will send you a statement that provides certain information pertinent to your own Contract.This statement will detail values, transactions made, and specific Contract data that apply only to your particularContract.
You will also be sent annual and semi-annual reports of the Funds showing the financial condition of the portfolios andthe investments held in each portfolio.
������� "(�����
Pruco Life is subject to regulation and supervision by the Department of Insurance of the State of Arizona, whichperiodically examines its operations and financial condition. It is also subject to the insurance laws and regulations ofall jurisdictions in which it is authorized to do business.
Pruco Life is required to submit annual statements of its operations, including financial statements, to the insurancedepartments of the various jurisdictions in which it does business to determine solvency and compliance with localinsurance laws and regulations.
In addition to the annual statements referred to above, Pruco Life is required to file with Arizona and other jurisdictionsa separate statement with respect to the operations of all its variable contract accounts, in a form promulgated by theNational Association of Insurance Commissioners.
�*�����
The consolidated financial statements of Pruco Life and its subsidiaries as of December 31, 2001 and 2000 and foreach of the three years in the period ended December 31, 2001 and the financial statements of the Variable UniversalLife Subaccounts of the Account as of December 31, 2001 and for each of the three years in the period then endedincluded in this prospectus have been so included in reliance on the reports of PricewaterhouseCoopers LLP,independent accountants, given on the authority of said firm as experts in auditing and accounting.PricewaterhouseCoopers LLP’s principal business address is 1177 Avenue of the Americas, New York, New York10036.
Actuarial matters included in this prospectus have been examined by Pamela A. Schiz, MAAA, FSA, Vice Presidentand Actuary of Prudential, whose opinion is filed as an exhibit to the registration statement.
���� �������%�� "(����#������%�� �
We are subject to legal and regulatory actions in the ordinary course of our businesses, including class actions.Pending legal and regulatory actions include proceedings specific to our practices and proceedings generallyapplicable to business practices in the industries in which we operate. In certain of these lawsuits, large and/orindeterminate amounts are sought, including punitive or exemplary damages.
Beginning in 1995, regulatory authorities and customers brought significant regulatory actions and civil litigationagainst Pruco Life and Prudential involving individual life insurance sales practices. In 1996, Prudential, on behalf ofitself and many of its life insurance subsidiaries, including Pruco Life, entered into settlement agreements with relevantinsurance regulatory authorities and plaintiffs in the principal life insurance sales practices class action lawsuit coveringpolicyholders of individual permanent life insurance policies issued in the United States from 1982 to 1995. Pursuantto the settlements, the companies agreed to various changes to their sales and business practices controls, to a seriesof fines, and to provide specific forms of relief to eligible class members. Virtually all claims by class members filed inconnection with the settlements have been resolved and virtually all aspects of the remediation program have beensatisfied.
As of December 31, 2001 Prudential and/or Pruco Life remained a party to approximately 44 individual sales practicesactions filed by policyholders who “opted out” of the class action settlement relating to permanent life insurancepolicies issued in the United States between 1982 and 1995. In addition, there were 19 sales practices actionspending that were filed by policyholders who were members of the class and who failed to “opt out” of the class actionsettlement. Prudential and Pruco Life believed that those actions are governed by the class settlement release and

36
expects them to be enjoined and/or dismissed. Additional suits may be filed by class members who “opted out” of theclass settlements or who failed to “opt out” but nevertheless seek to proceed against Prudential and/or Pruco Life. Anumber of the plaintiffs in these cases seek large and/or indeterminate amounts, including punitive or exemplarydamages. Some of these actions are brought on behalf of multiple plaintiffs. It is possible that substantial punitivedamages might be awarded in any of these actions and particularly in an action involving multiple plaintiffs.
Prudential has indemnified Pruco Life for any liabilities incurred in connection with sales practices litigation coveringpolicyholders of individual permanent life insurance policies issued in the United States from 1982 to 1995.
Pruco Life’s litigation is subject to many uncertainties, and given the complexity and scope, the outcomes cannot bepredicted. It is possible that the results of operations or the cash flow of Pruco Life in a particular quarterly or annualperiod could be materially affected by an ultimate unfavorable resolution of pending litigation and regulatory matters.Management believes, however, that the ultimate outcome of all pending litigation and regulatory matters should nothave a material adverse effect on Pruco Life’s financial position.
�%%������( ����!�����
Pruco Life has filed a registration statement with the SEC under the Securities Act of 1933, relating to the offeringdescribed in this prospectus. This prospectus does not include all the information set forth in the registrationstatement. Certain portions have been omitted pursuant to the rules and regulations of the SEC. The omittedinformation may, however, be obtained from the SEC's Public Reference Section at 450 Fifth Street, N.W.,Washington, D.C. 20549, or by telephoning (800) SEC-0330, upon payment of a prescribed fee.
To reduce costs, we now generally send only a single copy of prospectuses and shareholder reports to eachhousehold ("householding"), in lieu of sending a copy to each contract owner that resides in the household. Youshould be aware that you can revoke or "opt out" of householding at any time by calling 1-877-778-5008.
Further information may also be obtained from Pruco Life. Its address and telephone number are set forth on theinside front cover of this prospectus.
��������(�����!����
The financial statements of the Account should be distinguished from the consolidated financial statements of PrucoLife and its subsidiaries, which should be considered only as bearing upon the ability of Pruco Life to meet itsobligations under the Contracts.

37
� ������������ ����
The directors and major officers of Pruco Life, listed with their principal occupations during the past 5 years, are shownbelow.
� ��������������� ��
JAMES J. AVERY, JR., Vice Chairman and Director – President, Prudential Individual Life Insurance since 1998;prior to 1998: Senior Vice President, Chief Actuary and CFO, Prudential Individual Insurance Group.
VIVIAN L. BANTA, President, Chairman, and Director - Executive Vice President, Individual Financial Services, U.S.Consumer Group since 2000; 1998 to 1999: Consultant, Individual Financial Services; prior to 1998: Consultant,Morgan Stanley.
RICHARD J. CARBONE, Director – Senior Vice President and Chief Financial Officer since 1997.
HELEN M. GALT, Director – Company Actuary, Prudential since 1993.
JEAN D. HAMILTON, Director – Executive Vice President, Prudential Institutional since 1998; prior to 1998: President,Diversified Group.
RONALD P. JOELSON, Director – Senior Vice President, Prudential Asset, Liability and Risk Management since1999; prior to 1999: President, Guaranteed Products, Prudential Institutional.
DAVID R. ODENATH, JR., Director – President, Prudential Investments since 1999; prior to 1999: Senior VicePresident and Director of Sales, Investment Consulting Group, PaineWebber.
��� ����/�������� �������
SHAUN M. BYRNES, Senior Vice President – Senior Vice President, Director of Mutual Funds, Annuities and UITs,Prudential Investments since 2001; 2000 to 2001: Senior Vice President, Director of Research, Prudential Investments;1999 to 2000: Senior Vice President, Director of Mutual Funds, Prudential Investments; prior to 1999: Vice President,Mutual Funds, Prudential Investments.
C. EDWARD CHAPLIN, Treasurer – Senior Vice President and Treasurer, Prudential since 2000; prior to 2000, VicePresident and Treasurer, Prudential.
THOMAS F. HIGGINS, Senior Vice President – Vice President, Annuity Services, Prudential Individual FinancialServices since 1999; 1998 to 1999: Vice President, Mutual Funds, Prudential Individual Financial Services; prior to1998: Principal, Mutual Fund Operations, The Vanguard Group.
CLIFFORD E. KIRSCH, Chief Legal Officer and Secretary – Chief Counsel, Variable Products, Prudential LawDepartment since 1995.
ANDREW J. MAKO, Executive Vice President – Vice President, Finance, U.S. Consumer Group since 1999; prior to1999: Vice President, Business Performance Management Group.
ESTHER H. MILNES, Senior Vice President – Vice President and Chief Actuary, Prudential Individual Life Insurancesince 1999; prior to 1999: Vice President and Actuary, Prudential Individual Insurance Group.
JAMES M. O’CONNOR, Senior Vice President and Actuary – Vice President, Guaranteed Products since 2001; 1998to 2000: Corporate Vice President, Guaranteed Products; prior to 1998: Corporate Actuary, Prudential Investments.
SHIRLEY H. SHAO, Senior Vice President and Chief Actuary – Vice President and Associate Actuary, Prudential since1996.

38
WILLIAM J. ECKERT, IV, Vice President and Chief Accounting Officer – Vice President and IFS Controller, PrudentialEnterprise Financial Management since 2000; 1999 to 2000: Vice President and Individual Life Controller, PrudentialEnterprise Financial Management; prior to 1999: Vice President, Accounting, Enterprise Financial Management.
The business address of all directors and officers of Pruco Life is 213 Washington Street, Newark, New Jersey 07102-2992.
Pruco Life directors and officers are elected annually.

STATEMENTS OF NET ASSETSDecember 31, 2001
SUBACCOUNTS SUBACCOUNTS (Continued)
MFSPrudential Prudential Prudential Prudential Prudential Prudential T. Rowe Price Janus Emerging AmericanMoney Diversified Prudential Flexible Conservative High Yield Stock Prudential Prudential Prudential International AIM V.I. Aspen Growth Century VPMarket Bond Equity Managed Balanced Bond Index Value Global Jennison Stock Value Growth Series ValuePortfolio Portfolio Portfolio Portfolio Portfolio Portfolio Portfolio Portfolio Portfolio Portfolio Portfolio Fund Portfolio Portfolio Fund
ASSETS
Investment in The Prudential Series
Fund Inc. Portfolios and non-
Prudential administered funds at,
net asset value [Note 3] . . . . . . . . . . $149,803,902 $163,498,934 $1,356,366,869 $1,267,786,516 $962,475,586 $ 77,870,620 $865,987,367 $508,784,419 $193,992,871 $451,810,994 $ 905,264 $ 2,066,730 $ 2,535,719 $ 1,378,475 $ 1,237,007
Net Assets . . . . . . . . . . . . . . . . . . . . $149,803,902 $163,498,934 $1,356,366,869 $1,267,786,516 $962,475,586 $ 77,870,620 $865,987,367 $508,784,419 $193,992,871 $451,810,994 $ 905,264 $ 2,066,730 $ 2,535,719 $ 1,378,475 $ 1,237,007
NET ASSETS, representing:
Accumulation units [Note 9] . . . . . . . . . $149,803,902 $163,498,934 $1,356,366,869 $1,267,786,516 $962,475,586 $ 77,870,620 $865,987,367 $508,784,419 $193,992,871 $451,810,994 $ 905,264 $ 2,066,730 $ 2,535,719 $ 1,378,475 $ 1,237,007
$149,803,902 $163,498,934 $1,356,366,869 $1,267,786,516 $962,475,586 $ 77,870,620 $865,987,367 $508,784,419 $193,992,871 $451,810,994 $ 905,264 $ 2,066,730 $ 2,535,719 $ 1,378,475 $ 1,237,007
Units outstanding . . . . . . . . . . . . . . . . 83,793,334 65,406,382 298,797,327 390,792,044 341,216,574 37,841,595 174,445,809 105,681,938 113,393,328 191,013,777 1,025,423 1,556,003 1,921,232 1,014,569 828,765
Q:/Pru-SeparateAccounts/88232/—
Prudential–Separate
AccountsFinancialsVULPRU
Op:ron—
f88232_a1a2
ScottPrintingCorporationö(212)962-4405ö(212)943-8970
Friday,April26,20029:39am
SEE NOTES TO FINANCIAL STATEMENTS ON PAGES A15 THROUGH A20
A2
SEE NOTES TO FINANCIAL STATEMENTS ON PAGES A15 THROUGH A20
A1
FINANCIAL STATEMENTS OFTHE VARIABLE UNIVERSAL LIFE SUBACCOUNTS OFTHE PRUDENTIAL VARIABLE APPRECIABLE ACCOUNT

STATEMENTS OF OPERATIONSFor the years ended December 31, 2001, 2000 and 1999
SUBACCOUNTS SUBACCOUNTS (Continued)
Prudential Prudential Prudential Prudential PrudentialMoney Market Diversified Bond Equity Flexible Managed Conservative Balanced
Portfolio Portfolio Portfolio Portfolio Portfolio
2001 2000 1999 2001 2000 1999 2001 2000 1999 2001 2000 1999 2001 2000 1999
INVESTMENT INCOME
Dividend income . . . . . . . . . . . . . . . . . . . $ 5,691,321 $ 7,374,565 $ 5,770,360 $ 9,660,311 $ 9,363,742 $ 0 $ 11,778,719 $ 28,717,308 $ 26,581,947 $ 49,145,298 $ 51,475,016 $ 66,382 $ 33,596,157 $ 39,032,025 $ 45,641,073
EXPENSES
Charges to contract owners for assuming
mortality risk and expense risk
[Note 4A] . . . . . . . . . . . . . . . . . . . . . . 1,004,822 857,383 820,458 1,154,591 1,055,858 1,044,261 10,233,632 10,912,470 11,249,143 9,313,450 10,246,499 10,502,693 7,282,105 7,930,987 8,224,025
NET INVESTMENT INCOME (LOSS) . . . . . 4,686,499 6,517,182 4,949,902 8,505,720 8,307,884 (1,044,261) 1,545,087 17,804,838 15,332,804 39,831,848 41,228,517 (10,436,311) 26,314,052 31,101,038 37,417,048
NET REALIZED AND UNREALIZED GAIN
(LOSS) ON INVESTMENTS
Capital gains distributions received . . . . . . 0 0 0 0 18,515 399,858 74,972,452 252,626,405 188,845,438 18,948,318 20,228,730 16,843,257 10,268,699 7,927,522 6,358,209
Realized gain (loss) on shares
redeemed . . . . . . . . . . . . . . . . . . . . . . 0 0 0 1,463,159 86,063 (62,342) (11,972,627) 12,712,901 27,402,970 (5,121,442) 3,425,308 2,080,576 (3,219,178) 2,714,849 2,277,146
Net change in unrealized gain (loss)
on investments . . . . . . . . . . . . . . . . . . 0 0 0 (379,997) 4,554,260 (1,453,759) (248,117,507) (246,644,445) (58,596,445) (141,197,546) (96,184,606) 91,955,490 (61,523,825) (54,474,725) 18,533,490
NET GAIN (LOSS) ON INVESTMENTS . . . . 0 0 0 1,083,162 4,658,838 (1,116,243) (185,117,682) 18,694,861 157,651,963 (127,370,670) (72,530,568) 110,879,323 (54,474,304) (43,832,354) 27,168,845
NET INCREASE (DECREASE) IN NET
ASSETS RESULTING FROM
OPERATIONS . . . . . . . . . . . . . . . . . . . . $ 4,686,499 $ 6,517,182 $ 4,949,902 $ 9,588,882 $ 12,966,722 $ (2,160,504) $(183,572,595) $ 36,499,699 $172,984,767 $ (87,538,822) $ (31,302,051) $100,443,012 $ (28,160,252) $ (12,731,316) $ 64,585,893
Q:/Pru-SeparateAccounts/88232/—
Prudential–Separate
AccountsFinancialsVULPRU
Op:ron—
f88232_a3a4
ScottPrintingCorporationö(212)962-4405ö(212)943-8970
Friday,April26,20029:40am
SEE NOTES TO FINANCIAL STATEMENTS ON PAGES A15 THROUGH A20
A4
SEE NOTES TO FINANCIAL STATEMENTS ON PAGES A15 THROUGH A20
A3
FINANCIAL STATEMENTS OFTHE VARIABLE UNIVERSAL LIFE SUBACCOUNTS OFTHE PRUDENTIAL VARIABLE APPRECIABLE ACCOUNT

STATEMENTS OF OPERATIONSFor the years ended December 31, 2001, 2000 and 1999
SUBACCOUNTS SUBACCOUNTS (Continued)
Prudential Prudential Prudential Prudential PrudentialHigh Yield Bond Stock Index Value Global Jennison
Portfolio Portfolio Portfolio Portfolio Portfolio
2001 2000 1999 2001 2000 1999 2001 2000 1999 2001 2000 1999 2001 2000 1999
INVESTMENT INCOME
Dividend income . . . . . . . . . . . . . . . . . . $ 9,427,159 $ 9,628,996 $ 251,218 $ 9,128,445 9,144,548 10,125,645 $ 8,012,590 $ 10,338,921 $ 10,876,592 $ 734,834 $ 1,914,868 $ 678,214 $ 796,086 $ 384,515 $ 541,083
EXPENSES
Charges to contract owners for assuming
mortality risk and expense risk
[Note 4A]. . . . . . . . . . . . . . . . . . . . . . 580,357 601,288 655,946 6,421,387 7,509,378 6,675,340 3,558,508 3,178,543 3,285,457 1,440,781 1,752,355 1,111,465 3,229,200 3,978,955 2,115,948
NET INVESTMENT INCOME (LOSS) . . . . 8,846,802 9,027,708 (404,728) 2,707,058 1,635,170 3,450,305 4,454,082 7,160,378 7,591,135 (705,947) 162,513 (433,251) (2,433,114) (3,594,440) (1,574,865)
NET REALIZED AND UNREALIZED GAIN
(LOSS) ON INVESTMENTS
Capital gains distributions received . . . . . 0 0 0 51,332,600 35,213,342 12,472,929 47,413,973 35,832,915 53,052,638 48,429,909 16,578,985 1,189,193 4,599,398 76,293,654 18,100,277
Realized gain (loss) on shares
redeemed . . . . . . . . . . . . . . . . . . . . . (1,984,736) (1,139,978) (966,582) 14,703,822 16,646,062 19,189,378 555,997 2,234,121 7,546,600 (7,478,356) 917,015 3,166,922 (8,820,129) 1,403,528 1,956,464
Net change in unrealized gain (loss)
on investments. . . . . . . . . . . . . . . . . . (7,772,594) (15,147,733) 4,891,833 (196,280,113) (160,730,652) 136,915,479 (66,822,363) 20,197,962 (16,047,855) (83,717,864) (70,915,302) 67,191,804 (96,533,999) (198,113,004) 99,641,732
NET GAIN (LOSS) ON INVESTMENTS . . . (9,757,330) (16,287,711) 3,925,251 (130,243,691) (108,871,248) 168,577,786 (18,852,393) 58,264,998 44,551,383 (42,766,311) (53,419,302) 71,547,919 (100,754,730) (120,415,822) 119,698,473
NET INCREASE (DECREASE) IN NET
ASSETS RESULTING FROM
OPERATIONS . . . . . . . . . . . . . . . . . . . $ (910,528) $ (7,260,003) $ 3,520,523 $(127,536,633) $(107,236,078) $172,028,091 $ (14,398,311) $ 65,425,376 $ 52,142,518 $ (43,472,258) $ (53,256,789) $ 71,114,668 $(103,187,844) $(124,010,262) $118,123,608
Q:/Pru-SeparateAccounts/88232/—
Prudential–Separate
AccountsFinancialsVULPRU
Op:ron—
f88232_a5a6
ScottPrintingCorporationö(212)962-4405ö(212)943-8970
Friday,April26,20029:41am
SEE NOTES TO FINANCIAL STATEMENTS ON PAGES A15 THROUGH A20
A6
SEE NOTES TO FINANCIAL STATEMENTS ON PAGES A15 THROUGH A20
A5
FINANCIAL STATEMENTS OFTHE VARIABLE UNIVERSAL LIFE SUBACCOUNTS OFTHE PRUDENTIAL VARIABLE APPRECIABLE ACCOUNT

STATEMENTS OF OPERATIONSFor the years ended December 31, 2001, 2000 and 1999
SUBACCOUNTS SUBACCOUNTS (Continued)
T. Rowe Price AIM V.I. Janus Aspen MFS EmergingInternational Stock Value Growth Growth Series American Century
Portfolio Fund Portfolio Portfolio VP Value
2001 2000 1999 2001 2000 1999 2001 2000 1999 2001 2000 1999 2001 2000 1999
INVESTMENT INCOME
Dividend income . . . . . . . . . . . . . . . . . . . $ 18,843 $ 4,192 $ 570 $ 2,693 $ 1,609 $ 1,048 $ 1,491 $ 29,366 $ 742 $ 0 $ 0 $ 0 $ 5,401 $ 1,715 $ 0
EXPENSES
Charges to contract owners for assuming
mortality risk and expense risk
[Note 4A] . . . . . . . . . . . . . . . . . . . . . . . 4,594 2,592 221 10,008 5,257 599 12,066 8,122 745 6,908 4,451 424 4,726 1,658 85
NET INVESTMENT INCOME (LOSS) . . . . . 14,249 1,600 349 (7,315) (3,648) 449 (10,575) 21,244 (3) (6,908) (4,451) (424) 675 57 (85)
NET REALIZED AND UNREALIZED GAIN
(LOSS) ON INVESTMENTS
Capital gains distributions received . . . . . . 0 20,121 1,792 40,882 56,065 5,479 3,728 68,363 107 72,082 31,841 0 0 4,388 0
Realized gain (loss) on shares
redeemed . . . . . . . . . . . . . . . . . . . . . . (14,787) 6,356 0 (25,903) 7,979 0 (90,696) 8,468 0 (52,483) 19,917 0 7,745 2,209 0
Net change in unrealized gain (loss)
on investments . . . . . . . . . . . . . . . . . . . (183,179) (129,440) 28,848 (223,173) (265,995) 43,489 (407,229) (461,183) 73,745 (445,703) (273,214) 106,728 105,697 65,436 (1,710)
NET GAIN (LOSS) ON INVESTMENTS . . . . (197,966) (102,963) 30,640 (208,194) (201,951) 48,968 (494,197) (384,352) 73,852 (426,104) (221,456) 106,728 113,442 72,033 (1,710)
NET INCREASE (DECREASE) IN NET
ASSETS RESULTING FROM
OPERATIONS. . . . . . . . . . . . . . . . . . . . . $ (183,717) $ (101,363) $ 30,989 $ (215,509) $ (205,599) $ 49,417 $ (504,772) $ (363,108) $ 73,849 $ (433,012) $ (225,907) $ 106,304 $ 114,117 $ 72,090 $ (1,795)
Q:/Pru-SeparateAccounts/88232/—
Prudential–Separate
AccountsFinancialsVULPRU
Op:ron—
f88232_a7a8
ScottPrintingCorporationö(212)962-4405ö(212)943-8970
Friday,April26,20029:47am
SEE NOTES TO FINANCIAL STATEMENTS ON PAGES A15 THROUGH A20
A8
SEE NOTES TO FINANCIAL STATEMENTS ON PAGES A15 THROUGH A20
A7
FINANCIAL STATEMENTS OFTHE VARIABLE UNIVERSAL LIFE SUBACCOUNTS OFTHE PRUDENTIAL VARIABLE APPRECIABLE ACCOUNT

STATEMENTS OF CHANGES IN NET ASSETSFor the years ended December 31, 2001, 2000 and 1999
SUBACCOUNTS SUBACCOUNTS (Continued)
Prudential Prudential Prudential Prudential PrudentialMoney Market Diversified Bond Equity Flexible Managed Conservative Balanced
Portfolio Portfolio Portfolio Portfolio Portfolio
2001 2000 1999 2001 2000 1999 2001 2000 1999 2001 2000 1999 2001 2000 1999
OPERATIONS
Net investment income (loss) . . . . . . . . . . . . . . . $ 4,686,499 $ 6,517,182 $ 4,949,902 $ 8,505,720 $ 8,307,884 $ (1,044,261) $ 1,545,087 $ 17,804,838 $ 15,332,804 $ 39,831,848 $ 41,228,517 $ (10,436,311) $ 26,314,052 $ 31,101,038 $ 37,417,048
Capital gains distributions received . . . . . . . . . . . 0 0 0 0 18,515 399,858 74,972,452 252,626,405 188,845,438 18,948,318 20,228,730 16,843,257 10,268,699 7,927,522 6,358,209
Realized gain (loss) on shares
redeemed . . . . . . . . . . . . . . . . . . . . . . . . . . . 0 0 0 1,463,159 86,063 (62,342) (11,972,627) 12,712,901 27,402,970 (5,121,442) 3,425,308 2,080,576 (3,219,178) 2,714,849 2,277,146
Net change in unrealized gain (loss)
on investments . . . . . . . . . . . . . . . . . . . . . . . . 0 0 0 (379,997) 4,554,260 (1,453,759) (248,117,507) (246,644,445) (58,596,445) (141,197,546) (96,184,606) 91,955,490 (61,523,825) (54,474,725) 18,533,490
NET INCREASE (DECREASE) IN NET
ASSETS RESULTING FROM
OPERATIONS . . . . . . . . . . . . . . . . . . . . . . . . . 4,686,499 6,517,182 4,949,902 9,588,882 12,966,722 (2,160,504) (183,572,595) 36,499,699 172,984,767 (87,538,822) (31,302,051) 100,443,012 (28,160,252) (12,731,316) 64,585,893
CONTRACT OWNER TRANSACTIONS
Contract Owner Net Payments . . . . . . . . . . . . . . 27,534,492 33,271,809 29,999,800 20,475,507 23,708,710 23,078,475 209,889,474 222,204,944 222,112,390 152,653,244 160,739,340 155,685,002 124,589,424 132,066,783 122,128,969
Policy Loans . . . . . . . . . . . . . . . . . . . . . . . . . . . (3,880,970) (2,951,631) (3,827,696) (3,509,028) (2,951,317) (3,188,191) (39,007,160) (44,682,481) (46,925,941) (27,811,107) (32,903,486) (33,487,354) (21,870,768) (24,363,776) (23,665,043)
Policy Loan Repayments and
Interest . . . . . . . . . . . . . . . . . . . . . . . . . . . . . 2,987,045 1,690,948 2,588,192 2,352,792 1,966,848 2,135,135 29,559,815 26,549,494 25,863,007 22,716,426 20,974,631 20,075,111 17,263,176 15,280,452 15,558,408
Surrenders, Withdrawals and Death
Benefits . . . . . . . . . . . . . . . . . . . . . . . . . . . . . (16,502,180) (10,207,810) (11,775,018) (27,437,627) (7,206,907) (8,911,486) (107,153,507) (89,287,653) (94,909,037) (89,055,901) (73,837,706) (67,752,219) (80,372,641) (67,850,819) (64,392,473)
Net Transfers From (To) Other
Subaccounts or Fixed Rate Option . . . . . . . . . . 9,817,151 (13,623,199) 2,629,991 13,343,277 (6,126,033) (138,588) (11,110,043) (93,203,124) (59,651,177) (11,269,057) (64,915,895) (36,216,054) (11,000,589) (60,909,587) (27,102,834)
Withdrawal and Other Charges . . . . . . . . . . . . . . (9,841,971) (8,128,780) (8,860,933) (10,978,673) (9,969,514) (10,654,538) (103,407,621) (110,324,713) (122,798,555) (82,084,813) (89,144,922) (98,917,196) (71,104,797) (76,776,722) (84,858,651)
NET INCREASE (DECREASE) IN NET
ASSETS RESULTING FROM CONTRACT
OWNER TRANSACTIONS . . . . . . . . . . . . . . . . . 10,113,567 51,337 10,754,336 (5,753,752) (578,213) 2,320,807 (21,229,042) (88,743,533) (76,309,313) (34,851,208) (79,088,038) (60,612,710) (42,496,195) (82,553,669) (62,331,624)
TOTAL INCREASE (DECREASE) IN
NET ASSETS . . . . . . . . . . . . . . . . . . . . . . . . . . 14,800,066 6,568,519 15,704,238 3,835,130 12,388,509 160,303 (204,801,637) (52,243,834) 96,675,454 (122,390,030) (110,390,089) 39,830,302 (70,656,447) (95,284,985) 2,254,269
NET ASSETS:
Beginning of year . . . . . . . . . . . . . . . . . . . . . . . 135,003,836 128,435,317 112,731,079 159,663,804 147,275,295 147,114,992 1,561,168,506 1,613,412,340 1,516,736,886 1,390,176,546 1,500,566,635 1,460,736,333 1,033,132,033 1,128,417,018 1,126,162,749
End of year . . . . . . . . . . . . . . . . . . . . . . . . . . . $149,803,902 $135,003,836 $128,435,317 $163,498,934 $159,663,804 $147,275,295 $1,356,366,869 $1,561,168,506 $1,613,412,340 $1,267,786,516 $1,390,176,546 $1,500,566,635 $ 962,475,586 $1,033,132,033 $1,128,417,018
Q:/Pru-SeparateAccounts/88232/—
Prudential–Separate
AccountsFinancialsVULPRU
Op:ron—
f88232_a9a10
ScottPrintingCorporationö(212)962-4405ö(212)943-8970
Friday,April26,20029:49am
SEE NOTES TO FINANCIAL STATEMENTS ON PAGES A15 THROUGH A20
A10
SEE NOTES TO FINANCIAL STATEMENTS ON PAGES A15 THROUGH A20
A9
FINANCIAL STATEMENTS OFTHE VARIABLE UNIVERSAL LIFE SUBACCOUNTS OFTHE PRUDENTIAL VARIABLE APPRECIABLE ACCOUNT

STATEMENTS OF CHANGES IN NET ASSETSFor the years ended December 31, 2001, 2000 and 1999
SUBACCOUNTS SUBACCOUNTS (Continued)
Prudential Prudential Prudential Prudential PrudentialHigh Yield Bond Stock Index Value Global Jennison
Portfolio Portfolio Portfolio Portfolio Portfolio
2001 2000 1999 2001 2000 1999 2001 2000 1999 2001 2000 1999 2001 2000 1999
OPERATIONS
Net investment income (loss) . . . . . . . $ 8,846,802 $ 9,027,708 $ (404,728) $ 2,707,058 $ 1,635,170 $ 3,450,305 $ 4,454,082 $ 7,160,378 $ 7,591,135 $ (705,947) $ 162,513 $ (433,251) $ (2,433,114) $ (3,594,440) $ (1,574,865)
Capital gains distributions received . . . 0 0 0 51,332,600 35,213,342 12,472,929 47,413,973 35,832,915 53,052,638 48,429,909 16,578,985 1,189,193 4,599,398 76,293,654 18,100,277
Realized gain (loss) on shares
redeemed . . . . . . . . . . . . . . . . . . . (1,984,736) (1,139,978) (966,582) 14,703,822 16,646,062 19,189,378 555,997 2,234,121 7,546,600 (7,478,356) 917,015 3,166,922 (8,820,129) 1,403,528 1,956,464
Net change in unrealized gain (loss)
on investments . . . . . . . . . . . . . . . . (7,772,594) (15,147,733) 4,891,833 (196,280,113) (160,730,652) 136,915,479 (66,822,363) 20,197,962 (16,047,855) (83,717,864) (70,915,302) 67,191,804 (96,533,999) (198,113,004) 99,641,732
NET INCREASE (DECREASE) IN NET
ASSETS RESULTING FROM
OPERATIONS . . . . . . . . . . . . . . . . . (910,528) (7,260,003) 3,520,523 (127,536,633) (107,236,078) 172,028,091 (14,398,311) 65,425,376 52,142,518 (43,472,258) (53,256,789) 71,114,668 (103,187,844) (124,010,262) 118,123,608
CONTRACT OWNER TRANSACTIONS
Contract Owner Net Payments . . . . . . 13,869,897 14,981,479 15,705,252 137,075,014 143,813,535 128,537,549 67,102,332 71,330,448 72,746,641 39,726,205 39,422,009 30,573,669 111,015,272 108,600,153 78,282,647
Policy Loans . . . . . . . . . . . . . . . . . . . (1,978,781) (2,126,320) (2,428,091) (22,073,451) (31,788,094) (27,496,074) (12,626,611) (12,152,062) (11,949,900) (5,525,598) (7,601,293) (4,548,965) (13,191,797) (19,316,019) (10,302,874)
Policy Loan Repayments and
Interest . . . . . . . . . . . . . . . . . . . . . 1,582,960 1,428,737 1,801,343 18,345,046 16,352,451 14,533,537 9,238,764 6,794,156 7,032,090 3,646,145 3,673,153 2,204,939 10,310,202 8,402,856 3,885,895
Surrenders, Withdrawals and Death
Benefits . . . . . . . . . . . . . . . . . . . . . (6,304,511) (5,853,422) (6,795,370) (72,921,724) (55,218,390) (53,330,346) (36,169,132) (28,058,562) (28,641,449) (17,174,664) (12,990,958) (8,960,008) (38,427,779) (26,583,880) (17,393,950)
Net Transfers From (To) Other
Subaccounts or Fixed Rate Option . . 508,338 (6,209,425) (7,871,916) (9,290,237) 43,134,926 55,524,073 14,858,828 (31,865,939) (30,030,572) (6,966,843) 60,926,199 8,628,134 (12,719,136) 180,065,121 115,758,631
Withdrawal and Other Charges . . . . . . (6,339,467) (6,624,832) (7,570,585) (63,635,362) (69,977,646) (68,714,043) (35,679,010) (33,187,893) (37,398,609) (16,037,216) (17,867,845) (13,826,989) (42,382,485) (47,004,963) (32,069,991)
NET INCREASE (DECREASE) IN NET
ASSETS RESULTING FROM
CONTRACT OWNER
TRANSACTIONS . . . . . . . . . . . . . . . 1,338,436 (4,403,783) (7,159,367) (12,500,714) 46,316,782 49,054,696 6,725,171 (27,139,852) (28,241,799) (2,331,971) 65,561,265 14,070,780 14,604,277 204,163,268 138,160,358
TOTAL INCREASE (DECREASE) IN
NET ASSETS . . . . . . . . . . . . . . . . . . 427,908 (11,663,786) (3,638,844) (140,037,347) (60,919,296) 221,082,787 (7,673,140) 38,285,524 23,900,719 (45,804,229) 12,304,476 85,185,448 (88,583,567) 80,153,006 256,283,966
NET ASSETS:
Beginning of year . . . . . . . . . . . . . . . 77,442,712 89,106,498 92,745,342 1,006,024,714 1,066,944,010 845,861,223 516,457,559 478,172,035 454,271,316 239,797,100 227,492,624 142,307,176 540,394,561 460,241,555 203,957,589
End of year . . . . . . . . . . . . . . . . . . . $ 77,870,620 $ 77,442,712 $ 89,106,498 $ 865,987,367 $1,006,024,714 $1,066,944,010 $508,784,419 $516,457,559 $478,172,035 $193,992,871 $239,797,100 $227,492,624 $451,810,994 $540,394,561 $460,241,555
Q:/Pru-SeparateAccounts/88232/—
Prudential–Separate
AccountsFinancialsVULPRU
Op:ron—
f88232_a11a12
ScottPrintingCorporationö(212)962-4405ö(212)943-8970
Friday,April26,20029:51am
SEE NOTES TO FINANCIAL STATEMENTS ON PAGES A15 THROUGH A20
A12
SEE NOTES TO FINANCIAL STATEMENTS ON PAGES A15 THROUGH A20
A11
FINANCIAL STATEMENTS OFTHE VARIABLE UNIVERSAL LIFE SUBACCOUNTS OFTHE PRUDENTIAL VARIABLE APPRECIABLE ACCOUNT

STATEMENTS OF CHANGES IN NET ASSETSFor the years ended December 31, 2001, 2000 and 1999
SUBACCOUNTS SUBACCOUNTS (Continued)
T. Rowe Price AIM V.I. Janus Aspen MFS Emerging American CenturyInternational Stock Value Growth Growth Series VP
Portfolio Fund Portfolio Portfolio Value
2001 2000 1999 2001 2000 1999 2001 2000 1999 2001 2000 1999 2001 2000 1999
OPERATIONS
Net investment income (loss) . . . . . . . . . . . $ 14,249 $ 1,600 $ 349 $ (7,315) $ (3,648) $ 449 $ (10,575) $ 21,244 $ (3) $ (6,908) $ (4,451) $ (424) $ 675 $ 57 $ (85)
Capital gains distributions received . . . . . . . 0 20,121 1,792 40,882 56,065 5,479 3,728 68,363 107 72,082 31,841 0 0 4,388 0
Realized gain (loss) on shares
redeemed . . . . . . . . . . . . . . . . . . . . . . . (14,787) 6,356 0 (25,903) 7,979 0 (90,696) 8,468 0 (52,483) 19,917 0 7,745 2,209 0
Net change in unrealized gain (loss)
on investments . . . . . . . . . . . . . . . . . . . . (183,179) (129,440) 28,848 (223,173) (265,995) 43,489 (407,229) (461,183) 73,745 (445,703) (273,214) 106,728 105,697 65,436 (1,710)
NET INCREASE (DECREASE) IN NET
ASSETS RESULTING FROM
OPERATIONS . . . . . . . . . . . . . . . . . . . . . (183,717) (101,363) 30,989 (215,509) (205,599) 49,417 (504,772) (363,108) 73,849 (433,012) (225,907) 106,304 114,117 72,090 (1,795)
CONTRACT OWNER TRANSACTIONS
Contract Owner Net Payments . . . . . . . . . . 604,074 651,285 96,770 1,373,089 1,287,439 309,294 1,805,334 1,854,404 377,988 1,126,041 1,090,388 199,838 832,143 418,662 100,256
Policy Loans . . . . . . . . . . . . . . . . . . . . . . . (9,549) (948) (3,961) (5,117) (5,486) (3,633) (15,805) (3,134) 0 (9,279) (4,132) (3,837) (21,608) 0 0
Policy Loan Repayments and
Interest . . . . . . . . . . . . . . . . . . . . . . . . . 1,112 165 28 2,749 242 28 2,656 70 0 4,309 236 28 278 0 0
Surrenders, Withdrawals and Death
Benefits . . . . . . . . . . . . . . . . . . . . . . . . . (11,390) (3,852) (495) (40,492) (5,979) (513) (88,774) (5,574) (832) (35,185) (3,353) (947) (14,793) (1,619) (526)
Net Transfers From (To) Other
Subaccounts or Fixed Rate Option . . . . . . 6,804 40,079 87,453 29,146 34,533 154,808 43,762 36,035 438,710 (25,915) 62,504 87,988 139,880 (45,524) 828
Withdrawal and Other Charges . . . . . . . . . . (168,945) (112,378) (16,897) (389,519) (247,849) (54,319) (570,150) (463,187) (81,753) (295,919) (225,512) (36,163) (240,062) (101,416) (13,904)
NET INCREASE (DECREASE) IN NET
ASSETS RESULTING FROM CONTRACT
OWNER TRANSACTIONS . . . . . . . . . . . . . 422,106 574,351 162,898 969,856 1,062,900 405,665 1,177,023 1,418,614 734,113 764,052 920,131 246,907 695,838 270,103 86,654
TOTAL INCREASE (DECREASE) IN
NET ASSETS . . . . . . . . . . . . . . . . . . . . . . 238,389 472,988 193,887 754,347 857,301 455,082 672,251 1,055,506 807,962 331,040 694,224 353,211 809,955 342,193 84,859
NET ASSETS:
Beginning of year . . . . . . . . . . . . . . . . . . . 666,875 193,887 0 1,312,383 455,082 0 1,863,468 807,962 0 1,047,435 353,211 0 427,052 84,859 0
End of year . . . . . . . . . . . . . . . . . . . . . . . $ 905,264 $ 666,875 $ 193,887 $ 2,066,730 $ 1,312,383 $ 455,082 $ 2,535,719 $ 1,863,468 $ 807,962 $ 1,378,475 $ 1,047,435 $ 353,211 $ 1,237,007 $ 427,052 $ 84,859
Q:/Pru-SeparateAccounts/88232/—
Prudential–Separate
AccountsFinancialsVULPRU
Op:ron—
f88232_a13a14
ScottPrintingCorporationö(212)962-4405ö(212)943-8970
Friday,April26,20029:58am
SEE NOTES TO FINANCIAL STATEMENTS ON PAGES A15 THROUGH A20
A14
SEE NOTES TO FINANCIAL STATEMENTS ON PAGES A15 THROUGH A20
A13
FINANCIAL STATEMENTS OFTHE VARIABLE UNIVERSAL LIFE SUBACCOUNTS OFTHE PRUDENTIAL VARIABLE APPRECIABLE ACCOUNT
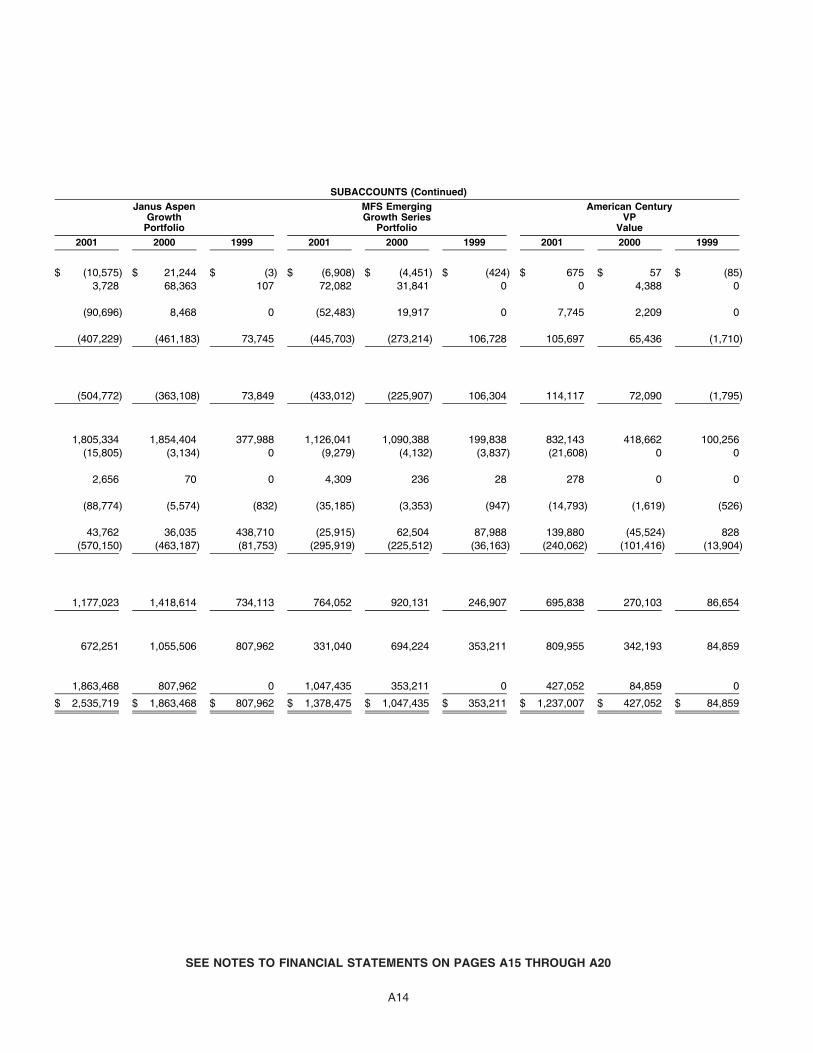
STATEMENTS OF CHANGES IN NET ASSETSFor the years ended December 31, 2001, 2000 and 1999
SUBACCOUNTS SUBACCOUNTS (Continued)
T. Rowe Price AIM V.I. Janus Aspen MFS Emerging American CenturyInternational Stock Value Growth Growth Series VP
Portfolio Fund Portfolio Portfolio Value
2001 2000 1999 2001 2000 1999 2001 2000 1999 2001 2000 1999 2001 2000 1999
OPERATIONS
Net investment income (loss) . . . . . . . . . . . $ 14,249 $ 1,600 $ 349 $ (7,315) $ (3,648) $ 449 $ (10,575) $ 21,244 $ (3) $ (6,908) $ (4,451) $ (424) $ 675 $ 57 $ (85)
Capital gains distributions received . . . . . . . 0 20,121 1,792 40,882 56,065 5,479 3,728 68,363 107 72,082 31,841 0 0 4,388 0
Realized gain (loss) on shares
redeemed . . . . . . . . . . . . . . . . . . . . . . . (14,787) 6,356 0 (25,903) 7,979 0 (90,696) 8,468 0 (52,483) 19,917 0 7,745 2,209 0
Net change in unrealized gain (loss)
on investments . . . . . . . . . . . . . . . . . . . . (183,179) (129,440) 28,848 (223,173) (265,995) 43,489 (407,229) (461,183) 73,745 (445,703) (273,214) 106,728 105,697 65,436 (1,710)
NET INCREASE (DECREASE) IN NET
ASSETS RESULTING FROM
OPERATIONS . . . . . . . . . . . . . . . . . . . . . (183,717) (101,363) 30,989 (215,509) (205,599) 49,417 (504,772) (363,108) 73,849 (433,012) (225,907) 106,304 114,117 72,090 (1,795)
CONTRACT OWNER TRANSACTIONS
Contract Owner Net Payments . . . . . . . . . . 604,074 651,285 96,770 1,373,089 1,287,439 309,294 1,805,334 1,854,404 377,988 1,126,041 1,090,388 199,838 832,143 418,662 100,256
Policy Loans . . . . . . . . . . . . . . . . . . . . . . . (9,549) (948) (3,961) (5,117) (5,486) (3,633) (15,805) (3,134) 0 (9,279) (4,132) (3,837) (21,608) 0 0
Policy Loan Repayments and
Interest . . . . . . . . . . . . . . . . . . . . . . . . . 1,112 165 28 2,749 242 28 2,656 70 0 4,309 236 28 278 0 0
Surrenders, Withdrawals and Death
Benefits . . . . . . . . . . . . . . . . . . . . . . . . . (11,390) (3,852) (495) (40,492) (5,979) (513) (88,774) (5,574) (832) (35,185) (3,353) (947) (14,793) (1,619) (526)
Net Transfers From (To) Other
Subaccounts or Fixed Rate Option . . . . . . 6,804 40,079 87,453 29,146 34,533 154,808 43,762 36,035 438,710 (25,915) 62,504 87,988 139,880 (45,524) 828
Withdrawal and Other Charges . . . . . . . . . . (168,945) (112,378) (16,897) (389,519) (247,849) (54,319) (570,150) (463,187) (81,753) (295,919) (225,512) (36,163) (240,062) (101,416) (13,904)
NET INCREASE (DECREASE) IN NET
ASSETS RESULTING FROM CONTRACT
OWNER TRANSACTIONS . . . . . . . . . . . . . 422,106 574,351 162,898 969,856 1,062,900 405,665 1,177,023 1,418,614 734,113 764,052 920,131 246,907 695,838 270,103 86,654
TOTAL INCREASE (DECREASE) IN
NET ASSETS . . . . . . . . . . . . . . . . . . . . . . 238,389 472,988 193,887 754,347 857,301 455,082 672,251 1,055,506 807,962 331,040 694,224 353,211 809,955 342,193 84,859
NET ASSETS:
Beginning of year . . . . . . . . . . . . . . . . . . . 666,875 193,887 0 1,312,383 455,082 0 1,863,468 807,962 0 1,047,435 353,211 0 427,052 84,859 0
End of year . . . . . . . . . . . . . . . . . . . . . . . $ 905,264 $ 666,875 $ 193,887 $ 2,066,730 $ 1,312,383 $ 455,082 $ 2,535,719 $ 1,863,468 $ 807,962 $ 1,378,475 $ 1,047,435 $ 353,211 $ 1,237,007 $ 427,052 $ 84,859
Q:/Pru-SeparateAccounts/88232/—
Prudential–Separate
AccountsFinancialsVULPRU
Op:ron—
f88232_a13a14
ScottPrintingCorporationö(212)962-4405ö(212)943-8970
Friday,April26,20029:58am
SEE NOTES TO FINANCIAL STATEMENTS ON PAGES A15 THROUGH A20
A14
SEE NOTES TO FINANCIAL STATEMENTS ON PAGES A15 THROUGH A20
A13
FINANCIAL STATEMENTS OFTHE VARIABLE UNIVERSAL LIFE SUBACCOUNTS OFTHE PRUDENTIAL VARIABLE APPRECIABLE ACCOUNT

NOTES TO FINANCIAL STATEMENTS OFTHE VARIABLE UNIVERSAL LIFE SUBACCOUNTS OF
THE PRUDENTIAL VARIABLE APPRECIABLE ACCOUNTDecember 31, 2001
Note 1: General
The Prudential Variable Appreciable Account (the “Account”) of The Prudential Insurance Company ofAmerica (“Prudential”) was established on August 11, 1987 by a resolution of Prudential’s Board ofDirectors in conformity with insurance laws of the State of New Jersey. The assets of the Account aresegregated from Prudential’s other assets. Proceeds from the purchases of Prudential Variable AppreciableLife (“PVAL”), Prudential Survivorship Preferred (“SVUL”) and Prudential Variable Universal Life (“PVUL”)contracts are invested in the Account.
The Account is registered under the Investment Company act of 1940, as amended, as a unit investmenttrust. The Account is a funding vehicle for individual variable life insurance contracts. Each contract offersthe option to invest in various subaccounts, each of which invests in either a corresponding portfolio of ThePrudential Series Fund, Inc. (the “Series fund”) or one of the non-Prudential administered funds. Optionsavailable to the VUL contracts which invest in a corresponding portfolio of the Series Fund are: PrudentialMoney Market Portfolio, Prudential Diversified Bond Portfolio, Prudential Equity Portfolio, PrudentialFlexible Managed Portfolio, Prudential Conservative Balanced Portfolio, Prudential High Yield BondPortfolio, Prudential Stock Index Portfolio, Prudential Value Portfolio, Prudential Global Portfolio, PrudentialJennison Portfolio. Options available to the VUL contracts which invest in a corresponding portfolio of thenon-Prudential administered funds are: T. Rowe Price International Stock Portfolio, AIM V.I. Value Portfolio,Janus Aspen Growth Portfolio, MFS Emerging Growth Series, American Century VP Value Fund.
The Series fund is a diversified open-end management investment company, and is managed by Prudential.
Note 2: Significant Accounting Policies
The accompanying financial statements are prepared in conformity with accounting principles generallyaccepted in the United States of America (“GAAP”). The preparation of the financial statements inconformity with GAAP requires management to make estimates and assumptions that affect the reportedamounts and disclosures. Actual results could differ from those estimates.
Investments—The investments in shares of the Series Fund or the non-Prudential administered funds arestated at the net asset values of the respective portfolios, which value their investment securities at fairvalue..
Security Transactions—Realized gains and losses on security transactions are reported on an average costbasis. Purchase and sale transactions are recorded as of the trade date of the security being purchasedor sold.
Distributions Received—Dividend and capital gain distributions received are reinvested in additional sharesof the Series Fund or the non-Prudential administered funds and are recorded on the ex-dividend date.
A15

Note 3: Investment Information for The Prudential Variable Appreciable Account
The net asset value per share for each portfolio of the Series Fund or the non-Prudential administered funds,the number of shares (rounded) of each portfolio held by the subaccounts and the aggregate cost ofinvestments in such shares at December 31, 2001 were as follows:
PORTFOLIOS
Prudential Prudential Prudential PrudentialMoney Diversified Prudential Flexible ConservativeMarket Bond Equity Managed BalancedPortfolio Portfolio Portfolio Portfolio Portfolio
Number of shares (rounded): 14,980,390 14,392,513 66,196,529 85,719,169 70,305,010
Net asset value per share: $ 10.00 $ 11.36 $ 20.49 $ 14.79 $ 13.69
Cost: $149,803,902 $159,403,802 $1,638,550,300 $1,422,830,400 $1,039,035,686
PORTFOLIOS (Continued)
Prudential PrudentialHigh Yield Stock Prudential Prudential Prudential
Bond Index Value Global JennisonPortfolio Portfolio Portfolio Portfolio Portfolio
Number of shares (rounded): 14,420,485 27,370,018 28,407,840 12,687,565 24,330,156
Net asset value per share: $ 5.40 $ 31.64 $ 17.91 $ 15.29 $ 18.57
Cost: $105,352,732 $672,627,470 $ 515,238,599 $ 251,767,455 $ 590,108,345
PORTFOLIOS (Continued)
T. Rowe PriceInternational AIM V.I. Janus MFS American
Stock Value Aspen Growth Emerging Century VPPortfolio Fund Portfolio Growth Series Value Fund
Number of shares (rounded): 78,924 88,511 127,487 76,667 166,264
Net asset value per share: $ 11.47 $ 23.35 $ 19.89 $ 17.98 $ 7.44
Cost: $ 1,189,035 $ 2,512,409 $ 3,330,386 $ 1,990,664 $ 1,067,584
A16

Note 4: Charges and Expenses
A. Mortality Risk and Expense Risk Charges
The mortality risk and expense risk charges, at an effective annual rates of up to 0.90% are applieddaily against the net assets of PVAL, SVUL and PVUL contract owners held in each subaccount.Mortality risk is that contract owners may not live as long as estimated and expense risk is that thecost of issuing and administering the policies may exceed related charges by Prudential. Prudentialcurrently intends to charge only 0.60% on PVAL contracts with face amounts of $100,000 or more andfor PVUL contracts but reserves the right to make the full 0.90% charge.
B. Deferred Sales Charge
A deferred sales charge is imposed upon surrenders of certain variable life insurance contracts tocompensate Prudential for sales and other marketing expenses. The amount of any sales charge willdepend on the number of years that have elapsed since the contract was issued. No sales charge willbe imposed after the tenth year of the contract. No sales charge will be imposed on death benefits.
C. Partial Withdrawal Charge
A charge is imposed by Prudential on partial withdrawals of the cash surrender value. A charge equal tothe lesser of $25 or 2% for SVUL and VUL and $15 or 2% for PVAL will be made in connection witheach partial withdrawal of the cash surrender value of a contract.
D. Cost of Insurance and Other Related Charges
Contract owner contributions are subject to certain deductions prior to being invested in the Account.The deductions are for (1) transaction costs which are deducted from each premium payment forPVAL and VUL, to cover premium collection and processing costs; (2) state premium taxes; and (3)sales charges which are deducted in order to compensate Prudential for the cost of selling thecontract. Contracts are also subject to monthly charges for the costs of administering the contract andto compensate Prudential for the guaranteed minimum death benefit risk.
Note 5: Taxes
Prudential is taxed as a “life insurance company” as defined by the Internal Revenue Code. The resultsof operations of the Account form a part of Prudential’s consolidated federal tax return. Under currentfederal law, no federal income taxes are payable by the Account. As such, no provision for tax liabilityhas been recorded in these financial statements.
A17

Note 6: Unit Activity
Transactions in units (including transfers among subaccounts) for the years ended December 31, 2001,2000, and 1999 were as follows:
SUBACCOUNTS
Prudential PrudentialMoney Market Diversified Bond
Portfolio Portfolio
2001 2000 1999 2001 2000 1999
Contract Owner Contributions: 105,091,671 114,194,561 120,477,063 18,552,419 14,105,601 22,216,255
Contract Owner Redemptions : (98,974,223) (113,537,294) (114,736,198) (20,248,087) (14,109,854) (20,070,222)
SUBACCOUNTS (Continued)
Prudential PrudentialEquity Flexible ManagedPortfolio Portfolio
2001 2000 1999 2001 2000 1999
Contract Owner Contributions: 50,172,529 55,966,094 60,448,440 46,753,155 51,084,427 55,689,347
Contract Owner Redemptions : (53,678,358) (71,783,274) (74,869,027) (56,876,097) (72,728,803) (72,365,779)
SUBACCOUNTS (Continued)
Prudential PrudentialConservative Balanced High Yield Bond
Portfolio Portfolio
2001 2000 1999 2001 2000 1999
Contract Owner Contributions: 44,140,060 48,304,976 53,724,364 26,551,188 9,772,562 19,247,980
Contract Owner Redemptions : (58,485,082) (75,572,311) (74,929,420) (25,743,919) (11,186,778) (22,299,293)
SUBACCOUNTS (Continued)
Prudential PrudentialStock Index ValuePortfolio Portfolio
2001 2000 1999 2001 2000 1999
Contract Owner Contributions: 31,193,542 18,523,899 47,997,403 26,288,127 10,949,452 27,292,681
Contract Owner Redemptions : (32,538,122) (9,320,711) (36,168,261) (23,928,211) (16,366,923) (33,584,226)
SUBACCOUNTS (Continued)
Prudential PrudentialGlobal JennisonPortfolio Portfolio
2001 2000 1999 2001 2000 1999
Contract Owner Contributions: 49,140,870 54,236,060 42,507,388 55,276,289 83,460,460 81,466,185
Contract Owner Redemptions : (50,342,322) (28,429,088) (35,405,377) (49,463,953) (27,512,457) (33,061,952)
SUBACCOUNTS (Continued)
T. Rowe PriceInternational Stock AIM V.I.
Portfolio Value Fund
2001 2000 1999 2001 2000 1999
Contract Owner Contributions: 621,120 564,964 156,396 1,010,468 775,493 294,943
Contract Owner Redemptions : (179,834) (119,526) (17,697) (313,309) (169,319) (42,273)
A18

Note 6: Unit Activity (Continued)
SUBACCOUNTS (Continued)
Janus Aspen MFS EmergingGrowth Growth SeriesPortfolio Portfolio
2001 2000 1999 2001 2000 1999
Contract Owner Contributions: 1,349,084 925,017 440,125 763,094 500,468 159,851
Contract Owner Redemptions : (484,287) (257,420) (51,287) (258,271) (128,093) (22,481)
SUBACCOUNTS (Continued)
AmericanCentury VPValue Fund
2001 2000 1999
Contract Owner Contributions: 679,994 376,232 86,847
Contract Owner Redemptions : (172,110) (130,226) (11,972)
Note 7: Purchases and Sales of Investments
The aggregate costs of purchases and proceeds from sales of investments in the Series Fund and the non-Prudential administered fund for the year ended December 31, 2001 were as follows:
PORTFOLIOS
Prudential Prudential Prudential PrudentialMoney Diversified Prudential Flexible ConservativeMarket Bond Equity Managed BalancedPortfolio Portfolio Portfolio Portfolio Portfolio
Purchases . . . . . . . . . . . . . . . $ 119,592,728 $ 17,909,916 $ 56,285,702 $ 26,864,265 $ 17,435,883
Sales . . . . . . . . . . . . . . . . . . $ (110,483,982) $ (24,818,260) $ (87,748,376) $ (71,028,922) $ (67,214,182)
PORTFOLIOS (Continued)
Prudential PrudentialHigh Yield Stock Prudential Prudential Prudential
Bond Index Value Global JennisonPortfolio Portfolio Portfolio Portfolio Portfolio
Purchases . . . . . . . . . . . . . . . . $ 26,431,494 $ 39,362,990 $ 38,739,750 $ 52,785,875 $ 47,166,755
Sales . . . . . . . . . . . . . . . . . . . $ (25,673,415) $ (58,285,091) $ (35,573,088) $ (56,558,625) $ (35,791,678)
PORTFOLIOS (Continued)
MFST. Rowe Price Janus Emerging AmericanInternational AIM V.I. Aspen Growth Century
Stock Value Growth Series VP ValuePortfolio Fund Portfolio Portfolio Fund
Purchases . . . . . . . . . . . . . . . . $ 485,116 $ 1,117,633 $ 1,522,008 $ 908,694 $ 777,451
Sales . . . . . . . . . . . . . . . . . . . $ (67,564) $ (157,785) $ (357,051) $ (151,550) $ (86,266)
Note 8: Related Party Transactions
Prudential has purchased multiple PVAL contracts insuring the lives of certain employees. Prudential is theowner and beneficiary of the contracts. There were no net premium payments for the year ended December31, 2001. Equity of contracts owners in the Flexible Managed subaccount at December 31, 2001 includesapproximately $241 million owned by Prudential.
Prudential and its affiliates perform various services on behalf of the mutual fund company that administersthe Series Fund in which the Account invests and may receive fees for the services performed. Theseservices include, among other things, shareholder communications, preparation, postage, fund transferagency and various other record keeping and customer service functions.
A19

Note 9: Financial Highlights
Prudential sells a number of variable life insurance products that are funded by the Account. These productshave unique combinations of features and fees that are charged against the contract owner’s accountbalance. Differences in the fee structures result in a variety of unit values, expense ratios and total returns.
The following table was developed by determining which products offered by the Prudential and funded bythe Account have the lowest and highest total return. Only product designs within each subaccount that hadunits outstanding throughout the respective periods were considered when determining the lowest andhighest return. The summary may not reflect the minimum and maximum contract charges offered byPrudential as contract owners may not have selected all available and applicable contract options asdiscussed in note 1.
At December 31, 2001 For the year ended December 31, 2001
InvestmentUnits Net Assets Income Expense Total(000s) Unit Fair Value (000s) Ratio* Ratio** Return***
Prudential Money Market Portfolio . . . . . . . . . . 83,793 $1.25552 to $1.89767 149,804 3.97% 0.60% to 0.90% 3.17% to 3.48%
Prudential Diversified Bond Portfolio . . . . . . . . . 65,406 $1.31342 to $2.65097 163,499 6.00% 0.60% to 0.90% 6.03% to 6.34%
Prudential Equity Portfolio. . . . . . . . . . . . . . . . 298,796 $1.37832 to $4.72760 1,356,367 0.83% 0.60% to 0.90% –11.97% to –11.71%
Prudential Flexible Managed Portfolio . . . . . . . . 390,792 $1.26663 to $3.31989 1,267,787 3.76% 0.60% to 0.90% –6.52% to –6.24%
Prudential Conservative Balanced Portfolio . . . . 341,217 $1.28828 to $2.89478 962,476 3.40% 0.60% to 0.90% –2.89% to –2.60%
Prudential High Yield Bond Portfolio . . . . . . . . . 37,842 $1.03945 to $2.39981 77,871 11.77% 0.60% to 0.90% –1.32% to –1.03%
Prudential Stock Index Portfolio . . . . . . . . . . . . 174,445 $1.60022 to $5.33848 865,987 1.00% 0.60% to 0.90% –12.83% to –12.57%
Prudential Value Portfolio . . . . . . . . . . . . . . . . 105,682 $1.68979 to $5.06872 508,784 1.58% 0.60% to 0.90% –2.94% to –2.66%
Prudential Global Portfolio . . . . . . . . . . . . . . . 113,393 $1.33447 to $1.73500 193,993 0.35% 0.60% to 0.90% –18.35% to –18.10%
Prudential Jennison Portfolio . . . . . . . . . . . . . . 191,014 $1.66508 to $2.39981 451,811 0.17% 0.60% to 0.90% –18.98% to –18.74%
T. Rowe Price International Stock Portfolio . . . . . 1,025 $0.88282 905 2.44% 0.60% to 0.60% –22.67% to –22.67%
AIM VI Value Fund . . . . . . . . . . . . . . . . . . . . 1,556 $1.32823 2,067 0.16% 0.60% to 0.60% –13.08% to –13.08%
Janus Aspen Growth Portfolio . . . . . . . . . . . . . 1,921 $1.31984 2,536 0.07% 0.60% to 0.60% –25.18% to –25.18%
MFS Emerging Growth Series Portfolio . . . . . . . 1,015 $1.35868 1,378 0.00% 0.60% to 0.60% –33.88% to –33.88%
American Century VP Value Fund . . . . . . . . . . 829 $1.49259 1,237 0.68% 0.60% to 0.60% 12.15% to 12.15%
* These amounts represent the dividends, excluding distributions of capital gains, received by the subaccount from the underlying mutual fund, net
of management fees assessed by the fund manager, divided by the average net assets. This ratio excludes those expenses, such as mortality
and expense charges, that result in direct reductions in the unit values. The recognition of investment income by the subaccount is affected by the
timing of the declaration of dividends by the underlying fund in which the subaccounts invest.
** These ratios represent the annualized contract expenses of the separate account, consisting primarily of mortality and expense charges, for each
period indicated. The ratios include only those expenses that result in a direct reduction to unit values. Charges made directly to contract owner
accounts through the redemption of units and expenses of the underlying fund are excluded.
*** These amounts represent the total return for the periods indicated, including changes in the value of the underlying fund, and reflect deductions
for all items included in the expense ratio. The total return does not include any expenses assessed through the redemption of units; inclusion of
these expenses in the calculation would result in a reduction in the total return presented.
A20

REPORT OF INDEPENDENT ACCOUNTANTS
To the Contract Owners of theVariable Universal Life Subaccounts of thePrudential Variable Appreciable Accountand the Board of Directors ofThe Prudential Insurance Company of America
In our opinion, the accompanying statements of net assets and the related statements of operationsand of changes in net assets present fairly, in all material respects, the financial position of each ofthe Variable Universal Life Subaccounts (as defined in Note 1) of the Prudential Variable AppreciableAccount at December 31, 2001, and the results of each of their operations and the changes in each oftheir net assets for each of the periods presented, in conformity with accounting principles generallyaccepted in the United States of America. These financial statements are the responsibility of themanagement of The Prudential Insurance Company of America; our responsibility is to express anopinion on these financial statements based on our audits. We conducted our audits of thesefinancial statements in accordance with auditing standards generally accepted in the United States ofAmerica, which require that we plan and perform the audit to obtain reasonable assurance aboutwhether the financial statements are free of material misstatement. An audit includes examining, on atest basis, evidence supporting the amounts and disclosures in the financial statements, assessing theaccounting principles used and significant estimates made by management, and evaluating the overallfinancial statement presentation. We believe that our audits, which included confirmation of fundshares owned at December 31, 2001 with the transfer agents of the investee mutual funds, provide areasonable basis for our opinion.
PricewaterhouseCoopers LLPNew York, New YorkApril 15, 2002
A21

The Prudential Insurance Company of America Consolidated Statements of Financial Position December 31, 2001 and 2000 (in Millions)
B-1
2001 2000 ASSETS Fixed maturities: Available for sale, at fair value (amortized cost: 2001 - $83,304; 2000 - $83,115) ........... $ 85,586 $ 83,827 Held to maturity, at amortized cost (fair value: 2001 - $0; 2000 - $12,615) ...................... — 12,448Trading account assets, at fair value ........................................................................................... 882 7,217Equity securities, available for sale, at fair value (cost: 2001 - $992; 2000 - $2,266)............... 1,069 2,317Commercial loans........................................................................................................................ 14,909 15,919Policy loans ................................................................................................................................. 7,930 8,046Securities purchased under agreements to resell......................................................................... 110 5,395Cash collateral for borrowed securities ....................................................................................... — 3,858Other long-term investments....................................................................................................... 3,824 4,459Short-term investments................................................................................................................ 4,048 5,029 Total investments................................................................................................................. 118,358 148,515 Cash and cash equivalents........................................................................................................... 6,587 7,676Accrued investment income........................................................................................................ 1,551 1,916Broker-dealer related receivables ................................................................................................ — 11,860Deferred policy acquisition costs ................................................................................................ 5,122 7,063Other assets.................................................................................................................................. 5,948 13,506Due from parent and affiliates ..................................................................................................... 5,750 — Separate account assets ............................................................................................................... 76,736 82,217 TOTAL ASSETS ................................................................................................................ $ 220,052 $ 272,753 LIABILITIES AND STOCKHOLDER’S EQUITY LIABILITIES Future policy benefits.................................................................................................................. $ 64,328 $ 67,859Policyholders’ account balances ................................................................................................. 33,525 32,722Unpaid claims and claim adjustment expenses ........................................................................... 1,647 3,549Policyholders’ dividends ............................................................................................................. 1,363 1,463Securities sold under agreements to repurchase.......................................................................... 6,130 15,010Cash collateral for loaned securities ............................................................................................ 4,808 11,053Income taxes payable .................................................................................................................. 1,571 1,610Broker-dealer related payables.................................................................................................... — 5,965Securities sold but not yet purchased.......................................................................................... 108 4,959Short-term debt............................................................................................................................ 3,837 11,131Long-term debt ............................................................................................................................ 2,726 2,502Other liabilities ............................................................................................................................ 7,047 12,105Due to parent and affiliates ......................................................................................................... 363 — Separate account liabilities .......................................................................................................... 76,736 82,217 Total liabilities ...................................................................................................................... 204,189 252,145 COMMITMENTS AND CONTINGENCIES (See Note 18) STOCKHOLDER’S EQUITY Common Stock ($5.00 par value; 1,000 shares authorized, issued and outstanding at December 31, 2001) ...............................................................................
—
—
Additional paid-in capital ............................................................................................................ 14,716 — Accumulated other comprehensive income ............................................................................... 1,099 234Retained earnings ........................................................................................................................ 48 20,374 Total stockholder’s equity.................................................................................................... 15,863 20,608 TOTAL LIABILITIES AND STOCKHOLDER’S EQUITY ........................................ $ 220,052 $ 272,753
See Notes to Consolidated Financial Statements

The Prudential Insurance Company of America
Consolidated Statements of Operations Years Ended December 31, 2001, 2000 and 1999 (in Millions)
B-2
2001 2000 1999
REVENUES Premiums ....................................................................................................................... $ 12,477 $ 10,181 $ 9,528 Policy charges and fee income...................................................................................... 1,803 1,639 1,516 Net investment income.................................................................................................. 9,147 9,497 9,367 Realized investment gains (losses), net ......................................................................... (709) (288) 924 Commissions and other income .................................................................................... 4,451 5,475 5,233 Total revenues ........................................................................................................ 27,169 26,504 26,568 BENEFITS AND EXPENSES Policyholders’ benefits.................................................................................................. 12,752 10,640 10,226 Interest credited to policyholders’ account balances ..................................................... 1,804 1,751 1,811 Dividends to policyholders............................................................................................ 2,722 2,724 2,571 General and administrative expenses ............................................................................ 9,524 10,043 9,530 Capital markets restructuring........................................................................................ — 476 — Sales practices remedies and costs................................................................................ — — 100 Demutualization costs and expenses: Administrative expenses......................................................................................... 248 143 75 Consideration to former Canadian branch policyholders....................................... 340 — — Total benefits and expenses.................................................................................... 27,390 25,777 24,313 INCOME (LOSS) FROM CONTINUING OPERATIONS BEFORE INCOME TAXES ................................................................................................. (221) 727 2,255 Income taxes: Current.................................................................................................................... (921) 434 690 Deferred.................................................................................................................. 863 (28) 352 Total income tax expense (benefit)................................................................. (58) 406 1,042 INCOME (LOSS) FROM CONTINUING OPERATIONS .................................... (163) 321 1,213 DISCONTINUED OPERATIONS Gain (loss) on disposal of healthcare operations, net of taxes ...................................... 16 77 (400) NET INCOME (LOSS)............................................................................................... $ (147) $ 398 $ 813
See Notes to Consolidated Financial Statements
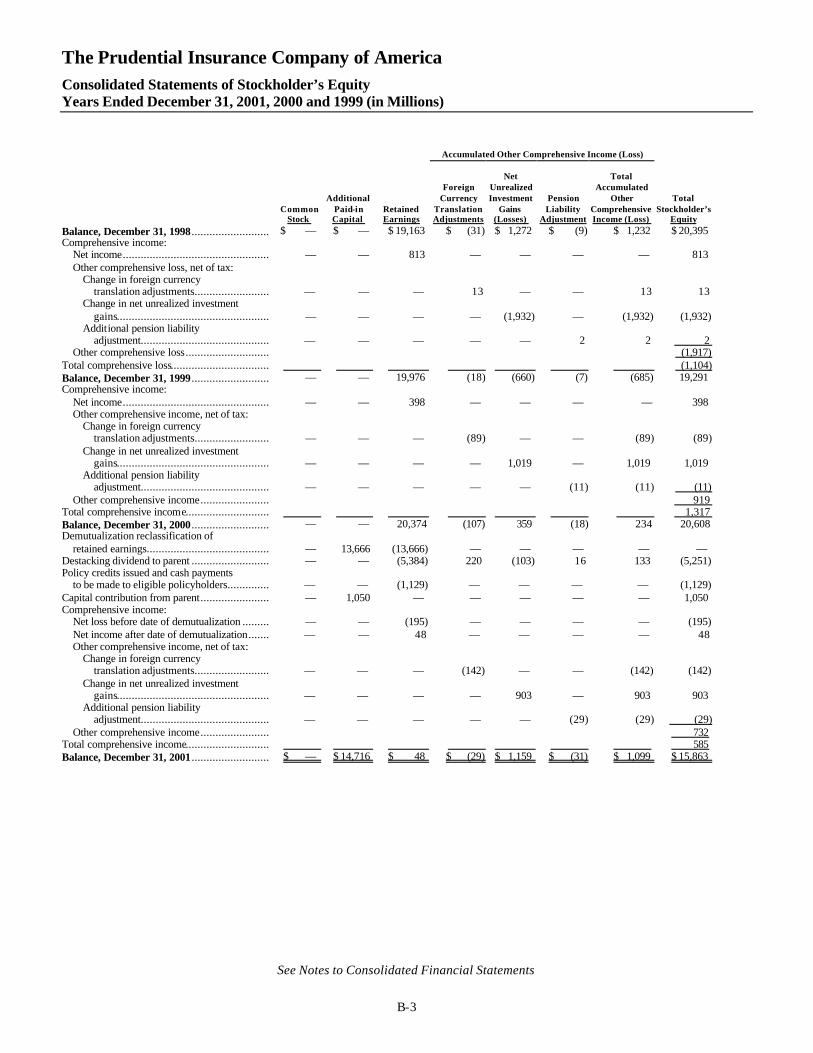
The Prudential Insurance Company of America Consolidated Statements of Stockholder’s Equity Years Ended December 31, 2001, 2000 and 1999 (in Millions)
B-3
Accumulated Other Comprehensive Income (Loss)
Common Stock
Additional Paid-in Capital
Retained Earnings
Foreign Currency
Translation Adjustments
Net
Unrealized Investment
Gains (Losses)
Pension Liability
Adjustment
Total
Accumulated Other
Comprehensive Income (Loss)
Total Stockholder’s
Equity Balance, December 31, 1998 .......................... $ — $ — $ 19,163 $ (31) $ 1,272 $ (9) $ 1,232 $ 20,395 Comprehensive income: Net income................................................. — — 813 — — — — 813 Other comprehensive loss, net of tax: Change in foreign currency translation adjustments.........................
— —
— 13
— — 13 13
Change in net unrealized investment gains...................................................
— —
— —
(1,932) — (1,932) (1,932)
Additional pension liability adjustment...........................................
— —
— —
— 2 2 2
Other comprehensive loss............................ (1,917)Total comprehensive loss................................. (1,104) Balance, December 31, 1999 .......................... — — 19,976 (18) (660) (7) (685) 19,291 Comprehensive income: Net income................................................. — — 398 — — — — 398 Other comprehensive income, net of tax: Change in foreign currency translation adjustments.........................
— —
— (89)
— — (89) (89)
Change in net unrealized investment gains...................................................
— —
— —
1,019 — 1,019 1,019
Additional pension liability adjustment...........................................
— —
— —
— (11) (11) (11)
Other comprehensive income....................... 919 Total comprehensive income............................ 1,317 Balance, December 31, 2000 .......................... — — 20,374 (107) 359 (18) 234 20,608 Demutualization reclassification of retained earnings.........................................
— 13,666
(13,666) —
— — — —
Destacking dividend to parent .......................... — — (5,384) 220 (103) 16 133 (5,251)Policy credits issued and cash payments to be made to eligible policyholders..............
— —
(1,129) —
— — — (1,129)
Capital contribution from parent....................... — 1,050 — — — — — 1,050 Comprehensive income: Net loss before date of demutualization ......... — — (195) — — — — (195) Net income after date of demutualization....... — — 48 — — — — 48 Other comprehensive income, net of tax: Change in foreign currency translation adjustments.........................
— —
— (142)
— — (142) (142)
Change in net unrealized investment gains...................................................
— —
— —
903 — 903 903
Additional pension liability adjustment...........................................
— —
— —
— (29) (29) (29)
Other comprehensive income....................... 732 Total comprehensive income............................ 585 Balance, December 31, 2001 .......................... $ — $ 14,716 $ 48 $ (29) $ 1,159 $ (31) $ 1,099 $ 15,863
See Notes to Consolidated Financial Statements

The Prudential Insurance Company of America Consolidated Statements of Cash Flows Years Ended December 31, 2001, 2000 and 1999 (in Millions)
B-4
2001 2000 1999
CASH FLOWS FROM OPERATING ACTIVITIES Net income (loss)............................................................................................................ $ (147) $ 398 $ 813 Adjustments to reconcile net income (loss) to net cash provided by operating activities: Realized investment (gains) losses, net .......................................................................... 709 288 (915) Policy charges and fee income...................................................................................... (482) (342) (300) Interest credited to policyholders’ account balances........................................................ 1,804 1,751 1,811 Depreciation and amortization, including premiums and discounts................................... 446 740 689 Loss (gain) on disposal of healthcare operations, net of taxes........................................... (16) (77) 400 Change in: Deferred policy acquisition costs............................................................................... (259) (228) (178) Future policy benefits and other insurance liabilities.................................................... 933 1,473 788 Trading account assets.............................................................................................. 2,268 2,524 (853) Income taxes payable............................................................................................... (1,308) 214 933 Broker-dealer related receivables/payables................................................................. 4,538 (388) (1,898) Securities purchased under agreements to resell .......................................................... 974 8,549 (3,692) Cash collateral for borrowed securities....................................................................... (1,407) 3,266 (1,502) Cash collateral for loaned securities........................................................................... (1,571) 278 3,643 Securities sold but not yet purchased.......................................................................... (2,168) (2,009) 1,197 Securities sold under agreements to repurchase........................................................... (2,625) (9,588) 3,112 Due from parent and affiliates................................................................................... (139) — — Other, net................................................................................................................ 3,714 1,016 (3,486) Cash flows from operating activities.................................................................... 5,264 7,865 562 CASH FLOWS FROM INVESTING ACTIVITIES Proceeds from the sale/maturity of: Fixed maturities, available for sale................................................................................ 98,150 99,971 122,790 Fixed maturities, held to maturity.................................................................................. 139 3,266 4,957 Equity securities, available for sale............................................................................... 5,503 3,025 3,190 Commercial loans....................................................................................................... 5,443 1,632 2,640 Other long-term investments........................................................................................ 764 2,044 2,169 Payments for the purchase of: Fixed maturities, available for sale................................................................................ (97,492) (103,086) (124,759) Fixed maturities, held to maturity.................................................................................. (56) (1,544) (2,414) Equity securities, available for sale............................................................................... (2,557) (2,316) (2,779) Commercial loans....................................................................................................... (1,521) (1,334) (2,595) Other long-term investments........................................................................................ (1,307) (1,374) (2,280)Cash acquired from Gibraltar Life..................................................................................... 5,912 — — Short -term investments.................................................................................................... 179 (2,257) (1,138)Due from parent and affiliates.......................................................................................... (5,248) — — Cash flows from (used in) investing activities....................................................... 7,909 (1,973) (219) CASH FLOWS FROM FINANCING ACTIVITIES Policyholders’ account deposits........................................................................................ 6,771 6,813 7,667 Policyholders’ account withdrawals.................................................................................. (9,014) (8,186) (10,531)Net increase (decrease) in short-term debt ......................................................................... (6,098) (2,678) 444 Proceeds from the issuance of long-term debt .................................................................... 1,464 638 1,844 Repayments of long-term debt.......................................................................................... (720) (1,230) (919)Capital contribution from parent....................................................................................... 1,050 — — Cash destacked............................................................................................................... (7,715) — — Cash flows used in financing activities................................................................. (14,262) (4,643) (1,495) NET INCREASE (DECREASE) IN CASH AND CASH EQUIVALENTS ...................... (1,089) 1,249 (1,152) CASH AND CASH EQUIVALENTS, BEGINNING OF YEAR...................................... 7,676 6,427 7,579 CASH AND CASH EQUIVALENTS, END OF YEAR................................................... $ 6,587 $ 7,676 $ 6,427 SUPPLEMENTAL CASH FLOW INFORMATION Income taxes paid (received)............................................................................................ $ 466 $ 248 $ (344) Interest paid................................................................................................................... $ 638 $ 1,040 $ 824 NON-CASH TRANSACTIONS DURING THE YEAR Policy credits issued and demutualization consideration payable to eligible policyholders............................................................................................... $ 1,469
$ — $ —
See Notes to Consolidated Financial Statements
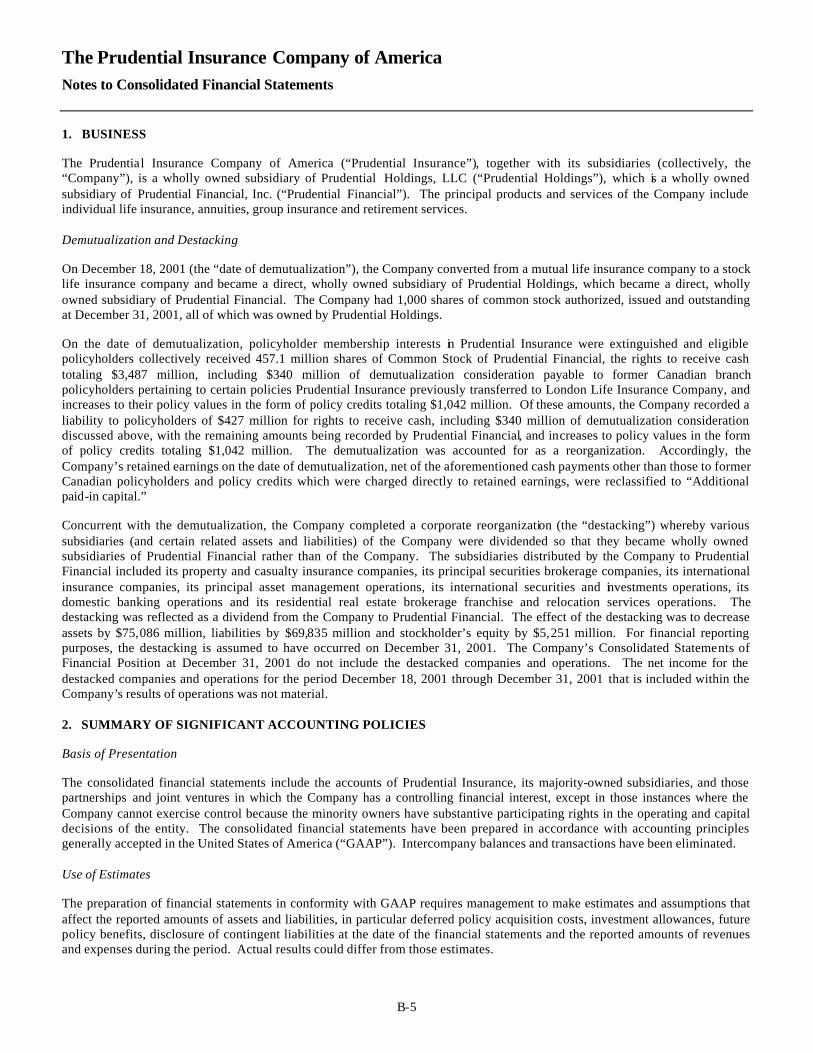
The Prudential Insurance Company of America Notes to Consolidated Financial Statements
B-5
1. BUSINESS The Prudential Insurance Company of America (“Prudential Insurance”), together with its subsidiaries (collectively, the “Company”), is a wholly owned subsidiary of Prudential Holdings, LLC (“Prudential Holdings”), which is a wholly owned subsidiary of Prudential Financial, Inc. (“Prudential Financial”). The principal products and services of the Company include individual life insurance, annuities, group insurance and retirement services. Demutualization and Destacking On December 18, 2001 (the “date of demutualization”), the Company converted from a mutual life insurance company to a stock life insurance company and became a direct, wholly owned subsidiary of Prudential Holdings, which became a direct, wholly owned subsidiary of Prudential Financial. The Company had 1,000 shares of common stock authorized, issued and outstanding at December 31, 2001, all of which was owned by Prudential Holdings. On the date of demutualization, policyholder membership interests in Prudential Insurance were extinguished and eligible policyholders collectively received 457.1 million shares of Common Stock of Prudential Financial, the rights to receive cash totaling $3,487 million, including $340 million of demutualization consideration payable to former Canadian branch policyholders pertaining to certain policies Prudential Insurance previously transferred to London Life Insurance Company, and increases to their policy values in the form of policy credits totaling $1,042 million. Of these amounts, the Company recorded a liability to policyholders of $427 million for rights to receive cash, including $340 million of demutualization consideration discussed above, with the remaining amounts being recorded by Prudential Financial, and increases to policy values in the form of policy credits totaling $1,042 million. The demutualization was accounted for as a reorganization. Accordingly, the Company’s retained earnings on the date of demutualization, net of the aforementioned cash payments other than those to former Canadian policyholders and policy credits which were charged directly to retained earnings, were reclassified to “Additional paid-in capital.” Concurrent with the demutualization, the Company completed a corporate reorganization (the “destacking”) whereby various subsidiaries (and certain related assets and liabilities) of the Company were dividended so that they became wholly owned subsidiaries of Prudential Financial rather than of the Company. The subsidiaries distributed by the Company to Prudential Financial included its property and casualty insurance companies, its principal securities brokerage companies, its international insurance companies, its principal asset management operations, its international securities and investments operations, its domestic banking operations and its residential real estate brokerage franchise and relocation services operations. The destacking was reflected as a dividend from the Company to Prudential Financial. The effect of the destacking was to decrease assets by $75,086 million, liabilities by $69,835 million and stockholder’s equity by $5,251 million. For financial reporting purposes, the destacking is assumed to have occurred on December 31, 2001. The Company’s Consolidated Statements of Financial Position at December 31, 2001 do not include the destacked companies and operations. The net income for the destacked companies and operations for the period December 18, 2001 through December 31, 2001 that is included within the Company’s results of operations was not material. 2. SUMMARY OF SIGNIFICANT ACCOUNTING POLICIES Basis of Presentation The consolidated financial statements include the accounts of Prudential Insurance, its majority-owned subsidiaries, and those partnerships and joint ventures in which the Company has a controlling financial interest, except in those instances where the Company cannot exercise control because the minority owners have substantive participating rights in the operating and capital decisions of the entity. The consolidated financial statements have been prepared in accordance with accounting principles generally accepted in the United States of America (“GAAP”). Intercompany balances and transactions have been eliminated. Use of Estimates The preparation of financial statements in conformity with GAAP requires management to make estimates and assumptions that affect the reported amounts of assets and liabilities, in particular deferred policy acquisition costs, investment allowances, future policy benefits, disclosure of contingent liabilities at the date of the financial statements and the reported amounts of revenues and expenses during the period. Actual results could differ from those estimates.

The Prudential Insurance Company of America Notes to Consolidated Financial Statements 2. SUMMARY OF SIGNIFICANT ACCOUNTING POLICIES (continued)
B-6
Investments Fixed maturities classified as “available for sale” are carried at estimated fair value. Fixed maturities that the Company has both the positive intent and ability to hold to maturity are stated at amortized cost and classified as “held to maturity.” See Note 17 for a discussion of the Company’s reclassificiation of “held to maturity” securities to “available for sale” in connection with the implementation of new accounting standards for derivatives. The amortized cost of fixed maturities is written down to estimated fair value when a decline in value is considered to be other than temporary. See the discussion below on realized investment gains and losses for a description of the accounting for impairment adjustments. Unrealized gains and losses on fixed maturities “available for sale,” net of income tax and the effect on deferred policy acquisition costs and future policy benefits that would result from the realization of unrealized gains and losses, are included in a separate component of equity, “Accumulated other comprehensive income (loss).” Trading account assets and securities sold but not yet purchased are carried at estimated fair value. Realized and unrealized gains and losses on trading account assets and securities sold but not yet purchased are included in “Commissions and other income.” Equity securities, available for sale, are comprised of common and non-redeemable preferred stock and are carried at estimated fair value. The associated unrealized gains and losses, net of income tax and the effect on deferred policy acquisition costs and future policy benefits that would result from the realization of unrealized gains and losses, are included in “Accumulated other comprehensive income (loss).” See the discussion below on realized investment gains and losses for a description of the accounting for impairment adjustments. Commercial loans are stated primarily at unpaid principal balances, net of unamortized discounts and an allowance for losses. The allowance for losses includes a loan specific reserve for impaired loans and a portfolio reserve for incurred but not specifically identified losses. Impaired loans include those loans for which it is probable that amounts due according to the contractual terms of the loan agreement will not all be collected. Impaired loans are measured at the present value of expected future cash flows discounted at the loan’s effective interest rate, or at the fair value of the collateral if the loan is collateral dependent. Interest received on impaired loans, including loans that were previously modified in a troubled debt restructuring, is either applied against the principal or reported as revenue, according to management’s judgment as to the collectibility of principal. Management discontinues accruing interest on impaired loans after the loans are 90 days delinquent as to principal or interest, or earlier when management has serious doubts about collectibility. When a loan is recognized as impaired, any accrued but uncollectible interest is reversed against interest income of the current period. Generally, a loan is restored to accrual status only after all delinquent interest and principal are brought current and, in the case of loans where the payment of interest has been interrupted for a substantial period, a regular payment performance has been established. The portfolio reserve for incurred but not specifically identified losses considers the Company’s past loan loss experience, the current credit composition of the portfolio, historical credit migration, property type diversification, default and loss severity statistics and other relevant factors. Policy loans are carried at unpaid principal balances. Securities purchased under agreements to resell and securities sold under agreements to repurchase are treated as collateralized financing arrangements and are carried at the amounts at which the securities will be subsequently resold or reacquired, including accrued interest, as specified in the respective agreements. The Company’s policy is to take possession or control of securities purchased under agreements to resell and to value the securities daily. Assets to be repurchased are the same, or substantially the same, as the assets transferred. The market value of securities to be repurchased or resold is monitored, and additional collateral is obtained, where appropriate, to protect against credit exposure. Securities borrowed and securities loaned are treated as financing arrangements and are recorded at the amount of cash advanced or received. With respect to securities loaned, the Company obtains collateral in an amount equal to 102% and 105% of the fair value of the domestic and foreign securities, respectively. The Company monitors the market value of securities borrowed and loaned on a daily basis with additional collateral obtained as necessary. Substantially all of the Company’s securities borrowed transactions are with brokers and dealers, commercial banks and institutional clients. Substantially all of the Company’s securities loaned transactions are with large brokerage firms. Securities repurchase and resale agreements and securities borrowed and loaned transactions are used to generate net investment income and facilitate trading activity. These instruments are short-term in nature (usually 30 days or less) and are collateralized

The Prudential Insurance Company of America Notes to Consolidated Financial Statements 2. SUMMARY OF SIGNIFICANT ACCOUNTING POLICIES (continued)
B-7
principally by U.S. Government and mortgage-backed securities. The carrying amounts of these instruments approximate fair value because of the relatively short period of time between the origination of the instruments and their expected realization. Other long-term investments primarily represent the Company’s investments in joint ventures and limited partnerships in which the Company does not exercise control. Other long-term investments also include investments in the Company’s own separate accounts, which are carried at estimated fair value, investment real estate and derivatives held for purposes other than trading. See Note 17 for a discussion of accounting policies for derivative instruments. Joint venture and partnership interests are generally accounted for using the equity method of accounting, reduced for other than temporary declines in value, except in instances in which the Company’s interest is so minor that it exercises virtually no influence over operating and financial policies. In such instances, the Company applies the cost method of accounting. The Company’s net income from investments in joint ventures and partnerships is generally included in “Net investment income.” However, for certain real estate joint ventures, the Company’s interest is liquidated by means of one or more transactions that result in the sale of the underlying invested assets to third parties and the ultimate distribution of the proceeds to the Company and other joint venture partners in exchange for and settlement of the respective joint venture interests. These transactions are accounted for as disposals of the Company’s joint venture interests and the resulting gains and losses are included in “Realized investment gains (losses), net.” Real estate held for disposal is carried at the lower of depreciated cost or fair value less estimated selling costs and is not further depreciated once classified as such. Real estate which the Company has the intent to hold for the production of income is carried at depreciated cost less any write-downs to fair value for impairment losses and is reviewed for impairment whenever events or circumstances indicate that the carrying value may not be recoverable. An impairment loss is recognized when the review indicates that the carrying value of the investment real estate exceeds the estimated undiscounted future cash flows (excluding interest charges) from the investment. At that time, the carrying value of the investment real estate is written down to fair value. Depreciation on real estate held for the production of income is computed using the straight-line method over the estimated lives of the properties, and is included in “Net investment income.” Short-term investments consist of highly liquid debt instruments with a maturity of greater than three months and less than twelve months when purchased. These investments are carried at amortized cost, which approximates fair value. Realized investment gains (losses), net are computed using the specific identification method. Costs of fixed maturities and equity securities are adjusted for impairments considered to be other than temporary. Impairment adjustments are included in “Realized investment gains (losses), net.” Factors considered in evaluating whether a decline in value is other than temporary are: 1) whether the decline is substantial; 2) the Company’s ability and intent to retain the investment for a period of time sufficient to allow for an anticipated recovery in value; 3) the duration and extent to which the market value has been less than cost; and 4) the financial condition and near-term prospects of the issuer. Provisions for losses on commercial loans are included in “Realized investment gains (losses), net.” Decreases in the carrying value of investment real estate held for disposal or for the production of income are recorded in “Realized investment gains (losses), net.” Cash and Cash Equivalents Cash and cash equivalents include cash on hand, amounts due from banks, money market instruments and other debt issues with a maturity of three months or less when purchased. Deferred Policy Acquisition Costs The costs that vary with and that are related primarily to the production of new insurance and annuity busines s are deferred to the extent such costs are deemed recoverable from future profits. Such costs include commissions, costs of policy issuance and underwriting, and variable field office expenses. Deferred policy acquisition costs (“DAC”) are subject to recoverability testing at the end of each accounting period. Deferred policy acquisition costs, for certain products, are adjusted for the impact of unrealized gains or losses on investments as if these gains or losses had been realized, with corresponding credits or charges included in “Accumulated other comprehensive income (loss).” For participating life insurance, DAC is amortized over the expected life of the contracts (up to 45 years) in proportion to estimated gross margins based on historical and anticipated future experience, which is updated periodically. The average rate of assumed future investment yield used in estimating expected gross margins was 7.28% at December 31, 2001 and gradually increases to 8.06% for periods after December 31, 2031. The effect of changes in estimated gross margins on unamortized deferred acquisition costs is reflected in “General and administrative expenses” in the period such estimated gross margins are

The Prudential Insurance Company of America Notes to Consolidated Financial Statements 2. SUMMARY OF SIGNIFICANT ACCOUNTING POLICIES (continued)
B-8
revised. Policy acquisition costs related to interest-sensitive and variable life products and certain investment-type products are deferred and amortized over the expected life of the contracts (periods ranging from 7 to 30 years) in proportion to estimated gross profits arising principally from investment results, mortality and expense margins, and surrender charges based on historical and anticipated future experience, which is updated periodically. The effect of changes to estimated gross profits on unamortized deferred acquisition costs is reflected in “General and administrative expenses” in the period such estimated gross profits are revised. DAC related to non-participating term insurance is amortized over the expected life of the contracts in proportion to premiums. The Company has offered programs under which policyholders, for a selected product or group of products, can exchange an existing policy or contract issued by the Company for another form of policy or contract. These transactions are known as internal replacements. If policyholders surrender traditional life insurance policies in exchange for life insurance policies that do not have fixed and guaranteed terms, the Company immediately charges to expense the remaining unamortized DAC on the surrendered policies. For other internal replacement transactions, the unamortized DAC on the surrendered policies is immediately charged to expense if the terms of the new policies are not substantially similar to those of the former policies. If the new policies have terms that are substantially similar to those of the earlier policies, the DAC is retained with respect to the new policies and amortized over the life of the new policies. For property and casualty insurance contracts, DAC is amortized over the period in which related premiums are earned. Future investment income is considered in determining the recoverability of DAC. The property and casualty insurance operations were destacked on the date of demutualization as discussed in Note 1. For group life and disability insurance, group annuities and guaranteed investment contracts, acquisition costs are expensed as incurred. Separate Account Assets and Liabilities Separate account assets and liabilities are reported at estimated fair value and represent segregated funds which are invested fo r certain policyholders, pension funds and other customers. The assets consist of common stocks, fixed maturities, real estate related securities, real estate mortgage loans and short-term investments. The assets of each account are legally segregated and are generally not subject to claims that arise out of any other business of the Company. Investment risks associated with market value changes are borne by the customers, except to the extent of minimum guarantees made by the Company with respect to certain accounts. The investment income and gains or losses for separate accounts generally accrue to the policyholders and are not included in the Consolidated Statements of Operations. Mortality, policy administration and surrender charges on the accounts are included in “Policy charges and fee income.” Asset management fees charged to the accounts are included in “Commissions and other income.” Other Assets and Other Liabilities Other assets consist primarily of prepaid benefit costs, reinsurance recoverables, certain restricted assets, trade receivables, property and equipment and receivables resulting from sales of securities that had not yet settled at the balance sheet date. In 2000, other assets also include mortgage securitization inventory and mortgage servicing rights of a subsidiary that was destacked on the date of demutualization. During 2001, the Company sold $1,409 million of commercial mortgage loans and other securities in securitization transactions versus $1,874 million in 2000, through a subsidiary that was destacked on the date of demutualization. The Company did not retain any material ownership interest in the financial assets that were transferred. The Company recognized pretax gains of $42 million in 2001 versus losses of $6 million in 2000 in connection with securitization and related hedging activity which are recorded in “Commissions and other income.” Property and equipment are stated at cost less accumulated depreciation. Depreciation is determined using the straight-line method over the estimated useful lives of the related assets which generally range from 3 to 40 years. Other liabilities consist primarily of trade payables, employee benefit liabilities, demutualization consideration not yet paid to policyholders, and payables resulting from purchases of securities that had not yet settled at the balance sheet date. Contingencies Amounts related to contingencies are accrued if it is probable that a liability has been incurred and an amount is reasonably estimable. Management evaluates whether there are incremental legal or other costs directly associated with the ultimate resolution of the matter that are reasonably estimable and, if so, they are included in the accrual.

The Prudential Insurance Company of America Notes to Consolidated Financial Statements 2. SUMMARY OF SIGNIFICANT ACCOUNTING POLICIES (continued)
B-9
Policyholders’ Dividends The amount of the dividends to be paid to policyholders is determined annually by the Company’s Board of Directors. The aggregate amount of policyholders’ dividends is based on the statutory results and past experience of Prudential Insurance, including investment income, net realized investment gains or losses over a number of years, mortality experience and other factors. See Note 9 for further discussion of the impact of policyholders’ dividends on earnings. Insurance Revenue and Expense Recognition Premiums from life insurance policies, excluding interest-sensitive life contracts, are recognized when due. Benefits are recorded as an expense when they are incurred. A liability for future policy benefits is recorded when premiums are recognized using the net level premium method. Premiums from non-participating group annuities with life contingencies are recognized when earned. For single premium immediate annuities and structured settlements with life contingencies, premiums are recognized when earned in a constant relationship to the amount of expected future benefit payments. Amounts received as payment for interest-sensitive life contracts, deferred annuities, structured settlements, contracts without life contingencies and participating group annuities are reported as deposits to “Policyholders’ account balances.” Revenues from these contracts are reflected in “Policy charges and fee income” and consist primarily of fees assessed during the period against the policyholders’ account balances for mortality charges, policy administration charges and surrender charges. Benefits and expenses for these products include claims in excess of related account balances, expenses of contract administration, interest credited and amortization of DAC. For group life and disability insurance, and property and casualty insurance, premiums are recognized over the period to which the premiums relate in proportion to the amount of insurance protection provided. Claim and claim adjustment expenses are recognized when incurred. The property and casualty insurance operations were destacked on the date of demutualization as discussed in Note 1. Premiums, benefits and expenses are stated net of reinsurance ceded to other companies. Estimated reinsurance recoverables and the cost of reinsurance are recognized over the life of the reinsured policies using assumptions consistent with those used to account for the underlying policies. Foreign Currency Translation Adjustments Assets and liabilities of foreign operations and subsidiaries reported in other than U.S. dollars are translated at the exchange rate in effect at the end of the period. Revenues, benefits and other expenses are translated at the average rate prevailing during the period. The effects of translating the statements of financial position of non-U.S. entities with functional currencies other than the U.S. dollar are included, net of related hedge gains and losses and income taxes, in “Accumulated other comprehensive income (loss).” Commissions and Other Income Commissions and other income principally includes securities and commodities commission revenues and asset management fees which are recognized in the period in which the services are performed. Realized and unrealized gains from trading activities of the Company’s securities business are also included in “Commissions and other income.” The Company’s principal securities brokerage companies, its principal asset management operations and its international securities and investments operations were destacked on the date of demutualization as discussed in Note 1. Derivative Financial Instruments Derivatives are financial instruments whose values are derived from interest rates, foreign exchange rates, financial indices, or the value of securities or commodities. Derivative financial instruments used by the Company include swaps, futures, forwards and option contracts and may be exchange-traded or contracted in the over-the-counter market. See Note 17 for a discussion of the Company’s use of derivative financial instruments and the related accounting and reporting treatment of such instruments.

The Prudential Insurance Company of America Notes to Consolidated Financial Statements 2. SUMMARY OF SIGNIFICANT ACCOUNTING POLICIES (continued)
B-10
Income Taxes The Company and its domestic subsidiaries file a consolidated federal income tax return with Prudential Financial. The Internal Revenue Code (the “Code”) limits the amount of non-life insurance losses that may offset life insurance company taxable income. The Code also imposes an “equity tax” on mutual life insurance companies which, in effect, imputes an additional tax to the Company based on a formula that calculates the difference between stock and mutual life insurance companies’ earnings. Effective for the year ended December 31, 2001, the Company, as a stock company, is no longer subject to the equity tax. The provision for income taxes includes an estimate for changes in the total equity tax to be paid for prior years. Subsidiaries operating outside the United States are taxed under applicable foreign statutes. Deferred income taxes are recognized, based on enacted rates, when assets and liabilities have different values for financial statement and tax reporting purposes. A valuation allowance is recorded to reduce a deferred tax asset to that amount that is expected to be realized. Demutualization Costs and Expenses Demutualization costs and expenses include the cost of engaging external accounting, actuarial, investment banking, legal and other consultants to advise the Company, the New Jersey Department of Banking and Insurance and the New York State Insurance Department in the demutualization process and related matters as well as the cost of printing and postage for communications with policyholders and other administrative costs. Demutualization costs and expenses also include $340 million of demutualization consideration payable to former Canadian branch policyholders pertaining to certain policies that Prudential Insurance transferred to London Life Insurance Company in 1996 in connection with the sale of most of its Canadian branch operations. Under the Plan of Reorganization, these policyholders are required to receive demutualization compensation in the form of cash. New Accounting Pronouncements In September 2000, the Financial Accounting Standards Board (the “FASB”) issued Statement of Financial Accounting Standards (“SFAS”) No. 140, “Accounting for Transfers and Servicing of Financial Assets and Extinguishments of Liabilities—a replacement of FASB Statement No. 125.” The Company has adopted the provisions of SFAS No. 140 relating to transfers and extinguishments of liabilities which are effective for periods occurring after March 31, 2001. The adoption did not have a material effect on the results of operations of the Company. In June 2001, the FASB issued SFAS No. 141, “Business Combinations” and SFAS No. 142, “Goodwill and Other Intangible Assets.” SFAS No. 141 requires that the Company account for all business combinations in the scope of the statement using the purchase method. SFAS No. 142 requires that an intangible asset acquired either individually or with a group of other assets shall initially be recognized and measured based on fair value. An intangible asset with a finite life is amortized over its useful life to the reporting entity; an intangible asset with an indefinite useful life, including goodwill, is not amortized. All indefinite lived intangible assets shall be tested for impairment in accordance with the statement. SFAS No. 142 is effective for fiscal years beginning after December 15, 2001; however, goodwill and intangible assets acquired after June 30, 2001 are subject immediately to the nonamortization and amortization provisions of this statement. The Company has ceased the amortization of goodwill as of January 1, 2002 and believes that the effect of implementing the impairment provisions of this statement will not be material to its results of operations and financial position. In August 2001, the FASB issued SFAS No. 144, “Accounting for the Impairment or Disposal of Long-Lived Assets.” SFAS No. 144 eliminated the requirement that discontinued operations be measured at net realizable value or that entities include losses that have not yet occurred. SFAS No. 144 eliminated the exception to consolidation for a subsidiary for which control is likely to be temporary. SFAS No. 144 requires that long-lived assets that are to be disposed of by sale be measured at the lower of book value or fair value less cost to sell. An impairment for assets that are not to be disposed of is recognized only if the carrying amounts of long-lived assets are not recoverable and exceed their fair values. Additionally, SFAS No. 144 expands the scope of discontinued operations to include all components of an entity with operations and cash flows that (1) can be distinguished from the rest of the entity and (2) will be eliminated from the ongoing operations of the entity in a disposal transaction. SFAS No. 144 is effective for financial statements issued for fiscal years beginning after December 15, 2001 and, generally, its provisions are to be applied prospectively. At the date of adoption of this standard, the impact on results of operations of the Company is not material.

The Prudential Insurance Company of America Notes to Consolidated Financial Statements 2. SUMMARY OF SIGNIFICANT ACCOUNTING POLICIES (continued)
B-11
Reclassifications Certain amounts in prior years have been reclassified to conform to the current year presentation. 3. DISCONTINUED OPERATIONS In December 1998, the Company entered into a definitive agreement to sell its healthcare business to Aetna, Inc. (“Aetna”). The sale was completed on August 6, 1999. The healthcare business is reported as discontinued operations in the accompanying consolidated financial statements. As of December 31, 1998, the measurement date, the Company recorded a loss on disposal of $223 million, net of taxes, which included estimated operating losses of the healthcare business subsequent to December 31, 1998 through the date of the sale, the estimated cost of retained liabilities associated with litigation, as well as estimates of other costs in connection with the disposition of the business. These included facilities closure and systems termination costs, severance and termination benefits, the impact of modifications to pension and benefit plans, payments to Aetna related to the Administrative Services Only business and payments in connection with a medical loss ratio agreement (the “MLR Agreement”). The MLR Agreement provided for payments to Aetna in the event that the medical loss ratios (i.e., incurred medical expense divided by earned premiums) of the sold businesses were less favorable than levels specified in the MLR Agreement for the years 1999 and 2000. The Company retained all liabilities associated with litigation that existed at August 6, 1999 or commenced within two years of that date with respect to claims that were incurred prior to August 6, 1999. The loss on disposal includes management’s best estimate of the cost of the ultimate resolution of such litigation as well as the cost of resolving certain matters pertaining to contractual and regulatory requirements. It is possible that additional adjustments to this estimate may be necessary which might be material to future results of operations of a particular quarterly or annual period. The loss on disposal was increased in 1999 by $400 million, net of taxes, primarily as a result of higher than anticipated healthcare operating losses prior to the August 6, 1999 closing date and an increase in the Company’s estimated obligation under the MLR Agreement. Actual pretax losses of $370 million during that period exceeded the original estimate of $160 million. In 2000, upon the completion of the period covered by the MLR Agreement and taking into consideration other costs incurred compared with those estimated in 1998 and 1999, the Company reduced the loss on disposal by $77 million, net of taxes. In 2001, upon the final settlement of the MLR Agreement, the Company reduced the loss on disposal by an additional $16 million, net of taxes. Pursuant to a coinsurance agreement with Aetna, the Company was required to issue additional policies for new customers in response to proposals made to brokers or customers within six months after the closing date and to renew insurance policies until two years after the closing date. All such additional new and renewal policies were 100% coinsured by Aetna. The purpose of the agreement was to provide for the uninterrupted operation and growth, including renewals of existing policies and issuance of new policies, of the healthcare business that Aetna acquired from Prudential Insurance. The operation of the business and the attendant risks, except for the existence of the MLR Agreement, were assumed entirely by Aetna. Consequently, the following amounts pertaining to the agreement had no effect on the Company’s results of operations. The Company ceded premiums and benefits of $966 million and $827 million, respectively for the year ended December 31, 2001. Premium and benefits ceded for the year ended December 31, 2000 were $1,872 million and $1,418 million, respectively, and for the period from August 6, 1999 through December 31, 1999 were $896 million and $757 million, respectively. Reinsurance recoverable under this agreement, included in “Other assets,” was $202 million at December 31, 2001 and $355 million at December 31, 2000.

The Prudential Insurance Company of America Notes to Consolidated Financial Statements
B-12
4. CAPITAL MARKETS RESTRUCTURING In the fourth quarter of 2000, Prudential Securities Group Inc. exited the lead-managed equity underwriting for corporate issuers and institutional fixed income businesses. Exiting these businesses resulted in staff reductions of approximately 700 positions, 350 of which were eliminated in 2000 and the remainder in 2001. The positions eliminated included investment bankers, traders, analysts and other professional and support staff. Results for 2000 include a pretax charge of $476 million in connection with the restructuring, which is presented as “Capital markets restructuring.” The charge includes $213 million for employee related costs, consisting largely of severance and termination benefits. The charge also includes the write-off of $140 million of goodwill previously recorded in connection with investment banking acquisitions. Remaining charges of $123 million consist of lease termination payments and other facility exit costs, including office equipment and leasehold improvements write-downs, and other related costs. Prudential Securities Group Inc. was destacked on the date of demutualization as discussed in Note 1. 5. ACQUISITION OF KYOEI LIFE INSURANCE COMPANY, LTD. In April 2001, the Company completed the acquisition of Kyoei Life Insurance Co., Ltd. (“Kyoei”), a stock life insurance company located in Japan, which has been accounted for as a purchase. Kyoei was renamed Gibraltar Life Insurance Company, Ltd. (“Gibraltar Life”) by the Company concurrent with the acquisition. Gibraltar Life provides financial services throughout Japan. Gibraltar Life primarily offers four types of insurance products: individual insurance, including life and indemnity health coverage; individual annuities; group life insurance; and group annuities. It distributes these products through an agency force and large employer groups. Gibraltar Life also has domestic and foreign subsidiaries, including non-insurance businesses, which are not material to its financial position or results of operations. On October 20, 2000, Gibraltar Life filed for reorganization under the Reorganization Law of Japan. The Reorganization Law, similar to Chapter 11 of the U.S. Bankruptcy Code, is intended to provide a mechanism for restructuring financially troubled companies by permitting the adjustment of the interests of creditors, shareholders and other interested parties. On October 20, 2000, the Tokyo District Court issued an order generally freezing Gibraltar Life’s assets and appointed an interim Trustee who, on October 23, 2000, was appointed as sole Trustee. On April 2, 2001, the Tokyo District Court issued its official recognition order approving the Reorganization Plan, which was submitted by the Trustee and approved by Gibraltar Life’s creditors. The Reorganization Plan became effective immediately upon the issuance of the recognition order, and is binding upon Gibraltar Life, its creditors, including policyholders, its shareholders and other interested parties, whether or not they submitted claims or voted for or against the plan. The Reorganization Plan included the extinguishment of all existing stock for no consideration and the issuance of 1.0 million new shares of common stock. Pursuant to the Reorganization Plan, on April 19, 2001 the Company contributed ¥50 billion ($395 million) in cash to Gibraltar Life’s capital and on April 20, 2001 received 100% of Gibraltar Life’s newly issued common stock. The Company also provided ¥98 billion ($775 million) to Gibraltar Life in the form of a subordinated loan. On April 23, 2001, the Tokyo District Court declared the reorganization proceedings concluded and dismissed the Trustee.
For purposes of inclusion in the Company’s consolidated financial statements, Gibraltar Life has adopted a November 30 fiscal year end; therefore, the Decemb er 31, 2001 consolidated financial statements include Gibraltar Life’s results of operations for the period April 2, 2001 through November 30, 2001. The Company’s Consolidated Statements of Operations include income from continuing operations before income taxes for Gibraltar Life of $238 million. Gibraltar Life was destacked on the date of demutualization as discussed in Note 1.

The Prudential Insurance Company of America Notes to Consolidated Financial Statements
B-13
6. INVESTMENTS Fixed Maturities and Equity Securities The following tables provide additional information relating to fixed maturities and equity securities (excluding trading account assets) at December 31, 2001
Amortized Cost
Gross Unrealized
Gains
Gross Unrealized
Losses
Estimated Fair
Value (In Millions) Fixed maturities available for sale U.S. Treasury securities and obligations of U.S. government corporations and agencies.................................................................. $ 7,715 $ 192 $ 33
$ 7,874
Obligations of U.S. states and their political subdivisions......................... 711 24 8 727 Foreign government bonds.................................................................... 1,961 199 14 2,146 Corporate securities ............................................................................. 68,130 2,682 898 69,914 Mortgage-backed securities................................................................... 4,787 157 19 4,925 Total fixed maturities available for sale.................................................. $ 83,304 $ 3,254 $ 972 $ 85,586
Equity securities available for sale ...................................................... $ 992 $ 188 $ 111 $ 1,069 2000
Amortized Cost
Gross Unrealized
Gains
Gross Unrealized
Losses
Estimated Fair
Value (In Millions) Fixed maturities available for sale U.S. Treasury securities and obligations of U.S. government corporations and agencies.................................................................. $ 7,068 $ 358 $ 2
$ 7,424
Obligations of U.S. states and their political subdivisions......................... 3,012 164 3 3,173 Foreign government bonds.................................................................... 4,457 228 38 4,647 Corporate securities ............................................................................. 62,066 1,205 1,374 61,897 Mortgage-backed securities................................................................... 6,512 188 14 6,686 Total fixed maturities available for sale.................................................. $ 83,115 $ 2,143 $ 1,431 $ 83,827
Equity securities available for sale ...................................................... $ 2,266 $ 239 $ 188 $ 2,317 2000
Amortized Cost
Gross Unrealized
Gains
Gross Unrealized
Losses
Estimated Fair
Value (In Millions) Fixed maturities held to maturity U.S. Treasury securities and obligations of U.S. government corporations and agencies.................................................................. $ 7 $ — $ —
$ 7
Obligations of U.S. states and their political subdivisions......................... 40 1 1 40 Foreign government bonds.................................................................... 193 13 — 206 Corporate securities ............................................................................. 12,208 343 189 12,362
Total fixed maturities held to maturity.................................................... $ 12,448 $ 357 $ 190 $ 12,615 The amortized cost and estimated fair value of fixed maturities by contractual maturities at December 31, 2001, is shown below:
Available for Sale
Amortized Cost
Estimated Fair
Value
(In Millions) Due in one year or less..................................................................... $ 10,424 $ 10,577 Due after one year through five years................................................. 20,859 21,364 Due after five years through ten years................................................ 20,152 20,676 Due after ten years........................................................................... 27,082 28,044 Mortgage-backed securities............................................................... 4,787 4,925
Total ....................................................................................... $ 83,304 $ 85,586

The Prudential Insurance Company of America Notes to Consolidated Financial Statements 6. INVESTMENTS (continued)
B-14
Actual maturities may differ from contractual maturities because issuers have the right to call or prepay obligations. Proceeds from the repayment of held to maturity fixed maturities during 2001, 2000 and 1999 were $139 million, $3,266 million, and $4,957 million, respectively. Gross gains of $0 million, $8 million, and $73 million were realized on prepayment of held to maturity fixed maturities during 2001, 2000 and 1999, respectively. Proceeds from the sale of available for sale fixed maturities during 2001, 2000 and 1999 were $84,629 million, $93,653 million and $117,685 million, respectively. Proceeds from the maturity of available for sale fixed maturities during 2001, 2000 and 1999 were $13,521 million, $6,318 million and $5,105 million, respectively. Gross gains of $1,270 million, $909 million and $884 million, and gross losses of $1,136 million, $1,408 million and $1,231 million were realized on sales and prepayments of available for sale fixed maturities during 2001, 2000 and 1999, respectively. Realized losses included $356 million in 2001 resulting from the sale of substantially all of the Company’s Enron Corp. holdings. Write-downs for impairments which were deemed to be other than temporary for fixed maturities were $777 million, $540 million and $266 million, and for equity securities were $238 million, $34 million and $205 million for the years ended 2001, 2000 and 1999, respectively. Due to the adoption of SFAS No. 133, “Accounting for Derivative Instruments and Hedging Activities,” on January 1, 2001, the aggregate amortized cost of the securities transferred to the “available for sale” portfolio was $11,937 million. Unrealized investment gains of $94 million, net of tax, were recorded in “Accumulated other comprehensive income (loss)” at the time of the transfer in 2001. Commercial Loans The Company’s commercial loans were as follows at December 31,
2001 2000
Amount (In Millions)
% of Total
Amount
(In Millions)
% of Total
Collateralized loans by property type Office buildings............................................................................... $ 3,548 23.5% $ 3,727 23.1% Retail stores.................................................................................... 2,054 13.6% 2,465 15.3% Residential properties....................................................................... 158 1.0% 713 4.4% Apartment complexes....................................................................... 4,203 27.8% 4,455 27.6% Industrial buildings.......................................................................... 2,685 17.8% 2,331 14.4% Agricultural properties...................................................................... 1,908 12.6% 1,856 11.5% Other.............................................................................................. 555 3.7% 597 3.7% Subtotal of collateralized loans................................................... 15,111 100.0% 16,144 100.0% Valuation allowance......................................................................... (202) (225) Total collateralized loans.................................................................. $ 14,909 $ 15,919
The commercial loans are geographically dispersed throughout the United States and Canada with the largest concentrations in California (27.0%) and New York (10.2%) at December 31, 2001. Activity in the allowance for losses for commercial loans, for the years ended December 31, is summarized as follows:
2001 2000 1999 (In Millions)
Allowance for losses, beginning of year ............................................. $ 225 $ 221 $ 427 Allowance on loans acquired from Gibraltar Life................................ 739 — — Addition (release) of allowance for losses........................................... (24) 17 (201) Charge-offs, net of recoveries............................................................ (412) (13) (5) Change in foreign exchange.............................................................. 7 — — Destacking...................................................................................... (333) — — Allowance for losses, end of year...................................................... $ 202 $ 225 $ 221

The Prudential Insurance Company of America Notes to Consolidated Financial Statements 6. INVESTMENTS (continued)
B-15
Impaired commercial loans identified in management’s specific review of probable loan losses and the related allowance for losses at December 31, are as follows:
2001 2000 (In Millions)
Impaired commercial loans with allowance for losses.......................... $ 155 $ 192 Impaired commercial loans with no allowance for losses...................... 222 247 Allowance for losses, end of year...................................................... (36) (35) Net carrying value of impaired commercial loans................................ $ 341 $ 404 Impaired commercial loans with no allowance for losses are loans in which the fair value of the collateral or the net present value of the loans’ expected future cash flows equals or exceeds the recorded investment. The average recorded investment in impaired loans before allowance for losses was $407 million, $565 million and $884 million for 2001, 2000 and 1999, respectively. Net investment income recognized on these loans totaled $32 million, $37 million and $55 million for the years ended December 31, 2001, 2000 and 1999, respectively. Other Long-term Investments The Company’s “Other long-term investments” include investments in joint ventures and limited partnerships of $2,091 million and $2,391 million at December 31, 2001 and 2000, respectively. These investments include $957 million and $1,363 million in real estate related interests and $1,134 million and $1,028 million in non-real estate related interests at December 31, 2001 and 2000, respectively. The Company’s share of net income from such entities was $84 million, $187 million and $217 million for the years ended 2001, 2000 and 1999, respectively, and is reported in “Net investment income.” Summarized combined financial information for joint ventures and limited partnership interests accounted for under the equity method, in which the Company has an investment of $10 million or greater and an equity interest of 10% or greater, is as follows:
At December 31, 2001 2000
(In Millions) STATEMENTS OF FINANCIAL POSITION Investments in real estate........................................................................ $ 3,603 $ 3,617 Investments in securities......................................................................... 1,694 1,899 Cash and cash equivalents....................................................................... 87 111 Other assets........................................................................................... 208 173 Total assets .......................................................................................... $ 5,592 $ 5,800 Borrowed funds-third party..................................................................... $ 598 $ 598 Borrowed funds-Prudential Financial....................................................... 2 — Other liabilities...................................................................................... 1,399 1,450 Total liabilities ..................................................................................... 1,999 2,048 Partners’ capital .................................................................................. 3,593 3,752 Total liabilities and partners’ capital .................................................... $ 5,592 $ 5,800 Equity in partners’ capital included above................................................ $ 971 $ 1,030 Equity in limited partnership interests not included above.......................... 1,120 1,361 Carrying value..................................................................................... $ 2,091 $ 2,391 For the years ended
December 31, 2001 2000 1999
(In Millions) STATEMENTS OF OPERATIONS Income of real estate joint ventures.......................................................... $ 245 $ 257 $ 102 Income of other limited partnership interests............................................. 142 256 530 Interest expense-third party..................................................................... (31) (31) (7) Other expenses...................................................................................... (251) (226) (121) Net earnings......................................................................................... $ 105 $ 256 $ 504 Equity in net earnings included above...................................................... $ 37 $ 79 $ 122 Equity in net earnings of limited partnership interests not included above.... 47 108 95 Total equity in net earnings .................................................................. $ 84 $ 187 $ 217
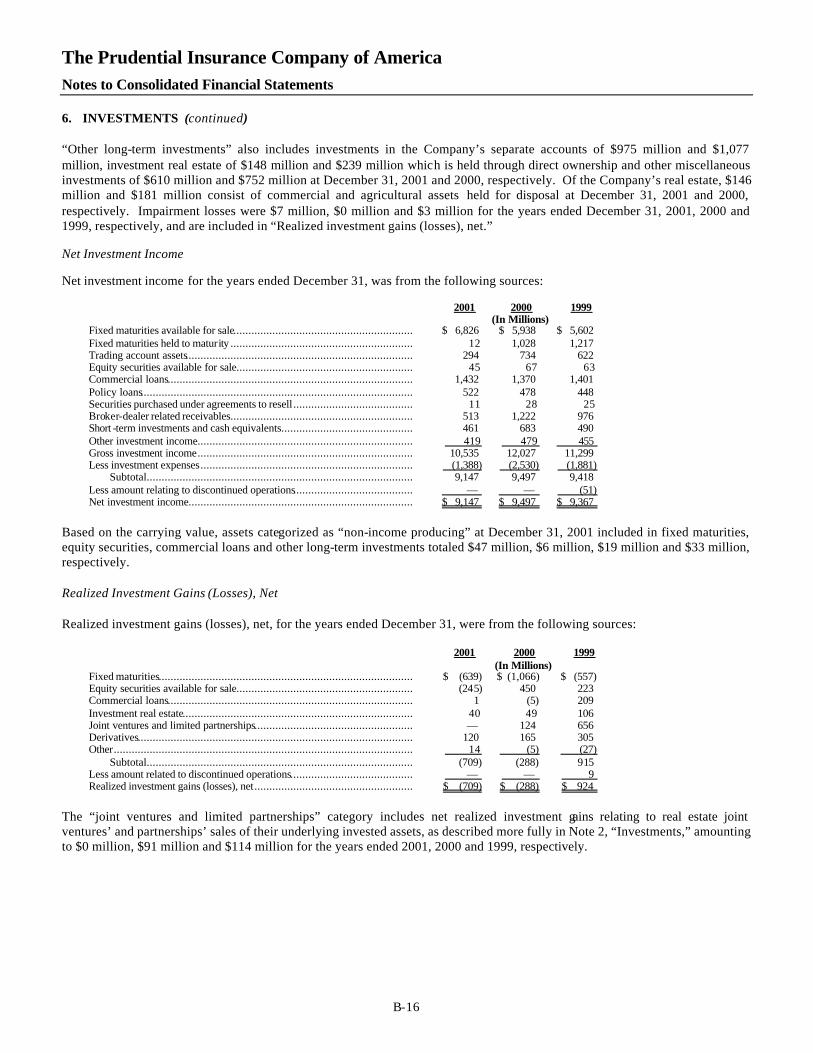
The Prudential Insurance Company of America Notes to Consolidated Financial Statements 6. INVESTMENTS (continued)
B-16
“Other long-term investments” also includes investments in the Company’s separate accounts of $975 million and $1,077 million, investment real estate of $148 million and $239 million which is held through direct ownership and other miscellaneous investments of $610 million and $752 million at December 31, 2001 and 2000, respectively. Of the Company’s real estate, $146 million and $181 million consist of commercial and agricultural assets held for disposal at December 31, 2001 and 2000, respectively. Impairment losses were $7 million, $0 million and $3 million for the years ended December 31, 2001, 2000 and 1999, respectively, and are included in “Realized investment gains (losses), net.” Net Investment Income Net investment income for the years ended December 31, was from the following sources:
2001 2000 1999 (In Millions)
Fixed maturities available for sale............................................................ $ 6,826 $ 5,938 $ 5,602 Fixed maturities held to maturity ............................................................. 12 1,028 1,217 Trading account assets............................................................................ 294 734 622 Equity securities available for sale........................................................... 45 67 63 Commercial loans.................................................................................. 1,432 1,370 1,401 Policy loans........................................................................................... 522 478 448 Securities purchased under agreements to resell ........................................ 11 28 25 Broker-dealer related receivables............................................................. 513 1,222 976 Short -term investments and cash equivalents............................................ 461 683 490 Other investment income........................................................................ 419 479 455 Gross investment income........................................................................ 10,535 12,027 11,299 Less investment expenses....................................................................... (1,388) (2,530) (1,881) Subtotal......................................................................................... 9,147 9,497 9,418 Less amount relating to discontinued operations........................................ — — (51) Net investment income........................................................................... $ 9,147 $ 9,497 $ 9,367 Based on the carrying value, assets categorized as “non-income producing” at December 31, 2001 included in fixed maturities, equity securities, commercial loans and other long-term investments totaled $47 million, $6 million, $19 million and $33 million, respectively. Realized Investment Gains (Losses), Net Realized investment gains (losses), net, for the years ended December 31, were from the following sources:
2001 2000 1999 (In Millions)
Fixed maturities..................................................................................... $ (639) $ (1,066) $ (557) Equity securities available for sale........................................................... (245) 450 223 Commercial loans.................................................................................. 1 (5) 209 Investment real estate............................................................................. 40 49 106 Joint ventures and limited partnerships..................................................... — 124 656 Derivatives............................................................................................ 120 165 305 Other.................................................................................................... 14 (5) (27) Subtotal......................................................................................... (709) (288) 915 Less amount related to discontinued operations......................................... — — 9 Realized investment gains (losses), net..................................................... $ (709) $ (288) $ 924 The “joint ventures and limited partnerships” category includes net realized investment gains relating to real estate joint ventures’ and partnerships’ sales of their underlying invested assets, as described more fully in Note 2, “Investments,” amounting to $0 million, $91 million and $114 million for the years ended 2001, 2000 and 1999, respectively.

The Prudential Insurance Company of America Notes to Consolidated Financial Statements 6. INVESTMENTS (continued)
B-17
Net Unrealized Investment Gains (Losses) Net unrealized investment gains and losses on securities available for sale and certain other long-term investments are included in the Consolidated Statements of Financial Position as a component of “Accumulated other comprehensive income (loss).” Changes in these amounts include reclassification adjustments to exclude from “Other comprehensive income (loss)” those items that are included as part of “Net income” for a period that had been part of “Other comprehensive income (loss)” in earlier periods. The amounts for the years ended December 31, are as follows:
Impact of unrealized investment gains (losses) on:
Unrealized gains
(losses) on investments
Deferred policy
acquisition costs
Future policy
benefits
Deferred income
tax (liability) benefit
Accumulated other
comprehensive income (loss) related to net
unrealized investment
gains (losses) (In Millions)
Balance, December 31, 1998........................................................ $ 3,337 $ (260) $ (1,095) $ (710) $ 1,272 Net investment gains (losses) on investments arising during the period............................................................................. (5,089) — — 1,845 (3,244) Reclassification adjustment for (gains) losses included in net income................................................................................. 404 — — (146) 258 Impact of net unrealized investment (gains) losses on deferred policy acquisition costs.......................................................... — 566 — (213) 353 Impact of net unrealized investment (gains) losses on future policy benefits...................................................................... — — 1,092 (391) 701 Balance, December 31, 1999........................................................ (1,348) 306 (3) 385 (660) Net investment gains (losses) on investments arising during the period............................................................................. 1,458 — — (540) 918 Reclassification adjustment for (gains) losses included in net income................................................................................. 621 — — (230) 391 Impact of net unrealized investment (gains) losses on deferred policy acquisition costs.......................................................... — (356) — 132 (224) Impact of net unrealized investment (gains) losses on future policy benefits...................................................................... — — (101) 35 (66) Balance, December 31, 2000........................................................ 731 (50) (104) (218) 359 Net investment gains (losses) on investments arising during the period............................................................................. 796 — — (294) 502 Reclassification adjustment for (gains) losses included in net income................................................................................. 884 — — (327) 557 Impact of net unrealized investment (gains) losses on deferred policy acquisition costs.......................................................... — (270) — 97 (173) Impact of net unrealized investment (gains) losses on future policy benefits...................................................................... — — 27 (10) 17 Destacking dividend to parent ...................................................... (156) 3 — 50 (103) Balance, December 31, 2001........................................................ $ 2,255 $ (317) $ (77) $ (702) $ 1,159 The table below presents unrealized gains (losses) on investments by asset class:
At December 31, 2001 2000 1999
(In Millions) Fixed maturities.......................................................................... $ 2,282 $ 712 $ (2,118) Equity securities......................................................................... 77 51 733 Other long-term investments........................................................ (104) (32) 37 Unrealized gains (losses) on investments....................................... $ 2,255 $ 731 $ (1,348)
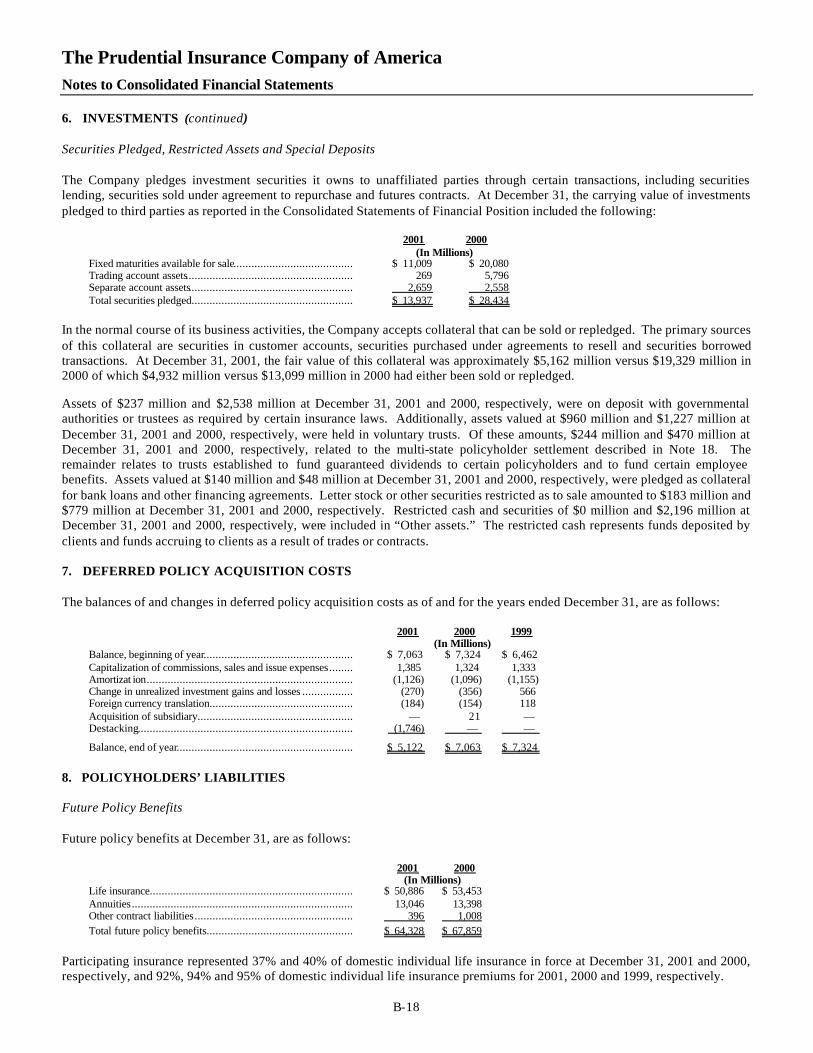
The Prudential Insurance Company of America Notes to Consolidated Financial Statements 6. INVESTMENTS (continued)
B-18
Securities Pledged, Restricted Assets and Special Deposits The Company pledges investment securities it owns to unaffiliated parties through certain transactions, including securities lending, securities sold under agreement to repurchase and futures contracts. At December 31, the carrying value of investments pledged to third parties as reported in the Consolidated Statements of Financial Position included the following:
2001 2000 (In Millions) Fixed maturities available for sale........................................ $ 11,009 $ 20,080 Trading account assets........................................................ 269 5,796 Separate account assets....................................................... 2,659 2,558 Total securities pledged...................................................... $ 13,937 $ 28,434 In the normal course of its business activities, the Company accepts collateral that can be sold or repledged. The primary sources of this collateral are securities in customer accounts, securities purchased under agreements to resell and securities borrowed transactions. At December 31, 2001, the fair value of this collateral was approximately $5,162 million versus $19,329 million in 2000 of which $4,932 million versus $13,099 million in 2000 had either been sold or repledged. Assets of $237 million and $2,538 million at December 31, 2001 and 2000, respectively, were on deposit with governmental authorities or trustees as required by certain insurance laws. Additionally, assets valued at $960 million and $1,227 million at December 31, 2001 and 2000, respectively, were held in voluntary trusts. Of these amounts, $244 million and $470 million at December 31, 2001 and 2000, respectively, related to the multi-state policyholder settlement described in Note 18. The remainder relates to trusts established to fund guaranteed dividends to certain policyholders and to fund certain employee benefits. Assets valued at $140 million and $48 million at December 31, 2001 and 2000, respectively, were pledged as collateral for bank loans and other financing agreements. Letter stock or other securities restricted as to sale amounted to $183 million and $779 million at December 31, 2001 and 2000, respectively. Restricted cash and securities of $0 million and $2,196 million at December 31, 2001 and 2000, respectively, were included in “Other assets.” The restricted cash represents funds deposited by clients and funds accruing to clients as a result of trades or contracts. 7. DEFERRED POLICY ACQUISITION COSTS The balances of and changes in deferred policy acquisition costs as of and for the years ended December 31, are as follows:
2001 2000 1999 (In Millions)
Balance, beginning of year.................................................. $ 7,063 $ 7,324 $ 6,462 Capitalization of commissions, sales and issue expenses........ 1,385 1,324 1,333 Amortizat ion..................................................................... (1,126) (1,096) (1,155) Change in unrealized investment gains and losses ................. (270) (356) 566 Foreign currency translation................................................ (184) (154) 118 Acquisition of subsidiary.................................................... — 21 — Destacking........................................................................ (1,746) — —
Balance, end of year........................................................... $ 5,122 $ 7,063 $ 7,324 8. POLICYHOLDERS’ LIABILITIES Future Policy Benefits Future policy benefits at December 31, are as follows:
2001 2000 (In Millions)
Life insurance.................................................................... $ 50,886 $ 53,453 Annuities.......................................................................... 13,046 13,398 Other contract liabilities..................................................... 396 1,008 Total future policy benefits................................................. $ 64,328 $ 67,859 Participating insurance represented 37% and 40% of domestic individual life insurance in force at December 31, 2001 and 2000, respectively, and 92%, 94% and 95% of domestic individual life insurance premiums for 2001, 2000 and 1999, respectively.

The Prudential Insurance Company of America Notes to Consolidated Financial Statements 8. POLICYHOLDERS’ LIABILITIES (continued)
B-19
Life insurance liabilities include reserves for death and endowment policy benefits, terminal dividends and certain health benefits. Annuity liabilities include reserves for life contingent immediate annuities and life contingent group annuities. Other contract liabilities primarily consist of unearned premium and benefit reserves for group health products. The following table highlights the key assumptions generally utilized in calculating these reserves (excluding consideration of premium deficiency reserves):
Product Mortality Interest Rate Estimation Method Life insurance....................... For Closed Block policies, rates guaranteed in
calculating cash surrender values; for remaining policies, based on company experience or standard industry tables established at policy issue
2.5% to 11.3% Net level premium
Individual annuities............... 1971 IAM, 1983 IAM and A2000 individual
annuity mortality tables with certain modifications based on company experience established at policy issue
3.5% to 13.4% Present value of expected future payments based on historical experience
Group annuities.................... 1951 and 1983 Group Annuity Mortality Tables with certain modifications based on company experience established at policy issue
4.0% to 17.3% Present value of expected future payments based on historical experience
Other contract liabilities........ 2.5% to 11.5% Present value of expected future payments
based on historical experience Premium deficiency reserves are established, if necessary, when the liability for future policy benefits plus the present value of expected future gross premiums are determined to be insufficient to provide for expected future policy benefits and expenses and to recover any unamortized policy acquisition costs. Premium deficiency reserves have been recorded for the group single premium annuity business, which consists of limited-payment, long duration traditional and non-participating annuities; structured settlements and single premium immediate annuities with life contingencies; and for certain individual health policies. Liabilities of $1,867 million and $2,002 million are included in “Future policy benefits” with respect to these deficiencies at December 31, 2001 and 2000, respectively. Policyholders’ Account Balances Policyholders’ account balances at December 31, are as follows:
2001 2000 (In Millions)
Individual annuities........................................................................... $ 5,243 $ 5,097 Group annuities................................................................................ 1,900 2,022 Guaranteed investment contracts and guaranteed interest accounts......... 13,031 12,852 Interest -sensitive life contracts........................................................... 3,788 3,809 Dividend accumulations and other...................................................... 9,563 8,942 Policyholders’ account balances......................................................... $ 33,525 $ 32,722 Policyholders’ account balances for interest-sensitive life and investment-type contracts represent an accumulation of account deposits plus credited interest less withdrawals, expenses and mortality charges.

The Prudential Insurance Company of America Notes to Consolidated Financial Statements 8. POLICYHOLDERS’ LIABILITIES (continued)
B-20
Certain contract provisions that determine the policyholders’ account balances are as follows:
Product Interest Rate Withdrawal/Surrender Charges Individual annuities............................................. 2.5% to 16.0% 0% to 7% for up t o 9 years
Group annuities.................................................. 2.0% to 13.9% Contractually limited or subject to market value
adjustment Guaranteed investment contracts and guaranteed interest accounts.............................
3.0% to 15.4%
Generally, subject to market value withdrawal provisions for any funds withdrawn other than for benefit responsive and contractual payments
Interest -sensitive life contracts............................. 3.0% to 6.8% Various up to 10 years Dividend accumulations and other........................ 2.0% to 11.5%
Generally, not subject to withdrawal/surrender
charges, except for certain contracts where withdrawal/surrender is limited or subject to a market value adjustment
Unpaid Claims and Claim Adjustment Expenses The following table provides a reconciliation of the activity in the liability for unpaid claims and claim adjustment expenses for property and casualty insurance, which includes the Company’s wind-down commercial lines business, primarily environmental and asbestos-related claims, and accident and health insurance at December 31:
2001 2000 1999 Accident
and Health
Property and
Casualty
Accident and
Health
Property and
Casualty
Accident and
Health
Property and
Casualty (In Millions) Balance at January 1............................. $ 1,701 $ 1,848 $ 1,735 $ 2,409 $ 2,307 $ 2,716 Less reinsurance recoverables, net .......... 246 608 378 451 50 533 Net balance at January 1........................ 1,455 1,240 1,357 1,958 2,257 2,183 Incurred related to: Current year..................................... 632 1,440 537 1,271 4,218 1,249 Prior years ....................................... (45) (113) (22) (150) (73) (54) Total incurred....................................... 587 1,327 515 1,121 4,145 1,195 Paid related to: Current year..................................... 219 932 152 842 3,206 700 Prior years ....................................... 312 553 265 634 874 720 Total paid ............................................ 531 1,485 417 1,476 4,080 1,420 Acquisitions (dispositions) (a)................ 15 — — (363) (965) — Destacking........................................... (8) (1,082) — — — — Net balance at December 31................... 1,518 — 1,455 1,240 1,357 1,958 Plus reinsurance recoverables, net........... 129 — 246 608 378 451 Balance at December 31........................ $ 1,647 $ — $ 1,701 $ 1,848 $ 1,735 $ 2,409 (a) The 2001 accident and health increase relates to the acquisition of Gibraltar Life which was subsequently destacked. The reduction in the 2000 property
and casualty balance is primarily attributable to the sale of Gibraltar Casualty Company; the 1999 accident and health reduction relates to the sale of the Company’s healthcare business.
The accident and health reinsurance recoverable balance at December 31, 2001, 2000 and 1999 includes $117 million, $239 million and $371 million, respectively, attributable to the Company’s discontinued healthcare business. The accident and health balance at January 1, 1999 includes $1,026 million attributable to the Company’s discontinued healthcare business. The unpaid claims and claim adjustment expenses presented above include estimates for liabilities associated with reported claims and for incurred but not reported claims based, in part, on the Company’s experience. Changes in the estimated cost to settle unpaid claims are charged or credited to the Consolidated Statements of Operations periodically as the estimates are revised. Accident and health unpaid claims liabilities are discounted using interest rates ranging from 3.5% to 7.5%. The amounts incurred for claims and claim adjustment expenses for property and casualty related to prior years were primarily driven by lower than anticipated losses for the auto line of business. The amounts incurred for claims and claim adjustment expenses for accident and health related to prior years were primarily due to improved long-term disability claim termination experience.

The Prudential Insurance Company of America Notes to Consolidated Financial Statements
B-21
9. CLOSED BLOCK Effective with demutualization, the Company adopted the American Institute of Certified Public Accountants Statement of Position (“SOP”) 00-3, “Accounting by Insurance Enterprises for Demutualizations and Formations of Mutual Insurance Holding Companies and For Certain Long-Duration Participating Contracts.” SOP 00-3 addresses financial statement presentation and accounting for certain participating policies after demutualization, accounting for demutualization expenses, and accounting for retained earnings and other comprehensive income at the date of demutualization. On the date of demutualization, Prudential Insurance established a Closed Block for certain individual life insurance policies and annuities issued by Prudential Insurance in the United States. The Company established a separate closed block for participating individual life insurance policies issued by the Canadian branch of Prudential Insurance. Because of the substantially smaller number of outstanding Canadian policies, this separate closed block is insignificant in size and is not included in the information presented below. The policies included in the Closed Block are specified individual life insurance policies and individual annuity contracts that were in force on the effective date of the Plan of Reorganization and for which Prudential Insurance is currently paying or expects to pay experience-based policy dividends. Assets have been allocated to the Closed Block in an amount that has been determined to produce cash flows which, together with revenues from policies included in the Closed Block, are expected to be sufficient to support obligations and liabilities relating to these policies, including provision for payment of benefits, certain expenses, and taxes and to provide for continuation of the policyholder dividend scales in effect in 2000, assuming experience underlying such scales continues. To the extent that, over time, cash flows from the assets allocated to the Closed Block and claims and other experience related to the Closed Block are, in the aggregate, more or less favorable than what was assumed when the Closed Block was established, total dividends paid to Closed Block policyholders in the future may be greater than or less than the total dividends that would have been paid to these policyholders if the policyholder dividend scales in effect in 2000 had been continued. Any cash flows in excess of amounts assumed will be available for distribution over time to Closed Block policyholders and will not be available to stockholders. If the Closed Block has insufficient funds to make guaranteed policy benefit payments, such payments will be made from assets outside of the Closed Block. The Closed Block will continue in effect as long as any policy in the Closed Block remains in force unless, with the consent of the New Jersey insurance regulator, it is terminated earlier. The recorded assets and liabilities were allocated to the Closed Block at their historical carrying amounts. The excess of Closed Block Liabilities over Closed Block Assets at the effective date of the demutualization (adjusted to eliminate the impact of related amounts in “Accumulated other comprehensive income (loss)”) represents the estimated maximum future earnings from the Closed Block expected to result from operations attributed to the Closed Block after income taxes. As required by SOP 00-3, the Company developed an actuarial calculation of the timing of such maximum future earnings. If actual cumulative earnings in any given period are greater than the expected cumulative earnings, only the expected earnings will be recognized in income. Any excess of actual cumulative earnings over expected cumulative earnings will represent undistributed accumulated earnings attributable to policyholders and will be recorded as a policyholder dividend obligation to be paid to Closed Block policyholders as an additional policyholder dividend unless otherwise offset by future Closed Block performance that is less favorable than originally expected. As of December 31, 2001, no such additional policyholder dividends were recorded. If over such period, the actual cumulative earnings of the Closed Block are less than the expected cumulative earnings of the Closed Block, the Company will recognize only the actual earnings in income. However, the Company may change policyholder dividend scales in the future, which would be intended to increase future actual earnings until the actual cumulative earnings equal the expected cumulative earnings. On November 13, 2001, the Company’s Board of Directors acted to reduce dividends, effective January 1, 2002, on Closed Block policies to reflect unfavorable investment experience that has emerged since July 1, 2000, the date the Closed Block was originally funded. This action resulted in a $104 million reduction of the liability for policyholder dividends recognized in the year ended December 31, 2001.

The Prudential Insurance Company of America Notes to Consolidated Financial Statements 9. CLOSED BLOCK (continued)
B-22
Closed Block Liabilities and Assets designated to the Closed Block at December 31, 2001, as well as maximum future earnings to be recognized from Closed Block Liabilities and Closed Block Assets, are as follows: Closed Block Liabilities and Closed Block Assets December 31, 2001
(In Millions) Closed Block Liabilities Future policy benefits....................................................................... $ 47,239 Policyholders’ dividends payable....................................................... 1,171 Policyholders’ account balances......................................................... 5,389 Other Closed Block liabilities............................................................ 4,603 Total Closed Block Liabilities.................................................... $ 58,402 Closed Block Assets Total investments............................................................................. $ 52,492 Cash................................................................................................ 1,810 Accrued investment income............................................................... 716 Other Closed Block assets................................................................. 635 Total Closed Block Assets......................................................... $ 55,653 Excess of reported Closed Block Liabilities over Closed Block Assets........... $ 2,749 Portion of above representing other comprehensive income.......................... 792 Maximum future earnings to be recognized from Closed Block Assets and Closed Block Liabilities.................................................................. $ 3,541 Closed Block revenues and benefits and expenses for the period from the date of demutualization through December 31, 2001 were as follows:
Closed Block Revenues and Benefits and Expenses
December 18, 2001 through
December 31, 2001 (In Millions)
Revenues Premiums.............................................................................................. $ 293 Net investment income........................................................................... 129 Realized investment gains, net................................................................. 24 Other income......................................................................................... 3 Total Closed Block revenues............................................................... 449 Benefits and Expenses Policyholders’ benefits........................................................................... 288 Interest credited to policyholders’ account balances................................... 5 Dividends to policyholders..................................................................... 100 General and administrative expense charge............................................... 33 Total Closed Block benefits and expenses............................................ 426 Closed Block benefits and expenses, net of Closed Block revenues before income taxes.............................................................. 23 Income taxes............................................................................................. 2 Closed Block benefits and expenses, net of Closed Block revenues and income taxes................................................................................... $ 21 10. REINSURANCE The Company participates in reinsurance in order to provide additional capacity for future growth and limit the maximum net loss potential arising from large risks. Life reinsurance is accomplished through various plans of reinsurance, primarily yearly renewable term and coinsurance. Property and casualty reinsurance is placed on a pro-rata basis and excess of loss, including stop loss, basis. Reinsurance ceded arrangements do not discharge the Company as the primary insurer. Ceded balances would represent a liability of the Company in the event the reinsurers were unable to meet their obligations to the Company under the terms of the reinsurance agreements. Reinsurance premiums, commissions, expense reimbursements, benefits and reserves related to reinsured long-duration contracts are accounted for over the life of the underlying reinsured contracts using assumptions consistent with those used to account for the underlying contracts. The cost of reinsurance related to short-duration contracts is accounted for over the reinsurance contract period. Amounts recoverable from reinsurers, for both short and long-duration reinsurance arrangements, are estimated in a manner consistent with the claim liabilities and policy benefits associated with the reinsured policies.

The Prudential Insurance Company of America Notes to Consolidated Financial Statements 10. REINSURANCE (continued)
B-23
The tables presented below exclude amounts pertaining to the Company’s discontinued healthcare operations. See Note 3 for a discussion of the Company’s coinsurance agreement with Aetna. Reinsurance amounts included in the Consolidated Statements of Operations for the years ended December 31, were as follows:
2001 2000 1999 (In Millions)
Direct premiums...................................................................... $ 13,066 $ 10,686 $ 10,121 Reinsurance assumed............................................................ 95 86 66 Reinsurance ceded................................................................ (684) (591) (659) Premiums................................................................................ $ 12,477 $ 10,181 $ 9,528 Policyholders’ benefits ceded.................................................... $ 845 $ 642 $ 483 Reinsurance recoverables, included in “Other assets” at December 31, were as follows:
2001 2000 (In Millions)
Life insurance.......................................................................... $ 712 $ 674 Property and casualty ............................................................... — 628 Other reinsurance..................................................................... 82 76 Total reinsurance recoverable.................................................... $ 794 $ 1,378 Three major reinsurance companies account for approximately 67% of the reinsurance recoverable at December 31, 2001. The Company periodically reviews the financial condition of its reinsurers and amounts recoverable therefrom in order to minimize its exposure to loss from reinsurer insolvencies, recording an allowance when necessary for uncollectible reinsurance. Reinsurance recoverables, included in “Due from parent and affiliates” and reinsurance payables included in “Due to parent and affiliates” at December 31, 2001, were $309 million and $128 million, respectively. Reinsurance recoverables and payables are due from/to the following companies: Prudential Life Insurance Company of Taiwan Inc., The Prudential Life Insurance Company of Korea, Ltd., The Prudential Life Insurance Company, Ltd., Prumerica Life S.P.A. and The Prumerica Life Insurance Company, Inc. 11. SHORT-TERM AND LONG-TERM DEBT Short-term Debt Short-term debt at December 31, is as follows:
2001 2000 (In Millions)
Commercial paper.................................................................... $ 3,022 $ 7,686 Notes payable.......................................................................... 61 2,728 Current portion of long-term debt .............................................. 754 717 Total short-term debt................................................................ $ 3,837 $ 11,131 The weighted average interest rate on outstanding short-term debt, excluding the current portion of long-term debt, was approximately 4.6% and 6.4% at December 31, 2001 and 2000, respectively. At December 31, 2001, the Company had $4,075 million in committed lines of credit from numerous financial institutions, all of which were unused. These lines of credit generally have terms ranging from one to five years. The Company issues commercial paper primarily to manage operating cash flows and existing commitments, meet working capital needs and take advantage of current investment opportunities. At December 31, 2001 and 2000, a portion of commercial paper borrowings were supported by $4,000 million and $3,500 million of the Company’s existing lines of credit, respectively. At December 31, 2001 and 2000, the weighted average maturity of commercial paper outstanding was 21 and 25 days, respectively.
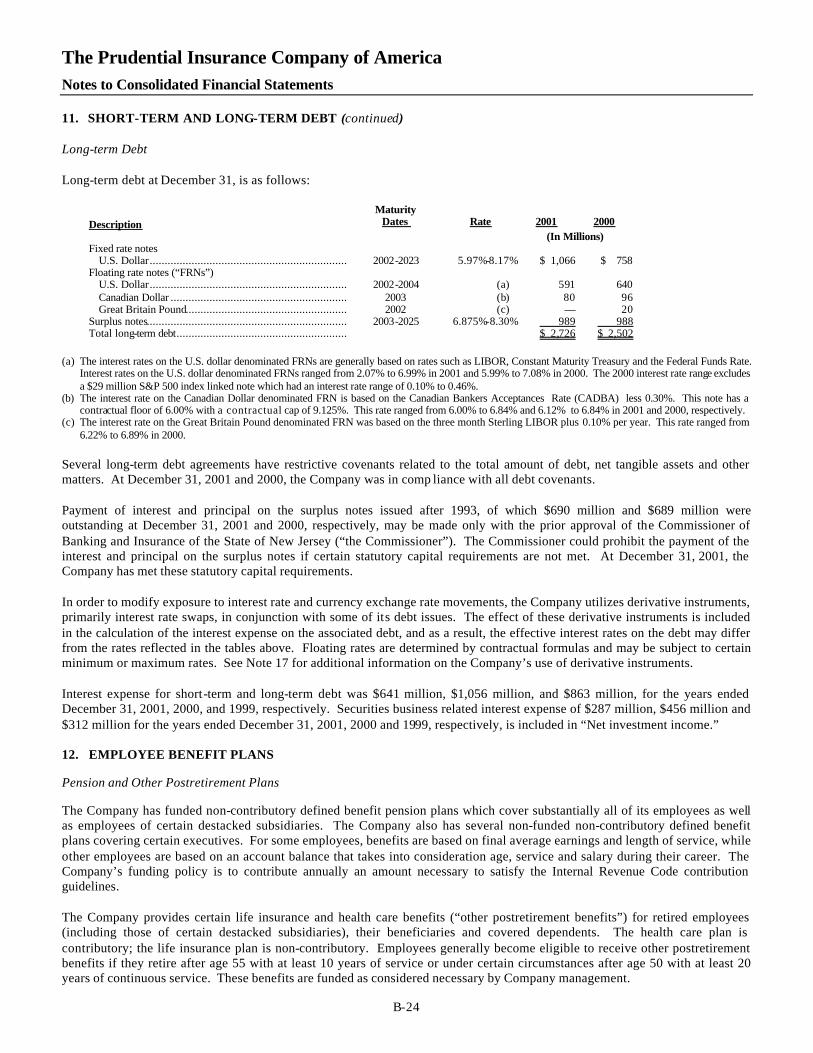
The Prudential Insurance Company of America Notes to Consolidated Financial Statements 11. SHORT-TERM AND LONG-TERM DEBT (continued)
B-24
Long-term Debt Long-term debt at December 31, is as follows: Description
Maturity Dates
Rate
2001
2000
(In Millions) Fixed rate notes U.S. Dollar.................................................................. 2002-2023 5.97%-8.17% $ 1,066 $ 758 Floating rate notes (“FRNs”) U.S. Dollar.................................................................. 2002-2004 (a) 591 640 Canadian Dollar ........................................................... 2003 (b) 80 96 Great Britain Pound...................................................... 2002 (c) — 20 Surplus notes................................................................... 2003-2025 6.875%-8.30% 989 988 Total long-term debt......................................................... $ 2,726 $ 2,502 (a) The interest rates on the U.S. dollar denominated FRNs are generally based on rates such as LIBOR, Constant Maturity Treasury and the Federal Funds Rate.
Interest rates on the U.S. dollar denominated FRNs ranged from 2.07% to 6.99% in 2001 and 5.99% to 7.08% in 2000. The 2000 interest rate range excludes a $29 million S&P 500 index linked note which had an interest rate range of 0.10% to 0.46%.
(b) The interest rate on the Canadian Dollar denominated FRN is based on the Canadian Bankers Acceptances Rate (CADBA) less 0.30%. This note has a contractual floor of 6.00% with a contractual cap of 9.125%. This rate ranged from 6.00% to 6.84% and 6.12% to 6.84% in 2001 and 2000, respectively.
(c) The interest rate on the Great Britain Pound denominated FRN was based on the three month Sterling LIBOR plus 0.10% per year. This rate ranged from 6.22% to 6.89% in 2000.
Several long-term debt agreements have restrictive covenants related to the total amount of debt, net tangible assets and other matters. At December 31, 2001 and 2000, the Company was in comp liance with all debt covenants. Payment of interest and principal on the surplus notes issued after 1993, of which $690 million and $689 million were outstanding at December 31, 2001 and 2000, respectively, may be made only with the prior approval of the Commissioner of Banking and Insurance of the State of New Jersey (“the Commissioner”). The Commissioner could prohibit the payment of the interest and principal on the surplus notes if certain statutory capital requirements are not met. At December 31, 2001, the Company has met these statutory capital requirements. In order to modify exposure to interest rate and currency exchange rate movements, the Company utilizes derivative instruments, primarily interest rate swaps, in conjunction with some of its debt issues. The effect of these derivative instruments is included in the calculation of the interest expense on the associated debt, and as a result, the effective interest rates on the debt may differ from the rates reflected in the tables above. Floating rates are determined by contractual formulas and may be subject to certain minimum or maximum rates. See Note 17 for additional information on the Company’s use of derivative instruments. Interest expense for short-term and long-term debt was $641 million, $1,056 million, and $863 million, for the years ended December 31, 2001, 2000, and 1999, respectively. Securities business related interest expense of $287 million, $456 million and $312 million for the years ended December 31, 2001, 2000 and 1999, respectively, is included in “Net investment income.” 12. EMPLOYEE BENEFIT PLANS Pension and Other Postretirement Plans The Company has funded non-contributory defined benefit pension plans which cover substantially all of its employees as well as employees of certain destacked subsidiaries. The Company also has several non-funded non-contributory defined benefit plans covering certain executives. For some employees, benefits are based on final average earnings and length of service, while other employees are based on an account balance that takes into consideration age, service and salary during their career. The Company’s funding policy is to contribute annually an amount necessary to satisfy the Internal Revenue Code contribution guidelines. The Company provides certain life insurance and health care benefits (“other postretirement benefits”) for retired employees (including those of certain destacked subsidiaries), their beneficiaries and covered dependents. The health care plan is contributory; the life insurance plan is non-contributory. Employees generally become eligible to receive other postretirement benefits if they retire after age 55 with at least 10 years of service or under certain circumstances after age 50 with at least 20 years of continuous service. These benefits are funded as considered necessary by Company management.

The Prudential Insurance Company of America Notes to Consolidated Financial Statements 12. EMPLOYEE BENEFIT PLANS (continued)
B-25
The Company has elected to amortize its transition obligation for other postretirement benefits over 20 years. Prepaid and accrued benefits costs are included in “Other assets” and “Other liabilities,” respectively, in the Company’s Consolidated Statements of Financial Position. The status of these plans as of September 30, adjusted for fourth-quarter activity, is summarized below:
Pension Benefi ts
Other Postretirement Benefits
2001 2000 2001 2000 (In Millions)
Change in benefit obligation Benefit obligation at the beginning of period................................. $ (5,461) $ (5,430) $ (1,996) $ (1,941) Service cost............................................................................... (167) (140) (18) (29) Interest cost............................................................................... (431) (427) (150) (151) Plan participants’ contributions................................................... — — (8) (7) Amendments............................................................................. 6 112 — 221 Acquisitions.............................................................................. (765) — — — Variable annuity purchase........................................................... 232 — — — Actuarial gains (losses)............................................................... (510) 34 (77) (262) Contractual termination benefits.................................................. (1) (17) — — Benefits paid............................................................................. 462 407 152 172 Foreign currency changes........................................................... 28 — 1 1 Destacking................................................................................ 756 — 69 — Benefit obligation at end of period............................................... $ (5,851) $ (5,461) $ (2,027) $ (1,996) Change in plan assets Fair value of plan assets at beginning of period............................. $ 10,356 $ 9,468 $ 1,560 $ 1,548 Actual return on plan assets........................................................ (1,114) 1,270 (82) 170 Variable annuity purchase........................................................... (232) — — — Employer contributions.............................................................. 81 25 9 7 Plan participants’ contributions................................................... — — 8 7 Benefits paid............................................................................. (462) (407) (152) (172) Destacking................................................................................ (1) — — — Fair value of plan assets at end of period...................................... $ 8,628 $ 10,356 $ 1,343 $ 1,560 Funded status Funded status at end of period..................................................... $ 2,777 $ 4,895 $ (684) $ (436) Unrecognized transition (asset) liability........................................ (236) (342) 159 207 Unrecognized prior service costs................................................. 42 65 1 1 Unrecognized actuarial net gain................................................... (351) (2,956) (169) (498) Effects of fourth quarter activity.................................................. 6 9 1 2 Net amount recognized............................................................... $ 2,238 $ 1,671 $ (692) $ (724) Amounts recognized in the Statements of Financial Position Prepaid benefit cost.................................................................... $ 2,570 $ 2,022 $ — $ — Accrued benefit liability ............................................................. (379) (382) (692) (724) Intangible asset.......................................................................... 2 7 — — Accumulated other comprehensive income................................... 45 24 — — Net amount recognized............................................................... $ 2,238 $ 1,671 $ (692) $ (724) The projected benefit obligations, accumulated benefit obligations and fair value of plan assets for the pension plans with accumulated benefit obligations in excess of plan assets were $461 million, $379 million and $0 million, respectively, at September 30, 2001 and $464 million, $384 million and $1 million, respectively, at September 30, 2000. Pension plan assets consist primarily of equity securities, bonds, real estate and short-term investments, of which $6,867 million and $7,381 million are included in Separate Account assets and liabilities at September 30, 2001 and 2000, respectively. In 2001, the pension plan purchased a variable annuity contract for $232 million from Prudential Insurance. The approximate future annual benefit payment for the variable annuity contract was $14 million. The benefit obligation for pensions decreased by $6 million in the year 2001 for miscellaneous changes related to the cash balance formula. The benefit obligation for pensions decreased by a net $112 million in the year 2000 for the effect of a Cost of Living Adjustment (“COLA”) and the introduction of the cash balance formula of ($134) million and $246 million, respectively. The COLA was effective as of July 1, 2000 and increased benefits, subject to a maximum, to retirees based upon their year of

The Prudential Insurance Company of America Notes to Consolidated Financial Statements 12. EMPLOYEE BENEFIT PLANS (continued)
B-26
retirement. The introduction of the cash balance formula was a feature of the substantive plan as of the measurement date and is effective January 1, 2001 for new employees and January 1, 2002 for existing employees. Other postretirement benefit plan assets consist of group and individual life insurance policies, common stocks, corporate debt securities, U.S. government securities, short-term investments and tax-exempt municipal debt. Plan assets include $395 million and $463 million of Company insurance policies at September 30, 2001 and 2000, respectively. The benefit obligation for other postretirement benefits was not affected by amendments in 2001. The benefit obligation for other postretirement benefits decreased by $221 million in the year 2000 for changes in the substantive plan made to medical, dental and life benefits for individuals retiring on or after January 1, 2001. The significant cost reduction features relate to the medical and life benefits. The Company adopted a cap that limits its long-term cost commitment to retiree medical coverage. The cap is defined as two times the estimated company contribution toward the cost of coverage per retiree in 2000. The new life insurance plan provides a reduced benefit of $10,000 of life insurance to retirees. The pension benefits were amended during the time period presented to provide contractual termination benefits to certain plan participants whose employment had been terminated. Costs related to these amendments are reflected in contractual termination benefits in the table below. Net periodic (benefit) cost included in “General and administrative expenses” in the Company’s Consolidated Statements of Operations for the years ended December 31, includes the following components:
Pension Benefits
Other Postretirement Benefits
2001 2000 1999 2001 2000 1999 (In Millions)
Components of net periodic (benefit) cost Service cost................................................................. $ 167 $ 140 $ 193 $ 18 $ 29 $ 39 Interest cost................................................................. 431 427 410 150 150 141 Expected return on plan assets....................................... (880) (799) (724) (134) (133) (121) Amortization of transition amount ................................. (106) (106) (106) 17 36 47 Amortization of prior service cost.................................. 12 47 45 — — — Amortization of actuarial net (gain) loss......................... (85) (77) 4 (16) (24) (10) Special termination benefits – discontinued operations..... — — 51 — — 2 Curtailment (gain) loss – discontinued operations............ — — (122) — — 108 Contractual termination benefits.................................... 4 6 48 — — — Subtotal............................................................... (457) (362) (201) 35 58 206 Less amounts included in discontinued operations........... — — 84 — — (130)
Net periodic (benefit) cost............................................. $ (457) $ (362) $ (117) $ 35 $ 58 $ 76 The assumptions at September 30, used by the Company to calculate the benefit obligations as of that date and to determine the benefit cost in the subsequent year are as follows:
Pension Benefits
Other Postretirement Benefits
2001 2000 1999 2001 2000 1999 Weighted-average assumptions Discount rate (beginning of period)................................ 7.75% 7.75% 6.50% 7.75% 7.75% 6.50% Discount rate (end of period)......................................... 7.25% 7.75% 7.75% 7.25% 7.75% 7.75% Rate of increase in compensation levels (beginning of period) ................................................
4.50%
4.50%
4.50%
4.50%
4.50%
4.50%
Rate of increase in compensation levels (end of period) .........................................................
4.50%
4.50%
4.50%
4.50%
4.50%
4.50%
Expected return on plan assets....................................... 9.50% 9.50% 9.50% 9.00% 9.00% 9.00% Health care cost trend rates........................................... — — — 6.76 – 8.76% 7.10 – 9.50% 7.50 - 10.30% Ultimate health care cost trend rate after gradual decrease until 2006.......................................
—
—
—
5.00%
5.00%
5.00%

The Prudential Insurance Company of America Notes to Consolidated Financial Statements 12. EMPLOYEE BENEFIT PLANS (continued)
B-27
Assumed health care cost trend rates have a significant effect on the amounts reported for the health care plan. A one-percentage point increase and decrease in assumed health care cost trend rates would have the following effects:
Other Postretirement Benefits
2001 (In Millions)
One percentage point increase Increase in total service and interest costs....................... $ 10 Increase in postretirement benefit obligation................... 125 One percentage point decrease Decrease in total service and interest costs...................... $ 8 Decrease in postretirement benefit obligation.................. 108 Postemployment Benefits The Company accrues postemployment benefits primarily for life and health benefits provided to former or inactive employees who are not retirees. The net accumulated liability for these benefits at December 31, 2001 and 2000 was $183 million and $152 million, respectively, and is included in “Other liabilities.” Other Employee Benefits The Company sponsors voluntary savings plans for employees (401(k) plans). The plans provide for salary reduction contributions by employees and matching contributions by the Company of up to 4%, 3% and 3% of annual salary for 2001, 2000 and 1999, respectively. The matching contributions by the Company included in “General and administrative expenses” are as follows:
401(k) Company Match 2001 2000 1999 (In Millions)
Company match........................................................... $ 72 $ 62 $ 60 Less amount included in discontinued operations............ — — (8) 401(k) Company match included in general and administrative expenses............................................. $ 72 $ 62 $ 52 Stock Options Prudential Financial adopted a stock option plan pursuant to which it may grant stock options, as well as stock appreciation rights, to employees and non-employees (i.e., statutory agents who perform services for Prudential Financial and participating subsidiaries) of the Company. Prudential Financial elected to apply Accounting Principles Board Opinion No. 25 “Accounting for Stock Issued to Employees” and related interpretations in accounting for employee stock options, pursuant to which compensation expense is not recorded if the option exercise price is no less than the fair market value of Prudential Financial common stock on the date the option is granted. Prudential Financial charges the Company for expenses incurred in connection with grants of options to non-employees. These charges were $270 thousand in 2001.

The Prudential Insurance Company of America Notes to Consolidated Financial Statements
B-28
13. INCOME TAXES The components of income tax expense (benefit) for the years ended December 31, were as follows:
2001 2000 1999 (In Millions)
Current tax expense (benefit) U.S...................................................................... $ (1,021) $ 362 $ 614 State and local...................................................... 57 31 84 Foreign ................................................................ 43 41 (8) Total ................................................................... (921) 434 690 Deferred tax expense (benefit) U.S...................................................................... 765 (86) 206 State and local...................................................... (73) (37) 44 Foreign ................................................................ 171 95 102 Total ................................................................... 863 (28) 352 Total income tax expense (benefit)................................ $ (58) $ 406 $ 1,042 The Company’s actual income tax expense (benefit) for the years ended December 31, differs from the expected amount computed by applying the statutory federal income tax rate of 35% to income from continuing operations before income taxes for the following reasons:
2001 2000 1999 (In Millions)
Expected federal income tax expense............................. $ (77) $ 254 $ 789 Non-deductible expenses.............................................. 228 61 33 Equity tax ................................................................... (200) 100 190 Non-taxable investment income..................................... (83) (42) (78) State and local income taxes.......................................... (12) (4) 83 Other.......................................................................... 86 37 25 Total income tax expense (benefit)......................... $ (58) $ 406 $ 1,042 Deferred tax assets and liabilities at December 31, resulted from the items listed in the following table:
2001 2000 (In Millions)
Deferred tax assets Insurance reserves................................................. $ 1,185 $ 1,371 Policyholder dividends.......................................... 231 297 Litigation related reserves...................................... 84 32 Net operating loss carryforwards............................ 51 353 Investments.......................................................... 60 (129) Deferred tax assets before valuation allowance......... 1,611 1,924 Valuation allowance.............................................. (25) (38) Deferred tax assets after valuation allowance........... 1,586 1,886 Deferred tax liabilities Deferred policy acquisition costs............................ 1,212 1,858 Net unrealized investment gains (losses).................. 845 273 Employee benefits................................................ 740 16 Depreciation......................................................... 40 71 Other................................................................... 378 (137) Deferred tax liabilities........................................... 3,215 2,081 Net deferred tax liability............................................... $ (1,629) $ (195) Management believes that based on its historical pattern of taxable income, the Company will produce sufficient income in the future to realize its deferred tax asset after valuation allowance. Adjustments to the valuation allowance will be made if there is a change in management’s assessment of the amount of the deferred tax asset that is realizable. At December 31, 2001 and 2000, respectively, the Company had federal net operating loss carryforwards of $61 million and $848 million, which expire between 2009 and 2018. At December 31, 2001 and 2000, respectively, the Company had state operating loss carryforwards for tax purposes approximating $1,867 million and $509 million, which expire between 2005 and 2021. The Internal Revenue Service (the “Service”) has completed all examinations of the consolidated federal income tax returns through 1992. The Service has examined the years 1993 through 1995. Discussions are being held with the Service with respect

The Prudential Insurance Company of America Notes to Consolidated Financial Statements 13. INCOME TAXES (continued)
B-29
to proposed adjustments. Management, however, believes there are adequate defenses against, or sufficient reserves to provide for such adjustments. The Service has completed its examination of 1996 and has begun its examination of 1997 through 2000. 14. STOCKHOLDER’S EQUITY Dividend Restrictions New Jersey insurance law provides that dividends or distributions may be declared or paid by Prudential Insurance without prior regulatory approval only from unassigned surplus, as determined pursuant to statutory accounting principles, less unrealized capital gains and certain other adjustments. In connection with the demutualization, unassigned surplus was reduced to zero, thereby limiting Prudential Insurance’s ability to pay a dividend in 2002 primarily to the amount of its statutory net gain from operations, not including realized investment gains, for the period subsequent to the date of demutualization. In addition, Prudential Insurance must obtain prior non-disapproval from the New Jersey insurance regulator prior to paying a dividend if the dividend, together with other dividends or distributions made within the preceding twelve months, would exceed the greater of 10% of Prudential Insurance’s surplus as of the preceding December 31 or its net gain from operations for the twelve month period ending on the preceding December 31. The laws regulating dividends of Prudential Insurance’s insurance subsidiaries domiciled in other states are similar, but not identical, to New Jersey’s. Statutory Net Income and Surplus Prudential Insurance is required to prepare statutory financial statements in accordance with statutory accounting practices prescribed or permitted by the New Jersey Department of Banking and Insurance. Statutory accounting practices primarily differ from GAAP by charging policy acquisition costs to expense as incurred, establishing future policy benefit liabilities using different actuarial assumptions and valuing investments and certain assets on a different basis. Statutory net income (loss) of Prudential Insurance amounted to $(896) million, $149 million and $333 million for the years ended December 31, 2001, 2000 and 1999, respectively. Statutory surplus of Prudential Insurance amounted to $6,420 million and $8,640 million at December 31, 2001 and 2000, respectively. The New York State Insurance Department recognizes only statutory accounting practices for determining and reporting the financial condition and results of operations of an insurance company for determining its solvency under the New York Insurance Law and for determining whether its financial condition warrants the payment of a dividend to its policyholders. No consideration is given by the New York State Insurance Department to financial statements prepared in accordance with GAAP in making such determinations. 15. RELATED PARTY TRANSACTIONS Service Agreements The Company has service agreements with Prudential Financial and certain subsidiaries of Prudential Financial, that prior to the destacking, were subsidiaries of Prudential Insurance. These companies include, along with their subsidiaries, PRUCO, Inc. (includes Prudential Securities Group Inc. and Prudential P&C Holdings, Inc.), Prudential Asset Management Holding Company, Prudential International Insurance Holdings, Ltd., Prudential IBH Holdco, Inc., The Prudential Real Estate Affiliates, Inc., Prudential International Investments Corporation, and Prudential Japan Holdings Inc. Under the agreements, the Company furnishes the services of its officers and employees, provides supplies, use of equipment, office space, accounts payable processing functions, makes operating advances, and engages in other transactions in the normal course of business. The Company charges these companies based on the level of service provided and amounts advanced. The amounts due to the Company at December 31, 2001 totaled $193 million and are included in “Due from parent and affiliates.” Prudential Financial and certain of its subsidiaries have service agreements with the Company. Under the agreements, the Company receives the services of the officers and employees of Prudential Financial, asset management services from Prudential Asset Management Holding Company and Prudential Financial makes tax payments under the consolidated federal income tax return for the Company. The Company is charged based on the level of service received and payments made on their behalf. The amounts due to Prudential Financial and certain subsidiaries at December 31, 2001 totaled $235 million and are included in “Due to parent and affiliates.”

The Prudential Insurance Company of America Notes to Consolidated Financial Statements 15. RELATED PARTY TRANSACTIONS (continued)
B-30
Notes Receivable Prudential Funding, LLC, a wholly owned consolidated subsidiary of the Company borrows funds primarily through the issuance of commercial paper, private placement medium-term notes, Eurobonds, Euro-commercial paper and Euro medium-term notes which are reflected in “Short-term debt” and “Long-term debt.” Historically, Prudential Funding, LLC lent net proceeds to Prudential Insurance and its subsidiaries generally at cost. At demutualization, the interest rates on loans to the destacked subsidiaries were adjusted to market rates. Loans made to destacked subsidiaries after demutualization will be made at market rates of interest. Accrued interest receivable related to these loans is included in “Due from parent and affiliates.” At December 31, 2001, “Due from parent and affiliates” includes affiliated notes receivable of the following: Description
Maturity Dates
Rates
2001
(In Millions) U.S. Dollar floating rate notes (a) ........................................................... 2002-2005 1.78% - 7.29% $ 2,590 Japanese Yen fixed rate note.................................................................. 2008 1.92% 565 Great Britain Pound floating rate note..................................................... 2004 2.99% - 5.59% 77 Total long-term notes receivable – affiliated (b) ....................................... 3,232 Short -term notes receivable – affiliated (c).............................................. 2,016 Total notes receivable – affiliated........................................................... $ 5,248
(a) On the date of demutualizat ion , Prudential Financial made a contribution of capital to the Company amounting to $1,050 million that was financed with the proceeds from the purchase by Prudential Insurance of a series of notes issued by Prudential Financial with market rates of interest and maturities ranging from nineteen months to three years which is included in floating rate notes. Also, included within floating rate notes is the current portion of long-term notes receivable, which is $150 million at December 31, 2001.
(b) All long-term notes receivable may be called for prepayment prior to the respective maturity dates under specified circumstances, with the exception of the Prudential Financial notes described in (a) above.
(c) Short -term notes receivable have variable rates which averaged 2.28% at December 31, 2001. Short-term notes receivable are payable on demand. Reinsurance As discussed in Note 10, the Company participates in reinsurance transactions with certain subsidiaries of Prudential Financial. Stock Based Compensation Prudential Financial adopted a stock option plan in which eligible participants were granted options to purchase shares of Prudential Financial’s common stock as discussed in Note 12.

The Prudential Insurance Company of America Notes to Consolidated Financial Statements
B-31
16. FAIR VALUE OF FINANCIAL INSTRUMENTS The estimated fair values presented below have been determined by using available market information and by applying valuation methodologies. Considerable judgment is applied in interpreting data to develop the estimates of fair value. Estimated fair values may not be realized in a current market exchange. The use of different market assumptions and/or estimation methodologies could have a material effect on the estimated fair values. The methods and assumptions discussed below were used in calculating the estimated fair values of the instruments. See Note 17 for a discussion of derivative instruments. Fixed Maturities and Equity Securities Estimated fair values for fixed maturities and equity securities, other than private placement securities, are based on quoted market prices or estimates from independent pricing services. Generally, fair values for private placement fixed maturities are estimated using a discounted cash flow model which considers the current market spreads between the U.S. Treasury yield curve and corporate bond yield curve, adjusted for the type of issue, its current credit quality and its remaining average life. The fair value of certain non-performing private placement fixed maturities is based on amounts estimated by management. Commercial Loans The estimated fair value of commercial loans is primarily based upon the present value of the expected future cash flows discounted at the appropriate U.S. Treasury rate, adjusted for the current market spread for similar quality loans. Policy Loans The estimated fair value of policy loans is calculated using a discounted cash flow model based upon current U.S. Treasury rates and historical loan repayment patterns. Mortgage Securitization Inventory The estimated fair value of the mortgage securitization inventory is primarily based upon the intended exit strategy for the mortgage loans, including securitization and whole loan sales. For loans expected to be securitized, the value is estimated using a pricing model that, among other factors, considers current investor yield requirements for subordination and yield. This activity was part of operations destacked on the date of demutualization as discussed in Note 1. Notes Receivable – Affiliated The estimated fair value of affiliated notes receivable is derived by using discount rates based on the borrowing rates currently available to the Company for notes with similar terms and remaining maturities. Investment Contracts For guaranteed investment contracts, income annuities, and other similar contracts without life contingencies, estimated fair values are derived using discounted projected cash flows based on interest rates being offered for similar contracts with maturities consistent with those of the contracts being valued. For individual deferred annuities and other deposit liabilities, fair value approximates carrying value. Debt The estimated fair value of short-term and long-term debt is derived by using discount rates based on the borrowing rates currently available to the Company for debt with similar terms and remaining maturities.
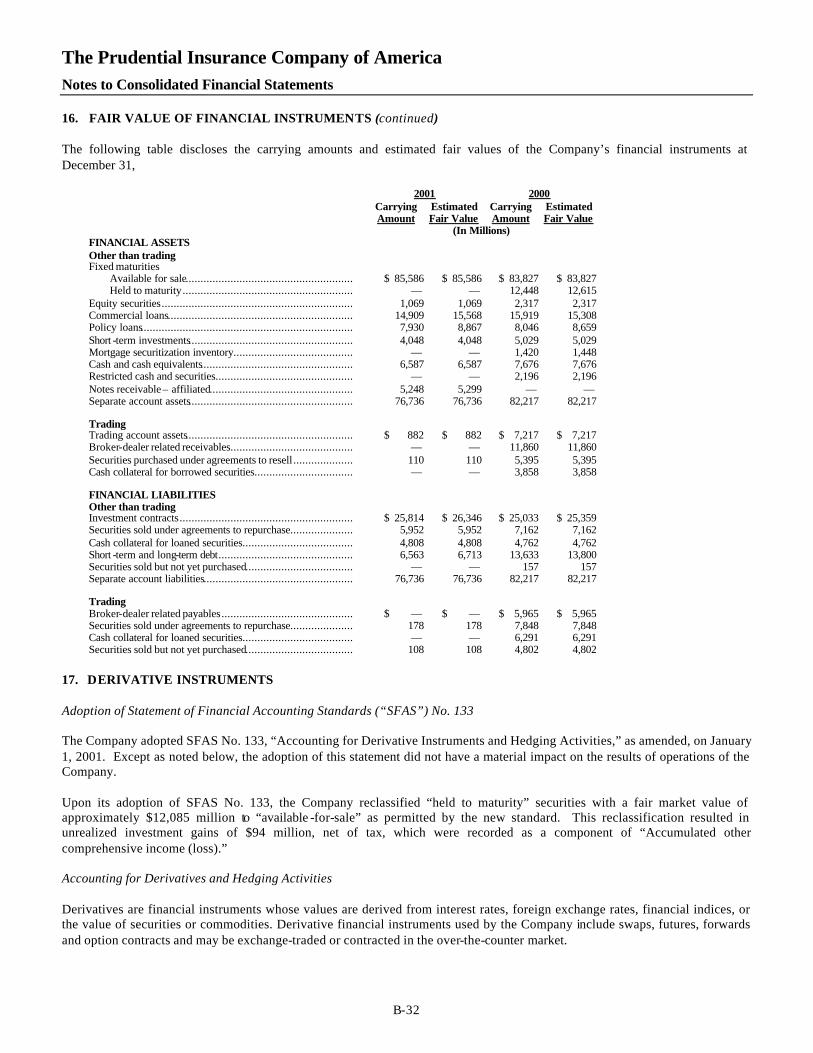
The Prudential Insurance Company of America Notes to Consolidated Financial Statements 16. FAIR VALUE OF FINANCIAL INSTRUMENTS (continued)
B-32
The following table discloses the carrying amounts and estimated fair values of the Company’s financial instruments at December 31,
2001 2000 Carrying
Amount Estimated Fair Value
Carrying Amount
Estimated Fair Value
(In Millions) FINANCIAL ASSETS Other than trading Fixed maturities Available for sale........................................................ $ 85,586 $ 85,586 $ 83,827 $ 83,827 Held to maturity......................................................... — — 12,448 12,615 Equity securities................................................................ 1,069 1,069 2,317 2,317 Commercial loans.............................................................. 14,909 15,568 15,919 15,308 Policy loans....................................................................... 7,930 8,867 8,046 8,659 Short -term investments....................................................... 4,048 4,048 5,029 5,029 Mortgage securitization inventory........................................ — — 1,420 1,448 Cash and cash equivalents................................................... 6,587 6,587 7,676 7,676 Restricted cash and securities.............................................. — — 2,196 2,196 Notes receivable – affiliated................................................ 5,248 5,299 — — Separate account assets....................................................... 76,736 76,736 82,217 82,217 Trading Trading account assets........................................................ $ 882 $ 882 $ 7,217 $ 7,217 Broker-dealer related receivables......................................... — — 11,860 11,860 Securities purchased under agreements to resell .................... 110 110 5,395 5,395 Cash collateral for borrowed securities................................. — — 3,858 3,858 FINANCIAL LIABILITIES Other than trading Investment contracts.......................................................... $ 25,814 $ 26,346 $ 25,033 $ 25,359 Securities sold under agreements to repurchase..................... 5,952 5,952 7,162 7,162 Cash collateral for loaned securities..................................... 4,808 4,808 4,762 4,762 Short -term and long-term debt............................................. 6,563 6,713 13,633 13,800 Securities sold but not yet purchased.................................... — — 157 157 Separate account liabilities.................................................. 76,736 76,736 82,217 82,217 Trading Broker-dealer related payables............................................ $ — $ — $ 5,965 $ 5,965 Securities sold under agreements to repurchase..................... 178 178 7,848 7,848 Cash collateral for loaned securities..................................... — — 6,291 6,291 Securities sold but not yet purchased.................................... 108 108 4,802 4,802 17. DERIVATIVE INSTRUMENTS Adoption of Statement of Financial Accounting Standards (“SFAS”) No. 133 The Company adopted SFAS No. 133, “Accounting for Derivative Instruments and Hedging Activities,” as amended, on January 1, 2001. Except as noted below, the adoption of this statement did not have a material impact on the results of operations of the Company. Upon its adoption of SFAS No. 133, the Company reclassified “held to maturity” securities with a fair market value of approximately $12,085 million to “available -for-sale” as permitted by the new standard. This reclassification resulted in unrealized investment gains of $94 million, net of tax, which were recorded as a component of “Accumulated other comprehensive income (loss).” Accounting for Derivatives and Hedging Activities Derivatives are financial instruments whose values are derived from interest rates, foreign exchange rates, financial indices, or the value of securities or commodities. Derivative financial instruments used by the Company include swaps, futures, forwards and option contracts and may be exchange-traded or contracted in the over-the-counter market.

The Prudential Insurance Company of America Notes to Consolidated Financial Statements 17. DERIVATIVE INSTRUMENTS (continued)
B-33
Derivatives held for trading purposes were used in the Company’s securities operations to meet the needs of customers and by the Company’s commercial mortgage securitizations business. Both of these businesses have been destacked. Trading derivatives are also utilized in a limited-purpose subsidiary primarily through the operation of hedge portfolios. Trading derivative positions are carried at estimated fair value, generally by obtaining quoted market prices or through the use of pricing models. Values are affected by changes in interest rates, currency exchange rates, credit spreads, market volatility and liquidity. Derivatives held for trading purposes are recorded at fair value in the Consolidated Statements of Financial Position either as assets, within “Trading account assets” or “Broker-dealer related receivables,” or as liabilities within “Broker-dealer related payables” or “Other liabilities.” Realized and unrealized changes in fair value are included in “Commissions and other income” in the Consolidated Statements of Operations in the periods in which the changes occur. Cash flows from trading derivatives are reported in the operating activities section of the Consolidated Statements of Cash Flows. Derivatives held for purposes other than trading are used to seek to reduce exposure to interest rate and foreign currency risks associated with assets held or expected to be purchased or sold, and liabilities incurred or expected to be incurred. Other than trading derivatives are also used to manage the characteristics of the Company’s asset/liability mix, manage the interest rate characteristics of invested assets and to mitigate the risk of a diminution, upon translation to U.S. dollars, of expected non-U.S. earnings resulting from unfavorable changes in currency exchange rates. Derivatives held for purposes other than trading are recognized on the Consolidated Statements of Financial Position at their fair value. On the date the derivative contract is entered into, the Company designates the derivative as either (1) a hedge of the fair value of a recognized asset or liability or unrecognized firm commitment (“fair value” hedge), (2) a hedge of a forecasted transaction or of the variability of cash flows to be received or paid related to a recognized asset or liability (“cash flow” hedge), (3) a foreign-currency fair value or cash flow hedge (“foreign currency” hedge), (4) a hedge of a net investment in a foreign operation, or (5) a derivative entered into as an economic hedge that does not qualify for hedge accounting. To qualify for hedge accounting treatment, a derivative must be highly effective in mitigating the designated risk of the hedged item. Effectiveness of the hedge is formally assessed at inception and throughout the life of the hedging relationship. Even if a derivative qualifies for special hedge accounting treatment, there may be an element of ineffectiveness of the hedge. Under such circumstances, the ineffective portion of adjusting the derivative to fair value is recorded in “Realized investment gains (losses), net.” The ineffective portion of derivatives accounted for using both cash flow and fa ir value hedge accounting for the period ended December 31, 2001 was not material to the results of operations of the Company. The Company discontinues hedge accounting prospectively when (1) it is determined that the derivative is no longer highly effective in offsetting changes in the fair value or cash flows of a hedged item (including firm commitments or forecasted transactions); (2) the derivative expires or is sold, terminated, or exercised; (3) the derivative is no longer designated as a hedge instrument, because (a) it is unlikely that a forecasted transaction will occur; (b) because a hedged firm commitment no longer meets the definition of a firm commitment; or (c) management determines that designation of the derivative as a hedge instrument is no longer appropriate. When hedge accounting is discontinued because it is determined that the derivative no longer qualifies as a highly effective fair value hedge, the derivative will continue to be carried on the balance sheet at its fair value, and the hedged asset or liability, which normally would not be carried at fair value, will no longer be adjusted for changes in fair value. When hedge accounting is discontinued because the hedged item no longer meets the definition of a firm commitment, the derivative will continue to be carried on the balance sheet at its fair value, and any asset or liability that was recorded pursuant to recognition of the firm commitment will be removed from the balance sheet and recognized as a gain or loss in current-period earnings. When hedge accounting is discontinued because it is probable that a forecasted transaction will not occur, the derivative will continue to be carried on the balance sheet at its fair value, and gains and losses that were accumulated in other comprehensive income will be recognized immediately in earnings. In all other situations in which hedge accounting is discontinued, the derivative will be carried at its fair value on the balance sheet, with changes in its fair value recognized in current-period earnings. For the year ended December 31, 2001, there were no reclassifications to earnings due to firm commitments no longer deemed probable or due to forecasted transactions that had not occurred by the end of the originally specified time period. The Company formally documents all relationships between hedging instruments and hedged items, as well as its risk-management objective and strategy for undertaking various hedge transactions. This process includes linking all derivatives

The Prudential Insurance Company of America Notes to Consolidated Financial Statements 17. DERIVATIVE INSTRUMENTS (continued)
B-34
designated as fair value, cash flow, or foreign currency hedges to specific assets and liabilities on the balance sheet or to specific firm commitments or forecasted transactions. When a derivative is designated as a fair value hedge and is determined to be highly effective, changes in its fair value, along with changes in the fair value of the hedged asset or liability (including losses or gains on firm commitments), are reported on a net basis in the income statement line item associated with the hedged item. Under certain circumstances, the change in fair value of an unhedged item is either not recorded or recorded instead in “Accumulated other comprehensive income (loss).” When such items are hedged and the hedge qualifies as a fair value hedge, the change in fair value of the hedged item and the derivative are reported on a net basis in “Realized investment gains (losses), net.” When a derivative is designated as a cash flow hedge and is determined to be highly effective, changes in its fair value are recorded in “Accumulated other comprehensive income (loss)” until earnings are affected by the variability of cash flows (e.g., when periodic settlements on a variable-rate asset or liability are recorded in earnings). At that time, the related portion of deferred gains or losses are reclassified to the income statement classification of the hedged item. Presented below is a roll forward of current period cash flow hedges in “Accumulated other comprehensive income (loss)” before taxes. (In Millions) Additions due to cumulative effect of change in accounting principle upon adoption of SFAS No. 133 at January 1, 2001.......................................................... $ 8 Net deferred losses on cash flow hedges from January 1 to December 31, 2001 ............... 3 Amount reclassified into current period earnings.......................................................... (18) Destacking............................................................................................................... 15 Balance, December 31, 2001............................................................................. $ 8 It is anticipated that a pre-tax gain of approximately $29 million will be reclassified from “Accumulated other comprehensive income (loss)” to earnings during the year ended December 31, 2002 and offset by equal amounts pertaining to the hedged items. The maximum length for which variable cash flows are hedged is 7 years. Income amounts deferred in “Accumulated other comprehensive income (loss)” as a result of cash flow hedges are included in “Net unrealized investment gains (losses)” in the Consolidated Statements of Stockholder’s Equity. When a derivative is designated as a foreign currency hedge and is determined to be effective, changes in its fair value are recorded in either current period earnings or “Accumulated other comprehensive income (loss),” depending on whether the hedge transaction is a fair value hedge (e.g., a hedge of a firm commitment that is to be settled in a foreign currency) or a cash flow hedge (e.g., a foreign currency denominated forecasted transaction). If, however, a derivative is used as a hedge of a net investment in a foreign operation, its changes in fair value, to the extent effective as a hedge, are recorded in the cumulative translation adjustments account within “Accumulated other comprehensive income (loss).” Those amounts, before applicable taxes, were gains of $75 million in 2001, $88 million in 2000 and a loss of $47 million in 1999. If a derivative does not qualify for hedge accounting as described above, it is recorded at fair value in “Other long-term investments” or “Other liabilities” in the Consolidated Statements of Financial Position, and changes in its fair value are included in current earnings without considering changes in fair value of the hedged assets or liabilities. See “Types of Derivative Instruments” for further discussion of the classification of derivative activity in current earnings. Cash flows from other than trading derivatives are reported in the investing activities section in the Consolidated Statements of Cash Flows. The Company occasionally purchases a financial instrument that contains a derivative instrument that is “embedded” in the financial instrument. Upon purchasing the instrument, the Company assesses whether the economic characteristics of the embedded derivative are clearly and closely related to the economic characteristics of the remaining component of the financial instrument (i.e., the host contract) and whether a separate instrument with the same terms as the embedded instrument would meet the definition of a derivative instrument. When it is determined that (1) the embedded derivative possesses economic characteristics that are not clearly and closely related to the economic characteristics of the host contract, and (2) a separate instrument with the same terms would qualify as a derivative instrument, the embedded derivative is separated from the host contract, carried at fair value, and changes in its fair value are included in “Realized investment gains (losses), net.”

The Prudential Insurance Company of America Notes to Consolidated Financial Statements 17. DERIVATIVE INSTRUMENTS (continued)
B-35
Types of Derivative Instruments Interest rate swaps are used by the Company to manage interest rate exposures arising from mismatches between assets and liabilities (including duration mismatches) and to hedge against changes in the value of assets it anticipates acquiring and other anticipated transactions and commitments. Under interest rate swaps, the Company agrees with other parties to exchange, at specified intervals, the difference between fixed-rate and floating-rate interest amounts calculated by reference to an agreed notional principal amount. Generally, no cash is exchanged at the outset of the contract and no principal payments are made by either party. Cash is paid or received based on the terms of the swap. These transactions are entered into pursuant to master agreements that provide for a single net payment to be made by one counterparty at each due date. The fair value of swap agreements is estimated based on proprietary pricing models or market quotes. As discussed above, if an interest rate swap does not qualify for hedge accounting, changes in its fair value are included in “Realized investment gains (losses), net” without considering changes in fair value of the hedged assets or liabilities. During the period that interest rate swaps are outstanding, net receipts or payments are included in “Net investment income.” Net interest receipts (payments) were $(29) million in 2001, $11 million in 2000 and $(4) million in 1999. Exchange-traded futures and options are used by the Company to reduce market risks from changes in interest rates, to alter mismatches between the duration of assets in a portfolio and the duration of liabilities supported by those assets, and to hedge against changes in the value of securities it owns or anticipates acquiring or selling. In exchange-traded futures transactions, the Company agrees to purchase or sell a specified number of contracts, the value of which are determined by the value of designated classes of Treasury securities, and to post variation margin on a daily basis in an amount equal to the difference in the daily market values of those contracts. The Company enters into exchange-traded futures and options with regulated futures commissions merchants who are members of a trading exchange. The fair value of those futures and options is based on market quotes. Treasury futures typically are used to hedge duration mismatches between assets and liabilities by replicating Treasury performance. Treasury futures move substantially in value as interest rates change and can be used to either modify or hedge existing interest rate risk. This strategy protects against the risk that cash flow requirements may necessitate liquidation of investments at unfavorable prices resulting from increases in interest rates. This strategy can be a more cost effective way of temporarily reducing the Company’s exposure to a market decline than selling fixed income securities and purchasing a similar portfolio when such a decline is believed to be over. When the Company anticipates a significant decline in the stock market that will correspondingly affect its diversified portfolio, it may purchase put index options where the basket of securities in the index is appropriate to provide a hedge against a decrease in the value of the Company’s equity portfolio or a portion thereof. This strategy effects an orderly sale of hedged securities. When the Company has large cash flows which it has allocated for investment in equity securities, it may purchase call index options as a temporary hedge against an increase in the price of the securities it intends to purchase. This hedge is intended to permit such investment transactions to be executed with less adverse market impact. Currency derivatives, including exchange-traded currency futures and options, currency forwards and currency swaps, are used by the Company to reduce market risks from changes in currency exchange rates with respect to investments denominated in foreign currencies that the Company either holds or intends to acquire or sell. Under exchange-traded currency futures and options, the Company agrees to purchase or sell a specified number of contracts and to post variation margin on a daily basis in an amount equal to the difference in the daily market values of those contracts. The Company enters into exchange-traded currency futures and options with regulated futures commissions merchants who are members of a trading exchange. Under currency forwards, the Company agrees with other parties upon delivery of a specified amount of an identified currency at a specified future date. Typically, the price is agreed upon at the time of the contract and payment for such a contract is made at the specified future date. Under currency swaps, the Company agrees with other parties to exchange, at specified intervals, the difference between one currency and another at a forward exchange rate and calculated by reference to an agreed principal amount. Generally, the principal amount of each currency is exchanged at the beginning and termination of the currency swap by each party. These

The Prudential Insurance Company of America Notes to Consolidated Financial Statements 17. DERIVATIVE INSTRUMENTS (continued)
B-36
transactions are entered into pursuant to master agreements that provide for a single net payment to be made by one counterparty for payments made in the same currency at each due date. Forward contracts are used by the Company to manage market risks relating to interest rates and commodities and trades in mortgage-backed securities forward contracts. The later activity was exited in connection with the restructuring of Prudential Securities Group Inc.’s capital markets activities as discussed in Note 4. Typically, the price is agreed upon at the time of the contract and payment for such a contract is made at the specified future date. The tables below summarize the Company’s outstanding positions by derivative instrument types at December 31, 2001 and 2000. The amounts presented are classified as either trading or other than trading, based on management’s intent at the time of contract inception and throughout the life of the contract. The table includes the estimated fair values of outstanding derivative positions only and does not include the changes in fair values of associated financial and non-financial assets and liabilities, which generally offset derivative gains and losses. The fair value amounts presented also do not reflect the netting of amounts pursuant to right of setoff, qualifying master netting agreements with counterparties or collateral arrangements.
Derivative Financial Instruments December 31, 2001
Trading Other than Trading Total
Hedge Accounting Non-Hedge
Accounting
Notional
Estimated Fair
Value
Notional
Estimated Fair
Value
Notional
Estimated Fair
Value
Notional
Estimated Fair
Value (In Millions)
Swap Instruments Interest rate Asset ....................................................................... $ 16,824 $ 724 $ — $ — $ 2,039 $ 69 $ 18,863 $ 793 Liability................................................................... 18,084 767 — — 1,402 26 19,486 793 Currency Asset ....................................................................... 1,201 135 605 32 742 88 2,548 255 Liability................................................................... 1,307 177 — — 234 17 1,541 194 Equity and commodity Asset ....................................................................... 35 7 — — 29 2 64 9 Liability................................................................... 70 7 — — — — 70 7 Forward contracts Interest rate Asset ....................................................................... 600 2 — — — — 600 2 Liability................................................................... 851 2 — — — — 851 2 Currency Asset ....................................................................... 2,903 100 1,006 7 3,537 127 7,446 234 Liability................................................................... 3,689 111 362 6 1,016 41 5,067 158 Futures contracts Interest rate Asset ....................................................................... 3,732 1 — — 1,610 11 5,342 12 Liability................................................................... 398 — — — 599 9 997 9 Equity and commodity Asset ....................................................................... — — — — 171 4 171 4 Liability................................................................... — — — — 625 1 625 1 Option contracts Interest rate Asset ....................................................................... 10,635 72 — — 338 3 10,973 75 Liability................................................................... 8,250 48 — — — — 8,250 48 Total Derivatives Assets...................................................................... $ 35,930 $ 1,041 $ 1,611 $ 39 $ 8,466 $ 304 $ 46,007 $ 1,384
Liabilities................................................................. $ 32,649 $ 1,112 $ 362 $ 6 $ 3,876 $ 94 $ 36,887 $ 1,212

The Prudential Insurance Company of America Notes to Consolidated Financial Statements 17. DERIVATIVE INSTRUMENTS (continued)
B-37
Derivative Financial Instruments December 31, 2000
Trading Other than Trading Total
Hedge Accounting Non-Hedge
Accounting
Notional
Estimated Fair
Value
Notional
Estimated Fair
Value
Notional
Estimated Fair
Value
Notional
Estimated Fair
Value (In Millions)
Swap Instruments Interest rate Asset ....................................................................... $ 9,693 $ 352 $ — $ — $ 1,908 $ 57 $ 11,601 $ 409 Liability................................................................... 10,521 370 — — 2,126 81 12,647 451Currency Asset ....................................................................... 7 — — — 383 31 390 31 Liability................................................................... 30 34 — — 302 20 332 54Equity and commodity Asset ....................................................................... 55 14 — — 46 17 101 31 Liability................................................................... 55 12 — — — — 55 12Forward contracts Interest rate Asset ....................................................................... 3,469 33 — — — — 3,469 33 Liability................................................................... 3,319 33 — — — — 3,319 33Currency Asset ....................................................................... 6,044 185 472 9 2,319 29 8,835 223 Liability................................................................... 5,897 195 429 9 27 79 6,353 283Equity and commodity Asset ....................................................................... 2,091 75 — — — — 2,091 75 Liability................................................................... 1,923 75 — — — — 1,923 75Futures contracts Interest rate Asset ....................................................................... 11,582 14 — — 2,410 55 13,992 69 Liability................................................................... 6,513 29 — — 1,468 21 7,981 50Equity and commodity Asset ....................................................................... 782 27 — — — — 782 27 Liability................................................................... 1,324 36 — — — — 1,324 36Option contracts Interest rate Asset ....................................................................... 4,141 48 — — — — 4,141 48 Liability................................................................... 4,273 29 — — — — 4,273 29Currency Asset ....................................................................... 1,108 27 — — — — 1,108 27 Liability................................................................... 1,174 26 — — — — 1,174 26Equity and commodity Asset ....................................................................... 175 3 — — — — 175 3 Liability................................................................... 126 1 — — — — 126 1Total Derivatives Assets...................................................................... $ 39,147 $ 778 $ 472 $ 9 $ 7,066 $ 189 $ 46,685 $ 976 Liabilities................................................................. $ 35,155 $ 840 $ 429 $ 9 $ 3,923 $ 201 $ 39,507 $ 1,050 Credit Risk The Company is exposed to credit-related losses in the event of nonperformance by counterparties to derivative financial instruments. Generally, the current credit exposure of the Company’s derivative contracts is limited to the fair value at the reporting date. The credit exposure of the Company’s swaps transactions is represented by the fair value (market value) of contracts with a positive fair value (market value) at the reporting date. Because exchange-traded futures and options are effected through regulated exchanges, and positions are marked to market on a daily basis, the Company has little exposure to credit-related losses in the event of nonperformance by counterparties to such financial instruments. The credit exposure of exchange-traded instruments is represented by the negative change, if any, in the fair value (market value) of contracts from the fair value (market value) at the reporting date. The credit exposure of currency forwards is represented by the difference, if any, between the exchange rate specified in the contract and the exchange rate for the same currency at the reporting date.

The Prudential Insurance Company of America Notes to Consolidated Financial Statements 17. DERIVATIVE INSTRUMENTS (continued)
B-38
The Company manages credit risk by entering into transactions with creditworthy counterparties and obtaining collateral where appropriate and customary. In addition, the Co mpany enters into over-the-counter swaps pursuant to master agreements that provide for a single net payment to be made by one counterparty to another at each due date and upon termination. Likewise, the Company effects exchange-traded futures and options through regulated exchanges and these positions are marked to market on a daily basis. 18. COMMITMENTS AND GUARANTEES, CONTINGENCIES AND LITIGATION Commitments and Guarantees The following table presents, as of December 31, 2001, the Company’s future commitments on short-term and long-term debt, as more fully described in Note 11 and future minimum lease payments under non-cancelable operating leases: Short-term and
Long-term Debt Operating
Leases (In Millions) 2002........................................................................... $ 3,837 $ 126 2003........................................................................... 651 108 2004........................................................................... 454 95 2005........................................................................... 58 77 2006........................................................................... 62 68 Beyond 2006............................................................... 1,501 195 Total .......................................................................... $ 6,563 $ 669 The Company occupies leased office space in many locations under various long-term leases and has entered into numerous leases covering the long-term use of computers and other equipment. Rental expense incurred for the years ended December 31, 2001, 2000 and 1999 was $520 million, $498 million and $456 million, respectively, excluding expenses relating to the Company’s healthcare business. During the normal course of its business, the Company utilizes financial instruments with off-balance sheet credit risk such as commitments, financial guarantees and letters of credit. Commitments include commitments to purchase and sell mortgage loans and the underfunded portion of commitments to fund investments in private placement securities. These mortgage loans and private commitments were $1,727 million, of which $781 million remain available at Decemb er 31, 2001. The Company also provides financial guarantees incidental to other transactions and letters of credit that guarantee the performance of customers to third parties. These credit-related financial instruments have off-balance sheet credit risk because only their origination fees, if any, and accruals for probable losses, if any, are recognized until the obligation under the instrument is fulfilled or expires. These instruments can extend for several years, and expirations are not concentrated in any period. The Company seeks to control credit risk associated with these instruments by limiting credit, maintaining collateral where customary and appropriate and performing other monitoring procedures. At December 31, 2001, financial guarantees and letters of credit issued by the Company were $325 million. Contingencies On September 19, 2000, the Company sold Gibraltar Casualty Company (“Gibraltar Casualty”), a subsidiary engaged in the commercial property and casualty insurance business, to Everest Re Group, Ltd. (“Everest”). Upon closing of the sale, a subsidiary of the Company entered into a stop-loss reinsurance agreement with Everest whereby the subsidiary reinsured Everest for up to 80% of the first $200 million of any adverse loss development in excess of Gibraltar Casualty’s carried reserves as of the closing of the sale. The subsidiary was among those that Prudential Insurance dividended to Prudential Financial in conjunction with the destacking. Prudential Insurance has indemnified the subsidiary for any losses it may incur in connection with this agreement. As of December 31, 2001, no liability has been recorded by Prudential Insurance in connection with this agreement. It is possible that the results of operations or the cash flow of the Company in a particular quarterly or annual period could be materially affected as a result of payments in connection with the matter discussed above depending, in part, upon the results of operations or cash flow for such period. Management believes, however, that ultimate payments in connection with this matter should not have a material adverse effect on the Company’s financial position.

The Prudential Insurance Company of America Notes to Consolidated Financial Statements 18. COMMITMENTS AND GUARANTEES, CONTINGENCIES AND LITIGATION (continued)
B-39
Litigation The Company is subject to legal and regulatory actions in the ordinary course of its businesses . Pending legal and regulatory actions include proceedings relating to aspects of our businesses and operations that are specific to the Company and proceedings that are typical of the businesses in which the Company operates, including in both cases businesses that have either been divested or placed in wind-down status. Some of these proceedings have been brought on behalf of various alleged classes of complainants. In certain of these matters, the plaintiffs are seeking large and/or indeterminate amounts, including punitive or exemplary damages. In particular, the Company has been subject to substantial regulatory actions and civil litigation involving individual life insurance sales practices. In 1996, the Company entered into settlement agreements with relevant insurance regulatory authorities and plaintiffs in the principal life insurance sales practices class action lawsuit covering policyholders of individual permanent life insurance policies issued in the United States from 1982 to 1995. Pursuant to the settlements, the Company agreed to various changes to its sales and business practices controls, to a series of fines, and to provide specific forms of relief to eligible class members. Virtually all claims by class members filed in connection with the settlements have been resolved and virtually all aspects of the remediation program have been satisfied. While the approval of the class action settlement is now final, the Company remains subject to oversight and review by insurance regulators and other regulatory authorities with respect to its sales practices and the conduct of the remediation program. The U.S. District Court has also retained jurisdiction as to all matters relating to the administration, consummation, enforcement and interpretation of the settlements. As of December 31, 2001, the Company remained a party to approximately 44 individual sales practices actions filed by policyholders who “opted out” of the class action settlement relating to permanent life insurance policies the Company issued in the United States between 1982 and 1995. In addition, there were 19 sales practices actions pending that were filed by policyholders who were members of the class and who failed to “opt out” of the class action settlement. The Company believes that those actions are governed by the class settlement release and expects them to be enjoined and/or dismissed. Additional suits may be filed by class members who “opted out” of the class settlement or who failed to “opt out” but nevertheless seek to proceed against the Company. A number of the plaintiffs in these cases seek large and/or indeterminate amounts, including punitive or exemplary damages. Some of these actions are brought on behalf of multiple plaintiffs. It is possible that substantial punitive damages might be awarded in any of these actions and particularly in an action involving multiple plaintiffs. The Company believes that its reserves related to sales practices, as of December 31, 2001, are adequate. No incremental provisions were recorded in 2001 or 2000. In 1999, 1998, 1997 and 1996, the Company recorded provisions in its Consolidated Statements of Operations of $100 million, $1,150 million, $2,030 million and $1,125 million, respectively, to provide for estimated remediation costs, and additional sales practices costs including related administrative costs, regulatory fines, penalties and related payments, litigation costs and settlements, including settlements associated with the resolution of claims of deceptive sales practices asserted by policyholders who elected to “opt-out” of the class action settlement and litigate their claims against the Company separately and other fees and expenses associated with the resolution of sales practices issues. The following table summarizes the Company’s charges for the estimated total costs of sales practices remedies and additional sales practices costs and related liability balances as of the dates indicated:
Year Ended December 31, 2001 2000 1999 1998 1997 1996 (In Millions)
Liability balance at beginning of period.......................... $ 253 $ 891 $ 3,058 $ 2,553 $ 963 $ — Charges to expense Remedy costs....................................................... — (54) (99) 510 1,640 410 Additional sales practices costs.............................. — 54 199 640 390 715 Total charges to expense.................................. — — 100 1,150 2,030 1,125 Amounts paid or credited Remedy costs....................................................... 71 448 1,708 147 — — Additional sales practices costs.............................. 130 190 559 498 440 162 Total amounts paid or credited......................... 201 638 2,267 645 440 162 Liability balance at end of period................................... $ 52 $ 253 $ 891 $ 3,058 $ 2,553 $ 963

The Prudential Insurance Company of America Notes to Consolidated Financial Statements 18. COMMITMENTS AND GUARANTEES, CONTINGENCIES AND LITIGATION (continued)
B-40
In 1996, the Company recorded in its Consolidated Statement of Operations the cost of $410 million before taxes as a guaranteed minimum remediation expense pursuant to the settlement agreement. Management had no better information available at that time upon which to make a reasonable estimate of the losses associated with the settlement. Charges were also recorded in 1996 for estimated additional sales practices costs totaling $715 million before taxes. In 1997, management increased the estimated liability for the cost of remedying policyholder claims by $1,640 million before taxes. This increase was based on additional information derived from claim sampling techniques, the terms of the settlement and the number of claim forms received. The Company also recorded additional charges of $390 million before taxes to recognize the increase in estimated total additional sales practices costs. In 1998, the Company recorded an additional charge of $510 million before taxes to recognize the increase of the estimated total cost of remedying policyholder claims to a total of $2,560 million before taxes. This increase was based on (1) estimates derived from an analysis of claims actually remedied (including interest); (2) a sample of claims still to be remedied; (3) an estimate of additional liabilities associated with a claimant’s right to “appeal” the Company’s decision; and (4) an estimate of an additional liability associated with the results of an investigation by a court-appointed independent expert regarding the impact of the Company’s failure to properly implement procedures to preserve all documents relevant to the class action and remediation program. The Company also recorded additional charges of $640 million before taxes to recognize the increase in estimated total additional sales practices costs. In 1999, the Company recorded an increase of $199 million of the estimate of total additional sales practices costs. This increase was partially offset by a $99 million release of the previously recorded liability relative to remedy costs reflecting a decrease in the estimate of the total costs of remedying policyholder claims. In 2000, the Company recorded an increase of $54 million of the estimate of total additional sales practices costs. This increase was offset by a $54 million release of the previously recorded liability relative to remedy costs reflecting a decrease in the estimate of the total costs of remedying policyholder claims. In addition, the Company retained all liabilities for the litigation associated with its discontinued healthcare business that existed at the date of closing with Aetna (August 6, 1999), or commenced within two years of that date, with respect to claims relating to events that occurred prior to the closing date. This litigation includes purported class actions and individual suits involving various issues, including payment of claims, denial of benefits, vicarious liability for malpractice claims, and contract disputes with provider groups and former policyholders. Some of the purported class actions challenge practices of the Company’s former managed care operations and assert nationwide classes. On October 23, 2000, by Order of the Judicial Panel on Multi-district Litigation, a number of these class actions were consolidated for pre-trial purposes, along with lawsuits pending against other managed health care companies, in the United States District Court for the Southern District of Florida in a consolidated proceeding captioned In Re Managed Care Litigation. Some of these class actions allege, among other things, misrepresentation of the level of services and quality of care, failure to disclose financial incentive agreements with physicians, interference with the physician-patient relationship, breach of contract and fiduciary duty, violations of ERISA, violations of and conspiracy to violate RICO, deprivation of plaintiffs’ rights to the delivery of honest medical services and industry-wide conspiracy to defraud physicians by failing to pay under provider agreements and by unlawfully coercing providers to enter into agreements with unfair and unreasonable terms. The remedies sought include unspecified damages, restitution, disgorgement of profits, treble damages, punitive damages and injunctive relief. Motions to dismiss certain of the amended complaints and plaintiff’s motions to certify nationwide classes in the consolidated proceedings are pending. In one of the consolidated actions the court granted our motion to dismiss, in part. The Company’s litigation is subject to many uncertainties, and given the complexity and scope, the outcomes cannot be predicted. It is possible that the results of operations or the cash flow of the Company in a particular quarterly or annual period could be materially affected by an ultimate unfavorable resolution of pending litigation and regulatory matters depending, in part, upon the results of operations or cash flow for such period. Management believes, however, that the ultimate outcome of all pending litigation and regulatory matters, after consideration of applicable reserves, should not have a material adverse effect on the Company’s financial position.

B-41
REPORT OF INDEPENDENT ACCOUNTANTS
To the Board of Directors and Stockholder of The Prudential Insurance Company of America In our opinion, the accompanying consolidated statements of financial position and the related consolidated statements of operations, of stockholder’s equity and of cash flows present fairly, in all material respects, the financial position of The Prudential Insurance Company of America and its subsidiaries at December 31, 2001 and 2000, and the results of their operations and their cash flows for each of the three years in the period ended December 31, 2001, in conformity with accounting principles generally accepted in the United States of America. These financial statements are the responsibility of the Company’s management; our responsibility is to express an opinion on these financial statements based on our audits. We conducted our audits of these statements in accordance with auditing standards generally accepted in the United States of America, which require that we plan and perform the audit to obtain reasonable assurance about whether the financial statements are free of material misstatement. An audit includes examining, on a test basis, evidence supporting the amounts and disclosures in the financial statements, assessing the accounting principles used and significant estimates made by management, and evaluating the overall financial statement presentation. We believe that our audits provide a reasonable basis for our opinion. New York, New York February 12, 2002
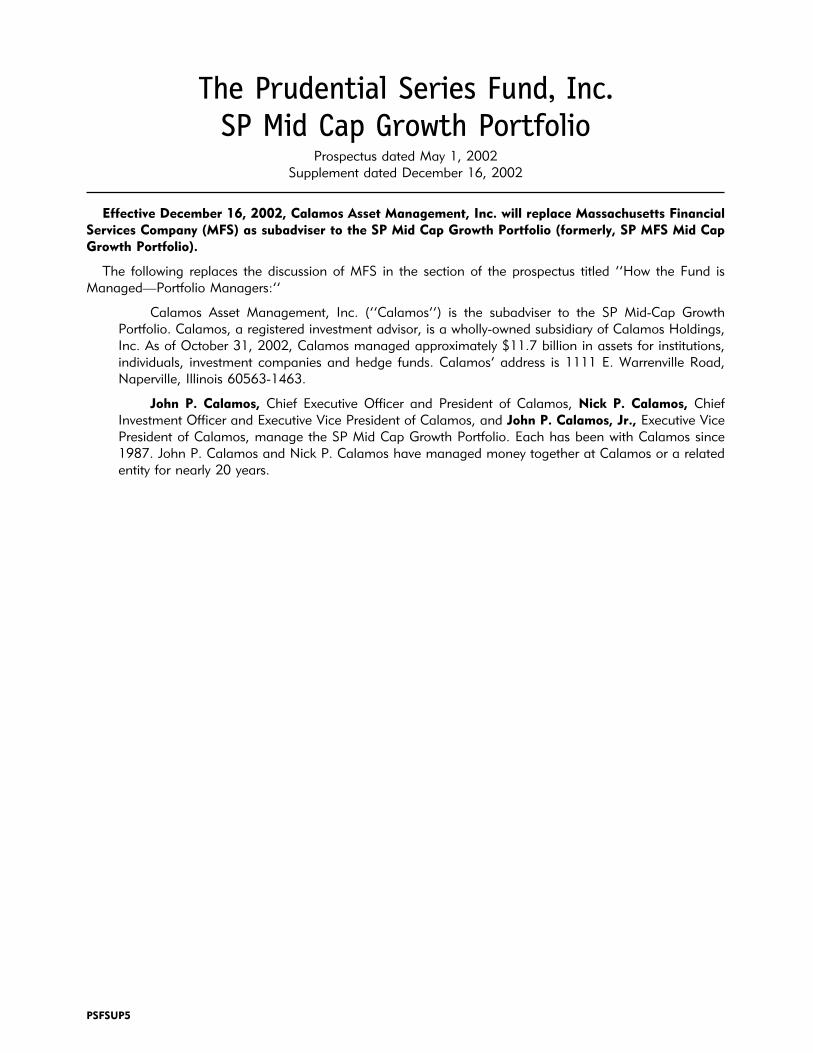
The Prudential Series Fund, Inc.
SP Mid Cap Growth PortfolioProspectus dated May 1, 2002
Supplement dated December 16, 2002
Effective December 16, 2002, Calamos Asset Management, Inc. will replace Massachusetts FinancialServices Company (MFS) as subadviser to the SP Mid Cap Growth Portfolio (formerly, SP MFS Mid CapGrowth Portfolio).
The following replaces the discussion of MFS in the section of the prospectus titled ‘‘How the Fund isManaged—Portfolio Managers:’’
Calamos Asset Management, Inc. (‘‘Calamos’’) is the subadviser to the SP Mid-Cap GrowthPortfolio. Calamos, a registered investment advisor, is a wholly-owned subsidiary of Calamos Holdings,Inc. As of October 31, 2002, Calamos managed approximately $11.7 billion in assets for institutions,individuals, investment companies and hedge funds. Calamos’ address is 1111 E. Warrenville Road,Naperville, Illinois 60563-1463.
John P. Calamos, Chief Executive Officer and President of Calamos, Nick P. Calamos, ChiefInvestment Officer and Executive Vice President of Calamos, and John P. Calamos, Jr., Executive VicePresident of Calamos, manage the SP Mid Cap Growth Portfolio. Each has been with Calamos since1987. John P. Calamos and Nick P. Calamos have managed money together at Calamos or a relatedentity for nearly 20 years.
PSFSUP5

The Prudential Series Fund, Inc.Supplement dated December 13, 2002 to
Prospectus dated May 1, 2002
Value Portfolio
The following amends the sections of the prospectus entitled ‘‘How the Portfolios Invest—InvestmentObjectives and Policies, ’’How the Fund Is Managed—Investment Sub-Advisers,‘‘ and ’’How the Fund isManaged—Portfolio Managers:‘‘
Effective as of the close of business on December 12, 2002, Jennison Associates LLC is responsible formanaging 100% of the Portfolio’s assets. The portfolio managers for the Portfolio are Tom Kolefas andBradley Goldberg. Bradley Goldberg has announced his intention to retire effective December 31, 2002.Following Mr. Goldberg’s retirement, Mr. Kolefas will continue as the portfolio manager for the Portfolio.
Equity Portfolio
The following amends the section of the prospectus entitled ’’How the Fund is Managed—PortfolioManagers:‘‘
Bradley Goldberg has announced his intention to retire effective December 31, 2002. Following Mr.Goldberg’s retirement, the portion of the Portfolio managed by Jennison Associates LLC will continue to bemanaged by Tom Kolefas.
PSFSUP6

The Prudential Series Fund, Inc.Supplement dated October 18, 2002
Prospectus dated May 1, 2002
SP PIMCO High Yield Portfolio
Effective immediately, Raymond G. Kennedy will replace Benjamin L. Trosky as portfolio manager. Thefollowing replaces the section titled ‘‘How the Fund is Managed—Portfolio Managers:’’
The Portfolio is managed by Raymond G. Kennedy. Mr. Kennedy is a Managing Director of PIMCO, and hejoined PIMCO as a credit analyst in 1996. Prior to joining PIMCO, Mr. Kennedy was associated with thePrudential Insurance Company of America as a private placement asset manager.
SP MFS Capital Opportunities Portfolio
Effective immediately, S. Irfan Ali and Kenneth J. Enright, CFA, will serve as co-portfolio managers of theSP MFS Capital Opportunities Portfolio replacing Maura Shaughnessy. The following replaces the sectiontitled ‘‘How the Fund is Managed—Portfolio Managers:’’
The Portfolio is managed by S. Irfan Ali and Kenneth J. Enright. Mr. Ali is a Senior Vice President andportfolio manager of the MFS Strategic Growth portfolios. He joined MFS as a research analyst in 1993 andearned his M.B.A. from the Harvard Business School. Mr. Enright is a Senior Vice President and portfoliomanager of the MFS Strategic Value portfolios and assists on the team managed MFS Total Return portfolios.He joined MFS in 1986 as a research analyst and earned his M.B.A. from Babson College.
PSFSUP4

The Prudential Series Fund, Inc.Supplement dated September 19, 2002 to Prospectus andStatement of Additional Information, dated May 1, 2002
SP AIM Core Equity Portfolio
The following supplements the sections of the prospectus entitled ‘‘Investment Objectives and PrincipalStrategies,’’ and ‘‘How the Portfolios Invest—Investment Objectives and Policies:’’
The Portfolio’s investment objective is growth of capital. The Portfolio’s secondary objective of currentincome is deleted.
SP Deutsche International Equity Portfolio
The following supplements the sections of the prospectus entitled ‘‘Investment Objectives and PrincipalStrategies,’’ ‘‘How The Portfolios Invest—Investment Objectives and Policies,’’ ‘‘How The Fund Is Managed—Investment Sub-Advisers,’’ and ‘‘How The Fund Is Managed—Portfolio Managers:’’
Effective September 30, 2002, Deutsche Asset Management Investment Services Limited (DeAMIS) is thesub-adviser to the Portfolio. DeAMIS is a wholly owned subsidiary of Deutsche Bank AG. As of June 30, 2002DeAMIS’ total assets under management were $5.667 billion. DeAMIS’ address is One Appold Street, LondonEC2A 2UU.
The following portfolio managers are responsible for the day-to-day management of the Portfolio’sinvestments:
Alexander Tedder, Managing Director of DeAMIS and Co-Manager of the Portfolio
� Head of EAFE Equity Portfolio Selection Team
� Joined DeAMIS in 1994 as a portfolio manager
� Was a European analyst (1990-1994) and representative (1992-1994) for Schroeders
� 12 years of investment experience
� Fluent in German, French, Italian and Spanish
� Masters in Economics and Business Administration from Freiburg University
Clare Brody, Director of DeAMIS and Co-Manager of the Portfolio
� Joined DeAMIS in 1993
� 10 years of investment industry experience
� Chartered Financial Analyst
� B.S., Cornell University
Stuart Kirk, Vice President of DeAMIS and Co-Manager of the Portfolio
� Joined Deutsche Bank AG, Paris Branch in 1995
� Seven years of investment industry experience
� Asia-Pacific analyst
� M.A. from Cambridge University
PSFSUP3

Marc Slendebroek,Vice President of DeAMIS and Co-Manager of the Portfolio
� Portfolio manager for EAFE Equities: London
� Joined Deutsche Asset Management Americas, Inc. (formerly, Zurich Scudder Investments, Inc.) in 1994after five years of experience as equity analyst at Kleinwort Benson Securities and at Enskilda Securities
� Fluent in English, Dutch, German, Swedish and Norwegian
� M.A. from University of Leiden, Netherlands
Joseph DeSantis, Managing Director of DeAMIS and Co-Manager of the Portfolio
� Oversees all equity portfolio managers based in the Americas region
� Joined Deutsche Asset Management, Inc. (formerly, Zurich Scudder Investments, Inc.) in 2000
� Chief Investment Officer at Chase Trust Bank in Tokyo, Japan, a division of Chase Global AssetManagement and Mutual Funds (1996-2000)
� Head of International Equities at Chase in New York (1992-1996)
� Positions as a portfolio manager at Chase and as the founder and later Investment Strategist at StrategicResearch International, Inc.
� B.A. from the University of Cincinnati
The following supplements the section of the Statement of Additional Information entitled ‘‘InvestmentManagement And Distribution Arrangements—Investment Management Arrangements:’’
Deutsche Asset Management Investment Services Limited (DeAMIS) is the subadviser to the SP DeutscheInternational Equity Portfolio. All references to Deutsche Asset Management, Inc. and/or DAMI with respect tothe SP Deutsche International Equity Portfolio are hereby deleted and replaced accordingly.

The Prudential Series Fund, Inc.Supplement dated August 29, 2002 to
Prospectus, dated May 1, 2002
SP Alliance Large Cap Growth Portfolio
The following supplements the section of the prospectus entitled ‘‘How the Portfolios Invest—InvestmentObjectives and Policies:’’
The Portfolio usually invests in about 40-60 companies, with the 25 most highly regarded of thesecompanies generally constituting approximately 70% of the Portfolio’s investable assets. Alliance seeks to gainpositive returns in good markets while providing some measure of protection in poor markets.
SP MFS Mid-Cap Growth Portfolio
The following supplements the section of the prospectus entitled ‘‘Portfolio Managers:’’
The Portfolio is managed by a team. MFS Senior Vice President Mark Regan, who had been a co-managerfor the Portfolio, retired effective June 30, 2002. David Sette-Ducati will continue as a member of themanagement team.
Eric Fischman joined the management team during April 2002. Mr. Fischman is a Senior Vice President ofMFS. Mr. Fischman joined MFS as a research analyst during 2000 and was named a portfolio manager inApril 2002. He earned an M.B.A. degree from Columbia Business School in 1998, a law degree from BostonUniversity School of Law, and a bachelor’s degree from Cornell University. From 1998 to 2000, Mr. Fischmanserved as an equity research analyst at State Street Research. Prior to that, he served as an equity researchanalyst at Dreyfus Corporation. Mr. Fischman also holds the Chartered Financial Analyst (CFA) designation.
SP INVESCO Small Company Growth Portfolio
The following supplements the section of the Prospectus entitled ‘‘Portfolio Managers:’’
The following individuals are primarily responsible for the day-to-day management of the Portfolio’sholdings:
Stacie L. Cowell, a senior vice president of INVESCO, is the lead portfolio manager of the Portfolio. Beforejoining INVESCO in 1997, Stacie was senior equity analyst with Founders Asset Management and a capitalmarkets and trading analyst with Chase Manhattan Bank in New York. She is a CFA charterholder. Stacieholds an M.S. in Finance from the University of Colorado and a B.A. in Economics from Colgate University.
Cameron Cooke is the co-portfolio manager of the Portfolio. Mr. Cooke joined the investment division ofINVESCO in 2000. Prior to joining INVESCO, Cameron was a senior equity analyst at Wells Capital Manage-ment. Mr. Cooke holds a B.A. in economics from the University of North Carolina at Chapel Hill.
PSFSUP1

SP PIMCO High Yield PortfolioSP PIMCO Total Return Portfolio
Diversified Conservative Growth Portfolio
The following supplements the section of the prospectus entitled ‘‘How the Portfolios Invest—InvestmentObjectives and Policies:’’
Each Portfolio may invest in swap agreements, including interest rate, credit default, currency exchangerate and total return swaps. Each Portfolio may also invest in preferred stock, and may invest in debt fromemerging markets. Each Portfolio may invest in event-linked bonds.
Jennison Portfolio
The following supplements the section of the Prospectus entitled ‘‘How the Portfolios Invest—InvestmentObjectives and Policies:’’
The Portfolio may invest in equity swap agreements.
Diversified Conservative Growth Portfolio
The following supplements the section of the Prospectus entitled ‘‘How the Portfolios Invest—InvestmentObjectives and Policies:’’
The Portfolio may enter into short sales of securities. No more than 25% of the Portfolio’s net assets maybe used as collateral or segregated for purposes of securing a short sale obligation.
AIM VARIABLE INSURANCE FUNDS
AIM V.I. AGGRESSIVE GROWTH FUND
(Series I shares)
Supplement dated June 28, 2002to the Prospectus dated May 1, 2002
Effective July 1, 2002, the following paragraph replaces in its entirety the first paragraph under the heading “FUNDMANAGEMENT - Portfolio Managers” on page 3 of the prospectus:
The advisor uses a team approach to investment management. The individual members of theteam (co-managers) who are primarily responsible for the management of the fund’s portfolioare:
• Robert M. Kippes (lead manager), Senior Portfolio Manager, who has been responsible forthe fund since 1998 and has been associated with the advisor and/or its affiliates since 1989.
• Ryan E. Crane, Senior Portfolio Manager, who has been responsible for the fund since 1999
and has been associated with the advisor and/or its affiliates since 1994. • Jay K. Ruchin, Portfolio Manager, who has been responsible for the fund since 2000 and has
been associated with the advisor and/or its affiliates since 1998. From 1996 to 1998, he wasan associate equity analyst for Prudential Securities.
They are assisted by the Mid Cap Growth Team. More information on the fund’s managementteam may be found on our website (http://www.aimfunds.com).
AIM VARIABLE INSURANCE FUNDS
AIM V.I. CORE EQUITY FUND
(Series I shares)
Supplement dated July 1, 2002to the Prospectus dated May 1, 2002
Effective September 30, 2002, the following paragraph replaces in its entirety the first paragraph under the heading“INVESTMENT OBJECTIVES AND STRATEGIES - AIM V.I. Core Equity Fund (formerly, AIM V.I. Growth andIncome Fund)” on page 1 of the prospectus:
The fund’s primary investment objective is growth of capital.
Effective July 1, 2002, the following paragraph replaces in its entirety the first paragraph under the heading “FUNDMANAGEMENT - Portfolio Managers” on page 3 of the prospectus:
• Ronald S. Sloan (lead manager), Senior Portfolio Manager, who has been responsible for thefund since 2002 and has been associated with the advisor and/or its affiliates since 1998.From 1993 to 1998, he was President of Verissimo Research and Management, Inc.
• Michael Yellen, Senior Portfolio manager, who has been responsible for the fund since 2002and has been associated with the advisor and/or its affiliates since 1994.
They are assisted by the Mid Cap Core Team. More information on the fund’s management teammay be found on our website (http://www.aimfunds.com).
PSFSUP2 Ed. 7/2002

The Prudential Series Fund, Inc.Prospectus
May 1, 2002
Conservative Balanced PortfolioDiversified Bond Portfolio
Equity PortfolioFlexible Managed Portfolio
Global PortfolioHigh Yield Bond Portfolio
Jennison PortfolioMoney Market PortfolioStock Index Portfolio
Value PortfolioSP Aggressive Growth Asset Allocation Portfolio
SP AIM Aggressive Growth PortfolioSP AIM Core Equity Portfolio
SP Alliance Large Cap Growth PortfolioSP Alliance Technology Portfolio
SP Balanced Asset Allocation PortfolioSP Conservative Asset Allocation Portfolio
SP Davis Value PortfolioSP Deutsche International Equity PortfolioSP Growth Asset Allocation Portfolio
SP INVESCO Small Company Growth PortfolioSP Jennison International Growth Portfolio
SP Large Cap Value PortfolioSP MFS Capital Opportunities PortfolioSP MFS Mid-Cap Growth PortfolioSP PIMCO High Yield PortfolioSP PIMCO Total Return Portfolio
SP Prudential U.S. Emerging Growth PortfolioSP Small/Mid-Cap Value Portfolio
SP Strategic Partners Focused Growth Portfolio
As with all mutual funds, the Securities and Exchange Commissionhas not approved or disapproved the Fund’s shares nor has theSEC determined that this prospectus is complete or accurate. It isa criminal offense to state otherwise.
A particular Portfolio may not be available under the variable lifeinsurance or variable annuity contract which you have chosen. Theprospectus of the specific contract which you have chosen willindicate which Portfolios are available and should be read inconjunction with this prospectus.

Table of Contents
1 RISK/RETURN SUMMARY
1 Investment Objectives and Principal Strategies12 Principal Risks16 Evaluating Performance
45 HOW THE PORTFOLIOS INVEST
45 Investment Objectives and Policies
45 Conservative Balanced Portfolio46 Diversified Bond Portfolio47 Equity Portfolio48 Flexible Managed Portfolio50 Global Portfolio50 High Yield Bond Portfolio51 Jennison Portfolio52 Money Market Portfolio53 Stock Index Portfolio54 Value Portfolio55 SP AIM Aggressive Growth Portfolio56 SP AIM Core Equity Portfolio58 SP Alliance Large Cap Growth Portfolio59 SP Alliance Technology Portfolio60 SP Asset Allocation Portfolios61 SP Aggressive Growth Asset Allocation Portfolio62 SP Balanced Asset Allocation Portfolio62 SP Conservative Asset Allocation Portfolio63 SP Growth Asset Allocation Portfolio63 SP Davis Value Portfolio64 SP Deutsche International Equity Portfolio67 SP INVESCO Small Company Growth Portfolio67 SP Jennison International Growth Portfolio69 SP Large Cap Value Portfolio70 SP MFS Capital Opportunities Portfolio71 SP MFS Mid-Cap Growth Portfolio72 SP PIMCO High Yield Portfolio73 SP PIMCO Total Return Portfolio75 SP Prudential U.S. Emerging Growth Portfolio77 SP Small/Mid-Cap Value Portfolio78 SP Strategic Partners Focused Growth Portfolio

Table of Contents (continued)
81 OTHER INVESTMENTS AND STRATEGIES
81 ADRs81 Convertible Debt and Convertible Preferred Stock81 Derivatives81 Dollar Rolls81 Equity Swaps81 Forward Foreign Currency Exchange Contracts81 Futures Contracts82 Interest Rate Swaps82 Joint Repurchase Account82 Loans and Assignments82 Mortgage-related Securities82 Options83 Real Estate Investment Trusts83 Repurchase Agreements83 Reverse Repurchase Agreements83 Short Sales83 Short Sales Against-the-Box83 When-Issued and Delayed Delivery Securities
84 HOW THE FUND IS MANAGED
84 Board of Directors84 Investment Adviser85 Investment Sub-Advisers87 Portfolio Managers
94 HOW TO BUY AND SELL SHARES OF THE FUND
95 Net Asset Value96 Distributor
96 OTHER INFORMATION
96 Federal Income Taxes97 Monitoring for Possible Conflicts
97 FINANCIAL HIGHLIGHTS
(For more information—see back cover)
2

RISK/RETURN SUMMARY
This prospectus provides information about The Prudential Series Fund, Inc. (the Fund), which consists of 36separate portfolios (each, a Portfolio).
The Fund offers two classes of shares in each Portfolio: Class I and Class II. Class I shares are sold only to separateaccounts of The Prudential Insurance Company of America and its affiliates (Prudential) as investment options undervariable life insurance and variable annuity contracts (the Contracts). (A separate account keeps the assets supportingcertain insurance contracts separate from the general assets and liabilities of the insurance company.) Class II sharesare offered only to separate accounts of non-Prudential insurance companies for the same types of Contracts. Notevery Portfolio is available under every Contract. The prospectus for each Contract lists the Portfolios currentlyavailable through that Contract.
This section highlights key information about each Portfolio available under your Contract. Additional informationfollows this summary and is also provided in the Fund’s Statement of Additional Information (SAI).
INVESTMENT OBJECTIVES AND PRINCIPAL STRATEGIES
The following summarizes the investment objectives, principal strategies and principal risks for each of the Portfolios.We describe the terms listed as principal risks on page 12. While we make every effort to achieve the investmentobjective for each Portfolio, we can’t guarantee success and it is possible that you could lose money.
Conservative Balanced Portfolio
The Portfolio’s investment objective is total investment return consistent with a conservatively manageddiversified portfolio. This Portfolio may be appropriate for an investor who wants diversification with a relatively lowerrisk of loss than that associated with the Flexible Managed Portfolio (see below). To achieve our objective, we invest ina mix of equity securities, debt obligations and money market instruments. Up to 30% of the Portfolio’s total assets maybe invested in foreign securities. We may invest a portion of the Portfolio’s assets in high-yield/high-risk debt securities,which are riskier than high-grade securities. While we make every effort to achieve our objective, we can’t guaranteesuccess and it is possible that you could lose money.
Principal Risks:‰ company risk‰ credit risk‰ foreign investment risk‰ high yield risk‰ interest rate risk‰ market risk‰ management risk
Diversified Bond Portfolio
The Portfolio’s investment objective is a high level of income over a longer term while providing reasonablesafety of capital. This means we look for investments that we think will provide a high level of current income, butwhich are not expected to involve a substantial risk of loss of capital through default. To achieve our objective, wenormally invest at least 80% of the Portfolio’s investable assets (net assets plus any borrowings made for investmentpurposes) in high-grade debt obligations and high-quality money market investments. We may purchase securities thatare issued outside the U.S. by foreign or U.S. issuers. In addition, we may invest a portion of the Portfolio’s assets inhigh-yield/high-risk debt securities, which are riskier than high-grade securities. While we make every effort to achieveour objective, we can’t guarantee success and it is possible that you could lose money.
Principal Risks:‰ credit risk‰ foreign investment risk‰ high yield risk‰ interest rate risk‰ management risk

Equity Portfolio
The Portfolio’s investment objective is long-term growth of capital. To achieve our objective, we normally invest atleast 80% of the Portfolio’s investable assets (net assets plus any borrowings made for investment purposes) incommon stocks of major established corporations as well as smaller companies that we believe offer attractiveprospects of appreciation. The Portfolio may invest up to 30% of its total assets in foreign securities. While we makeevery effort to achieve our objective, we can’t guarantee success and it is possible that you could lose money.
Principal Risks:‰ company risk‰ foreign investment risk‰ market risk‰ management risk
Flexible Managed Portfolio
The Portfolio’s investment objective is a high total return consistent with an aggressively managed diversifiedportfolio. This Portfolio may be appropriate for an investor who wants diversification and is willing to accept a relativelyhigh level of loss in an effort to achieve greater appreciation. To achieve our objective, we invest in a mix of equitysecurities, debt obligations and money market instruments. The Portfolio may invest in foreign securities. A portion ofthe debt portion of the Portfolio may be invested in high-yield/high-risk debt securities, which are riskier than high-gradesecurities. While we make every effort to achieve our objective, we can’t guarantee success and it is possible that youcould lose money.
Principal Risks:‰ company risk‰ credit risk‰ foreign investment risk‰ high yield risk‰ interest rate risk‰ market risk‰ management risk
Global Portfolio
The Portfolio’s investment objective is long-term growth of capital. To achieve this objective, we invest primarily incommon stocks (and their equivalents) of foreign and U.S. companies. Generally, we invest in at least three countries,including the U.S., but we may invest up to 35% of the Portfolio’s assets in companies located in any one country otherthan the U.S. While we make every effort to achieve our objective, we can’t guarantee success and it is possible thatyou could lose money.
Principal Risks:‰ company risk‰ foreign investment risk‰ market risk‰ management risk
High Yield Bond Portfolio
The Portfolio’s investment objective is a high total return. In pursuing our objective, we normally invest at least 80% ofthe Portfolio’s investable assets (net assets plus any borrowings made for investment purposes) in high-yield/high-riskdebt securities. Such securities have speculative characteristics and are riskier than high-grade securities. The Portfoliomay invest up to 20% of its total assets in foreign debt obligations. While we make every effort to achieve our objective,we can’t guarantee success and it is possible that you could lose money.
2

Principal Risks:‰ credit risk‰ foreign investment risk‰ high yield risk‰ interest rate risk‰ market risk‰ management risk
Jennison Portfolio (formerly, Prudential Jennison Portfolio)
The Portfolio’s investment objective is to achieve long-term growth of capital. To achieve this objective, we investprimarily in equity securities of major, established corporations that we believe offer above-average growth prospects.The Portfolio may invest up to 30% of its total assets in foreign securities. While we make every effort to achieve ourobjective, we can’t guarantee success and it is possible that you could lose money.
Principal Risks:‰ company risk‰ foreign investment risk‰ management risk‰ market risk
Money Market Portfolio
The Portfolio’s investment objective is maximum current income consistent with the stability of capital and themaintenance of liquidity. To achieve our objective, we invest in high-quality short-term money market instrumentsissued by the U.S. government or its agencies, as well as by corporations and banks, both domestic and foreign. ThePortfolio will invest only in instruments that mature in thirteen months or less, and which are denominated in U.S.dollars. While we make every effort to achieve our objective, we can’t guarantee success.
Principal Risks:‰ credit risk‰ interest rate risk‰ management risk
An investment in the Money Market Portfolio is not a bank deposit and is not insured or guaranteed by the FederalDeposit Insurance Corporation or any other government agency. Although the Portfolio seeks to maintain a net assetvalue of $10 per share, it is possible to lose money by investing in the Portfolio.
Principal Risks:‰ company risk‰ credit risk‰ derivatives risk‰ foreign investment risk‰ industry/sector risk‰ interest rate risk‰ management risk‰ market risk
Stock Index Portfolio
The Portfolio’s investment objective is investment results that generally correspond to the performance ofpublicly-traded common stocks. To achieve our objective, we attempt to duplicate the price and yield of theStandard & Poor’s 500 Composite Stock Price Index (S&P 500) by investing at least 80% of the Portfolio’s investableassets (net assets plus any borrowings made for investment purposes) in S&P 500 stocks. The S&P 500 represents
3

more than 70% of the total market value of all publicly-traded common stocks and is widely viewed as representative ofpublicly-traded common stocks as a whole. The Portfolio is not “managed” in the traditional sense of using market andeconomic analyses to select stocks. Rather, the portfolio manager purchases stocks in proportion to their weighting inthe S&P 500. While we make every effort to achieve our objective, we can’t guarantee success and it is possible thatyou could lose money.
Principal Risks:‰ company risk‰ market risk
Value Portfolio
The Portfolio’s investment objective is capital appreciation. To achieve our objective, we invest primarily in commonstocks that are undervalued — those stocks that are trading below their underlying asset value, cash generating ability andoverall earnings and earnings growth. We normally invest at least 65% of the Portfolio’s total assets in the common stockand convertible securities of companies that we believe will provide investment returns above those of the Standard &Poor’s 500 Composite Stock Price Index (S&P 500) or the New York Stock Exchange (NYSE) Composite Index. Most ofour investments will be securities of large capitalization companies. The Portfolio may invest up to 25% of its total assets inreal estate investment trusts (REITs) and up to 30% of its total assets in foreign securities. There is a risk that “value”stocks can perform differently from the market as a whole and other types of stocks and can continue to be undervalued bythe markets for long periods of time. While we make every effort to achieve our objective, we can’t guarantee success andit is possible that you could lose money.
Principal Risks:‰ company risk‰ credit risk‰ foreign investment risk‰ interest rate risk‰ market risk
SP Aggressive Growth Asset Allocation Portfolio
The SP Aggressive Growth Asset Allocation Portfolio seeks capital appreciation by investing in large cap equityPortfolios, international Portfolios, and small/mid-cap equity Portfolios. Pertinent risks are those associated with eachPortfolio in which this Portfolio invests. While we make every effort to achieve our objective, we can’t guaranteesuccess and it is possible that you could lose money.
The SP Aggressive Growth Asset Allocation Portfolio invests in shares of the following Fund Portfolios:
‰ a large capitalization equity component (approximately 40% of the Portfolio, invested in shares of the SPDavis Value Portfolio (20% of Portfolio), the SP Alliance Large Cap Growth Portfolio (10% of Portfolio), andthe Jennison Portfolio (10% of Portfolio)); and
‰ an international component (approximately 35% of the Portfolio, invested in shares of the SP JennisonInternational Growth Portfolio (17.5% of Portfolio) and the SP Deutsche International Equity Portfolio (17.5%of Portfolio)); and
‰ a small/mid-capitalization equity component (approximately 25% of the Portfolio, invested in shares of the SPSmall/Mid-Cap Value Portfolio (12.5% of Portfolio) and the SP Prudential U.S. Emerging Growth Portfolio(12.5% of Portfolio)).
For more information on the underlying Portfolios, please refer to their investment summaries included in thisprospectus.
SP AIM Aggressive Growth Portfolio
The Portfolio’s investment objective is to achieve long-term growth of capital. The Portfolio seeks to meet thisobjective by investing primarily in the common stocks of companies whose earnings the portfolio managers expect to
4

grow more than 15% per year. Growth stocks usually involve a higher level of risk than value stocks, because growthstocks tend to attract more attention and more speculative investments than value stocks. On behalf of the Portfolio,A I M Capital Management, Inc. will invest in securities of small- and medium-sized growth companies, may invest upto 25% of its total assets in foreign securities and may invest up to 25% of its total assets in real estate investmenttrusts (REITs). While we make every effort to achieve our objective, we can’t guarantee success and it is possible thatyou could lose money.
Principal Risks:‰ company risk‰ foreign investment risk‰ liquidity risk‰ management risk‰ market risk
SP AIM Core Equity Portfolio (formerly, SP AIM Growth and Income Portfolio)
The Portfolio’s primary investment objective is growth of capital with a secondary objective of current income. ThePortfolio seeks to meet these objectives by investing at least 80% of its investable assets (net assets plus anyborrowings made for investment purposes) in equity securities, including convertible securities of establishedcompanies that have long-term above-average growth in earnings and dividends, and growth companies that theportfolio managers believe have the potential for above-average growth in earnings and dividends. In complying withthis 80% requirement, the Portfolio’s investments may include synthetic instruments. Synthetic instruments areinvestments that have economic characteristics similar to the Portfolio’s direct investments and may include warrants,futures, options, exchange-traded funds and ADRs. A I M Capital Management, Inc. considers whether to sell aparticular security when they believe the security no longer has that potential or the capacity to generate income. ThePortfolio may invest up to 20% of its total assets in foreign securities. While we make every effort to achieve ourobjective, we can’t guarantee success and it is possible that you could lose money.
Principal Risks:‰ company risk‰ credit risk‰ derivatives risk‰ foreign investment risk‰ interest rate risk‰ leveraging risk‰ liquidity risk‰ management risk‰ market risk
SP Alliance Large Cap Growth Portfolio
The Portfolio’s investment objective is growth of capital by pursuing aggressive investment policies. The Portfolionormally invests at least 80% of the Portfolio’s investable assets (net assets plus any borrowings made for investmentpurposes) in stocks of companies considered to have large capitalizations (i.e., similar to companies included in the S&P500 Index). Up to 15% of the Portfolio’s total assets may be invested in foreign securities. Unlike most equity funds, thePortfolio focuses on a relatively small number of intensively researched companies. Alliance Capital Management, L.P.(“Alliance”) selects the Portfolio’s investments from a research universe of more than 500 companies that have strongmanagement, superior industry positions, excellent balance sheets, and superior earnings growth prospects. “Alliance”,“Alliance Capital” and their logos are registered marks of Alliance Capital Management, L.P. While we make every effortto achieve our objective, we can’t guarantee success and it is possible that you could lose money.
Principal Risks:‰ company risk‰ foreign investment risk‰ management risk‰ market risk
5

SP Alliance Technology Portfolio
The Portfolio’s objective is growth of capital. The Portfolio normally invests at least 80% of its investable assets (netassets plus any borrowings made for investment purposes) in securities of companies that use technology extensivelyin the development of new or improved products or processes. Within this framework, the Portfolio may invest in anycompany and industry and in any type of security with potential for capital appreciation. It invests in well-known,established companies or in new or unseasoned companies. The Portfolio also may invest in debt securities and up to25% of its total assets in foreign securities. In addition, technology stocks, especially those of smaller, less-seasonedcompanies, tend to be more volatile than the overall stock market. The Portfolio may invest up to 25% of its total assetsin foreign securities. While we make every effort to achieve our objective, we can’t guarantee success and it is possiblethat you could lose money. This Portfolio is advised by Alliance Capital Management, L.P.
Principal Risks:‰ company risk‰ credit risk‰ foreign investment risk‰ industry/sector risk‰ interest rate risk‰ liquidity risk‰ management risk‰ market risk
SP Balanced Asset Allocation Portfolio
The SP Balanced Asset Allocation Portfolio seeks to provide a balance between current income and growth of capitalby investing in fixed income Portfolios, large cap equity Portfolios, small/mid-cap equity Portfolios, and internationalequity Portfolios. Pertinent risks are those associated with each Portfolio in which this Portfolio invests. While we makeevery effort to achieve our objective, we can’t guarantee success and it is possible that you could lose money.
The SP Balanced Asset Allocation Portfolio invests in shares of the following Portfolios:
‰ a fixed income component (approximately 40% of the Portfolio, invested in shares of the SP PIMCO TotalReturn Portfolio (25% of Portfolio) and the SP PIMCO High Yield Portfolio (15% of Portfolio)); and
‰ a large capitalization equity component (approximately 35% of the Portfolio, invested in shares of the SPDavis Value Portfolio (17.5% of Portfolio), the SP Alliance Large Cap Growth Portfolio (8.75% of Portfolio),and the Jennison Portfolio (8.75% of Portfolio)); and
‰ a small/mid capitalization equity component (approximately 15% of the Portfolio, invested in shares of the SPSmall/Mid-Cap Value Portfolio (7.5% of Portfolio) and the SP Prudential U.S. Emerging Growth Portfolio (7.5%of Portfolio)); and
‰ an international component (approximately 10% of the Portfolio, invested in shares of the SP JennisonInternational Growth Portfolio (5% of Portfolio) and the SP Deutsche International Equity Portfolio (5% ofPortfolio)).
For more information on the underlying Portfolios, please refer to their investment summaries included in thisprospectus.
SP Conservative Asset Allocation Portfolio
The SP Conservative Asset Allocation Portfolio seeks to provide current income with low to moderate capitalappreciation by investing in fixed income Portfolios, large cap equity Portfolios, and small/mid-cap equity Portfolios.Pertinent risks are those associated with each Portfolio in which this Portfolio invests. While we make every effort toachieve our objective, we can’t guarantee success and it is possible that you could lose money.
The SP Conservative Asset Allocation Portfolio invests in shares of the following Portfolios:
‰ a fixed income component (approximately 60% of the Portfolio, invested in shares of the SP PIMCO TotalReturn Portfolio (40% of Portfolio) and the SP PIMCO High Yield Portfolio (20% of Portfolio)); and
6

‰ a large capitalization equity component (approximately 30% of the Portfolio, invested in shares of the SPDavis Value Portfolio (15% of Portfolio), the SP Alliance Large Cap Growth Portfolio (7.5% of Portfolio), andthe Jennison Portfolio (7.5% of Portfolio)); and
‰ a small/mid capitalization equity component (approximately 10% of the Portfolio, invested in shares of the SPSmall/Mid-Cap Value Portfolio (5% of Portfolio) and the SP Prudential U.S. Emerging Growth Portfolio (5% ofPortfolio)).
For more information on the underlying Portfolios, please refer to their investment summaries included in thisprospectus.
SP Davis Value Portfolio
SP Davis Value Portfolio’s investment objective is growth of capital. The Portfolio invests primarily in common stock ofU.S. companies with market capitalizations of at least $5 billion.
The portfolio managers use the investment philosophy of Davis Selected Advisers, L.P. to select common stocks ofquality, overlooked growth companies at value prices and to hold them for the long-term. They look for companies withsustainable growth rates selling at modest price-earnings multiples that they hope will expand as other investorsrecognize the company’s true worth. The portfolio managers believe that if you combine a sustainable growth rate witha gradually expanding multiple, these rates compound and can generate returns that could exceed average returnsearned by investing in large capitalization domestic stocks. They consider selling a company if the company no longerexhibits the characteristics that they believe foster sustainable long-term growth, minimize risk and enhance thepotential for superior long-term returns. There is a risk that “Value” Stocks can perform differently from the market as awhole and other types of stocks and can continue to be undervalued by the markets for long periods of time. While wemake every effort to achieve our objective, we can’t guarantee success and it is possible that you could lose money.
Principal Risks:‰ company risk‰ liquidity risk‰ management risk‰ market risk
SP Deutsche International Equity Portfolio
The Portfolio’s investment objective is to invest for long-term capital appreciation. The Portfolio normally invests atleast 80% of its investable assets (net assets plus borrowings made for investment purposes) in the stocks and otherequity securities of companies in developed countries outside the United States. The Portfolio seeks to achieve its goalby investing primarily in companies in developed foreign countries. The companies are selected by an extensivetracking system plus the input of experts from various financial disciplines. While we make every effort to achieve ourobjective, we can’t guarantee success and it is possible that you could lose money. This Portfolio is advised byDeutsche Asset Management Inc. (DAMI)
Principal Risks:‰ company risk‰ foreign investment risk‰ management risk‰ market risk
SP Growth Asset Allocation Portfolio
The SP Growth Asset Allocation Portfolio seeks to provide long-term growth of capital with consideration also given tocurrent income, by investing in large-cap equity Portfolios, fixed income Portfolios, international equity Portfolios, andsmall/mid-cap equity Portfolios. Pertinent risks are those associated with each Portfolio in which this Portfolio invests.While we make every effort to achieve our objective, we can’t guarantee success and it is possible that you could losemoney.
7

The Growth Asset Allocation Portfolio invests in shares of the following Portfolios:
‰ a large capitalization equity component (approximately 45% of the Portfolio, invested in shares of the SPDavis Value Portfolio (22.5% of Portfolio), the SP Alliance Large Cap Growth Portfolio (11.25% of Portfolio),and the Jennison Portfolio (11.25% of Portfolio)); and
‰ a fixed income component (approximately 20% of the Portfolio, invested in shares of the SP PIMCO HighYield Portfolio (10% of Portfolio) and the SP PIMCO Total Return Portfolio (10% of Portfolio)); and
‰ an international component (approximately 20% of the Portfolio, invested in shares of the SP JennisonInternational Growth Portfolio (10% of Portfolio) and the SP Deutsche International Equity Portfolio (10% ofPortfolio)); and
‰ a small/mid capitalization equity component (approximately 15% of the Portfolio, invested in shares of the SPSmall/Mid-Cap Value Portfolio (7.5% of Portfolio) and the SP Prudential U.S. Emerging Growth Portfolio (7.5%of Portfolio)).
For more information on the underlying Portfolios, please refer to their investment summaries included in thisprospectus.
SP INVESCO Small Company Growth Portfolio
The Portfolio seeks long-term capital growth. Under normal circumstances, the Portfolio will invest at least 80% of itsinvestable assets (net assets plus any borrowings made for investment purposes) in small-capitalization companies —those which are included in the Russell 2000 Growth Index at the time of purchase, or if not included in that index,have market capitalizations of $2.5 billion or below at the time of purchase.
Investments in small, developing companies carry greater risk than investments in larger, more established companies.Developing companies generally face intense competition, and have a higher rate of failure than larger companies. Onthe other hand, large companies were once small companies themselves, and the growth opportunities of some smallcompanies may be quite high. While we make every effort to achieve our objective, we can’t guarantee success and itis possible that you could lose money. This Portfolio is advised by INVESCO Funds Group, Inc.
Principal Risks:‰ company risk‰ management risk‰ market risk
SP Jennison International Growth Portfolio
The Portfolio’s investment objective is long-term growth of capital. The Portfolio seeks to achieve this objective byinvesting in equity-related securities of foreign issuers. This means the Portfolio looks for investments that JennisonAssociates LLC thinks will increase in value over a period of years. To achieve its objective, the Portfolio investsprimarily in the common stock of large and medium-sized foreign companies. Under normal circumstances, thePortfolio invests at least 65% of its total assets in common stock of foreign companies operating or based in at leastfive different countries. The Portfolio looks primarily for stocks of companies whose earnings are growing at a fasterrate than other companies. These companies typically have characteristics such as above average growth in earningsand cash flow, improving profitability, strong balance sheets, management strength and strong market share for itsproducts. The Portfolio also tries to buy such stocks at attractive prices in relation to their growth prospects. While wemake every effort to achieve our objective, we can’t guarantee success and it is possible that you could lose money.
Principal Risks:‰ company risk‰ foreign investment risk‰ market risk
8

SP Large Cap Value Portfolio
The Portfolio’s investment objective is long-term growth of capital. The portfolio’s investment strategy includesnormally investing at least 80% of its investable assets (net assets plus any borrowings made for investment purposes)in securities of companies with large market capitalizations (those with market capitalizations similar to companies inthe Standard & Poor’s 500 Composite Stock Price Index or the Russell 1000 Index). The Portfolio normally invests itsassets primarily in common stocks. The Portfolio invests in securities of companies that Fidelity Management &Research Company (FMR) believes are undervalued in the marketplace in relation to factors such as assets, earnings,growth potential or cash flow in relation to securities of other companies in the same industry (stocks of thesecompanies are often called “value” stocks). The Portfolio invests in domestic and foreign issuers. The Portfolio usesfundamental analysis of each issuer’s financial condition, its industry position and market and economic conditions,along with statistical models to evaluate growth potential, valuation, liquidity and investment risk, to select investments.There is a risk that “value” stocks can perform differently from the market as a whole and other types of stocks and cancontinue to be undervalued by the markets for long periods of time. An investment in this Portfolio, like any Portfolio, isnot a deposit of a bank, and is not insured by the Federal Deposit Insurance Corporation or any other governmentagency. While we make every effort to achieve our objective, we can’t guarantee success and it is possible that youcould lose money.
Principal Risks:‰ company risk‰ foreign investment risk‰ management risk‰ market risk
SP MFS Capital Opportunities Portfolio
The Portfolio’s investment objective is capital appreciation. The Portfolio invests, under normal market conditions, atleast 65% of its net assets in common stocks and related securities, such as preferred stocks, convertible securitiesand depositary receipts for those securities. The Portfolio focuses on companies which Massachusetts FinancialServices Company (MFS) believes have favorable growth prospects and attractive valuations based on current andexpected earnings or cash flow. The Portfolio’s investments may include securities listed on a securities exchange ortraded in the over-the-counter markets. MFS uses a bottom-up, as opposed to a top-down, investment style inmanaging the Portfolio. This means that securities are selected based upon fundamental analysis (such as an analysisof earnings, cash flows, competitive position and management’s abilities) performed by the Portfolio’s portfolio managerand MFS’s large group of equity research analysts. The Portfolio may invest in foreign securities (including emergingmarket securities), through which it may have exposure to foreign currencies. The Portfolio may engage in active andfrequent trading to achieve its principal investment strategies. While we make every effort to achieve our objective, wecan’t guarantee success and it is possible that you could lose money. High portfolio turnover results in highertransaction costs and can affect the Portfolio’s performance.
Principal Risks:‰ company risk‰ foreign investment risk‰ management risk‰ market risk‰ portfolio turnover risk
SP MFS Mid-Cap Growth Portfolio
The Portfolio’s investment objective is long-term growth of capital. The Portfolio invests, under normal marketconditions, at least 80% of its investable assets (net assets plus any borrowings made for investment purposes) incommon stocks and related securities, such as preferred stocks, convertible securities and depositary receipts forthose securities. These securities typically are of medium market capitalizations, which Massachusetts FinancialServices Company (MFS) believes have above-average growth potential.
Medium market capitalization companies are defined by the Portfolio as companies with market capitalizations equalingor exceeding $250 million but not exceeding the top of the Russell Midcap™ Growth Index range at the time of the
9

Portfolio’s investment. This Index is a widely recognized, unmanaged index of mid-cap common stock prices.Companies whose market capitalizations fall below $250 million or exceed the top of the Russell Midcap™ GrowthIndex range after purchase continue to be considered medium-capitalization companies for purposes of the Portfolio’s80% investment policy. The Portfolio’s investments may include securities listed on a securities exchange or traded inthe over-the-counter markets. MFS uses a bottom-up, as opposed to a top-down, investment style in managing thePortfolio. This means that securities are selected based upon fundamental analysis (such as an analysis of earnings,cash flows, competitive position and management’s abilities) performed by the portfolio manager and MFS’s largegroup of equity research analysts. The Portfolio is a non-diversified mutual fund portfolio. This means that the Portfoliomay invest a relatively high percentage of its assets in a small number of issuers. The Portfolio may invest in foreignsecurities (including emerging markets securities). The Portfolio is expected to engage in active and frequent trading toachieve its principal investment strategies. While we make every effort to achieve our objective, we can’t guaranteesuccess and it is possible that you could lose money.
Principal Risks:‰ company risk‰ foreign investment risk‰ management risk‰ market risk‰ portfolio turnover risk
SP PIMCO High Yield Portfolio
The investment objective of the Portfolio is to seek maximum total return, consistent with preservation of capitaland prudent investment management. The Portfolio seeks to achieve its investment objective by investing undernormal circumstances at least 80% of its investable assets (net assets plus any borrowings made for investmentpurposes) in a diversified portfolio of high yield/high risk securities rated below investment grade but rated at least B byMoody’s Investor Service, Inc. (Moody’s) or Standard & Poor’s Ratings Group (S&P), or, if unrated, determined byPacific Investment Management Company (PIMCO) to be of comparable quality. The remainder of the Portfolio’sassets may be invested in investment grade fixed income instruments. The average duration of the Portfolio normallyvaries within a two- to six-year time frame based on PIMCO’s forecast for interest rates. The Portfolio may investwithout limit in U.S. dollar-denominated securities of foreign issuers. The Portfolio may invest up to 15% of its assets ineuro-denominated securities. The Portfolio normally will hedge at least 75% of its exposure to the euro to reduce therisk of loss due to fluctuations in currency exchange rates. While we make every effort to achieve our objective, wecan’t guarantee success and it is possible that you could lose money.
Principal Risks:‰ credit risk‰ derivatives risk‰ foreign investment risk‰ high yield risk‰ interest rate risk‰ leveraging risk‰ liquidity risk‰ management risk‰ market risk‰ mortgage risk
SP PIMCO Total Return Portfolio
The investment objective of the Portfolio is to seek maximum total return, consistent with preservation of capitaland prudent investment management. The Portfolio seeks to achieve its investment objective by investing undernormal circumstances at least 65% of its assets in a diversified portfolio of fixed income instruments of varyingmaturities. The average portfolio duration of this Portfolio normally varies within a three- to six-year time frame basedon PIMCO’s forecast for interest rates. While we make every effort to achieve our objective, we can’t guaranteesuccess and it is possible that you could lose money.
10

Principal Risks:‰ credit risk‰ derivatives risk‰ interest rate risk‰ management risk
SP Prudential U.S. Emerging Growth Portfolio
The Portfolio’s investment objective is long-term capital appreciation, which means that the Portfolio seeksinvestments whose price will increase over several years. The Portfolio normally invests at least 80% of its investableassets (net assets plus any borrowings made for investment purposes) in equity securities of small and medium-sizedU.S. companies that Jennison Associates LLC believes have the potential for above-average growth. The Portfolio alsomay use derivatives for hedging or to improve the Portfolio’s returns. The Portfolio may actively and frequently trade itsportfolio securities. High portfolio turnover results in higher transaction costs and can affect the Portfolio’s performance.While we make every effort to achieve our objective, we can’t guarantee success and it is possible that you could losemoney.
Principal Risks:‰ company risk‰ foreign investment risk‰ management risk‰ market risk
SP Small/Mid-Cap Value Portfolio
The Portfolio’s investment objective is long-term growth of capital. The Portfolio’s investment strategy includesnormally investing at least 80% of its investable assets (net assets plus any borrowings made for investment purposes)in securities of companies with small to medium market capitalizations (those with market capitalizations similar tocompanies in the S&P Small Cap 600 or the Russell 2000 for small market capitalization and the S&P MidCap 400 orthe Russell Midcap® Index for medium market capitalization). The Portfolio normally invests its assets primarily incommon stocks. The Portfolio invests in securities of companies that Fidelity Management & Research Company(FMR) believes are undervalued in the marketplace in relation to factors such as assets, earnings, growth potential orcash flow, or in relation to securities of other companies in the same industry, (stocks of these companies are oftencalled “value” stocks). The Portfolio invests in domestic and foreign issuers. The Portfolio uses fundamental analysis ofeach issuer’s financial condition, its industry position and market and economic conditions, along with statistical modelsto evaluate growth potential, valuation, liquidity and investment risk to select investments. There is a risk that “value”stocks can perform differently from the market as a whole and other types of stocks and can continue to beundervalued by the markets for long periods of time. An investment in this Portfolio, like any Portfolio, is not a depositof a bank, and is not insured by the Federal Deposit Insurance Corporation or any other government agency. While wemake every effort to achieve our objective, we can’t guarantee success and it is possible that you could lose money.
Principal Risks:‰ company risk‰ foreign investment risk‰ liquidity risk‰ management risk‰ market risk
SP Strategic Partners Focused Growth Portfolio
The Portfolio’s investment objective is long-term growth of capital. This means the Portfolio seeks investmentswhose price will increase over several years. The Portfolio normally invests at least 65% of its total assets in equity-related securities of U.S. companies that the adviser believes to have strong capital appreciation potential. ThePortfolio’s strategy is to combine the efforts of two investment advisers and to invest in the favorite stock selectionideas of three portfolio managers (two of whom invest as a team). Each investment adviser to the Portfolio utilizes agrowth style to select approximately 20 securities. The portfolio managers build a portfolio with stocks in which they
11
have the highest confidence and may invest more than 5% of the Portfolio’s assets in any one issuer. The Portfolio isnondiversified, meaning it can invest a relatively high percentage of its assets in a small number of issuers. Investing ina nondiversified portfolio, particularly a portfolio investing in approximately 40 equity-related securities, involves greaterrisk than investing in a diversified portfolio because a loss resulting from the decline in the value of one security mayrepresent a greater portion of the total assets of a nondiversified portfolio. The Portfolio may actively and frequentlytrade its portfolio securities. While we make every effort to achieve our objective, we can’t guarantee success and it ispossible that you could lose money. This Portfolio is advised by Jennison Associates LLC and Alliance CapitalManagement, L.P.
Principal Risks:‰ company risk‰ foreign investment risk‰ management risk‰ market risk‰ portfolio turnover risk
PRINCIPAL RISKS
Although we try to invest wisely, all investments involve risk. Like any mutual fund, an investment in a Portfolio couldlose value, and you could lose money. The following summarizes the principal risks of investing in the Portfolios.
Company risk. The price of the stock of a particular company can vary based on a variety of factors, such as thecompany’s financial performance, changes in management and product trends, and the potential for takeover andacquisition. This is especially true with respect to equity securities of smaller companies, whose prices may go up anddown more than equity securities of larger, more established companies. Also, since equity securities of smallercompanies may not be traded as often as equity securities of larger, more established companies, it may be difficult orimpossible for a Portfolio to sell securities at a desirable price. Foreign securities have additional risks, includingexchange rate changes, political and economic upheaval, the relative lack of information about these companies,relatively low market liquidity and the potential lack of strict financial and accounting controls and standards.
Credit risk. Debt obligations are generally subject to the risk that the issuer may be unable to make principal andinterest payments when they are due. There is also the risk that the securities could lose value because of a loss ofconfidence in the ability of the borrower to pay back debt. Non-investment grade debt — also known as “high-yieldbonds” and “junk bonds” — have a higher risk of default and tend to be less liquid than higher-rated securities.
Derivatives risk. Derivatives are financial contracts whose value depends on, or is derived from, the value of anunderlying asset, interest rate or index. The Portfolios typically use derivatives as a substitute for taking a position inthe underlying asset and/or as part of a strategy designed to reduce exposure to other risks, such as interest rate orcurrency risk. A Portfolio may also use derivatives for leverage, in which case their use would involve leveraging risk. APortfolio’s use of derivative instruments involves risks different from, or possibly greater than, the risks associated withinvesting directly in securities and other traditional investments. Derivatives are subject to a number of risks describedelsewhere, such as liquidity risk, interest rate risk, market risk, credit risk and management risk. They also involve therisk of mispricing or improper valuation and the risk that changes in the value of the derivative may not correlateperfectly with the underlying asset, rate or index. A Portfolio investing in a derivative instrument could lose more thanthe principal amount invested. Also, suitable derivative transactions may not be available in all circumstances.
Foreign investment risk. Investing in foreign securities generally involves more risk than investing in securities ofU.S. issuers. Foreign investment risk includes the specific risks described below.
Currency risk. Changes in currency exchange rates may affect the value of foreign securities held by a Portfolioand the amount of income available for distribution. If a foreign currency grows weaker relative to the U.S. dollar,the value of securities denominated in that foreign currency generally decreases in terms of U.S. dollars. If aPortfolio does not correctly anticipate changes in exchange rates, its share price could decline as a result. Inaddition, certain hedging activities may cause the Portfolio to lose money and could reduce the amount of incomeavailable for distribution.
12

Emerging market risk. To the extent that a Portfolio invests in emerging markets to enhance overall returns, itmay face higher political, information, and stock market risks. In addition, profound social changes and businesspractices that depart from norms in developed countries’ economies have sometimes hindered the orderly growthof emerging economies and their stock markets in the past. High levels of debt may make emerging economiesheavily reliant on foreign capital and vulnerable to capital flight.
Foreign market risk. Foreign markets, especially those in developing countries, tend to be more volatile than U.S.markets and are generally not subject to regulatory requirements comparable to those in the U.S. Because ofdifferences in accounting standards and custody and settlement practices, investing in foreign securities generallyinvolves more risk than investing in securities of U.S. issuers.
Information risk. Financial reporting standards for companies based in foreign markets usually differ from those inthe United States. Since the “numbers” themselves sometimes mean different things, the sub-advisers devotemuch of their research effort to understanding and assessing the impact of these differences upon a company’sfinancial conditions and prospects.
Liquidity risk. Stocks that trade less can be more difficult or more costly to buy, or to sell, than more liquid oractive stocks. This liquidity risk is a factor of the trading volume of a particular stock, as well as the size andliquidity of the entire local market. On the whole, foreign exchanges are smaller and less liquid than the U.S.market. This can make buying and selling certain shares more difficult and costly. Relatively small transactions insome instances can have a disproportionately large effect on the price and supply of shares. In certain situations, itmay become virtually impossible to sell a stock in an orderly fashion at a price that approaches an estimate of itsvalue.
Political developments. Political developments may adversely affect the value of a Portfolio’s foreign securities.
Political risk. Some foreign governments have limited the outflow of profits to investors abroad, extendeddiplomatic disputes to include trade and financial relations, and imposed high taxes on corporate profits.
Regulatory risk. Some foreign governments regulate their exchanges less stringently, and the rights ofshareholders may not be as firmly established.
High yield risk. Portfolios that invest in high yield securities and unrated securities of similar credit quality (commonlyknown as “junk bonds”) may be subject to greater levels of interest rate, credit and liquidity risk than Portfolios that donot invest in such securities. High yield securities are considered predominantly speculative with respect to the issuer’scontinuing ability to make principal and interest payments. An economic downturn or period of rising interest rates couldadversely affect the market for high yield securities and reduce a Portfolio’s ability to sell its high yield securities(liquidity risk).
Industry/sector risk. Portfolios that invest in a single market sector or industry can accumulate larger positions insingle issuers or an industry sector. As a result, the Portfolio’s performance may be tied more directly to the success orfailure of a smaller group of portfolio holdings.
Interest rate risk. Fixed income securities are subject to the risk that the securities could lose value because ofinterest rate changes. For example, bonds tend to decrease in value if interest rates rise. Debt obligations with longermaturities sometimes offer higher yields, but are subject to greater price shifts as a result of interest rate changes thandebt obligations with shorter maturities.
Leveraging risk. Certain transactions may give rise to a form of leverage. Such transactions may include, amongothers, reverse repurchase agreements, loans of portfolio securities, and the use of when-issued, delayed delivery orforward commitment contracts. The use of derivatives may also create leveraging risks. To mitigate leveraging risk, asub-adviser can segregate liquid assets or otherwise cover the transactions that may give rise to such risk. The use ofleverage may cause a Portfolio to liquidate portfolio positions when it may not be advantageous to do so to satisfy itsobligations or to meet segregation requirements. Leverage, including borrowing, may cause a Portfolio to be morevolatile than if the Portfolio had not been leveraged. This is because leveraging tends to exaggerate the effect of anyincrease or decrease in the value of a Portfolio’s securities.
13

Liquidity risk. Liquidity risk exists when particular investments are difficult to purchase or sell. A Portfolio’sinvestments in illiquid securities may reduce the returns of the Portfolio because it may be unable to sell the illiquidsecurities at an advantageous time or price. Portfolios with principal investment strategies that involve foreignsecurities, derivatives or securities with substantial market and/or credit risk tend to have the greatest exposure toliquidity risk.
Management risk. Actively managed investment portfolios are subject to management risk. Each sub-adviser willapply investment techniques and risk analyses in making investment decisions for the Portfolios, but there can be noguarantee that these will produce the desired results.
Market risk. Common stocks are subject to market risk stemming from factors independent of any particular security.Investment markets fluctuate. All markets go through cycles and market risk involves being on the wrong side of acycle. Factors affecting market risk include political events, broad economic and social changes, and the mood of theinvesting public. You can see market risk in action during large drops in the stock market. If investor sentiment turnsgloomy, the price of all stocks may decline. It may not matter that a particular company has great profits and its stock isselling at a relatively low price. If the overall market is dropping, the values of all stocks are likely to drop. Generally, thestock prices of large companies are more stable than the stock prices of smaller companies, but this is not always thecase. Smaller companies often offer a smaller range of products and services than large companies. They may alsohave limited financial resources and may lack management depth. As a result, stocks issued by smaller companiesmay fluctuate in value more than the stocks of larger, more established companies.
Mortgage risk. A Portfolio that purchases mortgage related securities is subject to certain additional risks. Risinginterest rates tend to extend the duration of mortgage-related securities, making them more sensitive to changes ininterest rates. As a result, in a period of rising interest rates, a Portfolio that holds mortgage-related securities mayexhibit additional volatility. This is known as extension risk. In addition, mortgage-related securities are subject toprepayment risk. When interest rates decline, borrowers may pay off their mortgages sooner than expected. This canreduce the returns of a Portfolio because the Portfolio will have to reinvest that money at the lower prevailing interestrates.
Portfolio turnover risk. A Portfolio’s investments may be bought and sold relatively frequently. A high turnover ratemay result in higher brokerage commissions and taxable capital gain distributions to a Portfolio’s shareholders.
* * *
For more information about the risks associated with the Portfolios, see “How the Portfolios Invest — InvestmentRisks.”
* * *
14
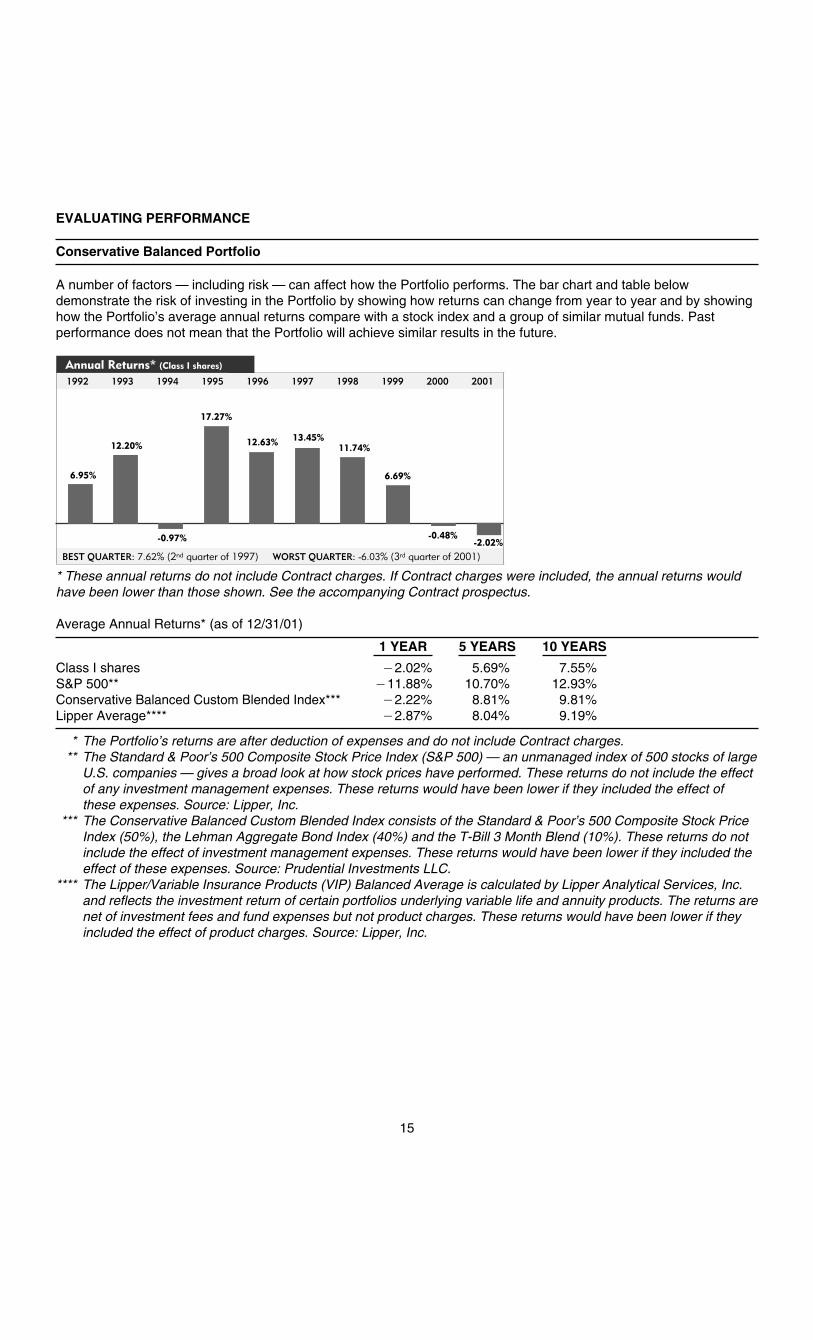
EVALUATING PERFORMANCE
Conservative Balanced Portfolio
A number of factors — including risk — can affect how the Portfolio performs. The bar chart and table belowdemonstrate the risk of investing in the Portfolio by showing how returns can change from year to year and by showinghow the Portfolio’s average annual returns compare with a stock index and a group of similar mutual funds. Pastperformance does not mean that the Portfolio will achieve similar results in the future.
* These annual returns do not include Contract charges. If Contract charges were included, the annual returns wouldhave been lower than those shown. See the accompanying Contract prospectus.
Average Annual Returns* (as of 12/31/01)
1 YEAR 5 YEARS 10 YEARS
Class I shares �2.02% 5.69% 7.55%S&P 500** �11.88% 10.70% 12.93%Conservative Balanced Custom Blended Index*** �2.22% 8.81% 9.81%Lipper Average**** �2.87% 8.04% 9.19%
* The Portfolio’s returns are after deduction of expenses and do not include Contract charges.** The Standard & Poor’s 500 Composite Stock Price Index (S&P 500) — an unmanaged index of 500 stocks of largeU.S. companies — gives a broad look at how stock prices have performed. These returns do not include the effectof any investment management expenses. These returns would have been lower if they included the effect ofthese expenses. Source: Lipper, Inc.
*** The Conservative Balanced Custom Blended Index consists of the Standard & Poor’s 500 Composite Stock PriceIndex (50%), the Lehman Aggregate Bond Index (40%) and the T-Bill 3 Month Blend (10%). These returns do notinclude the effect of investment management expenses. These returns would have been lower if they included theeffect of these expenses. Source: Prudential Investments LLC.
**** The Lipper/Variable Insurance Products (VIP) Balanced Average is calculated by Lipper Analytical Services, Inc.and reflects the investment return of certain portfolios underlying variable life and annuity products. The returns arenet of investment fees and fund expenses but not product charges. These returns would have been lower if theyincluded the effect of product charges. Source: Lipper, Inc.
15
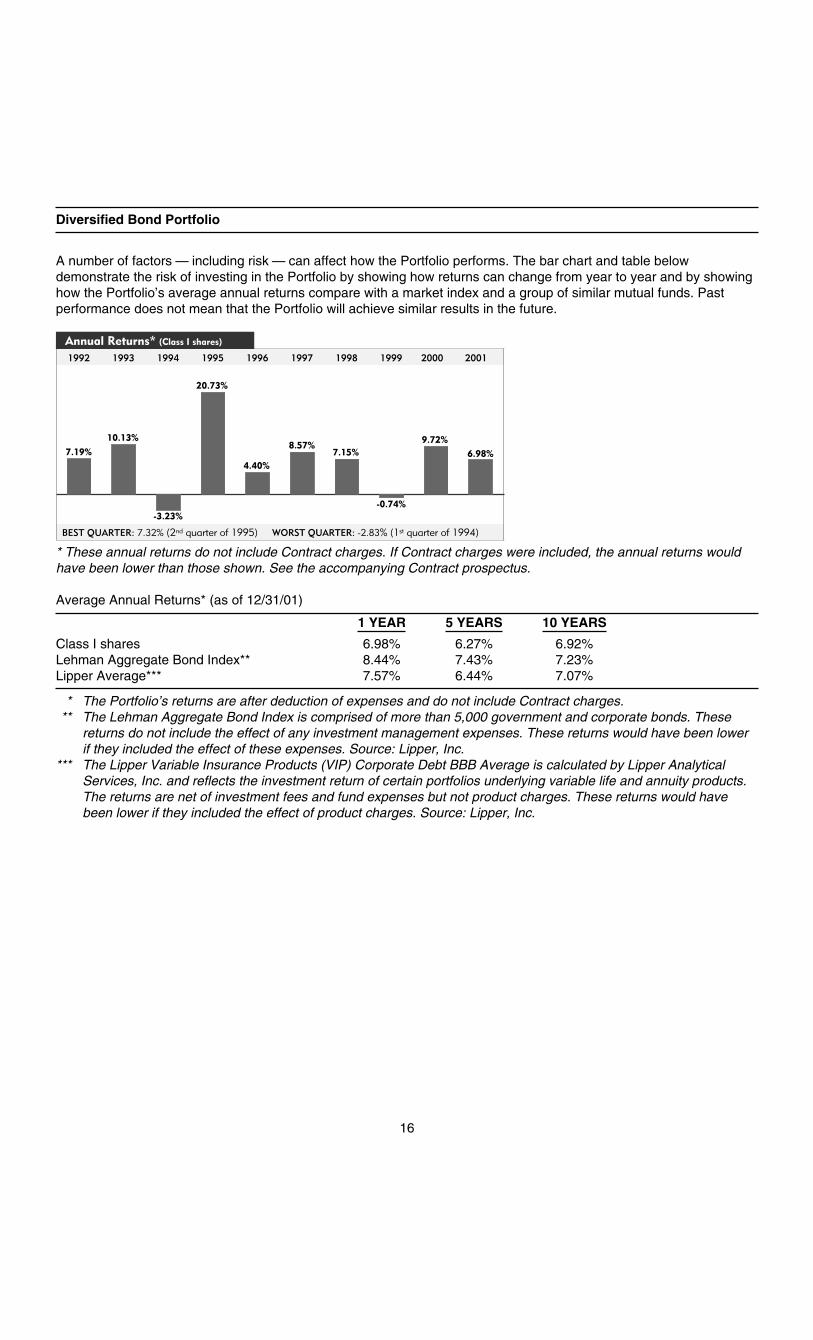
Diversified Bond Portfolio
A number of factors — including risk — can affect how the Portfolio performs. The bar chart and table belowdemonstrate the risk of investing in the Portfolio by showing how returns can change from year to year and by showinghow the Portfolio’s average annual returns compare with a market index and a group of similar mutual funds. Pastperformance does not mean that the Portfolio will achieve similar results in the future.
* These annual returns do not include Contract charges. If Contract charges were included, the annual returns wouldhave been lower than those shown. See the accompanying Contract prospectus.
Average Annual Returns* (as of 12/31/01)
1 YEAR 5 YEARS 10 YEARS
Class I shares 6.98% 6.27% 6.92%Lehman Aggregate Bond Index** 8.44% 7.43% 7.23%Lipper Average*** 7.57% 6.44% 7.07%
* The Portfolio’s returns are after deduction of expenses and do not include Contract charges.** The Lehman Aggregate Bond Index is comprised of more than 5,000 government and corporate bonds. These
returns do not include the effect of any investment management expenses. These returns would have been lowerif they included the effect of these expenses. Source: Lipper, Inc.
*** The Lipper Variable Insurance Products (VIP) Corporate Debt BBB Average is calculated by Lipper AnalyticalServices, Inc. and reflects the investment return of certain portfolios underlying variable life and annuity products.The returns are net of investment fees and fund expenses but not product charges. These returns would havebeen lower if they included the effect of product charges. Source: Lipper, Inc.
16

Equity Portfolio
A number of factors — including risk — can affect how the Portfolio performs. The bar chart and table belowdemonstrate the risk of investing in the Portfolio by showing how returns can change from year to year and by showinghow the Portfolio’s average annual returns compare with a stock index and a group of similar mutual funds. Pastperformance does not mean that the Portfolio will achieve similar results in the future.
* These annual returns do not include Contract charges. If Contract charges were included, the annual returns wouldhave been lower than those shown. See the accompanying Contract prospectus.
Average Annual Returns* (as of 12/31/01)
1 YEAR 5 YEARS 10 YEARS
SINCECLASS IIINCEPTION(5/3/99)
Class I shares �11.18% 7.06% 12.09% —Class II shares �11.57% — — �3.75%S&P 500** �11.88% 10.70% 12.93% �4.31%Russell 1000® Index*** �20.42% 8.27% 10.79% —Lipper Average**** �13.03% 7.94% 11.14% —
* The Portfolio’s returns are after deduction of expenses and do not include Contract charges.** The Standard & Poor’s 500 Composite Stock Price Index (S&P 500) — an unmanaged index of 500 stocks of largeU.S. companies — gives a broad look at how stock prices have performed. These returns do not include the effectof any investment management expenses. These returns would have been lower if they included the effect ofthese expenses. Source: Lipper, Inc.
*** The Russell 1000® Index consists of the 1000 largest securities in the Russell 3000 Index. The Russell 3000 Indexconsists of the 3000 largest companies, as determined by market capitalization. These returns do not include theeffect of any investment management expenses. These returns would have been lower if they included the effectof these expenses. Source: Lipper, Inc.
**** The Lipper Variable Insurance Products (VIP) Large Cap Core Funds Average is calculated by Lipper AnalyticalServices, Inc. and reflects the investment return of certain portfolios underlying variable life and annuity products.The returns are net of investment fees and fund expenses but not product charges. These returns would havebeen lower if they included the effect of these charges. Source: Lipper, Inc.
17

Flexible Managed Portfolio
A number of factors — including risk — can affect how the Portfolio performs. The bar chart and table belowdemonstrate the risk of investing in the Portfolio by showing how returns can change from year to year and by showinghow the Portfolio’s average annual returns compare with a market index and a group of similar mutual funds. Pastperformance does not mean that the Portfolio will achieve similar results in the future.
* These annual returns do not include Contract charges. If Contract charges were included, the annual returns wouldhave been lower than those shown. See the accompanying Contract prospectus.
Average Annual Returns* (as of 12/31/01)
1 YEAR 5 YEARS 10 YEARS
Class I shares �5.68% 5.43% 8.27%S&P 500** �11.88% 10.70% 12.93%Flexible ManagedCustom Blended Index*** �4.00% 9.26% 10.52%
Lipper Average**** �5.27% 7.95% 9.62%
* The Portfolio’s returns are after deduction of expenses and do not include Contract charges.** The Standard & Poor’s 500 Composite Stock Price Index (S&P 500) — an unmanaged index of 500 stocks oflarge U.S. companies — gives a broad look at how stock prices have performed. These returns do not include theeffect of any investment management expenses. These returns would have been lower if they included the effectof these expenses. Source: Lipper, Inc.
*** The Flexible Managed Custom Blended Index consists of the S&P 500 (60%), the Lehman Aggregate Bond Index(35%) and the T-Bill 3-month Blend (5%). The returns do not include the effect of any investment managementexpenses. These returns would have been lower if they included the effect of these expenses. Source PrudentialInvestments LLC.
**** The Lipper Variable Insurance Products (VIP) Flexible Portfolio Funds Average is calculated by Lipper AnalyticalServices, Inc. and reflects the investment return of certain portfolios underlying variable life and annuity products.The returns are net of investment fees and fund expenses but not product charges. These returns would havebeen lower if they included the effect of these charges. Source: Lipper, Inc.
18
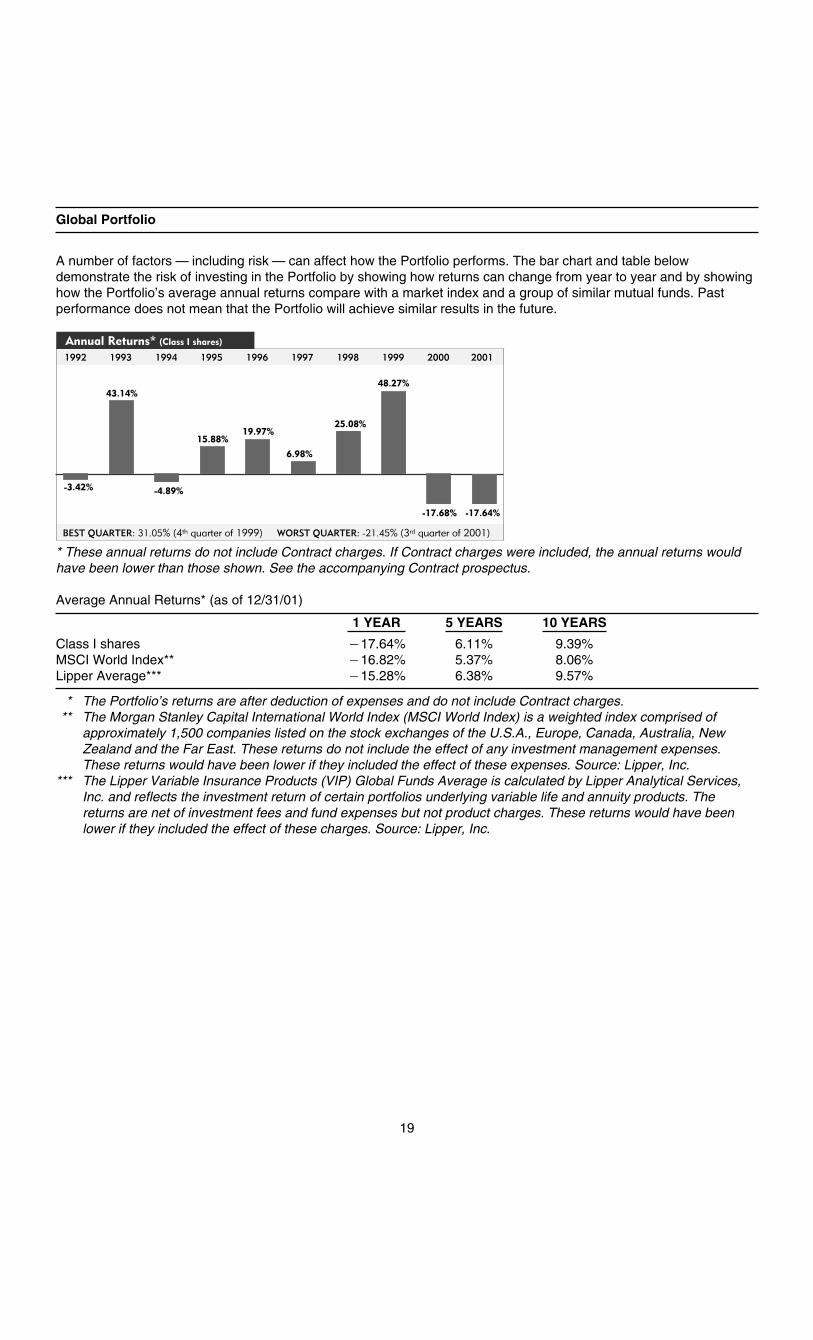
Global Portfolio
A number of factors — including risk — can affect how the Portfolio performs. The bar chart and table belowdemonstrate the risk of investing in the Portfolio by showing how returns can change from year to year and by showinghow the Portfolio’s average annual returns compare with a market index and a group of similar mutual funds. Pastperformance does not mean that the Portfolio will achieve similar results in the future.
* These annual returns do not include Contract charges. If Contract charges were included, the annual returns wouldhave been lower than those shown. See the accompanying Contract prospectus.
Average Annual Returns* (as of 12/31/01)
1 YEAR 5 YEARS 10 YEARS
Class I shares �17.64% 6.11% 9.39%MSCI World Index** �16.82% 5.37% 8.06%Lipper Average*** �15.28% 6.38% 9.57%
* The Portfolio’s returns are after deduction of expenses and do not include Contract charges.** The Morgan Stanley Capital International World Index (MSCI World Index) is a weighted index comprised of
approximately 1,500 companies listed on the stock exchanges of the U.S.A., Europe, Canada, Australia, NewZealand and the Far East. These returns do not include the effect of any investment management expenses.These returns would have been lower if they included the effect of these expenses. Source: Lipper, Inc.
*** The Lipper Variable Insurance Products (VIP) Global Funds Average is calculated by Lipper Analytical Services,Inc. and reflects the investment return of certain portfolios underlying variable life and annuity products. Thereturns are net of investment fees and fund expenses but not product charges. These returns would have beenlower if they included the effect of these charges. Source: Lipper, Inc.
19

High Yield Bond Portfolio
A number of factors — including risk — can affect how the Portfolio performs. The bar chart and table belowdemonstrate the risk of investing in the Portfolio by showing how returns can change from year to year and by showinghow the Portfolio’s average annual returns compare with a market index and a group of similar mutual funds. Pastperformance does not mean that the Portfolio will achieve similar results in the future.
* These annual returns do not include Contract charges. If Contract charges were included, the annual returns wouldhave been lower than those shown. See the accompanying Contract prospectus.
Average Annual Returns* (as of 12/31/01)
1 YEAR 5 YEARS 10 YEARS
Class I shares �0.44% 1.28% 6.64%Lehman High Yield Index** 5.28% 3.11% 7.58%Lipper Average*** 1.13% 1.60% 6.59%
* The Portfolio’s returns are after deduction of expenses and do not include Contract charges.** The Lehman High Yield Index is made up of over 700 noninvestment grade bonds. The index is an unmanaged
index that includes the reinvestment of all interest but does not reflect the payment of transaction costs andadvisory fees associated with an investment in the Portfolio. These returns would have been lower if they includedthe effect of these expenses. Source: Lipper, Inc.
*** The Lipper Variable Insurance Products (VIP) High Current Yield Funds Average is calculated by Lipper AnalyticalServices, Inc. and reflects the investment return of certain portfolios underlying variable life and annuity products.The returns are net of investment fees and fund expenses but not product charges. These returns would havebeen lower if they included the effect of these charges. Source: Lipper, Inc.
20

Jennison Portfolio (formerly, Prudential Jennison Portfolio)
A number of factors — including risk — can affect how the Portfolio performs. The bar chart and table belowdemonstrate the risk of investing in the Portfolio by showing how returns can change from year to year and by showinghow the Portfolio’s average annual returns compare with a stock index and a group of similar mutual funds. Pastperformance does not mean that the Portfolio will achieve similar results in the future.
* These annual returns do not include Contract charges. If Contract charges were included, the annual returns wouldhave been lower than those shown. See the accompanying Contract prospectus.
Average Annual Returns* (as of 12/31/01)
1 YEAR 5 YEARS
SINCE CLASS IINCEPTION(4/25/95)
SINCE CLASS IIINCEPTION(2/10/00)
Class I shares �18.25% 11.70% 14.66% —Class II shares �18.60% — — �21.45%S&P 500** �11.88% 10.70% 14.66% �8.50%Russell 1000® Growth Index*** �20.42% 8.27% 12.90% —Lipper Average**** �21.88% 8.75% 12.70% —
* The Portfolio’s returns are after deduction of expenses and do not include Contract charges.** The Standard & Poor’s 500 Composite Stock Price Index (S&P 500) — an unmanaged index of 500 stocks of large
U.S. Companies — gives a broad look at how stock prices have performed. These returns do not include the effectof any investment management expenses. These returns would have been lower if they included the effect ofthese expenses. The “Since Inception” return reflects the closest calendar month-end return. Source: Lipper, Inc.
*** The Russell 1000® Growth Index consists of those securities included in the Russell 1000 Index that have agreater-than-average growth orientation. These returns do not include the effect of any investment managementexpenses. These returns would have been lower if they included the effect of these expenses. The “SinceInception” return reflects the closest calendar month-end return. Source: Lipper, Inc.
**** The Lipper Variable Insurance Products (VIP) Large Cap Growth Funds Average is calculated by Lipper AnalyticalServices, Inc. and reflects the investment return of certain portfolios underlying variable life and annuity products.The returns are net of investment fees and fund expenses but not product charges. These returns would havebeen lower if they included the effect of these charges. The “Since Inception” return reflects the closest calendarmonth-end return. Source: Lipper, Inc.
21

Money Market Portfolio
A number of factors — including risk — can affect how the Portfolio performs. The bar chart and table belowdemonstrate the risk of investing in the Portfolio by showing how returns can change from year to year and by showinghow the Portfolio’s average annual returns compare with a group of similar mutual funds. Past performance does notassure that the Portfolio will achieve similar results in the future.
* These annual returns do not include Contract charges. If Contract charges were included, the annual returns wouldhave been lower than those shown. See the accompanying Contract prospectus.
Average Annual Returns* (as of 12/31/01)
1 YEAR 5 YEARS 10 YEARS
Class I shares 4.22% 5.24% 4.80%Lipper Average** 3.73% 4.96% 4.54%
* The Portfolio’s returns are after deduction of expenses and do not include Contract charges.** The Lipper Variable Insurance Products (VIP) Money Market Average is calculated by Lipper Analytical Services,
Inc., and reflects the investment return of certain portfolios underlying variable life and annuity products. Thesereturns are net of investment fees and fund expenses but not product charges. These returns would have beenlower if they included the effect of these charges. Source: Lipper, Inc.
7-Day Yield* (as of 12/31/01)
Money Market Portfolio 1.89%Average Money Market Fund** 1.45%
* The Portfolio’s yield is after deduction of expenses and does not include Contract charges.** Source: iMoneyNet, Inc. As of 12/31/01, based on the iMoneyNet First and Second Tier General Purpose Retail
Universe.
22

Stock Index Portfolio
A number of factors — including risk — can affect how the Portfolio performs. The bar chart and table belowdemonstrate the risk of investing in the Portfolio by showing how returns can change from year to year and by showinghow the Portfolio’s average annual returns compare with a stock index and a group of similar mutual funds. Pastperformance does not mean that the Portfolio will achieve similar results in the future.
* These annual returns do not include Contract charges. If Contract charges were included, the annual returns wouldhave been lower than those shown. See the accompanying Contract prospectus.
Average Annual Returns* (as of 12/31/01)
1 YEAR 5 YEARS 10 YEARS
Class I shares �12.05% 10.47% 12.61%S&P 500** �11.88% 10.70% 12.93%Lipper Average*** �12.22% 10.37% 12.53%
* The Portfolio’s returns are after deduction of expenses and do not include Contract charges.** The Standard & Poor’s 500 Composite Stock Price Index (S&P 500) — an unmanaged index of 500 stocks of large
U.S. companies — gives a broad look at how stock prices have performed. These returns do not include the effectof any investment management expenses. These returns would have been lower if they included the effect ofthese expenses. Source: Lipper, Inc.
*** The Lipper Variable Insurance Products (VIP) S&P 500 Index Funds Average is calculated by Lipper AnalyticalServices, Inc. and reflects the investment return of certain portfolios underlying variable life and annuity products.The returns are net of investment fees and fund expenses but not product charges. These returns would havebeen lower if they included the effect of these charges. Source: Lipper, Inc.
23

Value Portfolio
A number of factors — including risk — can affect how the Portfolio performs. The bar chart and table belowdemonstrate the risk of investing in the Portfolio by showing how returns can change from year to year and by showinghow the Portfolio’s average annual returns compare with a stock index and a group of similar mutual funds. Pastperformance does not mean that the Portfolio will achieve similar results in the future.
* These annual returns do not include Contract charges. If Contract charges were included, the annual returns wouldhave been lower than those shown. See the accompanying Contract prospectus.
Average Annual Returns* (as of 12/31/01)
1 YEAR 5 YEARS 10 YEARS
Class I Shares �2.08% 11.18% 13.14%S&P 500** �11.88% 10.70% 12.93%Russell® 1000 Value Index*** �5.59% 11.13% 14.13%Lipper Large Cap Value FundsAverage**** �5.98% 8.68% 12.38%
Lipper Multi Cap Value Funds Average**** �0.22% 9.81% 11.17%
* The Portfolio’s returns are after deduction of expenses and do not include Contract charges. Returns shown arefor Class I shares only. Returns are not shown for Class II shares, because Class II shares have not yet been inexistence for a full calendar year (Class II inception date: 5/14/01). Returns for Class II shares would have beenlower than for Class I due to higher expenses.
** The Standard & Poor’s 500 Composite Stock Price Index (S&P 500) — an unmanaged index of 500 stocks of largeU.S. companies — gives a broad look at how stock prices have performed. These returns do not include the effectof investment management expenses. These returns would have been lower if they included the effect of theseexpenses. Source: Lipper, Inc.
*** The Russell® 1000 Value Index consists of those securities included in the Russell 1000 Index that have a less-than-average growth orientation. These returns do not include the effect of investment management expenses.These returns would have been lower if they included the effect of these expenses. Source: Lipper, Inc.
**** The Lipper Variable Insurance Products (VIP) Large Cap Value Funds Average and Multi Cap Value FundsAverage are calculated by Lipper Analytical Services, Inc. and reflect the return of certain portfolios underlyingvariable life and annuity products. The returns are net of investment fees and fund expenses but not productcharges. These returns would have been lower if they included the effect of these charges. Although Lipperclassifies the Portfolio within the Multi Cap Value Funds Average, the returns for the Large Cap Value FundsAverage is also shown, because the management of the portfolios included in the Large Cap Value Funds Averageare more consistent with the management of the Portfolio.
24

SP Aggressive Growth Asset Allocation Portfolio
A number of factors — including risk — can affect how the Portfolio performs. The bar chart and table belowdemonstrate the risk of investing in the Portfolio by showing how the Portfolio’s average annual returns compare with astock index and a group of similar mutual funds. Past performance does not mean that the Portfolio will achieve similarresults in the future.
* These annual returns do not include Contract charges. If Contract charges were included, the annual returns wouldhave been lower than those shown. See the accompanying Contract prospectus.
Average Annual Returns* (as of 12/31/01)
1 YEAR
SINCEINCEPTION(9/22/00)
Class I shares �17.92% �18.84%S&P 500** �11.88% �15.32%Aggressive Growth AA Custom Blended Index*** �12.46% �16.17%Lipper Average**** �12.94% �15.14%
* The Portfolio’s returns are after deduction of expenses and do not include Contract charges.** The Standard & Poor’s 500 Composite Stock Price Index (S&P 500) — an unmanaged index of 500 stocks of largeU.S. companies — gives a broad look at how stock prices have performed. These returns do not include the effectof any investment management expenses. These returns would have been lower if they included the effect ofthese expenses. The “Since Inception” return reflects the closest calendar month-end return. Source: Lipper, Inc.
*** The Aggressive Growth AA Custom Blended Index consists of the Russell® 1000 Value Index (20%), the Russell1000 Growth Index (20%), the Russell 2500 Value Index (12.5%), the Russell Mid-Cap Growth Index (12.5%), andthe MSCI EAFE Index (35%). These returns do not include the effect of any investment management expenses.These returns would have been lower if they included the effect of these expenses. The “Since Inception” returnreflects the closest calendar month-end return. Source:
**** The Lipper Variable Insurance Products (VIP) Multi-Cap Core Funds Average is calculated by Lipper AnalyticalServices, Inc. and reflects the investment return of certain portfolios underlying variable life and annuity products.The returns are net of investment fees and fund expenses but not product charges. These returns would havebeen lower if they included the effect of these charges. The “Since Inception” return reflects the closest calendarmonth-end return. Source: Lipper, Inc.
25

SP AIM Aggressive Growth Portfolio
A number of factors — including risk — can affect how the Portfolio performs. The bar chart and table belowdemonstrate the risk of investing in the Portfolio by showing how the Portfolio’s average annual returns compare with astock index and a group of similar mutual funds. Past performance does not mean that the Portfolio will achieve similarresults in the future.
* These annual returns do not include Contract charges. If Contract charges were included, the annual returns wouldhave been lower than those shown. See the accompanying Contract prospectus.
Average Annual Returns* (as of 12/31/01)
1 YEAR
SINCEINCEPTION(9/22/00)
Class I shares �24.53% �28.74%Russell 2500® Index** 1.22% �2.00%Russell 2500™ Growth Index*** �10.75% �23.14%Lipper Average**** �23.31% �32.40%
* The Portfolio’s returns are after deduction of expenses and do not include Contract charges.** The Russell 2500® Index measures the performance of the 500 smallest companies in the Russell 1000 Index andall 2000 companies included in the Russell 2000 Index. These returns do not include the effect of any investmentmanagement expenses. These returns would have been lower if they included the effect of these expenses. The“Since Inception” return reflects the closest calendar month-end return. Source: Lipper, Inc.
*** The Russell 2500™ Growth Index measures the performance of the 2,500 smallest companies in the Russell 3000Index, which represents approximately 16% of the total market capitalization of the Russell 3000 Index. Thesereturns do not include the effect of any investment management expenses. These returns would have been lowerif they included the effect of these expenses. The “Since Inception” return reflects the closest calendar month-endreturn. Source: Lipper, Inc.
**** The Lipper Variable Insurance Products (VIP) Mid-Cap Growth Funds Average is calculated by Lipper AnalyticalServices, Inc. and reflects the investment return of certain portfolios underlying variable life and annuity products.The returns are net of investment fees and fund expenses but not product charges. These returns would havebeen lower if they included the effect of these charges. The “Since Inception” return reflects the closest calendarmonth-end return. Source: Lipper, Inc.
26

SP AIM Core Equity Portfolio (formerly, SP AIM Growth and Income Portfolio)
A number of factors — including risk — can affect how the Portfolio performs. The bar chart and table belowdemonstrate the risk of investing in the Portfolio by showing how the Portfolio’s average annual returns compare with astock index and a group of similar mutual funds. Past performance does not mean that the Portfolio will achieve similarresults in the future.
* These annual returns do not include Contract charges. If Contract charges were included, the annual returns wouldhave been lower than those shown. See the accompanying Contract prospectus.
Average Annual Returns* (as of 12/31/01)
1 YEAR
SINCEINCEPTION(9/22/00)
Class I Shares �22.68% �28.53%S&P 500** �11.88% �15.32%Russell 1000® Index*** �12.45% �16.74%Lipper Large Cap Growth Funds Average**** �21.88% �28.52%Lipper Large Cap Core Funds Average**** �13.03% �15.58%
* The Portfolio’s returns are after deduction of expenses and do not include Contract charges.** The Standard & Poor’s 500 Composite Stock Price Index (S&P 500) — an unmanaged index of 500 stocks of largeU.S. companies — gives a broad look at how stock prices have performed. These returns do not include the effectof investment management expenses. These returns would have been lower if they included the effect of theseexpenses. The “Since Inception” return reflects the closest calendar month-end return. Source: Lipper, Inc.
*** The Russell 1000® Index consists of the 1000 largest companies included in the Russell 3000 Index. The Russell3000 Index consists of the 3000 largest companies, as determined by market capitalization. These returns do notinclude the effect of investment management expenses. These returns would have been lower if they included theeffect of these expenses. The “Since Inception” return reflects the closest calendar month-end return. Source:Lipper, Inc.
**** The Lipper Variable Insurance Products (VIP) Large Cap Growth Funds Average and Large Cap Core FundsAverage are calculated by Lipper Analytical Services, Inc. and reflects the return of certain portfolios underlyingvariable life and annuity products. The returns are net of investment fees and fund expenses but not productcharges. These returns would have been lower if they included the effect of these charges. The “Since Inception”return reflects the closest calendar month-end return. Although Lipper classifies the Portfolio within the Large CapGrowth Funds Average, the returns for the Large Cap Core Funds Average is also shown, because themanagement of the portfolios included in the Large Cap Core Funds Average is more consistent with themanagement of the Portfolio.
27

SP Alliance Large Cap Growth Portfolio
A number of factors — including risk — can affect how the Portfolio performs. The bar chart and table belowdemonstrate the risk of investing by showing how the Portfolio’s average annual returns compare with a stock indexand a group of similar mutual funds. Past performance does not mean that the Portfolio will achieve similar results inthe future.
* These annual returns do not include Contract charges. If Contract charges were included, the annual returns wouldhave been lower than those shown. See the accompanying Contract prospectus.
Average Annual Returns* (as of 12/31/01)
1 YEAR
SINCEINCEPTION(9/22/00)
Class I shares �14.47% �21.71%Russell 1000® Index** �12.45% �16.74%Russell 1000® Growth Index*** �20.42% �31.26%Lipper Large Cap Growth Funds Average**** �21.88% �28.52%Lipper Multi-Cap Core Funds Average**** �12.94% �15.14%
* The Portfolio’s returns are after deduction of expenses and do not include Contract charges.** The Russell 1000® Index consists of the 1000 largest companies in the Russell 3000 Index. The Russell 3000Index consists of the 3000 largest companies, as determined by market capitalization. These returns do notinclude the effect of investment management expenses. These returns would have been lower if they included theeffect of these expenses. The “Since Inception” return reflects the closest calendar month-end return. Source:Lipper, Inc.
*** The Russell 1000® Growth Index consists of those securities included in the Russell 1000 Index that have agreater-than-average growth orientation. These returns do not include the effect of investment managementexpenses. The returns would have been lower if they included the effect of these expenses. The “Since Inception”return reflects the closest calendar month-end return.
**** The Lipper Variable Insurance Products (VIP) Large Cap Growth Funds Average and Multi-Cap Core FundsAverage are calculated by Lipper Analytical Services, Inc. and reflects the return of certain portfolios underlyingvariable life and annuity products. The returns are net of investment fees and fund expenses but not productcharges. These returns would have been lower if they included the effect of these charges. The “Since Inception”return reflects the closest calendar month-end return. Although Lipper classifies the Portfolio within the Multi-CapCore Funds Average, the returns for the Large Cap Growth Funds Average is also shown, because themanagement of the portfolios included in the Large Cap Growth Funds average is more consistent with themanagement of the Portfolio.
28

SP Alliance Technology Portfolio
A number of factors — including risk — can affect how the Portfolio performs. The bar chart and table belowdemonstrate the risk of investing in the Portfolio by showing how the Portfolio’s average annual returns compare with astock index and a group of similar mutual funds. Past performance does not mean that the Portfolio will achieve similarresults in the future.
* These annual returns do not include Contract charges. If Contract charges were included, the annual returns wouldhave been lower than those shown. See the accompanying Contract prospectus.
Average Annual Returns* (as of 12/31/01)
1 YEAR
SINCEINCEPTION(9/22/00)
Class I shares �25.07% �35.49%S&P 500** �11.88% �15.32%S&P Supercomposite 1500Technology Index*** �22.16% �39.58%Lipper Average**** �21.29% �27.50%
* The Portfolio’s returns are after deduction of expenses and do not include Contract charges.** The Standard & Poor’s 500 Composite Stock Price Index (S&P 500) — an unmanaged index of 500 stocks of largeU.S. companies — gives a broad look at how stock prices have performed. These returns do not include the effectof investment management expenses. These returns would have been lower if they included the effect of theseexpenses. The “Since Inception” return reflects the closest calendar month-end return. Source: Lipper, Inc.
*** The Standard & Poor’s Supercomposite 1500 Technology Index is a capitalization-weighted index designed tomeasure the performance of the technology component of the S&P 500 Index. These returns do not include theeffect of investment management expenses. These returns would have been lower if they included the effect ofthese expenses. The “Since Inception” return reflects the closest calendar month-end return. Source: Lipper, Inc.
**** The Lipper Variable Insurance Products (VIP) Specialty/Miscellaneous Funds Average is calculated by LipperAnalytical Services, Inc. and reflects the investment return of certain portfolios underlying variable life and annuityproducts. The returns are net of investment fees and fund expenses but not product charges. These returns wouldhave been lower if they included the effect of these charges. The “Since Inception” return reflects the closestcalendar month-end return. Source: Lipper, Inc.
29

SP Balanced Asset Allocation Portfolio
A number of factors — including risk — can affect how the Portfolio performs. The bar chart and table belowdemonstrate the risk of investing in the Portfolio by showing how the Portfolio’s average annual returns compare withmarket indexes and a group of similar mutual funds. Past performance does not mean that the Portfolio will achievesimilar results in the future.
* These annual returns do not include Contract charges. If Contract charges were included, the annual returns wouldhave been lower than those shown. See the accompanying Contract prospectus.
Average Annual Returns* (as of 12/31/01)
1 YEAR
SINCEINCEPTION(9/22/00)
Class I shares �5.99% �5.79%S&P 500** �11.88% �15.32%Balanced AA Custom Blended Index*** �2.97% �5.95%Lipper Average**** �2.87% �2.87%
* The Portfolio’s returns are after deduction of expenses and do not include Contract charges.** The Standard & Poor’s 500 Composite Stock Price Index (S&P 500) — an unmanaged index of 500 stocks of largeU.S. companies — gives a broad look at how stock prices have performed. These returns do not include the effectof any investment management expenses. These returns would have been lower if they included the effect ofthese expenses. The “Since Inception” return reflects the closest calendar month-end return. Source: Lipper, Inc.
*** The Balanced AA Custom Blended Index consists of the Russell 1000® Value Index (17.5%), the Russell 1000Growth Index (17.5%), the Russell 2500 Value Index (7.5%), the Russell Mid-Cap Growth Index (7.5%), theLehman Brothers Aggregate Bond Index (25%), the Lehman Brothers Intermediate BB Index (15%) and the MSCIEAFE Index (10%). These returns do not include the effect of any investment management expenses. Thesereturns would have been lower if they included the effect of these expenses. The “Since Inception” return reflectsthe closest calendar month-end return. Source: Prudential Investments LLC.
**** The Lipper Variable Insurance Products (VIP) Balanced Funds Average is calculated by Lipper Analytical Services,Inc. and reflects the investment return of certain portfolios underlying variable life and annuity products. Thereturns are net of investment fees and fund expenses but not product charges. These returns would have beenlower if they included the effect of these charges. The “Since Inception” return reflects the closest calendar month-end return. Source: Lipper, Inc.
30

SP Conservative Asset Allocation Portfolio
A number of factors — including risk — can affect how the Portfolio performs. The bar chart and table belowdemonstrate the risk of investing in the Portfolio by showing how the Portfolio’s average annual returns compare withmarket indexes and a group of similar mutual funds. Past performance does not mean that the Portfolio will achievesimilar results in the future.
* These annual returns do not include Contract charges. If Contract charges were included, the annual returns wouldhave been lower than those shown. See the accompanying Contract prospectus.
Average Annual Returns* (as of 12/31/01)
1 YEAR
SINCEINCEPTION(9/22/00)
Class I shares �0.23% 0.47%S&P 500** �11.88% �15.32%Conservative AA Custom Blended Index*** 1.68% �0.63%Lipper Average**** �0.28% 0.70%
* The Portfolio’s returns are after deduction of expenses and do not include Contract charges.** The Standard & Poor’s 500 Composite Stock Price Index (S&P 500) — an unmanaged index of 500 stocks of largeU.S. companies — gives a broad look at how stock prices have performed. These returns do not include the effectof any investment management expenses. These returns would have been lower if they included the effect ofthese expenses. The “Since Inception” return reflects the closest calendar month-end return. Source: Lipper, Inc.
*** The Conservative AA Custom Blended Index consists of the Russell 1000® Value Index (15%), the Russell 1000Growth Index (15%), the Russell 2500 Value Index (5%), the Lehman Brothers Aggregate Bond Index (40%), theLehman Brothers Intermediate BB Index (20%) and the Russell Mid-Cap Growth Index (5%). These returns do notinclude the effect of any investment management expenses. These returns would have been lower if they includedthe effect of these expenses. The “Since Inception” return reflects the closest calendar month-end return. Source:Prudential Investments LLC.
**** The Lipper Variable Insurance Products (VIP) Income Funds Average is calculated by Lipper Analytical Services,Inc. and reflects the investment return of certain portfolios underlying variable life and annuity products. Thereturns are net of investment fees and fund expenses but not product charges. These returns would have beenlower if they included the effect of these charges. The “Since Inception” return reflects the closest calendar month-end return. Source: Lipper, Inc.
31
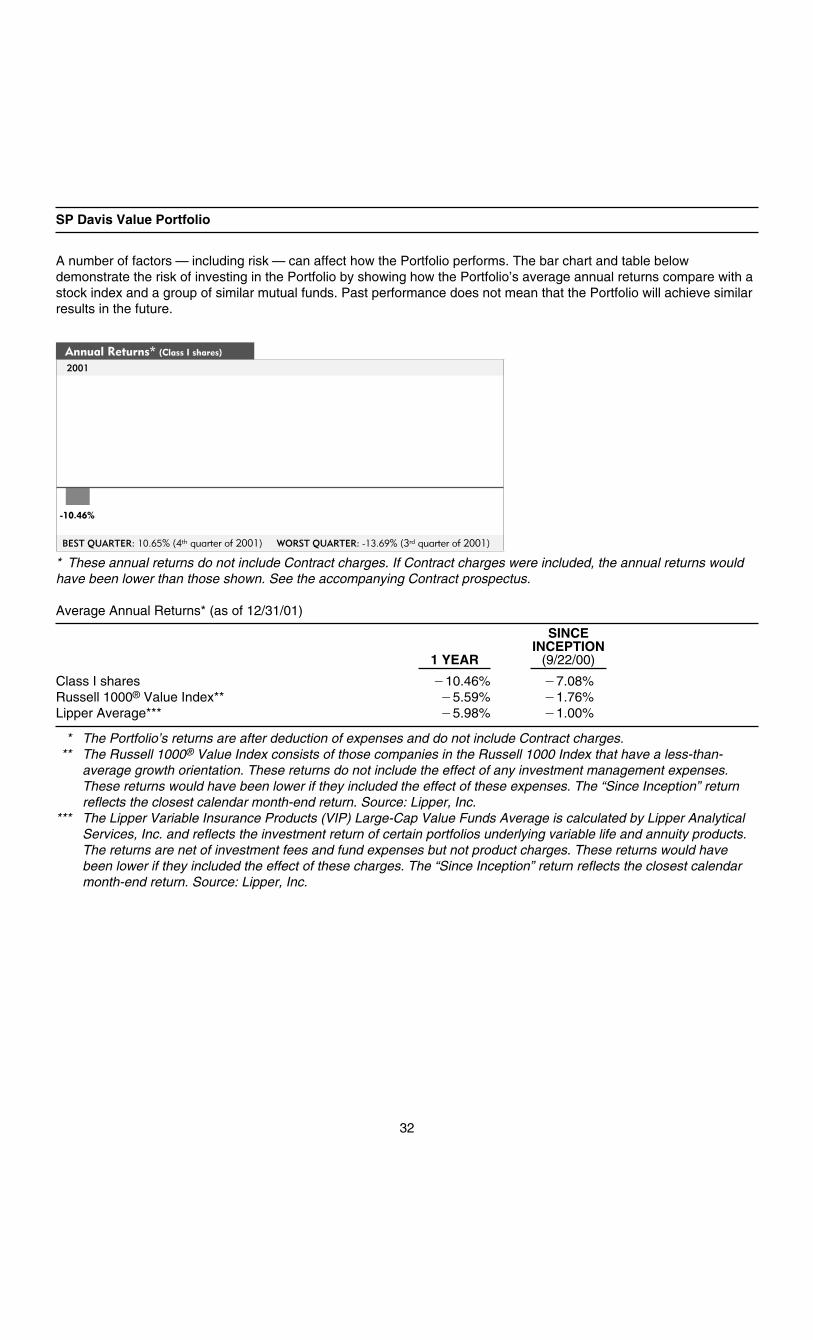
SP Davis Value Portfolio
A number of factors — including risk — can affect how the Portfolio performs. The bar chart and table belowdemonstrate the risk of investing in the Portfolio by showing how the Portfolio’s average annual returns compare with astock index and a group of similar mutual funds. Past performance does not mean that the Portfolio will achieve similarresults in the future.
* These annual returns do not include Contract charges. If Contract charges were included, the annual returns wouldhave been lower than those shown. See the accompanying Contract prospectus.
Average Annual Returns* (as of 12/31/01)
1 YEAR
SINCEINCEPTION(9/22/00)
Class I shares �10.46% �7.08%Russell 1000® Value Index** �5.59% �1.76%Lipper Average*** �5.98% �1.00%
* The Portfolio’s returns are after deduction of expenses and do not include Contract charges.** The Russell 1000® Value Index consists of those companies in the Russell 1000 Index that have a less-than-
average growth orientation. These returns do not include the effect of any investment management expenses.These returns would have been lower if they included the effect of these expenses. The “Since Inception” returnreflects the closest calendar month-end return. Source: Lipper, Inc.
*** The Lipper Variable Insurance Products (VIP) Large-Cap Value Funds Average is calculated by Lipper AnalyticalServices, Inc. and reflects the investment return of certain portfolios underlying variable life and annuity products.The returns are net of investment fees and fund expenses but not product charges. These returns would havebeen lower if they included the effect of these charges. The “Since Inception” return reflects the closest calendarmonth-end return. Source: Lipper, Inc.
32

SP Deutsche International Equity Portfolio
A number of factors — including risk — can affect how the Portfolio performs. The bar chart and table belowdemonstrate the risk of investing in the Portfolio by showing how the Portfolio’s average annual returns compare with astock index and a group of similar mutual funds. Past performance does not mean that the Portfolio will achieve similarresults in the future.
* These annual returns do not include Contract charges. If Contract charges were included, the annual returns wouldhave been lower than those shown. See the accompanying Contract prospectus.
Average Annual Returns* (as of 12/31/01)
1 YEAR
SINCEINCEPTION(9/22/00)
Class I shares �22.07% �21.12%MSCI EAFE Index** �21.44% �19.33%Lipper Average*** �21.48% �20.77%
* The Portfolio’s returns are after deduction of expenses and do not include Contract charges.** The Morgan Stanley Capital International (MSCI) Europe, Australia, Far East (EAFE) Index is a weighted,unmanaged index of performance that reflects stock price movements in Europe, Australasia, and the Far East.These returns do not include the effect of any investment management expenses. These returns would have beenlower if they included the effect of these expenses. The “Since Inception” return reflects the closest calendarmonth-end return. Source: Lipper, Inc.
*** The Lipper Variable Insurance Products (VIP) International Funds Average is calculated by Lipper AnalyticalServices, Inc. and reflects the investment return of certain portfolios underlying variable life and annuity products.The returns are net of investment fees and fund expenses but not product charges. These returns would havebeen lower if they included the effect of these charges. The “Since Inception” return reflects the closest calendarmonth-end return. Source: Lipper, Inc.
33

SP Growth Asset Allocation Portfolio
A number of factors — including risk — can affect how the Portfolio performs. The bar chart and table belowdemonstrate the risk of investing in the Portfolio by showing how the Portfolio’s average annual returns compare withmarket indexes and a group of similar mutual funds. Past performance does not mean that the Portfolio will achievesimilar results in the future.
* These annual returns do not include Contract charges. If Contract charges were included, the annual returns wouldhave been lower than those shown. See the accompanying Contract prospectus.
Average Annual Returns* (as of 12/31/01)
1 YEAR
SINCEINCEPTION(9/22/00)
Class I shares �11.77% �12.60%S&P 500** �11.88% �15.32%Growth AA Custom Blended Index*** �8.47% �11.50%Lipper Average**** �12.94% �15.14%
* The Portfolio’s returns are after deduction of expenses and do not include Contract charges.** The Standard & Poor’s 500 Composite Stock Price Index (S&P 500) — an unmanaged index of 500 stocks of largeU.S. companies — gives a broad look at how stock prices have performed. These returns do not include the effectof any investment management expenses. These returns would have been lower if they included the effect ofthese expenses. The “Since Inception” return reflects the closest calendar month-end return. Source: Lipper, Inc.
*** The Growth AA Custom Blended Index consists of the Russell 1000® Value Index (22.5%), the Russell 1000Growth Index (22.5%), the Russell 2500 Value Index (7.5%), the Russell Mid-Cap Growth Index (7.5%), theLehman Brothers Aggregate Bond Index (10%), the Lehman Brothers Intermediate BB Index (10%) and the MSCIEAFE Index (20%). These returns do not include the effect of any investment management expenses. Thesereturns would have been lower if they included the effect of these expenses. The “Since Inception” return reflectsthe closest calendar month-end return. Source: Prudential Investments LLC.
**** The Lipper Variable Insurance Products (VIP) Multi-Cap Core Funds Average is calculated by Lipper AnalyticalServices, Inc. and reflects the investment return of certain portfolios underlying variable life and annuity products.The returns are net of investment fees and fund expenses but not product charges. These returns would havebeen lower if they included the effect of these charges. The “Since Inception” return reflects the closest calendarmonth-end return. Source: Lipper, Inc.
34

SP INVESCO Small Company Growth Portfolio
A number of factors — including risk — can affect how the Portfolio performs. The bar chart and table belowdemonstrate the risk of investing in the Portfolio by showing how the Portfolio’s average annual returns compare with astock index and a group of similar mutual funds. Past performance does not mean that the Portfolio will achieve similarresults in the future.
* These annual returns do not include Contract charges. If Contract charges were included, the annual returns wouldhave been lower than those shown. See the accompanying Contract prospectus.
Average Annual Returns* (as of 12/31/01)
1 YEAR
SINCEINCEPTION(9/22/00)
Class I shares �17.18% �24.90%Russell 2000® Index** 2.49% �3.69%Russell 2000® Growth Index*** �9.23% �22.74%Lipper Average**** �12.40% �21.64%
* The Portfolio’s returns are after deduction of expenses and do not include Contract charges.** The Russell 2000® Index measures the performance of the 2,000 smallest companies in the Russell 3000 Index.These returns do not include the effect of any investment management expenses. These returns would have beenlower if they included the effect of these expenses. The “Since Inception” return reflects the closest calendarmonth-end return. Source: Lipper, Inc.
*** The Russell 2000® Growth Index consists of those companies in the Russell 2000 Index that have a greater-than-average growth orientation. These returns do not include the effect of any investment management expenses.These returns would have been lower if they included the effect of these expenses. The “Since Inception” returnreflects the closest calendar month-end return. Source: Lipper, Inc.
**** The Lipper Variable Insurance Products (VIP) Small-Cap Growth Funds Average is calculated by Lipper AnalyticalServices, Inc. and reflects the investment return of certain portfolios underlying variable life and annuity products.The returns are net of investment fees and fund expenses but not product charges. These returns would havebeen lower if they included the effect of these charges. The “Since Inception” return reflects the closest calendarmonth-end return. Source: Lipper, Inc.
35

SP Jennison International Growth Portfolio
A number of factors — including risk — can affect how the Portfolio performs. The bar chart and table belowdemonstrate the risk of investing in the Portfolio by showing how the Portfolio’s average annual returns compare with astock index and a group of similar mutual funds. Past performance does not mean that the Portfolio will achieve similarresults in the future.
* These annual returns do not include Contract charges. If Contract charges were included, the annual returns wouldhave been lower than those shown. See the accompanying Contract prospectus.
Average Annual Returns* (as of 12/31/01)
1 YEAR
SINCECLASS I
INCEPTION(9/22/00)
SINCECLASS IIINCEPTION(10/4/00)
Class I shares �35.64% �37.67% —Class II shares �35.92% — �37.67%MSCI EAFE Index** �21.44% �19.33% �19.33%Lipper Average*** �21.48% �20.77% �20.77%
* The Portfolio’s returns are after deduction of expenses and do not include Contract charges.** The Morgan Stanley Capital International (MSCI) Europe, Australia, Far East (EAFE) Index is a weighted,unmanaged index of performance that reflects stock price movements in Europe, Australia, and the Far East.These returns do not include the effect of any investment management expenses. These returns would have beenlower if they included the effect of these expenses. The “Since Inception” return reflects the closest calendarmonth-end return. Source: Lipper, inc.
*** The Lipper Variable Insurance Products (VIP) International Funds Average is calculated by Lipper AnalyticalServices, Inc. and reflects the investment return of certain portfolios underlying variable life and annuity products.The returns are net of investment fees and fund expenses but not product charges. These returns would havebeen lower if they included the effect of these charges. The “Since Inception” return reflects the closest calendarmonth-end return. Source: Lipper, Inc.
36

SP Large Cap Value Portfolio
A number of factors — including risk — can affect how the Portfolio performs. The bar chart and table belowdemonstrate the risk of investing in the Portfolio by showing how the Portfolio’s average annual returns compare with astock index and a group of similar mutual funds. Past performance does not mean that the Portfolio will achieve similarresults in the future.
* These annual returns do not include Contract charges. If Contract charges were included, the annual returns wouldhave been lower than those shown. See the accompanying Contract prospectus.
Average Annual Returns* (as of 12/31/01)
1 YEAR
SINCEINCEPTION(9/22/00)
Class I shares �8.65% 3.34%Russell 1000® Index** �12.45% �16.74%Russell 1000® Value Index*** �5.59% �1.76%Lipper Average**** �5.98% �4.97%
* The Portfolio’s returns are after deduction of expenses and do not include Contract charges.** The Russell 1000® Index measures the performance of the 1000 largest companies in the Russell 3000 Index. TheRussell 3000 index consists of the 3000 largest U.S. companies, as determined by total market capitalization.These returns do not include the effect of any investment management expenses. These returns would have beenlower if they included the effect of these expenses. The “Since Inception” return reflects the closest calendarmonth-end return. Source: Lipper, Inc.
*** The Russell 1000® Value Index measures the performance of those Russell 1000® companies that have a less-than-average growth orientation. These returns do not include the effect of any investment managementexpenses. These returns would have been lower if they included the effect of these expenses. The “SinceInception” return reflects the closest calendar month-end return. Source: Lipper, Inc.
**** The Lipper Variable Insurance Products (VIP) Large Cap Value Funds Average is calculated by Lipper AnalyticalServices, Inc. and reflects the investment return of certain portfolios underlying variable life and annuity products.The returns are net of investment fees and fund expenses but not product charges. These returns would havebeen lower if they included the effect of these charges. The “Since Inception” return reflects the closest calendarmonth-end return. Source: Lipper, Inc.
37
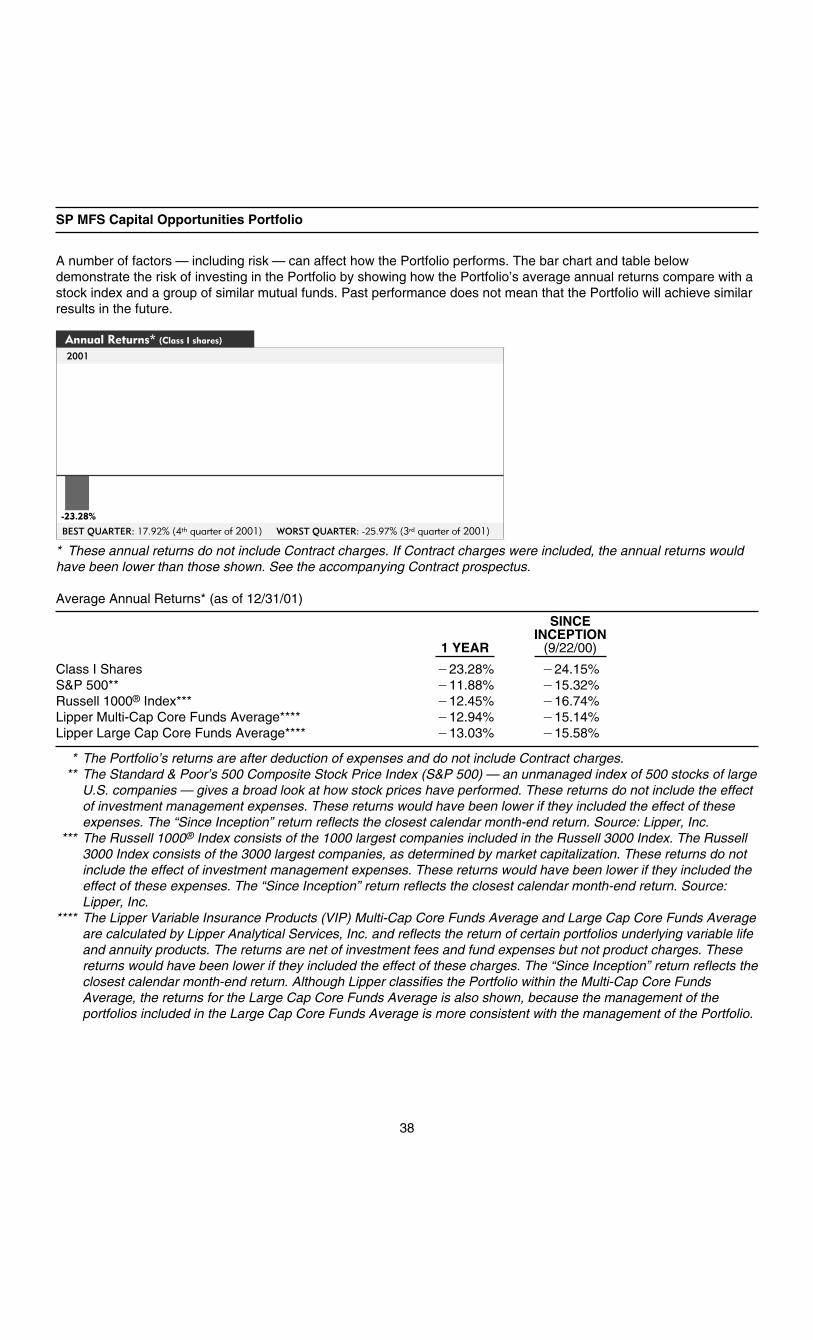
SP MFS Capital Opportunities Portfolio
A number of factors — including risk — can affect how the Portfolio performs. The bar chart and table belowdemonstrate the risk of investing in the Portfolio by showing how the Portfolio’s average annual returns compare with astock index and a group of similar mutual funds. Past performance does not mean that the Portfolio will achieve similarresults in the future.
* These annual returns do not include Contract charges. If Contract charges were included, the annual returns wouldhave been lower than those shown. See the accompanying Contract prospectus.
Average Annual Returns* (as of 12/31/01)
1 YEAR
SINCEINCEPTION(9/22/00)
Class I Shares �23.28% �24.15%S&P 500** �11.88% �15.32%Russell 1000® Index*** �12.45% �16.74%Lipper Multi-Cap Core Funds Average**** �12.94% �15.14%Lipper Large Cap Core Funds Average**** �13.03% �15.58%
* The Portfolio’s returns are after deduction of expenses and do not include Contract charges.** The Standard & Poor’s 500 Composite Stock Price Index (S&P 500) — an unmanaged index of 500 stocks of largeU.S. companies — gives a broad look at how stock prices have performed. These returns do not include the effectof investment management expenses. These returns would have been lower if they included the effect of theseexpenses. The “Since Inception” return reflects the closest calendar month-end return. Source: Lipper, Inc.
*** The Russell 1000® Index consists of the 1000 largest companies included in the Russell 3000 Index. The Russell3000 Index consists of the 3000 largest companies, as determined by market capitalization. These returns do notinclude the effect of investment management expenses. These returns would have been lower if they included theeffect of these expenses. The “Since Inception” return reflects the closest calendar month-end return. Source:Lipper, Inc.
**** The Lipper Variable Insurance Products (VIP) Multi-Cap Core Funds Average and Large Cap Core Funds Averageare calculated by Lipper Analytical Services, Inc. and reflects the return of certain portfolios underlying variable lifeand annuity products. The returns are net of investment fees and fund expenses but not product charges. Thesereturns would have been lower if they included the effect of these charges. The “Since Inception” return reflects theclosest calendar month-end return. Although Lipper classifies the Portfolio within the Multi-Cap Core FundsAverage, the returns for the Large Cap Core Funds Average is also shown, because the management of theportfolios included in the Large Cap Core Funds Average is more consistent with the management of the Portfolio.
38

SP MFS Mid-Cap Growth Portfolio
A number of factors — including risk — can affect how the Portfolio performs. The bar chart and table belowdemonstrate the risk of investing by showing how the Portfolio’s average annual returns compare with a stock indexand a group of similar mutual funds. Past performance does not mean that the Portfolio will achieve similar results inthe future.
* These annual returns do not include Contract charges. If Contract charges were included, the annual returns wouldhave been lower than those shown. See the accompanying Contract prospectus.
Average Annual Returns* (as of 12/31/01)
1 YEAR
SINCEINCEPTION(9/22/00)
Class I shares �20.93% �18.29%Russell MidCap® Index** �5.62% �7.27%Russell MidCap Growth® Index*** �20.15% �32.41%Lipper Average**** �23.31% �31.98%
* The Portfolio’s returns are after deduction of expenses and do not include Contract charges.** The Russell MidCap® Index consists of the 800 smallest securities in the Russell 1000 Index, as ranked by totalmarket capitalization. These returns do not include the effect of investment management expenses. These returnswould have been lower if they included the effect of these expenses. The “Since Inception” return reflects theclosest calendar month-end return. Source: Lipper, Inc.
*** The Russell MidCap Growth® Growth Index consists of those securities included in the Russell MidCap Index thathave a greater-than-average growth orientation. These returns do not include the effect of investmentmanagement expenses. The returns would have been lower if they included the effect of these expenses. The“Since Inception” return reflects the closest calendar month-end return.
****The Lipper Variable Insurance Products (VIP) Mid Cap Growth Funds Average is calculated by Lipper AnalyticalServices, Inc. and reflects the return of certain portfolios underlying variable life and annuity products. The returnsare net of investment fees and fund expenses but not product charges. These returns would have been lower ifthey included the effect of these charges. The “Since Inception” return reflects the closest calendar month-endreturn.
39

SP PIMCO High Yield Portfolio
A number of factors — including risk — can affect how the Portfolio performs. The bar chart and table belowdemonstrate the risk of investing in the Portfolio by showing how the Portfolio’s average annual returns compare with amarket index and a group of similar mutual funds. Past performance does not mean that the Portfolio will achievesimilar results in the future.
* These annual returns do not include Contract charges. If Contract charges were included, the annual returns wouldhave been lower than those shown. See the accompanying Contract prospectus.
Average Annual Returns* (as of 12/31/01)
1 YEAR
SINCEINCEPTION(9/22/00)
Class I shares 3.97% 4.66%Lehman Brothers Intermediate BB Corporate Index** 10.17% 7.99%Lipper Average*** 1.13% �3.78%
* The Portfolio’s returns are after deduction of expenses and do not include Contract charges.** The Lehman Brothers Intermediate BB Corporate Index is an unmanaged index comprised of various fixed-income
securities rated BB. These returns do not include the effect of any investment management expenses. Thesereturns would have been lower if they included the effect of these expenses. The “Since Inception” return reflectsthe closest calendar month-end return. Source: Lipper, Inc.
*** The Lipper Variable Insurance Products (VIP) High Current Yield Funds Average is calculated by Lipper AnalyticalServices, Inc. and reflects the investment return of certain portfolios underlying variable life and annuity products.The returns are net of investment fees and fund expenses but not product charges. These returns would havebeen lower if they included the effect of these charges. The “Since Inception” return reflects the closest calendarmonth-end return. Source: Lipper, Inc.
40

SP PIMCO Total Return Portfolio
A number of factors — including risk — can affect how the Portfolio performs. The bar chart and table belowdemonstrate the risk of investing in the Portfolio by showing how the Portfolio’s average annual returns compare with amarket index and a group of similar mutual funds. Past performance does not mean that the Portfolio will achievesimilar results in the future.
* These annual returns do not include Contract charges. If Contract charges were included, the annual returns wouldhave been lower than those shown. See the accompanying Contract prospectus.
Average Annual Returns* (as of 12/31/01)
1 YEAR
SINCEINCEPTION(9/22/00)
Class I shares 8.66% 11.03%Lehman Brothers Aggregate Bond Index** 8.44% 10.28%Lipper Average*** 5.76% 5.98%
* The Portfolio’s returns are after deduction of expenses and do not include Contract charges.** The Lehman Brothers Aggregate Bond Index is an unmanaged index comprised of more than 5,000 governmentand corporate bonds. These returns do not include the effect of any investment management expenses. Thesereturns would have been lower if they included the effect of these expenses. The “Since Inception’’ return reflectsthe closest calendar month-end return. Source: Lipper, Inc.
*** The Lipper Variable Insurance Products (VIP) General Bond Funds Average is calculated by Lipper AnalyticalServices, Inc. and reflects the investment return of certain portfolios underlying variable life and annuity products.The returns are net of investment fees and fund expenses but not product charges. These returns would havebeen lower if they included the effect of these charges. The “Since Inception’’ return reflects the closest calendarmonth-end return. Source: Lipper, Inc.
41

SP Prudential U.S. Emerging Growth Portfolio
A number of factors — including risk — can affect how the Portfolio performs. The bar chart and table belowdemonstrate the risk of investing in the Portfolio by showing how the Portfolio’s average annual returns compare with astock index and a group of similar mutual funds. Past performance does not mean that the Portfolio will achieve similarresults in the future.
* These annual returns do not include Contract charges. If Contract charges were included, the annual returns wouldhave been lower than those shown. See the accompanying Contract prospectus.
Average Annual Returns* (as of 12/31/01)
1 YEAR
SINCECLASS I
INCEPTION(9/22/00)
Class I Shares �17.78% �25.26%S&P MidCap 400 Index** �0.62% �3.57%Russell Midcap Growth® Index*** �20.15% �32.41%Lipper Multi-Cap Growth Funds Average**** �26.81% �35.76%Lipper Mid Cap Growth Funds Average**** �23.31% �31.98%
* The Portfolio’s returns are after deduction of expenses and do not include Contract charges. Returns shown arefor Class I shares only. Returns are not shown for Class II shares, because Class II shares have not yet been inexistence for a full calendar year (Class II inception date: 7/9/01). Returns for Class II shares would have beenlower than for Class I due to higher expenses.
** The Standard & Poor’s MidCap 400 Composite Stock Price Index (S&P MidCap 400) — an unmanaged index of400 domestic stocks chosen for market size, liquidity and industry group representation — gives a broad look athow mid-cap stock prices have performed. These returns do not include the effect of investment managementexpenses. These returns would have been lower if they included the effect of these expenses. The “SinceInception” return reflects the closest calendar month-end return. Source: Lipper, Inc.
*** The Russell Midcap Growth® Index consists of those securities in the Russell Midcap Index that have a greater-than-average growth orientation. The Russell Midcap Index consists of the 800 smallest securities in the Russell1000 Index, as ranked by total market capitalization. These returns do not include the effect of investmentmanagement expenses. These returns would have been lower if they included the effect of these expenses. The“Since Inception” return reflects the closest calendar month-end return. Source: Lipper, Inc.
**** The Lipper Variable Insurance Products (VIP) Multi-Cap Growth Funds Average and Mid Cap Growth FundsAverage are calculated by Lipper Analytical Services, Inc. and reflect the return of certain portfolios underlyingvariable life and annuity products. The returns are net of investment fees and fund expenses but not productcharges. These returns would have been lower if they included the effect of these charges. The “Since Inception”return reflects the closest calendar month-end return. Although Lipper classifies the Portfolio within the Multi-CapGrowth Funds Average, the returns for the Mid Cap Growth Fund Average is also shown, because themanagement of the portfolios included in the Mid Cap Growth Funds Average is more consistent with themanagement of the Portfolio.
42

SP Small/Mid-Cap Value Portfolio
A number of factors — including risk — can affect how the Portfolio performs. The bar chart and table belowdemonstrate the risk of investing in the Portfolio by showing how the Portfolio’s average annual returns compare with astock index and a group of similar mutual funds. Past performance does not mean that the Portfolio will achieve similarresults in the future.
* These annual returns do not include Contract charges. If Contract charges were included, the annual returns wouldhave been lower than those shown. See the accompanying Contract prospectus.
Average Annual Returns* (as of 12/31/01)
1 YEAR
SINCEINCEPTION(9/22/00)
Class I shares 3.11% 11.42%Russell 2500® Index** 1.22% �2.00%Russell 2500™ Value Index*** 9.73% 15.05%Lipper Average**** 7.33% 11.96%
* The Portfolio’s returns are after deduction of expenses and do not include Contract charges.** The Russell 2500 Index consists of the smallest 500 securities in the Russell 1000 Index and all 2000 securities inthe Russell 2000 Index. The Russell 1000 Index consists of the 1000 largest securities in the Russell 3000 Index,and the Russell 2000 Index consists of the smallest 2000 securities in the Russell 3000 Index. The Russell 3000Index consists of the 3000 largest U.S. companies, as determined by total market capitalization. These returns donot include the effect of any investment management expenses. These returns would have been lower if theyincluded the effect of these expenses. The “Since Inception” return reflects the closest calendar month-end return.Source: Lipper, Inc.
*** The Russell 2500™ Value Index measures the performance of Russell 2500™ companies with higher price-to-bookratios. These returns do not include the effect of any investment management expenses. These returns wouldhave been lower if they included the effect of these expenses. The “Since Inception” return reflects the closestcalendar month-end return. Source: Lipper, Inc.
**** The Lipper Variable Insurance Products (VIP) Mid-Cap Value Funds is calculated by Lipper Analytical Services,Inc. and reflects the investment return of certain portfolios underlying variable life and annuity products. Thereturns are net of investment fees and fund expenses but not product charges. These returns would have beenlower if they included the effect of these charges. The “Since Inception” return reflects the closest calendar month-end return. Source: Lipper, Inc.
43

SP Strategic Partners Focused Growth Portfolio
A number of factors — including risk — can affect how the Portfolio performs. The bar chart and table belowdemonstrate the risk of investing in the Portfolio by showing how the Portfolio’s average annual returns compare with astock index and a group of similar mutual funds. Past performance does not mean that the Portfolio will achieve similarresults in the future.
* These annual returns do not include Contract charges. If Contract charges were included, the annual returns wouldhave been lower than those shown. See the accompanying Contract prospectus.
Average Annual Returns* (as of 12/31/01)
1 YEAR
SINCECLASS I
INCEPTION(9/22/00)
Class I shares �15.32% �26.64%S&P 500** �11.88% �15.32%Russell 1000® Growth Index*** �20.42% �31.26%Lipper Average**** �22.94% �28.52%
* The Portfolio’s returns are after deduction of expenses and do not include Contract charges. Returns shown arefor Class I shares only. Returns are not shown for Class II shares, because Class II shares have not yet been inexistence for a full calendar year (Class II inception date: 1/12/01). Returns for Class II shares would have beenlower than for Class I due to higher expenses.
** The Standard & Poor’s 500 Composite Stock Price Index (S&P 500) — an unmanaged index of 500 stocks of largeU.S. companies — gives a broad look at how stock prices have performed. These returns do not include the effectof any investment management expenses. These returns would have been lower if they included the effect ofthese expenses. The “Since Inception” return reflects the closest calendar month-end return. Source: Lipper, Inc.
*** The Russell 1000® Growth Index consists of those Russell 1000 securities that have a greater-than-averagegrowth orientation. The Russell 1000 Index consists of the 1000 largest securities in the Russell 3000 Index. TheRussell 3000 Index consists of the 3000 largest U.S. securities, as determined by total market capitalization. Thesereturns do not include the effect of any investment management expenses. These returns would have been lowerif they included the effect of these expenses. The “Since Inception” return reflects the closest calendar month-endreturn. Source: Lipper, Inc.
**** The Lipper Variable Insurance Products (VIP) Large Cap Growth Funds is calculated by Lipper Analytical Services,Inc. and reflects the investment return of certain portfolios underlying variable life and annuity products. Thereturns are net of investment fees and fund expenses but not product charges. These returns would have beenlower if they included the effect of these charges. The “Since Inception” return reflects the closest calendar month-end return. Source: Lipper, Inc.
44

HOW THE PORTFOLIOS INVEST
Investment Objectives and Policies
We describe each Portfolio’s investment objective and policies below. We describe certain investment instruments thatappear in bold lettering below in the section entitled Other Investments and Strategies. Although we make every effortto achieve each Portfolio’s objective, we can’t guarantee success and it is possible that you could lose money. Unlessotherwise stated, each Portfolio’s investment objective is a fundamental policy that cannot be changed withoutshareholder approval. The Board of Directors can change investment policies that are not fundamental.
An investment in a Portfolio is not a bank deposit and is not insured or guaranteed by the Federal Deposit InsuranceCorporation or any other government agency.
Conservative Balanced Portfolio
The investment objective of this Portfolio is to seek a total investment return consistent with a conservativelymanaged diversified portfolio.
Balanced PortfolioWe invest in equity, debt and money market securities inorder to achieve diversification. We seek to maintain aconservative blend of investments that will have strongperformance in a down market and solid, but notnecessarily outstanding, performance in up markets.This Portfolio may be appropriate for an investor lookingfor diversification with less risk than that of the FlexibleManaged Portfolio, while recognizing that this reducesthe chances of greater appreciation.
To achieve our objective, we invest in a mix of equity andequity-related securities, debt obligations and moneymarket instruments. We adjust the percentage of Portfolioassets in each category depending on our expectationsregarding the different markets. While we make everyeffort to achieve our objective, we can’t guaranteesuccess and it is possible that you could lose money.
We will vary how much of the Portfolio’s assets areinvested in a particular type of security depending onhow we think the different markets will perform.
Under normal conditions, we will invest within the ranges shown below:
Asset Type Minimum Normal Maximum
Stocks 15% 50% 75%Debt obligations and money
market securities25% 50% 85%
The equity portion of the Portfolio is generally managed as an index fund, designed to mirror the holdings of theStandard & Poor’s 500 Composite Stock Price Index. For more information about the index and index investing, see theinvestment summary for Stock Index Portfolio included in this prospectus.
Debt securities in general are basically written promises to repay a debt. There are numerous types of debt securitieswhich vary as to the terms of repayment and the commitment of other parties to honor the obligations of the issuer.Most of the securities in the debt portion of this Portfolio will be rated “investment grade.” This means major ratingservices, like Standard & Poor’s Ratings Group (S&P) or Moody’s Investors Service, Inc. (Moody’s), have rated thesecurities within one of their four highest rating categories. The Portfolio also invests in high quality money marketinstruments.
The Portfolio may also invest in lower-rated securities, which are riskier and are considered speculative. Thesesecurities are sometimes referred to as “junk bonds.” We may also invest in instruments that are not rated, but whichwe believe are of comparable quality to the instruments described above. The Portfolio’s investment in debt securitiesmay include investments in mortgage-related securities.
The Portfolio may invest up to 30% of its total assets in foreign equity and debt securities that are not denominated inthe U.S. dollar. Up to 20% of the Portfolio’s total assets may be invested in debt securities that are issued outside the
45

U.S. by foreign or U.S. issuers, provided the securities are denominated in U.S. dollars. For these purposes, we do notconsider American Depositary Receipts (ADRs) as foreign securities.
In response to adverse market conditions or when restructuring the Portfolio, we may temporarily invest up to 100% ofthe Portfolio’s total assets in money market instruments. Investing heavily in these securities limits our ability to achieveour investment objective, but can help to preserve the value of the Portfolio’s assets when the markets are unstable.
We may also invest in fixed and floating rate loans (secured or unsecured) arranged through private negotiationsbetween a corporation which is the borrower and one or more financial institutions that are the lenders. Generally,these types of investments are in the form of loans or assignments.
We may also use alternative investment strategies — including derivatives— to try to improve the Portfolio’s returns,protect its assets or for short-term cash management.
We may: purchase and sell options on equity securities, debt securities, stock indexes and foreign currencies;purchase and sell exchange-traded fund shares; purchase and sell stock index, interest rate, interest rate swap andforeign currency futures contracts and options on those contracts; enter into forward foreign currency exchangecontracts; and purchase securities on a when-issued or delayed delivery basis.
The Portfolio may also enter into short sales. No more than 25% of the Portfolio’s net assets may be used as collateralor segregated for purposes of securing a short sale obligation. The Portfolio may also enter into short sales against-the-box.
We may also use interest rate swaps in the management of the fixed-income portion of the Portfolio.
The Portfolio may also enter into repurchase agreements. The Portfolio may participate with certain other Portfolios ofthe Fund and other affiliated funds in a joint repurchase account under an order obtained from the SEC. The Portfoliomay invest in equity and/or debt securities issued by Real Estate Investment Trusts (REITs).
We may also invest in reverse repurchase agreements and dollar rolls in the management of the fixed-incomeportion of the Portfolio. The Portfolio will not use more than 30% of its net assets in connection with reverse repurchasetransactions and dollar rolls.
Diversified Bond Portfolio
The investment objective of this Portfolio is a high level of income over a longer term while providing reasonablesafety of capital. This means we look for investments that we think will provide a high level of current income, butwhich are not expected to involve a substantial risk of loss of capital through default. To achieve our objective, wenormally invest at least 80% of the Portfolio’s investable assets in intermediate and long term debt obligations that arerated investment grade and high-quality money market investments. While we make every effort to achieve ourobjective, we can’t guarantee success and it is possible that you could lose money.
Our StrategyIn general, the value of debt obligations moves in theopposite direction as interest rates — if a bond ispurchased and then interest rates go up, newer bondswill be worth more relative to existing bonds becausethey will have a higher rate of interest. We will adjust themix of the Portfolio’s short-term, intermediate and longterm debt obligations in an attempt to benefit from priceappreciation when interest rates go down and to incursmaller declines when rates go up.
Debt obligations, in general, are basically writtenpromises to repay a debt. The terms of repayment varyamong the different types of debt obligations, as do thecommitments of other parties to honor the obligations ofthe issuer of the security. The types of debt obligationsin which we can invest include U.S. governmentsecurities, mortgage-related securities and corporatebonds.
Usually, at least 80% of the Portfolio’s investable assets will be invested in debt securities that are investment grade.This means major rating services, like Standard and Poor’s Ratings Group (S&P) or Moody’s Investor Service, Inc.-
46

(Moody’s), have rated the securities within one of their four highest rating categories. The Portfolio may continue tohold a debt obligation if it is downgraded below investment grade after it is purchased or if it is no longer rated by amajor rating service. We may also invest up to 20% of the Portfolio’s investable assets in lower rated securities whichare riskier and considered speculative. These securities are sometimes referred to as “junk bonds.” We may also investin instruments that are not rated, but which we believe are of comparable quality to the instruments described above.
The Portfolio may invest without limit in debt obligations issued or guaranteed by the U.S. government andgovernment-related entities. An example of a debt security that is backed by the full faith and credit of the U.S.government is an obligation of the Government National Mortgage Association (Ginnie Mae). In addition, we may investin U.S. government securities issued by other government entities, like the Federal National Mortgage Association(Fannie Mae) and the Student Loan Marketing Association (Sallie Mae) which are not backed by the full faith and creditof the U.S. government. Instead, these issuers have the right to borrow from the U.S. Treasury to meet theirobligations. The Portfolio may also invest in the debt securities of other government-related entities, like the FarmCredit System, which depend entirely upon their own resources to repay their debt.
We may invest up to 20% of the Portfolio’s total assets in debt securities issued outside the U.S. by U.S. or foreignissuers whether or not such securities are denominated in the U.S. dollar.
The Portfolio may also invest in convertible debt and convertible and preferred stocks and non-convertiblepreferred stock of any rating. The Portfolio will not acquire any common stock except by converting a convertiblesecurity or exercising a warrant. No more than 10% of the Portfolio’s total assets will be held in common stocks, andthose will usually be sold as soon as a favorable opportunity arises. The Portfolio may lend its portfolio securities tobrokers, dealers and other financial institutions to earn income.
We may also invest in loans or assignments arranged through private negotiations between a corporation which is theborrower and one or more financial institutions that are the lenders.
Under normal conditions, the Portfolio may invest a portion of its assets in high-quality money market instruments. Inresponse to adverse market conditions or when restructuring the Portfolio, we may temporarily invest up to 100% of thePortfolio’s assets in money market instruments. Investing heavily in these securities limits our ability to achieve ourinvestment objective, but can help to preserve the value of the Portfolio’s assets when the markets are unstable.
We may also use alternative investment strategies — including derivatives— to try to improve the Portfolio’s returns,protect its assets or for short-term cash management.
We may: purchase and sell options on debt securities; purchase and sell interest rate and interest rate swap futurescontracts and options on those contracts; invest in forward foreign currency exchange contracts; and purchasesecurities on a when-issued or delayed delivery basis.
The Portfolio may also enter into short sales. No more than 25% of the Portfolio’s net assets may be used as collateral orsegregated for purposes of securing a short sale obligation. The Portfolio may also enter into short sales against-the-box.
We may also use interest rate swaps in the management of the Portfolio.
The Portfolio may also enter into repurchase agreements. The Portfolio may participate with certain other Portfolios ofthe Fund in a joint repurchase account under an order obtained from the SEC.
The Portfolio may also invest up to 30% of its net assets in reverse repurchase agreements and dollar rolls. ThePortfolio will not use more than 30% of its net assets in connection with reverse repurchase transactions and dollar rolls.
Equity Portfolio
The investment objective of this Portfolio is capital appreciation. This means we seek investments that we believe willprovide investment returns above broadly based market indexes. While we make every effort to achieve our objective,we can’t guarantee success and it is possible that you could lose money.
47

Blend ApproachIn deciding which stocks to buy, our portfolio managersuse a blend of investment styles. That is, we invest instocks that may be undervalued given the company’searnings, assets, cash flow and dividends and alsoinvest in companies experiencing some or all of thefollowing: a price/earnings ratio lower than earnings pershare growth, strong market position, improvingprofitability and distinctive attributes such as uniquemarketing ability, strong research and development, newproduct flow, and financial strength.
To achieve our investment objective, we normally investat least 80% of the Portfolio’s investable assets incommon stocks of major established corporations aswell as smaller companies.
20% of the Portfolio’s investable assets may be investedin short, intermediate or long-term debt obligations,convertible and nonconvertible preferred stock and otherequity-related securities. Up to 5% of these investableassets may be rated below investment grade. Thesesecurities are considered speculative and are sometimesreferred to as “junk bonds.”
Up to 30% of the Portfolio’s total assets may be invested in foreign securities, including money market instruments,equity securities and debt obligations. For these purposes, we do not consider American Depositary Receipts (ADRs)as foreign securities.
Under normal circumstances, the Portfolio may invest a portion of its assets in money market instruments. In addition,we may temporarily invest up to 100% of the Portfolio’s assets in money market instruments in response to adversemarket conditions or when we are restructuring the portfolio. Investing heavily in these securities limits our ability toachieve our investment objective, but can help to preserve the Portfolio’s assets when the markets are unstable.
We may also use alternative investment strategies — including derivatives— to try to improve the Portfolio’s returns,protect its assets or for short-term cash management.
We may: purchase and sell options on equity securities, stock indexes and foreign currencies; purchase and sell stockindex and foreign currency futures contracts and options on these futures contracts; enter into forward foreigncurrency exchange contracts; and purchase securities on a when-issued or delayed delivery basis.
The Portfolio may also enter into short sales against-the-box.
The Portfolio may also enter into repurchase agreements. The Portfolio may participate with certain other Portfolios ofthe Fund in a joint repurchase account under an order obtained from the SEC. The Portfolio may invest in equity and/or debt securities of Real Estate Investment Trusts (REITs).
Jennison Associates LLC is responsible for managing approximately 50% of the Portfolio’s assets. GE AssetManagement Inc. and Salomon Brothers Asset Management Inc. are each responsible for managing approximately25% of the Portfolio’s assets.
Flexible Managed Portfolio
The investment objective of this Portfolio is to seek a high total return consistent with an aggressively manageddiversified portfolio.
Balanced PortfolioWe invest in equity, debt and money marketsecurities — in order to achieve diversification in a singlePortfolio. We seek to maintain a more aggressive mix ofinvestments than the Conservative Balanced Portfolio.This Portfolio may be appropriate for an investor lookingfor diversification who is willing to accept a relatively highlevel of loss in an effort to achieve greater appreciation.
To achieve our objective, we invest in a mix of equityand equity-related securities, debt obligations andmoney market instruments. We adjust the percentage ofPortfolio assets in each category depending on ourexpectations regarding the different markets. While wemake every effort to achieve our objective, we can’tguarantee success and it is possible that you could losemoney.
48

Generally, we will invest within the ranges shown below:
Asset Type Minimum Normal Maximum
Stocks 25% 60% 100%Fixed income securities 0% 40% 75%
The equity portion of the Fund is generally managed under an “enhanced index style.” Under this style, the portfoliomanagers utilize a quantitative approach in seeking to out-perform the Standard & Poor’s 500 Composite Stock PriceIndex and to limit the possibility of significantly under-performing that index.
The stock portion of the Portfolio will be invested in a broadly diversified portfolio of stocks generally consisting of largeand mid-size companies, although it may also hold stocks of smaller companies. We will invest in companies andindustries that, in our judgment, will provide either attractive long-term returns, or are desirable to hold in the Portfolio tomanage risk.
Most of the securities in the fixed income portion of this Portfolio will be investment grade. However, we may alsoinvest up to 25% of this portion of the Portfolio in debt securities rated as low as BB, Ba or lower by a major ratingservice at the time they are purchased. These high-yield or “junk bonds” are riskier and considered speculative. Wemay also invest in instruments that are not rated, but which we believe are of comparable quality to the instrumentsdescribed above. The fixed income portion of the Portfolio may also include loans or assignments in the form of loanparticipations and mortgage-related securities.
The Portfolio may also invest up to 30% of its total assets in foreign equity and debt securities that are not denominatedin the U.S. dollar. In addition, up to 20% of the Portfolio’s total assets may be invested in debt securities that are issuedoutside of the U.S. by foreign or U.S. issuers provided the securities are denominated in U.S. dollars. For thesepurposes, we do not consider American Depositary Receipts (ADRs) as foreign securities.
In response to adverse market conditions or when we are restructuring the Portfolio, we may temporarily invest up to100% of the Portfolio’s assets in money market instruments. Investing heavily in these securities limits our ability toachieve our investment objective, but can help to preserve the Portfolio’s assets when the markets are unstable.
The Portfolio may also invest in Real Estate Investment Trusts (REITs).
We may also use alternative investment strategies — including derivatives— to try to improve the Portfolio’s returns,protect its assets or for short-term cash management.
We may: purchase and sell options on equity securities, debt securities, stock indexes, and foreign currencies;purchase and sell exchange-traded fund shares; purchase and sell stock index, interest rate, interest rate swap andforeign currency futures contracts and options on those contracts; enter into forward foreign currency exchangecontracts; and purchase securities on a when-issued or delayed delivery basis.
The Portfolio may also enter into short sales. No more than 25% of the Portfolio’s net assets may be used as collateralor segregated for purposes of securing a short sale obligation. The Portfolio may also enter into short sales against-the-box.
The Portfolio may lend its portfolio securities to brokers, dealers and other financial institutions to earn income.
We may also use interest rate swaps in the management of the fixed income portion of the Portfolio.
The Portfolio may also enter into repurchase agreements. The Portfolio may participate with certain other Portfolios ofthe Fund in a joint repurchase account under an order obtained from the SEC.
We may also invest in reverse repurchase agreements and dollar rolls in the management of the fixed-incomeportion of the Portfolio. The Portfolio will not use more than 30% of its net assets in connection with reverse repurchasetransactions and dollar rolls.
49

Global Portfolio
The investment objective of this Portfolio is long-term growth of capital. To achieve this objective, we invest primarilyin equity and equity-related securities of foreign and U.S. companies. While we make every effort to achieve ourobjective, we can’t guarantee success and it is possible that you could lose money.
Global InvestingThis Portfolio is intended to provide investors with theopportunity to invest in companies located throughoutthe world. Although we are not required to invest in aminimum number of countries, we intend generally toinvest in at least three countries, including the U.S.However, in response to market conditions, we caninvest up to 35% of the Portfolio’s total assets in any onecountry other than the U.S. (The 35% limitation does notapply to U.S. investments).
When selecting stocks, we use a growth approach whichmeans we look for companies that have above-averagegrowth prospects. In making our stock picks, we look forcompanies that have had growth in earnings and sales,high returns on equity and assets or other strongfinancial characteristics. Often, the companies wechoose have superior management, a unique marketniche or a strong new product.
The Portfolio may invest up to 100% of its assets in money market instruments in response to adverse marketconditions or when we are restructuring the Portfolio. Investing heavily in these securities limits our ability to achieveour investment objective, but can help to preserve the Portfolio’s assets when the markets are unstable.
We may also use alternative investment strategies — including derivatives— to try to improve the Portfolio’s returns,protect its assets or for short-term cash management.
We may: purchase and sell options on equity securities, stock indexes and foreign currencies; purchase and sellfutures contracts on stock indexes, debt securities, interest rate indexes and foreign currencies and options on thesefutures contracts; enter into forward foreign currency exchange contracts; and purchase securities on a when-issued or delayed delivery basis.
The Portfolio may invest in equity swaps. The Portfolio may also lend its portfolio securities to brokers, dealers andother financial institutions to earn income.
The Portfolio may also enter into short sales against-the-box.
The Portfolio may also enter into repurchase agreements. The Portfolio may participate with certain other Portfolios ofthe Fund in a joint repurchase account under an order obtained from the SEC. The portfolio may invest in equity and/or debt securities issued by Real Estate Investment Trusts (REITs).
High Yield Bond Portfolio
The investment objective of this Portfolio is a high total return. In pursuing our objective, we invest in high yield/highrisk debt securities. While we make every effort to achieve our objective, we can’t guarantee success and it is possiblethat you could lose money.
50

High Yield/High RiskLower rated and comparable unrated securities tend tooffer better yields than higher rated securities with thesame maturities because the issuer’s financial conditionmay not have been as strong as that of higher ratedissuers. Changes in the perception of thecreditworthiness of the issuers of lower rated securitiestend to occur more frequently and in a more pronouncedmanner than for issuers of higher rated securities.
Normally, we will invest at least 80% of the Portfolio’sinvestable assets in medium to lower rated debtsecurities. These high-yield or “junk bonds” are riskierthan higher rated bonds and are considered speculative.
The Portfolio may invest up to 20% of its total assets inU.S. dollar denominated debt securities issued outsidethe U.S. by foreign and U.S. issuers.
The Portfolio may also acquire common and preferred stock, debt securities and convertible debt and preferred stock.
We may also invest in loans or assignments arranged through private negotiations between a corporation which is theborrower and one or more financial institutions that are the lenders.
Under normal circumstances, the Portfolio may invest in money market instruments. In response to adverse marketconditions or when we are restructuring the Portfolio, we may temporarily invest up to 100% of the Portfolio’s assets inmoney market instruments. Investing heavily in these securities limits our ability to achieve our investment objective,but can help to preserve the Portfolio’s assets when the markets are unstable.
We may also use alternative investment strategies — including derivatives— to try to improve the Portfolio’s returns,protect its assets or for short-term cash management.
We may: purchase and sell options on debt securities; purchase and sell interest rate and interest rate swap futurescontracts and options on these futures contracts; and purchase securities on a when-issued or delayed deliverybasis. The Portfolio may invest in PIK bonds.
The Portfolio may also enter into short sales. No more than 25% of the Portfolio’s net assets may be used as collateralor segregated for purposes of securing a short sale obligation. The Portfolio may also enter into short sales against-the-box.
We may also use interest rate swaps in the management of the Portfolio.
The Portfolio may also enter into repurchase agreements. The Portfolio may participate with certain other Portfolios ofthe Fund in a joint repurchase account under an order obtained from the SEC.
The Portfolio may use up to 30% of its net assets in connection with reverse repurchase agreements and dollar rolls.
Jennison Portfolio (formerly, Prudential Jennison Portfolio)
The investment objective of this Portfolio is to achieve long-term growth of capital. This means we seek investmentswhose price will increase over several years. While we make every effort to achieve our objective, we can’t guaranteesuccess and it is possible that you could lose money.
Investment StrategyWe seek to invest in equity securities of establishedcompanies with above-average growth prospects. Weselect stocks on a company-by-company basis usingfundamental analysis. In making our stock picks, we lookfor companies that have had growth in earnings andsales, high returns on equity and assets or other strongfinancial characteristics. Often, the companies wechoose have superior management, a unique marketniche or a strong new product.
In pursuing our objective, we normally invest 65% of thePortfolio’s total assets in common stocks and preferredstocks of companies with capitalization in excess of $1billion.
For the balance of the Portfolio, we may invest incommon stocks, preferred stocks and other equity-related securities of companies that are undergoingchanges in management, product and/or marketingdynamics which we believe have not yet been reflectedin reported earnings or recognized by investors.
51

In addition, we may invest in debt securities and mortgage-related securities. These securities may be rated as lowas Baa by Moody’s or BBB by S&P (or if unrated, of comparable quality in our judgment).
The Portfolio may also invest in obligations issued or guaranteed by the U.S. government, its agencies andinstrumentalities. Up to 30% of the Portfolio’s assets may be invested in foreign equity and equity-related securities.For these purposes, we do not consider American Depositary Receipts (ADRs) as foreign securities.
In response to adverse market conditions or when restructuring the Portfolio, we may invest up to 100% of thePortfolio’s assets in money market instruments. Investing heavily in these securities limits our ability to achieve ourinvestment objective, but can help to preserve the Portfolio’s assets when the markets are unstable.
We may also use alternative investment strategies — including derivatives— to try to improve the Portfolio’s returns,protect its assets or for short-term cash management.
We may: purchase and sell options on equity securities, stock indexes and foreign currencies; purchase and sell stockindex and foreign currency futures contracts and options on those futures contracts; enter into forward foreigncurrency exchange contracts; and purchase securities on a when-issued or delayed delivery basis.
The Portfolio may also lend its portfolio securities to brokers, dealers and other financial institutions to earn income.
The Portfolio may also enter into short sales against-the-box.
The Portfolio may also enter into repurchase agreements. The Portfolio may participate with certain other Portfolios ofthe Fund in a joint repurchase account under an order obtained from the SEC. The Portfolio may invest in equity and/or debt securities issued by Real Estate Investment Trusts (REITs).
Money Market Portfolio
The investment objective of this Portfolio is to seek the maximum current income that is consistent with stabilityof capital and maintenance of liquidity. This means we seek investments that we think will provide a high level ofcurrent income. While we make every effort to achieve our objective, we can’t guarantee success.
Steady Net Asset ValueThe net asset value for the Portfolio will ordinarily remainissued at $10 per share because dividends are declaredand reinvested daily. The price of each share remainsthe same, but when dividends are declared the value ofyour investment grows.
We invest in a diversified portfolio of short-term debtobligations of the U.S. government, its agencies andinstrumentalities, as well as commercial paper, assetbacked securities, funding agreements, certificates ofdeposit, floating and variable rate demand notes, notesand other obligations issued by banks, corporations andother companies (including trust structures), andobligations issued by foreign banks, companies orforeign governments.
We make investments that meet the requirements of specific rules for money market mutual funds, such as InvestmentCompany Act Rule 2a-7. As such, we will not acquire any security with a remaining maturity exceeding thirteen months,and we will maintain a dollar-weighted average portfolio maturity of 90 days or less. In addition, we will comply with thediversification, quality and other requirements of Rule 2a-7. This means, generally, that the instruments that wepurchase present “minimal credit risk” and are of “eligible quality.” “Eligible quality” for this purpose means a security is:(i) rated in one of the two highest short-term rating categories by at least two major rating services (or if only one majorrating service has rated the security, as rated by that service); or (ii) if unrated, of comparable quality in our judgment.All securities that we purchase will be denominated in U.S. dollars.
Commercial paper is short-term debt obligations of banks, corporations and other borrowers. The obligations areusually issued by financially strong businesses and often include a line of credit to protect purchasers of the obligations.An asset-backed security is a loan or note that pays interest based upon the cash flow of a pool of assets, such asmortgages, loans and credit card receivables. Funding agreements are contracts issued by insurance companies that
52

guarantee a return of principal, plus some amount of interest. When purchased by money market funds, fundingagreements will typically be short-term and will provide an adjustable rate of interest.
Certificates of deposit, time deposits and bankers’ acceptances are obligations issued by or through a bank. Theseinstruments depend upon the strength of the bank involved in the borrowing to give investors comfort that theborrowing will be repaid when promised.
We may purchase debt securities that include demand features, which allow us to demand repayment of a debtobligation before the obligation is due or “matures.” This means that longer term securities can be purchased becauseof our expectation that we can demand repayment of the obligation at a set price within a relatively short period of time,in compliance with the rules applicable to money market mutual funds.
The Portfolio may also purchase floating rate and variable rate securities. These securities pay interest at rates thatchange periodically to reflect changes in market interest rates. Because these securities adjust the interest they pay,they may be beneficial when interest rates are rising because of the additional return the Portfolio will receive, and theymay be detrimental when interest rates are falling because of the reduction in interest payments to the Portfolio.
The securities that we may purchase may change over time as new types of money market instruments are developed.We will purchase these new instruments, however, only if their characteristics and features follow the rules governingmoney market mutual funds.
We may also use alternative investment strategies to try to improve the Portfolio’s returns, protect its assets or forshort-term cash management. There is no guarantee that these strategies will work, that the instruments necessary toimplement these strategies will be available or that the Portfolio will not lose money.
We may purchase securities on a when-issued or delayed delivery basis.
The Portfolio may also enter into repurchase agreements. The Portfolio may participate with certain other Portfolios ofthe Fund in a joint repurchase account under an order obtained from the SEC.
The Portfolio may use up to 10% of its net assets in connection with reverse repurchase agreements.
An investment in the Portfolio is not a bank deposit and is not insured or guaranteed by the Federal DepositInsurance Corporation or any other government agency. Although the Portfolio seeks to preserve the value of aninvestment at $10 per share, it is possible to lose money by investing in the Portfolio.
Stock Index Portfolio
The investment objective of this Portfolio is to achieve investment results that generally correspond to theperformance of publicly-traded common stocks. To achieve this goal, we attempt to duplicate the performance ofthe Standard & Poor’s 500 Composite Stock Price Index (S&P 500 Index). While we make every effort to achieve ourobjective, we can’t guarantee success and it is possible that you could lose money.
S&P 500 IndexWe attempt to duplicate the performance of the S&P 500Index, a market-weighted index which represents morethan 70% of the market value of all publicly-tradedcommon stocks.
Under normal conditions, we attempt to invest in all 500stocks represented in the S&P 500 Index in proportion totheir weighting in the S&P 500 Index. We will normallyinvest at least 80% of the Portfolio’s investable assets inS&P 500 Index stocks, but we will attempt to remain asfully invested in the S&P 500 Index stocks as possible inlight of cash flow into and out of the Portfolio.
To manage investments and redemptions in the Portfolio, we may temporarily hold cash or invest in high-quality moneymarket instruments. To the extent we do so, the Portfolio’s performance will differ from that of the S&P 500 Index. We
53

attempt to minimize differences in the performance of the Portfolio and the S&P 500 Index by using stock index futurescontracts, options on stock indexes and options on stock index futures contracts. The Portfolio will not use thesederivative securities for speculative purposes or to hedge against a decline in the value of the Portfolio’s holdings.
We may also use alternative investment strategies to try to improve the Portfolio’s returns or for short-term cashmanagement. The Portfolio may lend its portfolio securities to brokers, dealers and other financial institutions to earnincome. There is no guarantee that these strategies will work, that the instruments necessary to implement thesestrategies will be available or that the Portfolio will not lose money.
We may: purchase and sell options on stock indexes; purchase and sell stock futures contracts and options on thosefutures contracts; and purchase and sell exchange-traded fund shares.
The Portfolio may also enter into short sales and short sales against-the-box. No more than 5% of the Portfolio’stotal assets may be used as collateral or segregated for purposes of securing a short sale obligation.
The Portfolio may also enter into repurchase agreements. The Portfolio may participate with certain other Portfolios ofthe Fund in a joint repurchase account under an order obtained from the SEC. The Portfolio may invest in equity and/or debt securities issued by Real Estate Investment Trusts (REITs).
A stock’s inclusion in the S&P 500 Index in no way implies S&P’s opinion as to the stock’s attractiveness as aninvestment. The portfolio is not sponsored, endorsed, sold or promoted by S&P. S&P makes no representationsregarding the advisability of investing in the portfolio. “Standard & Poor’s,” “Standard & Poor’s 500” and “500” aretrademarks of McGraw Hill.
Value Portfolio
The investment objective of this Portfolio is to seek capital appreciation. This means we focus on stocks that areundervalued — those stocks that are trading below their underlying asset value, cash generating ability, and overallearnings and earnings growth. While we make every effort to achieve our objective, we can’t guarantee success and itis possible that you could lose money.
Contrarian ApproachTo achieve our value investment strategy, we generallytake a strong contrarian approach to investing. In otherwords, we usually buy stocks that are out of favor andthat many other investors are selling, and we attempt toinvest in companies and industries before otherinvestors recognize their true value. Using theseguidelines, we focus on long-term performance, notshort-term gain.
We will normally invest at least 65% of the Portfolio’stotal assets in equity and equity-related securities. Mostof our investments will be securities of largecapitalization companies. When deciding which stocks tobuy, we look at a company’s earnings, balance sheetand cash flow and then at how these factors impact thestock’s price and return. We also buy equity-relatedsecurities — like bonds, corporate notes and preferredstock — that can be converted into a company’scommon stock or other equity security.
Up to 35% of the Portfolio’s total assets may be invested in other debt obligations including non-convertible preferredstock. When acquiring these types of securities, we usually invest in obligations rated A or better by Moody’s or S&P.We may also invest in obligations rated as low as CC by Moody’s or Ca by S&P. These securities are consideredspeculative and are sometimes referred to as “junk bonds.” We may also invest in instruments that are not rated, butwhich we believe are of comparable quality to the instruments described above.
Up to 30% of the Portfolio’s total assets may be invested in foreign securities, including money market instruments,equity securities and debt obligations. For these purposes, we do not consider American Depositary Receipts (ADRs)as foreign securities.
Under normal circumstances, the Portfolio may invest up to 35% of its total assets in high-quality money marketinstruments. In response to adverse market conditions or when we are restructuring the Portfolio, we may temporarily
54

invest up to 100% of the Portfolio’s assets in money market instruments. Investing heavily in these securities limits ourability to achieve our investment objective, but can help to preserve the Portfolio’s assets when the markets areunstable.
We may also use alternative investment strategies — including derivatives— to try to improve the Portfolio’s returns,protect its assets or for short-term cash management. The Portfolio may lend its portfolio securities to brokers, dealersand other financial institutions to earn income.
We may: purchase and sell options on equity securities, stock indexes and foreign currencies; purchase and sell stockindex and foreign currency futures contracts and options on these futures contracts; enter into forward foreigncurrency exchange contracts; and purchase securities on a when-issued or delayed delivery basis.
The Portfolio may also enter into short sales against-the-box.
The Portfolio may also enter into repurchase agreements. The Portfolio may participate with certain other Portfolios ofthe Fund in a joint repurchase account under an order obtained from the SEC. The Portfolio may invest in equity and/or debt securities issued by Real Estate Investment Trusts (REITs).
Jennison Associates LLC is responsible for managing approximately 50% of the Portfolio’s assets. Victory CapitalManagement Inc. (formerly, Key Asset Management Inc.) and Deutsche Asset Management, Inc. (DAMI) are eachresponsible for managing approximately 25% of the Portfolio’s assets.
SP AIM Aggressive Growth Portfolio
The Portfolio’s investment objective is to achieve long-term growth of capital. This investment objective is non-fundamental, meaning that we can change the objective without seeking a vote of contractholders. The Portfolio seeksto meet this objective by investing principally in securities of companies whose earnings the portfolio managers expectto grow more than 15% per year. While we make every effort to achieve our objective, we can’t guarantee success andit is possible that you could lose money.
Aggressive Growth Stock InvestingThe Portfolio invests primarily in the common stock ofsmall and medium-sized companies that are anticipatedto have excellent prospects for long-term growth ofearnings.
The Portfolio will invest in small- and medium-sizedgrowth companies. The portfolio managers focus oncompanies they believe are likely to benefit from new orinnovative products, services or processes as well asthose that have experienced above-average, long-termgrowth in earnings and have excellent prospects forfuture growth. The portfolio managers consider whetherto sell a particular security when any of those factorsmaterially changes.
The Portfolio may invest up to 25% of its total assets in foreign securities. In anticipation of or in response to adversemarket conditions, for cash management purposes, or for defensive purposes, the Portfolio may temporarily hold all ora portion of its assets in cash, money market instruments, shares of affiliated money market funds, bonds or other debtsecurities. The Portfolio may borrow for emergency or temporary purposes. As a result, the Portfolio may not achieveits investment objective.
The Portfolio may purchase and sell stock index futures contracts and related options on stock index futures, andmay purchase and sell futures contracts on foreign currencies and related options on foreign currency futurescontracts. The Portfolio may invest up to 25% of its total assets in Real Estate Investment Trusts (REITs), and thePortfolio may invest in the securities of other investment companies to the extent otherwise permissible under theInvestment Company Act of 1940, and the rules, regulations and orders promulgated thereunder. The Portfolio alsomay invest in preferred stock, convertible debt, convertible preferred stock, forward foreign currency exchangecontracts, restricted securities, repurchase agreements, reverse repurchase agreements and dollar rolls, warrants,when-issued and delayed delivery securities, options on stock and debt securities, options on stock indexes,
55

options on foreign currencies, and may loan portfolio securities. The Portfolio may also invest in equity-linked derivativeproducts designed to replicate the composition and performance of particular indices. Examples of such productsinclude S&P Depositary Receipts, World Equity Benchmark Series, NASDAQ 100 tracking shares, Dow JonesIndustrial Average Instruments and Optimised Portfolios as Listed Securities. Investments in equity-linked derivativesinvolve the same risks associated with a direct investment in the types of securities included in the indices suchproducts are designed to track. There can be no assurance that the trading price of the equity-linked derivatives willequal the underlying value of the basket of securities purchased to replicate a particular index or that such basket willreplicate the index. Investments in equity-linked derivatives may constitute investment in other investment companies.The Portfolio may invest in U.S. Government securities and may make short sales against-the-box (no more than10% of the Portfolio’s total assets may be deposited or pledged as collateral for short sales at any one time).
The Portfolio is managed by A I M Capital Management, Inc.
SP AIM Core Equity Portfolio (formerly, SP AIM Growth and Income Portfolio)
The Portfolio’s investment objective is growth of capital with a secondary objective of current income. This investmentobjective is non-fundamental, meaning that we can change the objective without seeking a vote of contractholders. ThePortfolio seeks to meet its objective by investing, normally, at least 80% of investible assets in equity securities,including convertible securities, of established companies that have long-term above-average growth in earnings anddividends, and growth companies that the portfolio managers believe have the potential for above-average growth inearnings and dividends. In complying with this 80% requirement, the Portfolio’s investments may include syntheticinstruments. Synthetic instruments are investments that have economic characteristics similar to the Portfolio’s directinvestments, and may include warrants, futures, options, exchange-traded funds and ADRs. While we make everyeffort to achieve our objective, we can’t guarantee success and it is possible that you could lose money.
Growth And Income InvestingThis Portfolio invests in a wide variety of equitysecurities and debt securities in an effort to achieve bothcapital appreciation as well as current income.
The Portfolio may invest in corporate debtsecurities. Corporations issue debt securities ofvarious types, including bonds and debentures(which are long-term), notes (which may be short-or long-term), bankers acceptances (indirectlysecured borrowings to facilitate commercialtransactions) and commercial paper (short-termunsecured notes).
The Portfolio may also invest in convertible securities whose values will be affected by market interest rates, the riskthat the issuer may default on interest or principal payments and the value of the underlying common stock into whichthese securities may be converted. Specifically, since these types of convertible securities pay fixed interest anddividends, their values may fall if interest rates rise and rise if market interest rates fall. Additionally, an issuer mayhave the right to buy back certain of the convertible securities at a time and price that is unfavorable to the Portfolio.
The values of fixed rate income securities tend to vary inversely with changes in interest rates, with longer-termsecurities generally being more volatile than shorter-term securities. Corporate securities frequently are subject to callprovisions that entitle the issuer to repurchase such securities at a predetermined price prior to their stated maturity. Inthe event that a security is called during a period of declining interest rates, the Portfolio may be required to reinvestthe proceeds in securities having a lower yield. In addition, in the event that a security was purchased at a premiumover the call price, the Portfolio will experience a capital loss if the security is called. Adjustable rate corporate debtsecurities may have interest rate caps and floors.
The Portfolio may invest in securities issued or guaranteed by the United States government or its agencies orinstrumentalities. These include Treasury securities (bills, notes, bonds and other debt securities) which differ only intheir interest rates, maturities and times of issuance. U.S. Government agency and instrumentality securities includesecurities which are supported by the full faith and credit of the U.S., securities that are supported by the right of theagency to borrow from the U.S. Treasury, securities that are supported by the discretionary authority of the U.S.Government to purchase certain obligations of the agency or instrumentality and securities that are supported only by
56

the credit of such agencies. While the U.S. Government may provide financial support to such U.S. government-sponsored agencies or instrumentalities, no assurance can be given that it always will do so. The U.S. government, itsagencies and instrumentalities do not guarantee the market value of their securities. The values of such securitiesfluctuate inversely to interest rates.
To the extent consistent with its investment objective and policies, the Portfolio may invest in equity and/or debtsecurities issued by Real Estate Investment Trusts (REITs). Such investments will not exceed 25% of the total assetsof the Portfolio. To the extent that the Portfolio has the ability to invest in REITs, it could conceivably own real estatedirectly as a result of a default on the securities it owns. The Portfolio, therefore, may be subject to certain risksassociated with the direct ownership of real estate including difficulties in valuing and trading real estate, declines in thevalue of real estate, risks related to general and local economic condition, adverse change in the climate for real estate,environmental liability risks, increases in property taxes and operating expense, changes in zoning laws, casualty orcondemnation losses, limitations on rents, changes in neighborhood values, the appeal of properties to tenants, andincreases in interest rates.
The Portfolio may hold up to 20% of its assets in foreign securities. Such investments may include AmericanDepositary Receipts (ADRs), European Depositary Receipts (EDRs) and other securities representing underlyingsecurities of foreign issuers. These securities may not necessarily be denominated in the same currency as thesecurities into which they may be converted.
The Portfolio has authority to deal in foreign exchange between currencies of the different countries in which it willinvest either for the settlement of transactions or as a hedge against possible variations in the foreign exchange ratesbetween those currencies. This may be accomplished through direct purchases or sales of foreign currency, purchasesof futures contracts with respect to foreign currency (and options thereon), and contractual agreements to purchase orsell a specified currency at a specified future date (up to one year) at a price set at the time of the contract. Suchcontractual commitments may be forward contracts entered into directly with another party or exchange-traded futurescontracts. The Portfolio may purchase and sell options on futures contracts or forward contracts which aredenominated in a particular foreign currency to hedge the risk of fluctuations in the value of another currency.
For the purpose of realizing additional income, the Portfolio may make secured loans of portfolio securities amountingto not more than 331⁄3% of its total assets.
The Portfolio may invest in reverse repurchase agreements with banks. The Portfolio may employ reverserepurchase agreements (i) for temporary emergency purposes, such as to meet unanticipated net redemptions so as toavoid liquidating other portfolio securities during unfavorable market conditions; (ii) to cover short-term cashrequirements resulting from the timing of trade settlements; or (iii) to take advantage of market situations where theinterest income to be earned from the investment of the proceeds of the transaction is greater than the interestexpense of the transaction.
The Portfolio may purchase securities of unseasoned issuers. Securities in such issuers may provide opportunities forlong term capital growth. Greater risks are associated with investments in securities of unseasoned issuers than in thesecurities of more established companies because unseasoned issuers have only a brief operating history and mayhave more limited markets and financial resources. As a result, securities of unseasoned issuers tend to be morevolatile than securities of more established companies.
The Portfolio may invest in other investment companies to the extent permitted by the Investment Company Act, andrules and regulations thereunder, and if applicable, exemptive orders granted by the SEC.
The Portfolio may purchase and sell stock index futures contracts and related options on stock index futures, andmay purchase and sell futures contracts on foreign currencies and related options on foreign currency futurescontracts. The Portfolio may invest in the securities of other investment companies to the extent otherwise permissibleunder the Investment Company Act of 1940, and the rules, regulations and orders promulgated thereunder. ThePortfolio also may invest in preferred stock, convertible debt, convertible preferred stock, forward foreign currencyexchange contracts, restricted securities, repurchase agreements, reverse repurchase agreements and dollarrolls, warrants, when-issued and delayed delivery securities, options on stock and debt securities, options onstock indexes, options on foreign currencies, and may loan portfolio securities. The Portfolio may also invest in equity-
57

linked derivative products designed to replicate the composition and performance of particular indices. Examples ofsuch products include S&P Depositary Receipts, World Equity Benchmark Series, NASDAQ 100 tracking shares, DowJones Industrial Average Instruments and Optimised Portfolios as Listed Securities. Investments in equity-linkedderivatives involve the same risk associated with a direct investment in the types of securities included in the indicessuch products are designed to track. There can be no assurance that the trading price of the equity-linked derivativeswill equal the underlying value of the basket of securities purchased to replicate a particular index or that such basketwill replicate the index. Investments in equity-linked derivatives may constitute investment in other investmentcompanies. This Portfolio may invest in U.S. Government securities, and short sales “against-the-box” (no morethan 10% of the Portfolio’s total assets may be deposited or pledged as collateral for short sales at any one time).
In anticipation of or in response to adverse market conditions, for cash management purposes, or for defensivepurposes, the Portfolio may temporarily hold all or a portion of its assets in cash, money market instruments, shares ofaffiliated money market funds, bonds or other debt securities. The Portfolio may borrow for emergency or temporarypurposes. As a result, the Portfolio may not achieve its investment objective.
The Portfolio is managed by A I M Capital Management, Inc.
SP Alliance Large Cap Growth Portfolio
The investment objective of this Portfolio is growth of capital by pursuing aggressive investment policies. Whilewe make every effort to achieve our objective, we can’t guarantee success and it is possible that you could losemoney.
Large Cap GrowthThe Portfolio usually invests in about 40-60 companies,with the 25 most highly regarded of these companiesgenerally constituting approximately 80% of thePortfolio’s investable assets. Alliance seeks to gainpositive returns in good markets while providing somemeasure of protection in poor markets.
During market declines, while adding to positions infavored stocks, the Portfolio becomes somewhatmore aggressive, gradually reducing the number ofcompanies represented in its portfolio. Conversely,in rising markets, while reducing or eliminatingfully-valued positions, the Portfolio becomessomewhat more conservative, gradually increasingthe number of companies represented in theportfolio. Through this approach, Alliance seeks togain positive returns in good markets whileproviding some measure of protection in poormarkets. The Portfolio also may invest up to 20%of its investable assets in convertible debt andconvertible preferred stock and up to 15% of itstotal assets in equity securities of non-U.S.companies.
The Portfolio will invest in special situations from time to time. A special situation arises when, in the opinion of Alliance,the securities of a particular company will, within a reasonably estimable period of time, be accorded market recognitionat an appreciated value solely by reason of a development particularly or uniquely applicable to that company, andregardless of general business conditions or movements of the market as a whole. Developments creating specialsituations might include, among other, liquidations, reorganizations, recapitalizations or mergers, material litigation,technological breakthroughs and new management or management policies. Although large and well-knowncompanies may be involved, special situations often involve much greater risk than is inherent in ordinary investmentsecurities.
Among the principal risks of investing in the Portfolio is market risk. Because the Portfolio invests in a smaller numberof securities than many other equity funds, your investment has the risk that changes in the value of a single securitymay have a more significant effect, either negative or positive, on the Portfolio’s net asset value.
58
The Portfolio seeks long-term growth of capital by investing predominantly in the equity securities of a limited number oflarge, carefully selected, high-quality U.S. companies that are judged likely to achieve superior earnings growth. As amatter of fundamental policy, the Portfolio normally invests at least 85% of its total assets in the equity securities ofU.S. companies. The Portfolio is thus atypical from most equity mutual funds in its focus on a relatively small number ofintensively researched companies. The Portfolio is designed for those seeking to accumulate capital over time with lessvolatility than that associated with investment in smaller companies.
Alliance’s investment strategy for the Portfolio emphasizes stock selection and investment in the securities of a limitednumber of issuers. Alliance relies heavily upon the fundamental analysis and research of its large internal researchstaff, which generally follows a primary research universe of more than 500 companies that have strong management,superior industry positions, excellent balance sheets and superior earnings growth prospects. An emphasis is placedon identifying companies whose substantially above average prospective earnings growth is not fully reflected incurrent market valuations.
In managing the Portfolio, Alliance seeks to utilize market volatility judiciously (assuming no change in companyfundamentals), striving to capitalize on apparently unwarranted price fluctuations, both to purchase or increasepositions on weakness and to sell or reduce overpriced holdings. The Portfolio normally remains nearly fully investedand does not take significant cash positions for market timing purposes.
Alliance normally invests at least 80% of the Portfolio’s investable assets in stocks of companies considered to havelarge capitalizations (i.e., similar to companies included in the S&P 500 Index).
The Portfolio also may:
‰ invest up to 15% of its total assets in foreign securities;
‰ purchase and sell exchange-traded index options and stock index futures contracts;
‰ write covered exchange-traded call options on its securities of up to 15% of its total assets, and purchase andsell exchange-traded call and put options on common stocks written by others of up to, for all options, 10% ofits total assets;
‰ make short sales “against-the-box” of up to 15% of its net assets; and
‰ invest up to 10% of its total assets in illiquid securities.
The Portfolio may invest in a wide variety of equity securities including large cap stocks, convertible and preferredsecurities, warrants and rights. The Portfolio may also invest in foreign securities, including foreign equity securities,and other securities that represent interests in foreign equity securities, such as European Depositary Receipts (EDRs)and Global Depositary Receipts (GDRs). The Portfolio may invest in American Depositary Receipts (ADRs), which arenot subject to the 15% limitation on foreign securities. The Portfolio may also invest in derivatives and in short terminvestments, including money market securities, short term U.S. government obligations, repurchase agreements,commercial paper, banker’s acceptances and certificates of deposit.
In response to adverse market conditions or when restructuring the Portfolio, Alliance may invest up to 100% of thePortfolio’s assets in money market instruments. Investing heavily in these securities limits the ability to achieve theinvestment objective, but can help to preserve the Portfolio’s assets when the markets are unstable.
The Portfolio is managed by Alliance Capital Management, L.P.
SP Alliance Technology Portfolio
The Portfolio emphasizes growth of capital and invests for capital appreciation. Current income is only anincidental consideration. While we make every effort to achieve our objective, we can’t guarantee success and it ispossible that you could lose money.
59

A Technology FocusThis Portfolio normally invests at least 80% of itsinvestable assets in technology.
The Portfolio invests primarily in securities of companiesexpected to benefit from technological advances andimprovements (i.e., companies that use technologyextensively in the development of new or improvedproducts or processes). The Portfolio will normally haveat least 80% of its investable assets invested in thesecurities of these companies.
The Portfolio normally will have substantially all of its assets invested in equity securities, but it also invests in debtsecurities offering an opportunity for price appreciation. The Portfolio will invest in listed and unlisted securities, in U.S.securities, and up to 25% of its total assets in foreign securities. The Portfolio may seek income by writing listed calloptions.
The Portfolio’s policy is to invest in any company and industry and in any type of security with potential for capitalappreciation. It invests in well-known and established companies and in new and unseasoned companies.
The Portfolio also may:
‰ write covered call options on its securities of up to 15% of its total assets and purchase exchange-listed calland put options, including exchange-traded index put options of up to, for all options, 10% of its total assets;
‰ invest up to 10% of its total assets in warrants;
‰ invest up to 15% of its net assets in illiquid securities; and
‰ make loans of portfolio securities of up to 30% of its total assets.
Because the Portfolio invests primarily in technology companies, factors affecting those types of companies could havea significant effect on the Portfolio’s net asset value. In addition, the Portfolio’s investments in technology stocks,especially those of small, less-seasoned companies, tend to be more volatile than the overall market. The Portfolio’sinvestments in debt and foreign securities have credit risk and foreign risk.
In response to adverse market conditions or when restructuring the Portfolio, Alliance may invest up to 100% of thePortfolio’s assets in money market instruments. Investing heavily in these securities limits the ability to achieve theinvestment objective, but can help to preserve the Portfolio’s assets when the markets are unstable.
The Portfolio is managed by Alliance Capital Management, L.P.
SP Asset Allocation Portfolios
There are four Asset Allocation Portfolios, entitled SP Aggressive Growth Asset Allocation Portfolio, SP Balanced AssetAllocation Portfolio, SP Conservative Asset Allocation Portfolio, and SP Growth Asset Allocation Portfolio. Theinvestment objective of each of the Portfolios is to obtain the highest potential total return consistent with thespecified level of risk tolerance. The definition of risk tolerance level is not a fundamental policy and, therefore, canbe changed by the Fund’s Board of Directors at any time. While each Portfolio will try to achieve its objective, we can’tguarantee success and it is possible that you could lose money. The Asset Allocation Portfolios are designed for:
‰ the investor who wants to maximize total return potential, but lacks the time, or expertise to do so effectively;
‰ the investor who does not want to watch the financial markets in order to make periodic exchanges amongPortfolios; and
‰ the investor who wants to take advantage of the risk management features of an asset allocation program.
The investor chooses an Asset Allocation Portfolio by determining which risk tolerance level most closely correspondsto the investor’s individual planning needs, objectives and comfort.
60

Each Asset Allocation Portfolio invests its assets in shares of underlying Portfolios according to the target percentagesindicated in the Portfolio descriptions below. Periodically, we will rebalance each Asset Allocation Portfolio to bring thePortfolio’s holdings in line with those target percentages. The manager expects that the rebalancing will occur on amonthly basis, although the rebalancing may occur less frequently. In addition, the manager will review the targetpercentages annually. Based on its evaluation the target percentages may be adjusted. Such adjustments will bereflected in the annual update to this prospectus. With respect to each of the four Asset Allocation Portfolios, PrudentialInvestments LLC reserves the right to alter the percentage allocations indicated below and/or the underlying FundPortfolios in which the Asset Allocation Portfolio invests if market conditions warrant. Although we will make every effortto meet each Asset Allocation Portfolio’s investment objective, we can’t guarantee success.
The performance of each Asset Allocation Portfolio depends on how its assets are allocated and reallocated betweenthe underlying Portfolios. A principal risk of investing in each Asset Allocation Portfolio is that Prudential InvestmentsLLC will make less than optimal decisions regarding allocation of assets in the underlying Portfolios. Because each ofthe Asset Allocation Portfolios invests all of its assets in underlying Portfolios, the risks associated with each AssetAllocation Portfolio are closely related to the risks associated with the securities and other investments held by theunderlying Portfolios. The ability of each Asset Allocation Portfolio to achieve its investment objective will depend onthe ability of the underlying Portfolios to achieve their investment objectives.
Each Asset Allocation Portfolio is managed by Prudential Investments LLC.
SP Aggressive Growth Asset Allocation Portfolio
An Asset Allocation Portfolio Investing Fully inEquity Portfolios
The SP Aggressive Growth Asset Allocation Portfolioinvests in shares of the following Fund Portfolios:
This Portfolio aggressively seeks capital appreciation byinvesting in large cap equity Portfolios, internationalPortfolios, and small/mid-cap equity Portfolios.
‰ a large capitalization equity component(approximately 40% of the Portfolio, invested inshares of the SP Davis Value Portfolio (20% ofPortfolio), the SP Alliance Large Cap GrowthPortfolio (10% of Portfolio), and the JennisonPortfolio (10% of Portfolio)); and
‰ an international component (approximately 35%of the Portfolio, invested in shares of the SPJennison International Growth Portfolio (17.5%of Portfolio) and the SP Deutsche InternationalEquity Portfolio (17.5% of Portfolio)); and
‰ a small/mid capitalization equity component(approximately 25% of the Portfolio, invested inshares of the SP Small/Mid-Cap Value Portfolio(12.5% of Portfolio) and the SP Prudential U.S.Emerging Growth Portfolio (12.5% of Portfolio)).
For more information on the underlying Portfolios, please refer to the descriptions of each Portfolio’s investmentobjectives and policies included in this prospectus.
61

SP Balanced Asset Allocation Portfolio
A Balance Between Current Income And CapitalAppreciationThis Portfolio seeks to balance current income andgrowth of capital by investing in fixed income Portfolios,large cap equity Portfolios, small/mid-cap equityPortfolios, and international equity Portfolios.
The SP Balanced Asset Allocation Portfolio invests inshares of the following Portfolios:
‰ a fixed income component (approximately 40%of the Portfolio, invested in shares of the SPPIMCO Total Return Portfolio (25% of Portfolio)and the SP PIMCO High Yield Portfolio (15% ofPortfolio)); and
‰ a large capitalization equity component(approximately 35% of the Portfolio, invested inshares of the SP Davis Value Portfolio (17.5%of Portfolio), the SP Alliance Large Cap GrowthPortfolio (8.75% of Portfolio), and the JennisonPortfolio (8.75% of Portfolio)); and
‰ a small/mid capitalization equity component(approximately 15% of the Portfolio, invested inshares of the SP Small/Mid-Cap Value Portfolio(7.5% of Portfolio) and the SP Prudential U.S.Emerging Growth Portfolio (7.5% of Portfolio));and
‰ an international component (approximately 10%of the Portfolio, invested in shares of the SPJennison International Growth Portfolio (5% ofPortfolio) and the SP Deutsche InternationalEquity Portfolio (5% of Portfolio)).
For more information on the underlying Portfolios, please refer to the description of each Portfolio’s investmentobjectives and policies included in this prospectus.
SP Conservative Asset Allocation Portfolio
An Asset Allocation Portfolio Investing Primarily InFixed Income PortfoliosThis Portfolio is invested in fixed income, large capequity, and small/mid-cap equity Portfolios.
The SP Conservative Asset Allocation Portfolio investsin shares of the following Portfolios:
‰ a fixed income component (approximately 60%of the Portfolio, invested in shares of the SPPIMCO Total Return Portfolio (40% of Portfolio)and the SP PIMCO High Yield Portfolio (20% ofPortfolio)); and
‰ a large capitalization equity component(approximately 30% of the Portfolio, invested inshares of the SP Davis Value Portfolio (15% ofPortfolio), the SP Alliance Large Cap GrowthPortfolio (7.5% of Portfolio), and the JennisonPortfolio (7.5% of Portfolio)); and
‰ a small/mid capitalization equity component(approximately 10% of the Portfolio, invested inshares of the SP Small/Mid-Cap Value Portfolio(5% of Portfolio) and the SP Prudential U.S.Emerging Growth Portfolio (5% of Portfolio)).
For more information on the underlying Portfolios, please refer to the description of each Portfolio’s investmentobjectives and policies included in this prospectus.
62
SP Growth Asset Allocation Portfolio
An Asset Allocation Portfolio InvestingPrimarily In Equity PortfoliosThis Portfolio seeks to provide long-term growth ofcapital with consideration also given to current income.
The Growth Asset Allocation Portfolio invests in sharesof the following Portfolios:
‰ a large capitalization equity component(approximately 45% of the Portfolio, invested inshares of the SP Davis Value Portfolio (22.5%of Portfolio), the SP Alliance Large Cap GrowthPortfolio (11.25% of Portfolio), and theJennison Portfolio (11.25% of Portfolio)); and
‰ a fixed income component (approximately 20%of the Portfolio, invested in shares of the SPPIMCO High Yield Portfolio (10% of Portfolio)and the SP PIMCO Total Return Portfolio (10%of Portfolio)); and
‰ an international component (approximately 20%of the Portfolio, invested in shares of the SPJennison International Growth Portfolio (10% ofPortfolio) and the SP Deutsche InternationalEquity Portfolio (10% of Portfolio)); and
‰ a small/mid-capitalization equity component(approximately 15% of the Portfolio, invested inshares of the SP Small/Mid-Cap Value Portfolio(7.5% of Portfolio) and the SP Prudential U.S.Emerging Growth Portfolio (7.5% of Portfolio)).
For more information on the underlying Portfolios, please refer to the descriptions of each Portfolio’s investmentobjectives and policies included in this prospectus.
SP Davis Value Portfolio
SP Davis Value Portfolio’s investment objective is growth of capital. In keeping with the Davis investment philosophy,the portfolio managers select common stocks that offer the potential for capital growth over the long-term. While we willtry to achieve our objective, we can’t guarantee success and it is possible that you could lose money.
The Davis Back-to-Basics ApproachUnder the Davis philosophy, Davis seeks to identifycompanies possessing ten basic characteristics, whichDavis believes will foster sustainable long-term growth.
The Portfolio invests primarily in common stocks of U.S.companies with market capitalizations of at least $5billion, but it may also invest in foreign companies andU.S. companies with smaller capitalizations.
COMMON STOCKS
What They Are. Common stock represents ownership of a company.
How They Pick Them. The Davis investment philosophy stresses a back-to-basics approach: they use extensiveresearch to buy growing companies at value prices and hold on to them for the long-term. Over the years, DavisSelected Advisers has developed a list of ten characteristics that they believe foster sustainable long-term growth,minimize risk and enhance the potential for superior long-term returns. While very few companies have all ten, Davissearches for those possessing several of the characteristics that are listed below.
Why They Buy Them. SP Davis Value Portfolio buys common stock to take an ownership position in companies withgrowth potential, and then holds that position long enough to realize the benefits of growth.
63

The Portfolio may also invest in foreign securities, primarily as a way of providing additional opportunities to invest inquality overlooked growth stocks. Investment in foreign securities can also offer the Portfolio the potential for economicdiversification.
WHAT DAVIS LOOKS FOR IN A COMPANY
1. First-Class Management. The Davis investment philosophy believes that great companies are created by greatmanagers. In visiting companies, they look for managers with a record of doing what they say they are going to do.
2. Management Ownership. Just as they invest heavily in their own portfolios, they look for companies whereindividual managers own a significant stake.
3. Strong Returns on Capital. They want companies that invest their capital wisely and reap superior returns onthose investments.
4. Lean Expense Structure. Companies that can keep costs low are able to compete better, especially in difficulttimes. A low cost structure sharply reduces the risk of owning a company’s shares.
5. Dominant or Growing Market Share in a Growing Market. A company that is increasing its share of a growingmarket has the best of both worlds.
6. Proven Record as an Acquirer.When an industry or market downturn occurs, it is a good idea to own companiesthat can take advantage of attractive prices to expand operations through inexpensive acquisitions.
7. Strong Balance Sheet. Strong finances give a company staying power to weather difficult economic cycles.
8. Competitive Products or Services. Davis invests in companies with products that are not vulnerable toobsolescence.
9. Successful International Operations. A proven ability to expand internationally reduces the risk of being tied tooclosely to the U.S. economic cycle.
10. Innovation. The savvy use of technology in any business, from a food company to an investment bank, can helpreduce costs and increase sales.
Other Securities and Investment Strategies
The Portfolio invests primarily in the common stock of large capitalization domestic companies. There are othersecurities in which the Portfolio may invest, and investment strategies which the Portfolio may employ, but they are notprincipal investment strategies. The Portfolio may invest in equity and/or debt securities issued by Real EstateInvestment Trusts (REITs).
The Portfolio uses short-term investments to maintain flexibility while evaluating long-term opportunities. The Portfolioalso may use short-term investments for temporary defensive purposes; in the event the portfolio managers anticipatea decline in the market values of common stock of large capitalization domestic companies, they may reduce the riskby investing in short-term securities until market conditions improve. Unlike common stocks, these investments will notappreciate in value when the market advances. In such a circumstance, the short-term investments will not contributeto the Portfolio’s investment objective.
The Portfolio is managed by Davis Selected Advisers, L.P.
SP Deutsche International Equity Portfolio
The Portfolio seeks long-term capital appreciation. Under normal circumstances, the Portfolio invests at least 80% ofits investable assets in the stocks and other securities with equity characteristics of companies in developed countriesoutside the United States. While we make every effort to achieve our objective, we can’t guarantee success and it ispossible that you could lose money.
64

International Equities From Developed CountriesThe Portfolio invests primarily in the stocks of companieslocated in developed foreign countries that make up theMSCI EAFE Index, plus Canada. The Portfolio also mayinvest in emerging markets securities.
The Portfolio invests for capital appreciation, not income;any dividend or interest income is incidental to thepursuit of that goal.
The Portfolio invests for the long term. The Portfolio employs a strategy of growth at a reasonable price. The Portfolioseeks to identify companies outside the United States that combine strong potential for earnings growth withreasonable investment value. Such companies typically exhibit increasing rates of profitability and cash flow, yet theirshare prices compare favorably to other stocks in a given market and to their global peers. In evaluating stocks, thePortfolio considers factors such as sales, earnings, cash flow and enterprise value. Enterprise value is a company’smarket capitalization plus the value of its net debt. The Portfolio further considers the relationship between these andother quantitative factors. Together, these indicators of growth and value may identify companies with improvingprospects before the market in general has taken notice.
Principal Investments
Almost all the companies in which the Portfolio invests are based in the developed foreign countries that make up theMSCI EAFE Index, plus Canada. The Portfolio may also invest a portion of its assets in companies based in theemerging markets of Latin America, the Middle East, Europe, Asia and Africa if it believes that its return potential morethan compensates for the extra risks associated with these markets. Under normal market conditions investment inemerging markets is not considered to be a central element of the Portfolio’s strategy. Typically, the Portfolio will nothold more than 15% of its net assets in emerging markets. The Portfolio may invest in a variety of debt securities,equity securities, and other instruments, including convertible securities, warrants, foreign securities, options (onstock, debt, stock indices, foreign currencies, and futures), futures contracts, forward foreign currency exchangecontracts, interest rate swaps, loan participations, reverse repurchase agreements, dollar rolls, when-issuedand delayed delivery securities, short sales, and illiquid securities. We explain each of these instruments in detail inthe Statement of Additional Information.
Investment Process
Company research lies at the heart of Deutsche Asset Management Inc.’s (DAMI’s) investment process, as it does withmany stock mutual fund portfolios. Several thousand companies are tracked to arrive at the approximately 100 stocksthe Portfolio normally holds. But the process brings an added dimension to this fundamental research. It draws on theinsight of experts from a range of financial disciplines — regional stock market specialists, global industry specialists,economists and quantitative analysts. They challenge, refine and amplify each other’s ideas. Their close collaborationis a critical element of the investment process.
Temporary Defensive Position. The Portfolio may from time to time adopt a temporary defensive position in responseto extraordinary adverse political, economic or stock market events. The Portfolio may invest up to 100% of its assetsin U.S. or foreign government money market investments, or other short-term bonds that offer comparable safety, if thesituation warranted. To the extent the Portfolio might adopt such a position over the course of its duration, the Portfoliomay not meet its goal of long-term capital appreciation.
Primary Risks
Market Risk. Although individual stocks can outperform their local markets, deteriorating market conditions mightcause an overall weakness in the stock prices of the entire market.
Stock Selection Risk. A risk that pervades all investing is the risk that the securities an investor has selected will notperform to expectations. To minimize this risk, DAMI monitors each of the stocks in the Portfolio according to threebasic quantitative criteria. They subject a stock to intensive review if:
‰ its rate of price appreciation begins to trail that of its national stock index;
65

‰ the financial analysts who follow the stock, both within DAMI and outside, cut their estimates of the stock’sfuture earnings; or
‰ the stock’s price approaches the downside target set when they first bought the stock (and may since havemodified to reflect changes in market and economic conditions).
In this review, DAMI seeks to learn if the deteriorating performance accurately reflects deteriorating prospects or if itmerely reflects investor overreaction to temporary circumstances.
Foreign Stock Market Risk. From time to time, foreign capital markets have exhibited more volatility than those in theUnited States. Trading stocks on some foreign exchanges is inherently more difficult than trading in the United Statesfor reasons including:
‰ Political Risk. Some foreign governments have limited the outflow of profits to investors abroad, extendeddiplomatic disputes to include trade and financial relations, and imposed high taxes on corporate profits. Whilethese political risks have not occurred recently in the major countries in which the Portfolio invests, DAMIanalyzes countries and regions to try to anticipate these risks.
‰ Information Risk. Financial reporting standards for companies based in foreign markets differ from those inthe United States. Since the “numbers” themselves sometimes mean different things, DAMI devotes much ofits research effort to understanding and assessing the impact of these differences upon a company’s financialconditions and prospects.
‰ Liquidity Risk. Stocks that trade less can be more difficult or more costly to buy, or to sell, than more liquid oractive stocks. This liquidity risk is a factor of the trading volume of a particular stock, as well as the size andliquidity of the entire local market. On the whole, foreign exchanges are smaller and less liquid than the U.S.market. This can make buying and selling certain shares more difficult and costly. Relatively smalltransactions in some instances can have a disproportionately large effect on the price and supply of shares. Incertain situations, it may become virtually impossible to sell a stock in an orderly fashion at a price thatapproaches an estimate of its value.
‰ Regulatory Risk. Some foreign governments regulate their exchanges less stringently, and the rights ofshareholders may not be as firmly established.
In an effort to reduce these foreign stock market risks, the Portfolio diversifies its investments, just as you may spreadyour investments among a range of securities so that a setback in one does not overwhelm your entire strategy. In thisway, a reversal in one market or stock need not undermine the pursuit of long-term capital appreciation.
Currency Risk. The Portfolio invests in foreign securities denominated in foreign currencies. This creates thepossibility that changes in foreign exchange rates will affect the value of foreign securities or the U.S. dollar amount ofincome or gain received on these securities. DAMI seeks to minimize this risk by actively managing the currencyexposure of the Portfolio.
Emerging Market Risk. To the extent that the Portfolio does invest in emerging markets to enhance overall returns, itmay face higher political, information, and stock market risks. In addition, profound social changes and businesspractices that depart from norms in developed countries’ economies have hindered the orderly growth of emergingeconomies and their stock markets in the past. High levels of debt tend to make emerging economies heavily reliant onforeign capital and vulnerable to capital flight. For all these reasons, the Portfolio carefully limits and balances itscommitment to these markets.
Secondary Risks
Small Company Risk. Although the Portfolio generally invests in the shares of large, well-established companies, itmay occasionally take advantage of exceptional opportunities presented by small companies. Such opportunities poseunique risks. Small company stocks tend to experience steeper price fluctuations — down as well as up — than thestocks of larger companies. A shortage of reliable information — the same information gap that creates opportunity insmall company investing — can also pose added risk. Industrywide reversals have had a greater impact on smallcompanies, since they lack a large company’s financial resources. Finally, small company stocks are typically less liquidthan large company stocks; when things are going poorly, it is harder to find a buyer for a small company’s shares.
66

Pricing Risk. When price quotations for securities are not readily available, they are valued by the method that mostaccurately reflects their current worth in the judgment of the Board. This procedure implies an unavoidable risk, the riskthat our prices are higher or lower than the prices that the securities might actually command if we sold them.
The Portfolio is managed by Deutsche Asset Management, Inc. (DAMI).
SP INVESCO Small Company Growth Portfolio
The Portfolio seeks long-term capital growth. Most holdings are in small-capitalization companies. While we makeevery effort to achieve our objective, we can’t guarantee success and it is possible that you could lose money.
A Small-Cap Stock PortfolioThe Portfolio generally invests primarily in the stocks ofcompanies with small market capitalizations.
INVESCO is primarily looking for companies in theaccelerated developing stages of their life cycles,which are currently priced below INVESCO’sestimation of their potential, have earnings which maybe expected to grow faster than the U.S. economy ingeneral, and/or offer earnings growth of sales, newproducts, management changes, or structuralchanges in the economy. The Portfolio may invest upto 25% of its assets in securities of non-U.S. issuers.Securities of Canadian issuers and ADRs are notsubject to this 25% limitation.
Under normal circumstances, the Portfolio will invest at least 80% of its investable assets in small-capitalizationcompanies — those which are included in the Russell 2000 Growth Index at the time of purchase, or if not included inthat index, have market capitalizations of $2.5 billion or below at the time of purchase. Although not a principalinvestment, the Portfolio may use derivatives. A derivative is a financial instrument whose value is “derived,” in somemanner, from the price of another security, index, asset or rate. Derivatives include options and futures contracts,among a wide range of other instruments.
Although not a principal investment, the Portfolio may invest in options and futures contracts. Options and futurescontracts are common types of derivatives that the Portfolio may occasionally use to hedge its investments. An optionis the right to buy or sell a security or other instrument, index or commodity at a specific price on or before a specificdate. A futures contract is an agreement to buy or sell a security or other instrument, index or commodity at a specificprice on a specific date.
Although not a principal investment, the Portfolio may invest in repurchase agreements. In addition, the Portfolio mayinvest in debt securities, ADRs, convertible securities, junk bonds, warrants, forward foreign currency exchangecontracts, interest rate swaps, when-issued and delayed delivery securities, short sales against-the-box, U.S.government securities, Brady Bonds, and illiquid securities. The Portfolio may lend its portfolio securities. In responseto adverse market conditions or when restructuring the Portfolio, INVESCO may invest up to 100% of the Portfolio’sassets in money market instruments. Investing heavily in these securities limits the ability to achieve the investmentobjective, but can help to preserve the Portfolio’s assets when the markets are unstable.
The Portfolio is managed by INVESCO Funds Group, Inc.
SP Jennison International Growth Portfolio
The investment objective of the Portfolio is to seek long-term growth of capital. The Portfolio seeks to achieve itsobjective through investment in equity-related securities of foreign companies. While we make every effort to achieveour objective, we can’t guarantee success and it is possible that you could lose money.
67

A Foreign Stock Growth PortfolioThe Portfolio seeks long-term growth by investing in thecommon stock of foreign companies. The Portfoliogenerally invests in about 60 securities of issuerslocated in at least five different foreign countries.
This means the Portfolio seeks investments — primarilythe common stock of foreign companies — that willincrease in value over a period of years. A company isconsidered to be a foreign company if it satisfies at leastone of the following criteria: its securities are tradedprincipally on stock exchanges in one or more foreigncountries; it derives 50% or more of its total revenuefrom goods produced, sales made or services performedin one or more foreign countries; it maintains 50% ormore of its assets in one or more foreign countries; it isorganized under the laws of a foreign country; or itsprincipal executive office is located in a foreign country.
The Portfolio invests in about 60 securities of primarily non-U.S. growth companies whose shares appear attractivelyvalued on a relative and absolute basis. The Portfolio looks for companies that have above-average actual andpotential earnings growth over the long term and strong financial and operational characteristics. The Portfolio selectsstocks on the basis of individual company research. Thus, country, currency and industry weightings are primarily theresult of individual stock selections. Although the Portfolio may invest in companies of all sizes, the Portfolio typicallyfocuses on large and medium sized companies. Under normal conditions, the Portfolio intends to invest at least 65% ofits total assets in the equity-related securities of foreign companies in at least five foreign countries. The Portfolio mayinvest anywhere in the world, including North America, Western Europe, the United Kingdom and the Pacific Basin, butgenerally not the U.S.
The principal type of equity-related security in which the Portfolio invests is common stock. In addition to commonstock, the Portfolio may invest in other equity-related securities that include, but are not limited to, preferred stock,rights that can be exercised to obtain stock, warrants and debt securities or preferred stock convertible orexchangeable for common or preferred stock and master limited partnerships. The Portfolio may also invest in ADRs,which we consider to be equity-related securities.
In deciding which stocks to purchase for the Portfolio, Jennison looks for growth companies that have both strongfundamentals and appear to be attractively valued relative to their growth potential. Jennison uses a bottom-upapproach in selecting securities for the Portfolio, which means that they select stocks based on individual companyresearch, rather than allocating by country or sector. In researching which stocks to buy, Jennison looks at acompany’s basic financial and operational characteristics as well as compare the company’s stock price to the price ofstocks of other companies that are its competitors, absolute historic valuation levels for that company’s stock, itsearnings growth and the price of existing portfolio holdings. Another important part of Jennison’s research process is tohave regular contact with management of the companies that they purchase in order to confirm earnings expectationsand to assess management’s ability to meet its stated goals. Although the Portfolio may invest in companies of allsizes, it typically focuses on large and medium sized companies.
Generally, Jennison looks for companies that have one or more of the following characteristics: actual and potentialgrowth in earnings and cash flow; actual and improving profitability; strong balance sheets; management strength; andstrong market share for the company’s products.
In addition, Jennison looks for companies whose securities appear to be attractively valued relative to: each company’speer group; absolute historic valuations; and existing holdings of the Portfolio. Generally, they consider selling asecurity when there is an identifiable change in a company’s fundamentals or when expectations of future earningsgrowth become fully reflected in the price of that security.
The Portfolio may invest in bonds, money market instruments and other fixed income obligations. Generally, thePortfolio will purchase only “Investment-Grade” fixed income investments. This means the obligations have receivedone of the four highest quality ratings determined by Moody’s Investors Service, Inc. (Moody’s), or Standard & Poor’sRatings Group (S&P), or one of the other nationally recognized statistical rating organizations (NRSROs). Obligationsrated in the fourth category (Baa for Moody’s or BBB for S&P) have speculative characteristics and are subject to agreater risk of loss of principal and interest. On occasion, the Portfolio may buy instruments that are not rated, but thatare of comparable quality to the investment-grade bonds described above.
68

In response to adverse market, economic or political conditions, the portfolio may temporarily invest up to 100% of itsassets in money market instruments or in the stock and other equity-related securities of U.S. companies. Investingheavily in money market instruments limits the ability to achieve capital appreciation, but may help to preserve theportfolio’s assets when global or international markets are unstable. When the portfolio is temporarily invested in equity-related securities of U.S. companies, the portfolio may achieve capital appreciation, although not through investment inforeign companies.
We may also use alternative investment strategies — including derivatives— to try to improve the Portfolio’s returns,protect its assets or for short-term cash management.
We may: purchase and sell options on equity securities, stock indexes and foreign currencies; purchase and sellfutures contracts on stock indexes, debt securities, interest rate indexes and foreign currencies and options on thesefutures contracts; enter into forward foreign currency exchange contracts; purchase securities on a when-issuedor delayed delivery basis; and borrow up to 33-1/3% of the value of the Portfolio’s total assets.
The Portfolio may also enter into short sales against-the-box.
The Portfolio may also enter into repurchase agreements. The Portfolio may participate with certain other Portfolios ofthe Fund in a joint repurchase account under an order obtained from the SEC.
This Portfolio is managed by Jennison Associates LLC.
SP Large Cap Value Portfolio
The investment objective of the SP Large Cap Value Portfolio is long-term growth of capital. The Portfolio ismanaged by Fidelity Management & Research Company (FMR). The Portfolio normally invests at least 80% of thePortfolio’s investable assets in securities of companies with large market capitalizations. The Portfolio normally investsits assets primarily in common stocks.
A Large-Cap Value PortfolioThe Portfolio is managed by Fidelity Management andResearch Company. The Portfolio normally invests atleast 80% of its investable assets in securities ofcompanies with large market capitalizations. ThePortfolio normally invests its assets primarily in commonstocks.
Although a universal definition of large marketcapitalization companies does not exist, FMR generallydefines large market capitalization companies as thosewhose market capitalization is similar to the marketcapitalization of companies in the S&P 500 or theRussell 1000. A company’s market capitalization isbased on its current market capitalization or its marketcapitalization at the time of the Portfolio’s investment.Companies whose capitalization is below this level afterpurchase continue to be considered to have largemarket capitalizations for purposes of the 80% policy.
FMR invests the Portfolio’s assets in companies that it believes are undervalued in the marketplace in relation tofactors such as the company’s assets, earnings, growth potential, or cash flow, or in relation to securities of othercompanies in the same industry. Companies with these characteristics tend to have lower than average price/earnings(P/E) or price/book (P/B) ratios. The stocks of these companies are often called “value” stocks.
FMR may invest the Portfolio’s assets in securities of foreign issuers in addition to securities of domestic issuers.
FMR relies on fundamental analysis of each issuer and its potential for success in light of its current financial condition,its industry position, and economic and market factors. Factors considered include growth potential, earningsestimates, and management. These securities may then be analyzed using statistical models to further evaluate growthpotential, valuation, liquidity and investment risk. In buying and selling securities for the Portfolio, FMR invests for thelong term and selects those securities it believes offer strong opportunities for the long-term growth of capital and areattractively valued.
69

The Portfolio primarily invests in equity securities which represent an ownership interest, or the right to acquire anownership interest, in an issuer. Different types of equity securities provide different voting and dividend rights andpriority in the event of the bankruptcy of the issuer. Equity securities include common stocks, preferred stocks,convertible securities, and warrants.
FMR may use various techniques, such as buying and selling futures contracts, and exchange traded funds toincrease or decrease the Portfolio’s exposure to changing security prices or other factors that affect security values. IfFMR’s strategies do not work as intended, the Portfolio may not achieve its objective. While we make every effort toachieve our objective, we can’t guarantee success and it is possible that you could lose money.
Many factors affect the Portfolio’s performance. The Portfolio’s share price changes daily based on changes in marketconditions and interest rates and in response to other economic, political or financial developments. The Portfolio’sreaction to these developments will be affected by the types of the securities in which the Portfolio invests, the financialcondition, industry and economic sector, and geographic location of an issuer, and the Portfolio’s level of investment inthe securities of that issuer. When you sell units corresponding to shares of the Portfolio, they could be worth more orless than what you paid for them.
In addition to company risk, derivatives risk, foreign investment risk, leveraging risk, liquidity risk, management risk,and market risk, the following factor can significantly affect the Portfolio’s performance:
“Value” stocks can react differently to issuer, political, market and economic developments than the market as a wholeand other types of stocks. “Value” stocks tend to be inexpensive relative to their earnings or assets compared to othertypes of stocks. However, “value” stocks can continue to be inexpensive for long periods of time and may not everrealize their full value.
In response to market, economic, political or other conditions, FMR may temporarily use a different investment strategyfor defensive purposes. If FMR does so, different factors could affect the Portfolio’s performance and the Portfolio maynot achieve its investment objective.
The Portfolio is managed by Fidelity Management and Research Company.
SP MFS Capital Opportunities Portfolio
The Portfolio invests, under normal market conditions, at least 65% of its total assets in common stocks and relatedsecurities, such as preferred stocks, convertible securities and depositary receipts for those securities. While we makeevery effort to achieve our objective, we can’t guarantee success and it is possible that you could lose money.
Capital Opportunities In Both U.S. and ForeignStocksThe Portfolio invests primarily in stocks, convertiblesecurities, and depositary receipts of companies in boththe United States and in foreign countries.
The portfolio focuses on companies whichMassachusetts Financial Services Company (MFS)believes have favorable growth prospects and attractivevaluations based on current and expected earnings orcash flow. The Portfolio’s investments may includesecurities listed on a securities exchange or traded in theover-the-counter markets.
MFS uses a bottom-up, as opposed to a top-down, investment style in managing the Portfolio. This means thatsecurities are selected based upon fundamental analysis (such as an analysis of earnings, cash flows, competitiveposition and management’s abilities) performed by the portfolio manager and MFS’ large group of equity researchanalysts. The Portfolio may invest in foreign securities (including emerging market securities), through which itmay have exposure to foreign currencies. The Portfolio may engage in active and frequent trading to achieve itsprincipal investment strategies. Generally, the Portfolio will invest no more than (i) 35% of its net assets in foreignsecurities and (ii) 15% in lower rated bonds, and the Portfolio will not lend more than 30% of the value of its securities.
The Portfolio can invest in a wide variety of debt and equity securities, including corporate debt, lower-rated bonds,U.S. Government securities, variable and floating rate obligations, zero coupon bonds, deferred interest bonds, PIK
70

bonds, Brady Bonds, depositary receipts, forward contracts, futures contracts, investment company securities,options (on currencies, futures, securities and stock indices), repurchase agreements, mortgage dollar rolls,restricted securities, short sales, short sales against-the-box, warrants, and when-issued and delayed deliverysecurities. The Portfolio may lend its securities. The Portfolio may invest in equity and/or debt securities issued byReal Estate Investment Trusts (REITs).
The Portfolio also may assume a temporary defensive position. In response to adverse market conditions or whenrestructuring the Portfolio, MFS may invest up to 100% of the Portfolio’s assets in money market instruments. Investingheavily in these securities limits the ability to achieve the investment objective, but can help to preserve the Portfolio’sassets when the markets are unstable.
The Portfolio is managed by Massachusetts Financial Services Company (MFS).
SP MFS Mid-Cap Growth Portfolio
The Portfolio’s investment objective is long-term growth of capital. While we make every effort to achieve ourobjective, we can’t guarantee success and it is possible you could lose money.
A Mid-Cap Growth Stock PortfolioThe Portfolio invests primarily in companies with marketcapitalizations equaling or exceeding $250 million butnot exceeding the top of the Russell Midcap™ GrowthIndex range at the time of purchase.
The Portfolio invests, under normal market conditions, atleast 80% of its investable assets in common stocks andrelated securities, such as preferred stocks, convertiblesecurities and depositary receipts for those securities, ofcompanies with medium market capitalization whichMassachusetts Financial Services Company (MFS)believes have above-average growth potential.
Medium market capitalization companies are defined by the Portfolio as companies with market capitalizations equalingor exceeding $250 million but not exceeding the top of the Russell Midcap™ Growth Index range at the time of thePortfolio’s investment. This Index is a widely recognized, unmanaged index of mid-cap common stock prices.Companies whose market capitalizations fall below $250 million or exceed the top of the Russell Midcap™ GrowthIndex range after purchase continue to be considered medium-capitalization companies for purposes of the fund’s 80%investment policy. As of December 28, 2001, the top of the Russell Midcap™ Growth Index range was approximately$15.7 billion. The Portfolio’s investments may include securities listed on a securities exchange or traded in the over-the-counter markets. MFS uses a bottom-up, as opposed to a top-down, investment style in managing the Portfolio.This means that securities are selected based upon fundamental analysis (such as an analysis of earnings, cash flows,competitive position and management’s abilities) performed by the portfolio manager and MFS’s large group of equityresearch analysts.
The Portfolio is a non-diversified mutual fund portfolio. This means that the Portfolio may invest a relatively highpercentage of its assets in a small number of issuers. As a result, the Portfolio’s performance may be tied more closelyto the success or failure of a smaller group of Portfolio holdings. The Portfolio may invest in foreign securities (includingemerging markets securities) through which it may have exposure to foreign currencies. The Portfolio is expected toengage in active and frequent trading to achieve its principal investment strategies. Generally, the Portfolio will invest nomore than (i) 20% of its net assets in foreign securities and (ii) 10% in lower rated bonds, and the Portfolio will not lendmore than 30% of the value of its securities. The Portfolio may invest in a variety of debt securities, equity securities, andother instruments, including corporate debt, lower-rated bonds, U.S. government securities, variable and floating rateobligations, zero coupon bonds, deferred interest bonds, PIK bonds, depository receipts, emerging markets equitysecurities, forward contracts, futures contracts, investment company securities, options (on currencies, futures,securities, and stock indices), repurchase agreements, restricted securities, short sales, short sales against-the-box,short-term debt, warrants, and when-issued and delayed delivery securities. The Portfolio may borrow for temporarypurposes, and lend its portfolio securities.
In response to adverse market conditions or when restructuring the Portfolio, MFS may invest up to 100% of thePortfolio’s assets in money market instruments. Investing heavily in the securities limits the ability to achieve theinvestment objective, but can help to preserve the Portfolio’s assets when markets are unstable.
71
The Portfolio is managed by Massachusetts Financial Services Company (MFS).
SP PIMCO High Yield Portfolio
The investment objective of the Portfolio is a high total return. Under normal circumstances, the Portfolio invests atleast 80% of its investable assets in high yield/high risk bonds.
A High-Yield, High-Risk Bond PortfolioThe Portfolio invests primarily in high-yield, high-riskbonds, also known as “junk bonds.”
The Portfolio may invest up to 15% of its assets inderivative instruments, such as options, futurescontracts or swap agreements. The Portfolio may alsoinvest in mortgage-related securities or asset-backedsecurities.
The Portfolio may seek to obtain market exposure to the securities in which it primarily invests by entering into a seriesof purchase and sale contracts or by using other investment techniques (such as buy backs or dollar rolls). The “totalreturn” sought by the Portfolio consists of income earned on the Portfolio’s investments, plus capital appreciation, ifany, which generally arises from decreases in interest rates or improving credit fundamentals for a particular sector orsecurity.
In selecting securities for the Portfolio, PIMCO develops an outlook for interest rates, currency exchange rates and theeconomy; analyzes credit and call risks, and uses other security selection techniques. The proportion of a Portfolio’sassets committed to investment in securities with particular characteristics (such as quality, sector, interest rate ormaturity) varies based on PIMCO’s outlook for the U.S. economy and the economies of other countries in the world, thefinancial markets and other factors.
PIMCO attempts to identify areas of the bond market that are undervalued relative to the rest of the market. PIMCOidentifies these areas by grouping bonds into the following sectors: money markets, governments, corporates,mortgages, asset-backed and international. Sophisticated proprietary software then assists in evaluating sectors andpricing specific securities. Once investment opportunities are identified, PIMCO will shift assets among sectorsdepending upon changes in relative valuations and credit spreads. There is no guarantee that PIMCO’s securityselection techniques will produce the desired results. While we make every effort to achieve our objective, we can’tguarantee success and it is possible that you could lose money.
The Portfolio may also invest in Brady Bonds, which are described below in the section on the SP PIMCO Total ReturnPortfolio.
Securities rated lower than Baa by Moody’s Investors Service, Inc. (Moody’s) or lower than BBB by Standard & Poor’sRatings Services (“S&P”) are sometimes referred to as “high yield” or “junk” bonds. Investing in high yield securitiesinvolves special risks in addition to the risks associated with investments in higher-rated fixed income securities. Whileoffering a greater potential opportunity for capital appreciation and higher yields, high yield securities typically entailgreater potential price volatility and may be less liquid than higher-rated securities. High yield securities may beregarded as predominantly speculative with respect to the issuer’s continuing ability to meet principal and interestpayments. They may also be more susceptible to real or perceived adverse economic and competitive industryconditions than higher-rated securities.
The Portfolio may invest in inflation-indexed bonds, which are described below in the section on the SP PIMCO TotalReturn Portfolio.
The Portfolio may invest in convertible debt and convertible preferred stock securities.
The Portfolio may also enter into, or acquire participations in, delayed funding loans and revolving credit facilities, whichare described in the section on SP PIMCO Total Return Portfolio.
For the purpose of achieving income, each Portfolio may lend its portfolio securities to brokers, dealers, and otherfinancial institutions provided a number of conditions are satisfied, including that the loan is fully collateralized.
72

The Portfolio may make short sales as part of its overall portfolio management strategies or to offset a potentialdecline in value of a security.
The Portfolio may purchase securities which it is eligible to purchase on a when-issued or delayed delivery basis,and may make contracts to purchase such securities for a fixed price at a future date beyond normal settlement time(forward commitments).
The Portfolio may enter into repurchase agreements.
The Portfolio may enter into reverse repurchase agreements and dollar rolls, subject to a Portfolio’s limitations onborrowings.
The Portfolio may invest in “event-linked bonds,” which are described in the section below on the SP PIMCO TotalReturn Portfolio.
The Portfolio may invest up to 15% of its net assets in illiquid securities.
The Portfolio may invest up to 10% of its assets in securities of other investment companies, such as closed-endmanagement investment companies, or in pooled accounts or other investment vehicles which invest in foreignmarkets. As a shareholder of an investment company, a Portfolio may indirectly bear service and other fees which arein addition to the fees the Portfolio pays its service providers.
For temporary or defensive purposes, the Portfolio may invest without limit in U.S. debt securities, including taxablesecurities and short-term money market securities, when PIMCO deems it appropriate to do so. When the Portfolioengages in such strategies, it may not achieve its investment objective.
The Portfolio is managed by Pacific Investment Management Company LLC (PIMCO).
SP PIMCO Total Return Portfolio
The Portfolio invests primarily in investment grade debt securities. It may also invest up to 10% of its assets in highyield/high risk securities (also known as “junk bonds”) rated B or higher by Moody’s or S&P or, if unrated, determinedby PIMCO to be of comparable quality.
An Investment Grade Bond PortfolioThe Portfolio invests primarily in investment grade debtsecurities, including foreign debt securities, but mayinvest some of its assets in high yield bonds.
The Portfolio may invest up to 20% of its assets insecurities denominated in foreign currencies, and mayinvest beyond this limit in U.S. dollar-denominatedsecurities of foreign issuers. The Portfolio will normallyhedge at least 75% of its exposure to foreign currency toreduce the risk of loss due to fluctuations in currencyexchange rates.
The Portfolio may invest all of its assets in derivative instruments, such as options, futures contracts or swapagreements, or in mortgage- or asset-backed securities. The Portfolio may lend its portfolio securities to brokers,dealers and other financial institutions to earn income. The Portfolio may seek to obtain market exposure to thesecurities in which it primarily invests by entering into a series of purchase and sale contracts or by using otherinvestment techniques (such as buy backs or dollar rolls). The “total return” sought by the Portfolio consists of incomeearned on the Portfolio’s investments, plus capital appreciation, if any, which generally arises from decreases ininterest rates or improving credit fundamentals for a particular sector or security.
In selecting securities for a Portfolio, PIMCO develops an outlook for interest rates, currency exchange rates and theeconomy; analyzes credit and call risks, and uses other security selection techniques. The proportion of a Portfolio’sassets committed to investment in securities with particular characteristics (such as quality, sector, interest rate ormaturity) varies based on PIMCO’s outlook for the U.S. economy and the economies of other countries in the world, thefinancial markets and other factors.
73

PIMCO attempts to identify areas of the bond market that are undervalued relative to the rest of the market. PIMCOidentifies these areas by grouping bonds into the following sectors: money markets, governments, corporates,mortgages, asset-backed and international. Sophisticated proprietary software then assists in evaluating sectors andpricing specific securities. Once investment opportunities are identified, PIMCO will shift assets among sectorsdepending upon changes in relative valuations and credit spreads. There is no guarantee that PIMCO’s securityselection techniques will produce the desired results. While we make every effort to achieve our objective, we can’tguarantee success and it is possible that you could lose money.
The Portfolio may invest in Brady Bonds, which are securities created through the exchange of existing commercialbank loans to sovereign entities for new obligations in connection with a debt restructuring. Investments in Brady Bondsmay be viewed as speculative. Brady Bonds acquired by the Portfolio may be subject to restructuring arrangements orto requests for new credit, which may cause the Portfolio to suffer a loss of interest or principal on any of its holdings.
The Portfolio may invest in inflation-indexed bonds, which are fixed income securities whose principal value isperiodically adjusted according to the rate of inflation. If the index measuring inflation falls, the principal value ofinflation-indexed bonds will be adjusted downward, and consequently the interest payable on these securities(calculated with respect to a smaller principal amount) will be reduced. Repayment of the original bond principal uponmaturity (as adjusted for inflation) is guaranteed in the case of U.S. Treasury inflation-indexed bonds. For bonds that donot provide a similar guarantee, the adjusted principal value of the bond repaid at maturity may be less than the originalprincipal. The value of inflation-indexed bonds is expected to change in response to changes in real interest rates. Realinterest rates are tied to the relationship between nominal interest rates and the rate of inflation. If nominal interestrates increase at a faster rate than inflation, real interest rates may rise, leading to a decrease in value of inflation-indexed bonds. Short-term increases in inflation may lead to a decline in value. Any increase in the principal amount ofan inflation-indexed bond will be considered taxable ordinary income, even though investors do not receive theirprincipal until maturity.
The Portfolio may invest in convertible debt and convertible preferred stock.
The Portfolio may invest in mortgage-related securities or other asset-backed securities.
The Portfolio may also enter into, or acquire participations in, delayed funding loans and revolving credit facilities, inwhich a lender agrees to make loans up to a maximum amount upon demand by the borrower during a specified term.These commitments may have the effect of requiring a Portfolio to increase its investment in a company at a time whenit might not otherwise decide to do so (including at a time when the company’s financial condition makes it unlikely thatsuch amounts will be repaid). To the extent that a Portfolio is committed to advance additional Portfolios, it willsegregate assets determined to be liquid by PIMCO in accordance with procedures established by the Board ofDirectors in an amount sufficient to meet such commitments. Delayed loans and revolving credit facilities are subject tocredit, interest rate and liquidity risk and the risks of being a lender.
For the purpose of achieving income, each Portfolio may lend its portfolio securities to brokers, dealers, and otherfinancial institutions provided a number of conditions are satisfied, including that the loan is fully collateralized.
The Portfolio may make short sales as part of its overall portfolio management strategies or to offset a potentialdecline in value of a security. The Portfolio may use interest rate swaps in the management of the Portfolio.
The Portfolio may purchase securities which it is eligible to purchase on a when-issued or delayed delivery basis,and may make contracts to purchase such securities for a fixed price at a future date beyond normal settlement time(forward commitments).
The Portfolio may enter into repurchase agreements.
The Portfolio may enter into reverse repurchase agreements and dollar rolls.
The Portfolio may invest in “event-linked bonds,” which are fixed income securities for which the return of principal andpayment of interest is contingent on the non-occurrence of a specific “trigger” event, such as a hurricane, earthquake,or other physical or weather-related phenomenon. If a trigger event occurs, a Portfolio may lose a portion or all of its
74

principal invested in the bond. Event-linked bonds often provide for an extension of maturity to process and audit lossclaims where a trigger event has, or possibly has, occurred. An extension of maturity may increase volatility. Event-linked bonds may also expose the Portfolio to certain unanticipated risks including credit risk, adverse regulatory orjurisdictional interpretations, and adverse tax consequences. Event-linked bonds may also be subject to liquidity risk.
The Portfolio may invest up to 15% of its net assets in illiquid securities.
The Portfolio may invest up to 10% of its assets in securities of other investment companies, such as closed-endmanagement investment companies, or in pooled accounts or other investment vehicles which invest in foreignmarkets. As a shareholder of an investment company, the Portfolio may indirectly bear service and other fees whichare in addition to the fees the Portfolio pays its service providers.
For temporary or defensive purposes, the Portfolio may invest without limit in U.S. debt securities, including taxablesecurities and short-term money market securities, when PIMCO deems it appropriate to do so. When the Portfolioengages in such strategies, it may not achieve its investment objective.
The Portfolio is managed by Pacific Investment Management Company LLC (PIMCO).
SP Prudential U.S. Emerging Growth Portfolio
The Portfolio’s investment objective is long-term capital appreciation. This means the Portfolio seeks investmentswhose price will increase over several years. While we make every effort to achieve its objective, we can’t guaranteesuccess and it is possible that you could lose money.
A Small/Medium-Sized Stock PortfolioThe Portfolio invests primarily in the stocks of small andmedium-sized companies with the potential for above-average growth.
In deciding which equities to buy, the Portfolio uses whatis known as a growth investment style. This means thePortfolio invests in companies that it believes couldexperience superior sales or earnings growth. Inpursuing this objective, the Portfolio normally invests atleast 80% of the Portfolio’s investable assets in equitysecurities of small and medium-sized U.S. companieswith the potential for above-average growth.
The Portfolio considers small and medium-sized companies to be those with market capitalizations that are less thanthe largest capitalization of the Standard and Poor’s Mid-Cap 400 Stock Index as of the end of a calendar quarter. Asof December 31, 2001, this number was $10.5 billion. We use the market capitalization measurements used by S&P attime of purchase.
In addition to buying equities, the Portfolio may invest in other equity-related securities. Equity-related securities includeAmerican Depositary Receipts (ADRs); common stocks; nonconvertible preferred stocks; warrants and rights that canbe exercised to obtain stock; investments in various types of business ventures, including partnerships and jointventures; Real Estate Investment Trusts (REITs); and similar securities.
The Portfolio also may buy convertible debt securities and convertible preferred stock. These are securities that thePortfolio can convert into the company’s common stock or some other equity security. The Portfolio will only invest ininvestment-grade convertible securities. Generally, the Portfolio considers selling a security when, in the opinion of theinvestment adviser, the stock has experienced a fundamental disappointment in earnings; it has reached anintermediate-term price objective and its outlook no longer seems sufficiently promising; a relatively more attractivestock emerges; or the stock has experienced adverse price movements.
The Portfolio can invest up to 20% of investable assets in equity securities of companies with larger or smaller marketcapitalizations than previously noted. The Portfolio may participate in the initial public offering (IPO) market. IPOinvestments may increase the Portfolio’s total returns. As the Portfolio’s assets grow, the impact of IPO investments willdecline, which may reduce the Portfolio’s total returns.
75

The Portfolio can invest up to 35% of total assets in foreign securities, including stocks and other equity-relatedsecurities, money market instruments and other investment-grade fixed-income securities of foreign issuers, includingthose in developing countries. For purposes of the 35% limit, the Portfolio does not consider ADRs and other similarreceipts or shares to be foreign securities.
The Portfolio can invest up to 20% of investable assets in investment-grade corporate or government obligations.Investment-grade obligations are rated in one of the top four long-term quality ratings by a major rating service (such asBaa/BBB or better by Moody’s Investors Service, Inc. or Standard & Poor’s Ratings Group, respectively). The Portfolioalso may invest in obligations that are not rated, but which it believes to be of comparable quality. Obligations rated in thefourth category (Baa/BBB) have speculative characteristics. These lower-rated obligations are subject to a greater risk ofloss of principal and interest. Generally, fixed-income securities provide a fixed rate of return, but provide less opportunityfor capital appreciation than investing in stocks. The Portfolio will purchase money market instruments only in one of thetwo highest short-term quality ratings of a major rating service.
In response to adverse market, economic or political conditions, the Portfolio may temporarily invest up to 100% of thePortfolio’s assets in cash or money market instruments. Investing heavily in these securities limits the Portfolio’s abilityto achieve capital appreciation, but can help to preserve its assets when the equity markets are unstable.
The Portfolio may also use repurchase agreements.
The Portfolio may enter into foreign currency forward contracts to protect the value of its portfolio against futurechanges in the level of currency exchange rates. The Portfolio may enter into such contracts on a spot, that is, cash,basis at the rate then prevailing in the currency exchange market or on a forward basis, by entering into a forwardcontract to purchase or sell currency.
The Portfolio may use various derivative strategies to try to improve its returns or protect its assets. The Portfoliocannot guarantee that these strategies will work, that the instruments necessary to implement these strategies will beavailable or that the Portfolio will not lose money.
The Portfolio may invest in securities issued by agencies of the U.S. Government or instrumentalities of the U.S.Government. These obligations, including those which are guaranteed by Federal agencies or instrumentalities, may ormay not be backed by the full faith and credit of the United States. Obligations of the Government National MortgageAssociation (GNMA), the Farmers Home Administration and the Small Business Administration are backed by the fullfaith and credit of the United States. In the case of securities not backed by the full faith and credit of the United States,the Portfolio must look principally to the agency issuing or guaranteeing the obligation for ultimate repayment and maynot be able to assert a claim against the United States if the agency or instrumentality does not meet its commitments.Securities in which the Portfolio may invest which are not backed by the full faith and credit of the United States includeobligations such as those issued by the Federal Home Loan Bank, the Federal Home Loan Mortgage Corporation(FHLMC), the Federal National Mortgage Association, the Student Loan Marketing Association, Resolution FundingCorporation and the Tennessee Valley Authority, each of which has the right to borrow from the U.S. Treasury to meetits obligations, and obligations of the Farm Credit System, the obligations of which may be satisfied only by theindividual credit of the issuing agency. FHLMC investments may include collateralized mortgage obligations.
The Portfolio may invest in mortgage-backed securities, including those which represent undivided ownership interestsin pools of mortgages. The U.S. Government or the issuing agency or instrumentality guarantees the payment ofinterest on and principal of these securities. However, the guarantees do not extend to the yield or value of thesecurities nor do the guarantees extend to the yield or value of the Portfolio’s shares. These securities are in mostcases “pass-through” instruments, through which the holders receive a share of all interest and principal payments fromthe mortgages underlying the securities, net of certain fees.
The Portfolio may purchase and write (that is, sell) put and call options on securities, stock indexes and currencies thatare traded on U.S. or foreign securities exchanges or in the over-the-counter market to seek to enhance return or toprotect against adverse price fluctuations in securities in the Portfolio’s portfolio. These options will be on equitysecurities, financial indexes (for example, S&P 500 Composite Stock Price Index) and foreign currencies. The Portfoliomay write put and call options to generate additional income through the receipt of premiums, purchase put options inan effort to protect the value of securities (or currencies) that it owns against a decline in market value and purchasecall options in an effort to protect against an increase in the price of securities (or currencies) it intends to purchase.
76

The Portfolio may purchase and sell financial futures contracts and options thereon which are traded on acommodities exchange or board of trade to reduce certain risks of its investments and to attempt to enhance return inaccordance with regulations of the Commodity Futures Trading Commission (CFTC).
The Portfolio also follows certain policies when it borrows money (the Portfolio can borrow up to 20% of the value of itstotal assets); lends its securities to others (the Portfolio can lend up to 331⁄3% of the value of its total assets, includingcollateral received in the transaction); and holds illiquid securities (the Portfolio may hold up to 15% of its net assets inilliquid securities, including securities with legal or contractual restrictions on resale, those without a readily availablemarket and repurchase agreements with maturities longer than seven days).
Portfolio Turnover
As a result of the strategies described above, the Portfolio may have an annual portfolio turnover rate of up to 200%.Portfolio turnover is generally the percentage found by dividing the lesser of portfolio purchases or sales by the monthlyaverage value of the portfolio. High portfolio turnover (100% or more) results in higher brokerage commissions andother transaction costs and can affect the Portfolio’s performance.
The Portfolio is managed by Jennison Associates LLC.
SP Small/Mid-Cap Value Portfolio
The investment objective of the SP Small/Mid-Cap Value Portfolio is long-term growth of capital. The Portfolio ismanaged by Fidelity Management & Research Company (FMR). The Portfolio normally invests at least 80% of itsinvestable assets in securities of companies with small to medium market capitalizations.
A Small/Mid-Cap Value PortfolioThe Portfolio normally invests at least 80% of itsinvestable assets in companies with small to mediummarket capitalizations.
The Portfolio normally invests its assets primarily incommon stocks. Although universal definitions of smalland medium market capitalization does not exist, FMRgenerally defines small and medium marketcapitalization companies as those whose marketcapitalizations is similar to the market capitalization ofcompanies in the S&P Small Cap 600 or the Russell2000, and the S&P MidCap 400 or the Russell Midcap,respectively. A company’s market capitalization is basedon its current market capitalization or its marketcapitalization at the time of the Portfolio’s investment.Companies whose capitalization is above this level afterpurchase continue to have a small or medium marketcapitalization for purposes of the 80% policy. The size ofcompanies in each index changes with marketconditions, and the composition of each index. FMR mayalso invest the Portfolio’s assets in companies withlarger market capitalizations.
FMR invests the Portfolio’s assets in companies that it believes are undervalued in the marketplace in relation tofactors such as the company’s assets, earnings, or growth potential, or cash flow, or in relation to securities of othercompanies in the same industry. Companies with these characteristics tend to have lower than average price/earnings(P/E) or price/book (P/B) ratios. The stocks of these companies are often called “value” stocks.
FMR may invest the Portfolio’s assets in securities of foreign issuers in addition to securities of domestic issuers.
FMR relies on fundamental analysis of each issuer and its potential for success in light of its current financial condition,its industry position, and economic and market factors. Factors considered include growth potential, earnings estimatesand management. These securities may then be analyzed using statistical models to further evaluate growth potential,valuation, liquidity and investment risk. In buying and selling securities for the Portfolio, FMR invests for the long termand selects those securities it believes offer strong opportunities for the long-term growth of capital and are attractivelyvalued.
77

The Portfolio invests primarily in equity securities, which represent an ownership interest, or the right to acquire anownership interest, in an issuer. Different types of equity securities provide different voting and dividend rights andpriority in the event of the bankruptcy of the issuer. Equity securities include common stocks, preferred stocks,convertible securities, and warrants.
FMR may use various techniques, such as buying and selling futures contracts and exchange traded funds, to increaseor decrease the Portfolio’s exposure to changing security prices or other factors that affect security values. ThePortfolio may invest in equity and/or debt securities issued by Real Estate Investment Trusts (REITs). If FMR’sstrategies do not work as intended, the Portfolio may not achieve its objective. While we make every effort to achieveour objective, we can’t guarantee success and it is possible that you could lose money.
Many factors affect the Portfolio’s performance. The Portfolio’s share price changes daily based on changes in marketconditions and interest rates and in response to other economic, political, or financial developments. The Portfolio’sreaction to these developments will be affected by the types of securities in which the Portfolio invests, the financialcondition, industry and economic sector, and geographic location of an issuer, and the Portfolio’s level of investment inthe securities of that issuer. When you sell units corresponding to shares of the Portfolio, they could be worth more orless than what you paid for them.
In addition to company risk, derivatives risk, foreign investment risk, leveraging risk, liquidity risk, management risk,and market risk, the following factors can significantly affect the Portfolio’s performance:
The value of securities of smaller, less well-known issuers can be more volatile than that of larger issuers and can reactdifferently to issuer, political, market and economic developments than the market as a whole and other types ofstocks. Smaller issuers can have more limited product lines, markets and financial resources.
“Value” stocks can react differently to issuer, political, market and economic developments than the market as a wholeand other types of stocks. “Value” stocks tend to be inexpensive relative to their earnings or assets compared to othertypes of stocks. However, “value” stocks can continue to be inexpensive for long periods of time and may not everrealize their full value.
In response to market, economic, political or other conditions, FMR may temporarily use a different investment strategyfor defensive purposes. If FMR does so, different factors could affect the Portfolio’s performance and the Portfolio maynot achieve its investment objective.
SP Strategic Partners Focused Growth Portfolio
In pursuing its objective of long-term growth of capital, the Portfolio normally invests at least 65% of its total assets inequity-related securities of U.S. companies that are believed to have strong capital appreciation potential. While wemake every effort to achieve our objective, we can’t guarantee success and it is possible that you could lose money.
A Growth Stock PortfolioThe Portfolio normally invests at least 65% of its totalassets in the equity-related securities of U.S. companiesthat are believed to have strong capital appreciationpotential. The Portfolio is managed according to agrowth investment style.
The Portfolio’s strategy is to combine the efforts of twoinvestment advisers and to invest in the favorite stockselection ideas of three portfolio managers (two of whominvest as a team). Each investment adviser to thePortfolio utilizes a growth style to select approximately20 securities. The portfolio managers build a portfoliowith stocks in which they have the highest confidenceand may invest more than 5% of the Portfolio’s assets inany one issuer.
The Portfolio may actively and frequently trade its portfolio securities. The Portfolio is a non-diversified mutual fundportfolio. This means that the Portfolio may invest in a relatively high percentage of net assets in a small number ofissuers. Investing in a nondiversified mutual fund, particularly a fund investing in approximately 40 equity-relatedsecurities, involves greater risk than investing in a diversified fund because a loss resulting from the decline in the valueof one security may represent a greater portion of the total assets of a nondiversified fund.
78
The primary equity-related securities in which the Portfolio invests are common stocks. Generally, each investmentadviser will consider selling or reducing a stock position when, in their opinion, the stock has experienced afundamental disappointment in earnings; it has reached an intermediate-term price objective and its outlook no longerseems sufficiently promising; a relatively more attractive stock emerges; or the stock has experienced adverse pricemovement. A price decline of a stock does not necessarily mean that an investment adviser will sell the stock at thattime. During market declines, either investment adviser may add to positions in favored stocks, which can result in asomewhat more aggressive strategy, with a gradual reduction of the number of companies in which the adviser invests.Conversely, in rising markets, either investment adviser may reduce or eliminate fully valued positions, which can resultin a more conservative investment strategy, with a gradual increase in the number of companies represented in theadviser’s portfolio segment.
In deciding which stocks to buy, each investment adviser uses what is known as a growth investment style. This meansthat each adviser will invest in stocks they believe could experience superior sales or earnings growth.
In addition to common stocks in which the Portfolio primarily invests, equity-related securities include nonconvertiblepreferred stocks; convertible debt and convertible preferred stock; American Depository Receipts (ADRs); warrantsand rights that can be exercised to obtain stock; investments in various types of business ventures, includingpartnerships and joint ventures; Real Estate Investment Trusts (REITs); and similar securities.
The Portfolio may buy common stocks of companies of every size — small-, medium- and large-capitalization —although its investments are mostly in medium- and large-capitalization stocks. The Portfolio intends to be fullyinvested, holding less than 5% of its total assets in cash under normal market conditions.
Under normal conditions, there will be an approximately equal division of the Portfolio’s assets between the twoinvestment advisers. All daily cash inflows (that is, purchases and reinvested distributions) and outflows (that is,redemptions and expense items) will usually be divided between the two investment advisers as the portfolio managerdeems appropriate. There will be a periodic rebalancing of each segment’s assets to take account of marketfluctuations in order to maintain the approximately equal allocation. As a consequence, the manager may allocateassets from the portfolio segment that has appreciated more to the other.
Alliance Capital Management’s portfolio manager, Alfred Harrison, utilizes the fundamental analysis and research ofAlliance’s large internal research staff. In selecting stocks for the Portfolio, he emphasizes stock selection andinvestment in a limited number of companies that have strong management, superior industry positions, excellentbalance sheets and the ability to demonstrate superior earnings growth.
Jennison Associates’ portfolio managers, Spiros Segalas and Kathleen McCarragher, invest in mid-size and largecompanies experiencing some or all of the following: high sales growth, high unit growth, high or improving returns onassets and equity and a strong balance sheet. These companies generally trade at high prices relative to their currentearnings.
Reallocations may result in additional costs since sales of securities may result in higher portfolio turnover. Also,because each investment adviser selects portfolio securities independently, it is possible that a security held by oneportfolio segment may also be held by the other portfolio segment of the Portfolio or that the two advisers maysimultaneously favor the same industry. Prudential Investments LLC will monitor the overall portfolio to ensure that anysuch overlaps do not create an unintended industry concentration. In addition, if one investment adviser buys a securityas the other adviser sells it, the net position of the Portfolio in the security may be approximately the same as it wouldhave been with a single portfolio and no such sale and purchase, but the Portfolio will have incurred additional costs.The portfolio manager will consider these costs in determining the allocation of assets. The portfolio manager willconsider the timing of reallocation based upon the best interests of the Portfolio and its shareholders. To maintain thePortfolio’s federal income tax status as a regulated investment company, Jennison Associates also may have to sellsecurities on a periodic basis.
The Portfolio may invest up to 20% of its total assets in foreign securities, including stocks and other equity-relatedsecurities, money market instruments and other fixed-income securities of foreign issuers. The Portfolio does notconsider ADRs and other similar receipts or shares to be foreign securities.
79
The Portfolio may temporarily hold cash or invest in high-quality foreign or domestic money market instruments pendinginvestment of proceeds from new sales of Portfolio shares or to meet ordinary daily cash needs subject to the policy ofnormally investing at least 65% of the Portfolio’s assets in equity-related securities. In response to adverse market,economic, political or other conditions, the Portfolio may temporarily invest up to 100% of its assets in money marketinstruments. Investing heavily in these securities limits the ability to achieve the investment objective, but can help topreserve the Portfolio’s assets when the equity markets are unstable.
The Portfolio may use repurchase agreements.
The Portfolio may purchase and write (that is, sell) put and call options on securities indexes that are traded on U.S. orforeign securities exchanges or in the over-the-counter market to try to enhance return or to hedge the Portfolio’sportfolio. The Portfolio may write covered put and call options to generate additional income through the receipt ofpremiums, purchase put options in an effort to protect the value of a security that it owns against a decline in marketvalue and purchase call options in an effort to protect against an increase in the price of securities it intends topurchase. The Portfolio also may purchase put and call options to offset previously written put and call options of thesame series. The Portfolio will write only “covered” options. The Portfolio may purchase and sell stock index futurescontracts and related options on stock index futures. The Portfolio may purchase and sell futures contracts on foreigncurrencies and related options on foreign currency futures contracts.
The Portfolio may invest in securities issued or guaranteed by the U.S. Treasury or by an agency or instrumentality ofthe U.S. government. Not all U.S. government securities are backed by the full faith and credit of the United States.Some are supported only by the credit of the issuing agency.
The Portfolio will also use futures contracts and options on futures contracts for certain bona fide hedging, returnenhancement and risk management purposes. The Portfolio may purchase put and call options and write (that is, sell)“covered” put and call options on futures contracts that are traded on U.S. and foreign exchanges.
The Portfolio may use short sales.
The Portfolio may use various derivatives to try to improve the Portfolio’s returns. The Portfolio may use hedgingtechniques to try to protect the Portfolio’s assets. We cannot guarantee that these strategies will work, that theinstruments necessary to implement these strategies will be available, or that the Portfolio will not lose money.
The Portfolio also follows certain policies when it borrows money (the Portfolio can borrow up to 331⁄3% of the value ofits total assets); lends its securities to others for cash management purposes (the Portfolio can lend up to 331⁄3% of thevalue of its total assets including collateral received in the transaction); and holds illiquid securities (the Portfolio mayhold up to 15% of its net assets in illiquid securities, including securities with legal or contractual restrictions on resale,those without a readily available market and repurchase agreements with maturities longer than seven days). ThePortfolio is subject to certain investment restrictions that are fundamental policies, which means they cannot bechanged without shareholder approval. For more information about these restrictions, see the SAI.
It is not a principal strategy of the Portfolio to actively and frequently trade its portfolio securities to achieve itsinvestment objective. Nevertheless, the Portfolio may have an annual portfolio turnover rate of up to 200%. Portfolioturnover is generally the percentage found by dividing the lesser of portfolio purchases and sales by the monthlyaverage value of the portfolio. High portfolio turnover (100% or more) results in higher brokerage commissions andother costs and can affect the Portfolio’s performance.
The Portfolio is managed by Jennison Associates LLC and Alliance Capital Management, L.P.
* * *
The Statement of Additional Information — which we refer to as the SAI — contains additional information about thePortfolios. To obtain a copy, see the back cover page of this prospectus.
* * *
80

OTHER INVESTMENTS AND STRATEGIES
As indicated in the description of the Portfolios above, we may use the following investment strategies to increase aPortfolio’s return or protect its assets if market conditions warrant.
ADRs are certificates representing the right to receive foreign securities that have been deposited with a U.S. bank or aforeign branch of a U.S. bank.
Convertible Debt and Convertible Preferred Stock—A convertible security is a security — for example, a bond orpreferred stock — that may be converted into common stock of the same or different issuer. The convertible securitysets the price, quantity of shares and time period in which it may be so converted. Convertible stock is senior to acompany’s common stock but is usually subordinated to debt obligations of the company. Convertible securities providea steady stream of income which is generally at a higher rate than the income on the company’s common stock butlower than the rate on the company’s debt obligations. At the same time, they offer — through their conversionmechanism — the chance to participate in the capital appreciation of the underlying common stock. The price of aconvertible security tends to increase and decrease with the market value of the underlying common stock.
Derivatives—A derivative is an investment instrument that derives its price, performance, value, or cash flow fromone or more underlying securities or other interests. Derivatives involve costs and can be volatile. With derivatives, theinvestment adviser tries to predict whether the underlying investment — a security, market index, currency, interest rateor some other benchmark — will go up or down at some future date. We may use derivatives to try to reduce risk or toincrease return consistent with a Portfolio’s overall investment objective. The investment adviser will consider otherfactors (such as cost) in deciding whether to employ any particular strategy, or use any particular instrument. Anyderivatives we use may not fully offset a Portfolio’s underlying positions and this could result in losses to the Portfoliothat would not otherwise have occurred.
Dollar Rolls—Dollar rolls involve the sale by the Portfolio of a security for delivery in the current month with a promiseto repurchase from the buyer a substantially similar — but not necessarily the same — security at a set price and datein the future. During the “roll period,” the Portfolio does not receive any principal or interest on the security. Instead, it iscompensated by the difference between the current sales price and the price of the future purchase, as well as anyinterest earned on the cash proceeds from the original sale.
Equity Swaps— In an equity swap, the Portfolio and another party agree to exchange cash flow payments that arebased on the performance of equities or an equity index.
Forward Foreign Currency Exchange Contracts—A foreign currency forward contract is an obligation to buy or sella given currency on a future date at a set price. When a Portfolio enters into a contract for the purchase or sale of asecurity denominated in a foreign currency, or when a Portfolio anticipates the receipt in a foreign currency of dividendsor interest payments on a security which it holds, the Portfolio may desire to “lock-in” the U.S. dollar price of thesecurity or the U.S. dollar equivalent of such dividend or interest payment, as the case may be. By entering into aforward contract for a fixed amount of dollars, for the purchase or sale of the amount of foreign currency involved in theunderlying transactions, the Portfolio will be able to protect itself against a possible loss resulting from an adversechange in the relationship between the U.S. dollar and the foreign currency during the period between the date onwhich the security is purchased or sold, or on which the dividend or interest payment is declared, and the date on whichsuch payments are made or received. At the maturity of a forward contract, a Portfolio may either sell the security andmake delivery of the foreign currency or it may retain the security and terminate its contractual obligation to deliver theforeign currency by purchasing an “offsetting” contract with the same currency trader obligating it to purchase, on thesame maturity date, the same amount of the foreign currency.
Futures Contracts— A futures contract is an agreement to buy or sell a set quantity of an underlying product at afuture date, or to make or receive a cash payment based on the value of a securities index. When a futures contract isentered into, each party deposits with a futures commission merchant (or in a segregated account) approximately 5% ofthe contract amount. This is known as the “initial margin.” Every day during the futures contract, either the buyer or thefutures commission merchant will make payments of “variation margin.” In other words, if the value of the underlyingsecurity, index or interest rate increases, then the buyer will have to add to the margin account so that the account
81

balance equals approximately 5% of the value of the contract on that day. The next day, the value of the underlyingsecurity, index or interest rate may decrease, in which case the borrower would receive money from the account equal tothe amount by which the account balance exceeds 5% of the value of the contract on that day. A stock index futurescontract is an agreement between the buyer and the seller of the contract to transfer an amount of cash equal to thedaily variation margin of the contract. No physical delivery of the underlying stocks in the index is made.
Interest Rate Swaps— In an interest rate swap, the Portfolio and another party agree to exchange interest payments.For example, the Portfolio may wish to exchange a floating rate of interest for a fixed rate. We would enter into thattype of a swap if we think interest rates are going down.
Joint Repurchase Account— In a joint repurchase transaction, uninvested cash balances of various Portfolios areadded together and invested in one or more repurchase agreements. Each of the participating Portfolios receives aportion of the income earned in the joint account based on the percentage of its investment.
Loans and Assignments— Loans are privately negotiated between a corporate borrower and one or more financialinstitutions. The Portfolio acquires interests in loans directly (by way of assignment from the selling institution) orindirectly (by way of the purchase of a participation interest from the selling institution. Purchasers of loans dependprimarily upon the creditworthiness of the borrower for payment of interest and repayment of principal. If scheduledinterest or principal payments are not made, the value of the instrument may be adversely affected. Interests in loansare also subject to additional liquidity risks. Loans are not generally traded in organized exchange markets but aretraded by banks and other institutional investors engaged in loan syndications. Consequently, the liquidity of a loan willdepend on the liquidity of these trading markets at the time that the Portfolio sells the loan.
In assignments, the Portfolio will have no recourse against the selling institution, and the selling institution generallymakes no representations about the underlying loan, the borrowers, the documentation or the collateral. In addition, therights against the borrower that are acquired by the Portfolio may be more limited than those held by the assigninglender.
Mortgage-related Securities are usually pass-through instruments that pay investors a share of all interest andprincipal payments from an underlying pool of fixed or adjustable rate mortgages. We may invest in mortgage-relatedsecurities issued and guaranteed by the U.S. government or its agencies like the Federal National MortgageAssociation (Fannie Maes) and the Government National Mortgage Association (Ginnie Maes) and debt securitiesissued (but not guaranteed) by the Federal Home Loan Mortgage Company (Freddie Macs). Private mortgage-relatedsecurities that are not guaranteed by U.S. governmental entities generally have one or more types of creditenhancement to ensure timely receipt of payments and to protect against default.
Mortgage-related securities include collateralized mortgage obligations, multi-class pass through securities andstripped mortgage-backed securities. A collateralized mortgage-backed obligation (CMO) is a security backed by anunderlying portfolio of mortgages or mortgage-backed securities that may be issued or guaranteed by entities such asbanks, U.S. governmental entities or broker-dealers. A multi-class pass-through security is an equity interest in a trustcomposed of underlying mortgage assets. Payments of principal and interest on the mortgage assets and anyreinvestment income provide the money to pay debt service on the CMO or to make scheduled distributions on themulti-class pass-through security. A stripped mortgage-backed security (MBS strip) may be issued by U.S.governmental entities or by private institutions. MBS strips take the pieces of a debt security (principal and interest) andbreak them apart. The resulting securities may be sold separately and may perform differently. MBS strips are highlysensitive to changes in prepayment and interest rates.
Options—A call option on stock is a short-term contract that gives the option purchaser or “holder” the right to acquirea particular equity security for a specified price at any time during a specified period. For this right, the option purchaserpays the option seller a certain amount of money or “premium” which is set before the option contract is entered into.The seller or “writer” of the option is obligated to deliver the particular security if the option purchaser exercises theoption. A put option on stock is a similar contract. In a put option, the option purchaser has the right to sell a particularsecurity to the option seller for a specified price at any time during a specified period. In exchange for this right, theoption purchaser pays the option seller a premium. Options on debt securities are similar to stock options except thatthe option holder has the right to acquire or sell a debt security rather than an equity security. Options on stock indexes
82

are similar to options on stocks, except that instead of giving the option holder the right to receive or sell a stock, itgives the holder the right to receive an amount of cash if the closing level of the stock index is greater than (in the caseof a call) or less than (in the case of a put) the exercise price of the option. The amount of cash the holder will receiveis determined by multiplying the difference between the index’s closing price and the option’s exercise price, expressedin dollars, by a specified “multiplier”. Unlike stock options, stock index options are always settled in cash, and gain orloss depends on price movements in the stock market generally (or a particular market segment, depending on theindex) rather than the price movement of an individual stock.
Real Estate Investment Trusts (REITs)—A REIT is a company that manages a portfolio of real estate to earn profitsfor its shareholders. Some REITs acquire equity interests in real estate and then receive income from rents and capitalgains when the buildings are sold. Other REITs lend money to real estate developers and receive interest income fromthe mortgages. Some REITs invest in both types of interests.
Repurchase Agreements— In a repurchase transaction, the Portfolio agrees to purchase certain securities and theseller agrees to repurchase the same securities at an agreed upon price on a specified date. This creates a fixed returnfor the Portfolio.
Reverse Repurchase Agreements— In a reverse repurchase transaction, the Portfolio sells a security it owns andagrees to buy it back at a set price and date. During the period the security is held by the other party, the Portfolio maycontinue to receive principal and interest payments on the security.
Short Sales— In a short sale, we sell a security we do not own to take advantage of an anticipated decline in thestock’s price. The Portfolio borrows the stock for delivery and if it can buy the stock later at a lower price, a profitresults.
Short Sales Against-the-Box—A short sale against-the-box means the Portfolio owns securities identical to thosesold short.
When-Issued and Delayed Delivery Securities—With when-issued or delayed delivery securities, the delivery andpayment can take place a month or more after the date of the transaction. A Portfolio will make commitments for when-98 issued transactions only with the intention of actually acquiring the securities. A Portfolio’s custodian will maintain ina segregated account, liquid assets having a value equal to or greater than such commitments. If the Portfolio choosesto dispose of the right to acquire a when-issued security prior to its acquisition, it could, as with the disposition of anyother security, incur a gain or loss.
* * *
Except for the Money Market Portfolio, each Portfolio also follows certain policies when it borrows money (eachPortfolio may borrow up to 5% of the value of its total assets, except that SP Large Cap Value Portfolio and SP Small/Mid-Cap Value Portfolio may each borrow up to 331⁄3% of their total assets); lends its securities; and holds illiquidsecurities (a Portfolio may hold up to 15% of its net assets in illiquid securities, including securities with legal orcontractual restrictions on resale, those without a readily available market and repurchase agreements with maturitieslonger than seven days). If the Portfolio were to exceed this limit, the investment adviser would take prompt action toreduce a Portfolio’s holdings in illiquid securities to no more than 15% of its net assets, as required by applicable law. APortfolio is subject to certain investment restrictions that are fundamental policies, which means they cannot bechanged without shareholder approval. For more information about these restrictions, see the SAI.
The Money Market Portfolio also follows certain policies when it borrows money (the Portfolio may borrow up to 5% ofthe value of its total assets) and holds illiquid securities (the Portfolio may hold up to 10% of its net assets in illiquidsecurities, including securities with legal or contractual restrictions on resale, those without a readily available marketand repurchase agreements with maturities longer than seven days). If the Portfolio were to exceed this limit, theinvestment adviser would take prompt action to reduce the Portfolio’s holdings in illiquid securities to no more than 10%of its net assets, as required by applicable law. The Portfolio is subject to certain investment restrictions that arefundamental policies, which means they cannot be changed without shareholder approval. For more information aboutthese restrictions, see the SAI.
83

We will consider other factors (such as cost) in deciding whether to employ any particular strategy or use any particularinstrument. For more information about these strategies, see the SAI, “Investment Objectives and Policies of thePortfolios.”
HOW THE FUND IS MANAGED
Board Of Directors
The Board of Directors oversees the actions of the Investment Adviser, the sub-advisers and the Distributor anddecides on general policies. The Board also oversees the Fund’s officers who conduct and supervise the daily businessoperations of the Fund.
Investment Adviser
Prudential Investments LLC (“PI”), a wholly-owned subsidiary of Prudential Financial, Inc., serves as the overallinvestment adviser for the Fund. PI is located at Gateway Center Three, 100 Mulberry Street, Newark, New Jersey07102-4077. PI and its predecessors have served as manager and administrator to investment companies since 1987.As of December 31, 2001, PI served as the investment manager to all of the Prudential U.S. and offshore investmentcompanies, and as manager or administrator to closed-end investment companies, with aggregate assets ofapproximately $100.8 billion.
The Fund uses a “manager-of-managers” structure. Under this structure, PI is authorized to select (with approval of theFund’s independent directors) one or more sub-advisers to handle the actual day-to-day investment management ofeach Portfolio. PI monitors each sub-adviser’s performance through quantitative and qualitative analysis, andperiodically reports to the Fund’s board of directors as to whether each sub-adviser’s agreement should be renewed,terminated or modified. PI also is responsible for allocating assets among the sub-advisers if a Portfolio has more thanone sub-adviser. In those circumstances, the allocation for each sub-adviser can range from 0% to 100% of aPortfolio’s assets, and PI can change the allocations without board or shareholder approval. The Fund will notifyshareholders of any new sub-adviser or any material changes to any existing sub-advisory agreement.
84
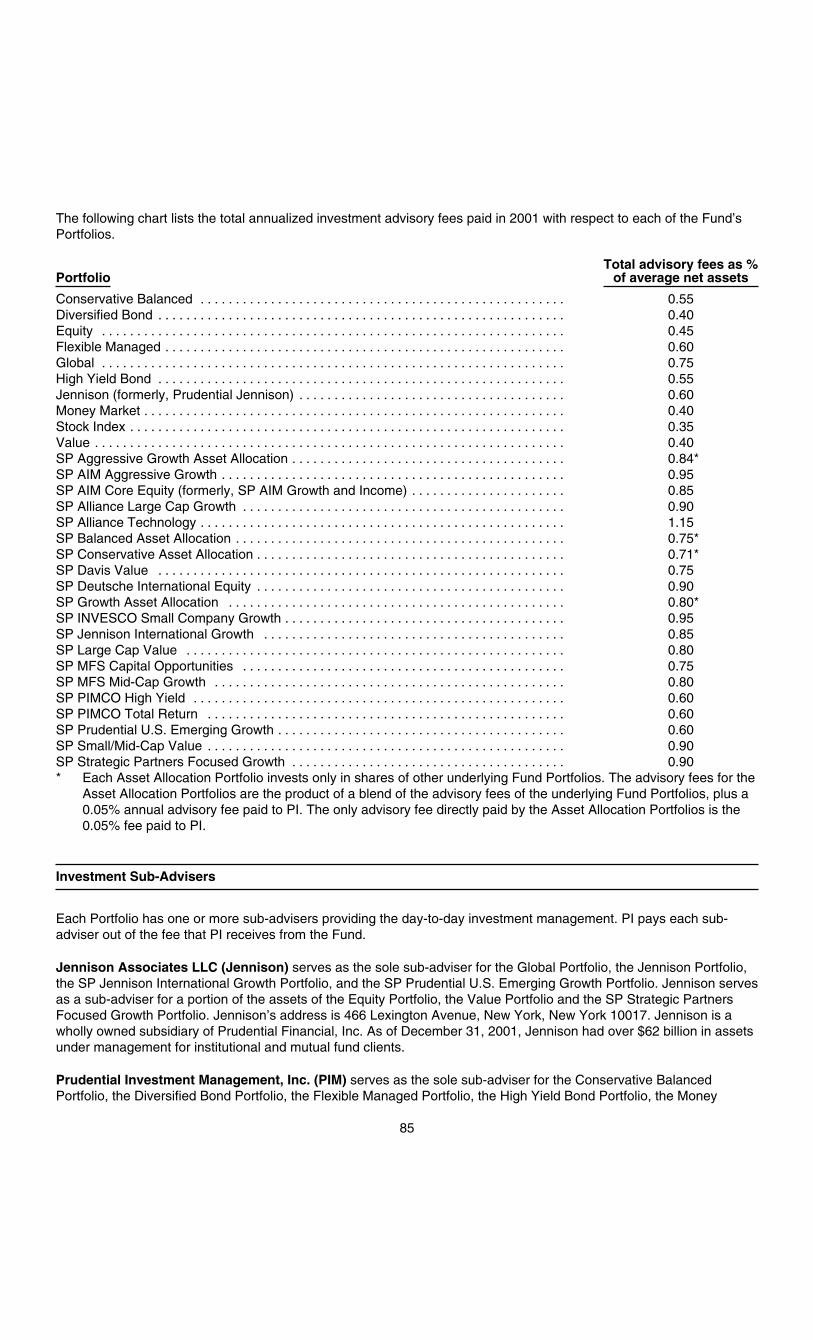
The following chart lists the total annualized investment advisory fees paid in 2001 with respect to each of the Fund’sPortfolios.
PortfolioTotal advisory fees as %of average net assets
Conservative Balanced . . . . . . . . . . . . . . . . . . . . . . . . . . . . . . . . . . . . . . . . . . . . . . . . . . . . 0.55Diversified Bond . . . . . . . . . . . . . . . . . . . . . . . . . . . . . . . . . . . . . . . . . . . . . . . . . . . . . . . . . . 0.40Equity . . . . . . . . . . . . . . . . . . . . . . . . . . . . . . . . . . . . . . . . . . . . . . . . . . . . . . . . . . . . . . . . . . 0.45Flexible Managed . . . . . . . . . . . . . . . . . . . . . . . . . . . . . . . . . . . . . . . . . . . . . . . . . . . . . . . . . 0.60Global . . . . . . . . . . . . . . . . . . . . . . . . . . . . . . . . . . . . . . . . . . . . . . . . . . . . . . . . . . . . . . . . . . 0.75High Yield Bond . . . . . . . . . . . . . . . . . . . . . . . . . . . . . . . . . . . . . . . . . . . . . . . . . . . . . . . . . . 0.55Jennison (formerly, Prudential Jennison) . . . . . . . . . . . . . . . . . . . . . . . . . . . . . . . . . . . . . . 0.60Money Market . . . . . . . . . . . . . . . . . . . . . . . . . . . . . . . . . . . . . . . . . . . . . . . . . . . . . . . . . . . . 0.40Stock Index . . . . . . . . . . . . . . . . . . . . . . . . . . . . . . . . . . . . . . . . . . . . . . . . . . . . . . . . . . . . . . 0.35Value . . . . . . . . . . . . . . . . . . . . . . . . . . . . . . . . . . . . . . . . . . . . . . . . . . . . . . . . . . . . . . . . . . . 0.40SP Aggressive Growth Asset Allocation . . . . . . . . . . . . . . . . . . . . . . . . . . . . . . . . . . . . . . . 0.84*SP AIM Aggressive Growth . . . . . . . . . . . . . . . . . . . . . . . . . . . . . . . . . . . . . . . . . . . . . . . . . 0.95SP AIM Core Equity (formerly, SP AIM Growth and Income) . . . . . . . . . . . . . . . . . . . . . . 0.85SP Alliance Large Cap Growth . . . . . . . . . . . . . . . . . . . . . . . . . . . . . . . . . . . . . . . . . . . . . . 0.90SP Alliance Technology . . . . . . . . . . . . . . . . . . . . . . . . . . . . . . . . . . . . . . . . . . . . . . . . . . . . 1.15SP Balanced Asset Allocation . . . . . . . . . . . . . . . . . . . . . . . . . . . . . . . . . . . . . . . . . . . . . . . 0.75*SP Conservative Asset Allocation . . . . . . . . . . . . . . . . . . . . . . . . . . . . . . . . . . . . . . . . . . . . 0.71*SP Davis Value . . . . . . . . . . . . . . . . . . . . . . . . . . . . . . . . . . . . . . . . . . . . . . . . . . . . . . . . . . 0.75SP Deutsche International Equity . . . . . . . . . . . . . . . . . . . . . . . . . . . . . . . . . . . . . . . . . . . . 0.90SP Growth Asset Allocation . . . . . . . . . . . . . . . . . . . . . . . . . . . . . . . . . . . . . . . . . . . . . . . . 0.80*SP INVESCO Small Company Growth . . . . . . . . . . . . . . . . . . . . . . . . . . . . . . . . . . . . . . . . 0.95SP Jennison International Growth . . . . . . . . . . . . . . . . . . . . . . . . . . . . . . . . . . . . . . . . . . . 0.85SP Large Cap Value . . . . . . . . . . . . . . . . . . . . . . . . . . . . . . . . . . . . . . . . . . . . . . . . . . . . . . 0.80SP MFS Capital Opportunities . . . . . . . . . . . . . . . . . . . . . . . . . . . . . . . . . . . . . . . . . . . . . . 0.75SP MFS Mid-Cap Growth . . . . . . . . . . . . . . . . . . . . . . . . . . . . . . . . . . . . . . . . . . . . . . . . . . 0.80SP PIMCO High Yield . . . . . . . . . . . . . . . . . . . . . . . . . . . . . . . . . . . . . . . . . . . . . . . . . . . . . 0.60SP PIMCO Total Return . . . . . . . . . . . . . . . . . . . . . . . . . . . . . . . . . . . . . . . . . . . . . . . . . . . 0.60SP Prudential U.S. Emerging Growth . . . . . . . . . . . . . . . . . . . . . . . . . . . . . . . . . . . . . . . . . 0.60SP Small/Mid-Cap Value . . . . . . . . . . . . . . . . . . . . . . . . . . . . . . . . . . . . . . . . . . . . . . . . . . . 0.90SP Strategic Partners Focused Growth . . . . . . . . . . . . . . . . . . . . . . . . . . . . . . . . . . . . . . . 0.90* Each Asset Allocation Portfolio invests only in shares of other underlying Fund Portfolios. The advisory fees for the
Asset Allocation Portfolios are the product of a blend of the advisory fees of the underlying Fund Portfolios, plus a0.05% annual advisory fee paid to PI. The only advisory fee directly paid by the Asset Allocation Portfolios is the0.05% fee paid to PI.
Investment Sub-Advisers
Each Portfolio has one or more sub-advisers providing the day-to-day investment management. PI pays each sub-adviser out of the fee that PI receives from the Fund.
Jennison Associates LLC (Jennison) serves as the sole sub-adviser for the Global Portfolio, the Jennison Portfolio,the SP Jennison International Growth Portfolio, and the SP Prudential U.S. Emerging Growth Portfolio. Jennison servesas a sub-adviser for a portion of the assets of the Equity Portfolio, the Value Portfolio and the SP Strategic PartnersFocused Growth Portfolio. Jennison’s address is 466 Lexington Avenue, New York, New York 10017. Jennison is awholly owned subsidiary of Prudential Financial, Inc. As of December 31, 2001, Jennison had over $62 billion in assetsunder management for institutional and mutual fund clients.
Prudential Investment Management, Inc. (PIM) serves as the sole sub-adviser for the Conservative BalancedPortfolio, the Diversified Bond Portfolio, the Flexible Managed Portfolio, the High Yield Bond Portfolio, the Money
85

Market Portfolio, and the Stock Index Portfolio. PIM is a wholly owned subsidiary of Prudential Financial, Inc. PIM’saddress is Gateway Center Two, 100 Mulberry Street, Newark, New Jersey 07102.
A I M Capital Management, Inc. (A I M Capital) serves as sub-adviser to the SP AIM Aggressive Growth Portfolio andthe SP AIM Core Equity Portfolio. The firm is located at 11 Greenway Plaza, Suite 100, Houston, Texas 77046-1173.The sub-adviser provides investment advisory services to each Portfolio by obtaining and evaluating economic,statistical and financial information and formulating and implementing investment programs. A I M Capital, together withits affiliates, advises or manages approximately 150 investment portfolios as of December 31, 2001, encompassing abroad range of investment objectives. A I M Capital uses a team approach to investment management. As ofDecember 31, 2001, A I M and its affiliates managed approximately $158 billion in assets.
Alliance Capital Management, L.P. (Alliance) serves as the sub-adviser to the SP Alliance Technology Portfolio, SPAlliance Large Cap Growth Portfolio and a portion of the SP Strategic Partners Focused Growth Portfolio. The sub-adviser is located at 1345 Avenue of the Americas, New York, New York 10105. Alliance is a leading internationalinvestment manager. Alliance’s clients are primarily major corporate employee benefit funds, public employeeretirement systems, investment companies, foundations and endowment funds. As of December 31, 2001, Alliancemanaged $455 billion in assets.
Davis Selected Advisers, L.P. (Davis) serves as the sub-adviser to the SP Davis Value Portfolio. Davis is located at2429 East Elvira Road, Suite 101, Tucson, Arizona 85706. As of December 31, 2001, Davis managed approximately$41.8 billion in assets.
Deutsche Asset Management, Inc. (DAMI) serves as a sub-adviser to the SP Deutsche International Equity Portfolioand as subadviser for approximately 25% of the assets of the Value Portfolio. DAMI is a wholly-owned subsidiary ofDeutsche Bank AG. As of December 31, 2001 DAMI’s total assets under management exceeded $96.1 billion. DAMI’saddress is 280 Park Avenue, New York, New York 10017.
Fidelity Management & Research Company (FMR) is the sub-adviser to the SP Large Cap Value Portfolio and theSP Small/Mid-Cap Value Portfolio. As of December 31, 2001, FMR and its wholly-owned subsidiaries hadapproximately $912 billion in assets under management. The address of FMR is 82 Devonshire Street, Boston,Massachusetts 02109.
GE Asset Management, Incorporated (GEAM) serves as a sub-adviser to approximately 25% of the Equity Portfolio.GEAM’s ultimate parent is General Electric Company. Its address is 3003 Summer Street, Stamford, Connecticut06904. As of December 31, 2001, GEAM oversees in excess of $112.2 billion under management.
INVESCO Funds Group, Inc. (INVESCO), located at 4350 South Monaco Street, Denver, Colorado 80237, is the sub-adviser of the SP INVESCO Small Company Growth Portfolio. INVESCO was founded in 1932 and as of December 31,2001, managed almost $35 billion in assets. INVESCO is a subsidiary of AMVESCAP PLC, an international investmentmanagement company based in London, with money managers in Europe, North and South America and the Far East.
Massachusetts Financial Services Company (MFS), located at 500 Boylston Street, Boston, Massachusetts, acts asthe sub-adviser for the SP MFS Capital Opportunities Portfolio and the SP MFS Mid-Cap Growth Portfolio. MFS and itspredecessor organizations have a history of money management dating from 1924. MFS is an indirect wholly-ownedsubsidiary of Sun Life Assurance Company of Canada. As of November 30, 2001, MFS managed over $135.3 billion inassets.
Pacific Investment Management Company LLC (PIMCO) acts as the sole sub-adviser for the SP PIMCO TotalReturn Portfolio and the SP PIMCO High Yield Portfolio. PIMCO is located at 840 Newport Center Drive, NewportBeach, California 92660 and is a subsidiary of Allianz Dresdner Asset Management of America L.P., formerly PIMCOAdvisors L.P. As of December 31, 2001, PIMCO managed over $241 billion in assets.
Salomon Brothers Asset Management Inc. (Salomon) serves as sub-adviser for a portion of the assets of the EquityPortfolio. Salomon is part of the global asset management arm of Citigroup Inc., which was formed in 1998 as a resultof the merger of Travelers Group and Citicorp Inc. As of December 31, 2001, Salomon managed more than $30 billionin total assets. Salomon’s address is 125 Broad Street, New York, New York 10004.
86

Victory Capital Management Inc. (Victory) (formerly, Key Asset Management Inc.) serves as a sub-adviser for aportion of the assets of the Value Portfolio. Victory is a wholly-owned subsidiary of KeyCorp, Inc. As of December 31,2001, Victory’s total assets under management exceeded $72 billion. Victory’s address is 127 Public Square,Cleveland, Ohio 44114.
Portfolio Managers
An Introductory Note About Prudential Investment Management’s Fixed Income Group
PIM’s Fixed Income Group, which provides portfolio management services to the Conservative Balanced, DiversifiedBond, Flexible Managed, High Yield Bond and Money Market Portfolios, manages more than $135 billion forPrudential’s retail investors, institutional investors, and policyholders. Senior Managing Director James J. Sullivanheads the Group, which is organized into teams specializing in different market sectors. Top-down, broad investmentdecisions are made by the Fixed Income Policy Committee, whereas bottom-up security selection is made by thesector teams.
Prior to joining PIM in 1998, Mr. Sullivan was a Managing Director in Prudential’s Capital Management Group, wherehe oversaw portfolio management and credit research for Prudential’s General Account and subsidiary fixed-incomeportfolios. He has more than 18 years of experience in risk management, arbitrage trading and corporate bondinvesting.
The Fixed Income Investment Policy Committee is comprised of key senior investment managers, including FixedIncome’s Chief Investment Officer and the head of risk management. The Committee uses a top-down approach toinvestment strategy, asset allocation and general risk management, identifying sectors in which to invest.
Conservative Balanced Portfolio and Flexible Managed Portfolio
These Portfolios are managed by a team of portfolio managers. M. Stumpp, Ph.D., Senior Managing Director of PIM,has been the lead portfolio manager of the Portfolios since 1994 and is responsible for the overall asset allocationdecisions.
The Fixed Income segments are managed by the Fixed Income Group of PIM. This Group uses a bottom-up approach,which focuses on individual securities, while staying within the guidelines of the Investment Policy Committee and thePortfolios’ investment restrictions and policies. In addition, the Credit Research team of analysts supports the sectorteams using bottom-up fundamentals, as well as economic and industry trends. Other sector teams may contribute tosecurities selection when appropriate.
The equity portion of the Conservative Balanced Portfolio is managed by M. Stumpp, John Moschberger, and MichaelLenarcic. M. Stumpp’s background is discussed above. Mr. Lenarcic is a Managing Director within PIM’s QuantitativeManagement team. Prior to joining the Quantitative Management team in 1985, Mr. Lenarcic was a Vice President atWilshire Associates, where he was head of the Asset Allocation Division. Mr. Lenarcic holds a B.A. degree from KentState University and A.M. and Ph.D. degrees in Business Economics from Harvard University. John Moschberger,CFA, is a Vice President of Prudential Investments. Mr. Moschberger joined Prudential in 1980 and has been a portfoliomanager since 1986.
The equity portion of the Flexible Managed Portfolio is managed by M. Stumpp, and James Scott. The background ofM. Stumpp is discussed above. James Scott is a Senior Managing Director of PIM’s Quantitative Management Group.Mr. Scott has managed balanced and equity portfolios for Prudential’s pension plans and several institutional clientssince 1987. Mr. Scott received a B.A. from Rice University and an M.S. and a Ph.D. from Carnegie Mellon University.
Diversified Bond Portfolio
The Corporate Team of PIM, headed by Steven Kellner, is primarily responsible for overseeing the day-to-daymanagement of the Portfolio. This team uses a bottom-up approach, which focuses on individual securities, while
87

staying within the guidelines of the Investment Policy Committee and the Portfolios’ investment restrictions and policies.In addition, the Credit Research team of analysts supports the sector teams using bottom-up fundamentals, as well aseconomic and industry trends. Other sector teams may contribute to securities selection when appropriate.
Corporate Team
Assets Under Management (as of December 31, 2001): $42 billion.
Team Leader: Steven Kellner, CFA. General Investment Experience: 16 years.
Portfolio Managers: 7. Average General Investment Experience: 12 years, which includes team members withsignificant mutual fund experience.
Sector: U.S. investment-grade corporate securities.
Investment Strategy: Focus is on identifying spread, credit quality and liquidity trends to capitalize on changingopportunities in the market. Ultimately, they seek the highest expected return with the least risk.
Equity Portfolio
Jeffrey Siegel, Bradley Goldberg and David Kiefer are co-managers of the portion of the Portfolio assigned to Jennison.Mr. Siegel has been an Executive Vice President of Jennison since June 1999. Previously he was at TIAA-CREF from1988-1999, where he held positions as a portfolio manager and analyst. Prior to joining TIAA-CREF, Mr. Siegel was ananalyst for Equitable Capital Management and held positions at Chase Manhattan Bank and First Fidelity Bank. Mr.Siegel earned a B.A. from Rutgers University. Mr. Goldberg is an Executive Vice President of Jennison, where he alsoserves as Chairman of the Asset Allocation Committee. Prior to joining Jennison in 1974 he served as Vice Presidentand Group Head in the Investment Research Division of Bankers Trust Company. He earned a B.S. from the Universityof Illinois and an M.B.A. from New York University. Mr. Goldberg holds a Chartered Financial Analyst (C.F.A.)designation. Mr. Kiefer has been a Senior Vice President of Jennison since September 2000. Previously, he was aManaging Director of Prudential Global Asset Management and has been with Prudential since 1986. Mr. Kiefer earneda B.S. from Princeton University and an M.B.A. from Harvard Business School. He holds a Chartered Financial Analyst(C.F.A.) designation.
Richard Sanderson, Senior Vice President and Director of Investment Research, Domestic Equities, for GEAM,manages the portion of the Equity Portfolio assigned to GEAM. Mr. Sanderson, a Chartered Financial Analyst, has 29years of asset management experience and has been employed with GEAM for over 5 years, and holds B.A. andM.B.A. degrees from the University of Michigan.
Michael Kagan, a Director of Salomon, manages the portion of the Equity Portfolio assigned to Salomon. Mr. Kaganhas over 15 years of asset management experience, including experience as an analyst covering the consumerproducts, aerospace, chemicals, and housing industries. Mr. Kagan received his B.A. from Harvard College andattended the MIT Sloan School of Management.
Global Portfolio
Daniel Duane and Michelle Picker manage this Portfolio. Mr. Duane has been an Executive Vice President of Jennisonsince October 2000 and was previously a Managing Director of Prudential Global Asset Management. He has beenmanaging the Portfolio since 1991. Prior to joining Prudential, he was with First Investors Asset Management where hewas in charge of all global equity investments. He earned a B.A. from Boston College, a Ph.D. from Yale University andan M.B.A. from New York University. He holds a Chartered Financial Analyst (C.F.A.) designation. Michelle Picker hasbeen a Vice President of Jennison since October 2000 and was previously a Vice President of Prudential InvestmentManagement, Inc. Ms. Picker joined Prudential in 1992 and has co-managed the Portfolio since October 1997.Ms. Picker earned a B.A. from the University of Pennsylvania and an M.B.A. from New York University. She holds aChartered Financial Analyst (C.F.A.) designation.
88

High Yield Bond Portfolio
The High Yield Team of PIM, headed by Paul Appleby, is primarily responsible for overseeing the day-to-daymanagement of the fixed income portfolio of the Portfolio. This Team uses a bottom-up approach, which focuses onindividual securities, while staying within the guidelines of the Investment Policy Committee and the Portfolio’sinvestment restrictions and policies. In addition, the Credit Research team of analysts supports the sector teams usingbottom-up fundamentals, as well as economic and industry trends. Other sector teams may contribute to securitiesselection when appropriate.
High Yield Team
Assets Under Management (as of December 31, 2001): $8 billion.
Team Leader: Paul Appleby. General Investment Experience: 15 years.
Portfolio Managers: 6. Average General Investment Experience: 18 years, which includes team members withsignificant mutual fund experience.
Sector: Below-investment-grade corporate securities.
Investment Strategy: The High Yield Team of PIM, headed by Paul Appleby, is primarily responsible foroverseeing the day-to-day management of the fixed income portion of the Portfolio assigned to PrudentialInvestment Management. Focus is generally on bonds with high total return potential, given existing riskparameters. They also seek securities with high current income, as appropriate. The Team uses a relative valueapproach while staying within the guidelines of the Investment Policy Committee and the Portfolio’s investmentrestrictions and policies. In addition, the Credit Research team of analysts supports the sector teams using bottom-up fundamentals, as well as economic and industry trends. Other sector trends may contribute to securitiesselection when appropriate.
Jennison Portfolio
This Portfolio has been managed by Spiros Segalas, Michael Del Balso and Kathleen McCarragher of Jennison since1999. Mr. Segalas is a founding member and a Director, President and Chief Investment Officer of Jennison. He hasbeen in the investment business for over 41 years. Mr. Del Balso, a Director and Executive Vice President of Jennison,is also Jennison’s Director of Equity Research. He has been part of the Jennison team since 1972 when he joined thefirm from White, Weld & Company. Mr. Del Balso is a member of the New York Society of Security Analysts. Ms.McCarragher, Director and Executive Vice President of Jennison, is also Jennison’s Domestic Equity InvestmentStrategist. Prior to joining Jennison in 1998, she was a Managing Director and Director of Large Cap Growth Equities atWeiss, Peck & Greer L.L.C. Prior to 1992, Ms. McCarragher served as an analyst, portfolio manager and member ofthe Investment Committee for State Street Research & Management Company.
Money Market Portfolio
The Money Market Team of PIM, headed by Joseph Tully, is primarily responsible for overseeing the day-to-daymanagement of the Portfolio. This team uses a bottom-up approach, which focuses on individual securities, whilestaying within the guidelines of the Investment Policy Committee and the Portfolio’s investment restrictions and policies.
Money Market Team
Assets Under Management (as of December 31, 2001): $52 billion.
Team Leader: Joseph Tully. General Investment Experience: 18 years.
89

Portfolio Managers: 8. Average General Investment Experience: 12 years, which includes team members withsignificant mutual fund experience.
Sector: High-quality short-term debt securities, including both taxable and tax-exempt instruments.
Investment Strategy: Focus is on safety of principal, liquidity and controlled risk.
Stock Index Portfolio
John Moschberger, CFA, Vice President of PIM, has managed this Portfolio since 1990. Mr. Moschberger joinedPrudential in 1980 and has been a portfolio manager since 1986.
Value Portfolio
Tom Kolefas and Bradley Goldberg are the co-portfolio managers of the portion of the Portfolio assigned to Jennison.Mr. Kolefas has been a Senior Vice President of Jennison since September 2000. Previously, he was a ManagingDirector and Senior Portfolio Manager of Prudential Global Asset Management. He joined Prudential in May 2000 fromLoomis Sayles and Company, L.P., where he headed the Large/Mid-Cap Value Team. Prior to 1996, Mr. Kolefas wasemployed by Mackay Shields Financial as a portfolio manager for five years. Mr. Kolefas earned a B.S. from theCooper Union School of Engineering and an M.B.A. from New York University and holds the Chartered FinancialAnalyst (C.F.A.) designation. Mr. Goldberg is an Executive Vice President of Jennison, and also serves as Chairman ofthe Asset Allocation Committee. He joined Jennison in 1974. Prior to joining Jennison, he served as Vice President andGroup Head in the Investment Research Division of Bankers Trust Company. He earned a B.S. from the University ofIllinois and an M.B.A from the New York University. Mr. Goldberg holds the Chartered Financial Analyst (C.F.A.)designation.
James Giblin, a Chartered Financial Analyst, manages the portion of the Portfolio assigned to DAMI. Mr. Giblin joinedDAMI in 1995 with 22 years of investment experience, including 15 years as a portfolio manager for Cigna EquityAdvisors. He received his B.S. from Pennsylvania State University and an M.B.A. from the Wharton School, Universityof Pennsylvania.
Neil A. Kilbane manages the portion of the Portfolio assigned to Victory. Mr. Kilbane is a Senior Portfolio and ManagingDirector for Victory, and is a Chartered Financial Analyst. Mr. Kilbane began his investment career with Victory in 1995,and prior to that was employed by Duff & Phelps Investment Management Company and National City Bank. Mr.Kilbane holds a B.S. from Cleveland State University, an M.S. from Kansas State University, and an M.B.A. from TulsaUniversity.
SP AIM Aggressive Growth Portfolio
A I M Capital Management, Inc. (A I M Capital) uses a team approach to investment management. The individualmembers of the team who are primarily responsible for the day-to-day management of the Portfolio are Ryan E. Crane,Portfolio Manager, who has been responsible for the Portfolio since 2000 and has been associated with A I M Capitaland/or its affiliates since 1994, Jay K. Rushin, CFA, Portfolio Manager, who has been responsible for the Portfolio since2001 and has been associated with A I M Capital and/or its affiliates since 1994, and Robert M. Kippes, Senior PortfolioManager, who has been associated with A I M Capital and/or its affiliates since 1989.
SP AIM Core Equity Portfolio
A I M Capital Management, Inc. (A I M Capital) uses a team approach to investment management. The individualmembers of the team who are primarily responsible for the day-to-day management of the Portfolio are:
Ronald Sloan, Senior Portfolio Manager, joined AIM Capital in 1998 from Verissimo Research and Management, wherehe served as president since 1993. Prior to Verissimo Research and Management, he was partner and executive vicepresident at Wood Island Associates, Inc./Siebel Capital Management, Inc. from 1981 to 1993. Mr. Sloan has been in
90

the investment industry since 1971. Mr. Sloan holds a B.S. in business administration as well as an M.B.A. from theUniversity of Missouri. He is a Chartered Financial Analyst.
Michael Yellen, Portfolio Manager, joined AIM Capital in 1994 from INVESCO (NY), Inc., formerly known as ChancellorLGT Asset Management, Inc., as an investment analyst for health care industries. He also had primary responsibilityfor the GT Applied Science Fund and the GT Healthcare Fund, both offshore funds, until assuming his presentresponsibilities with AIM Capital. Mr. Yellen began his career at Franklin Resources, Inc. as a senior securities analyst.Mr. Yellen holds a B.A. from Stanford University.
SP Alliance Large Cap Growth Portfolio
Alfred Harrison, Director and Vice Chairman of Alliance Capital Management Corporation (ACMC) leads the teammanaging this Portfolio, with Syed Hasnain, a Senior Portfolio Manager, also being directly involved.
Mr. Hasnain joined ACMC after working as a strategist with Merrill Lynch Capital Markets. Previously he was aninternational economist with Citicorp and a financial analyst at Goldman Sachs & Co. He holds a M. Phil in Financefrom Cambridge University, and Sc.B. from Brown University, and studied towards a doctorate at Stanford BusinessSchool. Investment experience: 12 years.
SP Alliance Technology Portfolio
Gerald T. Malone manages the SP Alliance Technology Portfolio. Mr. Malone is a Senior Vice President of AllianceCapital Management Corporation (ACMC) and has been associated with ACMC for more than five years.
SP Asset Allocation Portfolios
For the four Asset Allocation Portfolios, PI invests in shares of other Fund Portfolios according to the percentageallocations discussed in this prospectus.
SP Davis Value Portfolio
The following individuals provide day-to-day management of the SP Davis Value Portfolio.
Christopher C. Davis
Responsibilities:
‰ President of Davis New York Venture Fund, Inc.‰ Also manages or co-manages other equity funds advised by Davis Selected Advisers.
Other Experience:
‰ Portfolio Manager of Davis New York Venture Fund since October 1995.‰ Assistant Portfolio Manager and research analyst working with Shelby M.C. Davis from September 1989 to
September 1995.
Kenneth Charles Feinberg
Responsibilities:
‰ Co-Portfolio Manager of Davis New York Venture Fund with Christopher C. Davis since May 1998.‰ Also co-manages other equity funds advised by Davis Selected Advisers.
91
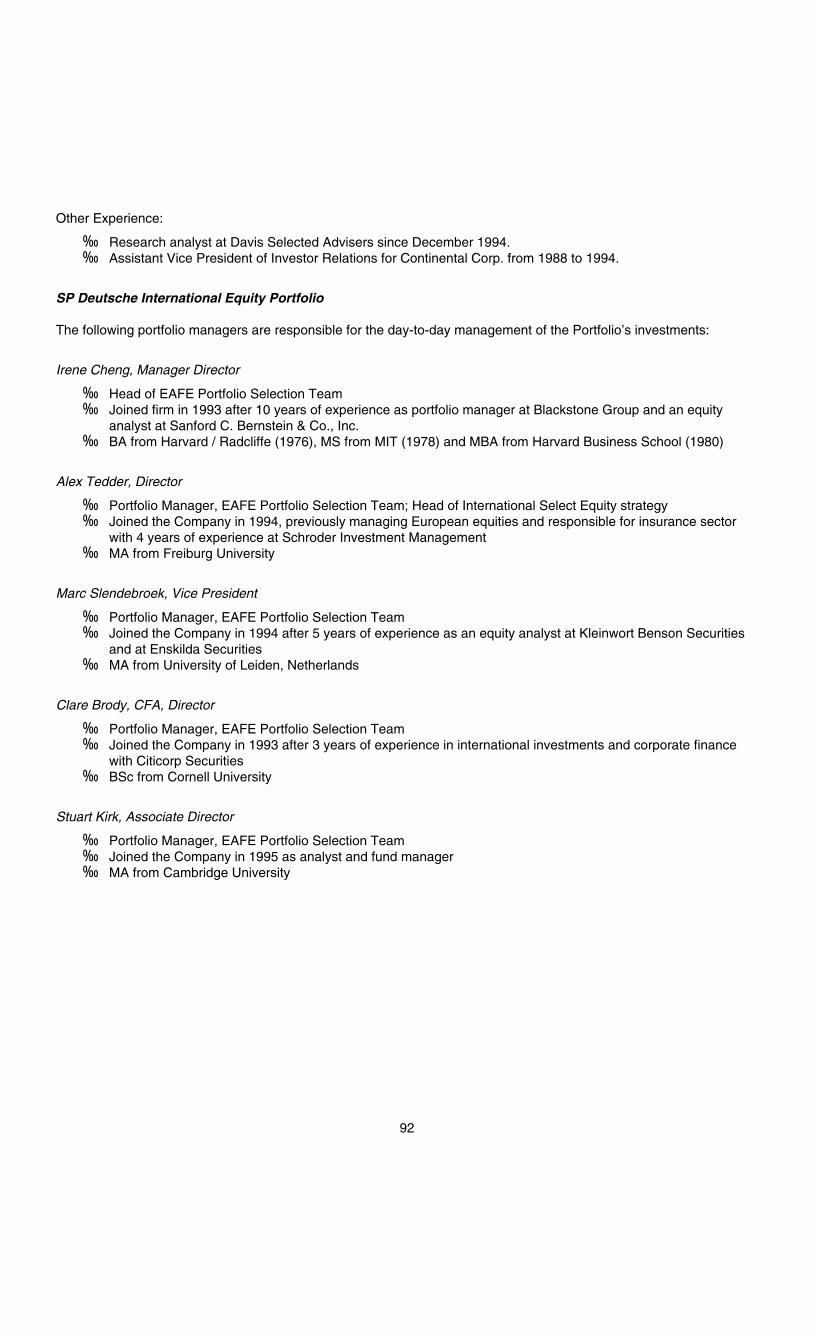
Other Experience:
‰ Research analyst at Davis Selected Advisers since December 1994.‰ Assistant Vice President of Investor Relations for Continental Corp. from 1988 to 1994.
SP Deutsche International Equity Portfolio
The following portfolio managers are responsible for the day-to-day management of the Portfolio’s investments:
Irene Cheng, Manager Director
‰ Head of EAFE Portfolio Selection Team‰ Joined firm in 1993 after 10 years of experience as portfolio manager at Blackstone Group and an equity
analyst at Sanford C. Bernstein & Co., Inc.‰ BA from Harvard / Radcliffe (1976), MS from MIT (1978) and MBA from Harvard Business School (1980)
Alex Tedder, Director
‰ Portfolio Manager, EAFE Portfolio Selection Team; Head of International Select Equity strategy‰ Joined the Company in 1994, previously managing European equities and responsible for insurance sector
with 4 years of experience at Schroder Investment Management‰ MA from Freiburg University
Marc Slendebroek, Vice President
‰ Portfolio Manager, EAFE Portfolio Selection Team‰ Joined the Company in 1994 after 5 years of experience as an equity analyst at Kleinwort Benson Securities
and at Enskilda Securities‰ MA from University of Leiden, Netherlands
Clare Brody, CFA, Director
‰ Portfolio Manager, EAFE Portfolio Selection Team‰ Joined the Company in 1993 after 3 years of experience in international investments and corporate finance
with Citicorp Securities‰ BSc from Cornell University
Stuart Kirk, Associate Director
‰ Portfolio Manager, EAFE Portfolio Selection Team‰ Joined the Company in 1995 as analyst and fund manager‰ MA from Cambridge University
92

SP INVESCO Small Company Growth Portfolio
The following individual is primarily responsible for the day-to-day management of the Portfolio’s holdings:
Stacie Cowell is the lead portfolio manager of the SP INVESCO Small Company Growth Portfolio and a CharteredFinancial Analyst (CFA) who joined INVESCO in 1997. She is also a vice president of INVESCO. Before joining thecompany, she was senior equity analyst with Founders Asset Management and capital markets and trading analystwith Chase Manhattan Bank in New York. She holds a B.A. in Economics from Colgate University and an M.S from theUniversity of Colorado (Boulder).
SP Jennison International Growth Portfolio
The Portfolio is co-managed by Blair Boyer and Daniel Duane. Mr. Boyer, Executive Vice President of Jennison, hasbeen in the investment business for over 18 years. Prior to joining Jennison in March 1993, he managed internationalequity portfolios at Arnhold and S. Bleichroeder, Inc. Previously, he was a research analyst and senior portfoliomanager at Verus Capital. He earned a B.A. from Bucknell University in 1983 and an M.B.A. from New York Universityin 1988. Mr. Duane has been an Executive Vice President of Jennison since October 2000 and was previously aManaging Director of Prudential Global Asset Management. Prior to joining Prudential, he was in charge of all globalequity investments at First Investors Asset Management, managed a portion of TIAA-CREF’s global portfolio and was aresearch analyst at Value Line. He earned a dual A.B. from Boston College, a Ph.D. from Yale University and anM.B.A. from New York University. Mr. Duane also was Fulbright Scholar at the University of Tubingen in Germany. Heholds a Chartered Financial Analyst (C.F.A.) designation.
SP Large Cap Value Portfolio And SP Small/Mid-Cap Value Portfolio
Fidelity Management & Research Company (FMR) is the Portfolios’ sub-adviser. Robert Macdonald is portfoliomanager of the SP Large Cap Value Portfolio and the SP Small/Mid-Cap Value Portfolio. Mr. Macdonald is a seniorvice president and portfolio manager for other accounts managed by FMR and its affiliates. He joined FMR in 1985.
SP MFS Capital Opportunities Portfolio
The Portfolio is managed by Maura A. Shaughnessy, a Senior Vice President of Massachusetts Financial ServicesCompany (MFS), who has been employed in the investment management area of MFS since 1991.
SP MFS Mid-Cap Growth Portfolio
The Portfolio is managed by Mark Regan, a Senior Vice President of MFS, who has been employed in the investmentmanagement area of MFS since 1989 and David E. Sette-Ducati, a Vice President of MFS, has been employed in theinvestment management area of MFS since 1995.
93

MFS and its predecessor organizations have a history of money management dating from 1924. MFS is an indirectwholly-owned subsidiary of Sun Life Assurance Company of Canada.
SP PIMCO High Yield Portfolio
The Portfolio is managed by Benjamin L. Trosky. Mr. Trosky, Managing Director of PIMCO, joined PIMCO as a portfoliomanager in 1990, and has managed fixed income accounts for various institutional clients and funds since that time.
SP PIMCO Total Return Portfolio
The Portfolio is managed by a portfolio management team led by William H. Gross, Managing Director, ChiefInvestment Officer and a founding partner of PIMCO. The portfolio management team develops and implementsstrategy for the Portfolio.
SP Prudential U.S. Emerging Growth Portfolio
Susan Hirsch, Executive Vice President of Jennison, has managed the retail fund counterpart of this Portfolio since itbegan. Prior to joining Jennison, Ms. Hirsch was a Managing Director of Prudential Investments, which she joined inJuly 1996. Before that she was employed by Lehman Brothers Global Asset Management from 1986 to 1996 andDelphi Asset Management in 1996. She managed growth stock portfolios at both firms. Ms. Hirsch holds a B.S. fromBrooklyn College and is a member of the Financial Analysts Federation and the New York Society of Security Analysts.
SP Strategic Partners Focused Growth Portfolio
Alfred Harrison is portfolio manager for the portion of the Portfolio’s assets advised by Alliance. Mr. Harrison joinedAlliance in 1978 and is manager of the firm’s Minneapolis office. He is Vice Chairman of Alliance Capital ManagementCorporation.
Spiros Segalas and Kathleen McCarragher are co-portfolio managers for the portion of the Portfolio’s assets advised byJennison. Mr. Segalas is a Director, founding member and President and Chief Investment Officer of Jennison. He hasbeen in the investment business for over 41 years. Ms. McCarragher, Director and Executive Vice President ofJennison, is also Jennison’s Domestic Equity Investment Strategist. Prior to joining Jennison in 1998, she was aManaging Director and Director of Large Cap Growth Equities at Weiss, Peck & Greer LLC. Prior to 1992, Ms.McCarragher served as an analyst portfolio manager and member of the Investment Committee for State StreetResearch and Management Company.
HOW TO BUY AND SELL SHARES OF THE FUND
The Fund offers two classes of shares in each Portfolio — Class I and Class II. Each Class participates in the sameinvestments within a given Portfolio, but the Classes differ as far as their charges. Class I shares are sold only toseparate accounts of Prudential Insurance Company of America and its affiliates as investment options under certainContracts. Class II is offered only to separate accounts of non-Prudential insurance companies as investment optionsunder certain of their Contracts. Please refer to the accompanying Contract prospectus to see which Portfolios areavailable through your Contract.
The Fund sells its shares to separate accounts issuing variable annuity contracts and variable life insurance policies.To the extent dictated by its agreement with a separate account, the Fund will cooperate with the separate account inmonitoring for transactions that are indicative of market timing. In addition, to the extent permitted by applicable laws andagreements, the Fund may cease selling its shares to a separate account to prevent market timing transactions.
The way to invest in the Portfolios is through certain variable life insurance and variable annuity contracts. Togetherwith this prospectus, you should have received a prospectus for such a Contract. You should refer to that prospectusfor further information on investing in the Portfolios.
94

Both Class I and Class II shares of a Portfolio are sold without any sales charge at the net asset value of the Portfolio.Class II shares, however, are subject to an annual distribution or “12b-1” fee of 0.25% and an administration fee of0.15% of the average daily net assets of Class II. Class I shares do not have a distribution or administration fee.
Shares are redeemed for cash within seven days of receipt of a proper notice of redemption or sooner if required bylaw. There is no redemption charge. We may suspend the right to redeem shares or receive payment when the NewYork Stock Exchange is closed (other than weekends or holidays), when trading on the New York Stock Exchange isrestricted, or as permitted by the SEC.
Net Asset Value
Any purchase or sale of Portfolio shares is made at the net asset value, or NAV, of such shares. The price at which apurchase or redemption is made is based on the next calculation of the NAV after the order is received in good order.The NAV of each share class of each Portfolio is determined on each day the New York Stock Exchange is open fortrading as of the close of the exchange’s regular trading session (which is generally 4:00 p.m. New York time). TheNYSE is closed on most national holidays and Good Friday. The Fund does not price, and shareholders will not be ableto purchase or redeem, the Fund’s shares on days when the NYSE is closed but the primary markets for the Fund’sforeign securities are open, even though the value of these securities may have changed. Conversely, the Fund willordinarily price its shares, and shareholders may purchase and redeem shares, on days that the NYSE is open butforeign securities markets are closed.
The NAV for each of the Portfolios other than the Money Market Portfolio is determined by a simple calculation. It’s thetotal value of a Portfolio (assets minus liabilities) divided by the total number of shares outstanding. The NAV for theMoney Market Portfolio will ordinarily remain at $10 per share. (The price of each share remains the same but you willhave more shares when dividends are declared.)
To determine a Portfolio’s NAV, its holdings are valued as follows:
Equity Securities are generally valued at the last sale price on an exchange or NASDAQ, or if there is not a sale onthat day, at the mean between the most recent bid and asked prices on that day. If there is no asked price, the securitywill be valued at the bid price. Equity securities that are not sold on an exchange or NASDAQ are generally valued byan independent pricing agent or principal market maker.
A Portfolio may own securities that are primarily listed on foreign exchanges that trade on weekends or other dayswhen the Portfolios do not price their shares. Therefore, the value of a Portfolio’s assets may change on days whenshareholders cannot purchase or redeem Portfolio shares.
All Short-term Debt Securities held by the Money Market Portfolio are valued at amortized cost. Short-term debtsecurities with remaining maturities of 12 months or less held by the Conservative Balanced and Flexible ManagedPortfolios are valued on an amortized cost basis. The amortized cost valuation method is widely used by mutual funds.It means that the security is valued initially at its purchase price and then decreases in value by equal amounts eachday until the security matures. It almost always results in a value that is extremely close to the actual market value. TheFund’s Board of Directors has established procedures to monitor whether any material deviation between valuation andmarket value occurs and if so, will promptly consider what action, if any, should be taken to prevent unfair results toContract owners.
For each Portfolio other than the Money Market Portfolio, and except as discussed above for the ConservativeBalanced and Flexible Managed Portfolios, short-term debt securities, including bonds, notes, debentures and otherdebt securities, and money market instruments such as certificates of deposit, commercial paper, bankers’acceptances and obligations of domestic and foreign banks, with remaining maturities of more than 60 days, for whichmarket quotations are readily available, are valued by an independent pricing agent or principal market maker (ifavailable, otherwise a primary market dealer).
Short-term Debt Securities with remaining maturities of 60 days or less are valued at cost with interest accrued ordiscount amortized to the date of maturity, unless such valuation, in the judgment of PI or a sub-adviser, does notrepresent fair value.
95

Convertible debt securities that are traded in the over-the-counter market, including listed convertible debt securitiesfor which the primary market is believed by PI or a sub-adviser to be over-the-counter, are valued at the mean betweenthe last bid and asked prices provided by a principal market maker (if available, otherwise a primary market dealer).
Other debt securities— those that are not valued on an amortized cost basis — are valued using an independentpricing service.
Options on stock and stock indexes that are traded on a national securities exchange are valued at the last saleprice on such exchange on the day of valuation or, if there was no such sale on such day, at the mean between themost recently quoted bid and asked prices on such exchange.
Futures contracts and options on futures contracts are valued at the last sale price at the close of the commoditiesexchange or board of trade on which they are traded. If there has been no sale that day, the securities will be valued atthe mean between the most recently quoted bid and asked prices on that exchange or board of trade.
Forward currency exchange contracts are valued at the cost of covering or offsetting such contracts calculated onthe day of valuation. Securities which are valued in accordance herewith in a currency other than U.S. dollars shall beconverted to U.S. dollar equivalents at a rate obtained from a recognized bank, dealer or independent service on theday of valuation.
Over-the-counter (OTC) options are valued at the mean between bid and asked prices provided by a dealer (whichmay be the counterparty). A sub-adviser will monitor the market prices of the securities underlying the OTC optionswith a view to determining the necessity of obtaining additional bid and ask quotations from other dealers to assess thevalidity of the prices received from the primary pricing dealer.
Securities for which no market quotations are available will be valued at fair value by PI under the direction of theFund’s Board of Directors. The Fund also may use fair value pricing if it determines that a market quotation is notreliable based among other things, on events that occur after the quotation is derived or after the close of the primarymarket on which the security is traded, but before the time that the Fund’s NAV is determined. This use of fair valuepricing most commonly occurs with securities that are primarily traded outside the U.S., but also may occur with U.S.-traded securities. The fair value of a portfolio security that the Fund uses to determine its NAV may differ from thesecurity’s quoted or published price. For purposes of computing the Fund’s NAV, we will value the Fund’s futurescontracts 15 minutes after the close of regular trading on the New York Stock Exchange (NYSE). Except when we fairvalue securities, we normally value each foreign security held by the Fund as of the close of the security’s primarymarket.
Distributor
Prudential Investment Management Services LLC (PIMS) distributes the Fund’s shares under a Distribution Agreementwith the Fund. PIMS’ principal business address is Gateway Center Three, 100 Mulberry Street, Newark, New Jersey07102-3777. The Fund has adopted a distribution plan under Rule 12b-1 of the Investment Company Act of 1940covering Class II shares. Under that plan, Class II of each Portfolio pays to PIMS a distribution or “12b-1” fee at theannual rate of 0.25% of the average daily net assets of Class II. This fee pays for distribution services for Class IIshares. Because these fees are paid out of the Portfolio’s assets on an on-going basis, over time these fees willincrease the cost of your investment in Class II shares and may cost you more than paying other types of salescharges. These 12b-1 fees do not apply to Class I.
OTHER INFORMATION
Federal Income Taxes
If you own or are considering purchasing a variable contract, you should consult the prospectus for the variablecontract for tax information about that variable contract. You should also consult with a qualified tax adviser forinformation and advice.
The SAI provides information about certain tax laws applicable to the Fund.
96

Monitoring For Possible Conflicts
The Fund sells its shares to fund variable life insurance contracts and variable annuity contracts and is authorized tooffer its shares to qualified retirement plans. Because of differences in tax treatment and other considerations, it ispossible that the interest of variable life insurance contract owners, variable annuity contract owners and participants inqualified retirement plans could conflict. The Fund will monitor the situation and in the event that a material conflict diddevelop, the Fund would determine what action, if any, to take in response.
Financial Highlights
The financial highlights which follow will help you evaluate the financial performance of each Portfolio available underyour Contract. The total return in each chart represents the rate that a shareholder earned on an investment in thatshare class of the Portfolio, assuming reinvestment of all dividends and other distributions. The charts do not reflectany charges under any variable contract. The information is for Class I shares for the periods indicated, unlessotherwise indicated.
The information has been audited by PricewaterhouseCoopers LLP, whose unqualified report, along with thefinancial statements, appears in the annual report, which is available upon request.
97

Financial HighlightsConservative Balanced Portfolio
Year EndedDecember 31,
2001 2000 1999 1998 1997
Per Share Operating Performance:Net Asset Value, beginning of year . . . . . . . . . . . . . . . . . . . . . . . . . . . . . . . . . . . . . . . . . . . . . $ 14.63 $ 15.36 $ 15.08 $ 14.97 $ 15.52
Income From Investment Operations:Net investment income . . . . . . . . . . . . . . . . . . . . . . . . . . . . . . . . . . . . . . . . . . . . . . . . . . . . . . . 0.44 0.59 0.62 0.66 0.76Net realized and unrealized gains (losses) on investments . . . . . . . . . . . . . . . . . . . . . . . . . (0.75) (0.65) 0.37 1.05 1.26
Total from investment operations . . . . . . . . . . . . . . . . . . . . . . . . . . . . . . . . . . . . . . . . . . (0.31) (0.06) 0.99 1.71 2.02
Less Distributions:Dividends from net investment income . . . . . . . . . . . . . . . . . . . . . . . . . . . . . . . . . . . . . . . . . . (0.48) (0.56) (0.62) (0.66) (0.76)Distributions from net realized gains . . . . . . . . . . . . . . . . . . . . . . . . . . . . . . . . . . . . . . . . . . . . (0.15) (0.11) (0.06) (0.94) (1.81)Distributions in excess of net realized gains . . . . . . . . . . . . . . . . . . . . . . . . . . . . . . . . . . . . . — — (0.03) — —
Total distributions . . . . . . . . . . . . . . . . . . . . . . . . . . . . . . . . . . . . . . . . . . . . . . . . . . . . . . . (0.63) (0.67) (0.71) (1.60) (2.57)
Net Asset Value, end of year . . . . . . . . . . . . . . . . . . . . . . . . . . . . . . . . . . . . . . . . . . . . . . . . . . $ 13.69 $ 14.63 $ 15.36 $ 15.08 $ 14.97
Total Investment Return:(a) . . . . . . . . . . . . . . . . . . . . . . . . . . . . . . . . . . . . . . . . . . . . . . . . . (2.02)% (0.48)% 6.69% 11.74% 13.45%Ratios/Supplemental Data:Net assets, end of year (in millions) . . . . . . . . . . . . . . . . . . . . . . . . . . . . . . . . . . . . . . . . . . . . $3,259.7 $3,714.3 $4,387.1 $4,796.0 $4,744.2Ratios to average net assets:Expenses . . . . . . . . . . . . . . . . . . . . . . . . . . . . . . . . . . . . . . . . . . . . . . . . . . . . . . . . . . . . . . . . 0.58% 0.60% 0.57% 0.57% 0.56%Net investment income . . . . . . . . . . . . . . . . . . . . . . . . . . . . . . . . . . . . . . . . . . . . . . . . . . . . . 3.05% 3.79% 4.02% 4.19% 4.48%
Portfolio turnover rate . . . . . . . . . . . . . . . . . . . . . . . . . . . . . . . . . . . . . . . . . . . . . . . . . . . . . . . . 239% 85% 109% 167% 295%
(a) Total investment return is calculated assuming a purchase of shares on the first day and a sale on the last day of each year reported andincludes reinvestment of dividends and distributions.
Diversified Bond Portfolio
Year EndedDecember 31,
2001 2000 1999 1998 1997
Per Share Operating Performance:Net Asset Value, beginning of year . . . . . . . . . . . . . . . . . . . . . . . . . . . . . . . . . . . . . . . . . . . . . $ 11.28 $ 10.95 $ 11.06 $ 11.02 $11.07
Income From Investment Operations:Net investment income . . . . . . . . . . . . . . . . . . . . . . . . . . . . . . . . . . . . . . . . . . . . . . . . . . . . . . . 0.67 0.77 0.67 0.69 0.80Net realized and unrealized gains (losses) on investments . . . . . . . . . . . . . . . . . . . . . . . . . 0.12 0.26 (0.75) 0.08 0.11
Total from investment operations . . . . . . . . . . . . . . . . . . . . . . . . . . . . . . . . . . . . . . . . . . 0.79 1.03 (0.08) 0.77 0.91
Less Distributions:Dividends from net investment income . . . . . . . . . . . . . . . . . . . . . . . . . . . . . . . . . . . . . . . . . . (0.71) (0.70) — (0.69) (0.83)Distributions from net realized gains . . . . . . . . . . . . . . . . . . . . . . . . . . . . . . . . . . . . . . . . . . . . — —(b) (0.03) (0.04) (0.13)
Total distributions . . . . . . . . . . . . . . . . . . . . . . . . . . . . . . . . . . . . . . . . . . . . . . . . . . . . . . . (0.71) (0.70) (0.03) (0.73) (0.96)
Net Asset Value, end of year . . . . . . . . . . . . . . . . . . . . . . . . . . . . . . . . . . . . . . . . . . . . . . . . . . $ 11.36 $ 11.28 $ 10.95 $ 11.06 $11.02
Total Investment Return(a) . . . . . . . . . . . . . . . . . . . . . . . . . . . . . . . . . . . . . . . . . . . . . . . . . . 6.98% 9.72% (0.74)% 7.15% 8.57%Ratios/Supplemental Data:Net assets, end of year (in millions) . . . . . . . . . . . . . . . . . . . . . . . . . . . . . . . . . . . . . . . . . . . . $1,400.7 $1,269.8 $1,253.8 $1,122.6 $816.7Ratios to average net assets:Expenses . . . . . . . . . . . . . . . . . . . . . . . . . . . . . . . . . . . . . . . . . . . . . . . . . . . . . . . . . . . . . . . . 0.44% 0.45% 0.43% 0.42% 0.43%Net investment income . . . . . . . . . . . . . . . . . . . . . . . . . . . . . . . . . . . . . . . . . . . . . . . . . . . . . 6.35% 6.83% 6.25% 6.40% 7.18%
Portfolio turnover rate . . . . . . . . . . . . . . . . . . . . . . . . . . . . . . . . . . . . . . . . . . . . . . . . . . . . . . . . 257% 139% 171% 199% 224%
(a) Total investment return is calculated assuming a purchase of shares on the first day and a sale on the last day of each year reported includesreinvestment of dividends and distributions.
(b) Less than $0.005 per share.
F1

Financial HighlightsEquity Portfolio
Class I Class II
Year EndedDecember 31,
Year EndedDecember 31,
May 3, 1999(c)through
December 31,19992001 2000 1999 1998 1997 2001 2000
Per Share Operating Performance:Net Asset Value, beginning of period . . . . . . . . . . . $ 24.50 $ 28.90 $ 29.64 $ 31.07 $ 26.96 $24.51 $28.92 $32.79
Income from Investment Operations:Net investment income . . . . . . . . . . . . . . . . . . . . . . . 0.18 0.51 0.54 0.60 0.69 0.09 0.39 0.28Net realized and unrealized gains (losses) oninvestments . . . . . . . . . . . . . . . . . . . . . . . . . . . . . . (2.83) 0.26 3.02 2.21 5.88 (2.83) 0.26 (0.60)
Total from investment operations . . . . . . . . . . . (2.65) 0.77 3.56 2.81 6.57 (2.74) 0.65 (0.32)
Less Distributions:Dividends from net investment income . . . . . . . . . . (0.18) (0.51) (0.53) (0.60) (0.70) (0.10) (0.40) (0.34)Distributions in excess of net investmentincome . . . . . . . . . . . . . . . . . . . . . . . . . . . . . . . . . . — (0.02) — — — — (0.02) —
Distributions from net realized gains . . . . . . . . . . . . (1.18) (4.64) (3.77) (3.64) (1.76) (1.18) (4.64) (3.21)
Total distributions . . . . . . . . . . . . . . . . . . . . . . . (1.36) (5.17) (4.30) (4.24) (2.46) (1.28) (5.06) (3.55)
Net Asset Value, end of period . . . . . . . . . . . . . . . . $ 20.49 $ 24.50 $ 28.90 $ 29.64 $ 31.07 $20.49 $24.51 $28.92
Total Investment Return(a) . . . . . . . . . . . . . . . . . . (11.18)% 3.28% 12.49% 9.34% 24.66% (11.57)% 2.83% (0.68)%Ratios/Supplemental Data:Net assets, end of period (in millions) . . . . . . . . . . . $4,615.9 $5,652.7 $6,235.0 $6,247.0 $6,024.0 $ 1.1 $ 1.8 $ 0.3Ratios to average net assets:Expenses . . . . . . . . . . . . . . . . . . . . . . . . . . . . . . . . 0.49% 0.49% 0.47% 0.47% 0.46% 0.89% 0.91% 0.87%(b)Net investment income . . . . . . . . . . . . . . . . . . . . . 0.84% 1.75% 1.72% 1.81% 2.27% 0.45% 1.26% 1.33%(b)
Portfolio turnover rate . . . . . . . . . . . . . . . . . . . . . . . . 153% 78% 9% 25% 13% 153% 78% 9%
(a) Total investment return is calculated assuming a purchase of shares on the first day and a sale on the last day of each period reported andincludes reinvestment of dividends and distributions. Total investment returns for less than a full year are not annualized.
(b) Annualized.
(c) Commencement of offering of Class II shares.
Flexible Managed Portfolio
Year EndedDecember 31,
2001 2000 1999 1998 1997
Per Share Operating Performance:Net Asset Value, beginning of year . . . . . . . . . . . . . . . . . . . . . . . . . . . . . . $ 16.53 $ 17.64 $ 16.56 $ 17.28 $ 17.79
Income From Investment Operations:Net investment income . . . . . . . . . . . . . . . . . . . . . . . . . . . . . . . . . . . . . . . . 0.42 0.61 0.58 0.58 0.59Net realized and unrealized gains (losses) on investments . . . . . . . . . . (1.35) (0.86) 0.69 1.14 2.52
Total from investment operations . . . . . . . . . . . . . . . . . . . . . . . . . . . . (0.93) (0.25) 1.27 1.72 3.11
Less Distributions:Dividends from net investment income . . . . . . . . . . . . . . . . . . . . . . . . . . . (0.58) (0.62) — (0.59) (0.58)Distributions from net realized gains . . . . . . . . . . . . . . . . . . . . . . . . . . . . . (0.23) (0.24) (0.19) (1.85) (3.04)
Total distributions . . . . . . . . . . . . . . . . . . . . . . . . . . . . . . . . . . . . . . . . (0.81) (0.86) (0.19) (2.44) (3.62)
Net Asset Value, end of year . . . . . . . . . . . . . . . . . . . . . . . . . . . . . . . . . . . $ 14.79 $ 16.53 $ 17.64 $ 16.56 $ 17.28
Total Investment Return(a) . . . . . . . . . . . . . . . . . . . . . . . . . . . . . . . . . . . (5.68)% (1.44)% 7.78% 10.24% 17.96%Ratios/Supplemental Data:Net assets, end of year (in millions) . . . . . . . . . . . . . . . . . . . . . . . . . . . . . $3,896.6 $4,463.8 $5,125.3 $5,410.0 $5,490.1Ratios to average net assets:Expenses . . . . . . . . . . . . . . . . . . . . . . . . . . . . . . . . . . . . . . . . . . . . . . . . . 0.64% 0.64% 0.62% 0.61% 0.62%Net investment income . . . . . . . . . . . . . . . . . . . . . . . . . . . . . . . . . . . . . . 2.61% 3.22% 3.20% 3.21% 3.02%
Portfolio turnover rate . . . . . . . . . . . . . . . . . . . . . . . . . . . . . . . . . . . . . . . . . 236% 132% 76% 138% 227%
(a) Total investment return is calculated assuming a purchase of shares on the first day and a sale on the last day of each year reported andincludes reinvestment of dividends and distributions.
F2

Financial HighlightsGlobal Portfolio
Year EndedDecember 31,
2001 2000 1999 1998 1997
Per Share Operating Performance:Net Asset Value, beginning of year . . . . . . . . . . . . . . . . . . . . . . . . . . . . . . . $ 23.61 $ 30.98 $ 21.16 $17.92 $17.85
Income from Investment Operations:Net investment income . . . . . . . . . . . . . . . . . . . . . . . . . . . . . . . . . . . . . . . . . 0.09 0.07 0.06 0.07 0.09Net realized and unrealized gains (losses) on investments . . . . . . . . . . . (3.58) (5.30) 10.04 4.38 1.11
Total from investment operations . . . . . . . . . . . . . . . . . . . . . . . . . . . . (3.49) (5.23) 10.10 4.45 1.20
Less Distributions:Dividends from net investment income . . . . . . . . . . . . . . . . . . . . . . . . . . . . (0.06) (0.07) — (0.16) (0.13)Distributions in excess of net investment income . . . . . . . . . . . . . . . . . . . — (0.13) (0.10) (0.12) (0.10)Distributions from net realized gains . . . . . . . . . . . . . . . . . . . . . . . . . . . . . . (4.77) (1.94) (0.18) (0.93) (0.90)
Total distributions . . . . . . . . . . . . . . . . . . . . . . . . . . . . . . . . . . . . . . . . . (4.83) (2.14) (0.28) (1.21) (1.13)
Net Asset Value, end of year . . . . . . . . . . . . . . . . . . . . . . . . . . . . . . . . . . . . $ 15.29 $ 23.61 $ 30.98 $21.16 $17.92
Total Investment Return(a) . . . . . . . . . . . . . . . . . . . . . . . . . . . . . . . . . . . . (17.64)% (17.68)% 48.27% 25.08% 6.98%Ratios/Supplemental Data:Net assets, end of year (in millions) . . . . . . . . . . . . . . . . . . . . . . . . . . . . . . $ 885.0 $1,182.1 $1,298.3 $844.5 $638.4Ratios to average net assets: . . . . . . . . . . . . . . . . . . . . . . . . . . . . . . . . . . .Expenses . . . . . . . . . . . . . . . . . . . . . . . . . . . . . . . . . . . . . . . . . . . . . . . . . . 0.84% 0.85% 0.84% 0.86% 0.85%Net investment income . . . . . . . . . . . . . . . . . . . . . . . . . . . . . . . . . . . . . . . 0.58% 0.25% 0.21% 0.29% 0.47%
Portfolio turnover rate . . . . . . . . . . . . . . . . . . . . . . . . . . . . . . . . . . . . . . . . . . 67% 95% 76% 73% 70%
(a) Total investment return is calculated assuming a purchase of shares on the first day and a sale on the last day of each year reported andincludes reinvestment of dividends and distributions.
High Yield Bond Portfolio
Year EndedDecember 31,
2001 2000 1999 1998 1997
Per Share Operating Performance:Net Asset Value, beginning of year . . . . . . . . . . . . . . . . . . . . . . . . . . . . . . . $ 6.14 $ 7.52 $ 7.21 $ 8.14 $ 7.87
Income From Investment Operations:Net investment income . . . . . . . . . . . . . . . . . . . . . . . . . . . . . . . . . . . . . . . . . 0.58 0.74 0.79 0.77 0.78Net realized and unrealized gains (losses) on investments . . . . . . . . . . . . (0.62) (1.30) (0.46) (0.94) 0.26
Total from Investment operations . . . . . . . . . . . . . . . . . . . . . . . . . . . . . (0.04) (0.56) 0.33 (0.17) 1.04
Less Distributions:Dividends from net investment income . . . . . . . . . . . . . . . . . . . . . . . . . . . . (0.70) (0.82) (0.02) (0.76) (0.77)
Net Asset Value, end of year . . . . . . . . . . . . . . . . . . . . . . . . . . . . . . . . . . . . $ 5.40 $ 6.14 $ 7.52 $ 7.21 $ 8.14
Total Investment Return(a) . . . . . . . . . . . . . . . . . . . . . . . . . . . . . . . . . . . . (0.44)% (7.91)% 4.61% (2.36)% 13.78%Ratios/Supplemental Data:Net assets, end of year (in millions) . . . . . . . . . . . . . . . . . . . . . . . . . . . . . . . $655.8 $661.3 $802.2 $789.3 $568.7Ratios to average net assets:Expenses . . . . . . . . . . . . . . . . . . . . . . . . . . . . . . . . . . . . . . . . . . . . . . . . . . 0.60% 0.60% 0.60% 0.58% 0.57%Net investment income . . . . . . . . . . . . . . . . . . . . . . . . . . . . . . . . . . . . . . . 10.93% 10.47% 10.48% 10.31% 9.78%
Portfolio turnover rate . . . . . . . . . . . . . . . . . . . . . . . . . . . . . . . . . . . . . . . . . . 84% 76% 58% 63% 106%
(a) Total investment return is calculated assuming a purchase of shares on the first day and a sale on the last day of each year reported andincludes reinvestment of dividends and distributions.
F3

Financial HighlightsJennison Portfolio (formerly, Prudential Jennison Portfolio)
Class I Class II
Year EndedDecember 31, 2001 Year Ended
December 31,2001
February 10, 2000(a)through
December 31, 20002001 2000 1999 1998 1997
Per Share Operating Performance:Net Asset Value, beginning of period . . . . . . . . . . . $ 22.97 $ 32.39 $ 23.91 $ 17.73 $14.32 $22.88 $34.25
Income From Investment Operations:Net investment income (loss) . . . . . . . . . . . . . . . . . . 0.04 0.01 0.05 0.04 0.04 0.01 (0.03)Net realized and unrealized gains (losses) oninvestments . . . . . . . . . . . . . . . . . . . . . . . . . . . . . . (4.22) (5.61) 9.88 6.56 4.48 (4.25) (7.54)
Total from investment operations . . . . . . . . . . . (4.18) (5.60) 9.93 6.60 4.52 (4.24) (7.57)
Less Distributions:Dividends from net investment income . . . . . . . . . . (0.03) —(d) (0.05) (0.04) (0.04) —(d) —(d)Distributions from net realized gains . . . . . . . . . . . . (0.19) (3.82) (1.40) (0.38) (1.07) (0.19) (3.80)
Total distributions . . . . . . . . . . . . . . . . . . . . . . . . (0.22) (3.82) (1.45) (0.42) (1.11) (0.19) (3.80)
Net Asset Value, end of period . . . . . . . . . . . . . . . . . $ 18.57 $ 22.97 $ 32.39 $ 23.91 $17.73 $18.45 $22.88
Total Investment Return(b) . . . . . . . . . . . . . . . . . . (18.25)% (17.38)% 41.76% 37.46% 31.71% (18.60)% (22.19)%Ratios/Supplemental Data:Net assets, end of period (in millions) . . . . . . . . . . . $2,186.9 $2,892.7 $2,770.7 $1,198.7 $495.9 $ 59.6 $ 13.3Ratios to average net assets:Expenses . . . . . . . . . . . . . . . . . . . . . . . . . . . . . . . . 0.64% 0.64% 0.63% 0.63% 0.64% 1.04% 1.04%(c)Net investment income (loss) . . . . . . . . . . . . . . . . 0.18% 0.02% 0.17% 0.20% 0.25% (0.19)% (0.39)%(c)
Portfolio turnover rate . . . . . . . . . . . . . . . . . . . . . . . . 86% 89% 58% 54% 60% 86% 89%(e)
(a) Commencement of offering of Class II shares.
(b) Total investment return is calculated assuming a purchase of shares on the first day and a sale on the last day of each period reported andincludes reinvestment of dividends and distributions. Total investment returns for less than a full year are not annualized.
(c) Annualized.
(d) Less than $0.01 per share.
(e) Not annualized.
Money Market Portfolio
Year EndedDecember 31,
2001 2000 1999 1998 1997
Per Share Operating Performance:Net Asset Value, beginning of year . . . . . . . . . . . . . . . . . . . . . . . . . . . . . $ 10.00 $ 10.00 $ 10.00 $10.00 $10.00
Income From Investment Operations:Net investment income and realized and unrealized gains . . . . . . . . . . 0.41 0.60 0.49 0.52 0.54Dividend and distributions . . . . . . . . . . . . . . . . . . . . . . . . . . . . . . . . . . . . (0.41) (0.60) (0.49) (0.52) (0.54)
Net Asset Value, end of year . . . . . . . . . . . . . . . . . . . . . . . . . . . . . . . . . . $ 10.00 $ 10.00 $ 10.00 $10.00 $10.00
Total Investment Return(a) . . . . . . . . . . . . . . . . . . . . . . . . . . . . . . . . . . 4.22% 6.20% 4.97% 5.39% 5.41%Ratios/Supplemental Data:Net assets, end of year (in millions) . . . . . . . . . . . . . . . . . . . . . . . . . . . . $1,501.9 $1,238.2 $1,335.5 $920.2 $657.5Ratios to average net assets:Expenses . . . . . . . . . . . . . . . . . . . . . . . . . . . . . . . . . . . . . . . . . . . . . . . . 0.43% 0.44% 0.42% 0.41% 0.43%Net investment income . . . . . . . . . . . . . . . . . . . . . . . . . . . . . . . . . . . . . 3.86% 6.03% 4.90% 5.20% 5.28%
(a) Total investment return is calculated assuming a purchase on the first day and a sale on the last day of each year reported and includesreinvestment of dividends and distributions.
F4

Financial HighlightsStock Index Portfolio
Year EndedDecember 31,
2001 2000 1999 1998 1997
Per Share Operating Performance:Net Asset Value, beginning of year . . . . . . . . . . . . . . . . . . . . . . . . . . . . . . . . . . . . . . . . $ 38.66 $ 44.45 $ 37.74 $ 30.22 $ 23.74
Income from Investment Operations:Net investment income . . . . . . . . . . . . . . . . . . . . . . . . . . . . . . . . . . . . . . . . . . . . . . . . . . 0.36 0.36 0.44 0.42 0.43Net realized and unrealized gains (losses) on investments . . . . . . . . . . . . . . . . . . . . (5.05) (4.37) 7.23 8.11 7.34
Total from investment operations . . . . . . . . . . . . . . . . . . . . . . . . . . . . . . . . . . . . . . (4.69) (4.01) 7.67 8.53 7.77
Less Distributions:Dividends from net investment income . . . . . . . . . . . . . . . . . . . . . . . . . . . . . . . . . . . . . (0.35) (0.37) (0.43) (0.42) (0.42)Distributions from net realized gains . . . . . . . . . . . . . . . . . . . . . . . . . . . . . . . . . . . . . . . (1.98) (1.41) (0.53) (0.59) (0.87)
Total distributions . . . . . . . . . . . . . . . . . . . . . . . . . . . . . . . . . . . . . . . . . . . . . . . . . . (2.33) (1.78) (0.96) (1.01) (1.29)
Net Asset Value, end of year . . . . . . . . . . . . . . . . . . . . . . . . . . . . . . . . . . . . . . . . . . . . . $ 31.64 $ 38.66 $ 44.45 $ 37.74 $ 30.22
Total Investment Return(a) . . . . . . . . . . . . . . . . . . . . . . . . . . . . . . . . . . . . . . . . . . . . . (12.05)% (9.03)% 20.54% 28.42% 32.83%Ratios/Supplemental Data:Net assets, end of year (in millions) . . . . . . . . . . . . . . . . . . . . . . . . . . . . . . . . . . . . . . . $3,394.1 $4,186.0 $4,655.0 $3,548.1 $2,448.2Ratios to average net assets:Expenses . . . . . . . . . . . . . . . . . . . . . . . . . . . . . . . . . . . . . . . . . . . . . . . . . . . . . . . . . . . 0.39% 0.39% 0.39% 0.37% 0.37%Net investment income . . . . . . . . . . . . . . . . . . . . . . . . . . . . . . . . . . . . . . . . . . . . . . . . 1.02% 0.83% 1.09% 1.25% 1.55%
Portfolio turnover rate . . . . . . . . . . . . . . . . . . . . . . . . . . . . . . . . . . . . . . . . . . . . . . . . . . . 3% 7% 2% 3% 5%
(a) Total investment return is calculated assuming a purchase of shares on the first day and a sale on the last day of each year reported andincludes reinvestment of dividends and distributions.
Value Portfolio
Class I Class II
Year EndedDecember 31,
May 14, 2001(a)through
December 31,20012001 2000 1999 1998 1997
Per Share Operating Performance:Net Asset Value, beginning of period . . . . . . . . . . . . . . . . . . . . . . . . . . . . . $ 20.46 $ 19.52 $ 20.03 $ 22.39 $ 18.51 $19.79
Income From Investment Operations:Net investment income . . . . . . . . . . . . . . . . . . . . . . . . . . . . . . . . . . . . . . . . . 0.25 0.46 0.51 0.56 0.61 0.12Net realized and unrealized gains (losses) on investments . . . . . . . . . . . (0.69) 2.45 1.89 (1.03) 6.06 (1.01)
Total from investment operations . . . . . . . . . . . . . . . . . . . . . . . . . . . . (0.44) 2.91 2.40 (0.47) 6.67 (0.89)
Less Distributions:Dividends from net investment income . . . . . . . . . . . . . . . . . . . . . . . . . . . . (0.30) (0.44) (0.50) (0.59) (0.57) (0.14)Distributions from net realized gains . . . . . . . . . . . . . . . . . . . . . . . . . . . . . . (1.81) (1.53) (2.41) (1.30) (2.22) (0.85)
Total distributions . . . . . . . . . . . . . . . . . . . . . . . . . . . . . . . . . . . . . . . . . (2.11) (1.97) (2.91) (1.89) (2.79) (0.99)
Net Asset Value, end of period . . . . . . . . . . . . . . . . . . . . . . . . . . . . . . . . . . $ 17.91 $ 20.46 $ 19.52 $ 20.03 $ 22.39 $17.91
Total Investment Return(b) . . . . . . . . . . . . . . . . . . . . . . . . . . . . . . . . . . . . (2.08)% 15.59% 2.52% (2.38)% 36.61% (4.34)%Ratios/Supplemental Data:Net assets, end of period (in millions) . . . . . . . . . . . . . . . . . . . . . . . . . . . . . $1,801.4 $1,975.3 $2,024.0 $2,142.3 $2,029.8 $ 1.1Ratios to average net assets:Expenses . . . . . . . . . . . . . . . . . . . . . . . . . . . . . . . . . . . . . . . . . . . . . . . . . . 0.44% 0.45% 0.42% 0.42% 0.41% 0.84%(c)Net investment income . . . . . . . . . . . . . . . . . . . . . . . . . . . . . . . . . . . . . . . 1.32% 2.31% 2.34% 2.54% 2.90% 0.94%(c)
Portfolio turnover rate . . . . . . . . . . . . . . . . . . . . . . . . . . . . . . . . . . . . . . . . . . 175% 85% 16% 20% 38% 175%
(a) Commencement of offering of Class II shares.
(b) Total investment return is calculated assuming a purchase of shares on the first day and a sale on the last day of each year reported andincludes reinvestment of dividends and distributions. Total investment returns for periods of less than one full year are not annualized.
(c) Annualized.
F5
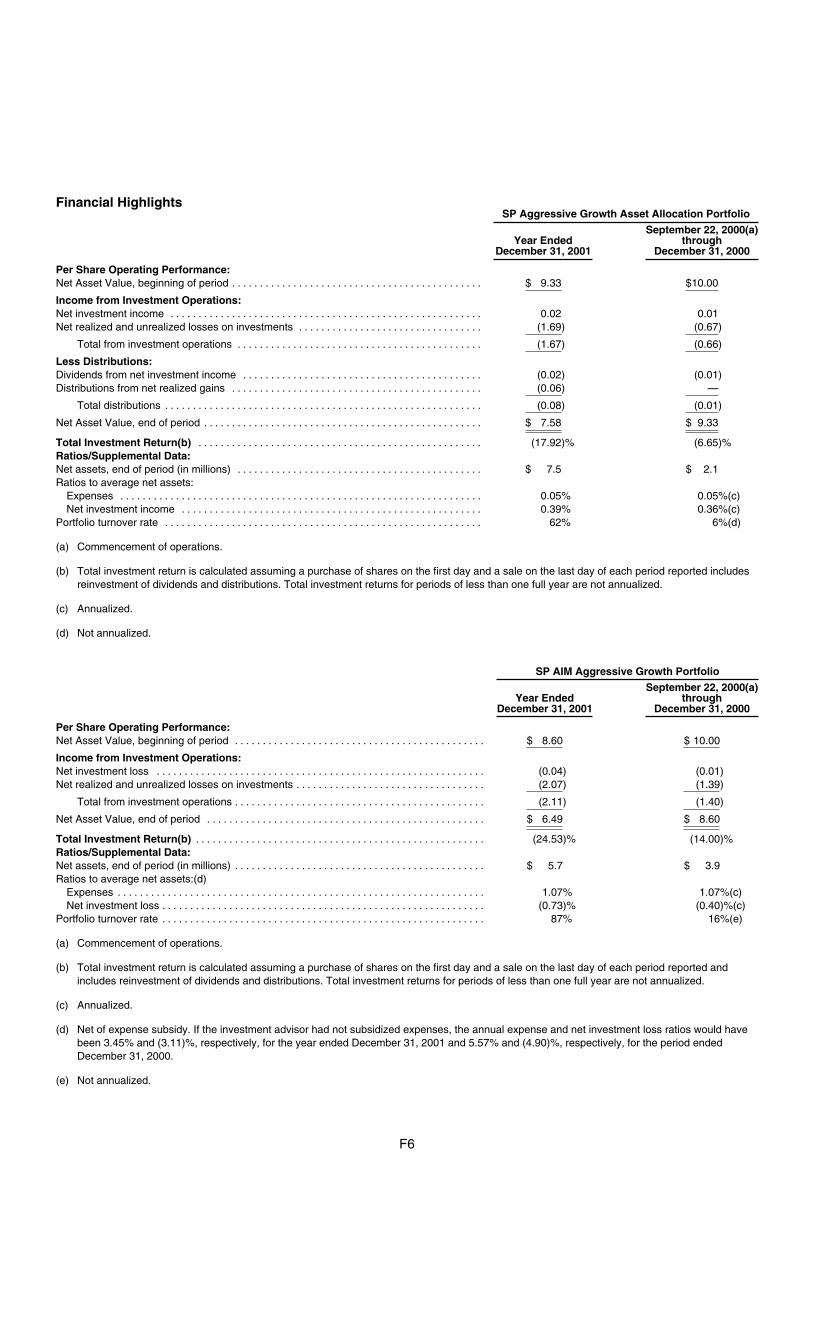
Financial HighlightsSP Aggressive Growth Asset Allocation Portfolio
Year EndedDecember 31, 2001
September 22, 2000(a)through
December 31, 2000
Per Share Operating Performance:Net Asset Value, beginning of period . . . . . . . . . . . . . . . . . . . . . . . . . . . . . . . . . . . . . . . . . . . . . $ 9.33 $10.00
Income from Investment Operations:Net investment income . . . . . . . . . . . . . . . . . . . . . . . . . . . . . . . . . . . . . . . . . . . . . . . . . . . . . . . . 0.02 0.01Net realized and unrealized losses on investments . . . . . . . . . . . . . . . . . . . . . . . . . . . . . . . . . (1.69) (0.67)
Total from investment operations . . . . . . . . . . . . . . . . . . . . . . . . . . . . . . . . . . . . . . . . . . . . (1.67) (0.66)
Less Distributions:Dividends from net investment income . . . . . . . . . . . . . . . . . . . . . . . . . . . . . . . . . . . . . . . . . . . (0.02) (0.01)Distributions from net realized gains . . . . . . . . . . . . . . . . . . . . . . . . . . . . . . . . . . . . . . . . . . . . . (0.06) —
Total distributions . . . . . . . . . . . . . . . . . . . . . . . . . . . . . . . . . . . . . . . . . . . . . . . . . . . . . . . . . (0.08) (0.01)
Net Asset Value, end of period . . . . . . . . . . . . . . . . . . . . . . . . . . . . . . . . . . . . . . . . . . . . . . . . . . $ 7.58 $ 9.33
Total Investment Return(b) . . . . . . . . . . . . . . . . . . . . . . . . . . . . . . . . . . . . . . . . . . . . . . . . . . . (17.92)% (6.65)%Ratios/Supplemental Data:Net assets, end of period (in millions) . . . . . . . . . . . . . . . . . . . . . . . . . . . . . . . . . . . . . . . . . . . . $ 7.5 $ 2.1Ratios to average net assets:Expenses . . . . . . . . . . . . . . . . . . . . . . . . . . . . . . . . . . . . . . . . . . . . . . . . . . . . . . . . . . . . . . . . . 0.05% 0.05%(c)Net investment income . . . . . . . . . . . . . . . . . . . . . . . . . . . . . . . . . . . . . . . . . . . . . . . . . . . . . . 0.39% 0.36%(c)
Portfolio turnover rate . . . . . . . . . . . . . . . . . . . . . . . . . . . . . . . . . . . . . . . . . . . . . . . . . . . . . . . . . 62% 6%(d)
(a) Commencement of operations.
(b) Total investment return is calculated assuming a purchase of shares on the first day and a sale on the last day of each period reported includesreinvestment of dividends and distributions. Total investment returns for periods of less than one full year are not annualized.
(c) Annualized.
(d) Not annualized.
SP AIM Aggressive Growth Portfolio
Year EndedDecember 31, 2001
September 22, 2000(a)through
December 31, 2000
Per Share Operating Performance:Net Asset Value, beginning of period . . . . . . . . . . . . . . . . . . . . . . . . . . . . . . . . . . . . . . . . . . . . . $ 8.60 $ 10.00
Income from Investment Operations:Net investment loss . . . . . . . . . . . . . . . . . . . . . . . . . . . . . . . . . . . . . . . . . . . . . . . . . . . . . . . . . . . (0.04) (0.01)Net realized and unrealized losses on investments . . . . . . . . . . . . . . . . . . . . . . . . . . . . . . . . . . (2.07) (1.39)
Total from investment operations . . . . . . . . . . . . . . . . . . . . . . . . . . . . . . . . . . . . . . . . . . . . . (2.11) (1.40)
Net Asset Value, end of period . . . . . . . . . . . . . . . . . . . . . . . . . . . . . . . . . . . . . . . . . . . . . . . . . . $ 6.49 $ 8.60
Total Investment Return(b) . . . . . . . . . . . . . . . . . . . . . . . . . . . . . . . . . . . . . . . . . . . . . . . . . . . . (24.53)% (14.00)%Ratios/Supplemental Data:Net assets, end of period (in millions) . . . . . . . . . . . . . . . . . . . . . . . . . . . . . . . . . . . . . . . . . . . . . $ 5.7 $ 3.9Ratios to average net assets:(d)Expenses . . . . . . . . . . . . . . . . . . . . . . . . . . . . . . . . . . . . . . . . . . . . . . . . . . . . . . . . . . . . . . . . . . 1.07% 1.07%(c)Net investment loss . . . . . . . . . . . . . . . . . . . . . . . . . . . . . . . . . . . . . . . . . . . . . . . . . . . . . . . . . . (0.73)% (0.40)%(c)
Portfolio turnover rate . . . . . . . . . . . . . . . . . . . . . . . . . . . . . . . . . . . . . . . . . . . . . . . . . . . . . . . . . . 87% 16%(e)
(a) Commencement of operations.
(b) Total investment return is calculated assuming a purchase of shares on the first day and a sale on the last day of each period reported andincludes reinvestment of dividends and distributions. Total investment returns for periods of less than one full year are not annualized.
(c) Annualized.
(d) Net of expense subsidy. If the investment advisor had not subsidized expenses, the annual expense and net investment loss ratios would havebeen 3.45% and (3.11)%, respectively, for the year ended December 31, 2001 and 5.57% and (4.90)%, respectively, for the period endedDecember 31, 2000.
(e) Not annualized.
F6
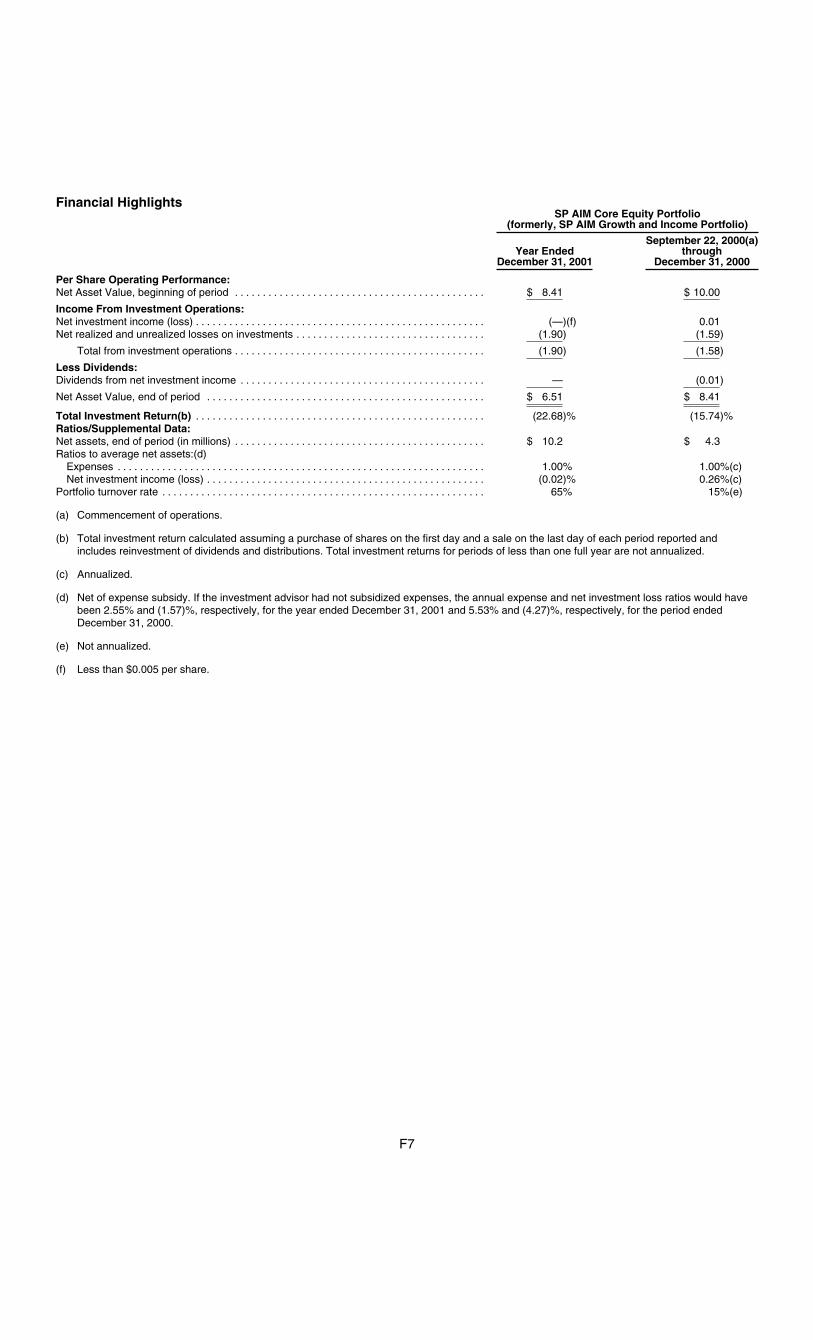
Financial HighlightsSP AIM Core Equity Portfolio
(formerly, SP AIM Growth and Income Portfolio)
Year EndedDecember 31, 2001
September 22, 2000(a)through
December 31, 2000
Per Share Operating Performance:Net Asset Value, beginning of period . . . . . . . . . . . . . . . . . . . . . . . . . . . . . . . . . . . . . . . . . . . . . $ 8.41 $ 10.00
Income From Investment Operations:Net investment income (loss) . . . . . . . . . . . . . . . . . . . . . . . . . . . . . . . . . . . . . . . . . . . . . . . . . . . . (—)(f) 0.01Net realized and unrealized losses on investments . . . . . . . . . . . . . . . . . . . . . . . . . . . . . . . . . . (1.90) (1.59)
Total from investment operations . . . . . . . . . . . . . . . . . . . . . . . . . . . . . . . . . . . . . . . . . . . . . (1.90) (1.58)
Less Dividends:Dividends from net investment income . . . . . . . . . . . . . . . . . . . . . . . . . . . . . . . . . . . . . . . . . . . . — (0.01)
Net Asset Value, end of period . . . . . . . . . . . . . . . . . . . . . . . . . . . . . . . . . . . . . . . . . . . . . . . . . . $ 6.51 $ 8.41
Total Investment Return(b) . . . . . . . . . . . . . . . . . . . . . . . . . . . . . . . . . . . . . . . . . . . . . . . . . . . . (22.68)% (15.74)%Ratios/Supplemental Data:Net assets, end of period (in millions) . . . . . . . . . . . . . . . . . . . . . . . . . . . . . . . . . . . . . . . . . . . . . $ 10.2 $ 4.3Ratios to average net assets:(d)Expenses . . . . . . . . . . . . . . . . . . . . . . . . . . . . . . . . . . . . . . . . . . . . . . . . . . . . . . . . . . . . . . . . . . 1.00% 1.00%(c)Net investment income (loss) . . . . . . . . . . . . . . . . . . . . . . . . . . . . . . . . . . . . . . . . . . . . . . . . . . (0.02)% 0.26%(c)
Portfolio turnover rate . . . . . . . . . . . . . . . . . . . . . . . . . . . . . . . . . . . . . . . . . . . . . . . . . . . . . . . . . . 65% 15%(e)
(a) Commencement of operations.
(b) Total investment return calculated assuming a purchase of shares on the first day and a sale on the last day of each period reported andincludes reinvestment of dividends and distributions. Total investment returns for periods of less than one full year are not annualized.
(c) Annualized.
(d) Net of expense subsidy. If the investment advisor had not subsidized expenses, the annual expense and net investment loss ratios would havebeen 2.55% and (1.57)%, respectively, for the year ended December 31, 2001 and 5.53% and (4.27)%, respectively, for the period endedDecember 31, 2000.
(e) Not annualized.
(f) Less than $0.005 per share.
F7

Financial HighlightsSP Alliance Large Cap Growth Portfolio
Year EndedDecember 31, 2001
September 22, 2000(a)through
December 31, 2000
Per Share Operating Performance:Net Asset Value, beginning of period . . . . . . . . . . . . . . . . . . . . . . . . . . . . . . . . . . . . . . . . . . . . . $ 8.55 $ 10.00
Income From Investment Operations:Net investment income (loss) . . . . . . . . . . . . . . . . . . . . . . . . . . . . . . . . . . . . . . . . . . . . . . . . . . . . (0.01) 0.01Net realized and unrealized losses on investments . . . . . . . . . . . . . . . . . . . . . . . . . . . . . . . . . . (1.23) (1.45)
Total from investment operations . . . . . . . . . . . . . . . . . . . . . . . . . . . . . . . . . . . . . . . . . . . . . (1.24) (1.44)
Less Distributions:Dividends from net investment income . . . . . . . . . . . . . . . . . . . . . . . . . . . . . . . . . . . . . . . . . . . . — (0.01)Tax return of capital distributions . . . . . . . . . . . . . . . . . . . . . . . . . . . . . . . . . . . . . . . . . . . . . . . . . —(f) —
Total distributions . . . . . . . . . . . . . . . . . . . . . . . . . . . . . . . . . . . . . . . . . . . . . . . . . . . . . . . . . —(f) (0.01)
Net Asset Value, end of period . . . . . . . . . . . . . . . . . . . . . . . . . . . . . . . . . . . . . . . . . . . . . . . . . . $ 7.31 $ 8.55
Total Investment Return(b) . . . . . . . . . . . . . . . . . . . . . . . . . . . . . . . . . . . . . . . . . . . . . . . . . . . . (14.47)% (14.44)%Ratios/Supplemental Data:Net assets, end of period (in millions) . . . . . . . . . . . . . . . . . . . . . . . . . . . . . . . . . . . . . . . . . . . . . $ 35.9 $ 7.1Ratios to average net assets:(d)Expenses . . . . . . . . . . . . . . . . . . . . . . . . . . . . . . . . . . . . . . . . . . . . . . . . . . . . . . . . . . . . . . . . . . 1.10% 1.10%(c)Net investment income (loss) . . . . . . . . . . . . . . . . . . . . . . . . . . . . . . . . . . . . . . . . . . . . . . . . . . (0.08)% 0.44%(c)
Portfolio turnover rate . . . . . . . . . . . . . . . . . . . . . . . . . . . . . . . . . . . . . . . . . . . . . . . . . . . . . . . . . . 47% 10%(e)
(a) Commencement of operations.
(b) Total investment return is calculated assuming a purchase of shares on the first day and a sale on the last day of each period reported andincludes reinvestment of dividends and distributions. Total investment returns for periods of less than one full year are not annualized.
(c) Annualized.
(d) Net of expense subsidy. If the investment advisor had not subsidized expenses, the annual expense and net investment loss ratios would havebeen 1.57% and (0.55)%, respectively, for the year ended December 31, 2001 and 4.26% and (2.72)%, respectively, for the period endedDecember 31, 2000.
(e) Not annualized.
(f) Less than $0.005 per share.
F8

Financial HighlightsSP Alliance Technology Portfolio
Year EndedDecember 31, 2001
September 22, 2000(a)through
December 31, 2000
Per Share Operating Performance:Net Asset Value, beginning of period . . . . . . . . . . . . . . . . . . . . . . . . . . . . . . . . . . . . . . . . . . . . . $ 7.62 $ 10.00
Income from Investment Operations:Net investment income (loss) . . . . . . . . . . . . . . . . . . . . . . . . . . . . . . . . . . . . . . . . . . . . . . . . . . . . (0.03) 0.01Net realized and unrealized losses on investments . . . . . . . . . . . . . . . . . . . . . . . . . . . . . . . . . . (1.88) (2.38)
Total from investment operations . . . . . . . . . . . . . . . . . . . . . . . . . . . . . . . . . . . . . . . . . . . . . (1.91) (2.37)
Less Distributions:Dividends from net investment income . . . . . . . . . . . . . . . . . . . . . . . . . . . . . . . . . . . . . . . . . . . . — (0.01)Distributions in excess of net investment income . . . . . . . . . . . . . . . . . . . . . . . . . . . . . . . . . . . — —(b)
Total distributions . . . . . . . . . . . . . . . . . . . . . . . . . . . . . . . . . . . . . . . . . . . . . . . . . . . . . . . . . — (0.01)
Net Asset Value, end of period . . . . . . . . . . . . . . . . . . . . . . . . . . . . . . . . . . . . . . . . . . . . . . . . . . $ 5.71 $ 7.62
Total Investment Return(c) . . . . . . . . . . . . . . . . . . . . . . . . . . . . . . . . . . . . . . . . . . . . . . . . . . . . (25.07)% (23.71)%Ratios/Supplemental Data:Net assets, end of period (in millions) . . . . . . . . . . . . . . . . . . . . . . . . . . . . . . . . . . . . . . . . . . . . . $ 7.7 $ 6.1Ratios to average net assets: (e)Expenses . . . . . . . . . . . . . . . . . . . . . . . . . . . . . . . . . . . . . . . . . . . . . . . . . . . . . . . . . . . . . . . . . . 1.30% 1.30%(d)Net investment income (loss) . . . . . . . . . . . . . . . . . . . . . . . . . . . . . . . . . . . . . . . . . . . . . . . . . . (0.69)% 0.37%(d)
Portfolio turnover rate . . . . . . . . . . . . . . . . . . . . . . . . . . . . . . . . . . . . . . . . . . . . . . . . . . . . . . . . . . 47% 23%(f)
(a) Commencement of operations.
(b) Less than $0.005 per share.
(c) Total investment return is calculated assuming a purchase of shares on the first day and a sale on the last day of each period reported andincludes reinvestment of dividends and distributions. Total investment returns for periods of less than one full year are not annualized.
(d) Annualized.
(e) Net of expense subsidy. If the investment advisor had not subsidized expenses, the annual expense and net investment loss ratios would havebeen 3.16% and (2.53)%, respectively, for the year ended December 31, 2001 and 4.66% and (2.99)%, respectively, for the period endedDecember 31, 2000.
(f) Not annualized.
SP Balanced Asset Allocation Portfolio
Year EndedDecember 31, 2001
September 22, 2000(a)through
December 31, 2000
Per Share Operating Performance:Net Asset Value, beginning of period . . . . . . . . . . . . . . . . . . . . . . . . . . . . . . . . . . . . . . . . . . . . . $ 9.80 $10.00
Income from Investment Operations:Net investment income . . . . . . . . . . . . . . . . . . . . . . . . . . . . . . . . . . . . . . . . . . . . . . . . . . . . . . . . . 0.14 0.06Net realized and unrealized losses on investments . . . . . . . . . . . . . . . . . . . . . . . . . . . . . . . . . . (0.73) (0.20)
Total from investment operations . . . . . . . . . . . . . . . . . . . . . . . . . . . . . . . . . . . . . . . . . . . . . (0.59) (0.14)
Less Distributions:Dividends from net investment income . . . . . . . . . . . . . . . . . . . . . . . . . . . . . . . . . . . . . . . . . . . . (0.14) (0.06)Distributions from net realized gains . . . . . . . . . . . . . . . . . . . . . . . . . . . . . . . . . . . . . . . . . . . . . . (0.05) —
Total distributions . . . . . . . . . . . . . . . . . . . . . . . . . . . . . . . . . . . . . . . . . . . . . . . . . . . . . . . . . (0.19) (0.06)
Net Asset Value, end of period . . . . . . . . . . . . . . . . . . . . . . . . . . . . . . . . . . . . . . . . . . . . . . . . . . $ 9.02 $ 9.80
Total Investment Return(b) . . . . . . . . . . . . . . . . . . . . . . . . . . . . . . . . . . . . . . . . . . . . . . . . . . . . (5.99)% (1.42)%Ratios/Supplemental Data:Net assets, end of period (in millions) . . . . . . . . . . . . . . . . . . . . . . . . . . . . . . . . . . . . . . . . . . . . . $ 66.1 $ 3.7Ratios to average net assets:Expenses . . . . . . . . . . . . . . . . . . . . . . . . . . . . . . . . . . . . . . . . . . . . . . . . . . . . . . . . . . . . . . . . . . 0.05% 0.05%(c)Net investment income . . . . . . . . . . . . . . . . . . . . . . . . . . . . . . . . . . . . . . . . . . . . . . . . . . . . . . . 3.26% 4.89%(c)
Portfolio turnover rate . . . . . . . . . . . . . . . . . . . . . . . . . . . . . . . . . . . . . . . . . . . . . . . . . . . . . . . . . . 35% 4%(d)
(a) Commencement of operations.
(b) Total investment return is calculated assuming a purchase of shares on the first day and a sale on the last day of each period reported andincludes reinvestment of dividends and distributions. Total investment returns for periods of less than one full year are not annualized.
(c) Annualized.
(d) Not annualized.
F9

Financial HighlightsSP Conservative Asset Allocation Portfolio
Year EndedDecember 31, 2001
September 22, 2000(a)through
December 31, 2000
Per Share Operating Performance:Net Asset Value, beginning of period . . . . . . . . . . . . . . . . . . . . . . . . . . . . . . . . . . . . . . . . . . . . . $10.00 $10.00
Income From Investment Operations:Net investment income . . . . . . . . . . . . . . . . . . . . . . . . . . . . . . . . . . . . . . . . . . . . . . . . . . . . . . . . . 0.21 0.08Net realized and unrealized gains (losses) on investments . . . . . . . . . . . . . . . . . . . . . . . . . . . (0.24) —(c)
Total from investment operations . . . . . . . . . . . . . . . . . . . . . . . . . . . . . . . . . . . . . . . . . . . . . (0.03) 0.08
Less Distributions:Dividends from net investment income . . . . . . . . . . . . . . . . . . . . . . . . . . . . . . . . . . . . . . . . . . . . (0.16) (0.08)Distributions from net realized gains . . . . . . . . . . . . . . . . . . . . . . . . . . . . . . . . . . . . . . . . . . . . . . (0.04) —(c)
Total distributions . . . . . . . . . . . . . . . . . . . . . . . . . . . . . . . . . . . . . . . . . . . . . . . . . . . . . . . . . (0.20) (0.08)
Net Asset Value, end of period . . . . . . . . . . . . . . . . . . . . . . . . . . . . . . . . . . . . . . . . . . . . . . . . . . $ 9.77 $10.00
Total Investment Return(b) . . . . . . . . . . . . . . . . . . . . . . . . . . . . . . . . . . . . . . . . . . . . . . . . . . . . (0.23)% 0.84%Ratios/Supplemental Data:Net assets, end of period (in millions) . . . . . . . . . . . . . . . . . . . . . . . . . . . . . . . . . . . . . . . . . . . . . $ 47.9 $ 1.9Ratios to average net assets:Expenses . . . . . . . . . . . . . . . . . . . . . . . . . . . . . . . . . . . . . . . . . . . . . . . . . . . . . . . . . . . . . . . . . . 0.05% 0.05%(d)Net investment income . . . . . . . . . . . . . . . . . . . . . . . . . . . . . . . . . . . . . . . . . . . . . . . . . . . . . . . 4.76% 8.07%(d)
Portfolio turnover rate . . . . . . . . . . . . . . . . . . . . . . . . . . . . . . . . . . . . . . . . . . . . . . . . . . . . . . . . . . 29% 4%(e)
(a) Commencement of operations.
(b) Total investment return is calculated assuming a purchase of shares on the first day and a sale on the last day of each period reported andincludes reinvestment of dividends and distributions. Total investment returns for periods of less than one full year are not annualized.
(c) Less than $0.005 per share.
(d) Annualized.
(e) Not annualized.
SP Davis Value Portfolio
Year EndedDecember 31, 2001
September 22, 2000(a)through
December 31, 2000
Per Share Operating Performance:Net Asset Value, beginning of period . . . . . . . . . . . . . . . . . . . . . . . . . . . . . . . . . . . . . . . . . . . . . $ 10.15 $10.00
Income from Investment Operations:Net investment income . . . . . . . . . . . . . . . . . . . . . . . . . . . . . . . . . . . . . . . . . . . . . . . . . . . . . . . . . 0.05 0.02Net realized and unrealized gains (losses) on investments . . . . . . . . . . . . . . . . . . . . . . . . . . . (1.11) 0.15
Total from investment operations . . . . . . . . . . . . . . . . . . . . . . . . . . . . . . . . . . . . . . . . . . . . . (1.06) 0.17
Less Dividends:Dividends from net investment income . . . . . . . . . . . . . . . . . . . . . . . . . . . . . . . . . . . . . . . . . . . . (0.05) (0.02)
Net Asset Value, end of period . . . . . . . . . . . . . . . . . . . . . . . . . . . . . . . . . . . . . . . . . . . . . . . . . . $ 9.04 $10.15
Total Investment Return(b) . . . . . . . . . . . . . . . . . . . . . . . . . . . . . . . . . . . . . . . . . . . . . . . . . . . . (10.46)% 1.69%Ratios/Supplemental Data:Net assets, end of period (in millions) . . . . . . . . . . . . . . . . . . . . . . . . . . . . . . . . . . . . . . . . . . . . . $ 94.4 $ 12.8Ratios to average net assets:(d)Expenses . . . . . . . . . . . . . . . . . . . . . . . . . . . . . . . . . . . . . . . . . . . . . . . . . . . . . . . . . . . . . . . . . . 0.83% 0.83%(c)Net investment income . . . . . . . . . . . . . . . . . . . . . . . . . . . . . . . . . . . . . . . . . . . . . . . . . . . . . . . 0.64% 1.48%(c)
Portfolio turnover rate . . . . . . . . . . . . . . . . . . . . . . . . . . . . . . . . . . . . . . . . . . . . . . . . . . . . . . . . . . 17% 3%(e)
(a) Commencement of operations.
(b) Total investment is calculated assuming a purchase of shares on the first day and a sale on the last day of each period reported and includesreinvestment of dividends and distributions. Total investment returns for periods of less than one full year are not annualized.
(c) Annualized.
(d) Net of expense subsidy. If the investment advisor had not subsidized expenses, the annual expense and net investment income (loss) ratioswould have been 1.03% and 0.43%, respectively, for the year ended December 31, 2001 and 3.16% and (0.85)%, respectively, for the periodended December 31, 2000.
(e) Not annualized.
F10

Financial HighlightsSP Deutsche International Equity Portfolio
Year EndedDecember 31, 2001
September 22, 2000(a)through
December 31, 2000
Per Share Operating Performance:Net Asset Value, beginning of period . . . . . . . . . . . . . . . . . . . . . . . . . . . . . . . . . . . . . . . . . . . . . $ 9.44 $10.00
Income From Investment Operations:Net investment income . . . . . . . . . . . . . . . . . . . . . . . . . . . . . . . . . . . . . . . . . . . . . . . . . . . . . . . . . 0.05 0.01Net realized and unrealized losses on investments . . . . . . . . . . . . . . . . . . . . . . . . . . . . . . . . . . (2.09) (0.57)
Total from investment operations . . . . . . . . . . . . . . . . . . . . . . . . . . . . . . . . . . . . . . . . . . . . . (2.04) (0.56)
Less Dividends:Dividends from net investment income . . . . . . . . . . . . . . . . . . . . . . . . . . . . . . . . . . . . . . . . . . . . (0.05) —
Net Asset Value, end of period . . . . . . . . . . . . . . . . . . . . . . . . . . . . . . . . . . . . . . . . . . . . . . . . . . $ 7.35 $ 9.44
Total Investment Return(c) . . . . . . . . . . . . . . . . . . . . . . . . . . . . . . . . . . . . . . . . . . . . . . . . . . . . (22.07)% (5.20)%Ratios/Supplemental Data:Net assets, end of period (in millions) . . . . . . . . . . . . . . . . . . . . . . . . . . . . . . . . . . . . . . . . . . . . . $ 24.7 $ 7.8Ratios to average net assets:(e)Expenses . . . . . . . . . . . . . . . . . . . . . . . . . . . . . . . . . . . . . . . . . . . . . . . . . . . . . . . . . . . . . . . . . . 1.10% 1.10%(d)Net investment income . . . . . . . . . . . . . . . . . . . . . . . . . . . . . . . . . . . . . . . . . . . . . . . . . . . . . . . 0.61% 0.55%(d)
Portfolio turnover rate . . . . . . . . . . . . . . . . . . . . . . . . . . . . . . . . . . . . . . . . . . . . . . . . . . . . . . . . . . 155% 51%(f)
(a) Commencement of operations.
(b) Less than $0.01 per share.
(c) Total investment return is calculated assuming a purchase of shares on the first day and a sale on the last day of each period reported andincludes reinvestment of dividends and distributions. Total investment returns for periods of less than one full year are not annualized.
(d) Annualized.
(e) Net of expense subsidy. If the investment advisor had not subsidized expenses, the annual expense and net investment loss ratios would havebeen 3.27% and (1.56)%, respectively, for the year ended December 31, 2001 and 4.21% and (2.56)%, respectively, for the period endedDecember 31, 2000.
(f) Not annualized.
SP Growth Asset Allocation Portfolio
Year EndedDecember 31, 2001
September 22, 2000(a)through
December 31, 2000
Per Share Operating Performance:Net Asset Value, beginning of period . . . . . . . . . . . . . . . . . . . . . . . . . . . . . . . . . . . . . . . . . . . . . $ 9.52 $10.00
Income from Investment Operations:Net investment income . . . . . . . . . . . . . . . . . . . . . . . . . . . . . . . . . . . . . . . . . . . . . . . . . . . . . . . . . 0.09 0.03Net realized and unrealized losses on investments . . . . . . . . . . . . . . . . . . . . . . . . . . . . . . . . . . (1.21) (0.49)
Total from investment operations . . . . . . . . . . . . . . . . . . . . . . . . . . . . . . . . . . . . . . . . . . . . . (1.12) (0.46)
Less Distributions:Dividends from net investment income . . . . . . . . . . . . . . . . . . . . . . . . . . . . . . . . . . . . . . . . . . . . (0.08) (0.02)Distributions from net realized gains . . . . . . . . . . . . . . . . . . . . . . . . . . . . . . . . . . . . . . . . . . . . . . (0.05) —
Total distributions . . . . . . . . . . . . . . . . . . . . . . . . . . . . . . . . . . . . . . . . . . . . . . . . . . . . . . . . . (0.13) (0.02)
Net Asset Value, end of period . . . . . . . . . . . . . . . . . . . . . . . . . . . . . . . . . . . . . . . . . . . . . . . . . . $ 8.27 $ 9.52
Total Investment Return(b) . . . . . . . . . . . . . . . . . . . . . . . . . . . . . . . . . . . . . . . . . . . . . . . . . . . . (11.77)% (4.56)%Ratios/Supplemental Data:Net assets, end of period (in millions) . . . . . . . . . . . . . . . . . . . . . . . . . . . . . . . . . . . . . . . . . . . . . $ 46.8 $ 3.9Ratios to average net assets:Expenses . . . . . . . . . . . . . . . . . . . . . . . . . . . . . . . . . . . . . . . . . . . . . . . . . . . . . . . . . . . . . . . . . . 0.05% 0.05%(c)Net investment income . . . . . . . . . . . . . . . . . . . . . . . . . . . . . . . . . . . . . . . . . . . . . . . . . . . . . . . 1.71% 2.95%(c)
Portfolio turnover rate . . . . . . . . . . . . . . . . . . . . . . . . . . . . . . . . . . . . . . . . . . . . . . . . . . . . . . . . . . 43% 39%(d)
(a) Commencement of operations.
(b) Total investment return is calculated assuming a purchase of shares on the first day and a sale on the last day of each period reported andincludes reinvestment of dividends and distributions. Total investment returns for periods of less than one full year are not annualized.
(c) Annualized
(d) Not annualized.
F11

Financial HighlightsSP INVESCO Small Company Growth Portfolio
Year EndedDecember 31, 2001
September 22, 2000(a)through
December 31, 2000
Per Share Operating Performance:Net Asset Value, beginning of period . . . . . . . . . . . . . . . . . . . . . . . . . . . . . . . . . . . . . . . . . . . . . $ 8.38 $ 10.00
Income From Investment Operations:Net investment loss . . . . . . . . . . . . . . . . . . . . . . . . . . . . . . . . . . . . . . . . . . . . . . . . . . . . . . . . . . . (0.02) —(f)Net realized and unrealized losses on investments . . . . . . . . . . . . . . . . . . . . . . . . . . . . . . . . . . (1.42) (1.62)
Total from investment operations . . . . . . . . . . . . . . . . . . . . . . . . . . . . . . . . . . . . . . . . . . . . . (1.44) (1.62)
Net Asset Value, end of period . . . . . . . . . . . . . . . . . . . . . . . . . . . . . . . . . . . . . . . . . . . . . . . . . . $ 6.94 $ 8.38
Total Investment Return(b) . . . . . . . . . . . . . . . . . . . . . . . . . . . . . . . . . . . . . . . . . . . . . . . . . . . . (17.18)% (16.20)%Ratios/Supplemental Data:Net assets, end of period (in millions) . . . . . . . . . . . . . . . . . . . . . . . . . . . . . . . . . . . . . . . . . . . . . $ 8.4 $ 5.5Ratios to average net assets:(d)Expenses . . . . . . . . . . . . . . . . . . . . . . . . . . . . . . . . . . . . . . . . . . . . . . . . . . . . . . . . . . . . . . . . . . 1.15% 1.15%(c)Net investment loss . . . . . . . . . . . . . . . . . . . . . . . . . . . . . . . . . . . . . . . . . . . . . . . . . . . . . . . . . . (0.28)% (0.10)%(c)
Portfolio turnover rate . . . . . . . . . . . . . . . . . . . . . . . . . . . . . . . . . . . . . . . . . . . . . . . . . . . . . . . . . . 83% 29%(e)
(a) Commencement of operations.
(b) Total investment return is calculated assuming a purchase of shares on the first day and a sale on the last day of each period reported andincludes reinvestment of dividends and distributions. Total investment returns for periods of less than one full year are not annualized.
(c) Annualized.
(d) Net of expense subsidy. If the investment advisor had not subsidized expenses, the annual expense and net investment loss ratios would havebeen 2.84% and (1.97)%, respectively, for the year ended December 31, 2001 and 4.00% and (2.95)%, respectively, for the period endedDecember 31, 2000.
(e) Not annualized.
(f) Less than $0.005 per share.
F12

Financial Highlights
SP Jennison International Growth Portfolio
Class I Class II
Year EndedDecember 31, 2001(i)
September 22, 2000(a)through
December 31, 2000Year Ended
December 31, 2001(i)
October 4, 2000(b)through
December 31, 2000
Per Share Operating Performance:Net Asset Value, beginning of period . . . $ 8.50 $ 10.00 $ 8.48 $ 9.79
Income from Investment Operations:Net investment income (loss) . . . . . . . . . 0.02 0.01 (—)(g) (—)(g)Net realized and unrealized losses oninvestments . . . . . . . . . . . . . . . . . . . . . (3.05) (1.51) (3.04) (1.31)
Total from investment operations . . (3.03) (1.50) (3.04) (1.31)
Less Distributions:Tax return of capital distributions . . . . . . (0.02) — (0.01) —
Net Asset Value, end of period . . . . . . . . $ 5.45 $ 8.50 $ 5.43 $ 8.48
Total Investment Return(c) . . . . . . . . . (35.64)% (15.00)% (35.92)% (13.28)%Ratios/Supplemental Data:Net assets, end of period (in millions) . . $ 19.9 $ 7.6 $ 14.9 $ 2.7Ratios to average net assets:(e)Expenses . . . . . . . . . . . . . . . . . . . . . . . 1.24% 1.24%(d) 1.64% 1.64%(d)Net investment income (loss) . . . . . . . 0.31%(h) 0.51%(d) (0.03)%(h) (—)%(d)
Portfolio turnover rate . . . . . . . . . . . . . . . 86% 12%(f) 86% 12%(f)
(a) Commencement of offering of Class I shares.
(b) Commencement of offering of Class II shares.
(c) Total investment return is calculated assuming a purchase of shares on the first day and a sale on the last day of each period reported andincludes reinvestment of dividends and distributions. Total investment returns for periods of less than one full year are not annualized.
(d) Annualized.
(e) Net of expense subsidy. If the investment advisor had not subsidized expenses, the annual expense and net investment loss ratios would havebeen 1.86% and (0.30)%, respectively, for Class I and 2.26% and (0.66)%, respectively, for Class II for the year ended December 31, 2001 and3.44% and (1.69)%, respectively, for Class I and 3.84% and (2.20)%, respectively, for Class II for the period ended December 31, 2000.
(f) Not annualized.
(g) Less than $0.005 per share.
(h) Includes custodian fee credits of 0.12% for Class I and 0.13% for Class II. If the Portfolio had not earned custodian fee credits, the annual netinvestment income (loss) ratios would have been 0.19% and (0.16)%, respectively, for Class I and Class II for the year ended December 31,2001.
(i) Calculated based upon weighted average shares outstanding during the year.
F13

Financial HighlightsSP Large Cap Value Portfolio
Year EndedDecember 31, 2001
September 22, 2000(a)through
December 31, 2000
Per Share Operating Performance:Net Asset Value, beginning of period . . . . . . . . . . . . . . . . . . . . . . . . . . . . . . . . . . . . . . . . . . . . . . . . $10.44 $10.00
Income from Investment Operations:Net investment income . . . . . . . . . . . . . . . . . . . . . . . . . . . . . . . . . . . . . . . . . . . . . . . . . . . . . . . . . . . 0.09 0.04Net realized and unrealized gains (losses) on investments . . . . . . . . . . . . . . . . . . . . . . . . . . . . . . (0.99) 0.44
Total from investment operations . . . . . . . . . . . . . . . . . . . . . . . . . . . . . . . . . . . . . . . . . . . . . . . (0.90) 0.48
Less Distributions:Dividends from net investment income . . . . . . . . . . . . . . . . . . . . . . . . . . . . . . . . . . . . . . . . . . . . . . (0.10) (0.04)Distributions in excess of net investment income . . . . . . . . . . . . . . . . . . . . . . . . . . . . . . . . . . . . . . — —(e)
Total distributions . . . . . . . . . . . . . . . . . . . . . . . . . . . . . . . . . . . . . . . . . . . . . . . . . . . . . . . . . . . . (0.10) (0.04)
Net Asset Value, end of period . . . . . . . . . . . . . . . . . . . . . . . . . . . . . . . . . . . . . . . . . . . . . . . . . . . . . $ 9.44 $10.44
Total Investment Return(b) . . . . . . . . . . . . . . . . . . . . . . . . . . . . . . . . . . . . . . . . . . . . . . . . . . . . . . (8.65)% 4.82%Ratios/Supplemental Data:Net assets, end of period (in millions) . . . . . . . . . . . . . . . . . . . . . . . . . . . . . . . . . . . . . . . . . . . . . . . $ 23.7 $ 3.9Ratios to average net assets:(d)Expenses . . . . . . . . . . . . . . . . . . . . . . . . . . . . . . . . . . . . . . . . . . . . . . . . . . . . . . . . . . . . . . . . . . . . 0.90% 0.90%(c)Net investment income . . . . . . . . . . . . . . . . . . . . . . . . . . . . . . . . . . . . . . . . . . . . . . . . . . . . . . . . . 1.18% 1.60%(c)
Portfolio turnover rate . . . . . . . . . . . . . . . . . . . . . . . . . . . . . . . . . . . . . . . . . . . . . . . . . . . . . . . . . . . . 61% 13%(f)
(a) Commencement of operations.
(b) Total investment return is calculated assuming a purchase of shares on the first day and a sale on the last day of each period reported andincludes reinvestment of dividends and distributions. Total investment returns for periods of less than one full year are not annualized.
(c) Annualized.
(d) Net of expense subsidy. If the investment advisor had not subsidized expenses, the annual expense and net investment income (loss) ratioswould have been 1.98% and 0.10%, respectively, for the year ended December 31, 2001 and 5.47% and (2.97)%, respectively, for the periodended December 31, 2000.
(e) Less than $0.005 per share.
(f) Not annualized.
F14

Financial HighlightsSP MFS Capital Opportunities Portfolio
Year EndedDecember 31, 2001
September 22, 2000(a)through
December 31, 2000
Per Share Operating Performance:Net Asset Value, beginning of period . . . . . . . . . . . . . . . . . . . . . . . . . . . . . . . . . . . . . . . . . . . . . . . . $ 9.15 $10.00
Income From Investment Operations:Net investment income (loss) . . . . . . . . . . . . . . . . . . . . . . . . . . . . . . . . . . . . . . . . . . . . . . . . . . . . . . (—)(f) 0.01Net realized and unrealized losses on investments . . . . . . . . . . . . . . . . . . . . . . . . . . . . . . . . . . . . (2.13) (0.85)
Total from investment operations . . . . . . . . . . . . . . . . . . . . . . . . . . . . . . . . . . . . . . . . . . . . . . . (2.13) (0.84)
Less Dividends:Dividends from net investment income . . . . . . . . . . . . . . . . . . . . . . . . . . . . . . . . . . . . . . . . . . . . . . (0.01) (0.01)
Net Asset Value, end of period . . . . . . . . . . . . . . . . . . . . . . . . . . . . . . . . . . . . . . . . . . . . . . . . . . . . . $ 7.01 $ 9.15
Total Investment Return(b) . . . . . . . . . . . . . . . . . . . . . . . . . . . . . . . . . . . . . . . . . . . . . . . . . . . . . . (23.28)% (8.39)%Ratios/Supplemental Data:Net assets, end of period (in millions) . . . . . . . . . . . . . . . . . . . . . . . . . . . . . . . . . . . . . . . . . . . . . . . $ 8.2 $ 4.3Ratios to average net assets:(d)Expenses . . . . . . . . . . . . . . . . . . . . . . . . . . . . . . . . . . . . . . . . . . . . . . . . . . . . . . . . . . . . . . . . . . . . 1.00% 1.00%(c)Net investment income (loss) . . . . . . . . . . . . . . . . . . . . . . . . . . . . . . . . . . . . . . . . . . . . . . . . . . . . (—)%(g) 0.40%(c)
Portfolio turnover rate . . . . . . . . . . . . . . . . . . . . . . . . . . . . . . . . . . . . . . . . . . . . . . . . . . . . . . . . . . . . 99% 25%(e)
(a) Commencement of operations.
(b) Total investment return is calculated assuming a purchase of shares on the first day and a sale on the last day of each period reported andincludes reinvestment of dividends and distributions. Total investment returns for periods of less than one full year are not annualized.
(c) Annualized.
(d) Net of expense subsidy. If the investment advisor had not subsidized expenses, the annual expense and net investment loss ratios would havebeen 3.04% and (2.04)%, respectively, for the year ended December 31, 2001 and 5.48% and (4.08)%, respectively, for the period endedDecember 31, 2000.
(e) Not annualized.
(f) Less than $0.005 per share.
(g) Less than 0.005%.
SP MFS Mid-Cap Growth Portfolio
Year EndedDecember 31, 2001
September 22, 2000(a)through
December 31, 2000
Per Share Operating Performance:Net Asset Value, beginning of period . . . . . . . . . . . . . . . . . . . . . . . . . . . . . . . . . . . . . . . . . . . . . . . . $ 9.69 $10.00
Income from Investment Operations:Net investment income (loss) . . . . . . . . . . . . . . . . . . . . . . . . . . . . . . . . . . . . . . . . . . . . . . . . . . . . . . (0.01) 0.02Net realized and unrealized losses on investments . . . . . . . . . . . . . . . . . . . . . . . . . . . . . . . . . . . . (2.01) (0.25)
Total from investment operations . . . . . . . . . . . . . . . . . . . . . . . . . . . . . . . . . . . . . . . . . . . . . . . (2.02) (0.23)
Less Distributions:Dividends from net investment income . . . . . . . . . . . . . . . . . . . . . . . . . . . . . . . . . . . . . . . . . . . . . . (0.01) (0.02)Distributions from net realized gains . . . . . . . . . . . . . . . . . . . . . . . . . . . . . . . . . . . . . . . . . . . . . . . . (0.04) (0.06)
Total distributions . . . . . . . . . . . . . . . . . . . . . . . . . . . . . . . . . . . . . . . . . . . . . . . . . . . . . . . . . . . . (0.05) (0.08)
Net Asset Value, end of period . . . . . . . . . . . . . . . . . . . . . . . . . . . . . . . . . . . . . . . . . . . . . . . . . . . . . $ 7.62 $ 9.69
Total Investment Return(b) . . . . . . . . . . . . . . . . . . . . . . . . . . . . . . . . . . . . . . . . . . . . . . . . . . . . . . (20.93)% (2.26)%Ratios/Supplemental Data:Net assets, end of period (in millions) . . . . . . . . . . . . . . . . . . . . . . . . . . . . . . . . . . . . . . . . . . . . . . . $ 15.9 $ 5.6Ratios to average net assets:(d)Expenses . . . . . . . . . . . . . . . . . . . . . . . . . . . . . . . . . . . . . . . . . . . . . . . . . . . . . . . . . . . . . . . . . . . . 1.00% 1.00%(c)Net investment income (loss) . . . . . . . . . . . . . . . . . . . . . . . . . . . . . . . . . . . . . . . . . . . . . . . . . . . . (0.20)% 1.16%(c)
Portfolio turnover rate . . . . . . . . . . . . . . . . . . . . . . . . . . . . . . . . . . . . . . . . . . . . . . . . . . . . . . . . . . . . 93% 27%(e)
(a) Commencement of operations.
(b) Total investment return is calculated assuming a purchase of shares on the first day and a sale on the last day of each period reported andincludes reinvestment of dividends and distributions. Total investment returns for periods of less than one full year are not annualized.
(c) Annualized.
(d) Net of expense subsidy. If the investment advisor had not subsidized expenses, the annual expense and net investment loss ratios would havebeen 2.11% and (1.31)%, respectively, for the year ended December 31, 2001 and 4.59% and (2.43)%, respectively, for the period endedDecember 31, 2000.
(e) Not annualized.
F15

Financial Highlights
SP PIMCO High Yield Portfolio
Year EndedDecember 31, 2001
September 22, 2000(a)through
December 31, 2000
Per Share Operating Performance:Net Asset Value, beginning of period . . . . . . . . . . . . . . . . . . . . . . . . . . . . . . . . . . . . . . . . . . . . . . . . $10.02 $10.00
Income from Investment Operations:Net investment income . . . . . . . . . . . . . . . . . . . . . . . . . . . . . . . . . . . . . . . . . . . . . . . . . . . . . . . . . . . 0.59 0.17Net realized and unrealized gains (losses) on investments . . . . . . . . . . . . . . . . . . . . . . . . . . . . . . (0.21) 0.02
Total from investment operations . . . . . . . . . . . . . . . . . . . . . . . . . . . . . . . . . . . . . . . . . . . . . . . 0.38 0.19
Less Distributions:Dividends from net investment income . . . . . . . . . . . . . . . . . . . . . . . . . . . . . . . . . . . . . . . . . . . . . . (0.59) (0.16)Distributions from net realized gains . . . . . . . . . . . . . . . . . . . . . . . . . . . . . . . . . . . . . . . . . . . . . . . . — (0.01)Distributions in excess of net realized capital gains . . . . . . . . . . . . . . . . . . . . . . . . . . . . . . . . . . . . — —(d)
Total distributions . . . . . . . . . . . . . . . . . . . . . . . . . . . . . . . . . . . . . . . . . . . . . . . . . . . . . . . . . . . . (0.59) (0.17)
Net Asset Value, end of period . . . . . . . . . . . . . . . . . . . . . . . . . . . . . . . . . . . . . . . . . . . . . . . . . . . . . $ 9.81 $10.02
Total Investment Return(b) . . . . . . . . . . . . . . . . . . . . . . . . . . . . . . . . . . . . . . . . . . . . . . . . . . . . . . 3.97% 1.94%Ratios/Supplemental Data:Net assets, end of period (in millions) . . . . . . . . . . . . . . . . . . . . . . . . . . . . . . . . . . . . . . . . . . . . . . . $ 52.0 $ 8.0Ratios to average net assets:(e)Expenses . . . . . . . . . . . . . . . . . . . . . . . . . . . . . . . . . . . . . . . . . . . . . . . . . . . . . . . . . . . . . . . . . . . . 0.82% 0.82%(c)Net investment income . . . . . . . . . . . . . . . . . . . . . . . . . . . . . . . . . . . . . . . . . . . . . . . . . . . . . . . . . 7.44% 7.78%(c)
Portfolio turnover rate . . . . . . . . . . . . . . . . . . . . . . . . . . . . . . . . . . . . . . . . . . . . . . . . . . . . . . . . . . . . 105% 88%(f)
(a) Commencement of operations.
(b) Total investment return is calculated assuming a purchase of shares on the first day and a sale on the last day of each period reported andincludes reinvestment of dividends and distributions. Total investment returns for periods of less than one full year are not annualized.
(c) Annualized.
(d) Less than $0.005 per share.
(e) Net of expense subsidy. If the investment advisor had not subsidized expenses, the annual expense and net investment income ratios wouldhave been 1.08% and 7.18%, respectively, for the year ended December 31, 2001 and 3.42% and 5.18%, respectively, for the period endedDecember 31, 2000.
(f) Not annualized.
F16

Financial HighlightsSP PIMCO Total Return Portfolio
Year EndedDecember 31, 2001
September 22, 2000(a)through
December 31, 2000
Per Share Operating Performance:Net Asset Value, beginning of period . . . . . . . . . . . . . . . . . . . . . . . . . . . . . . . . . . . . . . . . . . . . . . . . $10.40 $10.00
Income From Investment Operations:Net investment income . . . . . . . . . . . . . . . . . . . . . . . . . . . . . . . . . . . . . . . . . . . . . . . . . . . . . . . . . . . 0.32 0.13Net realized and unrealized gains on investments . . . . . . . . . . . . . . . . . . . . . . . . . . . . . . . . . . . . . 0.57 0.39
Total from investment operations . . . . . . . . . . . . . . . . . . . . . . . . . . . . . . . . . . . . . . . . . . . . . . . 0.89 0.52
Less Distributions:Dividends from net investment income . . . . . . . . . . . . . . . . . . . . . . . . . . . . . . . . . . . . . . . . . . . . . . (0.34) (0.11)Distributions from net realized gains . . . . . . . . . . . . . . . . . . . . . . . . . . . . . . . . . . . . . . . . . . . . . . . . (0.25) (0.01)
Total distributions . . . . . . . . . . . . . . . . . . . . . . . . . . . . . . . . . . . . . . . . . . . . . . . . . . . . . . . . . . . . (0.59) (0.12)
Net Asset Value, end of period . . . . . . . . . . . . . . . . . . . . . . . . . . . . . . . . . . . . . . . . . . . . . . . . . . . . . $10.70 $10.40
Total Investment Return(b) . . . . . . . . . . . . . . . . . . . . . . . . . . . . . . . . . . . . . . . . . . . . . . . . . . . . . . 8.66% 5.18%Ratios/Supplemental Data:Net assets, end of period (in millions) . . . . . . . . . . . . . . . . . . . . . . . . . . . . . . . . . . . . . . . . . . . . . . . $147.0 $ 10.7Ratios to average net assets(d):Expenses . . . . . . . . . . . . . . . . . . . . . . . . . . . . . . . . . . . . . . . . . . . . . . . . . . . . . . . . . . . . . . . . . . . . 0.76% 0.76%(c)Net investment income . . . . . . . . . . . . . . . . . . . . . . . . . . . . . . . . . . . . . . . . . . . . . . . . . . . . . . . . . 3.69% 5.94%(c)
Portfolio turnover rate . . . . . . . . . . . . . . . . . . . . . . . . . . . . . . . . . . . . . . . . . . . . . . . . . . . . . . . . . . . . 718% 239%(e)
(a) Commencement of operations.
(b) Total investment return is calculated assuming a purchase of shares on the first day and a sale on the last day of each period reported andincludes reinvestment of dividends and distributions. Total investment returns for periods of less than one full year are not annualized.
(c) Annualized.
(d) Net of expense subsidy. If the investment advisor had not subsidized expenses, the annual expense and net investment income ratios wouldhave been 0.82% and 3.63%, respectively, for the year ended December 31, 2001 and 2.73% and 3.97%, respectively, for the period endedDecember 31, 2000.
(e) Not annualized.
SP Prudential U.S. Emerging Growth Portfolio
Class I Class II
Year EndedDecember 31, 2001
September 22, 2000(a)through
December 31, 2000
July 9, 2001(b)through
December 31, 2001
Per Share Operating Performance:Net Asset Value, beginning of period . . . . . . . . . . . . . . . . . . . . . . . . . . . . . . . . . $ 8.38 $ 10.00 $ 7.56
Income from Investment Operations:Net investment income (loss) . . . . . . . . . . . . . . . . . . . . . . . . . . . . . . . . . . . . . . . (0.01) 0.01 (0.01)Net realized and unrealized losses on investments . . . . . . . . . . . . . . . . . . . . . (1.48) (1.62) (0.67)
Total from investment operations . . . . . . . . . . . . . . . . . . . . . . . . . . . . . . . . (1.49) (1.61) (0.68)
Less Dividends:Dividends from net investment income . . . . . . . . . . . . . . . . . . . . . . . . . . . . . . . — (0.01) —
Net Asset Value, end of period . . . . . . . . . . . . . . . . . . . . . . . . . . . . . . . . . . . . . . $ 6.89 $ 8.38 $ 6.88
Total Investment Return(c) . . . . . . . . . . . . . . . . . . . . . . . . . . . . . . . . . . . . . . . . (17.78)% (16.11)% (8.99)%Ratios/Supplemental Data:Net assets, end of period (in millions) . . . . . . . . . . . . . . . . . . . . . . . . . . . . . . . . $ 31.2 $ 6.4 $ 0.2Ratios to average net assets:(d)Expenses . . . . . . . . . . . . . . . . . . . . . . . . . . . . . . . . . . . . . . . . . . . . . . . . . . . . . 0.90% 0.90%(e) 1.30%(e)Net investment income (loss) . . . . . . . . . . . . . . . . . . . . . . . . . . . . . . . . . . . . . (0.37)% 0.49%(e) (0.87)%(e)
Portfolio turnover rate . . . . . . . . . . . . . . . . . . . . . . . . . . . . . . . . . . . . . . . . . . . . . 258% 82%(f) 258%(f)
(a) Commencement of operations.
(b) Commencement of offering of Class II shares.
(c) Total investment return is calculated assuming a purchase of shares on the first day and a sale on the last day of each period reported andincludes reinvestment of dividends and distributions. Total investment returns for periods of less than one full year are not annualized.
(d) Net of expense subsidy. If the investment advisor had not subsidized expenses, the annual expense and net investment loss ratios would havebeen 1.41% and (0.88)%, respectively, for Class I and 1.81% and (1.38)%, respectively, for Class II for the period ended December 31, 2001and 4.26% and (2.87)%, respectively, for Class I for the period ended December 31, 2000.
(e) Annualized.
(f) Not annualized.
F17

Financial Highlights
SP Small/Mid Cap Value Portfolio
Year EndedDecember 31, 2001
September 22, 2000(a)through
December 31, 2000
Per Share Operating Performance:Net Asset Value, beginning of period . . . . . . . . . . . . . . . . . . . . . . . . . . . . . . . . . . . . . . . . . . . . . . . . . . . . $11.13 $10.00
Income From Investment Operations:Net investment income . . . . . . . . . . . . . . . . . . . . . . . . . . . . . . . . . . . . . . . . . . . . . . . . . . . . . . . . . . . . . . . . 0.08 0.03Net realized and unrealized gains on investments . . . . . . . . . . . . . . . . . . . . . . . . . . . . . . . . . . . . . . . . . . 0.26 1.10
Total from investment operations . . . . . . . . . . . . . . . . . . . . . . . . . . . . . . . . . . . . . . . . . . . . . . . . . . . . 0.34 1.13
Less Dividends:Dividends from net investment income . . . . . . . . . . . . . . . . . . . . . . . . . . . . . . . . . . . . . . . . . . . . . . . . . . . (0.11) —(b)
Net Asset Value, end of period . . . . . . . . . . . . . . . . . . . . . . . . . . . . . . . . . . . . . . . . . . . . . . . . . . . . . . . . . $11.36 $11.13
Total Investment Return(c) . . . . . . . . . . . . . . . . . . . . . . . . . . . . . . . . . . . . . . . . . . . . . . . . . . . . . . . . . . . 3.11% 11.33%Ratios/Supplemental Data:Net assets, end of period (in millions) . . . . . . . . . . . . . . . . . . . . . . . . . . . . . . . . . . . . . . . . . . . . . . . . . . . . $ 47.4 $ 6.1Ratios to average net assets:(e)Expenses . . . . . . . . . . . . . . . . . . . . . . . . . . . . . . . . . . . . . . . . . . . . . . . . . . . . . . . . . . . . . . . . . . . . . . . . . 1.05% 1.05%(d)Net investment income . . . . . . . . . . . . . . . . . . . . . . . . . . . . . . . . . . . . . . . . . . . . . . . . . . . . . . . . . . . . . . 1.08% 1.79%(d)
Portfolio turnover rate . . . . . . . . . . . . . . . . . . . . . . . . . . . . . . . . . . . . . . . . . . . . . . . . . . . . . . . . . . . . . . . . . 89% 18%(f)
(a) Commencement of operations.
(b) Less than $0.005 per share.
(c) Total investment return is calculated assuming a purchase of shares on the first day and a sale on the last day of each period reported andincludes reinvestment of dividends and distributions. Total investment returns for periods of less than one full year are not annualized.
(d) Annualized.
(e) Net of expense subsidy. If the investment advisor had not subsidized expenses, the annual expense and net investment income (loss) ratioswould have been 1.56% and 0.57%, respectively, for the year ended December 31, 2001 and 4.84% and (2.00)%, respectively, for the periodended December 31, 2000.
(f) Not annualized.
F18
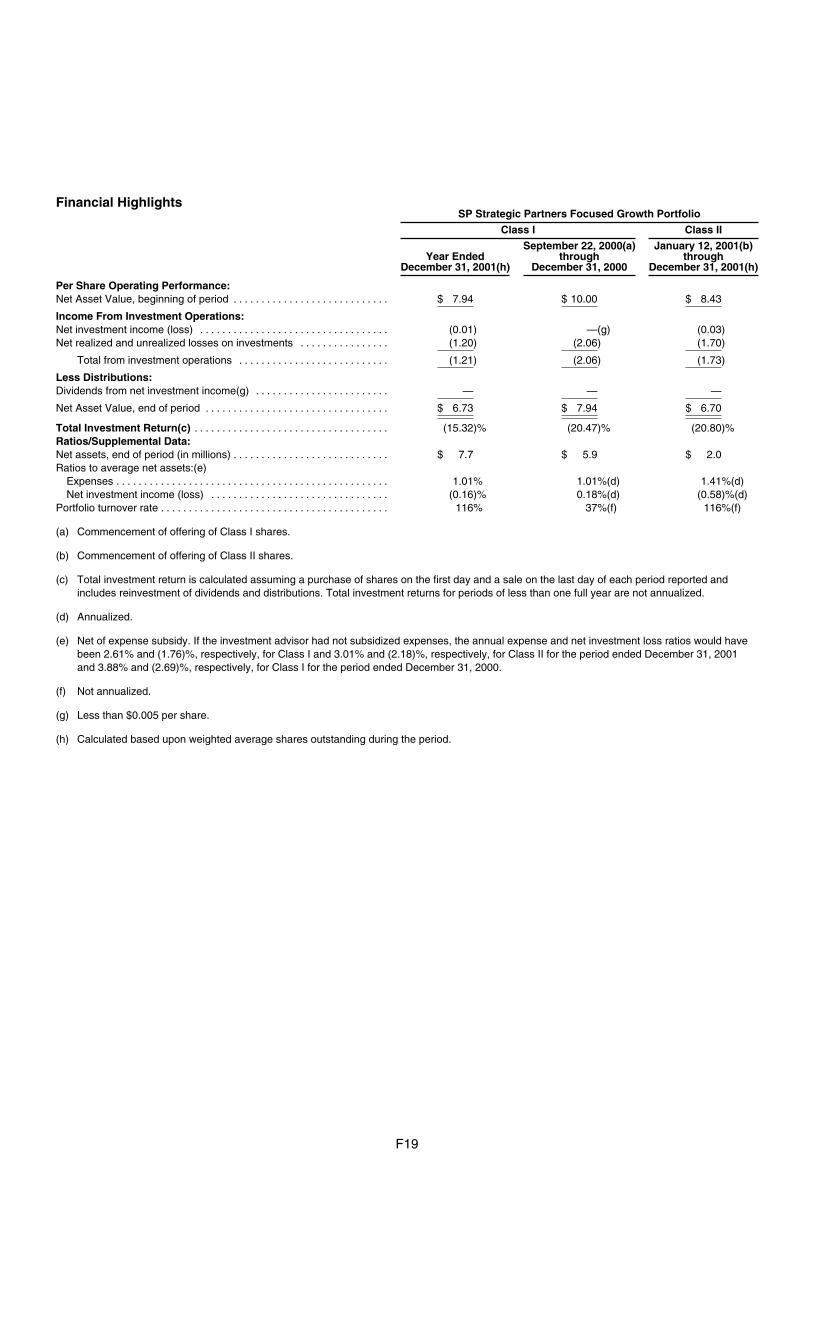
Financial HighlightsSP Strategic Partners Focused Growth Portfolio
Class I Class II
Year EndedDecember 31, 2001(h)
September 22, 2000(a)through
December 31, 2000
January 12, 2001(b)through
December 31, 2001(h)
Per Share Operating Performance:Net Asset Value, beginning of period . . . . . . . . . . . . . . . . . . . . . . . . . . . . $ 7.94 $ 10.00 $ 8.43
Income From Investment Operations:Net investment income (loss) . . . . . . . . . . . . . . . . . . . . . . . . . . . . . . . . . . (0.01) —(g) (0.03)Net realized and unrealized losses on investments . . . . . . . . . . . . . . . . (1.20) (2.06) (1.70)
Total from investment operations . . . . . . . . . . . . . . . . . . . . . . . . . . . (1.21) (2.06) (1.73)
Less Distributions:Dividends from net investment income(g) . . . . . . . . . . . . . . . . . . . . . . . . — — —
Net Asset Value, end of period . . . . . . . . . . . . . . . . . . . . . . . . . . . . . . . . . $ 6.73 $ 7.94 $ 6.70
Total Investment Return(c) . . . . . . . . . . . . . . . . . . . . . . . . . . . . . . . . . . . (15.32)% (20.47)% (20.80)%Ratios/Supplemental Data:Net assets, end of period (in millions) . . . . . . . . . . . . . . . . . . . . . . . . . . . . $ 7.7 $ 5.9 $ 2.0Ratios to average net assets:(e)Expenses . . . . . . . . . . . . . . . . . . . . . . . . . . . . . . . . . . . . . . . . . . . . . . . . . 1.01% 1.01%(d) 1.41%(d)Net investment income (loss) . . . . . . . . . . . . . . . . . . . . . . . . . . . . . . . . (0.16)% 0.18%(d) (0.58)%(d)
Portfolio turnover rate . . . . . . . . . . . . . . . . . . . . . . . . . . . . . . . . . . . . . . . . . 116% 37%(f) 116%(f)
(a) Commencement of offering of Class I shares.
(b) Commencement of offering of Class II shares.
(c) Total investment return is calculated assuming a purchase of shares on the first day and a sale on the last day of each period reported andincludes reinvestment of dividends and distributions. Total investment returns for periods of less than one full year are not annualized.
(d) Annualized.
(e) Net of expense subsidy. If the investment advisor had not subsidized expenses, the annual expense and net investment loss ratios would havebeen 2.61% and (1.76)%, respectively, for Class I and 3.01% and (2.18)%, respectively, for Class II for the period ended December 31, 2001and 3.88% and (2.69)%, respectively, for Class I for the period ended December 31, 2000.
(f) Not annualized.
(g) Less than $0.005 per share.
(h) Calculated based upon weighted average shares outstanding during the period.
F19

For more information
Additional information about the Fund and each Portfolio can be obtained upon request without charge and can befound in the following documents:
Statement of Additional Information (SAI)
(incorporated by reference into this prospectus)
Annual Report
(including a discussion of market conditions and strategies that significantly affected the Portfolios’ performance duringthe previous year)
Semi-Annual Report
To obtain these documents or to ask any questions about the Fund:
Call toll-free (800) 778-2255
Write to The Prudential Series Fund, Inc., Gateway Center Three, 100 Mulberry Street, Newark, NJ 07102
You can also obtain copies of Fund documents from the Securities and Exchange Commission as follows:
By Mail:
Securities and Exchange CommissionPublic Reference SectionWashington, DC 20549-0102
By Electronic Request:
[email protected](The SEC charges a fee to copy documents.)
In Person:
Public Reference Roomin Washington, DC(For hours of operation, call 1-202-942-8090)
Via the Internet:on the EDGAR Database athttp://www.sec.gov
SEC File No. 811-03623

AIM˛
AIM V.I. PREMIER EQUITY FUND---------------------------------------------------------------------------------------------------------------
Series I SharesShares of the fund are currently offered only to insurance company separate accounts.AIM V.I. Premier Equity Fund seeks to achieve long-term growth of capital. Income is a secondaryobjective.
ProspectusMay 1, 2002
This prospectus contains important information about theSeries I class shares (‘‘Series I shares’’) of the fund. Pleaseread it before investing and keep it for future reference.
As with all other mutual fund securities, the Securities andExchange Commission has not approved or disapprovedthese securities or determined whether the information inthis prospectus is adequate or accurate. Anyone who tells youotherwise is committing a crime.
An investment in the fund:) is not FDIC insured;) may lose value; and) is not guaranteed by a bank.
Invest with DISCIPLINE˛

AIMSUP2 Ed. 12-02
AIM VARIABLE INSURANCE FUNDS
AIM V.I. PREMIER EQUITY FUND
(Series I shares)
Supplement dated December 31, 2002 to the Prospectus dated May 1, 2002
Effective December 31, 2002, the following paragraph replaces in its entirety the first paragraph under the heading “FUND MANAGEMENT – Portfolio Managers” on page 3 of the prospectus:
• Evan G. Harrel (lead manager), Senior Portfolio Manager, who has been responsible for the fund since 1998 and has been associated with the advisor and/or its affiliates since 1998. From 1994 to 1998, he was Vice President and portfolio manager of Van Kampen American Capital Asset Management, Inc. and portfolio manager for various growth and equity funds.
• Robert A. Shelton, Senior Portfolio Manager, who has been responsible for the fund since 1997
and has been associated with the advisor and/or its affiliates since 1995.
They are assisted by the Premier Equity Team. More information on the fund’s management team may be found on our website (http://www.aimfunds.com).

A I M V . I . P R E M I E R E Q U I T Y F U N D
Table of ContentsInvestment Objectives and Strategies 1
Principal Risks of Investing in the Fund 1
Performance Information 2
Annual Total Returns 2
Performance Table 2
Fund Management 3
The Advisor 3
Advisor Compensation 3
Portfolio Managers 3
Other Information 4
Purchase and Redemption of Shares 4
Pricing of Shares 4
Taxes 4
Dividends and Distributions 4
Share Classes 4
Financial Highlights 5
Obtaining Additional Information Back Cover
The AIM Family of Funds, The AIM Family of Funds and Design No dealer, salesperson or any other person has been authorized(i.e., the AIM logo), AIM and Design, AIM, AIM Funds, AIM to give any information or to make any representations otherFunds and Design, AIM Investor, AIM LINK, AIM Institutional than those contained in this prospectus, and you should not relyFunds, aimfunds.com, La Familia AIM de Fondos, La Familia AIM on such other information or representations.de Fondos and Design, Invierta con DISCIPLINA and Invest withDISCIPLINE are registered service marks and AIM BankConnection, AIM Internet Connect, AIM Private Asset Manage-ment, AIM Private Asset Management and Design, AIM stylizedand/or Design, AIM Alternative Assets and Design, myaim.com,The AIM College Savings Plan, AIM Solo 401(k) and AIM LifetimeAmerica are service marks of A I M Management Group Inc.

A I M V . I . P R E M I E R E Q U I T Y F U N D
Investment Objectives and StrategiesThe fund’s investment objective is to achieve long-term growth of early but tangible evidence of improving prospects that are notcapital. Income is a secondary objective. The investment objec- yet reflected in the price of the company’s equity securities; andtive and policies of the fund may be changed by the Board of (4) companies whose equity securities are selling at prices thatTrustees without shareholder approval do not reflect the current market value of their assets and where
The fund seeks to meet its objectives by investing, normally, at there is reason to expect realization of this potential in the formleast 80% of its net assets, plus the amount of any borrowings of increased equity values. The portfolio managers considerfor investment purposes, in equity securities, including convert- whether to sell a particular security when they believe theible securities. In complying with this 80% investment require- company no longer fits into any of the above categories.ment, the fund’s investments may include synthetic instruments. In anticipation of or in response to adverse market or otherSynthetic instruments are investments that have economic char- conditions, or atypical circumstances such as unusually largeacteristics similar to the fund’s direct investments, and may cash inflows or redemptions, the fund may temporarily hold allinclude warrants, futures, options, exchange-traded funds and or a portion of its assets in cash or the following liquid assets:American Depositary Receipts. The fund also may invest in money market instruments, shares of affiliated money marketpreferred stocks and debt instruments that have prospects for funds or high-quality debt obligations. As a result, the fund maygrowth of capital. The fund also may invest up to 25% of its total not achieve its investment objective. For cash managementassets in foreign securities. Any percentage limitations with purposes, the fund may also hold a portion of its assets in cashrespect to the assets of the fund are applied at the time of or such liquid assets.purchase. A larger cash position or liquid assets could also detract from
The portfolio managers focus on undervalued equity securities the achievement of the funds’ objective(s), but could alsoof (1) out-of-favor cyclical growth companies; (2) established reduce the funds’ exposure in the event of a market downturn.growth companies that are undervalued compared to historical Any percentage limitations with respect to assets of the fund arerelative valuation parameters; (3) companies where there is applied at the time of purchase.
Principal Risks of Investing in the FundThere is a risk that you could lose all or a portion of your
) Markets—The securities markets of other countries areinvestment in the fund and that the income you may receive from
smaller than U.S. securities markets. As a result, many foreignyour investment may vary. The value of your investment in the
securities may be less liquid and more volatile thanfund will go up and down with the prices of the securities in
U.S. securities.which the fund invests. The price of equity securities change inresponse to many factors, including the historical and prospec- These factors may affect the prices of securities issued bytive earnings of the issuer, the value of its assets, general foreign companies located in developing countries more thaneconomic conditions, interest rates, investor perceptions and those in countries with mature economies. For example, manymarket liquidity. developing countries have, in the past, experienced high rates of
The prices of foreign securities may be further affected by inflation or sharply devaluated their currencies against theother factors, including: U.S. dollar, thereby causing the value of investments in compa-
nies located in those countries to decline. Transaction costs are) Currency exchange rates—The dollar value of the fund’s
often higher in developing countries and there may be delays inforeign investments will be affected by changes in the exchange
settlement procedures.rates between the dollar and the currencies in which those
To the extent the fund holds cash or liquid assets rather thaninvestments are traded.
equity securities, the fund may not achieve its investment) Political and economic conditions—The value of the fund’s objective.
foreign investments may be adversely affected by political and If the seller of a repurchase agreement in which the fundsocial instability in their home countries and by changes in invests defaults on its obligation or declares bankruptcy, the fundeconomic or taxation policies in those countries. may experience delays in selling the securities underlying the
repurchase agreement. As a result, the fund may incur losses) Regulations—Foreign companies generally are subject to less
arising from decline in the value of those securities, reducedstringent regulations, including financial and accounting con-
levels of income and expenses of enforcing its rights.trols, than are U.S. companies. As a result, there generally isless publicly available information about foreign companiesthan about U.S. companies.
1

A I M V . I . P R E M I E R E Q U I T Y F U N D
Performance InformationThe bar chart and table shown below provide an indication of the risks of investing in the fund. The fund’s past performance is notnecessarily an indication of its future performance. All performance shown assumes the reinvestment of dividends and capital gains. Thebar chart and performance table shown do not reflect charges at the separate rate account level; if they did, the performance shown wouldbe lower.
ANNUAL TOTAL RETURNS
The following bar chart shows changes in the performance of the fund’s shares from year to year.
-40
-20
0
20
40
60
80%
12/31/0112/31/0012/31/9912/31/9812/31/9712/31/9612/31/9512/31/94
36.25%32.41% 29.90%
-14.65% -12.56%
23.69%15.02%
4.04%
During the periods shown in the bar chart, the highest quarterly return was 27.04% (quarter ended December 31, 1998) and the lowestquarterly return was -15.58% (quarter ended September 30, 2001).
PERFORMANCE TABLEThe following performance table compares the fund’s performance to that of a broad-based securities market index.
Average Annual Total Returns
(for the periods Since Inceptionended December 31, 2001) 1 Year 5 Years Inception Date
AIM V.I. Premier Equity Fund (12.56)% 9.69% 13.41% 05/05/93
Standard & Poor’s 500 Index(1) (11.88)% 10.70% 13.85%(2) 04/30/93(2)
(1) The Standard & Poor’s 500 Index is an unmanaged index of common stocks frequently used as a general measure of U.S. stock market performance.(2) The average annual total return given is since the date closest to the inception date of the fund’s Series I shares.
2

A I M V . I . P R E M I E R E Q U I T Y F U N D
Fund ManagementTHE ADVISOR PORTFOLIO MANAGERSA I M Advisors, Inc. (the advisor) serves as the fund’s investment The advisor uses a team approach to investment management.advisor. The advisor is located at 11 Greenway Plaza, Suite 100, The individual members of the team who are primarily responsi-Houston, Texas 77046-1173. The advisor supervises all aspects ble for the day-to-day management of the fund’s portfolio areof the fund’s operations and provides investment advisory as follows:services to the fund, including obtaining and evaluating eco-
) Joel E. Dobberpuhl, Senior Portfolio Manager, who has beennomic, statistical and financial information to formulate and
responsible for the fund since 1993, and has been associatedimplement investment programs for the fund.
with the advisor and/or its affiliates since 1990.The advisor has acted as an investment advisor since its
organization in 1976. Today, the advisor, together with its ) Evan G. Harrel, Senior Portfolio Manager, who has beensubsidiaries, advises or manages over 150 investment portfolios, responsible for the fund since 1998 and has been associatedincluding the fund, encompassing a broad range of investment with the advisor and/or its affiliates since 1998. From 1994 toobjectives. 1998, he was Vice President and portfolio manager of Van
Kampen American Capital Asset Management, Inc. and portfo-ADVISOR COMPENSATION
lio manager for various growth and equity funds.During the fund’s fiscal year ended December 31, 2001, the
) Robert A. Shelton, Senior Portfolio Manager, who has beenadvisor received compensation of 0.60% of the fund’s averageresponsible for the fund since 1997 and has been associateddaily net assets.with the advisor and/or its affiliates since 1995.
3

A I M V . I . P R E M I E R E Q U I T Y F U N D
Other InformationPURCHASE AND REDEMPTION OF SHARES security, the fund may value the security at its fair value as
determined in good faith by or under the supervision of theThe fund ordinarily effects orders to purchase and redeemBoard of Trustees. The effect of using fair value pricing is that theshares at the fund’s next computed net asset value after itfund’s net asset value will be subject to the judgment of thereceives an order. Life insurance companies participating in theBoard of Trustees or its designee instead of being determined byfund serve as the fund’s designee for receiving orders ofthe market. Because the fund may invest in securities that areseparate accounts that invest in the fund.primarily listed on foreign exchanges, the value of the fund’sShares of the fund are offered in connection with mixed andshares may change on days when the separate account will notshared funding, i.e., to separate accounts of affiliated andbe able to purchase or redeem shares. The fund determines theunaffiliated life insurance companies funding variable annuitynet asset value of its shares as of the close of the customarycontracts and variable life insurance policies. The fund currentlytrading session of the NYSE on each day the NYSE is open foroffers shares only to insurance company separate accounts. Inbusiness.the future, the fund may offer them to pension and retirement
plans that qualify for special federal income tax treatment. Due todifferences in tax treatment and other considerations, the TAXESinterests of variable contract owners investing in separate
The amount, timing and character of distributions to the separateaccounts investing in the fund, and the interests of plan
account may be affected by special tax rules applicable toparticipants investing in the fund, may conflict.
certain investments purchased by the fund. Holders of variableMixed and shared funding may present certain conflicts of
contracts should refer to the prospectus for their contracts forinterest. For example, violation of the federal tax laws by one
information regarding the tax consequences of owning suchseparate account investing in a fund could cause owners of
contracts and should consult their tax advisors before investing.contracts and policies funded through another separate accountto lose their tax-deferred status, unless remedial actions weretaken. The Board of Trustees of the fund will monitor for the DIVIDENDS AND DISTRIBUTIONSexistence of any material conflicts and determine what action, if
Dividendsany, should be taken. A fund’s net asset value could decrease if
The fund generally declares and pays dividends, if any, annuallyit had to sell investment securities to pay redemption proceeds
to separate accounts of participating life insurance companies.to a separate account (or plan) withdrawing because of a
Capital Gains Distributionsconflict.The fund generally distributes long-term and short-term capitalgains, if any, annually to separate accounts of participating life
PRICING OF SHARES insurance companies.The fund prices its shares based on its net asset value. The fund At the election of participating life insurance companies,values portfolio securities for which market quotations are dividends and distributions are automatically reinvested at netreadily available at market value. The fund values short-term asset value in shares of the fund.investments maturing within 60 days at amortized cost, whichapproximates market value. The fund values all other securities
SHARE CLASSESand assets at their fair value. Securities and other assets quotedThe fund has two classes of shares, Series I and Series II. Eachin foreign currencies are valued in U.S. dollars based on theclass is identical except that Series II has a distribution plan orprevailing exchange rates on that day. In addition, if, between the‘‘Rule 12b-1 Plan’’ that is described in the prospectus relatingtime trading ends on a particular security and the close of theto the Series II shares.customary trading session of the New York Stock Exchange
(NYSE), events occur that materially affect the value of the
4
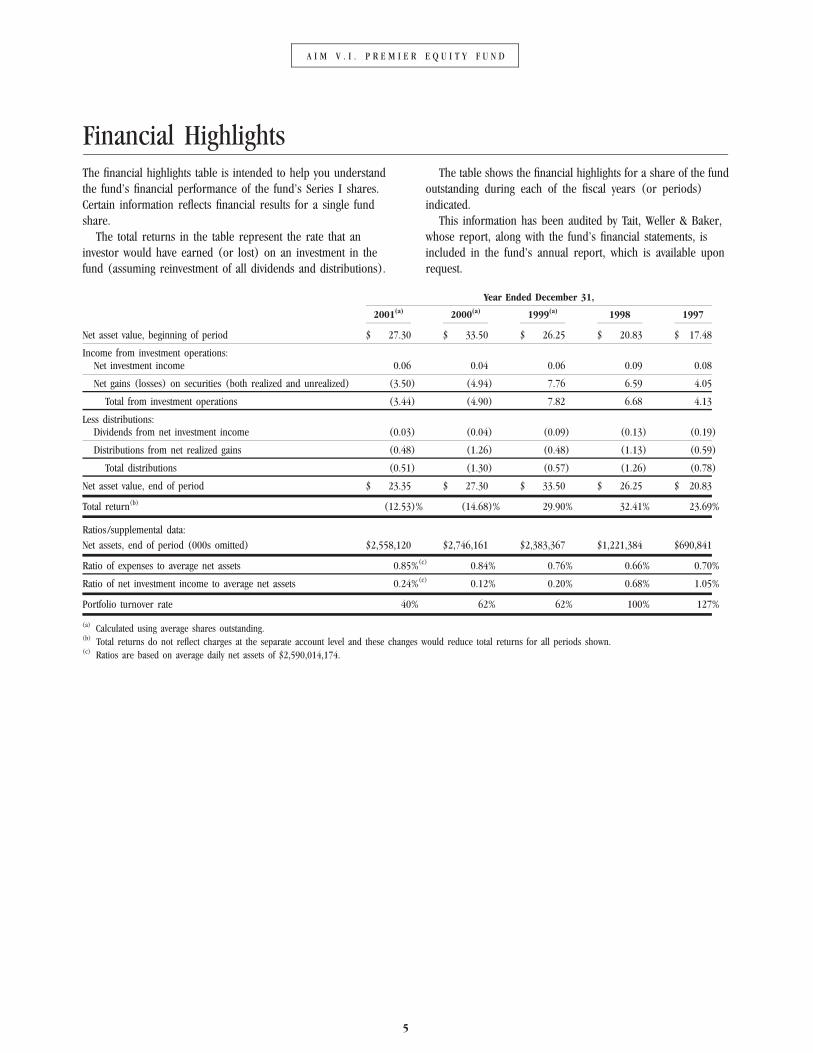
A I M V . I . P R E M I E R E Q U I T Y F U N D
Financial HighlightsThe financial highlights table is intended to help you understand The table shows the financial highlights for a share of the fundthe fund’s financial performance of the fund’s Series I shares. outstanding during each of the fiscal years (or periods)Certain information reflects financial results for a single fund indicated.share. This information has been audited by Tait, Weller & Baker,
The total returns in the table represent the rate that an whose report, along with the fund’s financial statements, isinvestor would have earned (or lost) on an investment in the included in the fund’s annual report, which is available uponfund (assuming reinvestment of all dividends and distributions). request.
Year Ended December 31,
2001(a) 2000(a) 1999(a) 1998 1997
Net asset value, beginning of period $ 27.30 $ 33.50 $ 26.25 $ 20.83 $ 17.48
Income from investment operations:Net investment income 0.06 0.04 0.06 0.09 0.08
Net gains (losses) on securities (both realized and unrealized) (3.50) (4.94) 7.76 6.59 4.05
Total from investment operations (3.44) (4.90) 7.82 6.68 4.13
Less distributions:Dividends from net investment income (0.03) (0.04) (0.09) (0.13) (0.19)
Distributions from net realized gains (0.48) (1.26) (0.48) (1.13) (0.59)
Total distributions (0.51) (1.30) (0.57) (1.26) (0.78)
Net asset value, end of period $ 23.35 $ 27.30 $ 33.50 $ 26.25 $ 20.83
Total return(b) (12.53)% (14.68)% 29.90% 32.41% 23.69%
Ratios /supplemental data:Net assets, end of period (000s omitted) $2,558,120 $2,746,161 $2,383,367 $1,221,384 $690,841
Ratio of expenses to average net assets 0.85%(c) 0.84% 0.76% 0.66% 0.70%
Ratio of net investment income to average net assets 0.24%(c) 0.12% 0.20% 0.68% 1.05%
Portfolio turnover rate 40% 62% 62% 100% 127%
(a) Calculated using average shares outstanding.(b) Total returns do not reflect charges at the separate account level and these changes would reduce total returns for all periods shown.(c) Ratios are based on average daily net assets of $2,590,014,174.
5

A I M V . I . P R E M I E R E Q U I T Y F U N D
Obtaining Additional InformationMore information may be obtained free of charge upon request.The Statement of Additional Information (SAI), a current versionof which is on file with the Securities and Exchange Commis-sion (SEC), contains more details about the fund and isincorporated by reference into the prospectus (is legally a part ofthis prospectus). Annual and semiannual reports to sharehold-ers contain additional information about the fund’s investments.The fund’s annual report also discusses the market conditionsand investment strategies that significantly affected the fund’sperformance during its last fiscal year.
If you wish to obtain free copies of the fund’s current SAI,please send a written request to A I M Distributors, Inc.,11 Greenway Plaza, Suite 100, Houston, Texas 77046-1173 orcall (800) 410-4246.
You also can review and obtain copies of the fund’s SAI,reports and other information at the SEC’s Public ReferenceRoom in Washington, DC; on the EDGAR database on the SEC’sInternet website (http://www.sec.gov); or, after paying a dupli-cation fee, by sending a letter to the SEC’s Public ReferenceSection, Washington, DC 20549-0102 or by sending an electronicmail request to [email protected]. Please call the SEC at1-202-942-8090 for information about the Public ReferenceRoom.
AIM V.I. Premier Equity FundSEC 1940 Act file number: 811-7452
www.aimfunds.com Invest with DISCIPLINE˛

CLASS I May 1, 2002
VP Value Fund
The Securities and ExchangeCommission has not approved ordisapproved these securities ordetermined if this Prospectus isaccurate or complete. Anyonewho tells you otherwise iscommitting a crime.
American Century Investment Services, Inc.
Your American Century prospectus
VP_Value_I_ 4/14/02 5:56 PM Page iii

Table of ContentsAn Overview of the Fund . . . . . . . . . . . . . . . . . . . . . . . . . . . . . . . . . . . . . . . . . . .2
Fund Performance History . . . . . . . . . . . . . . . . . . . . . . . . . . . . . . . . . . . . . . . . . .3
Objectives, Strategies and Risks . . . . . . . . . . . . . . . . . . . . . . . . . . . . . . . . . . . . .4
Management . . . . . . . . . . . . . . . . . . . . . . . . . . . . . . . . . . . . . . . . . . . . . . . . . . . . . .6
Share Price, Distributions and Taxes . . . . . . . . . . . . . . . . . . . . . . . . . . . . . . . . . .8
Multiple Class Information . . . . . . . . . . . . . . . . . . . . . . . . . . . . . . . . . . . . . . . . .10
Financial Highlights . . . . . . . . . . . . . . . . . . . . . . . . . . . . . . . . . . . . . . . . . . . . . . .11
Throughout this book you’ll find definitions of key investment termsand phrases. When you see a wordprinted in green italics, look for its definition in the margin.
This symbol highlights special information and helpful tips.
�
VP_Value_I_ 4/14/02 5:56 PM Page v

2
An Overview of the Fund
What are the fund’s investment objectives?This fund seeks long-term capital growth. Income is a secondary objective.
What are the fund’s primary investment strategy and principal risks?In selecting stocks for VP Value, the fund managers look for companies whose stock priceis less than they believe the company is worth. The managers attempt to purchase thestock of these undervalued companies and hold them until their stock price has increasedto, or is higher than, a level the managers believe more accurately reflects the fair value ofthe company. A more detailed description of the fund’s value investment strategy beginson page 4.
The fund’s principal risks include
• Market Risk – The value of the fund’s shares will go up and down based on theperformance of the companies whose securities it owns and other factors generallyaffecting the securities market.
• Price Volatility – The value of the fund’s shares may fluctuate significantly in the short term.
• Principal Loss – At any given time your shares may be worth more or less than theprice you paid for them. In other words, it is possible to lose money by investing in the funds
• Style Risk – If the fund’s investment style is out of favor with the market, the fund’sperformance may suffer.
Who may want to invest in the fund?The fund may be a good investment if you are
• seeking long-term capital growth and income from your investment
• seeking an equity fund that utilizes a value style of investing
• comfortable with the risks associated with the fund’s investment strategy
• comfortable with the fund’s short-term price volatility
Who may not want to invest in the fund?The fund may not be a good investment if you are
• investing for a short period of time
• uncomfortable with volatility in the value of your investment
�
An investment in the fund is not a bank deposit, and it is not insured orguaranteed by the Federal DepositInsurance Corporation (FDIC) or any other government agency.
VP_Value_I_ 4/14/02 5:56 PM Page 2

3
Fund Performance History
Annual Total ReturnsThe following bar chart shows the performance of the fund’s Class I shares for each fullcalendar year in the life of the fund. It indicates the volatility of the fund’s historicalreturns from year to year.
The highest and lowest returns for the period reflected in the bar chart are:
Highest Lowest
VP Value 18.09% (2Q 1999) -11.05% (3Q 1999)
Average Annual Total ReturnsThe following table shows the average annual total returns of the fund’s Class I shares forthe periods indicated. The benchmarks are unmanaged indices that have no operatingcosts and are included in the table for performance comparison. The S&P 500 is viewed asa broad measure of U.S. Stock performance. The Lipper Multicap Value Index is an indexof multicap value funds that have management styles similar to the fund’s.
For the calendar year ended December 31,2001 1 year 5 years Life of Fund (1)
VP Value 12.82% 11.80% 12.61%
S&P 500 Index -11.87% 10.70% 12.12%
Lipper Multicap Value Index 1.30% 9.73% 10.83%
1 The inception date for VP Value is May 1, 1996.
�
The performance information on thispage is designed to help you see howthe fund’s returns can vary. Keep inmind that past performance does notpredict how the fund will perform in the future.
2000
1999
1998
1997
2001
40%30%20%10%-10%-20% 0%
26.08%
18.14%
12.82%
4.81%
-0.85%
VP_Value_I_ 4/14/02 5:56 PM Page 3

4
Objectives, Strategies and Risks
VP Value Fund
What are the fund’s investment objectives?The fund seeks long-term capital growth. Income is a secondary objective.
How does the fund pursue its investment objective?The fund managers look for stocks of companies that they believe are undervalued at thetime of purchase. The managers use a value investment strategy that looks for companiesthat are temporarily out of favor in the market. The managers attempt to purchase thestocks of these undervalued companies and hold them until they have returned to favor inthe market and their stock prices have gone up.
Companies may be undervalued due to market declines, poor economic conditions, actualor anticipated bad news regarding the issuer or its industry, or because they have beenoverlooked by the market. To identify these companies, the fund managers look forcompanies with earnings, cash flows and/or assets that may not be reflected accurately inthe companies’ stock prices or may be outside the companies’ historical ranges.
The fund managers do not attempt to time the market. Instead, under normal marketconditions, they intend to keep at least 80% of the fund’s assets invested in U.S. equitysecurities at all times. When the managers believe it is prudent, the fund may invest aportion of its assets in convertible debt securities, equity-equivalent securities, foreignsecurities, debt securities of companies, debt obligations of governments and their agencies, nonleveraged stock index futures contracts and other similar securities. Stockindex futures contracts, a type of derivative security, can help the fund’s cash assets remainliquid while performing more like stocks. The fund has a policy governing stock indexfutures contracts and similar derivative securities to help manage the risk of these types ofinvestments. For example, the fund managers cannot invest in a derivative security if itwould be possible for the fund to lose more money than it invested. A complete descrip-tion of the derivatives policy is included in the Statement of Additional Information.
In the event of exceptional market or economic conditions, the fund may, as a temporarydefensive measure, invest all or a substantial portion of its assets in cash or short-termdebt securities. To the extent the fund assumes a defensive position, it will not bepursuing its objective of capital growth. The fund generally limits its purchase of debtsecurities to investment-grade obligations, except for convertible debt securities, whichmay be rated below investment grade.
Nonleveraged means that the fundmay not invest in futures contractswhen it would be possible to lose morethan the fund invested.
VP_Value_I_ 4/14/02 5:56 PM Page 4

5
What are the principal risks of investing in the fund?The value of the fund’s shares depends on the value of the stocks and other securities itowns. The value of the individual securities the fund owns will go up and downdepending on the performance of the companies that issued them, general market andeconomic conditions, and investor confidence.
At any given time your shares may be worth more or less than the price you paid forthem. In other words, it is possible to lose money by investing in the fund.
If the market does not consider the individual stocks purchased by the fund to be under-valued, the value of the fund’s shares may not rise as high as other funds and may in factdecline, even if stock prices generally are increasing.
Market performance tends to be cyclical, and, in the various cycles, certain investmentstyles may fall in and out of favor. If the market is not favoring the fund’s style, the fund’sgains may not be as big as, or its losses may be bigger than, other equity funds usingdifferent investment styles.
Although the fund managers intend to invest the fund’s assets primarily in U.S. stocks,the fund may invest in securities of foreign companies. Foreign investment involves additional risks, including fluctuations in currency exchange rates, less stable political and economic structures, reduced availability of public information, and lack of uniformfinancial reporting and regulatory practices similar to those that apply in the UnitedStates. These factors make investing in foreign securities generally riskier than investingin U.S. stocks.
The fund is offered only to insurance companies for the purpose of offering the fund asan investment option under variable annuity or variable life insurance contracts. Althoughthe fund does not foresee any disadvantages to contract owners due to the fact that itoffers its shares as an investment medium for both variable annuity and variable life products, the interests of various contract owners participating in the fund might, at sometime, be in conflict due to future differences in tax treatment of variable products or otherconsiderations. Consequently, the fund’s Board of Directors will monitor events in orderto identify any material irreconcilable conflicts that may possibly arise and to determinewhat action, if any, should be taken in response to such conflicts. If a conflict were tooccur, an insurance company separate account might be required to withdraw its invest-ments in the fund, and the fund might be forced to sell securities at disadvantageousprices to redeem such investments.
VP_Value_I_ 4/14/02 5:56 PM Page 5

6
Management
Who manages the fund?The Board of Directors, investment advisor and fund management team play key roles inthe management of the fund.
The Board of DirectorsThe Board of Directors oversees the management of the fund and meets at least quarterlyto review reports about fund operations. Although the Board of Directors does notmanage the fund, it has hired an investment advisor to do so. More than two-thirds of thedirectors are independent of the fund’s advisor; that is, they are not employed by and haveno financial interest in the advisor.
The Investment AdvisorThe fund’s investment advisor is American Century Investment Management, Inc. Theadvisor has been managing mutual funds since 1958 and is headquartered at 4500 MainStreet, Kansas City, Missouri 64111.
The advisor is responsible for managing the investment portfolios of the fund anddirecting the purchase and sale of its investment securities. The advisor also arranges for transfer agency, custody and all other services necessary for the fund to operate.
For the services it provided to the fund during the most recent fiscal year, the advisorreceived a unified management fee of 0.97% of the average net assets of the Class I shares of the fund. The amount of the management fee is calculated daily and paid monthly in arrears.
Out of that fee, the advisor paid all expenses of managing and operating the fund exceptbrokerage expenses, taxes, interest, fees and expenses of the independent directors(including legal counsel fees), and extraordinary expenses. A portion of the managementfee may be paid by the fund’s advisor to unaffiliated third parties who provide record-keeping and administrative services that would otherwise be performed by an affiliate ofthe advisor.
VP_Value_I_ 4/14/02 5:56 PM Page 6

7
The Fund Management TeamThe advisor uses a team of portfolio managers, assistant portfolio managers and analyststo manage the fund. The team meets regularly to review portfolio holdings and discusspurchase and sale activity. Team members buy and sell securities for the fund as they seefit, guided by the fund’s investment objective and strategy.
The portfolio managers on the investment team are identified below:
Phillip N. Davidson Mr. Davidson, Senior Vice President and Senior Portfolio Manager,has been a member ofthe team that manages VP Value since May 1996. He joined American Century inSeptember 1993 as a Portfolio Manager. Prior to joining American Century, he spent 11years at Boatmen’s Trust Company in St. Louis and served as Vice President and PortfolioManager responsible for institutional value equity clients. He has a bachelor’s degree infinance and an MBA from Illinois State University. He is a CFA charterholder.
Scott A. Moore Mr. Moore, Vice President and Portfolio Manager, has been a member of the team thatmanages VP Value since October 1996 and Portfolio Manager since February 1999. Hejoined American Century in August 1993 as an Investment Analyst. He has a bachelor’sdegree in finance from Southern Illinois University and an MBA in finance from theUniversity of Missouri – Columbia. He is a CFA charterholder.
Fund PerformanceVP Value has the same management team and investment policies as another fund in theAmerican Century family of funds. The fees and expenses of the funds are expected to besimilar, and they will be managed with substantially the same investment objective andstrategies. Notwithstanding these general similarities, this fund and the retail fund areseparate mutual funds that will have different investment performance. Differences incash flows into the two funds, the size of their portfolios and specific investments held bythe two funds, as well as the additional expenses of the insurance product, will causeperformance to differ.
Please consult the separate account prospectus for a description of the insurance productthrough which the fund is offered and its associated fees.
Fundamental Investment PoliciesFundamental investment policies contained in the Statement of Additional Informationand the investment objective of the fund may not be changed without shareholderapproval. The Board of Directors may change any other policies and investment strategies.
�
Code of EthicsAmerican Century has a Code ofEthics designed to ensure that theinterests of fund shareholders comebefore the interests of the people whomanage the fund. Among other provi-sions, the Code of Ethics prohibitsportfolio managers and other invest-ment personnel from buying securitiesin an initial public offering or profitingfrom the purchase and sale of thesame security within 60 calendar days.In addition, the Code of Ethics requiresportfolio managers and otheremployees with access to informationabout the purchase or sale of securitiesby the fund to obtain approval beforeexecuting permitted personal trades.
VP_Value_I_ 4/14/02 5:56 PM Page 7

8
Share Price, Distributions and Taxes
Purchase and Redemption of SharesFor instructions on how to purchase and redeem shares, read the prospectus of yourinsurance company separate account. Your order will be priced at the net asset value nextdetermined after your request is received in the form required by the insurance companyseparate account. There are no sales commissions or redemption charges. However, certainsales or deferred sales charges and other charges may apply to the variable annuity or lifeinsurance contracts. Those charges are disclosed in the separate account prospectus.
Abusive Trading PracticesWe do not permit market timing or other abusive trading practices in our funds.
Excessive, short-term (market timing) or other abusive trading practices may disrupt port-folio management strategies and harm fund performance. To minimize harm to the fundand its shareholders, we reserve the right to reject any purchase order (includingexchanges) from any investor we believe has a history of abusive trading or whose trading,in our judgment, has been or may be disruptive to a fund. In making this judgment, wemay consider trading done in multiple accounts under common ownership or control.
We also reserve the right to delay delivery of redemption proceeds up to seven days.
Modifying or Canceling an InvestmentInvestment instructions are irrevocable. That means that once you have mailed or other-wise transmitted your investment instruction, you may not modify or cancel it. The fundreserves the right to suspend the offering of shares for a period of time, and to reject anyspecific investment (including a purchase by exchange). Additionally, we may refuse apurchase if, in our judgment, it is of a size that would disrupt the management of the fund.
Share PriceAmerican Century determines the net asset value (NAV) of the fund as of the close ofregular trading on the New York Stock Exchange (usually 4 p.m. Eastern time) on each day the Exchange is open. On days when the Exchange is closed (including certain U.S.holidays), we do not calculate the NAV. A fund share’s NAV is the current value of thefund’s assets, minus any liabilities, divided by the number of fund shares outstanding.
If current market prices of securities owned by a fund are not readily available, the advisormay determine their fair value in accordance with procedures adopted by the fund’sBoard. Trading of securities in foreign markets may not take place every day the Exchangeis open. Also, trading in some foreign markets and on some electronic trading networksmay take place on weekends or holidays when a fund’s NAV is not calculated. So, the valueof a fund’s portfolio may be affected on days when you can’t purchase or redeem shares ofthe fund.
We will price your purchase, exchange or redemption at the NAV next determined afterthe insurance company separate account receives your transaction request in good order.
Good order means that your instructions have been received in the form required by AmericanCentury. This may include, for example,providing the fund name and accountnumber, the amount of the transactionand all required signatures.
VP_Value_I_ 4/14/02 5:56 PM Page 8

9
DistributionsFederal tax laws require the fund to make distributions to its shareholders in order toqualify as a “regulated investment company.” Qualification as a regulated investmentcompany means the fund will not be subject to state or federal income tax on amountsdistributed. The distributions generally consist of dividends and interest received by afund, as well as capital gains realized by a fund on the sale of its investment securities.The fund generally pays distributions from net income and capital gains, if any, once ayear in March. The fund may make more frequent distributions, if necessary, to complywith Internal Revenue Code provisions.
You will participate in fund distributions when they are declared, starting the next business day after your purchase is effective. For example, if you purchase shares on a day that a distribution is declared, you will not receive that distribution. If you redeemshares, you will receive any distribution declared on the day you redeem. If you redeemall shares, we will include any distributions received with your redemption proceeds. Alldistributions from the fund will be invested in additional shares.
Provided that all shareholders agree, the fund may utilize the consent dividend provisionof Internal Revenue Code section 565 which treats the income earned by the fund asdistributed to the shareholders as of the end of the taxable year.
TaxesConsult the prospectus of your insurance company separate account for a discussion ofthe tax status of your variable contract.
Capital gains are increases in thevalues of capital assets, such as stock,from the time the assets are purchased.
VP_Value_I_ 4/14/02 5:56 PM Page 9

10
Multiple Class Information
American Century offers three classes of the fund: Class I (the original class), Class II andClass III. The shares offered by this Prospectus are Class I shares. All classes are offeredexclusively to insurance companies to fund their obligations under the variable annuityand variable life contracts purchased by their clients.
Class I and Class III have the same fees and expenses, with one exception. Class III shareshave a 1.0% redemption fee for shares that are redeemed or exchanged within 60 days ofpurchase. Class II shares have different fees and expenses. The difference in the feestructures between the classes is the result of their separate arrangements for distributionservices and not the result of any difference in amounts charged by the advisor for coreinvestment advisory services. Accordingly, the core investment advisory expenses do not vary by class. Different fees and expenses will affect performance. For additionalinformation concerning the other classes of shares not offered by this Prospectus, call usat 1-800-345-3533.
Except as described below, all classes of shares of the fund have identical voting, dividend,liquidation and other rights, preferences, terms and conditions. The only differencesbetween the classes are (a) each class may be subject to different expenses specific to thatclass; (b) each class has a different identifying designation or name; (c) each class hasexclusive voting rights with respect to matters solely affecting that class; and (d) each classmay have different exchange privileges.
VP_Value_I_ 4/14/02 5:56 PM Page 10

11
Financial Highlights
Understanding the Financial HighlightsThe table on the next page itemizes what contributed to the changes in share price duringthe most recently ended fiscal year. It also shows the changes in share price for thisperiod in comparison to changes over the last five fiscal years or less, if the fund is notfive years old.
On a per-share basis, the table includes as appropriate
• share price at the beginning of the period
• investment income and capital gains or losses
• distributions of income and capital gains paid to investors
• share price at the end of the period
The table also includes some key statistics for the period as appropriate
• Total Return – the overall percentage of return of the fund, assuming the reinvestmentof all distributions
• Expense Ratio – the operating expenses of the fund as a percentage of average net assets
• Net Income Ratio – the net investment income of the fund as a percentage of averagenet assets
• Portfolio Turnover – the percentage of the fund’s buying and selling activity
The Financial Highlights have been audited by Deloitte & Touche LLP, independent auditors.Their Independent Auditors’ Report and the financial statements are included in thefund’s Annual Report, which is available upon request.
VP_Value_I_ 4/14/02 5:56 PM Page 11

VP Value FundClass I
For a Share Outstanding Throughout the Years Ended December 31
Per-Share Data2 0 0 1 2 0 0 0 1 9 9 9 1 9 9 8 1 9 9 7
Net Asset Value, Beginning of Period $6.67 $5.95 $6.73 $6.93 $5.58
Income From Investment Operations
Net Investment Income 0.08(1) 0.08 0.08 0.08(1) 0.07
Net Realized and Unrealized Gain (Loss) 0.77 0.90 (0.15) 0.27 1.37
Total From Investment Operations 0.85 0.98 (0.07) 0.35 1.44
Distributions
From Net Investment Income (0.08) (0.07) (0.07) (0.04) (0.04)
From Net Realized Gains .— (0.19) (0.64) (0.51) (0.05)
Total Distributions (0.08) (0.26) (0.71) (0.55) (0.09)
Net Asset Value, End of Period $7.44 $6.67 $5.95 $6.73 $6.93
Total Return(2) 12.82% 18.14% (0.85)% 4.81% 26.08%
Ratios/Supplemental Data2 0 0 1 2 0 0 0 1 9 9 9 1 9 9 8 1 9 9 7
Ratio of Operating Expenses to Average Net Assets 0.97% 1.00% 1.00% 1.00% 1.00%
Ratio of Net Investment Income to Average Net Assets 1.28% 1.81% 1.40% 1.21% 1.60%
Portfolio Turnover Rate 174% 159% 118% 158% 138%
Net Assets, End of Period (in thousands) $1,424,235 $672,214 $416,166 $316,624 $188,015
1 Computed using average shares outstanding throughout the year.
2 Total return assumes reinvestment of dividends and capital gains distributions, if any. The total return of the classes may not precisely reflect the class expensedifferences because of the impact of calculating the net asset values to two decimal places. If net asset values were calculated to three decimal places, thetotal return differences would more closely reflect the class expense differences. The calculation of net asset values to two decimal places is made in accor-dance with SEC guidelines and does not result in any gain or loss of value between one class and another.
12
VP_Value_I_ 4/14/02 5:56 PM Page 12

13
Notes
VP_Value_I_ 4/14/02 5:56 PM Page 13

More information about the fund is contained in these documents.
Annual and Semiannual Reports Annual and semiannual reports contain more information about the fund’s investmentsand the market conditions and investment strategies that significantly affected the fund’sperformance during the most recent fiscal period.
Statement of Additional Information (SAI) The SAI contains a more detailed, legal description of the fund’s operations, investmentrestrictions, policies and practices. The SAI is incorporated by reference into thisProspectus. This means that it is legally part of this Prospectus, even if you don’t requesta copy.
You may obtain a free copy of the SAI or annual and semiannual reports, and ask ques-tions about the fund or your accounts, by contacting the insurance company from whichyou purchased the fund or American Century at the address or telephone numberslisted below.
You also can get information about the fund (including the SAI) from the Securities and Exchange Commission (SEC). The SEC charges a duplicating fee to provide copiesof this information.
In person SEC Public Reference Room Washington, D.C. Call 202-942-8090 for location and hours.
On the Internet • EDGAR database at www.sec.gov• By email request at [email protected]
By mail SEC Public Reference SectionWashington, D.C. 20549-0102
Investment Company Act File No. 811-5188
American Century InvestmentsP.O. Box 419385Kansas City, Missouri 64141-63851-800-345-6488 or 816-531-5575www.americancentury.com
0205SH-PRS-28991
VP_Value_I_ 4/14/02 5:56 PM Page ii
� May 1, 2002
Janus Aspen SeriesInstitutional Shares
Growth Portfolio
Prospectus
The Securities and Exchange Commission has not approved or disapproved of these securities or passed on the accuracy oradequacy of this Prospectus. Any representation to the contrary is a criminal offense.

This prospectus describes Growth Portfolio (the ‘‘Portfolio’’). This Portfolio of Janus Aspen Seriescurrently offers two classes of shares. The Institutional Shares (the ‘‘Shares’’) are offered by thisprospectus in connection with investment in and payments under variable annuity contracts andvariable life insurance contracts (collectively, ‘‘variable insurance contracts’’), as well as certainqualified retirement plans.
Janus Aspen Series sells and redeems its Shares at net asset value without sales charges orcommissions. Each variable insurance contract involves fees and expenses that are not described inthis Prospectus. See the accompanying contract prospectus for information regarding contract feesand expenses and any restrictions on purchases or allocations.
This prospectus contains information that a prospective purchaser of a variable insurance contractor plan participant should consider in conjunction with the accompanying separate accountprospectus of the specific insurance company product before allocating purchase payments orpremiums to the Portfolio.

TABLE OF CONTENTS
RISK/RETURN SUMMARYGrowth Portfolio **************************************************************** 2Fees and expenses *************************************************************** 4
INVESTMENT OBJECTIVE, PRINCIPAL INVESTMENT STRATEGIES AND RISKSInvestment objective and principal investment strategies ******************************** 5General portfolio policies********************************************************** 6Risks ************************************************************************** 7
MANAGEMENT OF THE PORTFOLIOInvestment adviser *************************************************************** 10Management expenses ************************************************************ 10Portfolio manager**************************************************************** 11
OTHER INFORMATION ************************************************************* 12
DISTRIBUTIONS AND TAXESDistributions******************************************************************** 13Taxes ************************************************************************** 13
SHAREHOLDER’S GUIDEPricing of portfolio shares ********************************************************* 14Purchases ********************************************************************** 14Redemptions******************************************************************** 15Excessive trading **************************************************************** 15Shareholder communications******************************************************* 15
FINANCIAL HIGHLIGHTS *********************************************************** 16
GLOSSARY OF INVESTMENT TERMSEquity and debt securities ********************************************************* 17Futures, options and other derivatives *********************************************** 19Other investments, strategies and/or techniques *************************************** 19
Table of contents 1

RISK/RETURN SUMMARY
GROWTH PORTFOLIO
The Portfolio is designed for long-term investors who primarily seek growth of capital and who cantolerate the greater risks associated with common stock investments.
1. What is the investment objective of the Portfolio?
Growth Portfolio seeks long-term growth of capital in a manner consistent with the preservation ofcapital.
The Portfolio’s Trustees may change this objective or the Portfolio’s principal investment policies withouta shareholder vote. The Portfolio will notify you at least 60 days before making any changes to itsobjective or principal investment policies. If there is a material change to the Portfolio’s objective orprincipal investment policies, you should consider whether the Portfolio remains an appropriateinvestment for you. There is no guarantee that the Portfolio will meet its objective.
2. What are the main investment strategies of the Portfolio?
The portfolio manager applies a ‘‘bottom up’’ approach in choosing investments. In other words, he looksat companies one at a time to determine if a company is an attractive investment opportunity and isconsistent with the Portfolio’s investment policies. If the portfolio manager is unable to find investmentswith earnings growth potential, a significant portion of the Portfolio’s assets may be in cash or similarinvestments.
Within the parameters of its specific investment policies discussed below, the Portfolio may invest withoutlimit in foreign equity and debt securities.
Within the parameters of its specific investment policies discussed below, the Portfolio will limit itsinvestment in high-yield/high-risk bonds to less than 35% of its net assets.
The Portfolio invests primarily in common stocks selected for their growth potential. Although thePortfolio can invest in companies of any size, it generally invests in larger, more established companies.
3. What are the main risks of investing in the Portfolio?
The biggest risk is that the Portfolio’s returns may vary, and you could lose money. The Portfolio isdesigned for long-term investors who can accept the risks of investing in a portfolio with significantcommon stock holdings. Common stocks tend to be more volatile than other investment choices.
The value of the Portfolio’s holdings may decrease if the value of an individual company in the portfoliodecreases. The value of the Portfolio’s holdings could also decrease if the stock market goes down. If thevalue of the Portfolio’s holdings decreases, the Portfolio’s net asset value (NAV) will also decrease, whichmeans if you sell your shares in the Portfolio you may get back less money.
An investment in the Portfolio is not a bank deposit and is not insured or guaranteed by the FederalDeposit Insurance Corporation or any other government agency.
2 Janus Aspen Series

The following information provides some indication of the risks of investing in the Portfolio by showinghow the Portfolio’s performance has varied over time. The bar chart depicts the change in performancefrom year to year during the periods indicated. The table compares the average annual returns for theShares of the Portfolio for the periods indicated to a broad-based securities market index.
Growth Portfolio – Institutional Shares
Best Quarter: 4th-1998 27.71% Worst Quarter: 3rd-2001 (24.79%)
(30%)
(20%)
-10%
0%
10%
20%
30%
40%
50%
20012000199919981997199619951994
Annual returns for periods ended 12/31
(24.73%)
30.17%
2.76%
18.45%22.75%
35.66%
43.98%
(14.55%)
Average annual total return for periods ended 12/31/01
Since Inception1 year 5 years (9/13/93)
Growth Portfolio – Institutional Shares (24.73%) 9.05% 11.83%S&P 500 Index* (11.88%) 10.70% 13.70%
* The S&P 500 is the Standard & Poor’s Composite Index of 500 Stocks, a widely recognized, unmanaged index of common stockprices.
The Portfolio’s past performance does not necessarily indicate how it will perform in the future.
Risk return summary 3

FEES AND EXPENSES
Shareholder fees, such as sales loads, redemption fees or exchange fees, are charged directly to aninvestor’s account. The Janus funds are no-load investments, so you will generally not pay any shareholderfees when you buy or sell shares of the Portfolio. However, each variable insurance contract involves feesand expenses not described in this prospectus. See the accompanying contract prospectus for informationregarding contract fees and expenses and any restrictions on purchases or allocations.
Annual fund operating expenses are paid out of the Portfolio’s assets and include fees for portfoliomanagement, maintenance of shareholder accounts, shareholder servicing, accounting and other services.You do not pay these fees directly but, as the example below shows, these costs are borne indirectly by allshareholders.
This table and example are designed to assist participants in qualified plans that invest in the Shares of thePortfolio in understanding the fees and expenses that you may pay as an investor in the Shares. Owners ofvariable insurance contracts that invest in the Shares should refer to the variable insurance contractprospectus for a description of fees and expenses, as the table and example do not reflect deductionsat the separate account level or contract level for any charges that may be incurred under a contract.
Total Annual FundManagement Other Operating
Fee Expenses Expenses*Growth Portfolio 0.65% 0.01% 0.66%
* Expenses are based upon expenses for the year ended December 31, 2001. All expenses are shown without the effect of any expense offsetarrangements.
EXAMPLE:This example is intended to help you compare the cost of investing in the Portfolio with the cost of investing in other mutual funds. Theexample assumes that you invest $10,000 in the Portfolio for the time periods indicated and then redeem all of your shares at the end ofthose periods. The example also assumes that your investment has a 5% return each year, and that the Portfolio’s operating expenses remainthe same. Since no sales load applies, the results apply whether or not you redeem your investment at the end of each period. Although youractual costs may be higher or lower, based on these assumptions your costs would be:
1 Year 3 Years 5 Years 10 Years
Growth Portfolio $67 $211 $368 $822
4 Janus Aspen Series

INVESTMENT OBJECTIVE, PRINCIPAL INVESTMENT STRATEGIES AND RISKS
The Portfolio has a similar investment objective and similar principal investment strategies to Janus Fund.Although it is anticipated that the Portfolio and its corresponding retail fund will hold similar securities,differences in asset size, cash flow needs and other factors may result in differences in investmentperformance. The expenses of the Portfolio and its corresponding retail fund are expected to differ. Thevariable contract owner will also bear various insurance related costs at the insurance company level. Youshould review the accompanying separate account prospectus for a summary of fees and expenses.
INVESTMENT OBJECTIVE AND PRINCIPAL INVESTMENT STRATEGIES
This section takes a closer look at the investment objectives of the Portfolio, its principal investmentstrategies and certain risks of investing in the Portfolio. Strategies and policies that are noted as‘‘fundamental’’ cannot be changed without a shareholder vote.
Please carefully review the ‘‘Risks’’ section of this Prospectus for a discussion of risks associated withcertain investment techniques. We’ve also included a Glossary with descriptions of investment terms usedthroughout this Prospectus.
Growth Portfolio seeks long-term growth of capital in a manner consistent with the preservation of capital.It pursues its objective by investing primarily in common stocks selected for their growth potential.Although the Portfolio can invest in companies of any size, it generally invests in larger, more establishedcompanies.
The following questions and answers are designed to help you better understand the Portfolio’s principal investmentstrategies.
1. How are common stocks selected?
Consistent with its investment objective and policies, each of the Portfolio may invest substantially all of itsassets in common stocks if the portfolio manager believes that common stocks will appreciate in value.The portfolio manager generally takes a ‘‘bottom up’’ approach to selecting companies. This means that heseeks to identify individual companies with earnings growth potential that may not be recognized by themarket at large. The portfolio manager makes this assessment by looking at companies one at a time,regardless of size, country of organization, place of principal business activity, or other similar selectioncriteria.
Realization of income is not a significant consideration when choosing investments for the Portfolio.Income realized on the Portfolio’s investments may be incidental to its objective.
2. Are the same criteria used to select foreign securities?
Generally, yes. The portfolio manager seeks companies that meet his selection criteria, regardless of wherea company is located. Foreign securities are generally selected on a stock-by-stock basis without regard toany defined allocation among countries or geographic regions. However, certain factors such as expectedlevels of inflation, government policies influencing business conditions, the outlook for currencyrelationships, and prospects for economic growth among countries, regions or geographic areas maywarrant greater consideration in selecting foreign securities. There are no limitations on the countries inwhich the Portfolio may invest and the Portfolio may at times have significant foreign exposure.
3. What does ‘‘market capitalization’’ mean?
Market capitalization is the most commonly used measure of the size and value of a company. It iscomputed by multiplying the current market price of a share of the company’s stock by the total numberof its shares outstanding. The Portfolio does not emphasize companies of any particular size.
Investment objective, principal investment strategies and risks 5

GENERAL PORTFOLIO POLICIES
The percentage limitations included in these policies and elsewhere in this Prospectus apply at the time ofpurchase of a security. So, for example, if the Portfolio exceeds a limit as a result of market fluctuations orthe sale of other securities, it will not be required to dispose of any securities.
Cash PositionWhen the portfolio manager believes that market conditions are unfavorable for profitable investing, orwhen he is otherwise unable to locate attractive investment opportunities, the Portfolio’s cash or similarinvestments may increase. In other words, the Portfolio does not always stay fully invested in stocks andbonds. Cash or similar investments generally are a residual – they represent the assets that remain after theportfolio manager has committed available assets to desirable investment opportunities. However, theportfolio manager may also temporarily increase the Portfolio’s cash position to, for example, protect itsassets, maintain liquidity or meet unusually large redemptions. The Portfolio’s cash position may alsoincrease temporarily due to unusually large cash inflows. When the Portfolio’s investments in cash orsimilar investments increase, it may not participate in market advances or declines to the same extent thatit would if the Portfolio remained more fully invested in stocks or bonds.
Other Types of InvestmentsThe Portfolio invests primarily in domestic and foreign equity securities, which may include preferredstocks, common stocks and securities convertible into common or preferred stocks. To a lesser degree, thePortfolio may invest in other types of domestic and foreign securities and use other investment strategies,which are described in the Glossary. These may include:
) debt securities
) indexed/structured securities
) high-yield/high-risk bonds (less than 35% of the Portfolio’s assets)
) options, futures, forwards, swaps and other types of derivatives for hedging purposes or for non-hedgingpurposes such as seeking to enhance return
) short sales (no more than 8% of the Portfolio’s assets may be invested in ‘‘naked’’ short sales)
) securities purchased on a when-issued, delayed delivery or forward commitment basis
Illiquid InvestmentsThe Portfolio may invest up to 15% of its net assets in illiquid investments. An illiquid investment is asecurity or other position that cannot be disposed of quickly in the normal course of business. Forexample, some securities are not registered under U.S. securities laws and cannot be sold to theU.S. public because of SEC regulations (these are known as ‘‘restricted securities’’). Under proceduresadopted by the Portfolio’s Trustees, certain restricted securities may be deemed liquid, and will not becounted toward this 15% limit.
Foreign SecuritiesWithin the parameters of its specific investment policies, the Portfolio may invest without limit in foreignequity and debt securities. The Portfolio may invest directly in foreign securities denominated in a foreigncurrency and not publicly traded in the United States. Other ways of investing in foreign securities includedepositary receipts or shares and passive foreign investment companies.
6 Janus Aspen Series

Special SituationsThe Portfolio may invest in special situations. A special situation arises when, in the opinion of theportfolio manager, the securities of a particular issuer will be recognized and appreciate in value due to aspecific development with respect to that issuer. Special situations may include significant changes in acompany’s allocation of its existing capital, a restructuring of assets, or a redirection of free cash flow.Developments creating a special situation might include, among others, a new product or process, atechnological breakthrough, a management change or other extraordinary corporate event, or differences inmarket supply of and demand for the security. The Portfolio’s performance could suffer if the anticipateddevelopment in a ‘‘special situation’’ investment does not occur or does not attract the expected attention.
Portfolio TurnoverThe Portfolio generally intends to purchase securities for long-term investment, although, to the extentpermitted by its specific investment policies, the Portfolio may purchase securities in anticipation ofrelatively short-term price gains. Short-term transactions may also result from liquidity needs, securitieshaving reached a price or yield objective, changes in interest rates or the credit standing of an issuer, or byreason of economic or other developments not foreseen at the time of the investment decision. ThePortfolio may also sell one security and simultaneously purchase the same or a comparable security to takeadvantage of short-term differentials in bond yields or securities prices. Portfolio turnover is affected bymarket conditions, changes in the size of the Portfolio, the nature of the Portfolio’s investments and theinvestment style of the portfolio manager. Changes are made in the Portfolio’s holdings whenever theportfolio manager believes such changes are desirable. Portfolio turnover rates are generally not a factor inmaking buy and sell decisions.
Increased portfolio turnover may result in higher costs for brokerage commissions, dealer mark-ups andother transaction costs and may also result in taxable capital gains. Higher costs associated with increasedportfolio turnover may offset gains in the Portfolio’s performance. The Financial Highlights section of thisProspectus shows the Portfolio’s historical turnover rates.
RISKS
Because the Portfolio may invest substantially all of its assets in common stocks, the main risk is the riskthat the value of the stocks it holds might decrease in response to the activities of an individual companyor in response to general market and/or economic conditions. If this occurs, the Portfolio’s share price mayalso decrease. The Portfolio’s performance may also be affected by risks specific to certain types ofinvestments, such as foreign securities, derivative investments, non-investment grade bonds, initial publicofferings (IPOs) or companies with relatively small market capitalizations. IPOs and other investmenttechniques may have a magnified performance impact on a Portfolio with a small asset base. A Portfoliomay not experience similar performance as its assets grow.
The following questions and answers are designed to help you better understand some of the risks of investing in thePortfolio.
1. The Portfolio may invest in smaller or newer companies. Does this create any special risks?
Many attractive investment opportunities may be smaller, start-up companies offering emerging products orservices. Smaller or newer companies may suffer more significant losses as well as realize more substantialgrowth than larger or more established issuers because they may lack depth of management, be unable togenerate funds necessary for growth or potential development, or be developing or marketing newproducts or services for which markets are not yet established and may never become established. In
Investment objective, principal investment strategies and risks 7

addition, such companies may be insignificant factors in their industries and may become subject tointense competition from larger or more established companies. Securities of smaller or newer companiesmay have more limited trading markets than the markets for securities of larger or more establishedissuers, or may not be publicly traded at all, and may be subject to wide price fluctuations. Investments insuch companies tend to be more volatile and somewhat more speculative.
2. How could the Portfolio’s investments in foreign securities affect its performance?
Within the parameters of its specific investment policies, the Portfolio may invest without limit in foreignsecurities either indirectly (e.g., depositary receipts) or directly in foreign markets. Investments in foreignsecurities, including those of foreign governments, may involve greater risks than investing in domesticsecurities because the Portfolio’s performance may depend on issues other than the performance of aparticular company. These issues include:
) Currency Risk. As long as the Portfolio holds a foreign security, its value will be affected by the value ofthe local currency relative to the U.S. dollar. When the Portfolio sells a foreign denominated security, itsvalue may be worth less in U.S. dollars even if the security increases in value in its home country.U.S. dollar denominated securities of foreign issuers may also be affected by currency risk.
) Political and Economic Risk. Foreign investments may be subject to heightened political and economicrisks, particularly in emerging markets which may have relatively unstable governments, immatureeconomic structures, national policies restricting investments by foreigners, different legal systems, andeconomies based on only a few industries. In some countries, there is the risk that the government maytake over the assets or operations of a company or that the government may impose taxes or limits onthe removal of the Portfolio’s assets from that country.
) Regulatory Risk. There may be less government supervision of foreign markets. As a result, foreignissuers may not be subject to the uniform accounting, auditing and financial reporting standards andpractices applicable to domestic issuers and there may be less publicly available information aboutforeign issuers.
) Market Risk. Foreign securities markets, particularly those of emerging market countries, may be lessliquid and more volatile than domestic markets. Certain markets may require payment for securitiesbefore delivery and delays may be encountered in settling securities transactions. In some foreignmarkets, there may not be protection against failure by other parties to complete transactions.
) Transaction Costs. Costs of buying, selling and holding foreign securities, including brokerage, tax andcustody costs, may be higher than those involved in domestic transactions.
3. Are there special risks associated with investments in high-yield/high-risk bonds?
High-yield/high-risk bonds (or ‘‘junk’’ bonds) are bonds rated below investment grade by the primaryrating agencies such as Standard & Poor’s and Moody’s. The value of lower quality bonds generally ismore dependent on credit risk and default risk than investment grade bonds. Issuers of high-yield bondsmay not be as strong financially as those issuing bonds with higher credit ratings and are more vulnerableto real or perceived economic changes, political changes or adverse developments specific to the issuer. Inaddition, the junk bond market can experience sudden and sharp price swings.
8 Janus Aspen Series

4. How does the Portfolio try to reduce risk?
The Portfolio may use futures, options, swaps and other derivative instruments to ‘‘hedge’’ or protect itsportfolio from adverse movements in securities prices and interest rates. The Portfolio may also use avariety of currency hedging techniques, including forward currency contracts, to manage exchange raterisk. The portfolio manager believes the use of these instruments will benefit the Portfolio. However, thePortfolio’s performance could be worse than if the Portfolio had not used such instruments if the portfoliomanager’s judgement proves incorrect.
5. What is ‘‘industry risk’’?
Industry risk is the possibility that a group of related stocks will decline in price due to industry-specificdevelopments. Companies in the same or similar industries may share common characteristics and aremore likely to react similarly to industry-specific market or economic developments. The Portfolio may attimes have significant exposure to industry risk as a result of investing in multiple companies in aparticular industry.
Investment objective, principal investment strategies and risks 9

MANAGEMENT OF THE PORTFOLIO
INVESTMENT ADVISER
Janus Capital Management LLC (‘‘Janus Capital’’), 100 Fillmore Street, Denver, Colorado 80206-4928, isthe investment adviser to the Portfolio and is responsible for the day-to-day management of the investmentportfolio and other business affairs of the Portfolio.
Janus Capital began serving as investment adviser to Janus Fund in 1970 and currently serves asinvestment adviser to all of the Janus retail funds, acts as sub-adviser for a number of private-label mutualfunds and provides separate account advisory services for institutional accounts.
Janus Capital furnishes continuous advice and recommendations concerning the Portfolio’s investments.Janus Capital also furnishes certain administrative, compliance and accounting services for the Portfolio,and may be reimbursed by the Portfolio for its costs in providing those services. In addition, Janus Capitalemployees serve as officers of the Trust and Janus Capital provides office space for the Portfolio and paysthe salaries, fees and expenses of all Portfolio officers and those Trustees who are affiliated with JanusCapital.
Participating insurance companies that purchase the Portfolio’s Shares may perform certain administrativeservices relating to the Portfolio and Janus Capital or the Portfolio may pay those companies for suchservices.
MANAGEMENT EXPENSES
The Portfolio pays Janus Capital a management fee which is calculated daily and paid monthly. ThePortfolio’s advisory agreement spells out the management fee and other expenses that the Portfolio mustpay. A new investment advisory agreement approved at a special meeting of the shareholders onJanuary 31, 2002, that is the same in all material respects as the previous advisory agreement, becameeffective on April 3, 2002. For the year ended December 31, 2001, the Portfolio paid Janus Capital amanagement fee of 0.65% of the Portfolio’s average net assets.
The Shares of the Portfolio incur expenses not assumed by Janus Capital, including transfer agent andcustodian fees and expenses, legal and auditing fees, printing and mailing costs of sending reports andother information to existing shareholders, and independent Trustees’ fees and expenses.
10 Janus Aspen Series

PORTFOLIO MANAGER
Blaine P. Rollins
is Executive Vice President and Portfolio Manager of Growth Portfolio, which he has managed sinceJanuary 2000. He previously served as Executive Vice President and Portfolio Manager of Equity IncomePortfolio from its inception to December 1999 and Balanced Portfolio from May 1996 to December1999. Mr. Rollins is also Portfolio Manager of other Janus accounts. Mr. Rollins joined Janus Capital in1990. He holds a Bachelor of Science degree in Finance from the University of Colorado. Mr. Rollinshas earned the right to use the Chartered Financial Analyst designation.
Management of the Portfolio 11

OTHER INFORMATION
Classes of Shares
The Portfolio currently offers two classes of shares, one of which, the Institutional Shares, is offeredpursuant to this prospectus and sold under the name Janus Aspen Series. The Shares offered by thisProspectus are available only in connection with investment in and payments under variable insurancecontracts, as well as certain qualified retirement plans. Service Shares of the Portfolio are available only inconnection with investment in and payments under variable insurance contracts as well as certain qualifiedretirement plans that require a fee from Portfolio assets to procure distribution and administrative servicesto contract owners and plan participants. Because the expenses of each class may differ, the performance ofeach class is expected to differ. If you would like additional information about the Service Shares, pleasecall 1-800-525-0020.
Conflicts of Interest
The Shares offered by this prospectus are available only to variable annuity and variable life separateaccounts of insurance companies that are unaffiliated with Janus Capital and to certain qualified retirementplans. Although the Portfolio does not currently anticipate any disadvantages to policy owners because thePortfolio offers its shares to such entities, there is a possibility that a material conflict may arise. TheTrustees monitor events in order to identify any disadvantages or material irreconcilable conflicts and todetermine what action, if any, should be taken in response. If a material disadvantage or conflict occurs,the Trustees may require one or more insurance company separate accounts or qualified plans to withdrawits investments in the Portfolio or substitute Shares of another Portfolio. If this occurs, the Portfolio may beforced to sell its securities at disadvantageous prices. In addition, the Trustees may refuse to sell Shares ofthe Portfolio to any separate account or qualified plan or may suspend or terminate the offering of thePortfolio’s Shares if such action is required by law or regulatory authority or is in the best interests of thePortfolio’s shareholders. It is possible that a qualified plan investing in the Portfolio could lose its qualifiedplan status under the Internal Revenue Code, which could have adverse tax consequences on insurancecompany separate accounts investing in the Portfolio. Janus Capital intends to monitor such qualified plansand the Portfolio may discontinue sales to a qualified plan and require plan participants with existinginvestments in the Portfolio to redeem those investments if a plan loses (or in the opinion of Janus Capitalis at risk of losing) its qualified plan status.
Distribution of the Portfolio
The Portfolio is distributed by Janus Distributors LLC, which is a member of the National Association ofSecurities Dealers, Inc. (‘‘NASD’’). To obtain information about NASD member firms and their associatedpersons, you may contact NASD Regulation, Inc. at www.nasdr.com, or the Public Disclosure Hotline at800-289-9999. An investor brochure containing information describing the Public Disclosure Program isavailable from NASD Regulation, Inc.
12 Janus Aspen Series

DISTRIBUTIONS AND TAXES
DISTRIBUTIONS
To avoid taxation of the Portfolio, the Internal Revenue Code requires the Portfolio to distribute netincome and any net gains realized on its investments at least annually. The Portfolio’s income fromdividends and interest and any net realized short-term gains are paid to shareholders as ordinary incomedividends. Net realized long-term gains are paid to shareholders as capital gains distributions.
Distribution Schedule
Dividends for the Portfolio are normally declared and distributed in June and December. Capital gains arenormally declared and distributed in June for the Portfolio.
How Distributions Affect the Portfolio’s NAV
Distributions are paid to shareholders as of the record date of the distribution of the Portfolio, regardless ofhow long the shares have been held. Undistributed income and realized gains are included in the dailyNAV of the Portfolio’s Shares. The Share price of the Portfolio drops by the amount of the distribution, netof any subsequent market fluctuations. For example, assume that on December 31, the Shares of GrowthPortfolio declared a dividend in the amount of $0.25 per share. If the price of Growth Portfolio’s Shareswas $10.00 on December 30, the share price on December 31 would be $9.75, barring marketfluctuations.
TAXES
Taxes on Distributions
Because Shares of the Portfolio may be purchased only through variable insurance contracts and qualifiedplans, it is anticipated that any income dividends or capital gains distributions made by the Shares of thePortfolio will be exempt from current taxation if left to accumulate within the variable insurance contractor qualified plan. Generally, withdrawals from such contracts may be subject to ordinary income tax and,if made before age 591/2, a 10% penalty tax. The tax status of your investment depends on the features ofyour qualified plan or variable insurance contract. Further information may be found in your plandocuments or in the prospectus of the separate account offering such contract.
Taxation of the Portfolio
Dividends, interest and some gains received by the Portfolio on foreign securities may be subject to taxwithholding or other foreign taxes. The Portfolio may from year to year make the election permitted underSection 853 of the Internal Revenue Code to pass through such taxes to shareholders as a foreign taxcredit. If such an election is not made, any foreign taxes paid or accrued will represent an expense to thePortfolio.
The Portfolio does not expect to pay any federal income or excise taxes because it intends to meet certainrequirements of the Internal Revenue Code. In addition, because the Shares of the Portfolio are sold inconnection with variable insurance contracts, the Portfolio intends to qualify under the Internal RevenueCode with respect to the diversification requirements related to the tax-deferred status of insurancecompany separate accounts.
Distributions and taxes 13

SHAREHOLDER’S GUIDE
INVESTORS MAY NOT PURCHASE OR REDEEM SHARES OF THE PORTFOLIO DIRECTLY. SHARESMAY BE PURCHASED OR REDEEMED ONLY THROUGH VARIABLE INSURANCE CONTRACTSOFFERED BY THE SEPARATE ACCOUNTS OF PARTICIPATING INSURANCE COMPANIES ORTHROUGH QUALIFIED RETIREMENT PLANS. REFER TO THE PROSPECTUS FOR THE PARTICIPAT-ING INSURANCE COMPANY’S SEPARATE ACCOUNT OR YOUR PLAN DOCUMENTS FORINSTRUCTIONS ON PURCHASING OR SELLING OF VARIABLE INSURANCE CONTRACTS ANDON HOW TO SELECT THE PORTFOLIO AS AN INVESTMENT OPTION FOR A CONTRACT OR AQUALIFIED PLAN.
PRICING OF PORTFOLIO SHARES
Investments will be processed at the NAV next calculated after an order is received and accepted by thePortfolio or its agent. In order to receive a day’s price, your order must be received by the close of theregular trading session of the New York Stock Exchange. Securities of the Portfolio are valued at marketvalue or, if a market quotation is not readily available, at their fair value determined in good faith underprocedures established by and under the supervision of the Trustees. Short-term instruments maturingwithin 60 days are valued at amortized cost, which approximates market value.
Because foreign securities markets may operate on days that are not business days in the United States, thevalue of the Portfolio’s holdings may change on days when you will not be able to purchase or redeem thePortfolio’s Shares.
PURCHASES
Purchases of Shares may be made only by the separate accounts of insurance companies for the purpose offunding variable insurance contracts or by qualified plans. Refer to the prospectus of the appropriateinsurance company separate account or your plan documents for information on how to invest in theShares of the Portfolio. Participating insurance companies and certain other designated organizations areauthorized to receive purchase orders on the Portfolio’s behalf.
The Portfolio is not intended for excessive trading or market timing. Excessive purchases of PortfolioShares disrupt portfolio management and drive Portfolio expenses higher. The Portfolio reserves the rightto reject any specific purchase order, including exchange purchases, for any reason. For example, purchaseorders may be refused if the Portfolio would be unable to invest the money effectively in accordance withits investment policies or would otherwise be adversely affected due to the size of the transaction,frequency of trading or other factors. The Portfolio may also suspend or terminate your exchange privilegeif you engage in an excessive pattern of exchanges. For more information about the Portfolio’s policy onmarket timing, see ‘‘Excessive Trading’’ on the next page.
Although there is no present intention to do so, the Portfolio may discontinue sales of its shares ifmanagement and the Trustees believe that continued sales may adversely affect the Portfolio’s ability toachieve its investment objective. If sales of the Portfolio’s Shares are discontinued, it is expected thatexisting policy owners and plan participants invested in the Portfolio would be permitted to continue toauthorize investment in the Portfolio and to reinvest any dividends or capital gains distributions, absenthighly unusual circumstances.
The Portfolio may discontinue sales to a qualified plan and require plan participants with existinginvestments in the Shares to redeem those investments if the plan loses (or in the opinion of Janus Capital,is at risk of losing) its qualified plan status.
14 Janus Aspen Series

REDEMPTIONS
Redemptions, like purchases, may be effected only through the separate accounts of participating insurancecompanies or through qualified plans. Please refer to the appropriate separate account prospectus or plandocuments for details.
Shares of the Portfolio may be redeemed on any business day. Redemptions are processed at the NAV nextcalculated after receipt and acceptance of the redemption order by the Portfolio or its agent. Redemptionproceeds will normally be wired to the participating insurance company the business day following receiptof the redemption order, but in no event later than seven days after receipt of such order.
EXCESSIVE TRADING
Frequent trading into and out of the Portfolio can disrupt portfolio investment strategies and increaseportfolio expenses for all shareholders, including long-term shareholders who do not generate these costs.The Portfolio is not intended for market timing or excessive trading. The Portfolio and its agents reservethe right to reject any purchase request (including exchange purchases if permitted by your insurancecompany or plan sponsor) by any investor or group of investors indefinitely if they believe that anycombination of trading activity in the account(s) is attributable to market timing or is otherwise excessiveor potentially disruptive to the Portfolio. The Portfolio may refuse purchase orders (including exchangepurchases) for any reason without prior notice, particularly orders that the Portfolio believes are made onbehalf of market timers.
The trading history of accounts under common ownership or control may be considered in enforcing thesepolicies. Transactions placed through the same insurance company or plan sponsor on an omnibus basismay be deemed part of a group for the purpose of this policy and may be rejected in whole or in part bythe Portfolio. Transactions accepted by your insurance company or plan sponsor in violation of ourexcessive trading policy are not deemed accepted by the Portfolio and may be cancelled or revoked by thePortfolio on the next business day following receipt by your intermediary.
SHAREHOLDER COMMUNICATIONS
Shareholders will receive annual and semiannual reports including the financial statements of the Shares ofthe Portfolio that they have authorized for investment. Each report will show the investments owned bythe Portfolio and the market values thereof, as well as other information about the Portfolio and itsoperations. The Trust’s fiscal year ends December 31.
Shareholder’s guide 15

FINANCIAL HIGHLIGHTS
The financial highlights table is intended to help you understand the Institutional Shares’ financialperformance for each of the five most recent years. Items 1 through ‘‘Net asset value, end of period’’ reflectfinancial results for a single Share. The total returns in the table represent the rate that an investor wouldhave earned (or lost) on an investment in the Institutional Shares of the Portfolio (assuming reinvestmentof all dividends and distributions) but do not include charges and expenses attributable to any insuranceproduct. This information has been audited by PricewaterhouseCoopers LLP, whose report, along with thePortfolio’s financial statements, is included in the Annual Report, which is available upon request andincorporated by reference into the SAI.
Growth Portfolio – Institutional Shares
Years ended December 312001 2000 1999 1998 1997
1. Net asset value, beginning of period $26.48 $33.65 $23.54 $18.48 $15.51
Income from investment operations:2. Net investment income 0.02 0.05 0.07 0.05 0.153. Net gains or losses on securities (both realized and unrealized) (6.56) (4.59) 10.24 6.36 3.34
4. Total from investment operations (6.54) (4.54) 10.31 6.41 3.49
Less distributions:5. Dividends (from net investment income) (0.01) (0.06) (0.06) (0.05) (0.15)6. Distributions (from capital gains) (0.04) (2.57) (0.14) (1.30) (0.37)
7. Total distributions (0.05) (2.63) (0.20) (1.35) (0.52)
8. Net asset value, end of period $19.89 $26.48 $33.65 $23.54 $18.48
9. Total return (24.73%) (14.55%) 43.98% 35.66% 22.75%
10. Net assets, end of period (in thousands) $2,490,954 $3,529,807 $2,942,649 $1,103,549 $608,28111. Average net assets for the period (in thousands) $2,911,331 $3,734,449 $1,775,373 $789,454 $477,91412. Ratio of gross expenses to average net assets(1) 0.66%(2) 0.67%(2) 0.67%(2) 0.68%(2) 0.70%(2)
13. Ratio of net expenses to average net assets(3) 0.66% 0.67% 0.67% 0.68% 0.69%14. Ratio of net investment income to average net assets 0.07% 0.19% 0.30% 0.26% 0.91%15. Portfolio turnover rate 48% 47% 53% 73% 122%
(1) The expense ratio reflects expenses prior to any expense offset arrangements.(2) The ratio was 0.66% in 2001, 0.67% in 2000, 0.69% in 1999, 0.75% in 1998 and 0.78% in 1997 before waiver of certain fees and/or reduction of
adviser’s fees to the effective rate of Janus Fund.(3) The expense ratio reflects expenses after any expense offset arrangements.
16 Janus Aspen Series

GLOSSARY OF INVESTMENT TERMS
This glossary provides a more detailed description of some of the types of securities, investment strategiesand other instruments in which the Portfolio may invest. The Portfolio may invest in these instruments tothe extent permitted by its investment objective and policies. The Portfolio is not limited by this discussionand may invest in any other types of instruments not precluded by the policies discussed elsewhere in thisProspectus.
I. EQUITY AND DEBT SECURITIES
Bonds are debt securities issued by a company, municipality, government or government agency. Theissuer of a bond is required to pay the holder the amount of the loan (or par value of the bond) at aspecified maturity and to make scheduled interest payments.
Commercial paper is a short-term debt obligation with a maturity ranging from 1 to 270 days issued bybanks, corporations and other borrowers to investors seeking to invest idle cash. The Portfolio maypurchase commercial paper issued in private placements under Section 4(2) of the Securities Act of 1933.
Common stocks are equity securities representing shares of ownership in a company and usually carryvoting rights and earn dividends. Unlike preferred stock, dividends on common stock are not fixed but aredeclared at the discretion of the issuer’s board of directors.
Convertible securities are preferred stocks or bonds that pay a fixed dividend or interest payment and areconvertible into common stock at a specified price or conversion ratio.
Debt securities are securities representing money borrowed that must be repaid at a later date. Suchsecurities have specific maturities and usually a specific rate of interest or an original purchase discount.
Depositary receipts are receipts for shares of a foreign-based corporation that entitle the holder todividends and capital gains on the underlying security. Receipts include those issued by domestic banks(American Depositary Receipts), foreign banks (Global or European Depositary Receipts) and broker-dealers(depositary shares).
Equity securities generally include domestic and foreign common stocks; preferred stocks; securitiesconvertible into common stocks or preferred stocks; warrants to purchase common or preferred stocks;and other securities with equity characteristics.
Fixed-income securities are securities that pay a specified rate of return. The term generally includes short-and long-term government, corporate and municipal obligations that pay a specified rate of interest,dividends or coupons for a specified period of time. Coupon and dividend rates may be fixed for the lifeof the issue or, in the case of adjustable and floating rate securities, for a shorter period.
High-yield/High-risk bonds are bonds that are rated below investment grade by the primary rating agencies(e.g., BB or lower by Standard & Poor’s and Ba or lower by Moody’s). Other terms commonly used todescribe such bonds include ‘‘lower rated bonds,’’ ‘‘noninvestment grade bonds’’ and ‘‘junk bonds.’’
Mortgage- and asset-backed securities are shares in a pool of mortgages or other debt. These securities aregenerally pass-through securities, which means that principal and interest payments on the underlyingsecurities (less servicing fees) are passed through to shareholders on a pro rata basis. These securitiesinvolve prepayment risk, which is the risk that the underlying mortgages or other debt may be refinancedor paid off prior to their maturities during periods of declining interest rates. In that case, the portfoliomanager may have to reinvest the proceeds from the securities at a lower rate. Potential market gains on asecurity subject to prepayment risk may be more limited than potential market gains on a comparablesecurity that is not subject to prepayment risk.
Glossary of investment terms 17

Passive foreign investment companies (PFICs) are any foreign corporations which generate certainamounts of passive income or hold certain amounts of assets for the production of passive income. Passiveincome includes dividends, interest, royalties, rents and annuities. To avoid taxes and interest that thePortfolio must pay if these investments are profitable, the Portfolio may make various elections permittedby the tax laws. These elections could require that the Portfolio recognize taxable income, which in turnmust be distributed, before the securities are sold and before cash is received to pay the distributions.
Pay-in-kind bonds are debt securities that normally give the issuer an option to pay cash at a couponpayment date or give the holder of the security a similar bond with the same coupon rate and a face valueequal to the amount of the coupon payment that would have been made.
Preferred stocks are equity securities that generally pay dividends at a specified rate and have preferenceover common stock in the payment of dividends and liquidation. Preferred stock generally does not carryvoting rights.
Rule 144A securities are securities that are not registered for sale to the general public under the SecuritiesAct of 1933, but that may be resold to certain institutional investors.
Standby commitments are obligations purchased by the Portfolio from a dealer that give the Portfolio theoption to sell a security to the dealer at a specified price.
Step coupon bonds are debt securities that trade at a discount from their face value and pay couponinterest. The discount from the face value depends on the time remaining until cash payments begin,prevailing interest rates, liquidity of the security and the perceived credit quality of the issuer.
Strip bonds are debt securities that are stripped of their interest (usually by a financial intermediary) afterthe securities are issued. The market value of these securities generally fluctuates more in response tochanges in interest rates than interest-paying securities of comparable maturity.
Tender option bonds are generally long-term securities that are coupled with an option to tender thesecurities to a bank, broker-dealer or other financial institution at periodic intervals and receive the facevalue of the bond. This type of security is commonly used as a means of enhancing the security’s liquidity.
U.S. government securities include direct obligations of the U.S. government that are supported by its fullfaith and credit. Treasury bills have initial maturities of less than one year, Treasury notes have initialmaturities of one to ten years and Treasury bonds may be issued with any maturity but generally havematurities of at least ten years. U.S. government securities also include indirect obligations of the U.S.government that are issued by federal agencies and government sponsored entities. Unlike Treasurysecurities, agency securities generally are not backed by the full faith and credit of the U.S. government.Some agency securities are supported by the right of the issuer to borrow from the Treasury, others aresupported by the discretionary authority of the U.S. government to purchase the agency’s obligations andothers are supported only by the credit of the sponsoring agency.
Variable and floating rate securities have variable or floating rates of interest and, under certain limitedcircumstances, may have varying principal amounts. Variable and floating rate securities pay interest atrates that are adjusted periodically according to a specified formula, usually with reference to some interestrate index or market interest rate (the ‘‘underlying index’’). The floating rate tends to decrease the security’sprice sensitivity to changes in interest rates.
Warrants are securities, typically issued with preferred stock or bonds, that give the holder the right tobuy a proportionate amount of common stock at a specified price. The specified price is usually higher
18 Janus Aspen Series

than the market price at the time of issuance of the warrant. The right may last for a period of yearsor indefinitely.
Zero coupon bonds are debt securities that do not pay regular interest at regular intervals, but are issued ata discount from face value. The discount approximates the total amount of interest the security will accruefrom the date of issuance to maturity. The market value of these securities generally fluctuates more inresponse to changes in interest rates than interest-paying securities.
II. FUTURES, OPTIONS AND OTHER DERIVATIVES
Forward contracts are contracts to purchase or sell a specified amount of a financial instrument for anagreed upon price at a specified time. Forward contracts are not currently exchange traded and aretypically negotiated on an individual basis. The Portfolio may enter into forward currency contracts tohedge against declines in the value of securities denominated in, or whose value is tied to, a currencyother than the U.S. dollar or to reduce the impact of currency appreciation on purchases of such securities.It may also enter into forward contracts to purchase or sell securities or other financial indices.
Futures contracts are contracts that obligate the buyer to receive and the seller to deliver an instrument ormoney at a specified price on a specified date. The Portfolio may buy and sell futures contracts on foreigncurrencies, securities and financial indices including indices of U.S. government, foreign government,equity or fixed-income securities. The Portfolio may also buy options on futures contracts. An option on afutures contract gives the buyer the right, but not the obligation, to buy or sell a futures contract at aspecified price on or before a specified date. Futures contracts and options on futures are standardized andtraded on designated exchanges.
Indexed/structured securities are typically short- to intermediate-term debt securities whose value atmaturity or interest rate is linked to currencies, interest rates, equity securities, indices, commodity pricesor other financial indicators. Such securities may be positively or negatively indexed (i.e. their value mayincrease or decrease if the reference index or instrument appreciates). Indexed/structured securities mayhave return characteristics similar to direct investments in the underlying instruments and may be morevolatile than the underlying instruments. The Portfolio bears the market risk of an investment in theunderlying instruments, as well as the credit risk of the issuer.
Interest rate swaps involve the exchange by two parties of their respective commitments to pay or receiveinterest (e.g., an exchange of floating rate payments for fixed rate payments).
Inverse floaters are debt instruments whose interest rate bears an inverse relationship to the interest rateon another instrument or index. For example, upon reset the interest rate payable on a security may godown when the underlying index has risen. Certain inverse floaters may have an interest rate resetmechanism that multiplies the effects of change in the underlying index. Such mechanism may increase thevolatility of the security’s market value.
Options are the right, but not the obligation, to buy or sell a specified amount of securities or other assetson or before a fixed date at a predetermined price. The Portfolio may purchase and write put and calloptions on securities, securities indices and foreign currencies.
III. OTHER INVESTMENTS, STRATEGIES AND/OR TECHNIQUES
Repurchase agreements involve the purchase of a security by the Portfolio and a simultaneous agreementby the seller (generally a bank or dealer) to repurchase the security from the Portfolio at a specified date orupon demand. This technique offers a method of earning income on idle cash. These securities involve therisk that the seller will fail to repurchase the security, as agreed. In that case, the Portfolio will bear the
Glossary of investment terms 19

risk of market value fluctuations until the security can be sold and may encounter delays and incur costsin liquidating the security.
Reverse repurchase agreements involve the sale of a security by the Portfolio to another party (generally abank or dealer) in return for cash and an agreement by the Portfolio to buy the security back at a specifiedprice and time. This technique will be used primarily to provide cash to satisfy unusually high redemptionrequests, or for other temporary or emergency purposes.
Short sales in which the Portfolio may engage may be of two types, short sales ‘‘against the box’’ or‘‘naked’’ short sales. Short sales against the box involve selling either a security that the Portfolio owns, ora security equivalent in kind or amount to the security sold short that the Portfolio has the right to obtain,for delivery at a specified date in the future. Naked short sales involve selling a security that the Portfolioborrows and does not own. The Portfolio may enter into a short sale to hedge against anticipated declinesin the market price of a security or to reduce portfolio volatility. If the value of a security sold shortincreases prior to the scheduled delivery date, the Portfolio loses the opportunity to participate in the gain.For ‘‘naked’’ short sales, the Portfolio will incur a loss if the value of a security increases during this periodbecause it will be paying more for the security than it has received from the purchaser in the short saleand if the price declines during this period, the Portfolio will realize a short-term capital gain. Althoughthe Portfolio’s potential for gain as a result of a short sale is limited to the price at which it sold thesecurity short less the cost of borrowing the security, its potential for loss is theoretically unlimited becausethere is no limit to the cost of replacing the borrowed security.
When-issued, delayed delivery and forward transactions generally involve the purchase of a security withpayment and delivery at some time in the future – i.e., beyond normal settlement. The Portfolio does notearn interest on such securities until settlement and bear the risk of market value fluctuations in betweenthe purchase and settlement dates. New issues of stocks and bonds, private placements andU.S. government securities may be sold in this manner.
20 Janus Aspen Series

You can request other information, including a Statement of AdditionalInformation, Annual Report or Semiannual Report, free of charge, bycontacting your insurance company or plan sponsor or visiting our Website at janus.com. In the Portfolio’s Annual and Semiannual Reports, youwill find a discussion of the market conditions and investment strategiesthat significantly affected the Portfolio’s performance during its lastfiscal year. Other information is also available from financialintermediaries that sell Shares of the Portfolio.
The Statement of Additional Information provides detailed informationabout the Portfolio and is incorporated into this Prospectus by reference.You may review and copy information about the Portfolio (including thePortfolio’s Statement of Additional Information) at the Public ReferenceRoom of the SEC or get text only copies, after paying a duplicating fee,by sending an electronic request by e-mail to [email protected] or bywriting to or calling the Public Reference Room, Washington, D.C.20549-0102 (1-202-942-8090). You may also obtain reports and otherinformation about the Portfolio from the Electronic Data GatheringAnalysis and Retrieval (EDGAR) Database on the SEC’s Web site athttp://www.sec.gov.
www.janus.com
100 Fillmore StreetDenver, CO 80206-49281-800-525-0020
Investment Company Act File No. 811-7736

ProspectusM A Y 1 , 2 0 0 2 Initial Class
MFS® EMERGING GROWTH SERIES
This Prospectus describes one series of the MFS Variable Insurance Trust (referred to as the trust):1. MFS Emerging Growth Series seeks to provide long-term growth of capital (referred to as the Emerging Growth Series).
The Securities and Exchange Commission has not approved or disapproved the series’ shares or determined whether thisprospectus is accurate or complete. Anyone who tells you otherwise is committing a crime.
MFS® VARIABLE INSURANCE TRUSTSM
Merrill Corporation - MFS CUNA Mutual #1 Tailored VIT | nthao | 13-Apr-02 08:08 | 02wbn2494.a | Sequence: 1CLEANCHKSUM Content: 94248 Layout: 113566 Graphics: 56811
NAME: MFS CUNA Mutual #1 Tailored VITPROJ: P1930wbn02 JOB: 02wbn2494 CYCLE#;BL#: 1; 0 TRIM: 8.5" x 11" DOC TYPE: ProspectusAS: Merrill Woburn: 781-939-0500
COMPOSITECOLORS: BlackGRAPHICS: mfs¤ no tag.eps

Page
I Expense Summary . . . . . . . . . . . . . . . . . . . . . . . . . . . . . . . . . . . . . . . . . . . . . . . . . . . . . . . . . . . . . . . . . . . . . . . . . . . . . . . 1
II Risk Return Summary . . . . . . . . . . . . . . . . . . . . . . . . . . . . . . . . . . . . . . . . . . . . . . . . . . . . . . . . . . . . . . . . . . . . . . . . . . . . 2
1. Emerging Growth Series . . . . . . . . . . . . . . . . . . . . . . . . . . . . . . . . . . . . . . . . . . . . . . . . . . . . . . . . . . . . . . . . . . . . . . . 2
III Certain Investment Strategies and Risks . . . . . . . . . . . . . . . . . . . . . . . . . . . . . . . . . . . . . . . . . . . . . . . . . . . . . . . . . . . . . . 5
IV Management of the Series . . . . . . . . . . . . . . . . . . . . . . . . . . . . . . . . . . . . . . . . . . . . . . . . . . . . . . . . . . . . . . . . . . . . . . . . 5
V Description of Shares . . . . . . . . . . . . . . . . . . . . . . . . . . . . . . . . . . . . . . . . . . . . . . . . . . . . . . . . . . . . . . . . . . . . . . . . . . . . 6
VI Other Information . . . . . . . . . . . . . . . . . . . . . . . . . . . . . . . . . . . . . . . . . . . . . . . . . . . . . . . . . . . . . . . . . . . . . . . . . . . . . . . 6
VII Financial Highlights . . . . . . . . . . . . . . . . . . . . . . . . . . . . . . . . . . . . . . . . . . . . . . . . . . . . . . . . . . . . . . . . . . . . . . . . . . . . . . 7
Appendix A — Investment Techniques and Practices . . . . . . . . . . . . . . . . . . . . . . . . . . . . . . . . . . . . . . . . . . . . . . . . . . . . A-1
TABLE OF CONTENTS
Merrill Corporation - MFS CUNA Mutual #1 Tailored VIT | nthao | 13-Apr-02 08:08 | 02wbn2494.a | Sequence: 2CLEANCHKSUM Content: 423936 Layout: 516932 Graphics: No Graphics
NAME: MFS CUNA Mutual #1 Tailored VITPROJ: P1930wbn02 JOB: 02wbn2494 CYCLE#;BL#: 1; 0 TRIM: 8.5" x 11" DOC TYPE: ProspectusAS: Merrill Woburn: 781-939-0500
COMPOSITECOLORS: BlackGRAPHICS: none

The trust offers shares of its 15 series to separate accounts established by insurance companies in order to serve as investment vehicles forvariable annuity and variable life insurance contracts and to qualified pension and retirement plans. Each of these series is managed byMassachusetts Financial Services Company (referred to as MFS or the adviser). One of these is described below.
Expense TableThis table describes the fees and expenses that you may pay when you hold initial class shares of each series. These fees and expenses do nottake into account the fees and expenses imposed by insurance companies through which your investment in a series may be made.
Annual Series Operating Expenses (expenses that are deducted from a series’ assets):EmergingGrowthSeries
Management Fee . . . . . . . . . . . . . . . . . . . . . . . . . . . . . . . . . . . . . . . . . . . . . . . . . . . . . . . . . . . . . . . . . . . . . . . . 0.75%Other Expenses(1) . . . . . . . . . . . . . . . . . . . . . . . . . . . . . . . . . . . . . . . . . . . . . . . . . . . . . . . . . . . . . . . . . . . . . . . . 0.12%Total Annual Series Operating Expenses . . . . . . . . . . . . . . . . . . . . . . . . . . . . . . . . . . . . . . . . . . . . . . . . . . . . . . 0.87%
Expense Reimbursement . . . . . . . . . . . . . . . . . . . . . . . . . . . . . . . . . . . . . . . . . . . . . . . . . . . . . . . . . . . . . . . . N/ANet Expenses(1) . . . . . . . . . . . . . . . . . . . . . . . . . . . . . . . . . . . . . . . . . . . . . . . . . . . . . . . . . . . . . . . . . . . . . . . 0.87%
(1) Each series has an expense offset arrangement which reduces the series’ custodian fee based upon the amount of cash maintained by the series with its custodian anddividend disbursing agent. Each series may enter into other such arrangements and directed brokerage arrangements, which would also have the effect of reducing theseries’ expenses. “Other Expenses” do not take into account these expense reductions, and are therefore higher than the actual expenses of the series. Had these feereductions been taken into account, “Net Expenses” would be lower for certain series and would equal 0.86% for Emerging Growth Series.
(2) “Other Expenses” are based on estimated amounts for the current fiscal year.
Example of Expenses—Initial ClassThese examples are intended to help you compare the cost of investing in the series with the cost of investing in other mutual funds. These examplesdo not take into account the fees and expenses imposed by insurance companies through which your investment in a series may be made.
The examples assume that:
• You invest $10,000 in the series for the time periods indicated and you redeem your shares at the end of the time periods;
• Your investment has a 5% return each year and dividends and other distributions are reinvested; and
• The series’ operating expenses remain the same, except that for the Capital Opportunities Series, Mid Cap Growth Series, New DiscoverySeries, High Income Series, Strategic Income Series, Global Equity Series, Bond Series, Money Market Series and Value Series the series’total operating expenses are assumed to be the series’ “Net Expenses” for the first year, and the series’ “Total Annual Series OperatingExpenses” for subsequent years (see the expense table on the previous page).
Although your actual costs may be higher or lower, under these assumptions your costs would be:Period
1 Year 3 Years 5 Years 10 Years
Emerging Growth Series $89 $278 $482 $1,073
I EXPENSE SUMMARY
1
Merrill Corporation - MFS CUNA Mutual #1 Tailored VIT | nthao | 13-Apr-02 08:07 | 02wbn2494.b | Sequence: 1CLEANCHKSUM Content: 342794 Layout: 355014 Graphics: 158624
NAME: MFS CUNA Mutual #1 Tailored VITPROJ: P1930wbn02 JOB: 02wbn2494 CYCLE#;BL#: 1; 0 TRIM: 8.5" x 11" DOC TYPE: ProspectusAS: Merrill Woburn: 781-939-0500
COMPOSITECOLORS: BlackGRAPHICS: triangle.eps

Investment strategies which are common to all series are described under the caption “Certain Investment Strategies.”
1: Emerging Growth Series
Investment ObjectiveThe series’ investment objective is long term growth of capital. This objective may be changed without shareholder approval.
Principal Investment PoliciesThe series invests, under normal market conditions, at least 65% of its net assets in common stocks and related securities, such as preferredstocks, convertible securities and depositary receipts for those securities, of emerging growth companies. Emerging growth companies arecompanies which MFS believes are either:
• early in their life cycle but which have the potential to become major enterprises, or
• major enterprises whose rates of earnings growth are expected to accelerate because of special factors, such as rejuvenated management,new products, changes in consumer demand, or basic changes in the economic environment.
Emerging growth companies may be of any size, and MFS would expect these companies to have products, technologies, management,markets and opportunities which will facilitate earnings growth over time that is well above the growth rate of the overall economy and therate of inflation. The series’ investments may include securities listed on a securities exchange or traded in the over-the-counter (OTC) markets.
MFS uses a bottom-up, as opposed to a top-down, investment style in managing the equity-oriented funds (such as the series) it advises. Thismeans that securities are selected based upon fundamental analysis (such as an analysis of earnings, cash flows, competitive position andmanagement’s abilities) performed by the series’ portfolio manager and MFS’ large group of equity research analysts.
While the series is a diversified fund and therefore spreads its investments across a number of issuers, it may invest a relatively large percentageof its assets in a single issuer as compared to other funds managed by MFS.
The series may invest in foreign securities (including emerging market securities), through which it may have exposure to foreign currencies.
The series has engaged and may engage in active and frequent trading to achieve its principal investment strategies.
Principal Risks of an InvestmentThe principal risks of investing in the series and the circumstances reasonably likely to cause the value of your investment in the series todecline are described below. The share price of the series generally changes daily based on market conditions and other factors. Please notethat there are many circumstances which could cause the value of your investment in the series to decline, and which could prevent the seriesfrom achieving its objective, that are not described here.
The principal risks of investing in the series are:
• Market Risk: This is the risk that the price of a security held by the series will fall due to changing economic, political or market conditionsor disappointing earnings results.
• Emerging Growth Risk: Prices of securities react to the economic condition of the company that issued the security. The series’ equityinvestments in an issuer may rise and fall based on the issuer’s actual and anticipated earnings, changes in management and the potentialfor takeovers and acquisitions. Investments in emerging growth companies may be subject to more abrupt or erratic market movements andmay involve greater risks than investments in other companies. Emerging growth companies often:
� have limited product lines, markets and financial resources
� are dependent on management by one or a few key individuals
� have shares which suffer steeper than average price declines after disappointing earnings reports and are more difficult to sell atsatisfactory prices
• Over-the-Counter Risk: OTC transactions involve risks in addition to those incurred by transactions in securities traded on exchanges. OTC-listed companies may have limited product lines, markets or financial resources. Many OTC stocks trade less frequently and in smallervolume than exchange-listed stocks. The values of these stocks may be more volatile than exchange-listed stocks, and the series mayexperience difficulty in purchasing or selling these securities at a fair price.
II RISK RETURN SUMMARY
2
Merrill Corporation - MFS CUNA Mutual #1 Tailored VIT | nthao | 13-Apr-02 08:07 | 02wbn2494.b | Sequence: 2CLEANCHKSUM Content: 140077 Layout: 198571 Graphics: 38426
NAME: MFS CUNA Mutual #1 Tailored VITPROJ: P1930wbn02 JOB: 02wbn2494 CYCLE#;BL#: 1; 0 TRIM: 8.5" x 11" DOC TYPE: ProspectusAS: Merrill Woburn: 781-939-0500
COMPOSITECOLORS: BlackGRAPHICS: triangle.eps

• Foreign Securities Risk: Investments in foreign securities involve risks relating to political, social and economic developments abroad, as wellas risks resulting from the differences between the regulations to which U.S. and foreign issuers and markets are subject:
� These risks may include the seizure by the government of company assets, excessive taxation, withholding taxes on dividends andinterest, limitations on the use or transfer of portfolio assets, and political or social instability.
� Enforcing legal rights may be difficult, costly and slow in foreign countries, and there may be special problems enforcing claimsagainst foreign governments.
� Foreign companies may not be subject to accounting standards or governmental supervision comparable to U.S. companies, and theremay be less public information about their operations.
� Foreign markets may be less liquid and more volatile than U.S. markets.
� Foreign securities often trade in currencies other than the U.S. dollar, and the series may directly hold foreign currencies and purchaseand sell foreign currencies through forward exchange contracts. Changes in currency exchange rates will affect the series’ net assetvalue, the value of dividends and interest earned, and gains and losses realized on the sale of securities. An increase in the strengthof the U.S. dollar relative to these other currencies may cause the value of the series to decline. Certain foreign currencies may beparticularly volatile, and foreign governments may intervene in the currency markets, causing a decline in value or liquidity in theseries’ foreign currency holdings. By entering into forward foreign currency exchange contracts, the series may be required to foregothe benefits of advantageous changes in exchange rates and, in the case of forward contracts entered into for the purpose ofincreasing return, the series may sustain losses which will reduce its gross income. Forward foreign currency exchange contractsinvolve the risk that the party with which the series enters into the contract may fail to perform its obligations to the series.
• Emerging Markets Risk: Emerging markets are generally defined as countries in the initial stages of their industrialization cycles with lowper capita income. The markets of emerging markets countries are generally more volatile than the markets of developed countries withmore mature economies. All of the risks of investing in foreign securities described above are heightened by investing in emerging marketscountries.
• Issuer Concentration Risk: Because the series may invest a relatively large percentage of its assets in a single issuer as compared to otherfunds managed by MFS, the series performance may be particularly sensitive to changes in the value of securities of these issuers.
• Active or Frequent Trading Risk: The series has engaged and may engage in active and frequent trading to achieve its principal investmentstrategies. Frequent trading increases transaction costs, which could detract from the series’ performance.
• As with any mutual fund, you could lose money on your investment in the series.
An investment in the series is not a bank deposit and is not insured or guaranteed by the Federal Deposit Insurance Corporation or any othergovernment agency.
Bar Chart and Performance TableThe bar chart and performance table below are intended to indicate some of the risks of investing in the series by showing changes in theseries’ performance over time. The performance table also shows how the series performance over time compares with that of one or morebroad measures of market performance. The chart and table provide past performance information based on calendar year periods. The series’past performance does not necessarily indicate how the series will perform in the future. The returns shown do not reflect fees and chargesimposed under the variable annuity and life insurance contracts through which an investment may be made. If these fees and charges wereincluded, they would reduce these returns.
3
Merrill Corporation - MFS CUNA Mutual #1 Tailored VIT | nthao | 13-Apr-02 08:07 | 02wbn2494.b | Sequence: 3CLEANCHKSUM Content: 121494 Layout: 121621 Graphics: 21244
NAME: MFS CUNA Mutual #1 Tailored VITPROJ: P1930wbn02 JOB: 02wbn2494 CYCLE#;BL#: 1; 0 TRIM: 8.5" x 11" DOC TYPE: ProspectusAS: Merrill Woburn: 781-939-0500
COMPOSITECOLORS: BlackGRAPHICS: triangle.eps

Bar ChartThe bar chart shows changes in the annual total returns of the series’ initial class, assuming the reinvestment of distributions.
During the period shown in the bar chart, the highest quarterly return was 55.05% (for the calendar quarter ended December 31, 1999) andthe lowest quarterly return was (29.03)% (for the calendar quarter ended September 30, 2001).
Performance TableThis table shows how the average annual total returns of the series’ shares compares to a broad measure of market performance and variousother market indicators and assumes the reinvestment of distributions.
Average Annual Total Returns as of December 31, 2001
1 Year 5 Year Life*
Emerging Growth Series—Initial Class (33.49)% 9.10% 12.41%Russell 2000 Index**† 2.49% 7.52% 9.37%Russell 3000® Growth Index**†† (19.63)% 7.72% 10.77%
* Series performance figures are for the period from the commencement of the series’ investment operations, July 24, 1995, through December 31, 2001. Index returnsare from August 1, 1995.
** Source: Standard & Poor’s Micropal, Inc.† The Russell 2000 Index is a broad-based, unmanaged index comprised of 2,000 of the smallest U.S.-domiciled company common stocks (on the basis of capitalization)
that are traded in the United States on the New York Stock Exchange (NYSE), the American Stock Exchange (AMEX), and NASDAQ. †† The Russell 3000 companies are the largest U.S. companies based on total market capitalization, which represent approximately 98% of the investable U.S. market.
The Russell 3000 Growth Index measures the performance of those Russell 3000 Index companies with higher price-to-book ratios and higher forecasted growthvalues.
Portfolio ManagersThe series is managed by a team of portfolio managers.
-60
20
40
60
100
-20
0
80
1996
17.02%
1997
21.90%
1998
34.16%
(33.49)%
2001
76.71%
1999
(19.61)%
2000
-40
4
Merrill Corporation - MFS CUNA Mutual #1 Tailored VIT | nthao | 13-Apr-02 08:07 | 02wbn2494.b | Sequence: 4CLEANCHKSUM Content: 159113 Layout: 177221 Graphics: 88384
NAME: MFS CUNA Mutual #1 Tailored VITPROJ: P1930wbn02 JOB: 02wbn2494 CYCLE#;BL#: 1; 0 TRIM: 8.5" x 11" DOC TYPE: ProspectusAS: Merrill Woburn: 781-939-0500
COMPOSITECOLORS: BlackGRAPHICS: 2494 Emerg Grow, triangle.eps

Further Information on Investment Strategies and RisksEach series may invest in various types of securities and engage in various investment techniques and practices which are not the principalfocus of the series and therefore are not described in this prospectus. The types of securities and investment techniques and practices in whicha series may engage, including the principal investment techniques and practices described above, are identified in Appendix A to thisProspectus, and are discussed, together with their risks, in the trust’s Statement of Additional Information (referred to as the SAI), which youmay obtain by contacting MFS Service Center, Inc. (see back cover for address and phone number).
Temporary Defensive PoliciesEach series may depart from its principal investment strategies by temporarily investing for defensive purposes when adverse market,economic or political conditions exist. While a series invests defensively, it may not be able to pursue its investment objective. A seriesdefensive investment position may not be effective in protecting its value.
Active or Frequent TradingEach series may engage in active and frequent trading to achieve its principal investment strategies. This may result in the realization anddistribution to shareholders of higher capital gains as compared to a series with less active trading policies. Frequent trading also increasestransaction costs, which could detract from the series’ performance.
Investment AdviserMassachusetts Financial Services Company (referred to as MFS or the adviser) is the investment adviser to each series. MFS is America’soldest mutual fund organization. MFS and its predecessor organizations have a history of money management dating from 1924 and thefounding of the first mutual fund, Massachusetts Investors Trust. Net assets under the management of the MFS organization wereapproximately $137 billion as of December 31, 2001. MFS is located at 500 Boylston Street, Boston, Massachusetts 02116.
MFS provides investment management and related administrative services and facilities to each series, including portfolio management andtrade execution. For these services, each series pays MFS an annual management fee as set forth in the Expense Summary.
MFS or its affiliates generally pay an administrative service fee to insurance companies which use the series as underlying investment vehiclesfor their variable annuity and variable life insurance contracts based upon the aggregate net assets of the series attributable to these contracts.These fees are not paid by the series, their shareholders, or by the contract holders.
AdministratorMFS provides each series with certain financial, legal, compliance, shareholder communications and other administrative services. MFS isreimbursed by each series for a portion of the costs it incurs in providing these services.
DistributorMFS Fund Distributors, Inc. (referred to as MFD), a wholly owned subsidiary of MFS, is the distributor of shares of the series.
IV MANAGEMENT OF THE SERIES
III CERTAIN INVESTMENT STRATEGIES AND RISKS
5
Merrill Corporation - MFS CUNA Mutual #1 Tailored VIT | nthao | 13-Apr-02 08:07 | 02wbn2494.c | Sequence: 1CLEANCHKSUM Content: 284174 Layout: 529985 Graphics: 133152
NAME: MFS CUNA Mutual #1 Tailored VITPROJ: P1930wbn02 JOB: 02wbn2494 CYCLE#;BL#: 1; 0 TRIM: 8.5" x 11" DOC TYPE: ProspectusAS: Merrill Woburn: 781-939-0500
COMPOSITECOLORS: BlackGRAPHICS: triangle.eps

Shareholder Servicing AgentMFS Service Center, Inc. (referred to as MFSC), a wholly owned subsidiary of MFS, performs transfer agency and certain other services for eachseries, for which it receives compensation from each series.
The trust offers two classes of shares—initial class shares and service class shares. Initial class shares are offered through this prospectus.Service class shares, which bear a Rule 12b-1 distribution fee, are available through a separate prospectus supplement. These shares areoffered to separate accounts established by insurance companies in order to serve as investment vehicles for variable annuity and variable lifeinsurance contracts. The trust also offers shares of each of its series to qualified pension and retirement plans. All purchases, redemptions andexchanges of shares are made through these insurance company separate accounts and plans, which are the record owner of the shares.Contract holders and plan beneficiaries seeking to purchase, redeem or exchange interests in the trust’s shares should consult with theinsurance company which issued their contracts or their plan sponsor.
Pricing of Series’ SharesThe price of each series’ shares is based on its net asset value. The net asset value of each series’ shares is determined once each day duringwhich the New York Stock Exchange is open for trading as of the close of regular trading on the New York Stock Exchange (generally, 4:00 p.m.,Eastern time) (referred to as the valuation time). The New York Stock Exchange is closed on most national holidays and Good Friday. Todetermine net asset value, each series values its assets at current market values, or at fair value as determined by the adviser under thedirection of the Board of Trustees that oversees the series if current market values are unavailable.
The securities held by each series that trade in foreign markets are usually valued on the basis of the most recent closing market prices inthose markets. Most foreign markets close before the series’ valuation time, generally at 4:00 p.m., Eastern time. For example, for securitiesprimarily traded in the Far East, the most recent closing prices may be as much as 15 hours old at 4:00 p.m., Eastern time. Normally,developments that could affect the values of portfolio securities that occur between the close of the foreign market and the series’ valuationtime will not be reflected in the series’ net asset value. However, if a determination is made that such developments are so significant thatthey will clearly and materially affect the value of the series’ securities, the series may adjust the previous closing prices to reflect what itbelieves to be the fair value of the securities as of the series’ valuation time. The series may fair value securities in other situations, forexample, when a particular foreign market is closed but the series is open.
Insurance companies and plan sponsors are the designees of the trust for receipt of purchase, exchange and redemption orders fromcontractholders and plan beneficiaries. An order submitted to the trust’s designee by the valuation time will receive the net asset value nextcalculated; provided that the trust receives notice of the order generally by 9:30 a.m. eastern time on the next day on which the New York StockExchange is open for trading.
Certain series invest in securities which are primarily listed on foreign exchanges that trade on weekends and other days when the series doesnot price its shares. Therefore, the value of these series’ shares may change on days when you will not be able to purchase or redeem theirshares.
DistributionsEach series intends to pay substantially all of its net income (including any realized net capital and net foreign currency gains) to shareholdersas dividends at least annually.
Tax ConsiderationsThe following discussion is very general. You are urged to consult your tax adviser regarding the effect that an investment in a series may haveon your tax situation. Each series of the trust is treated as a separate corporation for federal tax purposes. As long as a series qualifies fortreatment as a regulated investment company (which each series has done in the past and intends to do in the future), it pays no federal incometax on the net earnings and net realized gains it distributes to shareholders. In addition, each series also intends to continue to diversify itsassets to satisfy the federal diversification tax rules applicable to separate accounts that fund variable insurance and annuity contracts.
Shares of the series are offered to insurance company separate accounts and to qualified retirement and pension plans. You should consultwith the insurance company that issued your contract or your plan sponsor to understand the federal tax treatment of your investment.
VI OTHER INFORMATION
V DESCRIPTION OF SHARES
6
Merrill Corporation - MFS CUNA Mutual #1 Tailored VIT | nthao | 13-Apr-02 08:07 | 02wbn2494.c | Sequence: 2CLEANCHKSUM Content: 279100 Layout: 268135 Graphics: 201846
NAME: MFS CUNA Mutual #1 Tailored VITPROJ: P1930wbn02 JOB: 02wbn2494 CYCLE#;BL#: 1; 0 TRIM: 8.5" x 11" DOC TYPE: ProspectusAS: Merrill Woburn: 781-939-0500
COMPOSITECOLORS: BlackGRAPHICS: triangle.eps

Right to Reject or Restrict Purchase and Exchange OrdersPurchases and exchanges should be made for investment purposes only. Each series reserves the right to reject or restrict any specific purchaseor exchange request. Because an exchange request involves both a request to redeem shares of one series and to purchase shares of anotherseries, the series consider the underlying redemption and purchase requests conditioned upon the acceptance of each of these underlyingrequests. Therefore, in the event that the series reject an exchange request, neither the redemption nor the purchase side of the exchange willbe processed. When a series determines that the level of exchanges on any day may be harmful to its remaining shareholders, the series maydelay the payment of exchange proceeds for up to seven days to permit cash to be raised through the orderly liquidation of its portfoliosecurities to pay the redemption proceeds. In this case, the purchase side of the exchange will be delayed until the exchange proceeds arepaid by the redeeming series.
Excessive Trading PracticesThe series do not permit market-timing or other excessive trading practices. Excessive, short-term (market-timing) trading practices may disruptportfolio management strategies and harm series’ performance. As noted above, each series reserves the right to reject or restrict any purchaseorder (including exchanges) from any investor. To minimize harm to the series and their shareholders, the series will exercise these rights if aninvestor has a history of excessive trading or if an investor’s trading, in the judgment of the series, has been or may be disruptive to a series.In making this judgment, the series may consider trading done in multiple accounts under common ownership or control.
In-kind DistributionsThe series have reserved the right to pay redemption proceeds by a distribution in-kind of portfolio securities (rather than cash). In the eventthat the series makes an in-kind distribution, you could incur the brokerage and transaction charges when converting the securities to cash,and the securities may increase or decrease in value until you sell them. The series do not expect to make in-kind distributions.
Unique Nature of SeriesMFS may serve as the investment adviser to other funds which have investment goals and principal investment policies and risks similar tothose of the series, and which may be managed by the series’ portfolio manager(s). While a series may have many similarities to these otherfunds, its investment performance will differ from their investment performance. This is due to a number of differences between a series andthese similar products, including differences in sales charges, expense ratios and cash flows.
Potential ConflictsShares of the series are offered to the separate accounts of insurance companies that may be affiliated or unaffiliated with MFS and eachother (“shared funding”) and may serve as the underlying investments for both variable annuity and variable life insurance contracts (“mixedfunding”). Due to differences in tax treatment or other considerations, the interests of various contract owners might at some time be inconflict. The trust currently does not foresee any such conflict. Nevertheless, the board of trustees which oversees the series intends to monitorevents in order to identify any material irreconcilable conflicts which may possibly arise and to determine what action, if any, should be takenin response. If such a conflict were to occur, one or more separate accounts of the insurance companies might be required to withdraw itsinvestments in one or more series. This might force a series to sell securities at disadvantageous prices.
The financial highlights table is intended to help you understand the series’ financial performance for the past five years, or, if a series has notbeen in operation that long, since the time it commenced investment operations. Certain information reflects financial results for a singleseries’ share. The total returns in the table represent the rate by which an investor would have earned (or lost) on an investment in a series(assuming reinvestment of all distributions). This information has been audited by the trust’s independent auditors, whose report, together withthe trust’s financial statements, are included in the trust’s Annual Report to shareholders. The series’ Annual Report is available upon requestby contacting MFSC (see back cover for address and telephone number). These financial statements are incorporated by reference into the SAI.The trust’s independent auditors are Deloitte & Touche LLP.
VII FINANCIAL HIGHLIGHTS
7
Merrill Corporation - MFS CUNA Mutual #1 Tailored VIT | nthao | 13-Apr-02 08:07 | 02wbn2494.c | Sequence: 3CLEANCHKSUM Content: 286220 Layout: 309891 Graphics: 126924
NAME: MFS CUNA Mutual #1 Tailored VITPROJ: P1930wbn02 JOB: 02wbn2494 CYCLE#;BL#: 1; 0 TRIM: 8.5" x 11" DOC TYPE: ProspectusAS: Merrill Woburn: 781-939-0500
COMPOSITECOLORS: BlackGRAPHICS: triangle.eps

1. Emerging Growth Series—Initial Class
Year Ended December 31,
2001 2000 1999 1998 1997
Per share data (for a share outstanding throughout each period):
Net asset value — beginning of period . . . . . . . . . . . . . . . . . . $ 28.85 $ 37.94 $ 21.47 $ 16.13 $ 13.24Income from investment operations# —
Net investment income (loss)§ . . . . . . . . . . . . . . . . . . . . . . . $ (0.03) $ (0.01) $ (0.06) $ (0.05) $ (0.06)Net realized and unrealized gain on investments and
foreign currency transactions . . . . . . . . . . . . . . . . . . . . . (9.44) (7.07) 16.53 5.55 2.95Total from investment operations . . . . . . . . . . . . . . . $ (9.47) $ (7.08) $ 16.47 $ 5.50 $ 2.89
Less distributions declared to shareholders —From net realized gain on investments and foreign
currency transactions . . . . . . . . . . . . . . . . . . . . . . . . . . . (1.04) $ (2.01) $ — $ (0.05) $ —In excess of net realized gain on investments and
foreign currency transactions . . . . . . . . . . . . . . . . . . . . . (0.36) — — (0.11) —Total distributions declared to shareholders . . . . . . . $ (1.40) $ (2.01) $ — $ (0.16) $ —
Net asset value — end of period . . . . . . . . . . . . . . . . . . . . . . . $ 17.98 $ 28.85 $ 37.94 $ 21.47 $ 16.13Total return . . . . . . . . . . . . . . . . . . . . . . . . . . . . . . . . . . . . . . . . (33.49)% (19.61)% 76.71% 34.16% 21.90%Ratios (to average net assets)/Supplemental data§:
Expenses## . . . . . . . . . . . . . . . . . . . . . . . . . . . . . . . . . . . . . . 0.87% 0.85% 0.84% 0.85% 0.90%Net investment income (loss) . . . . . . . . . . . . . . . . . . . . . . . . (0.14)% (0.04)% (0.23)% (0.29)% (0.38)%
Portfolio turnover . . . . . . . . . . . . . . . . . . . . . . . . . . . . . . . . . . . 231% 200% 176% 71% 112%Net assets at end of period (000 Omitted) . . . . . . . . . . . . . . . . $1,462,469 $2,312,406 $2,132,528 $908,987 $384,480§ Prior to January 1, 1998, the investment adviser voluntarily agreed to maintain, subject to reimbursement by the series, the expenses of the series at not more than
1.00% of average daily net assets. To the extent actual expenses were over or under this limitation, the net investment loss per share and the ratios would have been:Net investment loss . . . . . . . . . . . . . . . . . . . . . . . . . . . . . . . — — — — $ (0.05)Ratios (to average net assets):
Expenses## . . . . . . . . . . . . . . . . . . . . . . . . . . . . . . . . . . . — — — — 0.87%Net investment loss . . . . . . . . . . . . . . . . . . . . . . . . . . . . — — — — (0.35)%
# Per share data are based on average shares outstanding.## Ratios do not reflect reductions from certain offset arrangements.
8
Merrill Corporation - MFS CUNA Mutual #1 Tailored VIT | nthao | 13-Apr-02 08:07 | 02wbn2494.c | Sequence: 4CLEANCHKSUM Content: 502869 Layout: 954363 Graphics: No Graphics
NAME: MFS CUNA Mutual #1 Tailored VITPROJ: P1930wbn02 JOB: 02wbn2494 CYCLE#;BL#: 1; 0 TRIM: 8.5" x 11" DOC TYPE: ProspectusAS: Merrill Woburn: 781-939-0500
COMPOSITECOLORS: BlackGRAPHICS: none

Investment Techniques and PracticesIn pursuing its investment objective and investment policies, the Emerging Growth Series may engage in the following principal and non-principal investment techniques and practices to the extent to which these techniques and practices are consistent with the series’ investmentobjective. Investment techniques and practices which the series will use or currently anticipates using are denoted by a check (�) mark.However, the series may not use all of these techniques and practices. Investment techniques and practices which the series does not currentlyanticipate using but which the series reserves the freedom to use are denoted by a dash (—) mark. Investment techniques and practices whichare the principal focus of the series are also described, together with their risks, in the Risk Return Summary of the Prospectus. Both principaland non-principal investment techniques and practices are described, together with their risks, in the SAI.
E m e r g i n g G r o w t h S e r i e sA p p e n d i x A
A-1
Debt SecuritiesAsset-Backed Securities
Collateralized Mortgage Obligations and MulticlassPass-Through Securities —
Corporate Asset-Backed Securities —Mortgage Pass-Through Securities —Stripped Mortgage-Backed Securities —
Corporate Securities �
Loans and Other Direct Indebtedness —Lower Rated Bonds �
Municipal Bonds —U.S. Government Securities �
Variable and Floating Rate Obligations �
Zero Coupon Bonds, Deferred Interest Bondsand PIK Bonds ·
Equity Securities �
Foreign Securities ExposureBrady Bonds —Depositary Receipts �
Dollar-Denominated Foreign Debt Securities —Emerging Markets �
Foreign Securities �
Forward Contracts �
Futures Contracts �
Indexed Securities/Structured Products —Inverse Floating Rate Obligations —
Investment in Other Investment CompaniesOpen-End Funds �
Closed-End Funds �
Lending of Portfolio Securities �
Leveraging TransactionsBank Borrowings —Mortgage “Dollar-Roll” Transactions �
Reverse Repurchase Agreements —OptionsOptions on Foreign Currencies �
Options on Futures Contracts �
Options on Securities �
Options on Stock Indices �
Reset Options —“Yield Curve” Options —
Repurchase Agreements �
Short Sales �
Short Term Instruments �
Swaps and Related Derivative Instruments —Temporary Borrowings �
Temporary Defensive Positions �
“When-Issued” Securities �
Investment Techniques/Practices
Symbols � series uses, or currently — permitted, but series does notanticipates using currently anticipate using
Merrill Corporation - MFS CUNA Mutual #1 Tailored VIT | nthao | 13-Apr-02 08:07 | 02wbn2494.c | Sequence: 5CLEANCHKSUM Content: 237439 Layout: 362145 Graphics: 21244
NAME: MFS CUNA Mutual #1 Tailored VITPROJ: P1930wbn02 JOB: 02wbn2494 CYCLE#;BL#: 1; 0 TRIM: 8.5" x 11" DOC TYPE: ProspectusAS: Merrill Woburn: 781-939-0500
COMPOSITECOLORS: BlackGRAPHICS: triangle.eps

MFS® VARIABLE INSURANCE TRUSTSM
If you want more information about the trust and its series, the following documents are available free upon request:
Annual/Semiannual Reports. These reports contain information about the series’ actual investments. Annual reports discuss the effect ofrecent market conditions and the series’ investment strategy on the series’ performance during their last fiscal year.
Statement of Additional Information (SAI). The SAI, dated May 1, 2002, provides more detailed information about the trust and its seriesand is incorporated into this prospectus by reference.
You can get free copies of the annual/semiannual reports, the SAI and other information about the trust and its series, andmake inquiries about the trust and its series, by contacting:
MFS Service Center, Inc. 2 Avenue de Lafayette Boston, MA 02111-1738 Telephone: 1-800-343-2829, ext. 3500Internet: http://www.mfs.com
Information about the trust and its series (including its prospectus, SAI and shareholder reports) can be reviewed and copied at the:
Public Reference RoomSecurities and Exchange Commission Washington, D.C., 20549-0102
Information on the operation of the Public Reference Room may be obtained by calling the Commission at 202-942-8090. Reports and otherinformation about the trust and its series are available on the EDGAR Databases on the Commission’s Internet website at http://www.sec.gov,and copies of this information may be obtained, upon payment of a duplicating fee, by electronic request at the following e-mail address:[email protected], or by writing the Public Reference Section at the above address.
The trust’s Investment Company Act file number is 811-8326
MSG 11/98 224M 90/290/390/890
Merrill Corporation - MFS CUNA Mutual #1 Tailored VIT | nthao | 13-Apr-02 08:06 | 02wbn2494.z | Sequence: 2CLEANCHKSUM Content: 7396 Layout: 90181 Graphics: No Graphics
NAME: MFS CUNA Mutual #1 Tailored VITPROJ: P1930wbn02 JOB: 02wbn2494 CYCLE#;BL#: 1; 0 TRIM: 8.5" x 11" DOC TYPE: ProspectusAS: Merrill Woburn: 781-939-0500
COMPOSITECOLORS: BlackGRAPHICS: none
Invest With Confidence
May 1, 2002
The Securities and Exchange Commission has not approved or disapproved these securities or passed upon the adequacy of this prospectus. Any representation to the contrary is a criminal offense.
PROSPECTUS
T. ROWE PRICE
InternationalStock PortfolioA stock fund seeking long-term capital growth
through investments in non-U.S. companies.
ISP02.fm Page -1 Monday, April 8, 2002 3:24 PM

ProspectusMay 1, 2002
T. Rowe Price International Series, Inc. T. Rowe Price International Stock Portfolio
T. Rowe Price International,
Inc. managed $24.4 billion in
foreign stocks and bonds as of
December 31, 2001, through
its offices in Baltimore,
London, Tokyo, Singapore,
Hong Kong, Buenos Aires, and
Paris.
Mutual fund shares are not deposits or obligations of, or guaranteed by, any depository institution. Shares are not insured by the FDIC, Federal Reserve, or any other government agency, and are subject to investment risks, including possible loss of the principal amount invested.
1 ABOUT THE FUND
Objective, Strategy, Risks, and Expenses 1
Other Information About the Fund 4
2 ABOUT YOUR ACCOUNT
Pricing Shares and Receiving Sale Proceeds 5
Rights Reserved by the Funds 6
Dividends and Other Distributions 7
3 MORE ABOUT THE FUND
Organization and Management 8
Understanding Performance Information 10
Investment Policies and Practices 10
Financial Highlights 14
ISP02.fm Page 0 Monday, April 8, 2002 3:24 PM

ABOUT THE FUND 1OBJECTIVE, STRATEGY, RISKS, AND EXPENSES
The fund should be used as an investment option for variable annuity and variable life insurance con-tracts.
What is the fund’s objective?
The fund seeks long-term growth of capital through investments primarily in the common stocks of established, non-U.S. companies.
What is the fund’s principal investment strategy?
We expect to invest substantially all of the fund’s assets in stocks outside the U.S. and to diversify broadly among developed and emerging countries throughout the world. Stock selection reflects a growth style. We may purchase the stocks of companies of any size, but our focus will typically be on large and, to a lesser extent, medium-sized companies. Normally, at least 80% of the fund’s net assets will be invested in stocks.
T. Rowe Price International, Inc. (“T. Rowe Price International”) employs in-depth fundamental research in an effort to identify companies capable of achieving and sustaining above-average, long-term earnings growth. We seek to purchase such stocks at reasonable prices in relation to present or anticipated earnings, cash flow, or book value, and valuation factors often influence our allocations among large-, mid-, or small-cap shares.
While we invest with an awareness of the global economic backdrop and our outlook for industry sectors and individual countries, bottom-up stock selection is the focus of our decision-making. Country allocation is driven largely by stock selection, though we may limit investments in markets that appear to have poor overall prospects.
In selecting stocks, we generally favor companies with one or more of the following characteristics:
• leading market position;• attractive business niche;• strong franchise or monopoly;• technological leadership or proprietary advantages;• seasoned management;• earnings growth and cash flow sufficient to support growing dividends; and• healthy balance sheet with relatively low debt.
In pursuing its investment objective, the fund’s management has the discretion to purchase some securities that do not meet its normal investment criteria, as described above, when it perceives an unusual opportunity for gain. These special situations might arise when the fund’s management believes a security could increase in value for a variety of reasons, including a change in management, an extraordinary corporate event, or a temporary imbalance in the supply of or demand for the securi-ties.
While the fund invests primarily in common stocks, the fund may also purchase other securities, including futures and options, in keeping with the fund’s objective.
The fund may sell securities for a variety of reasons, such as to secure gains, limit losses, or redeploy assets into more promising opportunities.
ISP02.fm Page 1 Monday, April 8, 2002 3:24 PM

T. ROWE PRICE 2
What are the main risks of investing in the fund?
As with all stock funds, the fund’s share price can fall because of weakness in one or more of its pri-mary equity markets, a particular industry, or specific holdings. Stock markets can decline for many reasons, including adverse political or economic developments, changes in investor psychology, or heavy institutional selling. The prospects for an industry or company may deteriorate because of a variety of factors, including disappointing earnings or changes in the competitive environment. In addition, our assessment of companies held in the fund may prove incorrect, resulting in losses or poor performance even in rising markets.
Funds that invest overseas generally carry more risk than funds that invest strictly in U.S. assets. Even investments in countries with highly developed economies are subject to significant risks. Some par-ticular risks affecting this fund include the following:
• Currency risk This refers to a decline in the value of a foreign currency versus the U.S. dollar, which reduces the dollar value of securities denominated in that currency. The overall impact on a fund’s holdings can be significant, unpredictable, and long-lasting depending on the currencies represented in the portfolio and how each one appreciates or depreciates in relation to the U.S. dollar, and whether currency positions are hedged. Under normal conditions, the fund does not engage in extensive foreign currency hedging programs. Further, exchange rate movements are volatile and it is not possible to effectively hedge the currency risks of many developing countries.
• Geographic risk The economies and financial markets of certain regions–such as Latin America and Asia–can be interdependent and may decline all at the same time.
• Emerging market risk To the extent the fund invests in emerging markets, it is subject to greater risk than a fund investing only in developed markets. The economic and political structures of develop-ing nations, in most cases, do not compare favorably with the U.S. or other developed countries in terms of wealth and stability, and their financial markets often lack liquidity. Fund performance will likely be hurt by exposure to nations in the midst of hyperinflation, currency devaluation, trade dis-agreements, sudden political upheaval, or interventionist government policies. Significant buying or selling by a few major investors may also heighten the volatility of emerging markets. These factors make investing in such countries significantly riskier than in other countries and any one of them could cause the fund’s share price to decline.
• Other risks of foreign investing Risks can result from the varying stages of economic and political development, differing regulatory environments, trading days, and accounting standards, and higher transaction costs of non-U.S. markets. Investments outside the United States could be subject to gov-ernmental actions such as capital or currency controls, nationalization of a company or industry, expropriation of assets, or imposition of high taxes.
3 While certain countries have made progress in economic growth, liberalization, fiscal discipline, and political and social stability, there is no assurance these trends will continue.
• Futures/options risk To the extent the fund uses futures and options, it is exposed to additional vola-tility and potential losses.
As with any mutual fund, there can be no guarantee the fund will achieve its objective.
3 The fund’s share price may decline, so when you sell your shares, you may lose money.
ISP02.fm Page 2 Monday, April 8, 2002 3:24 PM

ABOUT THE FUND 3
How can I tell if the fund is appropriate for me?
Consider your investment goals, your time horizon for achieving them, and your tolerance for risk. If you want to diversify your domestic stock portfolio by adding foreign investments, seek the long-term capital appreciation potential of growth stocks, and are comfortable with the risks that accom-pany foreign investments, the fund could be an appropriate part of your overall investment strategy.
3 The fund should not represent your complete investment program or be used for short-term trading purposes.
How has the fund performed in the past?
The bar chart showing calendar year returns and the average annual total return table indicate risk by illustrating how much returns can differ from one year to the next and over time. Fund past perfor-mance is no guarantee of future returns.
The fund can also experience short-term performance swings, as shown by the best and worst calen-dar quarter returns during the years depicted.
These figures include changes in principal value, reinvested dividends, and capital gain distributions, if any.
Figures do not reflect fees at the insurance product or contract level; if those fees were included, returns would be lower.
Table 1 Average Annual Total Returns
Periods endedDecember 31, 2001
1 year 5 yearsSince inception
(3/31/94)
International Stock Portfolio -22.21% 0.35% 3.66%
MSCI EAFE Index -21.21 1.17 3.57
Lipper Variable Annuity Underlying International Funds Average -21.48 2.09 5.17
Calendar Year ReturnsInternational Stock Portfolio
Best Quarter 12/31/99 24.01%
Worst Quarter 3/31/01 -15.20%
40 48%32241680-8-16-24
'01
'00
'99
'98
'97
'96
'95
QuarterEnded
TotalReturn
15.86
3.09
14.70
11.18
33.32
-17.84
-22.21
ISP02.fm Page 3 Monday, April 8, 2002 3:24 PM

T. ROWE PRICE 4
OTHER INFORMATION ABOUT THE FUND
What are some of the potential rewards of investing overseas through the fund?
Investing abroad increases the opportunities available to you. Some foreign countries may have greater potential for economic growth than the U.S. Investing a portion of your overall portfolio in foreign stock funds can enhance your diversification while providing the opportunity to boost long-term returns.
How does the portfolio manager try to reduce risk?
The principal tools we use to try to reduce risk are intensive research and limiting exposure to any one industry or company. Currency hedging techniques may be used from time to time.
• T. Rowe Price International employs a team of experienced portfolio managers and analysts, and has offices in London, Tokyo, Singapore, Hong Kong, Buenos Aires, Paris, and Baltimore. Portfolio managers keep close watch on individual investments as well as on political and economic trends in each country and region. Holdings are adjusted according to the manager’s analysis and outlook.
• The impact on the fund’s share price from a drop in the price of a particular stock is reduced sub-stantially by investing in a portfolio with dozens of different companies. Likewise, the impact of unfa-vorable developments in a particular country is reduced when investments are spread among many countries. However, the economies and financial markets of countries in a certain region may be influenced heavily by one another.
Is there other information I can review before making a decision?
Investment Policies and Practices in Section 3 discusses various types of portfolio securities the fund may purchase as well as types of management practices the fund may use.
ISP02.fm Page 4 Monday, April 8, 2002 3:24 PM

2ABOUT YOUR ACCOUNT
PRICING SHARES AND RECEIVING SALE PROCEEDS
Here are some procedures you should know when investing in the fund. For instructions on how to purchase and redeem shares of the fund, read the insurance contract prospectus.
Shares of the fund are designed to be offered to insurance company separate accounts estab-lished for the purpose of funding variable annuity contracts. They may also be offered to insur-ance company separate accounts established for the purpose of funding variable life contracts. Variable annuity and variable life contract holders or participants are not the shareholders of the fund. Rather, the separate account of the insurance company is the shareholder. The vari-able annuity and variable life contracts are described in separate prospectuses issued by the insurance companies. The fund assumes no responsibility for such prospectuses, or variable annuity or variable life contracts.
Shares of the fund are sold and redeemed without the imposition of any sales commission or redemption charge. However, certain other charges may apply to annuity or life contracts. Those charges are disclosed in the insurance contract prospectus.
Your ability to exchange from this fund to any other T. Rowe Price fund that serves as an investment option under your insurance contract is governed by the terms of that contract and the insurance contract prospectus, as well as the fund’s excessive trading policy described in this section.
How and when shares are pricedThe share price (also called “net asset value” or NAV per share) for a fund is calculated at the close of the New York Stock Exchange, normally 4 p.m. ET, each day the New York Stock Exchange is open for business. To calculate the NAV, the fund’s assets are valued and totaled, liabilities are subtracted, and the balance, called net assets, is divided by the number of shares outstanding. Market values are used to price stocks and bonds. Amortized cost is used to price securities held by money market funds.
The securities of funds investing in foreign markets are usually valued on the basis of the most recent closing market prices at 4 p.m. ET. Most foreign markets close before that time. For securities primarily traded in the Far East, for example, the most recent closing prices may be as much as 15 hours old at 4 p.m. Normally, developments that could affect the val-ues of portfolio securities that occur between the close of the foreign market and 4 p.m. ET will not be reflected in a fund NAV. However, if a fund determines that such developments are so significant that they will, in its judgment, clearly and materially affect the value of the fund’s securities, the fund may adjust the previous closing prices to reflect what it believes to be the fair value of the securities as of 4 p.m. ET. A fund may fair value securities in other sit-uations, for example, when a particular foreign market is closed but the fund is open.
How your purchase, sale, or exchange price is determinedPurchasesThe insurance companies purchase shares of the fund for their separate accounts, using premi-ums allocated by the contract holders or participants. Shares are purchased at the NAV next determined after the insurance company receives the premium payment in acceptable form.
ISP02.fm Page 5 Monday, April 8, 2002 3:24 PM

T. ROWE PRICE 6
Initial and subsequent payments allocated to the fund are subject to the limits stated in the insurance contract prospectus issued by the insurance company.
RedemptionsThe insurance companies redeem shares of the fund to make benefit or surrender payments under the terms of its contracts. Redemptions are processed on any day on which the New York Stock Exchange is open and are priced at the fund’s NAV next determined after the insur-ance company receives a surrender request in acceptable form.
Note: The time at which transactions and shares are priced and the time until which orders are accepted may be changed in case of an emergency or if the New York Stock Exchange closes at a time other than 4 p.m. ET.
How you can receive the proceeds from a sale
Payment for redeemed shares will be made promptly, but in no event later than seven days after receipt of your redemption order. However, the right of redemption may be suspended or the date of payment postponed in accordance with the Investment Company Act of 1940 (“1940 Act”). The amount received upon redemption of the shares of the fund may be more or less than the amount paid for the shares, depending on the fluctuations in the market value of the assets owned by the fund.
Excessive Trading
3 T. Rowe Price may bar excessive traders from purchasing shares.
Frequent trades or market timing involving your account or accounts controlled by you can disrupt management of a fund and raise its expenses. To deter such activity, each fund has adopted an excessive trading policy. If you violate this policy, you may be barred indefinitely and without further notice from further purchases of the T. Rowe Price funds. Our excessive trading policy applies to contract holders and participants notwithstanding any provisions in your insurance contract:
You can make one purchase and one sale involving the same fund within any 120-day period. If you exceed this limit or you hold fund shares for less than 60 calendar days, you are in vio-lation of our excessive trading policy. Systematic purchases and redemptions are exempt from this policy. Transactions accepted by insurance companies in violation of this excessive trad-ing policy or from persons believed to be market timers are subject to rejection or cancella-tion by the funds.
The terms of your insurance contract may also restrict your ability to trade between the invest-ment options available under your contract.
RIGHTS RESERVED BY THE FUNDS
T. Rowe Price funds and their agents reserve the following rights: (1) to waive or lower invest-ment minimums; (2) to refuse any purchase or exchange order; (3) to cancel or rescind any purchase or exchange order (including, but not limited to, orders deemed to result in excessive trading, market timing, fraud, or 5% ownership by individual contract holders or participants) upon notice to the contract holder or participant within five business days of the trade or if the written confirmation has not been received by the contract holder or participant, whichever is
ISP02.fm Page 6 Monday, April 8, 2002 3:24 PM

ABOUT YOUR ACCOUNT 7
sooner; (4) to freeze any account and suspend account services when notice has been received of a dispute between the registered or beneficial account owners or there is reason to believe a fraudulent transaction may occur; (5) to otherwise modify the conditions of purchase and any services at any time; or (6) to act on instructions believed to be genuine. These actions will be taken when, in the sole discretion of management, they are deemed to be in the best interest of the fund.
In an effort to protect T. Rowe Price funds from the possible adverse effects of a substantial redemption in a large account, as a matter of general policy, no contract holder or participant or group of contract holders or participants controlled by the same person or group of persons will knowingly be permitted to purchase in excess of 5% of the outstanding shares of the fund, except upon approval of the fund’s management.
DIVIDENDS AND OTHER DISTRIBUTIONS
For a discussion of the tax status of your variable annuity contract, please refer to the insurance contract prospectus.
Dividends and Other DistributionsThe policy of the fund is to distribute all of its net investment income and net capital gains each year to its shareholders, which are the separate accounts established by the various insur-ance companies in connection with their issuance of variable annuity and variable life con-tracts. Dividends from net investment income are declared daily and paid monthly for the Limited-Term Bond and Prime Reserve Portfolios; declared and paid quarterly for the Equity Income, Equity Index 500, and Personal Strategy Portfolios; and declared and paid annually for all other portfolios. All fund distributions made to a separate account will be reinvested automatically in additional fund shares, unless a shareholder (separate account) elects to receive distributions in cash. Under current law, dividends and distributions made by the fund to separate accounts generally are not taxable to the separate accounts, the insurance company, or the contract holder, provided that the separate account meets the diversification requirements of Section 817(h) of the Internal Revenue Code of 1986, as amended, and other tax-related requirements are satisfied. The fund intends to diversify its investments in the manner required under Code Section 817(h).
Foreign TransactionsIf the fund pays nonrefundable taxes to foreign governments during the year, the taxes will reduce fund dividends.
ISP02.fm Page 7 Monday, April 8, 2002 3:24 PM

3MORE ABOUT THE FUND
ORGANIZATION AND MANAGEMENT
How is the fund organized?
The T. Rowe Price International Series, Inc. (the “corporation”) was incorporated in Maryland in 1994. Currently, the corporation consists of one series, the International Stock Portfolio.
While the fund is managed in a manner similar to that of the T. Rowe Price International Stock Fund, investors should be aware that the fund is not the same fund and will not have the same performance. Investments made by the fund at any given time may not be the same as those made by the T. Rowe Price International Stock Fund. Different performance will result due to factors such as differences in the cash flows into and out of the fund, different fees and expenses, and differences in portfolio size and positions.
What is meant by “shares”?
Contract holders and participants indirectly (through the insurance company separate account) pur-chase shares when they put money in a fund offered as an investment option in their insurance con-tracts. These shares are part of a fund’s authorized capital stock, but share certificates are not issued.
Each share and fractional share entitles the shareholder (the insurance company separate account) to cast one vote per share on certain fund matters, including the election of fund directors, changes in fundamental policies, or approval of changes in the fund’s management contract.
The shares of the fund have equal voting rights. The various insurance companies own the outstand-ing shares of the fund in their separate accounts. These separate accounts are registered under the Investment Company Act of 1940 or are excluded from registration thereunder. Under current law, the insurance companies must vote the shares held in registered separate accounts in accordance with voting instructions received from variable contract holders or participants having the right to give such instructions.
Do T. Rowe Price funds have annual shareholder meetings?
The funds are not required to hold annual meetings and, to avoid unnecessary costs to fund shareholders, do not do so except when certain matters, such as a change in fundamental policies, must be decided. In addition, shareholders representing at least 10% of all eligible votes may call a special meeting, if they wish, for the purpose of voting on the removal of any fund director or trustee. If a meeting is held and you cannot attend, you can vote by proxy. Before the meeting, the insurance company will send you the fund’s proxy materials that explain the issues to be decided and include instructions on voting.
Who runs the fund?
General OversightThe corporation is governed by a Board of Directors that meets regularly to review the fund invest-ments, performance, expenses, and other business affairs. The Board elects the corporation’s officers. The majority of Board members are independent of T. Rowe Price International.
3 All decisions regarding the purchase and sale of fund investments are made by T. Rowe Price International–specifically by the fund’s Investment Advisory Group.
ISP02.fm Page 8 Monday, April 8, 2002 3:24 PM

MORE ABOUT THE FUND 9
Investment ManagerT. Rowe Price International is responsible for the selection and management of the fund’s portfolio investments. The company, a wholly owned subsidiary of T. Rowe Price Associates. The U.S. office of T. Rowe Price International is located at 100 East Pratt Street, Baltimore, Maryland 21202. Offices are also located in London, Tokyo, Singapore, Hong Kong, Buenos Aires, and Paris.
Portfolio ManagementThe fund has an Investment Advisory Group that has day-to-day responsibility for managing the portfolio and developing and executing the fund’s investment program. The members of the advisory group are: Mark C.J. Bickford-Smith, Frances Dydasco, John R. Ford, James B.M. Seddon, and David J.L. Warren.
Mark Bickford-Smith joined T. Rowe Price International in 1995 and has 17 years of experience in research and financial analysis. Frances Dydasco joined T. Rowe Price International in 1996 and has 13 years of experience in research and financial analysis. John Ford joined T. Rowe Price International in 1982 and has 22 years of experience in research and portfolio management. James Seddon joined T. Rowe Price International in 1987 and has 15 years of experience in portfolio management. David Warren joined T. Rowe Price International in 1983 and has 22 years of experience in equity research, fixed-income research, and portfolio management.
The Management FeeThe fund pays T. Rowe Price International an annual fee that includes investment management ser-vices and ordinary, recurring operating expenses, but does not cover interest, taxes, brokerage, nonre-curring and extraordinary items or fees and expenses for the fund’s independent directors. The fee is based on fund average daily net assets and is calculated and accrued daily. The fee for the fund for the most recent fiscal year was 1.05%.
In addition, from time to time, T. Rowe Price International may pay eligible insurance companies for services they provide to the fund for contract holders. These payments range from 0.15% to 0.25% of the average annual total assets invested by the separate accounts of the insurance company in the fund.
Variable Annuity and Variable Life ChargesVariable annuity and variable life fees and charges imposed on contract holders and participants by the insurance companies are in addition to those described previously and are described in the vari-able annuity and variable life contract prospectuses.
Variable Annuity and Variable Life ConflictsThe fund may serve as an investment medium for both variable annuity contracts and variable life insurance policies. Shares of the fund may be offered to separate accounts established by any number of insurance companies. The fund currently does not foresee any disadvantages to variable annuity contract owners due to the fact that the fund may serve as an investment medium for both variable life insurance policies and annuity contracts; however, due to differences in tax treatment or other consid-erations, it is theoretically possible that the interests of owners of annuity contracts and insurance pol-icies for which the fund serves as an investment medium might at some time be in conflict. However, the fund’s Board of Directors is required to monitor events to identify any material conflicts between variable annuity contract owners and variable life policy owners, and will determine what action, if any, should be taken in the event of such a conflict. If such a conflict were to occur, an insurance com-pany participating in the fund might be required to redeem the investment of one or more of its sepa-rate accounts from the fund. This might force the fund to sell securities at disadvantageous prices.
ISP02.fm Page 9 Monday, April 8, 2002 3:24 PM

T. ROWE PRICE 10
UNDERSTANDING PERFORMANCE INFORMATION
This section should help you understand the terms used to describe fund performance. You may see these terms used in shareholder reports you receive from your insurance company.
Total Return
This tells you how much an investment has changed in value over a given time period. It reflects any net increase or decrease in the share price and assumes that all dividends and capital gains (if any) paid during the period were reinvested in additional shares. Therefore, total return numbers include the effect of compounding.
Advertisements may include cumulative or average annual total return figures, which may be com-pared with various indices, other performance measures, or other mutual funds.
Cumulative Total Return
This is the actual return of an investment for a specified period. A cumulative return does not indicate how much the value of the investment may have fluctuated during the period. For example, an investment could have a 10-year positive cumulative return despite experiencing some negative years during that time.
Average Annual Total Return
This is always hypothetical and should not be confused with actual year-by-year results. It smooths out all the variations in annual performance to tell you what constant year-by-year return would have produced the investment’s actual cumulative return. This gives you an idea of an investment’s annual contribution to your portfolio, provided you held it for the entire period.
Total returns and yields quoted for the fund include the effect of deducting the fund’s expenses, but may not include charges and expenses attributable to any particular insurance product. Since you can only purchase shares of the fund through an insurance product, you should carefully review the pro-spectus of the insurance product you have chosen for information on relevant charges and expenses. Excluding these charges from quotations of the fund’s performance has the effect of increasing the performance quoted.
INVESTMENT POLICIES AND PRACTICES
This section takes a detailed look at some of the types of fund securities and the various kinds of investment practices that may be used in day-to-day portfolio management. Fund investments are subject to further restrictions and risks described in the Statement of Additional Information.
Shareholder approval is required to substantively change fund objectives and certain investment restrictions noted in the following section as “fundamental policies.” The managers also follow cer-tain “operating policies” which can be changed without shareholder approval. However, significant changes are discussed with shareholders in fund reports. Fund investment restrictions and policies apply at the time of investment. A later change in circumstances will not require the sale of an invest-ment if it was proper at the time it was made.
Fund holdings of certain kinds of investments cannot exceed maximum percentages of total assets, which are set forth in this prospectus. For instance, fund investments in hybrid instruments are lim-ited to 10% of total assets. While these restrictions provide a useful level of detail about fund invest-ments, investors should not view them as an accurate gauge of the potential risk of such investments. For example, in a given period, a 5% investment in hybrid instruments could have significantly more
ISP02.fm Page 10 Monday, April 8, 2002 3:24 PM
MORE ABOUT THE FUND 11
of an impact on a fund’s share price than its weighting in the portfolio. The net effect of a particular investment depends on its volatility and the size of its overall return in relation to the performance of all other fund investments.
Changes in fund holdings, fund performance, and the contribution of various investments are dis-cussed in the shareholder reports sent to you by your insurance company.
3 Fund managers have considerable leeway in choosing investment strategies and selecting securities they believe will help achieve fund objectives.
Types of Portfolio Securities
In seeking to meet its investment objective, the fund may invest in any type of security or instrument (including certain potentially high-risk derivatives described in this section) whose investment charac-teristics are consistent with its investment program. The following pages describe various types of fund securities and investment management practices.
Fundamental policy The fund will not purchase a security if, as a result, with respect to 75% of its total assets, more than 5% of its total assets would be invested in securities of a single issuer, or if more than 10% of the outstanding voting securities of the issuer would be held by the fund.
Fund investments are primarily in common stocks (normally, at least 80% of net assets) and, to a lesser degree, other types of securities as described below.
Common and Preferred StocksStocks represent shares of ownership in a company. Generally, preferred stock has a specified divi-dend and ranks after bonds and before common stocks in its claim on income for dividend payments and on assets should the company be liquidated. After other claims are satisfied, common stockhold-ers participate in company profits on a pro-rata basis; profits may be paid out in dividends or rein-vested in the company to help it grow. Increases and decreases in earnings are usually reflected in a company’s stock price, so common stocks generally have the greatest appreciation and depreciation potential of all corporate securities. While most preferred stocks pay a dividend, preferred stock may be purchased where the issuer has omitted, or is in danger of omitting, payment of its dividend. Such investments would be made primarily for their capital appreciation potential.
Convertible Securities and WarrantsInvestments may be made in debt or preferred equity securities convertible into, or exchangeable for, equity securities. Traditionally, convertible securities have paid dividends or interest at rates higher than common stocks but lower than nonconvertible securities. They generally participate in the appre-ciation or depreciation of the underlying stock into which they are convertible, but to a lesser degree. In recent years, convertibles have been developed which combine higher or lower current income with options and other features. Warrants are options to buy a stated number of shares of common stock at a specified price anytime during the life of the warrants (generally, two or more years). War-rants can be highly volatile, have no voting rights, and pay no dividends.
Fixed-Income SecuritiesFrom time to time, we may invest in corporate and government fixed-income securities. These securi-ties would be purchased in companies that meet fund investment criteria. The price of a bond fluctu-ates with changes in interest rates, generally rising when interest rates fall and falling when interest rates rise.
ISP02.fm Page 11 Monday, April 8, 2002 3:24 PM

T. ROWE PRICE 12
Hybrid Instruments These instruments (a type of potentially high-risk derivative) can combine the characteristics of secu-rities, futures, and options. For example, the principal amount, redemption, or conversion terms of a security could be related to the market price of some commodity, currency, or securities index. Such securities may bear interest or pay dividends at below market or even relatively nominal rates. Under some conditions, the redemption value of such an investment could be zero.
3 Hybrids can have volatile prices and limited liquidity, and their use may not be successful.
Operating policy Fund investments in hybrid instruments are limited to 10% of total assets.
Private PlacementsThese securities are sold directly to a small number of investors, usually institutions. Unlike public offerings, such securities are not registered with the SEC. Although certain of these securities may be readily sold, for example, under Rule 144A, others may be illiquid, and their sale may involve substan-tial delays and additional costs.
Operating policy Fund investments in illiquid securities are limited to 15% of net assets.
Types of Investment Management Practices
Reserve Position A certain portion of fund assets will be held in money market reserves. Fund reserve positions are expected to consist primarily of shares of one or more T. Rowe Price internal money market funds. Short-term, high-quality U.S. and foreign dollar-denominated money market securities, including repurchase agreements, may also be held. For temporary, defensive purposes, there is no limit on fund investments in money market reserves. The effect of taking such a position is that the fund may not achieve its investment objective. The reserve position provides flexibility in meeting redemptions, paying expenses, and in the timing of new investments and can serve as a short-term defense during periods of unusual market volatility.
Borrowing Money and Transferring AssetsFund borrowings may be made from banks and other T. Rowe Price funds for temporary emergency purposes to facilitate redemption requests, or for other purposes consistent with fund policies as set forth in this prospectus. Such borrowings may be collateralized with fund assets, subject to restric-tions.
Fundamental policy Borrowings may not exceed 33¹/³% of total fund assets.
Operating policy Fund transfers of portfolio securities as collateral will not be made except as neces-sary in connection with permissible borrowings or investments, and then such transfers may not exceed 33¹/³% of fund total assets. Fund purchases of additional securities will not be made when bor-rowings exceed 5% of total assets.
Foreign Currency TransactionsThe fund will normally conduct its foreign currency exchange transactions, if any, either on a spot (i.e., cash) basis at the spot rate prevailing in the foreign currency exchange market, or through enter-ing into forward contracts to purchase or sell foreign currencies. The fund will generally not enter into a forward contract with a term greater than one year.
The fund will generally enter into forward foreign currency exchange contracts only under two circumstances. First, when the fund enters into a contract for the purchase or sale of a security denominated in a foreign currency, it may desire to “lock in” the U.S. dollar price of the security. Second, when T. Rowe Price International believes that the currency of a particular foreign country may move substantially against another currency, it may enter into a forward contract to sell or buy
ISP02.fm Page 12 Monday, April 8, 2002 3:24 PM
MORE ABOUT THE FUND 13
the former foreign currency (or another currency that acts as a proxy for that currency). The contract may approximate the value of some or all of the fund portfolio securities denominated in such foreign currency. Under unusual circumstances, the fund may commit a substantial portion or the entire value of its portfolio to the consummation of these contracts. T. Rowe Price International will consider the effect such a commitment to forward contracts would have on the fund’s investment program and the flexibility of the fund to purchase additional securities. Although forward contracts will be used primarily to protect the fund from adverse currency movements, they also involve the risk that anticipated currency movements will not be accurately predicted, and fund total return could be adversely affected as a result.
There are some markets where it is not possible to engage in effective foreign currency hedging. This is generally true, for example, for the currencies of various emerging markets where the foreign exchange markets are not sufficiently developed to permit hedging activity to take place.
Futures and Options Futures, a type of potentially high-risk derivative, are often used to manage or hedge risk because they enable the investor to buy or sell an asset in the future at an agreed-upon price. Options, another type of potentially high-risk derivative, give the investor the right (where the investor purchases the option), or the obligation (where the investor “writes” or sells the option), to buy or sell an asset at a predetermined price in the future. Futures and options contracts may be bought or sold for any num-ber of reasons, including: to manage fund exposure to changes in securities prices and foreign curren-cies; as an efficient means of adjusting fund overall exposure to certain markets; in an effort to enhance income; to protect the value of portfolio securities; and as a cash management tool. Call or put options may be purchased or sold on securities, financial indices, and foreign currencies.
Futures contracts and options may not always be successful hedges; their prices can be highly volatile; using them could lower fund total return; and the potential loss from the use of futures can exceed a fund’s initial investment in such contracts.
Operating policies Futures: Initial margin deposits and premiums on options used for nonhedging purposes will not exceed 5% of fund net asset value. Options on securities: The total market value of securities covering call or put options may not exceed 25% of fund total assets. No more than 5% of fund total assets will be committed to premiums when purchasing call or put options.
Tax Consequences of HedgingHedging may result in the application of the mark-to-market and straddle provisions of the Internal Revenue Code. These provisions could result in an increase (or decrease) in the amount of taxable div-idends paid by the fund and could affect whether dividends paid are classified as capital gains or ordi-nary income.
Lending of Portfolio SecuritiesFund securities may be lent to broker-dealers, other institutions, or other persons to earn additional income. Risks include the potential insolvency of the broker-dealer or other borrower that could result in delays in recovering securities and capital losses. Additionally, losses could result from the reinvest-ment of collateral received on loaned securities.
Fundamental policy The value of loaned securities may not exceed 33¹/³% of total fund assets.
Portfolio Turnover Turnover is an indication of frequency of trading. The fund will not generally trade in securities for short-term profits, but, when circumstances warrant, securities may be purchased and sold without regard to the length of time held. A high turnover rate may increase transaction costs, result in addi-tional capital gain distributions, and reduce fund total return. The fund’s portfolio turnover rates are shown in the Financial Highlights table.
ISP02.fm Page 13 Monday, April 8, 2002 3:24 PM

T. ROWE PRICE 14
FINANCIAL HIGHLIGHTS
Table 2, which provides information about the fund’s financial history, is based on a single share out-standing throughout the periods shown. The table is part of the fund’s financial statements, which are included in its annual report and are incorporated by reference into the Statement of Additional Infor-mation (available upon request). The total returns in the table represent the rate that an investor would have earned or lost on an investment in the fund (assuming reinvestment of all dividends and distribu-tions and no payment of account or (if applicable) redemption fees). The financial statements in the annual report were audited by the fund’s independent accountants, PricewaterhouseCoopers LLP.
a The amount presented is calculated pursuant to a methodology prescribed by the Securities and Exchange Commission for a share outstand-ing throughout the period. This amount is inconsistent with the fund’s aggregate gains and losses because of the timing of sales and redemp-tions of fund shares in relation to fluctuating market values for the investment portfolio.
Table 2 Financial Highlights
Year ended December 31
1997 1998 1999 2000 2001
Net asset value,beginning of period $ 12.64 $ 12.74 $ 14.52 $ 19.04 $ 15.07
Income From Investment Operations
Net investment income 0.12 0.17 0.12 0.07 0.24
Net gains or losses on securities (both realized and unrealized) 0.27a 1.84 4.69 (3.46) (3.59)
Total from investment operations 0.39 2.01 4.81 (3.39) (3.35)
Less Distributions
Dividends (from net investment income) (0.12) (0.17) (0.07) (0.10) (0.25)
Distributions (fromcapital gains) (0.06) (0.06) (0.22) (0.48) —
In excess of netrealized gain (0.11) — — — —
Returns of capital — — — — —
Total distributions (0.29) (0.23) (0.29) (0.58) (0.25)
Net asset value,end of period $ 12.74 $ 14.52 $ 19.04 $ 15.07 $ 11.47
Total return 3.09% 15.86% 33.32% (17.84)% (22.21)%
Ratios/Supplemental Data
Net assets, end of period (in thousands) $369,400 $497,946 $707,330 $662,159 $550,329
Ratio of expenses to average net assets 1.05% 1.05% 1.05% 1.05% 1.05%
Ratio of net income to average net assets 1.10% 1.25% 0.83% 0.43% 1.90%
Portfolio turnover rate 16.6% 18.1% 25.4% 41.7% 27.7%
ISP02.fm Page 14 Monday, April 8, 2002 3:24 PM

A fund Statement of Additional Information has been filed with the Securities and Exchange Commission and is incorporated by reference into this prospectus. Further information about fund investments, including a review of market conditions and the manager’s recent strategies and their impact on performance, is available in the annual and semiannual shareholder reports. To obtain a free copy of a fund report or Statement of Additional Information, or for inquiries, contact your insurance company.
Fund information and Statements of Additional Information are also available from the Public Reference Room of the Securities and Exchange Commission. Information on the operation of the Public Reference Room may be obtained by calling the SEC at1-202-942-8090. Fund reports and other fund information are available on the EDGAR Database on the SEC’s Internet site at http://www.sec.gov. Copies of this information may be obtained, after paying a duplicating fee, by electronic request at [email protected], or by writing the Public Reference Room, Washington D.C. 20549-0102.
1940 Act File No.: 811-07145
5/1/02Invest With Confidence
ISP02.fm Page 15 Monday, April 8, 2002 3:24 PM

Variable Universal Life InsuranceVariable Universal Life was issued by The Prudential InsuranceCompany of America and offered through Pruco Securities Corporation,both are Prudential companies. Both located at 751 Broad Street,Newark, NJ 07102-3777.
Prudential Financial is a service mark of The Prudential InsuranceCompany of America, Newark, NJ, and its affiliates.
For online access to your policy information, visitwww.prudential.com
The Prudential Insurance Company of America751 Broad Street, Newark, NJ 07102-3777Telephone: 800 944-8786
PVUL1 ED 5/2002