prrp songbird monitoring proposal travis crane, chandler mundy, travis mote, and morgan mendenhall
Post on 21-Dec-2015
214 views
TRANSCRIPT

PRRP SongbirdMonitoring Proposal
Travis Crane, Chandler Mundy, Travis Mote, and Morgan Mendenhall
Objective
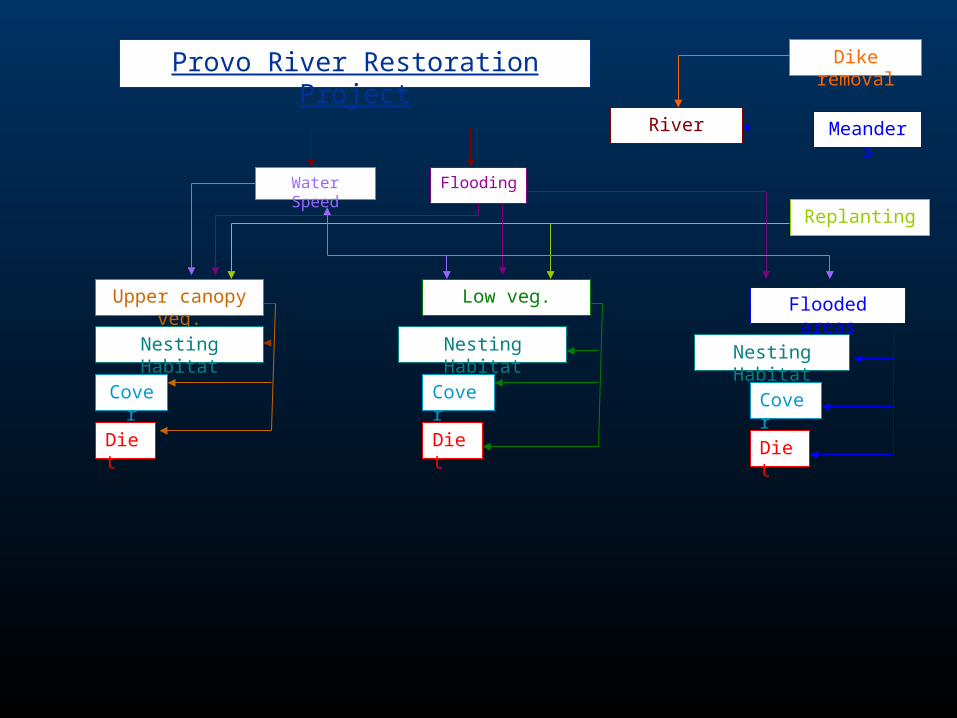
Develop a monitoring plan to be used with habitat management in order to double the number of bird species on the ten-mile Provo River restoration project.

Upper canopy veg. Low veg.
River
Flooded areas
Provo River Restoration Project Dike removal
Replanting
Meanders
FloodingWater Speed

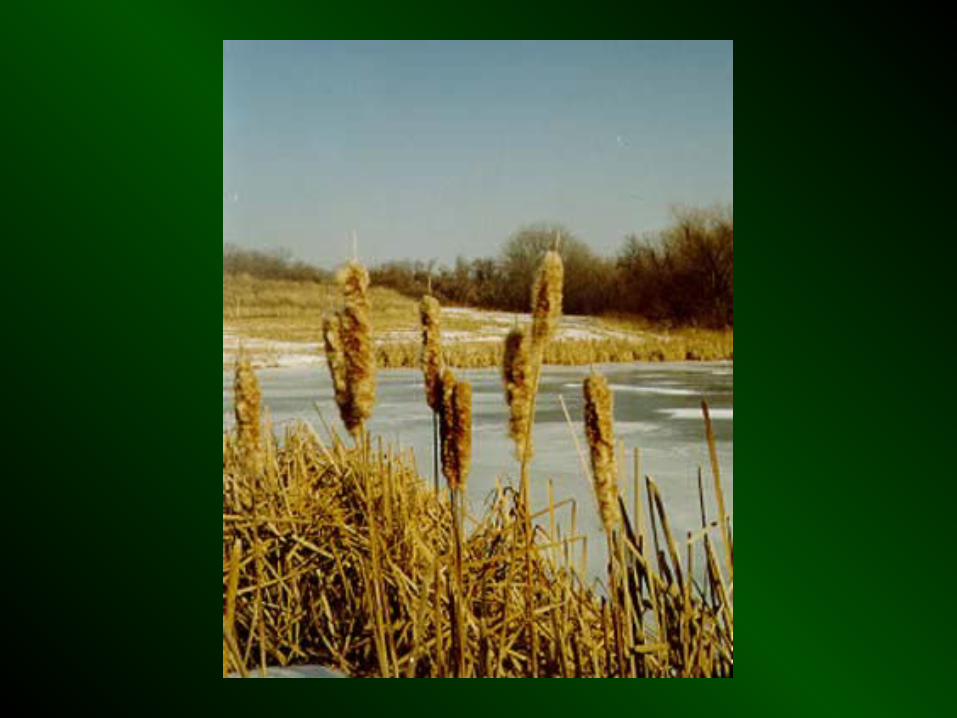
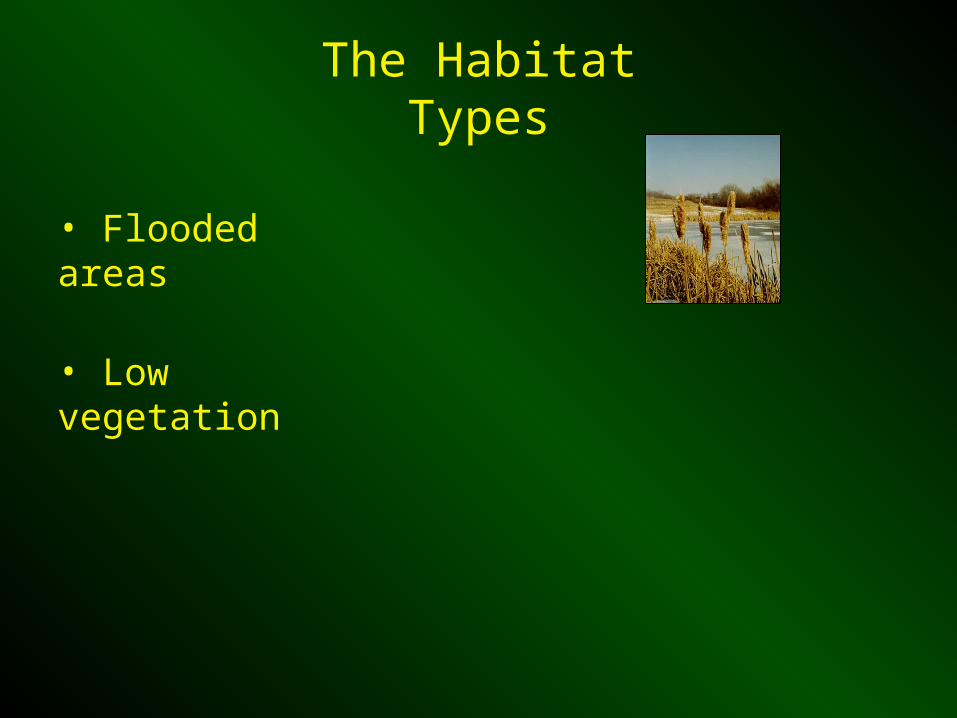
The Habitat Types
• Flooded areas
The Habitat Types
• Low vegetation
• Flooded areas


The Habitat Types
• Low vegetation
• Upper canopy
• Flooded areas
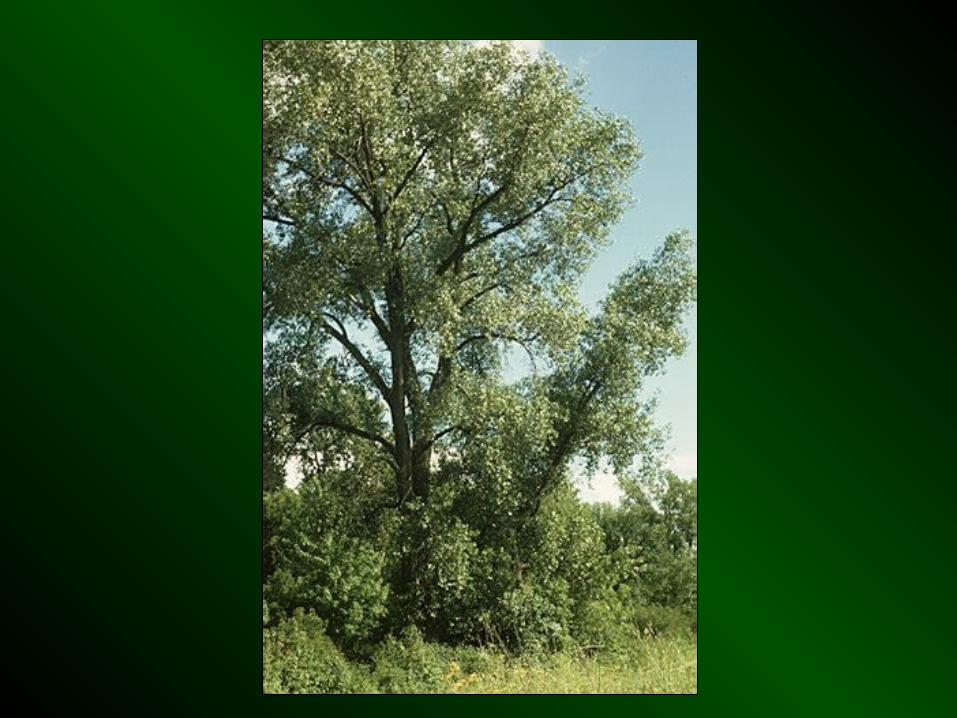

The Habitat Types
• Low vegetation
• Upper canopy
• Flooded areas
Diet
Upper canopy veg. Low veg.
River
Flooded areas
Provo River Restoration Project Dike removal
Replanting
Meanders
Nesting Habitat
Cover
Nesting Habitat
Cover
Diet
Nesting Habitat
Cover
Diet
FloodingWater Speed
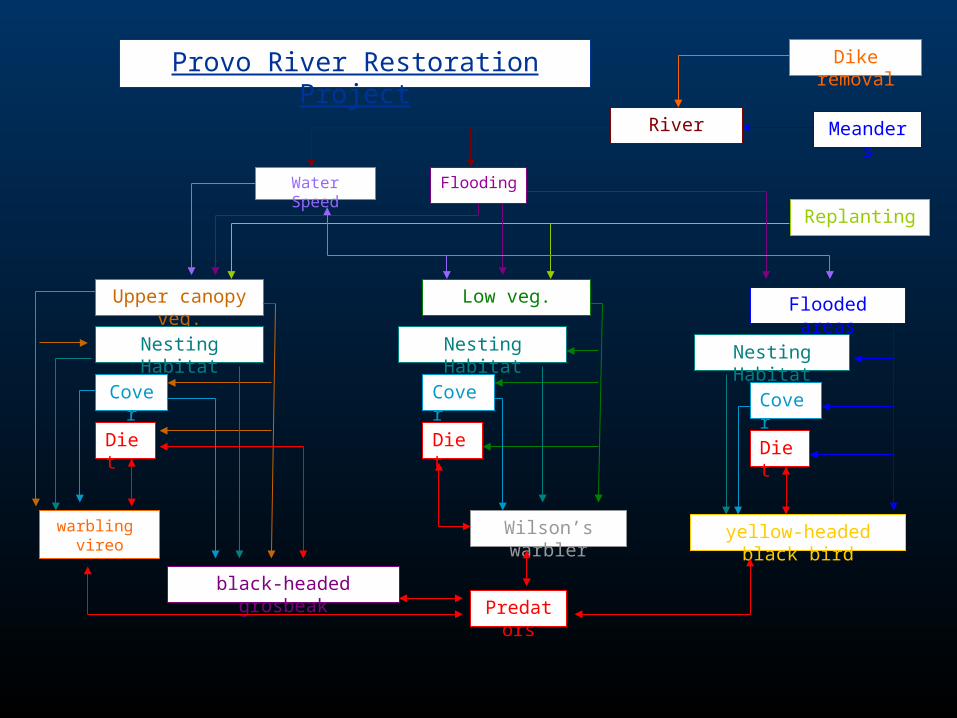
Predators
warbling vireo
black-headed grosbeak
yellow-headed black birdWilson’s warbler
Diet
Upper canopy veg. Low veg.
River
Flooded areas
Provo River Restoration Project Dike removal
Replanting
Meanders
Nesting Habitat
Cover
Nesting Habitat
Cover
Diet
Nesting Habitat
Cover
Diet
FloodingWater Speed

1. Species must be relatively easy and inexpensive to monitor.
2. Indicators should be sensitive to the environment and will fluctuate in the same manner as their guild.
3. Species have direct relationship to target population.
4. Most importantly, indicators should meet management’s objectives of being adequate predictors of the target population.
Characteristics of the indicator species
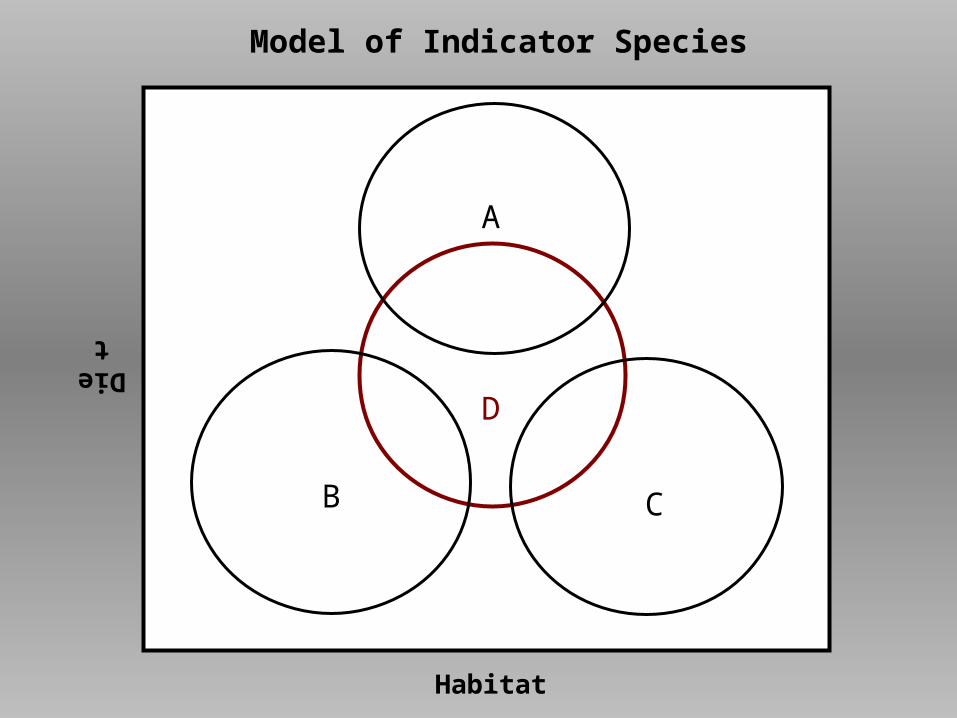
Habitat
Diet
A
B C
D
Model of Indicator Species

Warbling Vireo Vireo gilvus

Yellow-headed Blackbird Xanthocephalus xanthocephalus
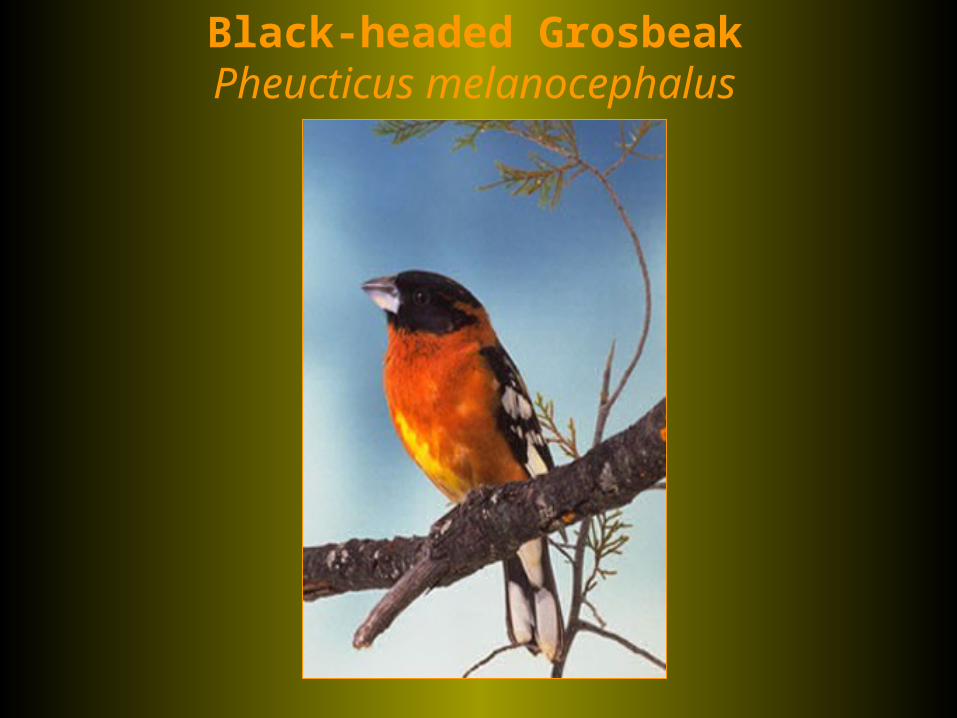
Black-headed Grosbeak Pheucticus melanocephalus

Wilson's Warbler Wilsonia pusilla

METHODSTransect Surveys:
Point Counts:
yellow-headed blackbird
warbling vireo, Wilson’s warbler, and black-headed grosbeak
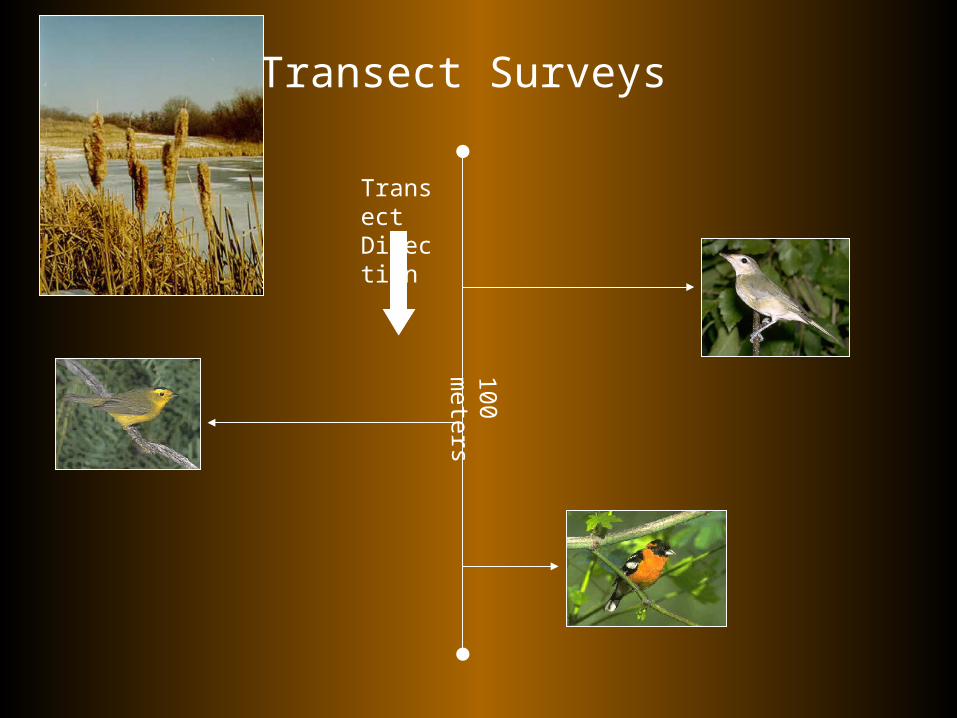
Transect Surveys
Transect Direction
100
m
ete
rs

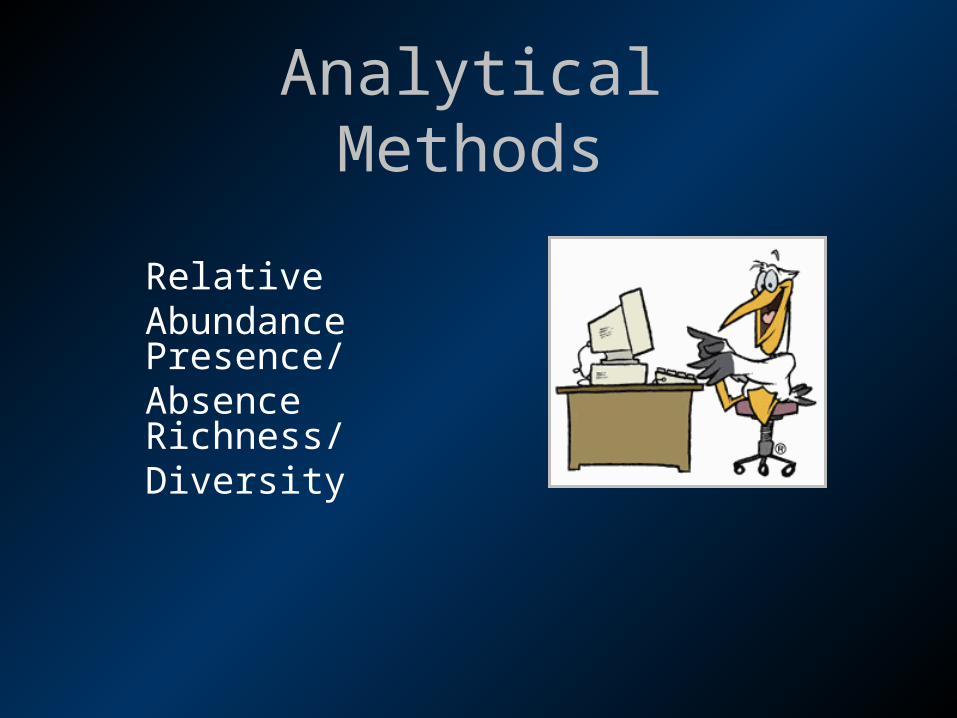
Relative Abundance
Presence/Absence
Richness/Diversity
Analytical Methods

Computer programs will be heavily used to calculate and interpret data using statistical tools.
Statistical Software
• SAS
• STATA
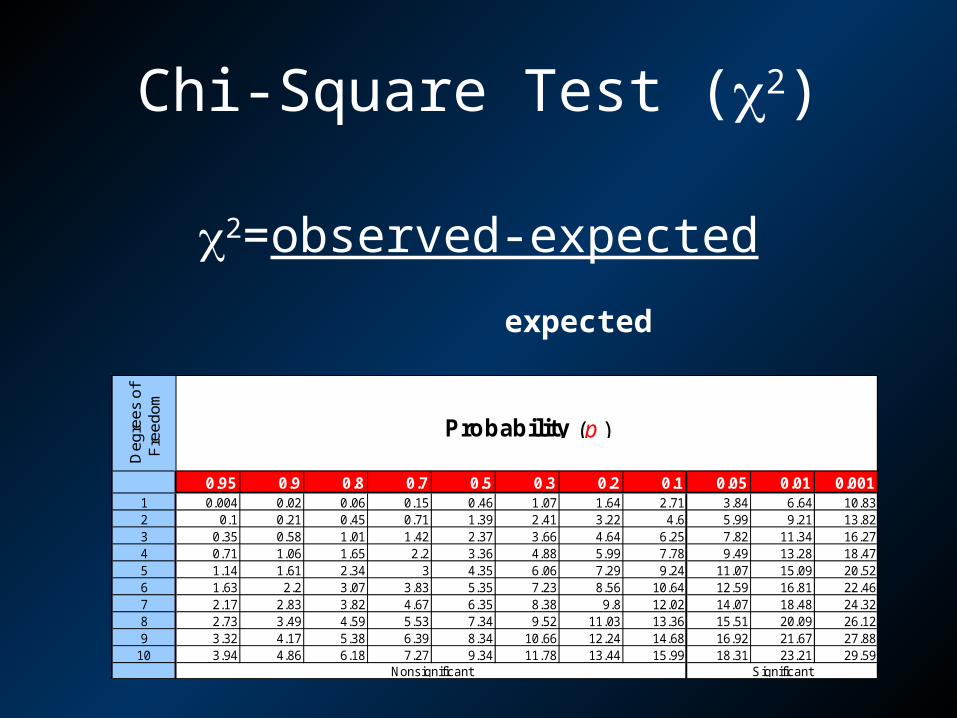
2=observed-expected
expected
0.95 0.9 0.8 0.7 0.5 0.3 0.2 0.1 0.05 0.01 0.0011 0.004 0.02 0.06 0.15 0.46 1.07 1.64 2.71 3.84 6.64 10.832 0.1 0.21 0.45 0.71 1.39 2.41 3.22 4.6 5.99 9.21 13.823 0.35 0.58 1.01 1.42 2.37 3.66 4.64 6.25 7.82 11.34 16.274 0.71 1.06 1.65 2.2 3.36 4.88 5.99 7.78 9.49 13.28 18.475 1.14 1.61 2.34 3 4.35 6.06 7.29 9.24 11.07 15.09 20.526 1.63 2.2 3.07 3.83 5.35 7.23 8.56 10.64 12.59 16.81 22.467 2.17 2.83 3.82 4.67 6.35 8.38 9.8 12.02 14.07 18.48 24.328 2.73 3.49 4.59 5.53 7.34 9.52 11.03 13.36 15.51 20.09 26.129 3.32 4.17 5.38 6.39 8.34 10.66 12.24 14.68 16.92 21.67 27.88
10 3.94 4.86 6.18 7.27 9.34 11.78 13.44 15.99 18.31 23.21 29.59Nonsignificant Significant
De
gre
es
of
Fre
ed
om
Probability (p )
Chi-Square Test (2)
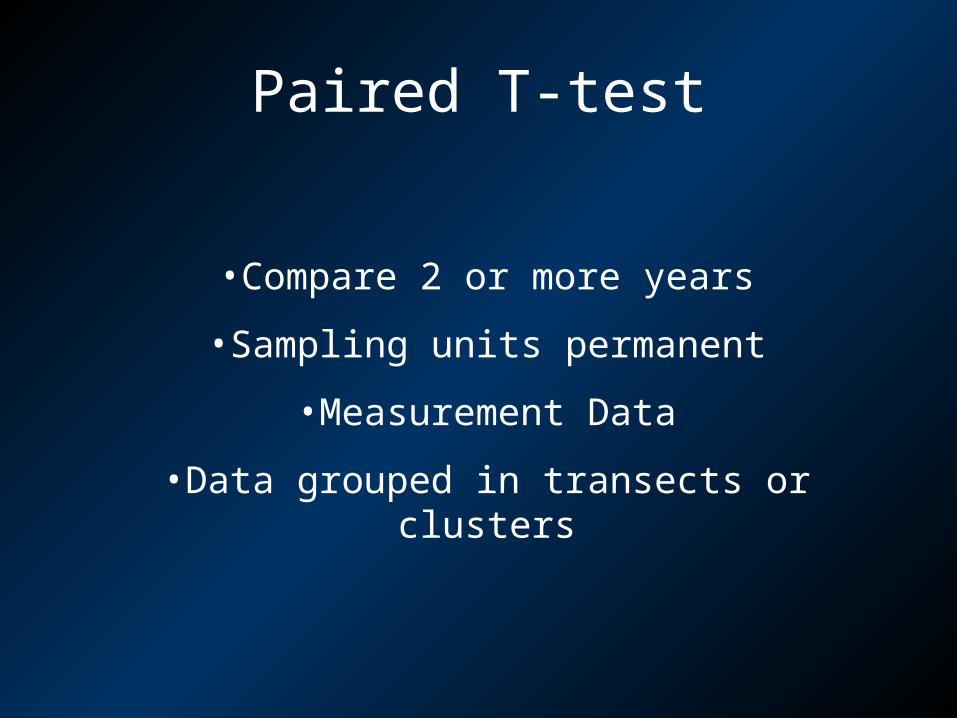
Paired T-test
•Compare 2 or more years
•Sampling units permanent
•Measurement Data
•Data grouped in transects or clusters

Paired T-test
• Is there a statistically significant result?
• What is the likelihood that no true change occurred and that any observed difference is the result of random sampling error?
• Does the observed change have any biological
significance?
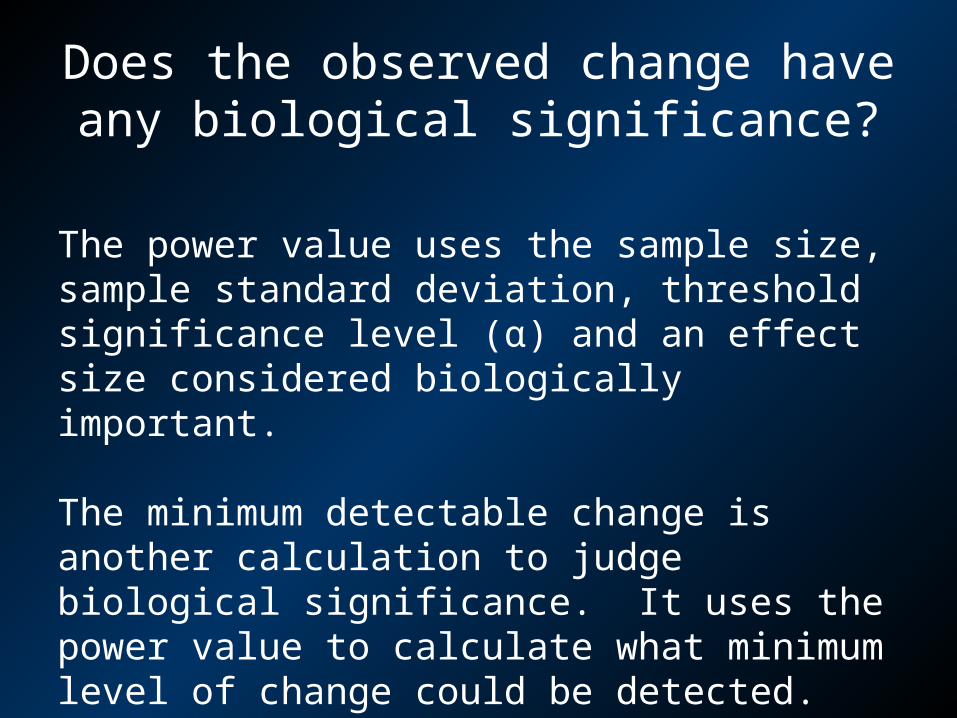
Does the observed change have any biological significance?
The power value uses the sample size, sample standard deviation, threshold significance level (α) and an effect size considered biologically important.
The minimum detectable change is another calculation to judge biological significance. It uses the power value to calculate what minimum level of change could be detected.

Species diversity and richness
Species richness is analyzed as a total number of species detected.
Evenness, or the relative abundance of a species, is incorporated with species richness into a diversity index.
Many indices exist; we will use the Shannon-Weaver index
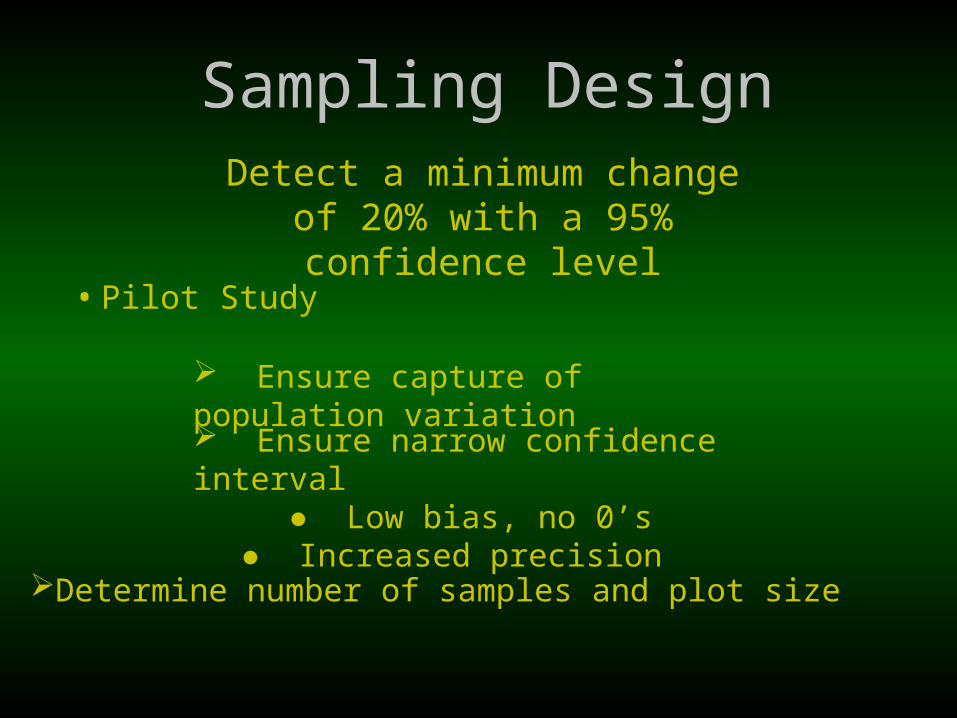
Sampling Design
• Pilot Study
Detect a minimum change of 20% with a 95% confidence level
Ensure capture of population variation
Ensure narrow confidence interval● Low bias, no 0’s
● Increased precision
Determine number of samples and plot size
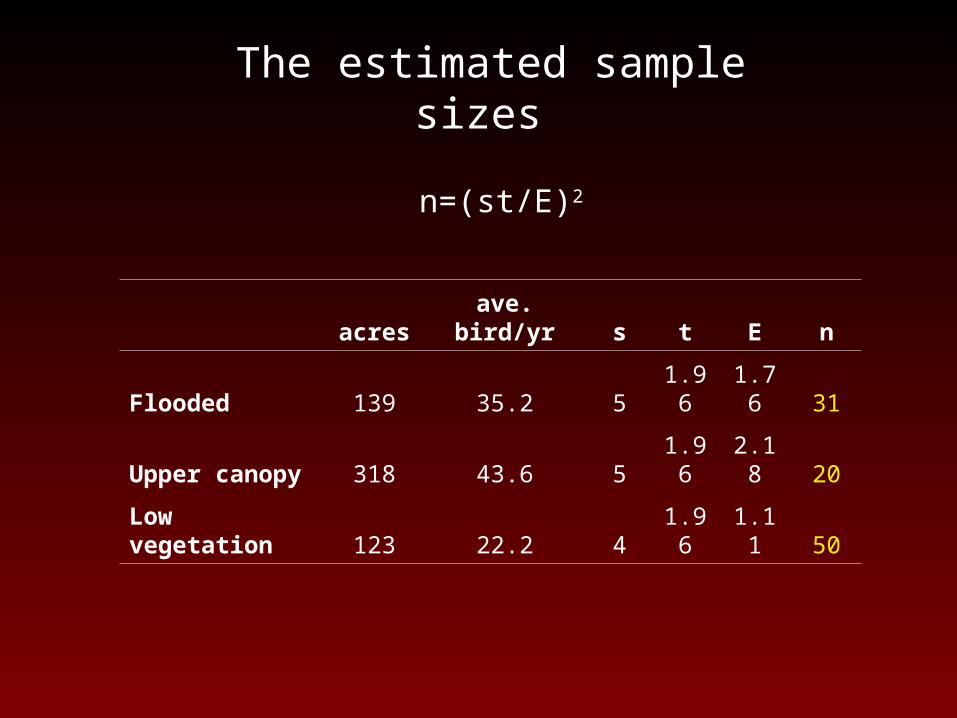
acres ave. bird/yr s t E n
Flooded 139 35.2 5 1.96 1.76 31
Upper canopy 318 43.6 5 1.96 2.18 20
Low vegetation 123 22.2 4 1.96 1.11 50
The estimated sample sizes
n=(st/E)2
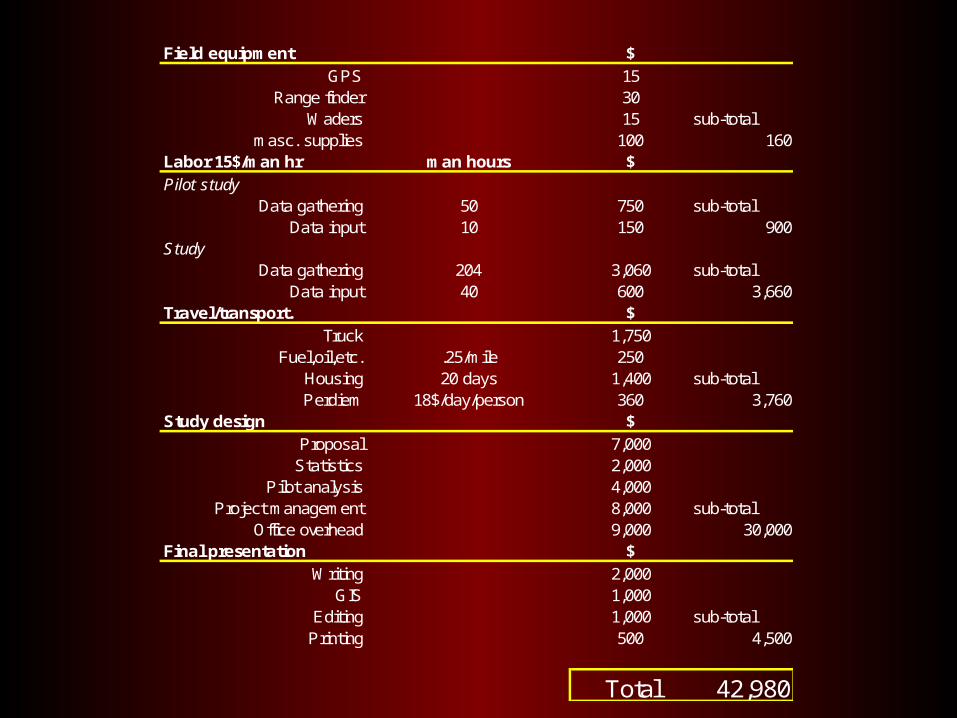
Field equipment $GPS 15
Range finder 30Waders 15 sub-total
masc. supplies 100 160Labor 15$/man hr man hours $Pilot study
Data gathering 50 750 sub-totalData input 10 150 900
StudyData gathering 204 3,060 sub-total
Data input 40 600 3,660Travel/transport. $
Truck 1,750Fuel,oil,etc. .25/mile 250
Housing 20 days 1,400 sub-totalPerdiem 18$/day/person 360 3,760
Study design $Proposal 7,000
Statistics 2,000Pilot analysis 4,000
Project management 8,000 sub-totalOffice overhead 9,000 30,000
Final presentation $Writing 2,000
GIS 1,000Editing 1,000 sub-total
Printing 500 4,500
Total 42,980
• Population estimates for indicator species
• Species diversity for all three habitat types
• Map of all study sites
• Guidelines of monitoring methods
• Management recommendations
Expected Products