proximity matters and territorial approach is a way to ... fileproximity matters and territorial...
TRANSCRIPT
2

Proximity matters and territorial approach is a way to make functional integration easiest between neighbours, across land and sea bondaries
3

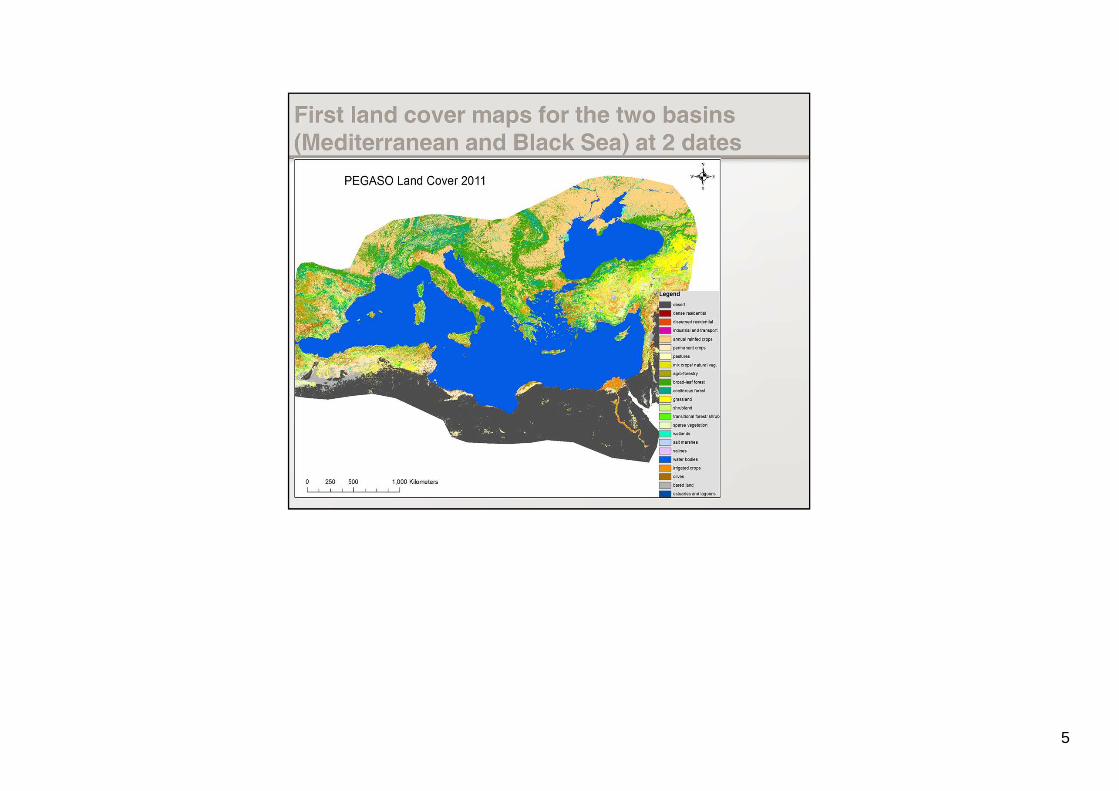
1st recommendation: comprensive cartography of territories EU and neighbours is key for spatial integration.
In the PEGASP EU FP7 project, There was a need to have a comparative Land Cover Map for all the countries around thetwo bassins. So a first prototype was produced in 2000 and 2011, showing 23 different land cover units (urban areas, industrial, forest, agriculture intensive and extensive, deserts, etc..
It is a regional product at 250m resolution, but we worked with the different countries and local areas (ex. Magreb coast, Danube Delta, nile Delta, Turkish protected area (Dalyan),North lebanon etc). This work represents an important challenge in term of data, to get a comparative frame where local data can be fitted/integrated, using a grid system (of 1km).
4
5
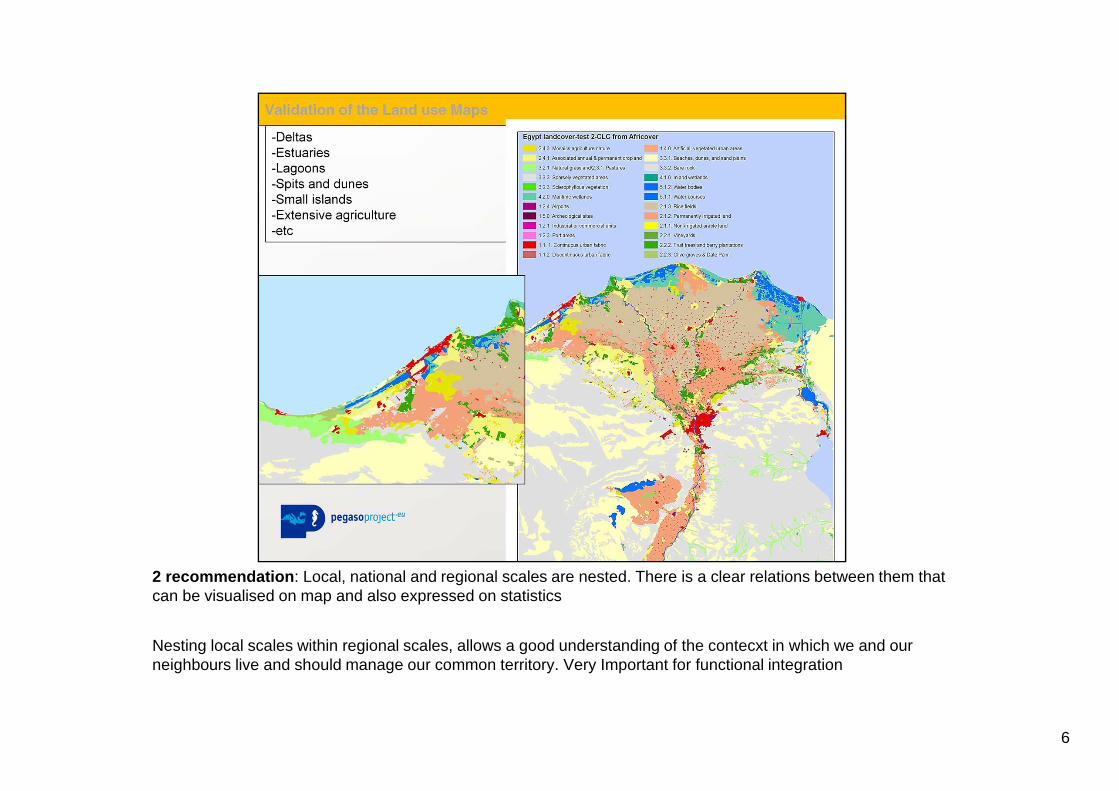
2 recommendation: Local, national and regional scales are nested. There is a clear relations between them thatcan be visualised on map and also expressed on statistics
Nesting local scales within regional scales, allows a good understanding of the contecxt in which we and ourneighbours live and should manage our common territory. Very Important for functional integration
6

7
Recommendation 3: time scale matters. Territorial trends are important. what is the data useful for:The land cover trends, shown in a 1 km grid, are used to understand how the areas covered by cities, forests, natural landscape, agriculture, etc have changes between 2 dates. We can calculate how land cover stocks have changes, and also which are the main flows, defined as drivers of changes during certain period of time ( eg Forest can grow because of agriculture land loss, or decline by fire or cuts).
This stocks and flows are expressed in statistics by different analitic units (geometrics: grids or buffers, administrative: Nuts, or geographical such as a catchment, high/low coast, etc) in a concrete time scale.
This information explain us what has happened during the last 10 years. It can also serves as a basis for future projections. We use them to make participative scenarios (using also other local and regional data) to understand how people, stake holders, scientists, etc see our common future, the “desired” and “undesired” trends, emerging issues, etc, pointing out the main uncertainties and common priorities.. Source: Prepared at the Centre for Environmental Management, University of Nottingham using MODIS (NASA) and CORINE land cover (EEA) data

Recommendation 4: there is also the need to map sea uses and sea ecosystems. EU policies urge us to workin an ecosystem based framework, so that land is strongly connected to the sea and viceversa. Activities at sea are done by people living on land….
This question makes us thought about data, tools, methodologies and procedure, to advance in this land-sea territorial,social, economic knowledge together
8
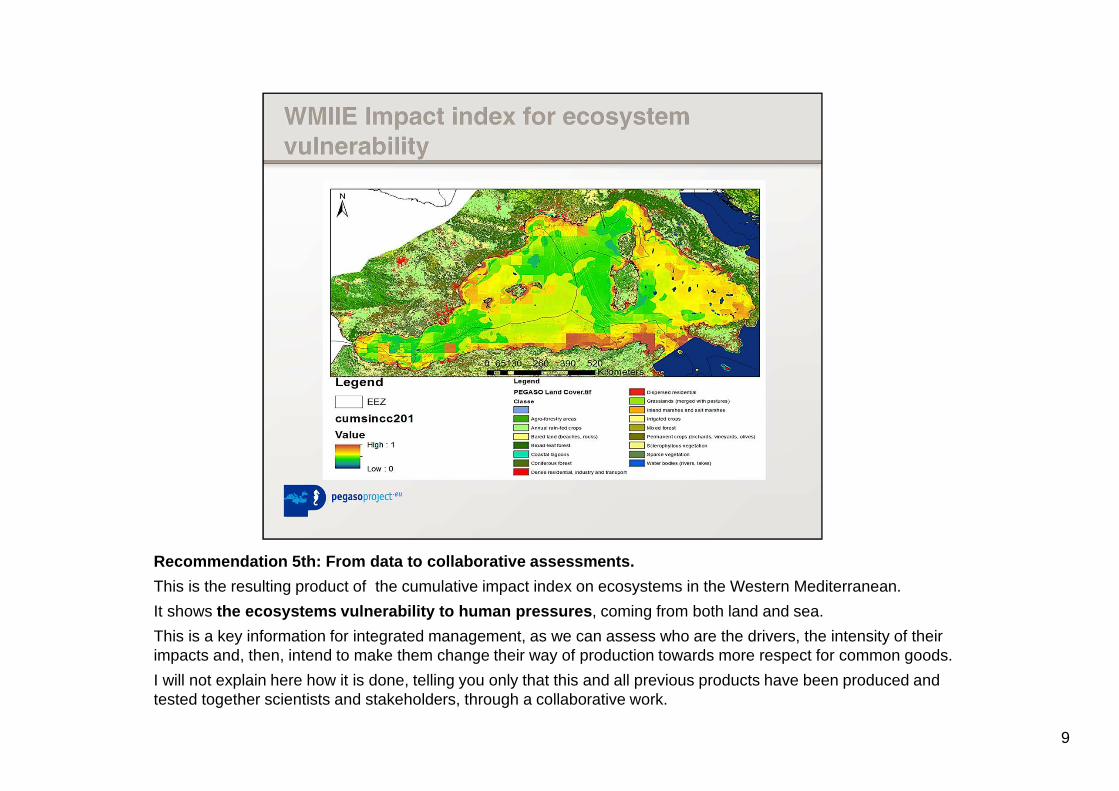
Recommendation 5th: From data to collaborative assessments.
This is the resulting product of the cumulative impact index on ecosystems in the Western Mediterranean.
It shows the ecosystems vulnerability to human pressures, coming from both land and sea.
This is a key information for integrated management, as we can assess who are the drivers, the intensity of theirimpacts and, then, intend to make them change their way of production towards more respect for common goods.
I will not explain here how it is done, telling you only that this and all previous products have been produced and tested together scientists and stakeholders, through a collaborative work.
9
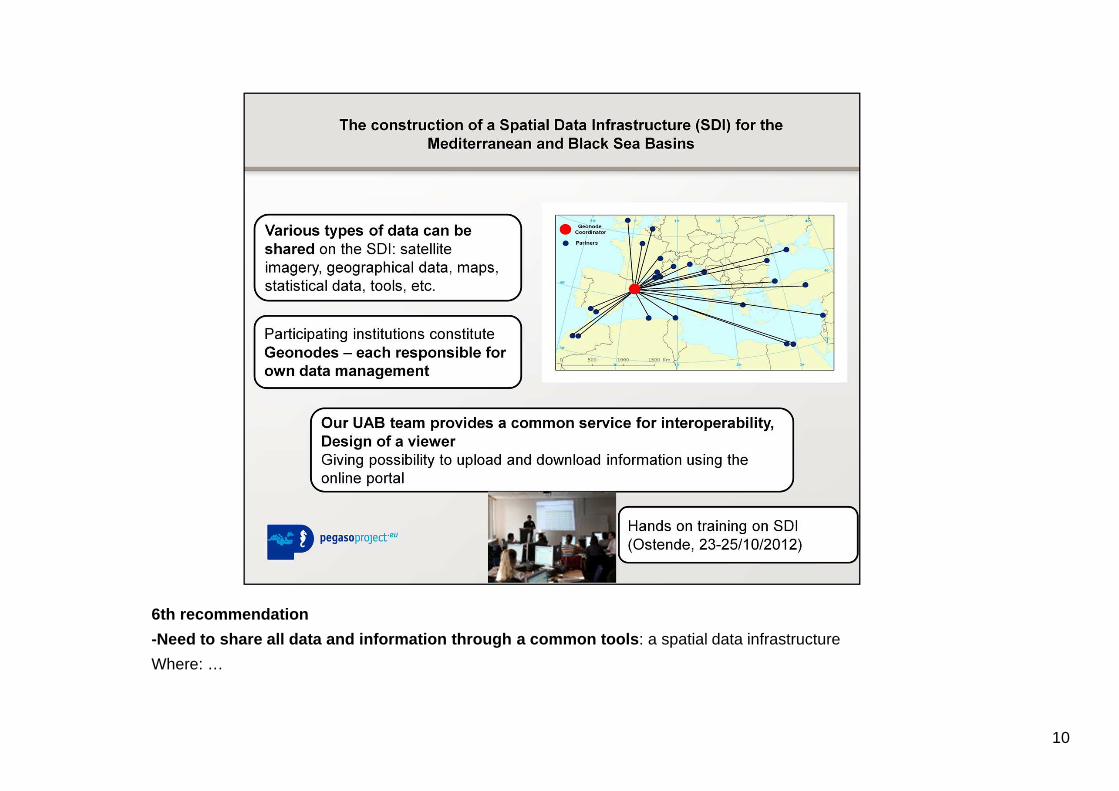
6th recommendation
-Need to share all data and information through a common tools: a spatial data infrastructure
Where: …
10
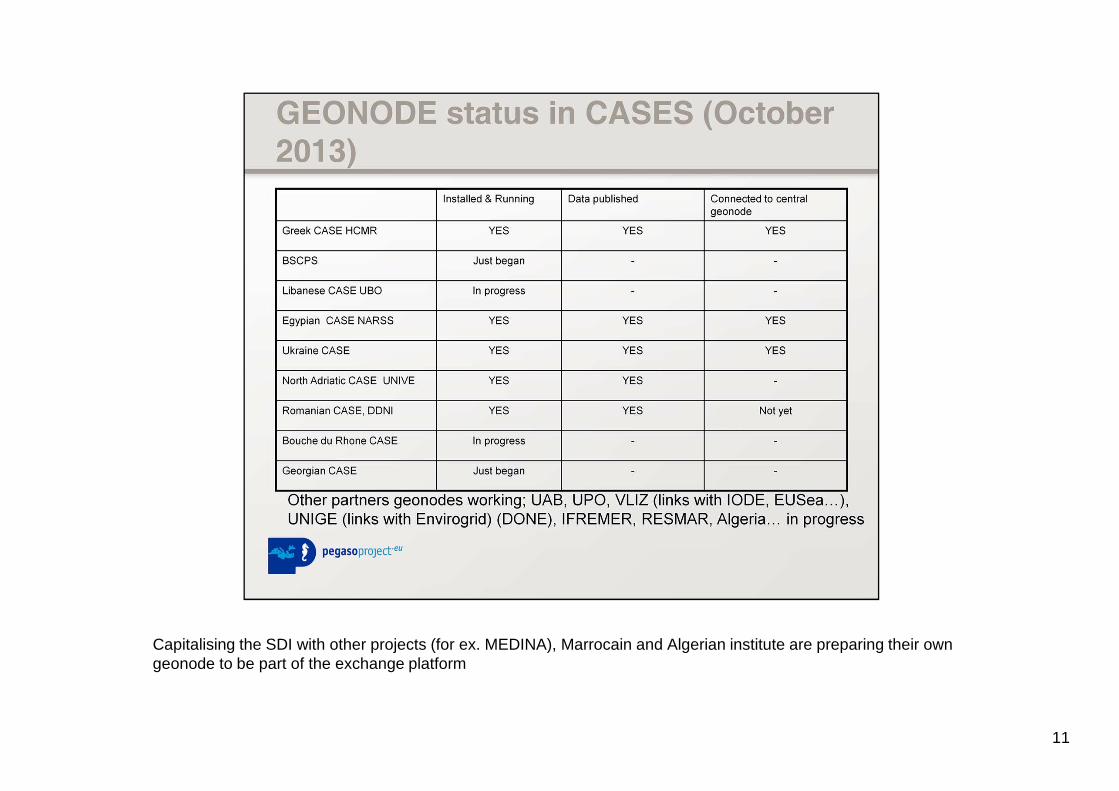
Capitalising the SDI with other projects (for ex. MEDINA), Marrocain and Algerian institute are preparing their owngeonode to be part of the exchange platform
11

Recommendation 8: Data are transformed in information through a number of co-produced tools(indicators, customised maps, etc). To create a shared Atlas.
The atlas is built by all partners of the SDI network.
As it is reliant with EU INSPIRE Directive, it is open to other partners and can be easily interoperable withEMODNET, ESPON or any other information system.
12
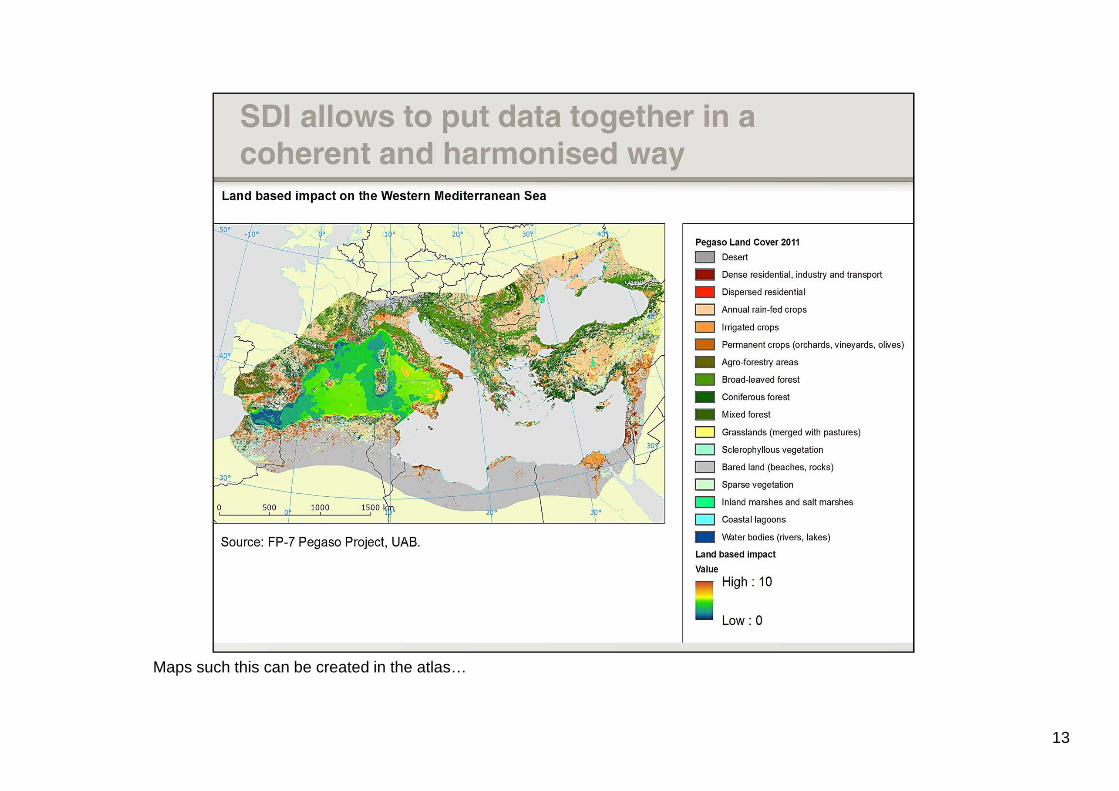
Maps such this can be created in the atlas…
13
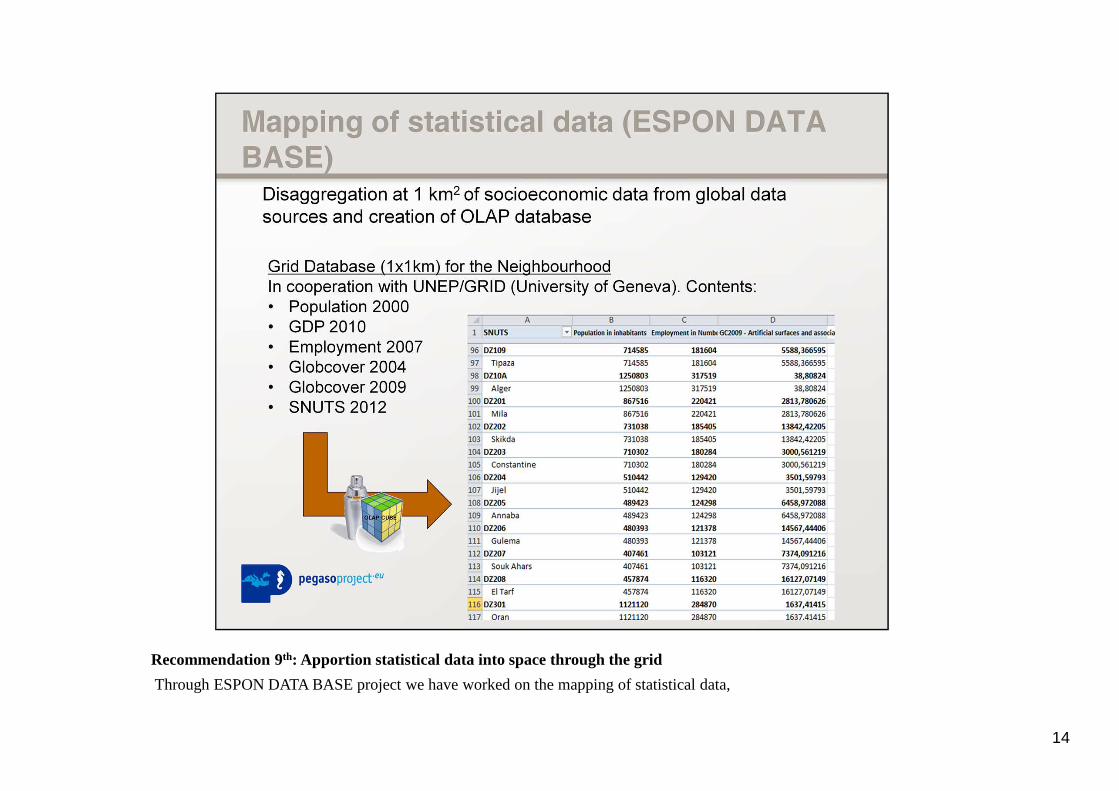
Recommendation 9th: Apportion statistical data into space through the grid
Through ESPON DATA BASE project we have worked on the mapping of statistical data,
14

15

Recommendation 10th: Give priority on existing networks and data platforms to capitalise, not to lossmomentum, or creating frustration!
Important efforts have been dedicated to collaborative work on data gathering and sharing, co-construction of toolsfor analysis, participative scenarios, and collective assessments.
More than 1000 persons (experts and Decision making ) have been implicated in local sites and at national and regional level.
16

Here the example of the PEGASO governance, that began with a project and plan to be continued for theMediterranean with UNEP-MAP support.
Last but not least---Data and information should be transformed through common work in a shared knowledge. To do that a governance model and implementation is key. It is a complex question to build a governance that works. Can we use the same model in all places ? Thereare basic criteria for replication? My experience tells me thatrecommendations for a good model are needed, but it could eventually be adapted at the different places and different culture, keeping however democratic principles of representation and equity.
17

18
19