providing a multidimensional measurement model … a multidimensional measurement model for...
TRANSCRIPT

Providing a multidimensional measurement model for
assessing quality of sport tourism services: Empirical
evidence from sport conference as sport event tourism
Reza Andam1, Amir Montazeri2, Smira Feizi3 and Rahimeh Mehdizadeh1
1. Faculty of Physical Education and Sport Science, University of Shahrood, Shahrood, Iran
2. Faculty of Physical Education and Sport Science, Ferdowsi University of Mashhad, Mashhad, Iran
3. Faculty of Physical Education and Sport Science, Shomal University, Amol, Iran
(Received: 29 July 2014; Revised: 10 February 2015; Accepted: 13 February 2015)
Abstract
This study aimed to empirically develop a reliable and valid model specifically for
measuring service quality of sport conferences as sport event tourism. To assess the
model which has been established based on the survey, data gathered from 136 of
attendees in sport conference. Finding of this study showed that participants form
their service quality perceptions based on their evaluations of 4 primary dimensions
including: venue quality, conference quality, access quality and trip quality. Total
variance of these dimensions explained %53.82 variance of services quality.
Confirmatory factor analysis showed that each of the four factors influence on the
services quality, and the fit indices confirmed the conceptual model that presented in
this study (Chi-Square=85.456, df=23, P=0.001, RMSEA=0.142). As a result, it is
recommended to conference organizer and tourism managers, to considering these
factors next to each other in order to increase and improve the service quality.
Keywords
Conference, Multidimensional scale, Service quality, Sport event, Sport tourism.
Corresponding Author, Email: [email protected]
Iranian Journal of Management Studies (IJMS) http://ijms.ut.ac.ir/
Vol. 8, No. 4, October 2015 Print ISSN: 2008-7055
pp: 607-629 Online ISSN: 2345-3745
Online ISSN 2345-3745
608 (IJMS) Vol. 8, No. 4, October 2015
Introduction
Sport is now recognized as the world’s largest social phenomenon
(Kurtzman and Zauhar, 2003) and tourism its biggest industry
(Goeldner and Ritchie, 2012). Sport tourism has a considerable
position in our society as well as our economy today (Nice, 2004;
Ritchie and Adair, 2004). Standeven and De Knop (1999) defined
sport tourism as “all forms of active and passive involvement in
sporting activity, participated in casual or in an organized way for
noncommercial or business/commercial reasons, that necessitate travel
away from home and work locality” (p. 12). Baker and Crompton
(2000) noted that tourists are an integral aspect of the service process
in tourism. Tourism literature attempts to explain how tourists
evaluate the quality of services, also places the tourists as a focal point
for understanding sport tourism (Shonk and Chelladurai, 2008).
Scholars in sport have examined perceptions of service quality by
participants within a variety of contexts. The sport tourism industry is
largely influenced by the quality of the services provided (Kouthouris
and Alexandris, 2005).
What is perceived service quality? How must service quality be
measured? These two questions have been severely argued by
academics over the last three decades and are amongst the most
frequent topics in management and marketing literature (Martínez and
Martínez, 2010). In order to answer these questions, several service
quality models have been proposed and widely examined in applied
research (see Martínez and Martínez, 2010; Seth et al., 2005). Some
important models in service quality include: Grönroos (1982, 1984),
Parasuraman et al. (1985, 1988, 1994), Cronin and Taylor (1992),
Rust and Oliver (1994), Dabholkar et al. (1996), Brady and Cronin
(2001). All these models share a common specification that is they
propose a multidimensional service quality conception that it is
inherently linked to the measurement of consumer quality perceptions
(Martínez and Martínez, 2010). Therefore, service quality models
propose a frame for realization what service quality is, as well as how
to measure service quality in each proposed conception (Martínez and
Providing a multidimensional measurement model for assessing quality of … 609
Martínez, 2010). For the past two decades or more discussion have
happened about the measures and dimension of service quality about
whether industry and type of service have any influence on service
quality perceptions; whether service quality should to be assessed
specifically or more generally (Yildiz and Kara, 2012). Some scholars
support the development of model and measurement instruments for
specific service environments. Babakus and Boller (1992) noted that
there is a requirement to develop industry-specific measures of service
quality. The more particular the scale items are in a service quality
instrument and the more enforceable they are to a manager’s own
contextual situations, the better they will be able to use the
information. Therefore, for taking a present instrument and trying to
proper it to the groundwork, a better approach is to develop an
instrument, especially for that service industry (Karatepe et al., 2005).
Hence, this study attempt to develop a service quality
multidimensional measurement model designed for sport tourism
specifically for sport conferences as event sport tourism.
Service Quality
The service quality construct derived out of the quality literature in
manufacturing. Quality originality dated back to the 1920s when
producers began to focus on controlling the physical output of goods,
and the internal measurements of the output process (Kandampully,
2002). Service quality, defined as “the difference between what is
expected from each of the service dimensions and what a consumer
perceives he or she receives from them” (Mackay and Crompton,
1988: 46), has become a major differences of service enterprises
(Kandampully, 1998). Many studies revealed that service quality has
been linked to customer satisfaction, customer loyalty, value and
repurchase intention (Ko and Pastore, 2004; Kandampully, 1998;
Laroche et al. 2004; Fornell, 1992). Identifying dimensions of service
quality is a beneficial approach for determining and enhancing service
quality (Brady and Cronin Jr., 2001). Dimensions of quality associated
with a service can be made into a benefit package, which is a “clearly
defined set of tangible (goods-content) and intangible (service-
610 (IJMS) Vol. 8, No. 4, October 2015
content) attributes the customer recognizes, pays for, uses or
experiences” (Collier, 1994: 63) in this context. There are several
delineations of quality dimensions including Grönroos (1984),
Parasuraman, Zeithaml and Berry (1985), Lehtinen and Lehtinen
(1991), Dabholkar, Thorpe and Rentz (1995) and Brady and Cronin
(2001). It is worth mentioning that the aforesaid studies of service
quality dimensions are to a great extent overlapping each other.
Moreover, the recognized dimensions are global in nature and do not
address the specific elements that should be included in quality
evaluations. Hence, identifying significant elements of service quality
in sport tourism is very necessary and important. (Shonk and
Chelladurai, 2008).
Sport Tourism
Sport and tourism have been interrelated throughout history. However,
the two phenomena have usually been treated as completely separate
fields. However, sport is a special segment of the tourism industry.
The phenomenon of sport must be analyzed on all levels in order to
obtain a clear understanding of the impact it has in relation to the
tourism industry (Chen et al., 1999). Sport tourism is defined as “all
forms of active and passive involvement in sporting activity,
participated in casual or in an organized way for noncommercial or
business/ commercial reasons, that necessitate travel away from home
and work locality” (Standeven and De Knop, 1999: 12). Some of
researchers break sport tourism down into separate categories, for
example, Standeven and De Knop (1999), Gibson (2003), and Weed
and Bull (2009). Therefore, based on the purposes or motives of the
tourist, the variety of sport tourism can be classified into one of four
types– participation in an organized sport event, participation at a
specific location, spectating at an organized event and nostalgia sport
tourism (Shonk, 2007). The present study considers sport tourism
focused on spectating at an organized sport conference as sport event.
A general growth in discretionary income (Thwaites, 1999), and
cities turned to sporting facilities (Turner and Rosentraub, 2002) are
two important factors that can be attributed to the growth in sport
Providing a multidimensional measurement model for assessing quality of … 611
tourism. It is not surprising that extreme attention has been given to
sport tourism in large urban cities trying to attract spectators for
sporting events (Kim, Jun, Walker and Drane, 2015). Sporting events
are often justified as tools for increasing the economy of a host city,
region or country (Chalip, 2004). According to these trends, cities that
have placed more emphasis on marketing sport and place are growing.
Local administrators provide a variety of sport-related organizations
and services within urbanized communities in order to achieve
economic and social development (Bradish, 2003).
Service Quality in Sport and Tourism
Since sport tourism is influenced by the quality of services
(Kouthouris and Alexandris, 2005), tourism literature attempts to
explain how tourists evaluate the quality of services. In this regard,
Baker and Crompton (2000) noted that tourists are an impartible
aspect of the service process in tourism. Echoing the emphasis on
attendees in the context of sport tourism, scholars in sport have
inquired perceptions of service quality by participants in the sport
management and marketing. As an example, Alexandris, Zahariadis,
Tsorbatzoudis, and Grouios (2004) investigated service quality within
health and fitness centers; Kyle, Theodorakis, Karageorgiou and
Lafazani (2010) explored service quality within the context of ski
industry; Alexandris, Douka and Balaska (2012) conducted service
quality in the recreational and leisure sport industry; Theodorakis,
Koustelios, Robinson and Barlas (2009) examined service quality at
sport event.
Chelladurai and Chang (2000) proposed that any quality evaluation
of a service should begin by identifying the targets of quality
evaluations, these targets of quality evaluations include: a) the core
service; b) the physical context such as the physical facilities and
equipment in which the service is provided; and c) the interpersonal
interactions in the performance of the service. The core service relates
to the performance of the promised service such as expert coaching or
fitness instruction. Core service is described as similar to the
conceptualization of the “reliability” dimension in the SERVQUAL
612 (IJMS) Vol. 8, No. 4, October 2015
instrument. The physical context dimension is described as the quality
of the facilities, their location, the equipment and tools used in the
production of the service, the amenities provided to the clients, the
accessibility of the facilities, and the equipment’s ease of use. Physical
context is described as similar to the conceptualization of the
“tangibles” dimension in the SERVQUAL instrument. Finally, the
interpersonal interactions dimension refers to the helping orientation
and behavior of the employee, courtesy and care toward clients, and
the prompt delivery of individualized attention. This dimension is
described as similar to the conceptualization of the responsiveness,
assurance and empathy dimensions in the SERVQUAL instrument.
The SERVQUAL model consisted of five dimensions of tangibles,
reliability, responsiveness, assurance and empathy (Parasuraman et
al., 1988). Moreover, Ko and Pastore (2004) proposed a four
dimensional model of service quality in the recreation industry
including of program quality, interaction quality, outcome quality and
physical environment quality. Program quality refers to the customer’s
relative perception of the excellence of the program experienced.
Interaction quality focuses on how the service is delivered and focuses
on the attitudes and behaviors of both the employees of the service
provider and other customers. Outcome quality represents what the
consumer gains from the service. Physical environment quality refers
to physical facilities or surroundings. Shonk and Chelladurai (2008)
stated that four primary dimensions or targets of evaluation indicated
sport tourism quality. These dimensions comprise (a) access quality;
(b) accommodation quality; (c) venue quality; and (d) contest quality.
The overall quality of sport tourism is accounted by these four
dimensions (Shonk and Chelladurai, 2008).
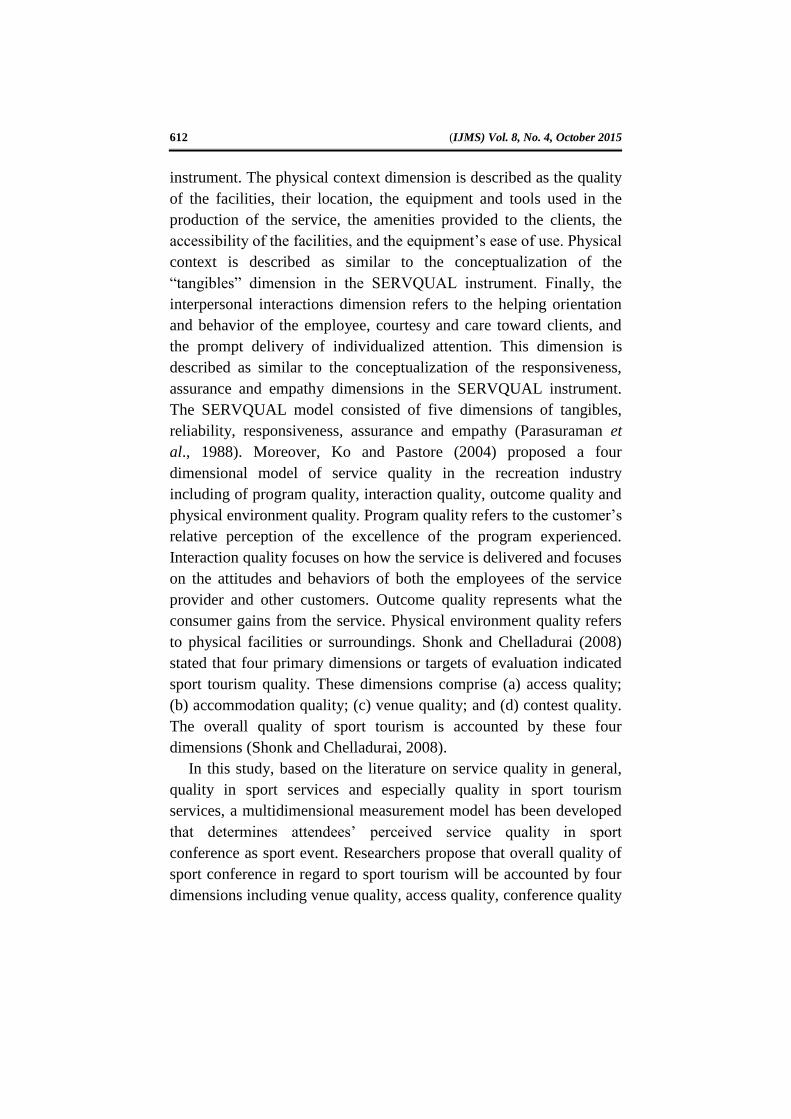
In this study, based on the literature on service quality in general,
quality in sport services and especially quality in sport tourism
services, a multidimensional measurement model has been developed
that determines attendees’ perceived service quality in sport
conference as sport event. Researchers propose that overall quality of
sport conference in regard to sport tourism will be accounted by four
dimensions including venue quality, access quality, conference quality
Providing a multidimensional measurement model for assessing quality of … 613
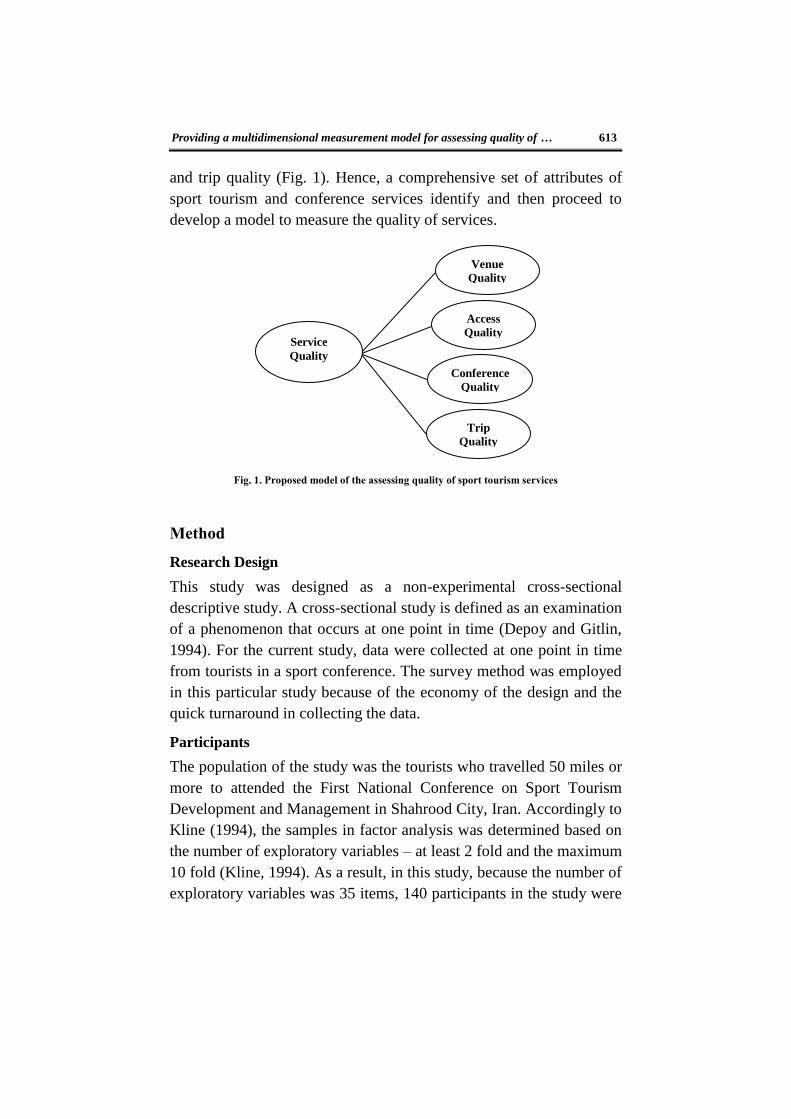
and trip quality (Fig. 1). Hence, a comprehensive set of attributes of
sport tourism and conference services identify and then proceed to
develop a model to measure the quality of services.
Fig. 1. Proposed model of the assessing quality of sport tourism services
Method
Research Design
This study was designed as a non-experimental cross-sectional
descriptive study. A cross-sectional study is defined as an examination
of a phenomenon that occurs at one point in time (Depoy and Gitlin,
1994). For the current study, data were collected at one point in time
from tourists in a sport conference. The survey method was employed
in this particular study because of the economy of the design and the
quick turnaround in collecting the data.
Participants
The population of the study was the tourists who travelled 50 miles or
more to attended the First National Conference on Sport Tourism
Development and Management in Shahrood City, Iran. Accordingly to
Kline (1994), the samples in factor analysis was determined based on
the number of exploratory variables – at least 2 fold and the maximum
10 fold (Kline, 1994). As a result, in this study, because the number of
exploratory variables was 35 items, 140 participants in the study were
Access
Quality
Trip
Quality
Venue
Quality
Conference
Quality
Service
Quality

614 (IJMS) Vol. 8, No. 4, October 2015
recruited based on a non-probability sampling method. A convenience
sampling technique was used to select subjects for the study.
Convenience sampling is a non-random sampling technique, which is
typically conducted in a non-probability sampling method so that,
asked them to take part in the study and to complete the standardized,
self- administered questionnaire. The participants were assured that all
information gathered would be held confidential, presented in group
from and only used in this study. The surveys distributed included a
cover letter that explained the project and requested participation, and
instrument. Finally, participants who expressed an interest in the
results will receive a summary of the findings and their interpretations
upon their request.
A total of 140 initial responses have been received. In order to
ensure the accuracy of the survey results, selected the same answer for
all question or having too many missing answers were excluded. Thus,
the final sample consisted of 136, resulted in a response rate of
(97.14%).
Amongst the respondents, (58.8%) were male and (41.2%) were
female. Age of participants ranged from 19 to 42 years with a mean
age of 26.24 years (Std. Deviation =5.05); as it shows in Table 1, the
majority of respondents were single (72.1%). Close to (60%) of
respondents traveled between 1 to 2 times per year in order to attend
sport conferences. Also, some information about respondents is
presented in Table 1.
Table 1. Sample characteristics
Measure Item Frequency Percentage (%)
Gender Male 80 58.8
Female 56 41.2
Education
Associate degree 9 6.6
Bachelor’s degree 33 24.3
Master’s degree 52 38.2
D.C. 42 30.9
Marital status Single 98 72.1
Married 38 27.9
Travel to participate in sport
conferences per year
1-2 81 59.6
3-5 36 26.5
6-12 9 6.6
More than 12 10 7.4
Providing a multidimensional measurement model for assessing quality of … 615
Data Collection
To test the proposed model, data from tourists were collected using a
structured questionnaire. Based on an extensive review of literature
from service marketing within sport and tourism, 35 items were
generated to measure service quality. Measures were translated from
English into Persian. Hence, to ensure content validity, they were
assessed by a panel of experts comprised of ten professors familiar
with the services literature and sport tourism, and based on their
feedbacks; some items were reworded, added or deleted so that
respondents would understand the questions correctly. For each item,
a five-point Likert scale was used with anchors from “1=strongly
disagree” to “5=strongly agree” to measure respondents’ agreement
levels on each item. The final questionnaire also included questions
about demographics. Next, a pre-test of the questionnaire was
conducted with 30 respondents to confirm that the instrument and
measures were clear, legible and understandable. Based on
respondents’ feedback, the questionnaire was revised and finalized.
Also, to assess the internal consistency (reliability) of the
questionnaire’s items, Cronbach’s alpha was calculated. The
reliability of the scale was found to be: α = 0.93.
Data Analysis and Results
Test for validity and reliability
To test for construct validity, scale items were analyzed using the
principal components method of factor analysis with VARIMAX
rotation (Table 2). Results of exploratory factor analysis show the
existence of four clean dimensions explaining 53.82% of the total
variance. Factor loadings of the scale items were relatively large,
ranging from 0.451 to 0.872. These were significantly more than the
minimum acceptable threshold for adequately representing the
construct validity of 0.45. The first factor had fifteen items and
explained the largest variance (24.87%) and clearly represented the
Venue Quality (VQ) dimension of the service quality. The second
factor contained eight items, and this explained 10.35% of the total
variance and corresponded with the Conference Quality (CQ)
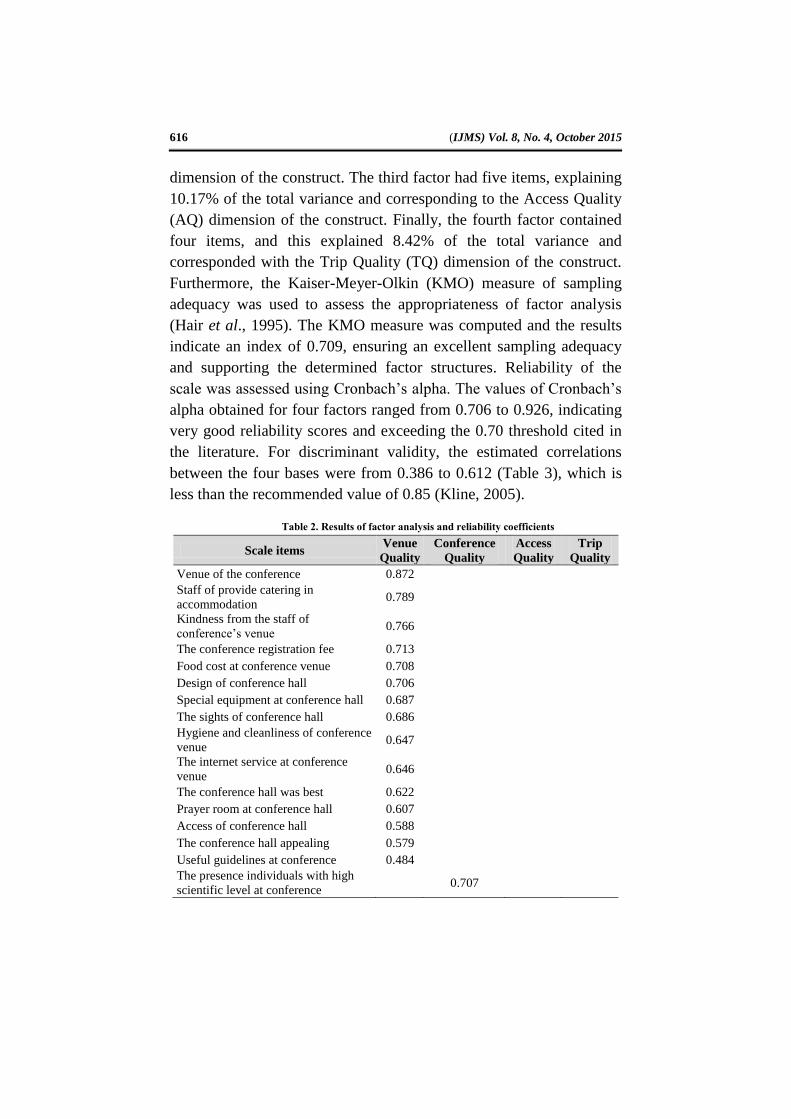
616 (IJMS) Vol. 8, No. 4, October 2015
dimension of the construct. The third factor had five items, explaining
10.17% of the total variance and corresponding to the Access Quality
(AQ) dimension of the construct. Finally, the fourth factor contained
four items, and this explained 8.42% of the total variance and
corresponded with the Trip Quality (TQ) dimension of the construct.
Furthermore, the Kaiser-Meyer-Olkin (KMO) measure of sampling
adequacy was used to assess the appropriateness of factor analysis
(Hair et al., 1995). The KMO measure was computed and the results
indicate an index of 0.709, ensuring an excellent sampling adequacy
and supporting the determined factor structures. Reliability of the
scale was assessed using Cronbach’s alpha. The values of Cronbach’s
alpha obtained for four factors ranged from 0.706 to 0.926, indicating
very good reliability scores and exceeding the 0.70 threshold cited in
the literature. For discriminant validity, the estimated correlations
between the four bases were from 0.386 to 0.612 (Table 3), which is
less than the recommended value of 0.85 (Kline, 2005).
Continue Table 2. Results of factor analysis and reliability coefficients
Scale items Venue
Quality
Conference
Quality
Access
Quality
Trip
Quality
Venue of the conference 0.872
Staff of provide catering in
accommodation 0.789
Kindness from the staff of
conference’s venue 0.766
The conference registration fee 0.713
Food cost at conference venue 0.708
Design of conference hall 0.706
Special equipment at conference hall 0.687
The sights of conference hall 0.686
Hygiene and cleanliness of conference
venue 0.647
The internet service at conference
venue 0.646
The conference hall was best 0.622
Prayer room at conference hall 0.607
Access of conference hall 0.588
The conference hall appealing 0.579
Useful guidelines at conference 0.484
The presence individuals with high
scientific level at conference 0.707
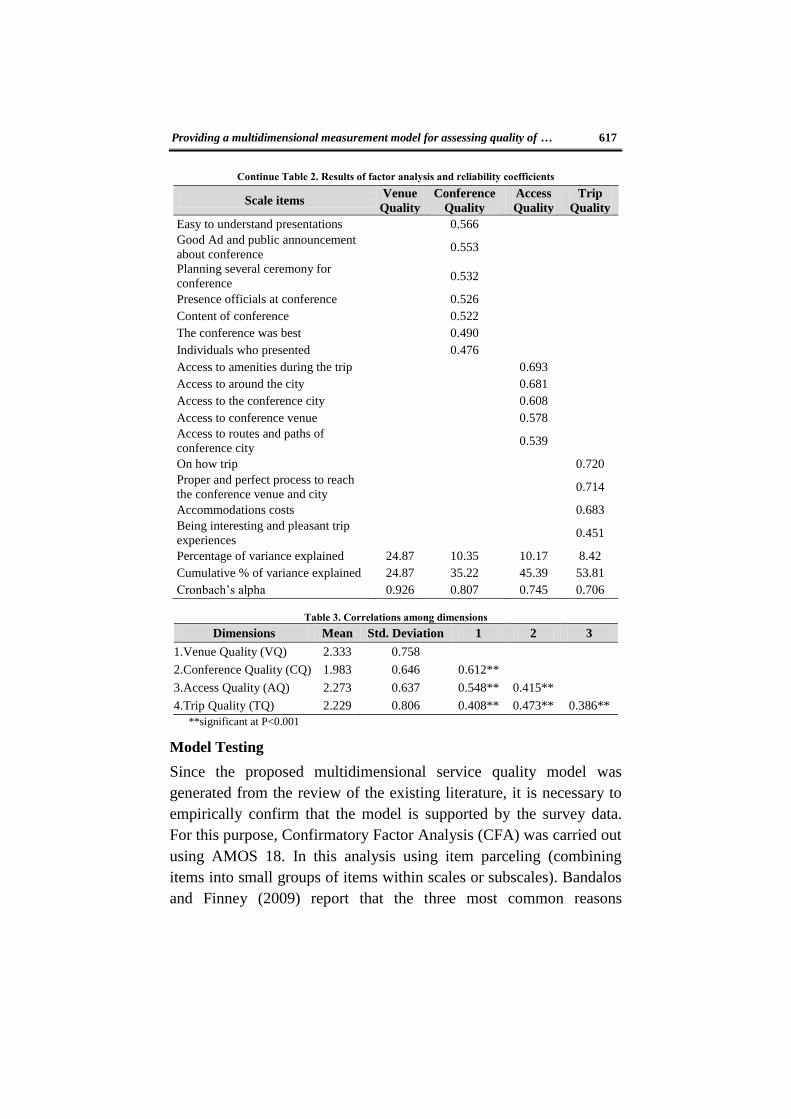
Providing a multidimensional measurement model for assessing quality of … 617
Continue Table 2. Results of factor analysis and reliability coefficients
Scale items Venue
Quality
Conference
Quality
Access
Quality
Trip
Quality
Easy to understand presentations 0.566
Good Ad and public announcement
about conference 0.553
Planning several ceremony for
conference 0.532
Presence officials at conference 0.526
Content of conference 0.522
The conference was best 0.490
Individuals who presented 0.476
Access to amenities during the trip 0.693
Access to around the city 0.681
Access to the conference city 0.608
Access to conference venue 0.578
Access to routes and paths of
conference city 0.539
On how trip 0.720
Proper and perfect process to reach
the conference venue and city 0.714
Accommodations costs 0.683
Being interesting and pleasant trip
experiences 0.451
Percentage of variance explained 24.87 10.35 10.17 8.42
Cumulative % of variance explained 24.87 35.22 45.39 53.81
Cronbach’s alpha 0.926 0.807 0.745 0.706
Table 3. Correlations among dimensions
Dimensions Mean Std. Deviation 1 2 3
1.Venue Quality (VQ) 2.333 0.758
2.Conference Quality (CQ) 1.983 0.646 0.612**
3.Access Quality (AQ) 2.273 0.637 0.548** 0.415**
4.Trip Quality (TQ) 2.229 0.806 0.408** 0.473** 0.386**
**significant at P<0.001
Model Testing
Since the proposed multidimensional service quality model was
generated from the review of the existing literature, it is necessary to
empirically confirm that the model is supported by the survey data.
For this purpose, Confirmatory Factor Analysis (CFA) was carried out
using AMOS 18. In this analysis using item parceling (combining
items into small groups of items within scales or subscales). Bandalos
and Finney (2009) report that the three most common reasons
618 (IJMS) Vol. 8, No. 4, October 2015
researchers cite for using item parceling are to increase the stability of
the parameter estimates improve the variable to sample size ratio, and
to remedy small sample sizes. Then, a series of confirmatory factor
analysis were estimated to confirm the proposed multidimensional
model. Figure 2 and table 4 present the measurement model and the
results of model fit indices. For this study, the test for equality of
covariance and means yields a chi-square of 88.73 with 23 degrees of
freedom (P = 0.001) and a RMSEA of 0.142. The RMSEA tends to
impose a harsher penalty for complexity on smaller models with
relatively few variables or factors. This is because smaller models
may have relatively few degrees of freedom, but larger models may
have more “room” for higher df values. Consequently, the RMSEA
may favor larger models. In contrast, the Goodness-of-Fit Index
(GFI), was relatively insensitive to model size (Kline R. , 2011).
While these fit measures suggest a good fit, the other fit indices also
pointed to a fair and acceptable model fit (NFI= 0.888, CFI= 0.914,
GFI= 0.873). In so far as the proposed model fit the data reasonably
well, we did not modify the model in any way as suggested by
Schreiber et al. (2006). In addition, because of Chi-square statistics’
sensitivity to sample size, the normed chi-square (χ²/df) was
recommended as a measure of model fit (Kline, 2005). In this model,
Chi-square to degrees of freedom was 3.715. Bollen (1989) proposed
that values of normed chi-square of 2.0, 3.0, or even as high as 5.0,
have been considered as indicators of reasonable fit.
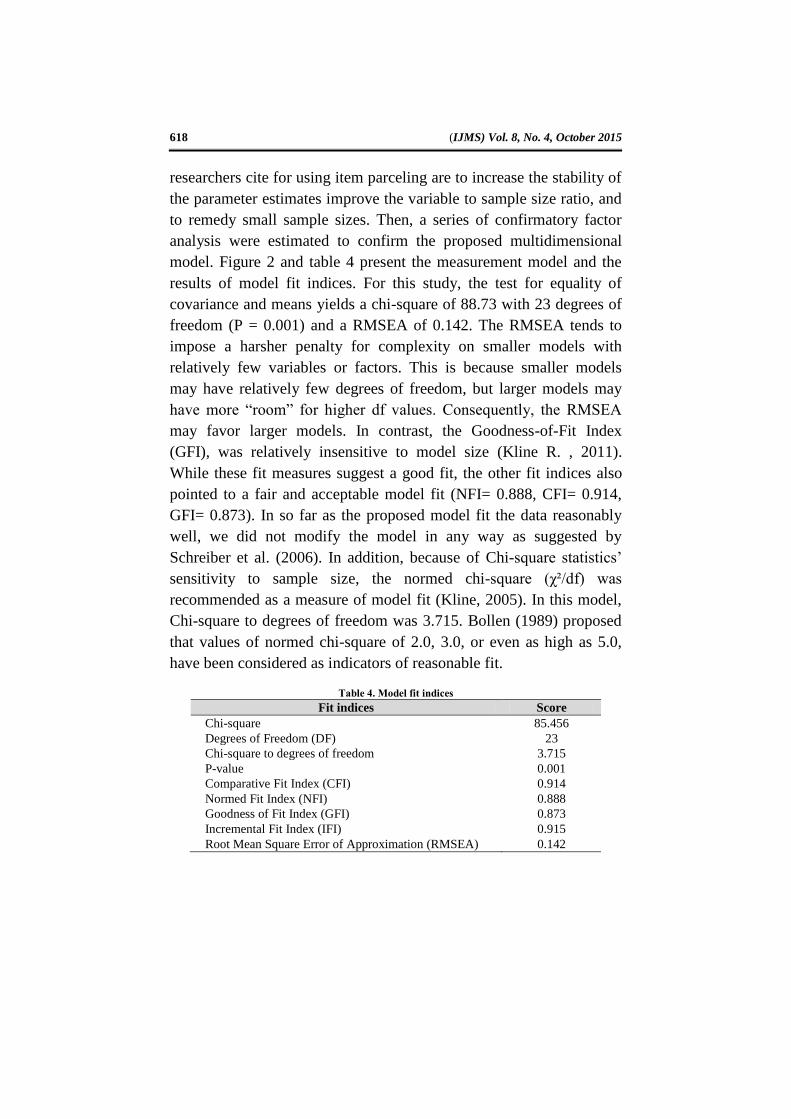
Table 4. Model fit indices
Fit indices Score
Chi-square 85.456
Degrees of Freedom (DF) 23
Chi-square to degrees of freedom 3.715
P-value 0.001
Comparative Fit Index (CFI) 0.914
Normed Fit Index (NFI) 0.888
Goodness of Fit Index (GFI) 0.873
Incremental Fit Index (IFI) 0.915
Root Mean Square Error of Approximation (RMSEA) 0.142
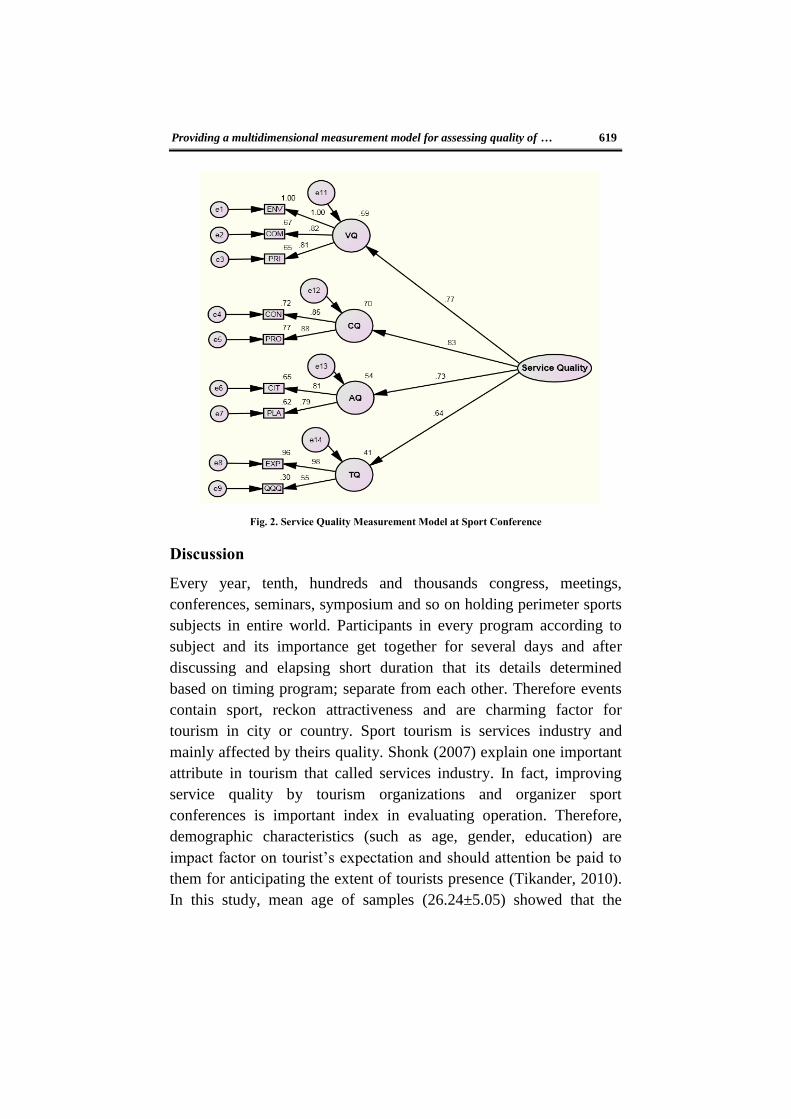
Providing a multidimensional measurement model for assessing quality of … 619
Fig. 2. Service Quality Measurement Model at Sport Conference
Discussion
Every year, tenth, hundreds and thousands congress, meetings,
conferences, seminars, symposium and so on holding perimeter sports
subjects in entire world. Participants in every program according to
subject and its importance get together for several days and after
discussing and elapsing short duration that its details determined
based on timing program; separate from each other. Therefore events
contain sport, reckon attractiveness and are charming factor for
tourism in city or country. Sport tourism is services industry and
mainly affected by theirs quality. Shonk (2007) explain one important
attribute in tourism that called services industry. In fact, improving
service quality by tourism organizations and organizer sport
conferences is important index in evaluating operation. Therefore,
demographic characteristics (such as age, gender, education) are
impact factor on tourist’s expectation and should attention be paid to
them for anticipating the extent of tourists presence (Tikander, 2010).
In this study, mean age of samples (26.24±5.05) showed that the

620 (IJMS) Vol. 8, No. 4, October 2015
majority of participants in this event were young and students. Also,
age is important criterion for judgment related to income. Therefore,
we have expectated that average of income in sample is relatively
middle (because individual has private income and with regard to
moral value we do not ask them directly). Hence attention should be
paid to this point that extent of income in tourists could effect on their
expectation and understanding quality of services. In this study, most
present tourists (%38.2) had MA degree, which showed their affinity
and motivation toward participation in the scientific conferences. Cha,
Mccleary and Uysal (1995), believed that education is mainly variable
that tourist motivations can be different based on their educations. For
example, it is determined that individual with high education has more
affinity to travelling (Braz, 2002).
From point of view of gender’s separation in tourists, %58.8 are
men and %41.2 are women, that indicates the presence of women in
these conferences as tourist, since majority events in our country are
single gender and men have maximum presence in it; hence, this
problem is unfavorable for sport tourism section and causes
disappearing of target market. Therefore, holding sport scientific
conferences can help to attract tourists especially in women part,
because most part of society as target market in tourism, it does not
have any restriction for presence in event sport.
Also, approximately %60 individuals traveled only 1 to 2 time in
year for participating in sport conferences, that showed low reception
individual from these events, while approximately %7.5 of them more
than 12 times in year travel for participating in sport conferences, as a
result organizer should pay attention to attract individual and
recognize the main factor and effective on service quality and
improving one of the action.
A basic principle of quality management is to improve quality,
which is must first be measured. On the basis of the need to develop
specific measurement tools for different services (Carman, 1990), this
study aimed at developing and validating a model specifically for
measuring sport conference service quality. A multidimensional
model has been proposed based on an extensive literature review and
Providing a multidimensional measurement model for assessing quality of … 621
then tested and validated by the survey data collected. This model
provides a very useful tool, for both researchers and practitioners, for
measuring and managing service quality in the sport conferences.
Finding of this study showed that attendees in conference form
their service quality perceptions based on their evaluations of four
primary dimensions including: venue quality, conference quality,
access quality and trip quality.
The results related to inferential analysis data showed from 35
items of questionnaire about service quality, which 32 items had high
value. Accordance to exploratory factor analysis, these items
classified in 4 groups. Adventing 4 factors in this study were
convergent with desired dimension by Shonk and Chelladurai (2008)
and adverse with 9 factors model by Kelley and Truly (2001). Of
course these investigators measured services quality in sport matches.
First factor had called “Venue Quality”. This factor refers to
quality of hall conference, hygienic situation and internet service,
manner of contact in personnel, and existence prayer room. Between
these item, “Venue of the conference”, “Staff of provide catering in
accommodation”, “Kindness from the staff of conference’s venue”,
and “The conference registration fee” had the most factor loading in
this factor. Therefore, for improving quality in service, it is necessary
to pay more attention to qualities of venue, manner and encounter of
personnel with participants and proportion cost of register with
participant’s income.
Second factor is “Conference Quality” and refer to individual
presence with high scientific degree, formal authorities presence,
conference content and manner of presentation. According to items of
this factor, for obtaining favorable quality in this section, attention
should be paid to invite scientific individual and important professors
for presence and lecture in conferences. Also, manner or way of
information technology and advertising about conferences could lead
to desired quality. In addition to designing and having plan and
different ceremony for participants, can help to quality.
Third factor is called “Access Quality”. Meaning of this factor is
ease and velocity on reaching participants to this city and hall
622 (IJMS) Vol. 8, No. 4, October 2015
conference. “Accessing to amenities during the trip”, “Accessing to
around the city”, “Accessing to the conference city”, “Accessing to
conference venue” were the most factors loading in this part. For
improving and achieving to service quality, welfare was applied and
hall was selected in suitable place that majority of participants have
easy access to it and it is one of the responsibilities on holders sport
conferences.
Final factor is “Trip Quality” and it refers to desired experience of
tourism and resident’s cost in city of holding conferences. Supplying
condition that tourists can obtain desireable experience from travelling
to this city and adjusting resident’s cost in city can lead to improve
service quality, especially tourism quality.
Each of the four identified and verified dimensions had significant
loading. For practitioners, the thirty two items across four factors can
serve as a useful diagnostic purpose. They can use the validated scale
to measure and improve service quality.
Results related to confirmatory factor analysis showed that 4
factors indentified throughout exploratory factor analysis were
effective on service quality in sport tourism. As a result, practitioners
must pay attention to four factors all together for obtaining desireable
service quality in this area. Between these factors, “Conference
Quality” had the most effect on service quality. This result showed
that presence elite individual, important professor for lecture and
presentation article in conference along with suitable planning and
variety ceremony had high effect on conference quality and in turn at
total service quality. In this case, Shonk and Chelladurai (2008)
believe that among quality dimensions in sport tourism service,
contest is the most important factor on service quality and it has main
portion in satisfying tourists.
“Venue Quality” was second factor that had the most effect on
service quality. Price variable, interaction with personnel and
conference environment had the most effect on this factor. Therefore
paying attention to register fee and cost related to food are important
in quality and it is necessary for holders and authorities to take into
account the income level of participants, politics and its method in
Providing a multidimensional measurement model for assessing quality of … 623
order to be adjusted. In addition to contact and manner of personnel,
giving guidance from them to tourists is effective on quality of venue
and tourism service. Since service’s personnel in these conferences are
temporary part-time workers or volunteers, it’s necessary for having
quality, they are educated. Interest, ability, politeness, sympathy,
contact, and adornment in personnel are items for accessing to
desireable quality in venue quality. Also attractiveness in conference
hall, prayer room, internet service, hygiene situation and cleanliness
are another items in quality that authorities should try to create such
environment. Bitner (1990) noted that variations in physical
environment can affect perceptions of an experience independently of
the actual outcomes. When participants enter to internal place and
conference hall, they will be busy to watching it, using beautiful
scene, presentation information and amusing them during pause main
services, which lead to delightful expectation and improving service
quality. In addition, cleaning in these positions that tourists forced stay
several days had mail role, for example, cleanliness of conference
hall, empting dustbin, sterile restrooms can also effect on quality that
tourists perceived. Venue is not only become clean before reaching
participants but also during holding it should be clean continually. In
this regard, Shonk and Chelladurai (2008) suggested that noise level,
odors, temperature, colors, textures, and comfort of furnishings may
influence perceived quality in the service encounter.
The third factor that had the most effect on service quality was
“Access quality”. These factors include access to city and conference
hall, between these items; access to conference hall was important and
had most effect on this factor. This result showed ease of access to
different places like reaching to city and conference hall affected
service quality. Therefore, holding sport scientific conferences in
place that tourists have better access to them and creating public
transportation for movement participants from different places of city
to conference hall lead to improving service quality. Also, Getz (2005)
stated that accessibility may relate to such details as parking areas,
airports, freeways and public transportation. Sport tourists are more
likely to perceive a higher quality experience when they can easily
624 (IJMS) Vol. 8, No. 4, October 2015
access the various places and things they want to see and do (Shonk
and Chelladurai, 2008).
Final factor was “Trip Quality” that effects on service quality. This
factor indicates travelling experience and pleasant to city and service
quality.
Conclusion
Service quality in sport tourism is service industry and has especial
importance on the other hand. And for obtaining desireable quality, it
should be recognized the main aspect of service quality, on the other
hand. Our model is focused on event sport tourism referring to a
specific type of sport tourism where individuals travel to be attendees
at an organized sport conference in a distant place. Creation 4 factors
related to service quality, emphasize its multidimensional and indicate
that for improving service quality, should pay attention to whole
aspects together. Also, we present a model in this study that indicates
the effect of “Conference Quality”, “Venue Quality”, “Access
Quality” and “Trip Quality” on service quality in sport tourism.
Hence, for obtaining desire service quality in sport tourism or
improving it, attention should be paid to content conference, exact
planning for holding, polite manner in personnel, especially facilities
and favorable in conference hall and ease access to conference hall.
Limitations and Future Research
A few limitations of this study should be acknowledged; however, we
argue that these should be seen as opportunities to design and develop
robust future studies. Firstly the sample used in this study limits our
ability to generalize these results to broader populations. The sample
was collected from a single Sport Conference in Iran. Future studies
could use more comprehensive samples and sampling method in order
to significantly improve the generalisability of the results. Secondly,
perceive service quality was assessed by collecting data from existing
customers. Generalisability of the results may be difficult to extend
beyond Iran’s boundaries; therefore, needs to be tested in other
Providing a multidimensional measurement model for assessing quality of … 625
countries and environments. Further studies should apply the
measurement instrument in different countries and with different
cultural, competitive and market environments in order to test the
consistency of our model. Finally, future studies should investigate the
relationship between service quality (as measured with the model) and
other important organizational outcomes such as customer
satisfaction, customer loyalty, value and repurchase intention. We
expect that such studies would confirm a positive relationship between
service quality and organizational outcome variables in the sport
conferences.
626 (IJMS) Vol. 8, No. 4, October 2015
References
Alexandris, K.; Douka, S. & Balaska, P. (2012). “Involvement with active
leisure participation: does service quality have a role?”. Managine
Leisure, 17(1), 54 - 66.
Alexandris, K.; Zahariadis, P.; Tsorbatzoudis, C. & Grouios, G. (2004). “An
empirical investigation of the relationship among service quality,
customer satisfaction and psychological commitment in a health club
context”. European Sport Management Quarterly, 4(1), 36 - 52.
Babakus, E. & Boller, G. W. (1992). “An empirical assessment of the
SERVQUAL scale”. Journal of Business Research, 24, 235-268.
Baker, D. A. & Crompton, J. L. (2000). “Quality, satisfaction and behavioral
intentions”. Annals of Tourism Research, 27(3), 785 - 804.
Bandalos, D. & Finney, S. (2009). “Item Parceling Issues in Structural
Equation Modeling”. In G. A. Marcoulides, & R. Schumacker, New
Developments and Techniques in Structural Equation Modeling (pp.
269-296). Taylor & Francis.
Bitner, M. J. (1990). “Evaluating Service Encounters: The Effects of
Physical Surroundings and Employee Responses”. Journal of
Marketing, 54(2), 69 - 82.
Bollen, K. A. (1989). Structural equations with latent variables. New York:
Wiley.
Bradish, C. L. (2003). An Examination of the Relationship between Regional
Sports Commissions and Organizational Structure. Electronic Theses,
Treatises and Dissertations, Florida State University. Retrieved from
http://diginole.lib.fsu.edu/etd/3415.
Brady, M. K. & Cronin Jr., J. J. (2001). “Some new thoughts on
conceptualizing perceived service quality: A hierarchical approach”.
Journal of Marketing, 65(3), 34 - 49.
Braz, J. I. (2002). “Sport for all moves people around the globe: New
perspective for tourism”. Journal of Asiana Sport For All, 1, 47-52.
Carman, J. M. (1990). “Consumer perceptions of service quality: An
assessment of the SERVQUAL”. Journal of Retailing, 66(1), 33 - 55.
Cha, S.; Mccleary, K. w. & Uysal, M. (1995). “Travel Motivations of
Japanese Overseas Travelers: A Factor-Cluster Segmentation
Approach”. Journal of Travel Reserch, 34(1), 33-39.
Chalip, L. (2004). “Beyond Impact: A General Model for Sport Event
Leverage”. In B. W. Ritchie, & D. Adair, Interrelationships, Impacts
and Issues (pp. 226 - 252). Tonawanda, NY: Channel View
Publications.
Providing a multidimensional measurement model for assessing quality of … 627
Chelladurai, P. & Chang, K. (2000). “Targets and Standards of Quality in
Sport Services”. Sport Management Review, 3(1), 1 - 22.
Chen, K.; Groves, D. & Lengfelder, J. (1999). “A system model of sport
tourism with implications for research”. Visions in Leisure and
Business, 18(1), 34 - 44.
Collier, D. A. (1994). The service quality solution: Using service
management to gain competitive advantage. Milwaukee, Wis. and
Burr Ridge, I11.: ASQC Quality Press .
Cronin, J. J.; Brady, M. K. & Hult, G. M. (2000). “Assessing the Effects of
Quality, Value, and Customer Satisfaction on Consumer Behavioral
Intentions in Service Environments”. Journal of Retailing, 76(2), 193-
218.
Dabholkar, P. A.; Thorpe, D. I. & Rentz, J. O. (1995). “A Measure of
Service Quality for Retail Stores: Scale Development and Validation”.
Journal of the Academy of Marketing Science, 24(1), 3 - 16.
Fornell, C. (1992). “A national customer satisfaction barometer: The
Swedish experience”. Journal of Marketing, 56, 6 - 12.
Getz, D. (2005). Event Management & Event Tourism (2 ed.). Elmsford,
NY: Cognizant Communication Corporation.
Gibson, H. J. (2003). “Sport Tourism: An Introduction to the Special Issue”.
Journal of Sport Management, 17(3), 205 - 213.
Goeldner, C. R. & Ritchie, J. R. (2012). Tourism: Principles, Practices,
Philosophies (12 ed.). Hoboken NJ: John Wiley & Sons.
Gröِnroos, C. (1984). “A Service Quality Model and its Marketing
Implications”. European Journal of Marketing, 18(4), 36 - 44.
Kandampully, J. (1998). “Service quality to service loyalty: A relationship
which goes beyond customer services”. Total Quality Management,
9(6), 431-443.
Kandampully, J. (2002). Services Management: The New Paradigm in
Hospitality. Australia: Pearson Education Australia.
Karatepe, O. M.; Yavas, U. & Babakus, E. (2005). “Measuring service
quality of bank: Scale development and validation”. Journal of
Retailing and Consumer Services, 12, 373-383.
Kelley, S. w. & Turley, L. W. (2001). “Consumer perceptions of service
quality attributes at sporting events”. Journal of Business Research,
54(2), 161-166.
Kim, W.; Jun, H. M.; Walker, M. & Drane, D. (2015). “Evaluating the
perceived social impacts of hosting large-scale sport tourism events:
Scale development and validation”. Tourism Management, 48, 21-32.
628 (IJMS) Vol. 8, No. 4, October 2015
Kline, p. (1994). An Easy Guide to Factor Analysis. London: Routledge.
Kline, R. (2011). Principles and Practice of Structural Equation Modeling
(Third ed.). New York: The Guilford Press.
Kline, R. B. (2005). Principles and practice of structural equation modeling
(2nd ed.). New York: The Guilford Press.
Ko, Y. J. & Pastore, D. L. (2004). “Current issues and conceptualizations of
service quality in the recreation sport industry”. Sport Marketing
Quarterly, 13(3), 158-166.
Kouthouris, C. & Alexandris, K. (2005). “Can service quality predict
customer satisfaction and behavioral intentions in the sport tourism
industry? An application of the SERVQUAL model in an outdoors
setting”. Journal of Sport Tourism, 10(2), 101-111.
Kurtzman, J. & Zauhar, J. (2003). “A Wave in Time -The Sports Tourism
Phenomena”. Journal of Sport & Tourism, 8(1), 35 - 47.
Kyle, G. T.; Theodorakis, N. D.; Karageorgios, A. & Lafazani, M. (2010).
“The Effect of Service Quality on Customer Loyalty within the
Context of Ski Resorts”. Journal of Park and Recreation
Administration, 28(1), 1 - 15.
Laroche, M.; Ueltschy, L. C.; Abe, S.; Cleveland, M. & Yannopoulos, P.
(2004). “Service Quality Perceptions and Customer Satisfaction:
Evaluating the Role of Culture”. Journal of International Marketing,
12(3), 58 - 85.
Lehtinen, U. & Lehtinen, J. R. (1991). “Two Approaches to Service Quality
Dimensions”. The Service Industries Journal, 11(3), 287 - 303.
Mackay, K. J. & Crompton, J. L. (1988). “A conceptual model of consumer
evaluation of recreation service quality”. Leisure Studies, 7(1), 41-49.
Martínez, J. A. & Martínez, L. (2010). “Some insights on conceptualizing
and measuring service quality”. Journal of Retailing and Consumer
Services, 17, 29 - 42.
Nice, B. (2004). golf in meetings, incentives, conventions, exxhibitions
(mice) tourism: perceptions of meeting planners. A thesis presented to
the graduate school of the university of Florida in partial fulfillment of
the requirements for the degree of master of science in recreational
studies. University of Florida.
Parasuraman, A.; Zeithaml, V. A. & Berry, L. L. (1985). “A conceptual
model of service quality and its implications for future research”.
Journal of Marketing, 49(4), 41 - 50.
Parasuraman, A.; Zeithaml, V. A. & Berry, L. L. (1988). “SERVQUAL: a
multiple-item scale for measuring consumer perceptions of service
quality”. Journal of retailing, 64(1), 12 - 40.

Providing a multidimensional measurement model for assessing quality of … 629
Ritchie, B. W. & Adair, D. (2004). “Sport tourism: An introduction and
overview”. In B. W. Ritchie, & D. Adair, Sport tourism:
Interrelationship, impacts and issues (pp. 1 - 29). Tonawanda NY:
Channel View Publications.
Seth, N. & Deshmukh, S. (2005). “Service quality models: a review”.
International Journal of Quality & Reliability Management, 22(9),
913-949.
Shonk, D. J. (2007). “Perceptions of service quality, satisfaction and intent
to return among tourists attending a sporting event”. North American
Society for Sport Management Conference (NASSM 2007).
Shonk, D. J. & Chelladurai, P. (2008). “Service Quality, Satisfaction, and
Intent to Return in Event Sport Tourism”. Journal of Sport
Management, 22, 587-602.
Standeven, J. & De Knop, P. (1999). Sport tourism, Champaign. IL: Human
Kinetics.
Theodorakis, N. D.; Koustelios, A.; Robinson, L. & Barlas, A. (2009).
“Moderating role of team identification on the relationship between
service quality and repurchase intentions among spectators of
professional sports”. Managing Service Quality, 19(4), 456 - 473.
Thwaites, D. (1999). “Closing the gaps: service quality in sport tourism”.
Journal of Services Marketing, 13(6), 500 - 516.
Tikander, J. (2010). Traveller and fan identities of the Finnish football fans.
The Master's Thesis, University of Jyväskylä, Department of sport
sciences.
Turner, R. S. & Rosentraub, M. S. (2002). “Tourism, Sport and the
Centrality of Cities”. Journal of Urban Affairs, 24(5), 487 - 492.
Weed, M. & Bull, C. (2009). Sports tourism: Participants, policy and
providers. Oxford UK: Elsevier Butterworth-Heinemann.
Yildiz, S. M. & Kara, A. (2012). “A re-examination and extention of
measuring oerceived service quality in Physical Activity and Sport
Centres (PSC): QSport-14 scale”. International Journal of Sports
Marketing & Sponsorship, 189-208.