provenance study of qumran pottery by neutron...
TRANSCRIPT
PROVENANCE STUDY OF QUMRAN POTTERY BY NEUTRON ACTIVATION ANALYSIS
PhD Dissertation
MÁRTA BALLA
BUDAPEST 2005

Table of contents Table of contents ........................................................................................................................ 0 Introduction ................................................................................................................................ 3 The scope of the work ................................................................................................................ 6 1. Science and archaeology .................................................................................................... 8 2. Archaeological chemistry................................................................................................... 9
2.1. Provenance Studies .................................................................................................. 11 2.2. Provenance studies of archaeological ceramics ....................................................... 12
2.2.1. “Best” elements ................................................................................................ 13 2.2.2. “Best” methods................................................................................................. 13
3. Neutron Activation Analysis............................................................................................ 15 3.1. Neutron Activation Analysis in archaeology ........................................................... 16
4. Principles of NAA............................................................................................................ 18 4.1. Irradiation ................................................................................................................. 18 4.2. Kinetics of activation ............................................................................................... 19 4.3. Standardization......................................................................................................... 20 4.4. Measurement and evaluation.................................................................................... 23
5. Performance capabilities of the INAA method ensuring privileged position among analytical techniques for provenance studies ....................................................................... 24
6. Analytical research and development .............................................................................. 26 6.1. “Strategic” developments......................................................................................... 26 6.2. Applied research....................................................................................................... 28 6.3. Operational activities................................................................................................ 28
7. Standard Operation Procedure for INAA of Archaeological Ceramics........................... 29 7.1. Analytical protocol ................................................................................................... 29 7.2. Estimation of uncertainty budget ............................................................................. 33 7.3. Method validation .................................................................................................... 34
7.3.1. Interlaboratory comparison and Proficiency Testing ....................................... 36 7.3.2. Intercalibration of laboratories ......................................................................... 37
8. Statistical evaluation of elemental data............................................................................ 39 8.1. Multivariate statistics for Qumran pottery data........................................................ 42
9. Qumran Pottery Project .................................................................................................... 44 9.1. The Dead Sea Basin ................................................................................................. 44 9.2. Scroll discovery........................................................................................................ 46 9.3. Excavations in Qumran ............................................................................................ 46 9.4. The function of the settlement.................................................................................. 49 9.5. The “Essene hypothesis”.......................................................................................... 50 9.6. Judean society in the Second Temple period ........................................................... 51 9.7. The Dead Sea Scrolls ............................................................................................... 53 9.8. Qumran pottery ........................................................................................................ 54
10. Chemical provenancing of Qumran pottery ................................................................. 57 10.1. Sample selection................................................................................................... 57 10.2. Reference material for Qumran............................................................................ 58 10.3. Analysis................................................................................................................ 59 10.4. Data processing .................................................................................................... 59 10.5. Analytical results.................................................................................................. 60
10.5.1. Chemical Group I. ............................................................................................ 61
1

10.5.2. Chemical Group II............................................................................................ 62 10.5.3. Chemical Group III. ......................................................................................... 63 10.5.4. Chemical Group IV. ......................................................................................... 63 10.5.5. Chemical Group V. .......................................................................................... 63 10.5.6. Outliers ............................................................................................................. 64
10.6. Discussion ............................................................................................................ 65 10.6.1. West-East connection....................................................................................... 66 10.6.2. Inscriptions on Pottery (Ostraca)...................................................................... 67 10.6.3. Another source, providing complementary information .................................. 69
10.7. Summary .............................................................................................................. 69 Synthesis................................................................................................................................... 71 Tables ....................................................................................................................................... 74 List of samples ......................................................................................................................... 91 List of figures ........................................................................................................................... 96 Elemental data .......................................................................................................................... 97 Bibliography........................................................................................................................... 125 Acknowledgements ................................................................................................................ 133
2
Introduction
Introduction
Ancient manuscripts were discovered at various places during the last two centuries,
like e.g. Greek and Latin scrolls from under the lava of Herculaneum, Greek papyri and
Coptic Gnostic manuscripts from Egypt, but these never moved the Western world as did the
scrolls found in caves near Qumran, at the Dead Sea. These manuscripts, known today as the
Dead Sea Scrolls, dated to 300 BC-70 AD have over the last fifty-five years shed light on the
origins of Judaism and Christianity as well as providing insight into the political and religious
setting at a time of momentous importance.
To whom these manuscripts belonged, who wrote, copied, read these texts and hid
them into the caves, have always been controversial. The texts themselves do not give a
definite answer. Most part of the scrolls includes biblical texts, books of the Hebrew Bible,
another type is represented by apocryphal, and there are general writings, such as calendric
treaties or magical texts. A significant portion of the manuscripts however, of sectarian
character, belonging to a religious community: rules, exegeses and liturgical works.
Identification of this community is not clearly defined, but there is a consensus today,
that the Essenes, mentioned by the ancient authors, Flavius Josephus, Pliny the Elder, Philo of
Alexandria were the writers of the communal, sectarian texts, and the settlement, Khirbet
Qumran, excavated near the caves belonged to the Essene community. In the vicinity of the
settlement there is a cemetery of about 1200 graves that was also discovered.
The connection of the settlement with the cemetery and the caves, as well as the
function of the settlement, and the identity of the community have always been the object of
academic and religious debates. Generations of scholars have tried to answer the question:
who wrote the Dead Sea Scrolls? Were they written locally in Qumran, or were they taken
from other places? Do the descriptions of the ancient writers about the Essenes fit this
3

Introduction
community, and their description of the “wilderness” to Qumran? Do the settlers of Qumran
rest in the nearby cemetery? Were it the Essenes who used the caves and hid the scrolls there,
fearing the arrival of the Roman legions?
Scroll research was a continuous, dynamic process over the past fifty years, and
because of the very slow process of their publication, it always seemed mystical, nonetheless,
controversial. Archaeological research of the Qumran Complex (settlement, cemetery, caves)
however, led by Roland de Vaux, didn’t gain such a public attention. The excavation of
Khirbet Qumran was accomplished, investigation of the caves and the marl spur was
performed, material finds were placed into the vaults of the École Biblique et Archéologique
and in the Rockefeller Museum. Traditional archaeology finished its task.
The integration of flesh and spirit, archaeology and scroll research has been only a
recent endeavour, although Qumran provides a unique opportunity to the reconstruction and
understanding of the life of a community by
combining information from ancient authors, the
scrolls themselves, and archaeological evidences.
The texts and the antique literary sources provide
information that complement archaeology, while
archaeology establishes the direct connection
between the scrolls in the caves and the settlement at
Qumran.
The best evidence is provided by the pottery,
for the same unique ceramic types were discovered in
the settlement and in the scroll caves. In the first
season of Qumran excavations (1951) it was noticed
that “sunk into the floor of one of the rooms was a
jar, identical with most of those found in the Scroll
cave….We thus, even in the small area so far
excavated, have a direct connection with the Scrolls
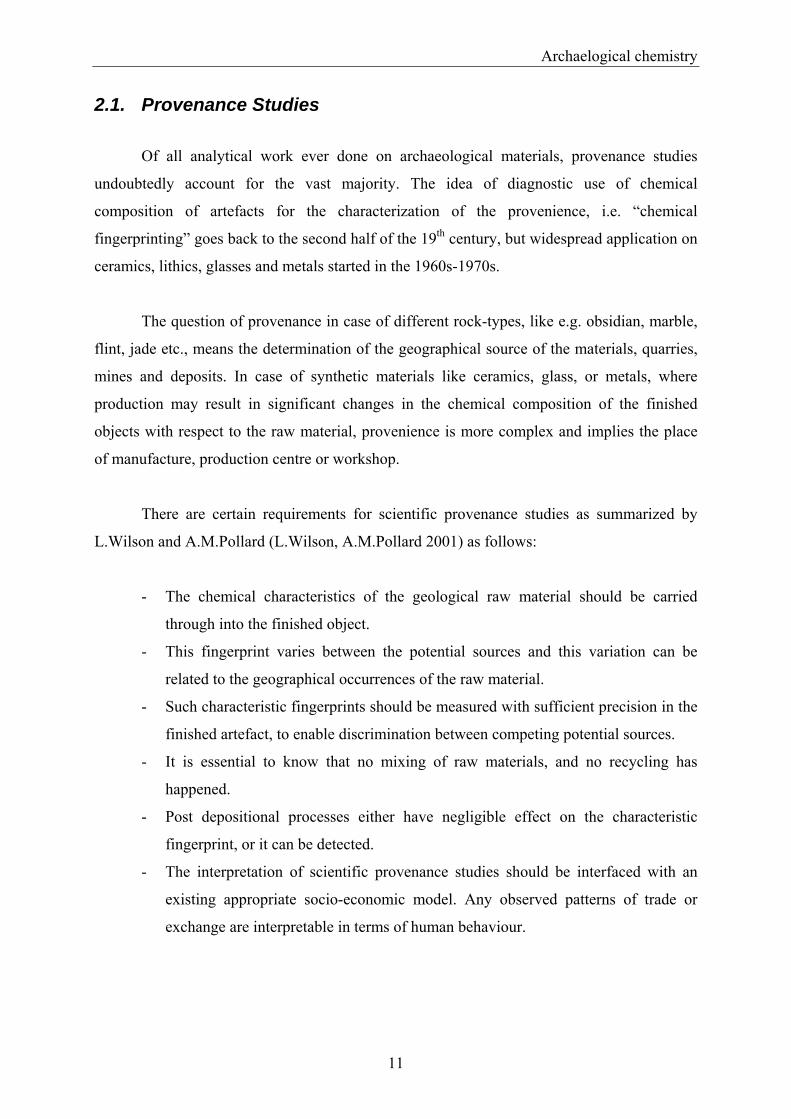
“(Harding 1952). The most distinctive pottery-type associated with Qumran is, beyond doubt,
the cylindrical jar, the so-called scroll jar (Fig.1.).It represents a unique storage jar type,
frequent in Qumran, but completely unattested elsewhere. The ceramic assemblage shows a
Figure 1. Cylindrical scroll jar with lid (Davies 2002)
4

Introduction
number of peculiarities both in terms of types that are present and the types that are absent.
Most of the published papers on the pottery of Qumran are in agreement, that the pottery was
made at the site.
The study of pottery is always a powerful way to look into the life of early
civilisations. One can get a view into the technological level of pottery practice of a given
population, but one may learn about the development of trade, or simple human interaction
between groups of people. This applies to the Qumran settlement as it does to any other site.
Taking this into consideration, it seemed to be a logical step to study the ceramic
material unearthed at Khirbet Qumran and the surrounding caves, to cheque the validity of
this statement, by identifying specific characteristics of Qumran pottery, which give definite
answers concerning their provenance: chemical composition.
Archaeological ceramics all bear special chemical fingerprints which, appropriately
identified, can be used to trace the vessels back to where they were manufactured.
Instrumental Neutron Activation Analysis has been applied to Qumran pottery with a primary
objective of establishing their chemical composition and by that their provenience, thus
shading light on the closeness of the community, possible trade patterns and interregional
contacts.
5

Scope
The scope of the work
Within the past few years there has been a significant shift in the research interest
from classical archaeology to applying scientific techniques in an attempt to better understand
this ancient monastic community. This paradigm change has resulted in a new emphasis away
from the literary/historical emphasis of the distant past to an interdisciplinary synthesis
towards the human landscape.
The sciences provide archaeology with numerous techniques and approaches to
facilitate data analysis and interpretation, enhancing the opportunity to extract more
information from the material record of past human activities. Specifically, chemistry has as
much to offer as any other scientific discipline, if not more.
To determine the chemical profile of Qumran potteries and related materials, with a
special emphasis on trace element abundances, instrumental neutron activation analysis has
been applied. Reliable scientific information must be based on results produced by an
analytical technique, which has an appropriate accuracy, precision, sensitivity, resolution
power and fitness of purpose to be applied to the archaeological problem.
On the other hand, results of scientific provenance studies are irrelevant in themselves.
Where a vessel comes from is of limited value, unless it can be interfaced with an existing
social and economic structure, historical background, basic forms of human behaviour.
To meet the requirements of this twofold task, methodological as well as
archaeological research have needed, and the scope of the work summarized in the
dissertation was formulated as follows:
- to perform strategic (resource implementation) and applied (resource utilization)
research and development in the field of Instrumental Neutron Activation
Analysis, to fit the technique to provenance studies of archaeological ceramics
6
Scope
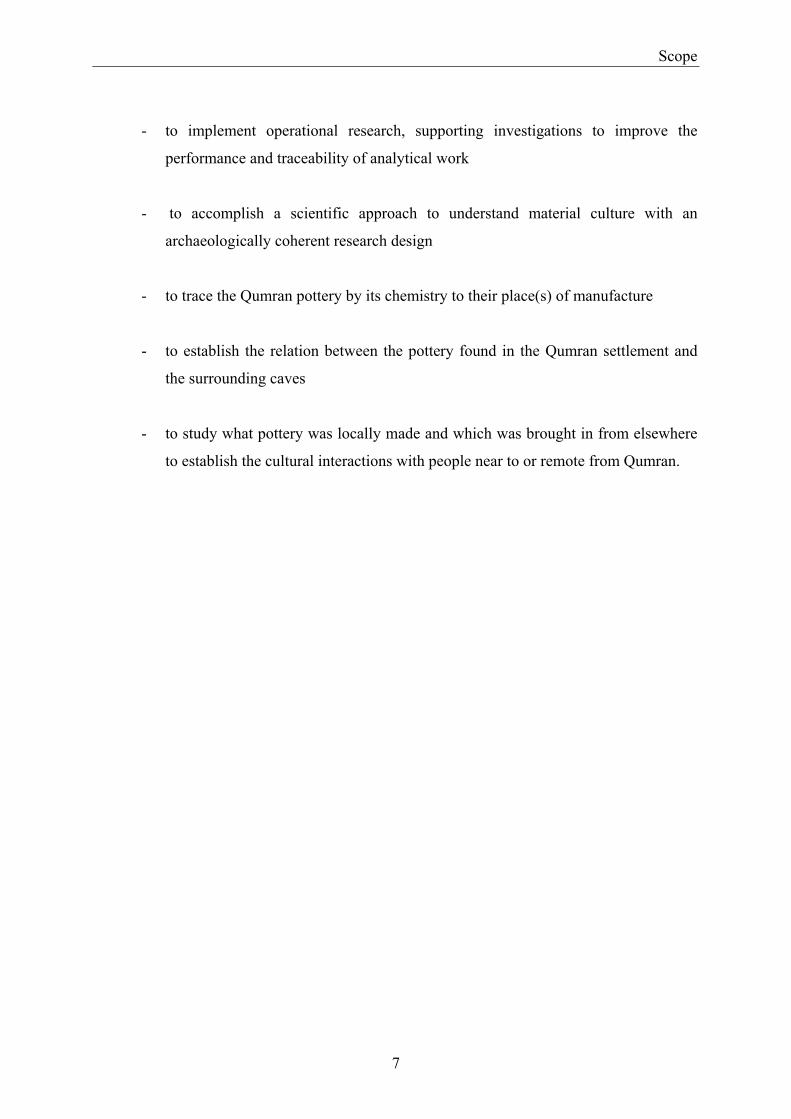
- to implement operational research, supporting investigations to improve the
performance and traceability of analytical work
- to accomplish a scientific approach to understand material culture with an
archaeologically coherent research design
- to trace the Qumran pottery by its chemistry to their place(s) of manufacture
- to establish the relation between the pottery found in the Qumran settlement and
the surrounding caves
- to study what pottery was locally made and which was brought in from elsewhere
to establish the cultural interactions with people near to or remote from Qumran.
7

Science and archaeology
1. Science and archaeology
Archaeology is one of the few disciplines that bridge the gulf between the humanities
and the sciences. The diversity of scientific analyses in archaeology can be summarized into
the following areas (Tite 1991):
- Physical and chemical dating methods which provide archaeology with absolute
and relative chronologies.
- Artefact studies incorporating provenance, technology and use.
- Environmental approaches which provide information on past landscapes,
climates, flora and fauna as well as diet, nutrition, health and pathology of people.
- Mathematical methods as tools for data treatment also encompassing the role of
computers in handling, analysing, and modelling the vast sources of data
- Remote sensing applications comprising a battery of non-destructive techniques
for the location and characterization of buried features at the regional, micro
regional, and intra-site levels.
- Conservation science, involving the study of decay processes and the development
of new methods of conservation.
It is easy to see, that chemistry is relevant to most, if not all of the areas.
Archaeological chemistry is not a straightforward application of routine methods, but a
challenging field of enquiry, making significant contributions.
8

Archaelogical chemistry
2. Archaeological chemistry
Chemical methods have been brought to bear archaeological importance ever since
chemistry became a recognizable science. At the end of the 18th century Klaproth determined
the composition of some Greek and Roman coins, and Roman glass pieces. H. Davy
examined ancient pigments from Rome and Pompei, Faraday proved the presence of lead in
Roman pottery glaze, and the list of the most eminent scientists could be continued (Pollard
1996). Since then, chemists in increasing numbers have been fascinated by the evidences that
chemical analysis can tell about ancient history, ancient ways of life, including technical
processes and the chemical substances, and patterns of trade in the ancient world.
In the middle of the 19th century, the Austrian scholar, J.E.Wocel first suggested that
correlations in the chemical composition could be used to trace the provenance, i.e. to identify
the source of archaeological materials. Some years later the Estonian Göbel made a
comparative study of a large number of metal objects from the Baltic region and that of
known artefacts of prehistoric, Greek and Roman date. With his work scientific analysis
progressed beyond the generation of analytical data on simple specimens to “establishing a
group chemical property” (Harbottle 1982).
The increasing number of archaeological objects soon called for restoration and
conservation methods. F.Rathgen established a laboratory at the State Museum of Berlin and
he published the first book on practical procedures for conservation of antiquities (Rathgen
1898). The end of the 19th century finally witnessed the first wet chemical investigations of
archaeological ceramics.
The beginning of the 20th century brought about instrumental measurement techniques,
like e.g. optical emission spectroscopy, and the scientific and technological developments
persuaded by the Second World War resulted in a wide range of scientific techniques to be
used for studying archaeological materials. The principles of neutron activation analysis
(NAA) had been set forth by this time too, but its widespread application was hindered by
technical and methodological difficulties.
9
Archaelogical chemistry
The development of radiocarbon dating by W. Libby in 1949 is a real cornerstone
concerning the integration of hard sciences within archaeology (Libby 1952).
By the 1950s the new discipline of Archaeometry has been developed, covering the
involvement of chemical, physical and biological sciences within archaeology. A journal with
the same title started in 1958, illustrating the full potential of scientific endeavours in
archaeology. The term archaeometry is not favoured by now, as it has the danger of over-
emphasizing the “-metry” at the expense of the “archaeo-“, and has been modified to
archaeological science or scientific archaeology.
In the 1960s a wide range of scientific techniques was deployed to material remains.
The so-called golden era in archaeometry (Pollard 1996) brought about valuable contributions
in the determination of a wide range of chemical properties, including trace element
composition, scientific dating, mineralogy, isotopic distribution, biomarker composition, etc.
By the development of computers big data sets, generated by the measuring techniques could
be subjected to statistical treatment.
Sophisticated analytical techniques of the 80s-90s offered routine analysis of samples
in the milligram or smaller scale, running automatically under computer control, giving
information on any kind of physical and chemical properties of any kind of materials.
For quite a long time archaeology has paid more attention to the analysis of inorganic
materials – stone, metal, ceramics, glass, etc. Recently however, materials previously thought
to be lost, like ancient textiles, waxes and resins, food residues, human remains, including
bone, teeth, hair, protein, lipids and most recently DNA, are in the focus of research interest.
Organic chemistry, biochemistry, molecular biology has their techniques to offer to
archaeology.
As no analytical technique has “built-in interpretative value for archaeological
investigations” (DeAtley&Bishop 1991), the success in archaeological science, however, lies
in the degree of integration into relevant archaeological questions, in a contextually driven
research. Science and archaeology should focus on common objectives.
10
Archaelogical chemistry
2.1. Provenance Studies
Of all analytical work ever done on archaeological materials, provenance studies
undoubtedly account for the vast majority. The idea of diagnostic use of chemical
composition of artefacts for the characterization of the provenience, i.e. “chemical
fingerprinting” goes back to the second half of the 19th century, but widespread application on
ceramics, lithics, glasses and metals started in the 1960s-1970s.
The question of provenance in case of different rock-types, like e.g. obsidian, marble,
flint, jade etc., means the determination of the geographical source of the materials, quarries,
mines and deposits. In case of synthetic materials like ceramics, glass, or metals, where
production may result in significant changes in the chemical composition of the finished
objects with respect to the raw material, provenience is more complex and implies the place
of manufacture, production centre or workshop.
There are certain requirements for scientific provenance studies as summarized by
L.Wilson and A.M.Pollard (L.Wilson, A.M.Pollard 2001) as follows:
- The chemical characteristics of the geological raw material should be carried
through into the finished object.
- This fingerprint varies between the potential sources and this variation can be
related to the geographical occurrences of the raw material.
- Such characteristic fingerprints should be measured with sufficient precision in the
finished artefact, to enable discrimination between competing potential sources.
- It is essential to know that no mixing of raw materials, and no recycling has
happened.
- Post depositional processes either have negligible effect on the characteristic
fingerprint, or it can be detected.
- The interpretation of scientific provenance studies should be interfaced with an
existing appropriate socio-economic model. Any observed patterns of trade or
exchange are interpretable in terms of human behaviour.
11

Archaelogical chemistry
2.2. Provenance studies of archaeological ceramics
Provenance studies of ceramics are a real success-story in archaeological chemistry.
Pottery was important in trade, and the composition of pottery is strongly related to the source
of clay and the recipe of the fabrication. This is highly site-specific and, although similar in
style and appearance, in critical cases it is possible to distinguish among products by
determining the chemical composition.
Clay deposits are extremely common and are found all over the world. The chemical
composition of a clay deposit is a complex product of the mineralogy of the rocks from which
the clay is derived, the weathering and transport processes effecting the production of given
deposit, and the chemical environment of sedimentation.
The basic constituents of pottery clays are clay minerals, i.e. hydrated aluminium
silicates. Within the basic phyllo-silicate structure some minor constituents, present to the
order of a fraction of 1 percent to several percents are also found. The raw clay used for
pottery contains, in addition to the clay minerals, residual components of the original rock,
and other materials that are picked up during the transport.
Ceramic producing procedures might involve washing, levigation, mixing clays from
different deposits, and adding temper, in order to obtain workable plasticity, to provide
porosity and diminish shrinkage during firing. Ceramics are fired at temperatures between
700-1400 oC, with a wide range of chemical reactions taking place during firing, depending
on the mineralogical composition of the clay and the temperature and condition of firing.
It is obvious that this anthropogenic manipulation of the raw material makes it highly
difficult to trace vessels back to raw clays, and usually it is not attempted. Ceramic
provenancing almost always means tracing potteries to production places, where both
geochemistry and potters’ practice are covered. The normal procedure is to compare the
finished pottery with fired pottery of certain, or assumed provenance. Most commonly
“control groups” are established from kiln wasters, or by comparison with material of
impeccable provenience.
12

Archaelogical chemistry
Over the last twenty years there have been heated debates about the most informative
elements and the most appropriate analytical technique for source discrimination. A number
of instruments and analytical protocols may fulfil provenance objectives with the ability of
determining a wide range of elemental concentrations.
2.2.1. “Best” elements
Clay minerals are composed of the major structural elements Si, Al, and O. Minor
elements (0.1%-10%) such as Ca, Fe, K, Na, Ti and Mg can be both technological and
provenance discriminators. Trace elements (below 0.1%) are considered to be accidental, and
thus provenance-related. While changes in the concentrations of the main and minor
components are restricted by stoichiometrical rules, trace elements are more variable in clay
sources. Also, trace elements are less susceptible to anthropogenic control, than the major and
minor elements, which are more likely to influence the firing and performance characteristics
of the pot. The majority of chemical provenance studies carried out since the 1970s have
utilized trace element data.
2.2.2. “Best” methods
For scientific provenance analyses the following requirements have to be considered:
1. A logical demand is that analyses must give information on as many elements as
possible, so as to get an overall picture of the periodic system.
2. The method should be sensitive enough for the determination of trace elements.
3. Analyses, coming from the nature of the problem, should be carried out in series of
samples, too, so phases from the preparation of samples to the results received, should
not contain time-consuming processes.
The aim is to apply a well-automated measuring technique, which assumes a sensitive
determination of trace elements at the same time ensuring the objectivity, reliability and
reproducibility required by the task.
13
Archaelogical chemistry
The most common methods of elemental analysis for ceramics are atomic emission
spectroscopy (AES), atomic absorption spectroscopy (AAS), X-ray fluorescence spectroscopy
(XRF), neutron activation analysis (NAA) and inductively coupled plasma spectrometry
(ICP).
Atomic emission spectroscopy is a simultaneous, selective technique, suitable to
measure virtually any element present in a powder sample of 10 mg, in concentrations
between 0.001% and 10%. It is quite difficult to standardize (photographic procedure) and the
reproducibility of the measurements is affected by some technical parameters.
Atomic absorption spectrometry provides a rapid and effective means of analysis, but
has the disadvantage of being sequential instead of simultaneous character. Sample
preparation is quite difficult, samples have to be dissolved. Reproductivity problems can be
significant as well.
X-ray fluorescence spectrometry is the most surface sensitive of the analytical
techniques, which can be a critical restriction. Although it can be non-destructive, for
unprepared samples standardization is quite problematic. For prepared, i.e. fusioned glass
bead samples and using a wavelength-dispersive system the method has the required trace
element sensitivity, but this protocol has relatively little use on archaeological materials.
Inductively coupled plasma atomic emission spectrometry (ICP-AES) is a quasi-
simultaneous multielemental technique, sensitive for the determination of trace elements. Its
main disadvantage is that it needs dissolved samples.
Connecting up the ICP torch to a mass spectrometer gives the powerful technique of
inductively coupled plasma mass spectrometry (ICP-MS). It makes possible to determine the
concentration of individual isotopes, or the ratios of specific isotopes of a given element. Its’
sensitivity is prominent, but still has the disadvantage of requiring a sample solution. There
are different approaches to overcome this problem, like slurry nebulization or laser ablation.
The following description will show that neutron activation analysis satisfies all the
mentioned requirements. This is the most widespread analytical technique applied in studies
on the provenance of archaeological ceramics.
14

Neutron Activation Analysis
3. Neutron Activation Analysis
Neutrons were discovered in 1932 and within four years the principles of neutron
activation analysis had been set forth by Hevesy and Levi (1936). They determined the
dysprosium content of an yttrium sample, using a radium-beryllium neutron source, Geiger-
Müller tube for beta-counting, while element identification was based on half-life. Because of
the lack of high-flux neutron sources and gamma ray spectrometry equipment the method was
slow in developing. Nevertheless, the initial development was combined with skilful
advancements in radiochemistry, as multi-element samples had to be treated via tedious post-
irradiation radiochemical separations (P.Guinn 1999).
The construction and rapid distribution of nuclear research reactors after the Second
World War has been of great help to the development of activation analysis. Radiochemical
separations were still essential, as counting was possible by Geiger or proportional counters.
The appearance of the NaI(Tl) scintillation detectors in the 1950s, coupled with the newly-
developed pulse-height analyzers paved the way to gamma-ray spectrometry. The electronic
revolution, with the development of transistors, computers and solid-state detectors has made
a real impact in the field.
In the early 1960s the lithium-drifted germanium semiconductor detectors were
invented, with an energy-resolution of some 20-30 times better, than was possible with a
NaI(Tl) scintillation detector. By 1970 Ge(Li) detectors with sensitive volumes approaching
1000 cm3 and multi-channel analyzers of 4096 channels had become commercially available.
Progress in the field of gamma-spectroscopy made possible the instrumental neutron
activation analysis (INAA) of multi-element samples. The method proved to be applicable in
a great variety of fields, the annual publication rate had risen to about 1000 (P.Guinn 1990)
During the 1980s the high-purity germanium detectors began to replace the Ge(Li)
detectors, the development in nuclear electronics proved to be a constant dynamic process,
just as the development of computers and computer programs to process the data.
15

Neutron Activation Analysis
It can be stated that up to the 1970s INAA was undoubtedly the only highly sensitive,
quantitative, multi-elemental analytical method available. Its unique position, nevertheless,
has been challenged by other increasingly sensitive and versatile analytical techniques, like
AAS, ICP-AES and ICP-MS, which today are used widely in applications that previously had
been a domain for NAA. A variety of activation analysis techniques have emerged, though,
that complements classical NAA and increases its capabilities. INAA still occupies a solid
position in analytical chemistry, it is competitive with or superior to most methods when
precise and accurate data are needed. It has the advantage that solid samples can be analysed
directly reducing the hazards of contamination that emerges during sample dissolution. The
highest competitor will be the ICP-MS with laser ablation in the future.
3.1. Neutron Activation Analysis in archaeology
NAA has been used on archaeological material from the early fifties. The earliest
publication is from Ambrosino and Pindrus (1953), they studied coins from the collection of
the Louvre. In 1956, at the suggestion of R.Oppenheimer, a conference was held in Princeton,
(Asworth 1966) to examine the possibility of the use of nuclear techniques to help solve
archaeological problems. As a result of this meeting, work started at the Brookhaven National
Laboratory and in the Research Laboratory for Archaeology at Oxford. E.Sayre made the
initial study on Mediterranean pottery (1957). In an evaluation of this work it was concluded,
that the results were encouraging, and that specific questions of archaeological analysis could
be answered by neutron activation analysis. V.M.Emeleus pioneered the technique in Britain,
and applied it mostly to terra sigillata (Emeleus 1958, 1960).
The first archaeological applications of INAA were primarily methodological in
nature, with the broadly posed archaeological question: Is this type of pottery chemically
different from the other one? By the development of the instrumentation the number of
elements, that could be determined and quantified, and the capabilities of the method
increased considerably. Main contributors of this period were Asworth and Abeles, Sayre and
Dodson. For more than two decades, the two major laboratories in this field were the
Brookhaven National Laboratory and the Lawrence Berkeley Laboratory.
16
Neutron Activation Analysis
This period culminated in the work of Isadore Perlman and Frank Asaro. With a
systematic theoretical as well as practical work of indisputable importance, they developed a
high precision INAA technique, making measurements accurate to the 1% level for most of
the elements, which should be good enough to make the distinctions between clay fingerprints
from different potteries. Protocols for the analysis and for a possible statistical data-treatment
are basic contribution to the field. Besides, they prepared and calibrated the first multi-
element standard of fired clay, called standard pottery, which became one of the most highly
regarded multi-element standards in the field of NAA. (Perlman 1969, 1971)
Perlman proved that the implementation of the newly developed method is not less
important than the accurate analysis. One of his major efforts was the development of a data
bank of reference clay-sources and groups of pottery of known origin, whose fingerprints
could be compared with those of ancient pottery. With his research group he tackled many
archaeological projects, mostly in the Mediterranean and in Palestine. (Perlman 1970, 1986)
Neutron activation laboratories specializing in the provenance of pottery with similar
procedures started in France (Widemann 1975, 1978, 1980), Israel (Perlman 1981,
Gunneweg 1983,1985, Yellin 1978,1985) and Germany (Mommsen 1987, 1988, 1992). The
most productive period of NAA laboratories in this field was the 1980-1990s, teams from the
University of Toronto (Hancock 1985, 1986), the Missouri University Research Reactor
(Glascock 1992, 1993., Neff 1992, 1993), the Demokritos Reactor Centre (Kilikoglou 1984,
1995), The University of Sofia (Kuleff 1986, 1996, 1998) reported valuable works on
different material remains of our cultural heritage, originating from the most different context
in space and time.
It can be stated that for at least two decades the standard analytical method for
producing multi-element analyses with detection limits at the ppm level or better has been
INAA, and in spite of the difficulties resulting from the decline in acceptance of nuclear
power, is still marketable. The two most competing techniques today are PIXE and ICP-MS.
INAA however is competitive with or superior to most methods when precise and accurate
data are needed.
17
Principles of NAA
4. Principles of NAA
A brief summary is given below on the theoretical aspects of NAA, to demonstrate
that its performance capabilities undoubtedly ensure its privileged position among trace-
element techniques implemented in archaeological science.
The basic idea of NAA is that irradiating a sample by neutrons high-probability (high
cross-section) nuclear reactions are induced, producing from stable isotopes of different
elements concerned radioactive nuclides, whose characteristic radiations can be used both to
identify and accurately quantify the elements of the sample.
The radioactive decay is characterized by its half-life, which can be on a wide scale
from the fraction of a second to several years. Most nuclides stabilize by β-decay, but the
emission of β-particles is often accompanied by discrete gamma radiation.
Determinations are based on the detection of the highly penetrating γ-photons of
discrete energies. Gamma energies of different nuclides are spread over the interval from
some keV to some MeV.
The measurable parameters for qualitative analyses are the energy of the emitted γ
quanta (Eγ) and the half-life of the nuclide (T1/2). For quantitative analysis the intensity (Iγ) is
used, which is the number of γ-photons of energy Eγ, measured per unit time.
4.1. Irradiation
There are various types of neutron sources according to the needs and availability.
Nevertheless, the most efficient neutron sources for high sensitivity activation analysis are the
nuclear reactors, operating in the maximum thermal power region of 100 kW – 10 MW, with
a thermal neutron flux of 1012 – 1014 neutrons cm-2 s-1.
18

Principles of NAA
4.2. Kinetics of activation
In the case of neutron induced nuclear reactions, the activity of the studied nuclide
depends, beside the number of target atoms, on the flux of the neutrons and the macroscopic
cross-section of the given nuclear reaction. Both cross-section and neutron flux depend on the
neutron energy, therefore the basic activation equation is:
∫0
)()( dEEENNR 4.2.1.
Where N is the number of interacting nuclides, σ(E) is the cross-section [in cm
∞
Φ(E) is the neutron flux per unit of energy interval [in cm-2s-1eV-1], and R is
the rea
lower limit of
e epithermal component of neutron spectra is 0.55 eV, the Cd cutoff energy:
Φ⋅⋅=Φ⋅⋅= σσ
2] at neutron
energy E[in eV] ,
ction rate.
When irradiation is performed in a nuclear reactor, the integral in Eq. 4.2.1. is replaced
by a sum of two integrals, separating the thermal and epithermal regions. The
th
)( 0INRRR eththepith ⋅Φ+⋅Φ⋅=+= σ 4.2.2.
s the resonance integral (cross-
ection in epithermal region) for the 1/E epithermal spectrum.
factor . Subsequent to the irradiation the nuclide decays exponentially. The decay
where Φth is the conventional thermal neutron flux, σth is the effective thermal neutron cross-
section, Φe is the conventional epithermal neutron flux, and I0 i
s
The activity (A) is time dependent. During irradiation the activity of the produced
radioactive nuclide grows according to a saturation characteristic, governed by a saturation
1 iteS λ−−=
factor is dteD λ−= .
DSINA ethth ⋅⋅⋅Φ+⋅Φ⋅= )( 0σ 4.2.3.
here t is the irradiation time and t is the decay time.
activity. The measured
arameter is the total peak area (Np) at a particular energy, given by:
w i d
The intensity of the measured gamma line is proportional to the
p
mp tfAN ⋅⋅⋅= γγ ε 4.2.4.
19

Principles of NAA
where εγ is the efficiency of a semiconductor detector (depends on gamma-energy), fγ is the
mission probability of a gamma photon at a given energy, and tm is the measuring time.
he unknown mass (mx) of element x can be expressed as follows:
e
T
mx = meththiAv
p
fN
MN
⋅
⋅
tDSIfx
⋅⋅⋅Φ+⋅Φ⋅⋅⋅ )( 0σεγγ
4.2.5.
here NAv is the Avogadro number, fi is the isotopic abundance and m is the mass of the
radiated element.
Absolu
n from literature, especially those on decay schemes and activation cross-
ections can sometimes be significant, comparative analysis with a standard sample is much
ften performed.
Classic
, followed by the measurement of the ratio of counts Npx / Npst . If the conditions for
oth irradiation and counting are identical, the ratio of masses mx / mst equals to the ratio of
w
ir
4.3. Standardization
te method
Equation 4.2.5. provides the basis for quantitative activation analysis. The unknown
mass can be determined if all other parameters are accurately known. By determining the
neutron flux and measuring the absolute gamma-ray activity, a direct calculation of
concentration can be done by applying the necessary nuclear constants. As uncertainties of
nuclear data take
s
o
relative method
A relative standardization can be performed by the simultaneous irradiation of the
sample with standards of known quantities of elements in question in identical reactor
positions
b
counts:
20
Principles of NAA
mx = mst stpN ,
4.3.1.
The accuracy of the relative standardization method depends on the standard
preparation pr
xpN ,
ocedure. The use of mono-elemental standards results in time consuming
easuring processes, but there are multi-elemental certified reference materials for different
ample types.
Single
f an experimentally determined composite nuclear constant k-factor.
As this
determination of the k-factors by
irradiating known quantities of the elements concerned together with the known quantity of
m
s
comparator method
This technique is based on the co-irradiation of the sample and of a neutron fluence
rate monitor and the use o
method has been used during this work, its description is more detailed here than for
the previous procedures.
The method has two phases, the first is the
the selected comparator element. k-factors are defined as
k = *spI
4.3.2.
I
spI
sp = N
mCDSp
⋅⋅⋅ and C =
λ
λ mte−−1 4.3.3.
here C is the counting factor which considers the decay during the time of the measurement
e parator. Theoreticall
equation:
k
w
(tm ) and the * refers to th com y the k-factors are calculated from the
= )()(
*0
****0
*
QfffMQfffM
thi
thi
+⋅⋅⋅⋅
+⋅⋅⋅⋅
γγ
γγ
εσεσ
4.3.4.
where e
thfΦΦ
= and th
IQ
σ0
0 =
21
Principles of NAA
This means that the k-factor depends on the thermal/epithermal neutronflux-ratio of
the irradiation position and on the efficiency curve (ε(E)) of the detector, that is they are valid
irradiation and measurement conditions. Valu -
factors are stored in a library.
ical phase, samples are irradiated together with the chosen comparator
lement (in most cases Au is used), and the mass of the element concerned is calculated by:
only under well-defined es of the defined k
In the analyt
e
m = *spIk
I cor
⋅ 4.3.5. and
CDSN
I pcor ⋅⋅
= 4.3.6.
k standardization 0
0 s
independent of the irradiation and measuring conditions. k0 factors are calculated according to
DeCorte (1987) defined the k -factors as a composite nuclear constant which i
the following equation:
***
*
0thi
thi
ffMffM
kσσ
γ
γ
⋅⋅⋅
⋅⋅⋅= 4.3.7.
The literature values can be checked by determining the k0-factors through measuring
the specific intensities, if the Φth / Φe ratio and the efficiency curve of the detector is known:
)()( *
0*
*0 QfQf
II
k sp
+⋅
+⋅⋅= γ
εε
0sp γ
4.3.8.
Using the commercially available k0 computer program the standardization procedure
plified. The program makes possible to avoid systematic errors during
the standardization procedure, like e.g. the gamma-attenuation effect, the changes of
ects, and epithermal flux deviations. This
method is a very promising contribution of NAA development.
can be avoided or sim
measuring geometry, the true-coincidence eff
22

Principles of NAA
4.4. Measurement and evaluation
Gamma-spectrometry systems are used to process the induced radiation of the
different nuclides produced in activated samples.
Gamma measuring systems are based on high-purity germanium semiconductor
detectors. The most important characteristics of the detector are its efficiency and resolution.
The detector is connected to a multi-channel analyser (MCA) by an appropriate electronic
system (preamplifier, spectroscopy amplifier, analogue-digital converter). MCAs are
computer based systems with the ability of spectrum evaluation. There are data acquisition
software for calculating the energies and the areas of the total energy peaks, enabling the
calculations of qualitative and quantitative characteristics of the nuclides.
23

Performance capabilities of NAA method
5. Performance capabilities of the INAA method ensuring privileged position among analytical techniques for provenance studies
Referring back to Chapter 2.2.2., outlining the requirements of analytical methods to
fulfil provenance objectives, the following conclusions can be drawn:
1. In order to take advantage of the differences resulting from different geological
layouts, it is logical that as wide an elemental range as possible should be measured,
encompassing great diversity in chemical properties.
Almost all elements subjected to neutron irradiation have a given probability of
interacting with neutrons, and at least one of the isotopes will be partially converted to a
radioactive form. By optimized irradiation and counting procedures about 30-35 elements can
be determined by INAA.
Nuclear reactions are independent of the chemical form of an element and their
chemical environment. Reaction probabilities (i.e. cross-sections) are functions only of the
energy of the bombarding neutrons and the characteristics of the nuclei. As a result, there are
no preferred chemical properties, all groups of elements of the Periodic Table are represented.
2. As trace element distribution of chemical pastes is site specific (see 2.2.1.), the
analytical method must be sensitive for their determination.
INAA does not measure all elements with equal sensitivity. Cross-section, isotope
abundance, half-life, emission probability of the given nuclide are the nuclear characteristics
determining sensitivity, but the measuring technique can influence it, too. INAA using
thermal neutrons can determine two thirds of the elements of the Periodic Table with
sensitivities at the ppm level or below, and these are mostly trace elements.
The method is not suitable however for some light elements. Concerning major
components of clayey materials, some either do not activate at all (e.g. O), they do poorly
(e.g. Fe), they have short-lived radionuclides which decay rapidly (e.g. Mg, Ca, Cl), or there
are interfering activation reactions making determinations difficult (e.g. Si, Al).
24

Performance capabilities of NAA method
3. In order to get a statistically meaningful data-set, analyses should be carried out in
series of samples.
The method is chemically non-destructive, samples do not have to undergo any
chemical treatment, neither prior, nor after activation, sample preparation involves only the
handling of representative samples, powdering, mass determination and packing. Phases of
analysis can be fully, or partly automated, so there are no laborious or time-consuming
processes. Standardization is potentially easy and accurate. Contamination hazard is easily
avoided by careful sample treatment.
Standardization is potentially easy and accurate.
Also objectivity is provided by the exploitation of automation, the risk of systematic as
well as random errors is reduced.
Summarizing the abovementioned points, it can be stated that INAA lends itself to a
successful provenance study by having different advantages inherent to the underlying
physical principle of the method.
25
Analytical research and developments
6. Analytical research and development
INAA technique is considered to be “mature”. The emphasis in this research program
has been shifted towards strategic developments and applied research (Bode 1996), to make
the existing knowledge on the technique available for utilization and to demonstrate its full
potential.
To go beyond the trivial level of applying INAA technique to archaeological ceramics,
laboratories have to develop and optimize the method, tailoring it to the special technical and
practical resources.
6.1. “Strategic” developments
Specific demands set by the task have been considered, theoretical and practical
aspects of resource implementation were studied as well.
The research reactor at our disposal is a low-flux reactor, with several irradiation
possibilities, characterized by different spectral variations of the neutron-flux. The
determination of the thermal neutron-flux, the Cd-ratio and the thermal/epithermal flux-ratio
has been performed by different methods through the years. Based on these data irradiation
channels with the highest thermal neutron-flux were chosen (G4 and G6 positions, see Fig.2.)
and the spatial and spectral variations of the neutron-flux in these positions has been
investigated. The optimal size of the irradiation vials, the number of samples, monitors and
standards per batches were defined.
Provenance studies require multi-elemental data of big sample sets, so standardization
must be simple, but accurate. Single comparator method has been chosen as standardizing
procedure, and proved to be appropriate for the accurate quantification of major, minor and
trace elements in pottery samples. By independent experiments k-factors for the most
important (n,γ) reactions and γ-ray energies of the resulting isotopes were determined. (Table
1.)
26

Analytical research and developments
In the attempt to optimize the analysis of pottery, one of the primary questions was to
decide which elements provide the most important information for chemical discrimination of
ceramic materials. The diversity of the parent rocks and the complexity of geochemical
fractionations in the formation of clay beds result in specific distribution patterns of elements
in different sources of pottery clay. The fingerprinting process is usually not concerned with
any specific elements, but rather with an array, providing a pattern, which varies in a sensitive
manner. This sensitivity is provided by the trace elements (see 2.2.1.), their great variability
assumes more certain separation. To demonstrate this, in Table 2. trace element data of some
clay minerals from different regions of Hungary are presented.
Results showed that the kaolinites of the same structure but different genetics and
occurrence point to a wide diversity in respect of their trace-element composition. The
difference in the elemental concentrations sometimes can be greater than concerning two
structurally different clay minerals, e.g. illite and kaolinite. It is remarkable, that the trace-
element distribution of kaolinites from Szegi and Mád differ considerably, although they were
formed by the same rock-forming process, deposited geographically not far from each other.
Archaeological ceramics of different dates, pastes and fabrics have been analyzed in
great number, too, to get information on their trace-element composition.
To define the final set of elements to be determined in pottery samples, some specific
features of the nuclear measuring technique have also been considered. To ensure the lowest
detection limit and measuring uncertainty, the radioisotope, i.e. the gamma line of it which
yielded the greatest peak/background ratio free of spectral disturbance was chosen. These
conditions are significantly influenced by the choice of irradiation-, cooling and measuring
times, and measuring geometry, so care was taken to set the timing protocols and to fix the
counting geometry.
Different sampling techniques has been tested, and was found, that grinding by a
diamond-coated drill bit provides uncontaminated powder samples of appropriate particle
sizes. The amount of sample taken has to balance between limiting the damage to the
ceramics and the accurate and precise determination of a large number of elements.
On different ceramic types homogeneity studies were performed, to check, whether a
simple sample of about 50 mg can be considered representative for a whole vessel. Although
it proved to be true for fine wares (see Table 3.), a test is recommended for each pottery type
when starting a project.
27

Analytical research and developments
6.2. Applied research
The implementation of the method, fitted by these experiments to the special
characteristics of the laboratory’s resources resulted in successful contributions in many
archaeological studies (Balla 1998, 1999).
The characteristic feature of radioanalytical work, i.e. sophisticated techniques on
special samples presumes a research oriented activity, with a dynamic method-development
and a constant improvement of effectiveness and reliability. A kind of quality culture has
always been involved in this field.
However, in the early 90s, by the appearance of ISO standards it was soon realized,
that there is a need and responsibility to implement a quality control and quality assurance
system, according to the guidelines and norms of an international standard.
Accreditation requires a transparent, high-level, and thoroughly documented analytical
activity, and decrees, that for non-standard test methods procedures should be developed,
containing full description of the given analytical process, with clear specifications of the
samples, standards, and equipment. The so-called standard operation procedure should cover
uncertainty budget estimation and should give criteria for approval or rejection.
During the accreditation process, procedures, instructions, forms (PIF) have been
defined for all the relevant equipment and the Standard Operation Procedure (SOP) for INAA
of Archaeological Ceramics has been prepared.
6.3. Operational activities
Performing these research tasks involves operational activities, to support
investigations and management work, so as to improve the performance and traceability of the
laboratory’s activity.
A five-year work of improvement, fulfilling scientific, technical and management
requirements, demonstrating the quality of work and crediting the methods, led to the
accreditation of the Radiochemistry Laboratory according to ISO/IEC 17025 International
Standard.
28

Standard Operation Procedure for NAA of Archaelogical Ceramics
7. Standard Operation Procedure for INAA of Archaeological Ceramics
This procedure, resulting from the strategic and applied research, which was supported
by operational activities, comprises the analytical protocol, the estimation of uncertainty
budget of pottery analysis and the validation of the method in Quality Control/Quality
Assurance system.
7.1. Analytical protocol
A detailed description of the procedure covers all phases of the analyses, and directs as
follows:
Sampling and sample preparation
Sampling is done by the use of a diamond drill-bit, on a freshly-cleaned surface of the
pottery, where no glaze or other type of finishing material is found. The sample should weigh
about 50-100 mg, if there is no constrain. In certain cases the sample may not be
representative, but it is determined by availability.
Powder samples then are fired in a furnace, for one hour duration, on 600 0C, so as to
get rid of moisture, organic materials, and to ensure identical starting conditions for all
samples. After cooling, samples are weighed into polyethylene irradiation capsules.
Gold is used as comparator element, and zirconium foils serve as flux-monitors. Three
pieces of 0.1%Au-Al alloy disc of 5mm diameter and two pure zirconium foils of the same
size are weighed, too, and packed together with fifteen ceramic samples and one sample of
reference material(RM) into one batch. RM type and analyte concentration range have to be
chosen as similar as possible to those of the samples. From our laboratory’s resources for
ceramics NBS SRM 1633a Coal Fly Ash, or GWB 07313 Marine Sediment are the most
appropriate.
29

Standard Operation Procedure for NAA of Archaelogical Ceramics
Irradiation
Irradiations should be done
using either the G4 or the G6
vertical irradiation channels (Fig.
2.), with maximal 100 kW reactor
power, for eight hours. Irradiation
capsules are opened after a
cooling-time of five-six days.
Measurements
γ-spectrometric
measurements are performed on
one of the two gamma-
spectrometers of the Laboratory.
Each has a HPGe semiconductor
detector, connected through
appropriate nuclear electronic
devices to multichannel analyzers.
Measuring system specifications
are as follows: Figure 2. Horizontal cross section of the core of the nuclear reactor at the Institute of Nuclear Techniques
Gamma-spectrometer #1
Detector: HPGe-Well GCW 2022 Canberra, with a 2002CSL preamplifier
FWHM: 1.95 keV (1332 keV)
Rel.efficiency: 20.5%
HV Supply: NB-850 KT(ATOMKI) 5kV
Spectroscopic amplifier: 2020 Canberra
ADC: 8075 Canberra
MCA: S-100 Canberra, 2x8k
Software: SAMPO-90
30

Standard Operation Procedure for NAA of Archaelogical Ceramics
Gamma-spectrometer #2
TOP
1.90 keV (1332 keV)
EC
anberra
lanned and documented quality control measurements are performed by both
equipm
nce the irradiation capsule is opened, samples and metal foils are unpacked. The first
measur
alculations
y the evaluation of Zr and Au spectra, corrected specific intensities are calculated,
and the
ed in Table 4.:
able 4. Nuclear data of Au and Zr isotopes
Eγ(k
Detector: HPGe POP
FWHM:
Rel.efficiency: 23%
HV Supply: NB-850 KT(ATOMKI)
Spectroscopic amplifier: 572 ORT
ADC: ND 579 Canberra
MCA: ACCUSPEC-B 8k C
Software: SAMPO-90
P
ent, control charts of resolution and efficiency values are recorded, action levels are
defined. The analyst has to be sure that γ-spectroscopic measurements are carried out using
equipment that is within specification, working correctly and adequately calibrated.
O
ements after 5-6 days-long cooling time are performed on the zirconium foils, then the
samples are counted for 5-8000 seconds each. An automatic sample changer ensures identical
measuring geometry not only for all samples but also for the comparators. A second
measurement after about one month is performed, the measuring geometry is kept unchanged.
C
B
thermal/epithermal flux-ratio is determined as well.
The most important nuclear data of Au and Zr are list
T
Isotope eV) T1/2 (s) Q0
198Au 411 232934 15,71 95 Zr 724 5532192 5,05 97Zr 743 60264 248,00
743 60264
31

Standard Operation Procedure for NAA of Archaelogical Ceramics
According to Eq. 4.3. -facto depends on the thermal per epithermal ratio of the
irradiation position and on the efficiency curve of the detector. Using nuclides with different
I /σ va
4. the k r
0 0 lues (i.e. Zr) the flux ratio is controlled, and reference k-factors (kref), taken from the
library, are converted to an analytical (an) channel where the actual irradiation is performed:
)()()()(
00 refan*
00
QfQfkk refan
refan +⋅+⋅= 6.1.1.
*QfQf +⋅+
The evaluation of the saved sample-spectra is performed by SAMPO-90 software.
Peak identification by gamma-energies, and peak area determination by fitting an analytical
function to the peak is done interactively.
Using the k-factor library and the actual spectral parameters, calculation codes give
the elemental concentrations.
The set of elements determined through these processes are as follows:
As, Ba, Ca, Ce, Co, Cs, Cr, Eu, Fe, Hf, K, La, Lu, Na, Nd, Rb, Sb, Sc, Sm, Ta, Tb,
Th, U, Yb, Zn
Acceptance criteria
Results of analyses can be accepted if
- deviation of specific intensities of Au foils is below 10%
bigger value, especially when tendency is noticed, indicates a bad positioning
of the irradiation vial in the reactor core
- concentrations calculated from the first, and the second run agree within measuring
uncertainties
which justifies the qualitative determination (half-life), the use of a consistent
measuring geometry, and correct calculations
- calculated concentrations for the analysed reference material pass the u-test for
each element, where
29.3)(/ 22 ≤−−= refmrefm uuccu
by which the accuracy of the measurements can be verified
32

Standard Operation Procedure for NAA of Archaelogical Ceramics
7.2. Estimation of uncertainty budget
The basic equation for the calculation of the concentration of the measurand, using
single comparator standardized INAA is
x
p
xxx
xp
spx
xspx
Ic =
kmCDS
N
CDSmIk1/ ****
*,
*, ⋅
⋅⋅⋅⋅⋅⋅=
⋅ 6.2.1.
etermined according to this equation,
based o
stimated, taking into account all recognised effects
influencing the results (Balla 2004).
inties due to sample preparation,
irradiation, gamma-ray spectrometry and standardization.
e the standard uncertainty of counting statistics is given by the gamma software SAMPO-
90.
N
Uncertainties of elemental concentrations are d
n the law of error propagation.
Although results, i.e. elemental concentration data, have never been sent out without
uncertainties, prior to the elaboration of this procedure uncertainty was not fully evaluated. In
most cases only counting statistics were given as measurement uncertainty. By now, a
combined standard uncertainty is e
INAA has unique sources of uncertainties which can be grouped according to the
individual steps of analysis into four categories: uncerta
Table 5. comprises and quantifies all investigated uncertainty components of INAA
and refers to uncertainties due to impurities of irradiation vials (Table 6.), varieties of sample
quantities (Table 7.), and the determinations of k-factors (Table 8. and 9.). There are
quantities (numerical values) ,which are estimated by statistical evaluation of measured data
(weighing, vial impurities, neutron-flux gradient, dead time effect, uncertainty of k-factors),
others taken from certificates (gold and zirconium foil concentration-purity- uncertainties ),
whil
33
Standard Operation Procedure for NAA of Archaelogical Ceramics
Evaluating uncertainty budget it could be concluded, that the main components are :
the uncertainty of net peak areas, k-factors, sample masses, dead-time correction, and
standard deviation of intensities of gold foils. The combined standard uncertainty is calculated
according to the law of propagation of uncertainties.
is the p
ference materials proved to be appropriate, as RM type and
nalyte concentration range made it possible. Interlaboratory comparisons were performed,
o, as it will be reported later.
he following performance parameters were examined:
ove 10
pm, correction is needed for Ce, La, Ba and Nd. If the cobalt content is below 1 ppm, the
ite-specific background cobalt activity of our laboratory has to be taken into account.
7.3. Method validation
To meet the requirements of the ISO/IEC 17025 Standard, the laboratory has to
validate its non-standard, laboratory developed methods, i.e. it should be proved, that it is fit
for the particular, intended use. Method validation, by definition (EURACHEM Guide, 1998),
rocess of establishing the performance characteristics and limitations of a method and
the identification of the influences which may change these characteristics and to what extent.
Of the possibilities offered by the Standard for the determination of the performance
of the method the analysis of re
a
to
T
Selectivity:
The ability of the method to determine accurately and specifically the given nuclide in
the presence of other components in a sample matrix is good, due to high resolution gamma-
spectrometry. The proper analytical gamma lines have to be chosen, spectral interferences
should be avoided. Selectivity is violated, if e.g. the concentration of uranium is ab
p
s
34
Standard Operation Procedure for NAA of Archaelogical Ceramics
D ion limit:
The detection limit dep ground and can be calculated
according to Currie’s equation:
etect
ends on actual gamma-back
BGD NL ⋅+= 29.371.2 where NBG is the background at
the given energy of the gamma-spectrum. Typical values for some elements are presented in
able 10.
ndependent of the
matrix) s ough:
amma self-absorption (e.g. determination of elements in lead)
- high dead-time
are available on
o detectors, results are controlled by measurements of reference materials.
b
with each batch of samples to check whether the results pass the accuracy
riteria, i.e.
T
Linearity:
Theoretical basis of NAA (the signal to concentration ratio is i
en ures linearity of the method, there are some exceptions th
- sample contains neutron absorber (e.g. boron, cadmium)
- in case of high g
Robustness:
The procedure is capable to remain unaffected by small, but deliberate variations in
method parameters. Intra laboratory studies were performed by measuring samples on both
gamma spectrometers. Results proved the reliability of the method. k-factors
tw
Accuracy:
Closeness of the agreement etween the results of a measurement and a true (accepted
reference) value of the measurand is characterized by u-test. Certified Reference Materials
are analysed
c
29.3)(/)( 22 ≤+−= refmmref uuccu 6.3.1.
Table 11. and Table 12. present the measured concentration data compared with reference
values for NBS SRM 1633a Coal Fly Ash and Perlman/Asaro Standard Pottery. As can be
seen, all results meet the acceptance criteria. It is stated in the SOP, that analytical results are
acceptable only if the concentration values of the reference sample pass the u-test, and with
no reasonable explanation to any discrepancy, the measurements have to be repeated.
35
Standard Operation Procedure for NAA of Archaelogical Ceramics
Pr on:
Results of successive measurements of GBW 07313 Marine Sediment Certified
Reference Material samples are given in Table 13. Five sam
ecisi
ples were analysed under
peatability conditions. Precision index was defined as follows:
re
25.0)/()/( 22 ≤+= mmrefref cucuP 6.3.2.
The standard deviation of the concentrations in all five measurements is lower than the
calculated uncertainties, precision index is lower than 25% for all elements, the results are
s the method
suitable for providing accurate analytical data for ceramic provenance studies.
7.3.1. atory comparison and Proficiency Testing
terlaboratory
comparisons or proficiency programs. Examples for both are presented below.
(INCT-TL-1) and Mixed Polish herbs (INCT-MPH-2) were to be determined.
acceptable.
Summarizing the validation process, by taking all the investigated method performance
characteristics into account it can be stated that the INAA method, developed in the
laboratory fits for the intended use. By ascertaining a stable statistical control over the
necessary equipment, working according to well-documented standard procedure
is
Interlabor
For monitoring the validity of the analyses, to detect possible trends, or reveal reasons
for failures there are quality control procedures, like participation in in
An interlaboratory comparison was organized by the Institute of Nuclear Chemistry
and Technology, Warszawa, Poland with the intended goal of “Checking the accuracy of
analytical work of the laboratories engaged in the determination of trace elements”, and the
laboratory was invited to participate. Chemical profile of two plant samples, Tea leaves
Elemental data in qualitative sense were compatible with our prospectus, concerning
quantitative determinations, in many cases analyses were performed near detection limit
36

Standard Operation Procedure for NAA of Archaelogical Ceramics
levels. In spite of this, for both materials the results passed the accuracy and precision criteria,
too, see Table 14. and Table 15.
es. Dust
materials on air filter samples originating from Vienna and Prague were subjected to INAA
analyses. Evaluation of the reported results is summarized in Table 16. and Table 17.
.3.2. Intercalibration of laboratories
cerami
ndard
Pottery
dards are used, based on the same primary standard, the uncertainty
compo
Participation in the Proficiency Test NAT-7, organized by the International Atomic
Energy Agency offered another challenge to control the method’s overall performanc
7
This kind of quality control activity has to be extended over a very important aspect of
c provenancing. During years, large amount of data have been accumulated in
laboratory’s data banks. Exchanging results and comparing data turned to be an actual need.
Achieving interlaboratory comparability requires a collaboration either in the analysis
of a common reference material, or in characterizing one another’s standards. As was shown
above, for method validation, among others, elemental data of the Perlman/Asaro Sta
was used. This reference material was widely used for several years in INAA
laboratories dedicated to pottery provenance studies, but now it is on very short supply.
When starting the Qumran pottery project, the first step aimed to investigate the extent
to which the data, generated during years, in the Archaeometry Unit of the Hebrew University
of Jerusalem could be compared with our results. The HU Laboratory used the P/A Pottery for
standardization, and we in the Radiochemistry Laboratory have used this reference material as
quality control material. When different laboratories are calibrated against the same primary
standards, the uncertainties in the reference values do not affect comparability. When
secondary stan
nents of this standard have to be considered in addition to the precision of the
measurement.
Validation proved the accuracy and precision of the analytical data obtained by us for
the P/A Pottery Standard. Samples of some clay samples (Motza 2) and also ceramics were
37

Standard Operation Procedure for NAA of Archaelogical Ceramics
re-analysed in our laboratory, to assess the quality of the results in the sense of comparability.
The results indicated that the measured elemental concentrations, except for some outliers
a), are in good agreement, and with the necessary precautions, the exchange of pottery data
possible. Results are summarised in Table 18.
(N
is
38

Statistical evaluation of elemental data
8. Statistical evaluation of elemental data
Provenance studies generally aim to investigate the distribution of ceramic vessels in a
spatial dimension, make distinction between local and non-local products, try to find evidence
for production centres, and for the movements of goods or people. While elemental
concentrations, with their determinable degree of analytical precision have an inherent
objectivity, the incorporation of chemical data into a social, political or economic model is of
highly inferential nature. The bridge between analyses and interpretation is provided by
various statistical methods.
A considerable amount of analytical information can be obtained from elemental
concentrations and measuring uncertainties. There are different attempts to apply numerical
procedures to achieve partitioning of the data sets. Simple methods, such as bivariate scatter
plots and various pattern-recognition techniques are widely used, the well-quantified data-
matrices lend themselves to multivariate statistics.
There are several approaches, models and algorithms of multivariate statistics. The
primary point of view when choosing a procedure is that data processing should model the
questions arising from archaeological investigations and the results should directly answer the
questions.
In provenance studies elemental abundances are either used (1) to form statistically
meaningful compositional groups, or (2) to assign samples of unknown provenience to well-
defined existing groups. Samples to be treated are placed in a multidimensional space where
dimensionality is determined by the number of calculated concentrations. The samples lie
with varying point densities in this space. Problems are generally viewed in terms of
“distance” between different groups, groups and individual samples, or just among
individuals.
Data processing usually starts with a search for some kind of a structure, to define
statistically meaningful groups of chemically similar samples in the data set. The most widely
used, so-called “structure-imposing” (Bishop 2003) statistical methods for subdivision of
samples into groups are Cluster Analysis and Principal Component Analysis.
39
Statistical evaluation of elemental data
Cluster Analysis is designed to the classification of samples into more or less
homogeneous groups, in a way, that the relation between groups is also revealed. Clustering
process needs the definition of a measure of (dis)similarity, and an algorithm for defining
groups. As a measure of dissimilarity Euclidean distance, or its square, weighted Euclidean
distance, or Mahalanobis distance are the most used. Samples with the highest mutual
similarity are selected on the computed values, after which calculations are continued
according to hierarchical agglomerative algorithms, such as average-linkage method, Ward’s
method, or partitioning method. Calculations proceed until all samples are involved in one of
the clusters. The result is usually presented in the form of a dendrogram, characterizing and
illustrating the similarity relation of samples.
As elemental abundances are in most cases highly correlated, it is better to transform
the original data to uncorrelated components. The method working on this basis is Principal
Component Analysis.
Principal Component Analysis converts the original variables (i.e. elemental
concentrations) into new variables (principal components) that are linear combinations of the
originals. After this linear transformation similarity can be calculated by Euclidean distances.
At the same time the dimension of the problem is also reduced. The subspace of the first few
principal components, containing most of the variance, can be used to represent the structure
of the data set. Results can be presented in two-dimensional plots, where data-points are
projected into the plane of the first two principal components.
Another grouping method for elemental data is suggested by Beier and Mommsen
(1994) which surpasses the difficulties in Cluster Analysis and Principal Component
Analysis. As similarity measure between patterns a “modified Mahalanobis’ distance” based
on statistics is defined. It includes the consideration of elemental concentrations and
measuring uncertainties and a possible constant shift of the data caused by measurement
uncertainties or by dilution of the samples during manufacturing.
Once a structure has been identified in the data set, the subsets (groups) need further
investigation. Single-group, and/or between-group “structure-revealing” evaluative
procedures are needed to define the cohesiveness of a group and the “goodness” of separation
of the different chemical groups. For checking group cohesiveness the estimation of group
40

Statistical evaluation of elemental data
distribution parameters (mean and covariance matrix) are studied, by selecting the confidence
level.
As group separation approach, Discriminant Analysis can be applied. This
method also works with the uncorrelated linear combinations of the original variables (linear
discriminants) that reflect group differences as much as possible.
Several tests of significance are useful in conjunction with a discriminant function
analysis. In particular the T2 test can be used to test a significant difference between the mean
values for any pair of groups.
The structure of the data set usually reveals outliers as well, samples which cannot be
assigned to any of the subsets. The investigation of outliers can be performed e.g. by
Hotelling’s T2 test, with previously determined confidence level. χ2 test is also applicable.
Leaving out the outliers group distribution parameters are usually recalculated.
The separation of groups and the definition of outliers is followed by assigning
unknown samples to well-defined existing groups. One of the methods used for this kind of
problem is Discriminant Analysis mentioned above, another approach is based on
Mahalanobis distances.
The Mahalanobis distances of individual samples to previously defined group
centroids can be calculated, and each sample can be allocated to the group that it is closest to.
Significance tests can be also successfully applied for defining group membership
probabilities.
There are several further approaches and new methodologies of multivariate statistics,
like e.g. the Bayesian statistics (Buck 1966), which works on a model-based methodology,
where archaeological knowledge can be incorporated into statistical analysis. Model-based
clustering, classification trees, as well as neural networks offer future challenges in clearing
archaeological problems. A summary of statistical and computational methods used in
archaeology can be fined in Brothwell and Pollard (2001).
41
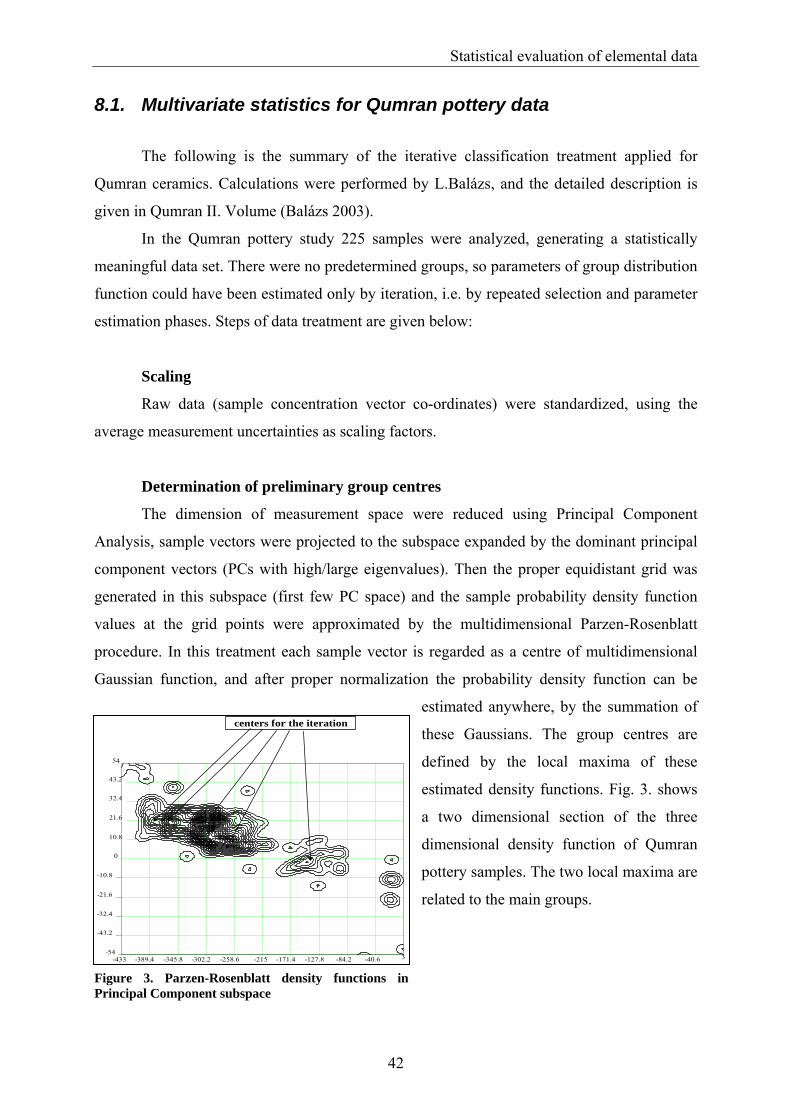
Statistical evaluation of elemental data
8.1. Multivariate statistics for Qumran pottery data
The following is the summary of the iterative classification treatment applied for
Qumran ceramics. Calculations were performed by L.Balázs, and the detailed description is
given in Qumran II. Volume (Balázs 2003).
In the Qumran pottery study 225 samples were analyzed, generating a statistically
meaningful data set. There were no predetermined groups, so parameters of group distribution
function could have been estimated only by iteration, i.e. by repeated selection and parameter
estimation phases. Steps of data treatment are given below:
Scaling
Raw data (sample concentration vector co-ordinates) were standardized, using the
average measurement uncertainties as scaling factors.
Determination of preliminary group centres
The dimension of measurement space were reduced using Principal Component
Analysis, sample vectors were projected to the subspace expanded by the dominant principal
component vectors (PCs with high/large eigenvalues). Then the proper equidistant grid was
generated in this subspace (first few PC space) and the sample probability density function
values at the grid points were approximated by the multidimensional Parzen-Rosenblatt
procedure. In this treatment each sample vector is regarded as a centre of multidimensional
Gaussian function, and after proper normalization the probability density function can be
estimated anywhere, by the summation of
these Gaussians. The group centres are
defined by the local maxima of these
estimated density functions. Fig. 3. shows
a two dimensional section of the three
dimensional density function of Qumran
pottery samples. The two local maxima are
related to the main groups.
-433 -389.4 -345.8 -302.2 -258.6 -215 -171.4 -127.8 -84.2 -40.6 3-54
-43.2
-32.4
-21.6
-10.8
0
10.8
21.6
32.4
43.2
54
centers for the iteration
Figure 3. Parzen-Rosenblatt density functions in Principal Component subspace
42

Statistical evaluation of elemental data
Preliminary group selection
In this step the group samples are selected around the preliminary centres, offering
further on the determination of group mean and covariance matrix as starting value of
iterations. Selection may be based on the Euclidean distance, proper statistical criteria cannot
be defined, only an arbitrary critical value. For the proper group selection the sequence of
critical values must be used, and the variation (trends and stability) of calculated group
parameters need to be analysed. The preliminary group boundaries are determined by given
critical levels regarding to the decrement of estimated density function from the local
maximum. For each preselected group mean vector and sample covariance matrix are
calculated.
Classification
Using the calculated group distribution functions, all sample points are classified by
the group conditional probability, or equivalently, by the related Mahalanobis distances.
Classification is performed on different confidence levels. By extending the confidence level
the number of group points increases, in the same time the outliers are filtered. The
subsequent estimation of group distribution parameters and selection of confidence level leads
to the convergence of the result.
The determination of group membership probabilities can be carried out by applying
the Hotelling’s T2 test to the Mahalanobis distances.
Although all these techniques offer empirical solutions, and can provide only
statistical probability of the provenance, statistics provides a powerful interpretative tool,
bridging the gap between chemistry and archaeology.
43
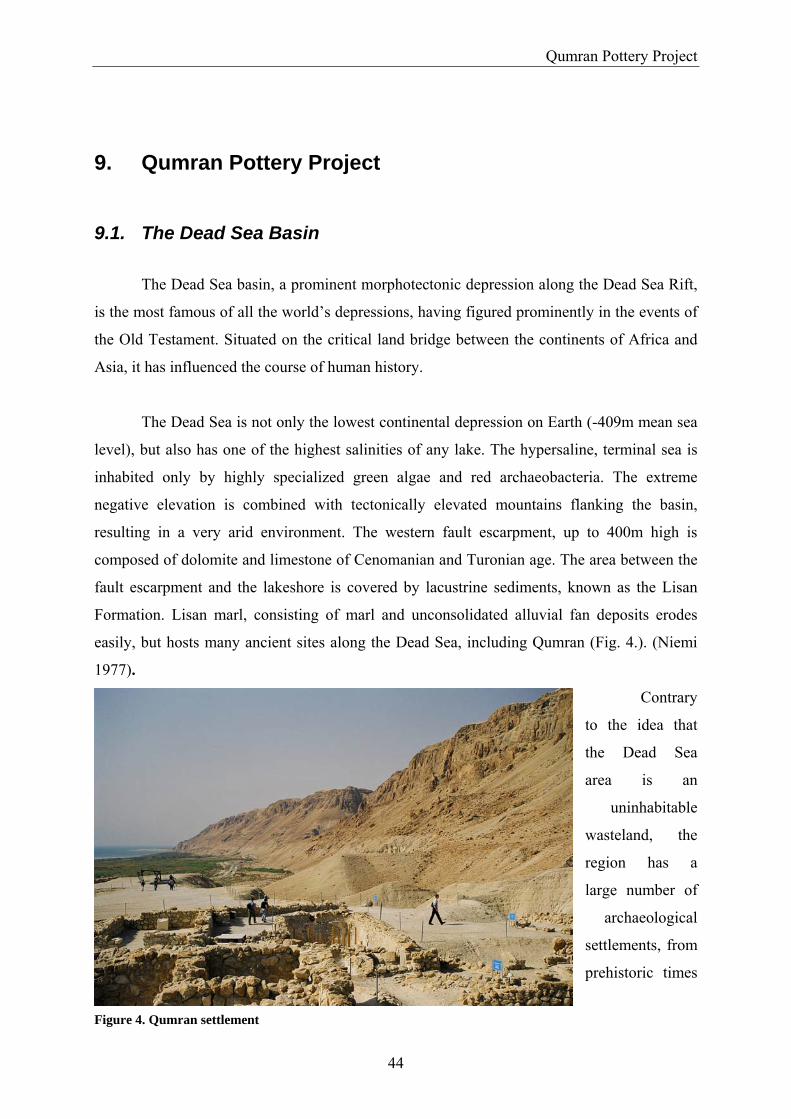
Qumran Pottery Project
9. Qumran Pottery Project
9.1. The Dead Sea Basin
The Dead Sea basin, a prominent morphotectonic depression along the Dead Sea Rift,
is the most famous of all the world’s depressions, having figured prominently in the events of
the Old Testament. Situated on the critical land bridge between the continents of Africa and
Asia, it has influenced the course of human history.
The Dead Sea is not only the lowest continental depression on Earth (-409m mean sea
level), but also has one of the highest salinities of any lake. The hypersaline, terminal sea is
inhabited only by highly specialized green algae and red archaeobacteria. The extreme
negative elevation is combined with tectonically elevated mountains flanking the basin,
resulting in a very arid environment. The western fault escarpment, up to 400m high is
composed of dolomite and limestone of Cenomanian and Turonian age. The area between the
fault escarpment and the lakeshore is covered by lacustrine sediments, known as the Lisan
Formation. Lisan marl, consisting of marl and unconsolidated alluvial fan deposits erodes
easily, but hosts many ancient sites along the Dead Sea, including Qumran (Fig. 4.). (Niemi
1977).
Contrary
to the idea that
the Dead Sea
area is an
uninhabitable
wasteland, the
region has a
large number of
archaeological
settlements, from
prehistoric times
Figure 4. Qumran settlement
44

Qumran Pottery Project
to later periods (Fig.5) The special terrain, deep wadis,
tory served as a
many caves and topographic havens
provided an ideal environment for
anyone seeking isolation, whether for
ideological reasons, or for escape
from enemy. Beside that, the natural
resources of the Dead Sea area, like
e.g. salt, asphalt, fruit crops and
freshwater, provided unique raw
materials needed in the ancient world
(Beit-Arieh 1997).
The area around Qumran
many times in his
place of refugee and hiding- for
people, treasure and documents. In a
cave at Nahal Mishmar, called “The
cave of the treasure” Chalcolitic
people hid a spectacular copper
treasure of about 400 finely worked
artefacts, including crowns, mace-heads, scepters and standards. Bar Kochba warriors of the
Second Jewish Revolt used the cave at Nahal Hever (Cave of Letters), leaving documents and
some of their wartime correspondence there. Human remains as well as documents of
Samaritan refugees were found in a cave in Wadi Daliyeh, north of Jericho. These examples
show, that it is not unusual to find documents hidden in caves in this arid environment.
Figure 5. Archaeological sites around the Dead Sea (Beit-Arieh 1997)
45

Qumran Pottery Project
9.2. Scroll discovery
The first scrolls, today known as
the Dead Sea Scrolls, were discovered in
1947, in Cave 1, North of Qumran
(Fig.6.). The seven scrolls, found by
Bedouins turned up for sale on the
antiquities market without
archaeological context, but their
authenticity was soon proved by Eleazar
Sukenik of the Hebrew University of
Jerusalem. He dated them to about the
time of Jesus, and he was the first to
suggest a connection with the Essenes.
The seven scrolls were: two copies of the
book of Isaiah, the Genesis Apocryphon,
the Habakkuk Commentary, the Hymn
Scroll, the War Scroll, and the Rule of
the Community. This latter one, but also
the War Scroll, the poetic work of the Thanksgiving Hymns, or the Commentary on
Habakkuk, are not biblical texts, but undoubtedly belonged to a certain community, and
provide information on their lives, beliefs and religious practices.
Figure 6. Cave 1 (Davies 2002)
9.3. Excavations in Qumran
In 1949 Roland de Vaux of the École Biblique et Archaéologique of Jerusalem and
Lankaster Harding, the chief inspector of antiquities in Jordan excavated Cave 1, and
surveyed the Qumran settlement and cemetery. At that time they had found no evidence for
the connection with the scrolls and the caves.
46

Qumran Pottery Project
In 1951 however, excavations were started in Qumran and de Vaux found a jar, similar
to those, found in Cave 1, dated by a nearby coin to ca.10 BC. It was also recognized that the
same types of pots and lamps that was found in Cave 1 were represented in the settlement.
Based on this, these pottery types were dated to the 1st century BC and 1st century AD.
The first season of excavations finished with the conclusion, that the people who lived at
Qumran deposited the scrolls in the cave.
de Vaux conducted excavations on the site for four further seasons, between 1953 and
1956. Based on his observations he distinguished several different periods of occupation and
assigned dates to them. The history of the settlement can be summarized as follows (de Vaux
1973):
The site was first
inhabited in the late Iron Age
(8th-7th century BC). A
rectangular building with a
row of rooms, a large round
cistern and a wall, running
southward belong to this
phase. This settlement was
destroyed in around 586 BC,
and was abandoned for quite
a long time. Under the reign
of John Hyrcanus (135-104
BC) a new population lived
there, but only for relatively
short period of time. The Iron
Age buildings were rebuilt,
rooms were constructed around the big cistern and two rectangular pools were dug. Two
potters’kilns in the south-east part
Figure 7. Plan of Khirbet Qumran (Gunneweg 2003)
(L66) were in use in this period.
The settlement acquired its definitive form, and became an impressive complex of
buildings during the reign of Alexander Jannaeus (103-76 BC).(Fig.7.)
47
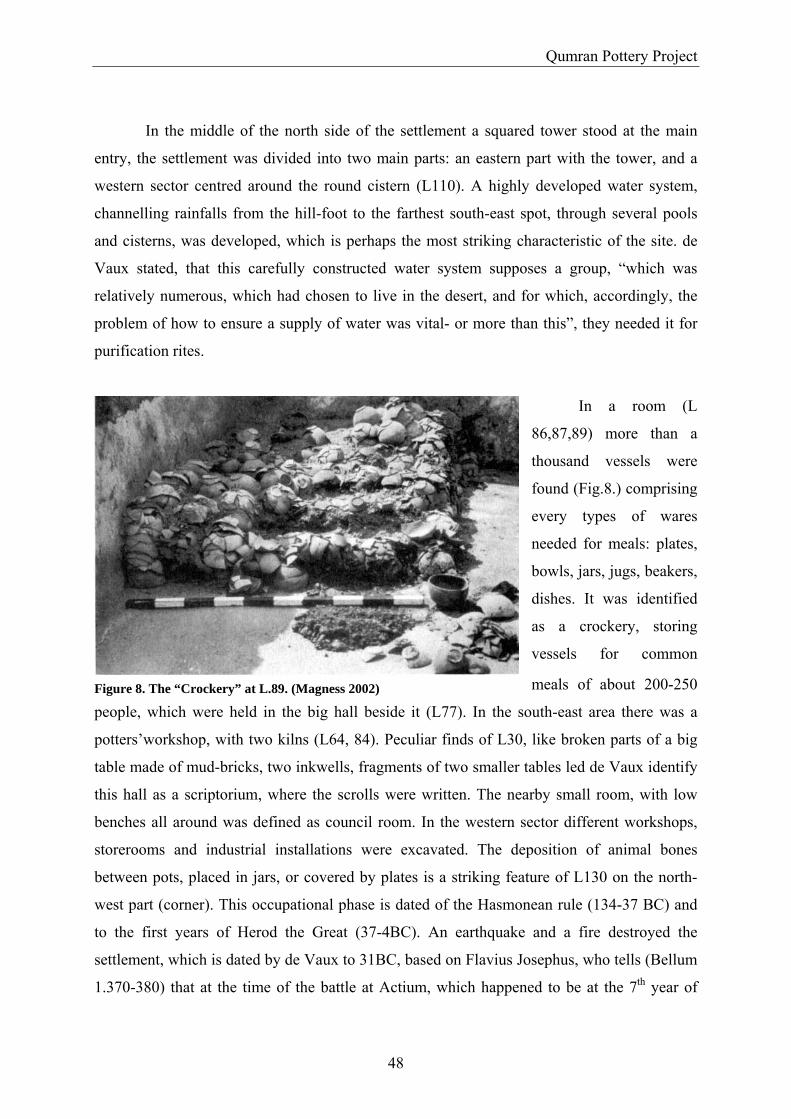
Qumran Pottery Project
In the middle of the north side of the settlement a squared tower stood at the main
entry, the settlement was divided into two main parts: an eastern part with the tower, and a
western sector centred around the round cistern (L110). A highly developed water system,
channelling rainfalls from the hill-foot to the farthest south-east spot, through several pools
and cisterns, was developed, which is perhaps the most striking characteristic of the site. de
Vaux stated, that this carefully constructed water system supposes a group, “which was
relatively numerous, which had chosen to live in the desert, and for which, accordingly, the
problem of how to ensure a supply of water was vital- or more than this”, they needed it for
purification rites.
In a room (L
86,87,89) more than a
thousand vessels were
found (Fig.8.) comprising
every types of wares
needed for meals: plates,
bowls, jars, jugs, beakers,
dishes. It was identified
as a crockery, storing
vessels for common
meals of about 200-250
people, which were held in the big hall beside it (L77). In the south-east area there was a
potters’workshop, with two kilns (L64, 84). Peculiar finds of L30, like broken parts of a big
table made of mud-bricks, two inkwells, fragments of two smaller tables led de Vaux identify
this hall as a scriptorium, where the scrolls were written. The nearby small room, with low
benches all around was defined as council room. In the western sector different workshops,
storerooms and industrial installations were excavated. The deposition of animal bones
between pots, placed in jars, or covered by plates is a striking feature of L130 on the north-
west part (corner). This occupational phase is dated of the Hasmonean rule (134-37 BC) and
to the first years of Herod the Great (37-4BC). An earthquake and a fire destroyed the
settlement, which is dated by de Vaux to 31BC, based on Flavius Josephus, who tells (Bellum
1.370-380) that at the time of the battle at Actium, which happened to be at the 7th year of
Figure 8. The “Crockery” at L.89. (Magness 2002)
48
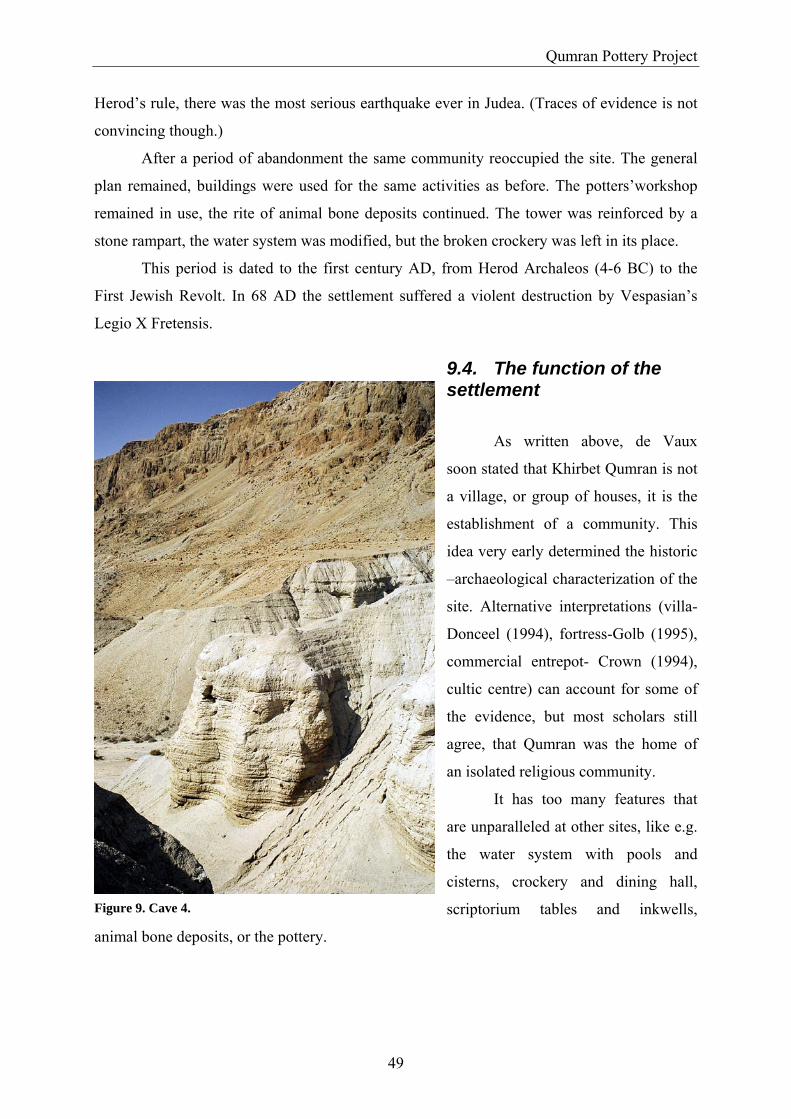
Qumran Pottery Project
Herod’s rule, there was the most serious earthquake ever in Judea. (Traces of evidence is not
convincing though.)
After a period of abandonment the same community reoccupied the site. The general
plan remained, buildings were used for the same activities as before. The potters’workshop
remained in use, the rite of animal bone deposits continued. The tower was reinforced by a
stone rampart, the water system was modified, but the broken crockery was left in its place.
This period is dated to the first century AD, from Herod Archaleos (4-6 BC) to the
First Jewish Revolt. In 68 AD the settlement suffered a violent destruction by Vespasian’s
Legio X Fretensis.
9.4. The function of the settlement
As written above, de Vaux
soon stated that Khirbet Qumran is not
a village, or group of houses, it is the
establishment of a community. This
idea very early determined the historic
–archaeological characterization of the
site. Alternative interpretations (villa-
Donceel (1994), fortress-Golb (1995),
commercial entrepot- Crown (1994),
cultic centre) can account for some of
the evidence, but most scholars still
agree, that Qumran was the home of
an isolated religious community.
It has too many features that
are unparalleled at other sites, like e.g.
the water system with pools and
cisterns, crockery and dining hall,
scriptorium tables and inkwells,
animal bone deposits, or the pottery.
Figure 9. Cave 4.
49

Qumran Pottery Project
Between 1951 and 1956 ten other caves hiding scrolls were discovered, among them
Cave 4, (Fig.9.) containing thousands of fragments, and Cave 11, with several complete
scrolls. Cave 4 and 5 are located within a stone-throw from the buildings of the settlement, so
the connection of the scrolls from the caves and the settlement was generally accepted. Scrolls
were found in association with potteries in almost all cases, the only exception is Cave 5,
where not a single shard of pottery was recognized.
Next to the site, about 50 meters to the east, there is a cemetery of about 1200 graves,
arranged in neat rows, most of them in the same orientation, with heads pointing south.
Tombs are marked by heaps of stones on the surface.
The magnitude of the cemetery and the careful arrangement of individual graves
suggest people of similar religious rite. Out of the 43 graves opened, four were identified as
women or children.
By 1955, all the seven scrolls of Cave 1 have been published. Based on paleography,
epigraphy and archaeology, it was determined that the scrolls can be dated to the last centuries
of the Second Temple era: 2nd century BC-1st century AD. Already in 1951(!) a piece of
textile, attached to one of the scrolls was subjected to C-14 dating, and later on eight scroll
fragments from different caves were analysed by Accelerator Mass Spectrometry, confirming
the previous dates.
9.5. The “Essene hypothesis”
1st century ancient authors, Flavius Josephus, Pliny the Elder, Philo of Alexandria all
have passages in their books about a Dead Sea community, the Essenes. Flavius Josephus in
Bellum 2.119-61 gives a long and detailed description of their ascetic life style, their religious
beliefs. Pliny’s Historia Naturalis (5.73) provides information about the location of the
settlement, writing that they live on the western shore of the Dead Sea, somewhere above the
town of En Gedi. He wrote, that the Essenes didn’t marry and lived in isolation, “with only
the palm trees for company”. Most of Philo’s information on the Essenes (Every Good Man is
Free 75-79) corresponds with that of Josephus’s, but it is less specific.
50
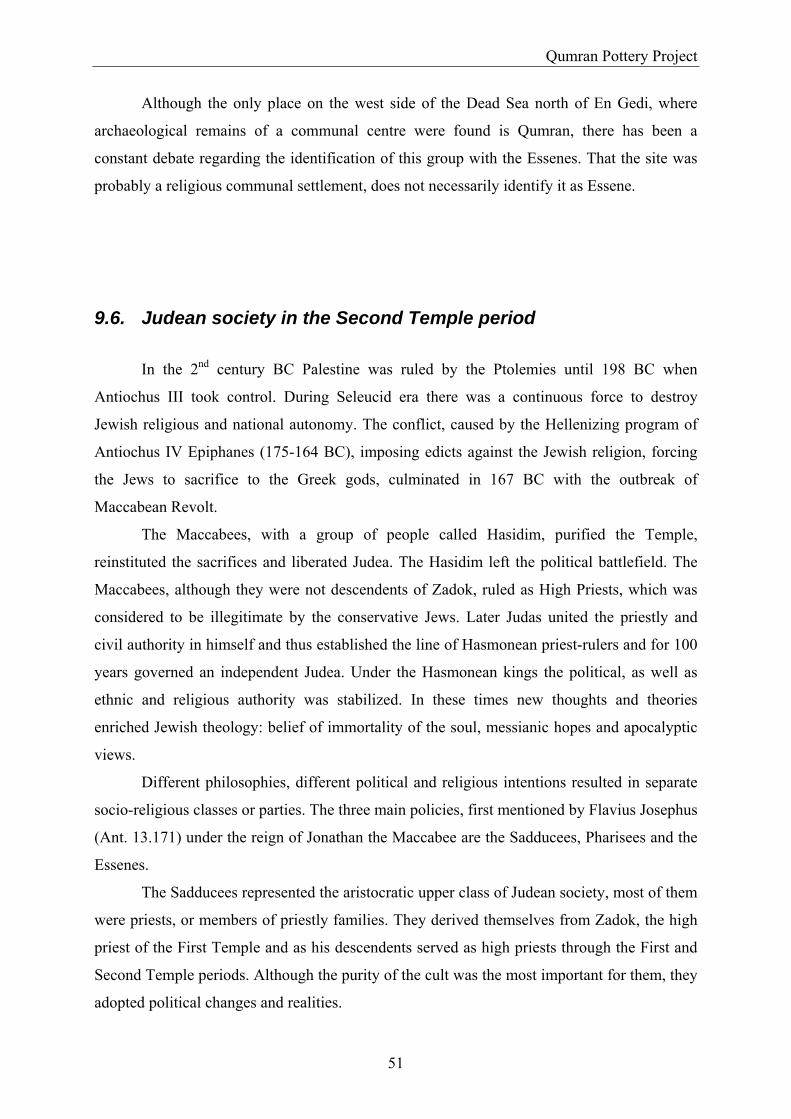
Qumran Pottery Project
Although the only place on the west side of the Dead Sea north of En Gedi, where
archaeological remains of a communal centre were found is Qumran, there has been a
constant debate regarding the identification of this group with the Essenes. That the site was
probably a religious communal settlement, does not necessarily identify it as Essene.
9.6. Judean society in the Second Temple period
In the 2nd century BC Palestine was ruled by the Ptolemies until 198 BC when
Antiochus III took control. During Seleucid era there was a continuous force to destroy
Jewish religious and national autonomy. The conflict, caused by the Hellenizing program of
Antiochus IV Epiphanes (175-164 BC), imposing edicts against the Jewish religion, forcing
the Jews to sacrifice to the Greek gods, culminated in 167 BC with the outbreak of
Maccabean Revolt.
The Maccabees, with a group of people called Hasidim, purified the Temple,
reinstituted the sacrifices and liberated Judea. The Hasidim left the political battlefield. The
Maccabees, although they were not descendents of Zadok, ruled as High Priests, which was
considered to be illegitimate by the conservative Jews. Later Judas united the priestly and
civil authority in himself and thus established the line of Hasmonean priest-rulers and for 100
years governed an independent Judea. Under the Hasmonean kings the political, as well as
ethnic and religious authority was stabilized. In these times new thoughts and theories
enriched Jewish theology: belief of immortality of the soul, messianic hopes and apocalyptic
views.
Different philosophies, different political and religious intentions resulted in separate
socio-religious classes or parties. The three main policies, first mentioned by Flavius Josephus
(Ant. 13.171) under the reign of Jonathan the Maccabee are the Sadducees, Pharisees and the
Essenes.
The Sadducees represented the aristocratic upper class of Judean society, most of them
were priests, or members of priestly families. They derived themselves from Zadok, the high
priest of the First Temple and as his descendents served as high priests through the First and
Second Temple periods. Although the purity of the cult was the most important for them, they
adopted political changes and realities.
51

Qumran Pottery Project
The Pharisees belonged mostly to the middle and lower classes of Judean society and
opposed the adoption of Hellenization. Pharisees are regarded as an attractive and powerful
faction, with an ascetic lifestyle, who could effectively control the state. They were the most
rigid defenders of the Jewish religion and traditions, and were very scrupulous in their
observance of Jewish law.
The third main religious group of the Jews of Second Temple Palestine was the sect of
the Essenes. The history of essenism goes back to the Hasidic movement of the 2nd century
BC. It is rooted in the conflict between the Wicked Priest and an unknown priest, the spiritual
leader of the community, the teacher of Righteousness. Surviving Hasidim became the
founding-members of the community. They were more ascetic and more esoteric than the
Sadducees or the Pharisees. One of the most striking characteristics of this group was their
communal life. Their ascetism, moral principles, apocalyptic outlook, eschatologic
philosophy and messianic hopes are mostly known to us from Josephus’ writings.
There were other smaller and less powerful factions, like the Zealots/Sicarii or the
early Christians, and the evolvement of all these groups marks a tendency of separation from
mainstream Judaism.
At 63 BC the rivalry between Hyrcanus II and Aristobulus II over the control of
Palestine brought about a civil war, which led to Roman intervention by Pompey. Different
administrative districts of Palestine were ruled and governed by Roman procurators or
governors.
The rule of the Hasmonean dynasty ended in 37 BC, when Herod the Great became
king of the Jews. Herod become the ruler with Roman help, and was a dependent client-king.
Nevertheless, his building projects, the development of economic resources, the establishment
of a sound bureaucracy undoubtedly enhanced the standing of the country. Many of his
projects won him the bitter hatred of orthodox Jews though. After his death in 4BC, the
kingdom was divided among his sons, Archeleaus, Philip and Antipas.
Roman control had grown more and more onerous. Rome took over the appointment
of the High Priest, proved unconcealed contempt for Judaism, and this in combination with a
financial exploitation brought about the Great Revolt of 66-70 AD, leading to one of the
greatest catastrophes in Jewish life, the destruction of the Temple.
The settlement of Qumran was destroyed by the Roman legions, while the loss of
Masada, defended by a group of Zealots in 73 BC marked the end of the rebellion.
The history of Qumran should be viewed in this historical background.
52

Qumran Pottery Project
9.7. The Dead Sea Scrolls
Classical sources and archaeology both are consistent with putting the Essenes to
Qumran and the “Essene hypothesis” can be corroborated by the scrolls themselves. The
scrolls are the only extensive contemporary documentation that we have, all other sources
being retrospective. This group of documents provides a detailed picture of a socio-religious
entity. It is a self-portrait, not a description by others. Although there are a few cases in which
historical figures (Shalomzion, Amaelius) are mentioned, they provide almost no information
on Jewish history proper.
The origin of the community is depicted by cryptic statements. The founder of the
community was the “Teacher of Righteousness”, who had to suffer persecution by the
“Wicked Priest” of the Jewish rulers. The teacher and his followers had to flee to the
wilderness to wait for the coming event: the victory of the Lord above the evil and dark, the
Sons of the Light above the Sons of Darkness. The conflict written in the scrolls is the conflict
between the head of the community and the political-religious Jewish ruler, Jonathan or
Simon Maccabee. (Vermes 1998)
The number of documents counts more than 800, with Cave 4 giving 555. Most part of
them is written in Hebrew, there is a smaller portion in Aramaic, and some of them are
written in Greek. Before their discovery, no Jewish documents written in Hebrew or Aramaic,
dated to pre-Christian time was known.
Among the scrolls, in complete or fragmentary form, all books of the Hebrew Bible
(except the book of Esther) can be found. Beside biblical literature apocryphals (e.g.
Ecclesiasticus), and pseudo-epigraphical texts (e.g. Jubilees, Henoch) are also represented.
Communal documents, probably written in Qumran by members of the community,
like rules, exegeses, religious poetry, liturgical texts stress the deliberate and selective policy
of isolation, pursuit for purity. The split with the Temple is embedded into calendrical
treatises, alighting the use of the solar calendar. The basic laws of communal life are written
in these texts, and although these group characteristics may be true for some other
contemporary Jewish groups, neither of the hypotheses identifying the Qumran community
53
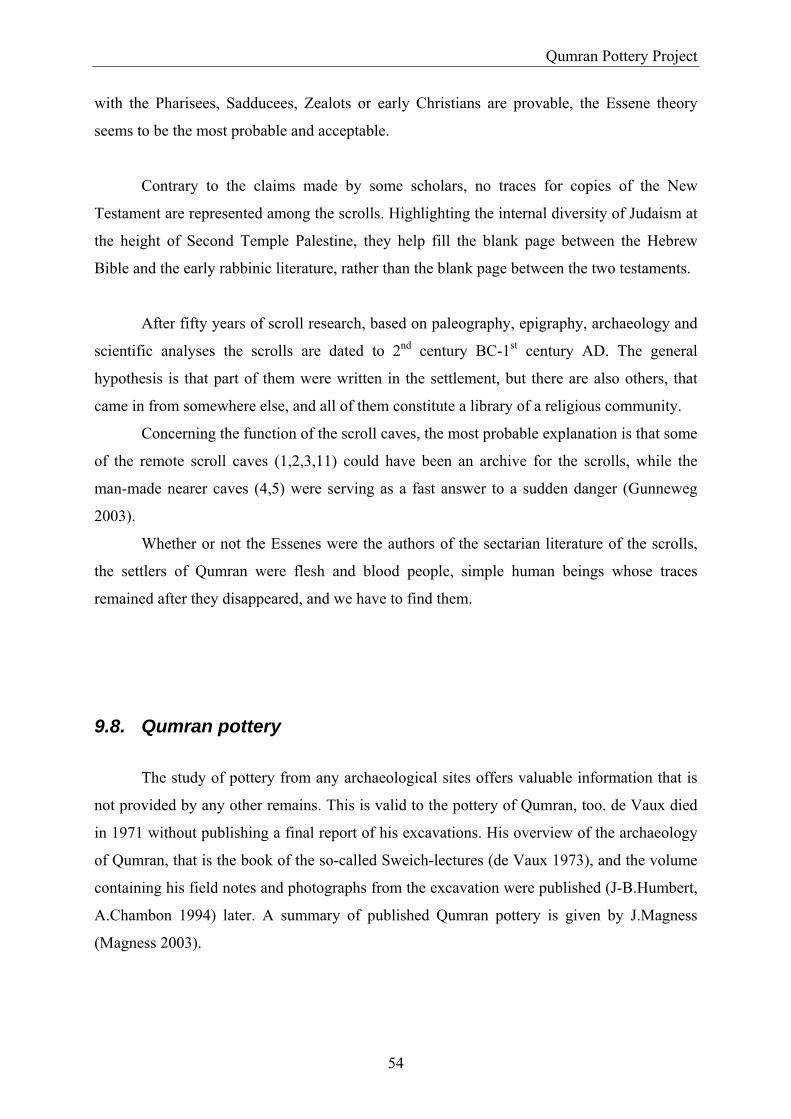
Qumran Pottery Project
with the Pharisees, Sadducees, Zealots or early Christians are provable, the Essene theory
seems to be the most probable and acceptable.
Contrary to the claims made by some scholars, no traces for copies of the New
Testament are represented among the scrolls. Highlighting the internal diversity of Judaism at
the height of Second Temple Palestine, they help fill the blank page between the Hebrew
Bible and the early rabbinic literature, rather than the blank page between the two testaments.
After fifty years of scroll research, based on paleography, epigraphy, archaeology and
scientific analyses the scrolls are dated to 2nd century BC-1st century AD. The general
hypothesis is that part of them were written in the settlement, but there are also others, that
came in from somewhere else, and all of them constitute a library of a religious community.
Concerning the function of the scroll caves, the most probable explanation is that some
of the remote scroll caves (1,2,3,11) could have been an archive for the scrolls, while the
man-made nearer caves (4,5) were serving as a fast answer to a sudden danger (Gunneweg
2003).
Whether or not the Essenes were the authors of the sectarian literature of the scrolls,
the settlers of Qumran were flesh and blood people, simple human beings whose traces
remained after they disappeared, and we have to find them.
9.8. Qumran pottery
The study of pottery from any archaeological sites offers valuable information that is
not provided by any other remains. This is valid to the pottery of Qumran, too. de Vaux died
in 1971 without publishing a final report of his excavations. His overview of the archaeology
of Qumran, that is the book of the so-called Sweich-lectures (de Vaux 1973), and the volume
containing his field notes and photographs from the excavation were published (J-B.Humbert,
A.Chambon 1994) later. A summary of published Qumran pottery is given by J.Magness
(Magness 2003).
54

Qumran Pottery Project
According to these, the ceramic types represented in Qumran include bowls, plates,
cups, jars, lids, jugs, juglets, kraters, flasks, cooking pots and oil lamps. The pottery from the
caves is identical with that of the settlement, the same fabrics and the same forms recur here.
The vessel types reflect the activities carried out on the place. The ceramic assemblage
shows important peculiarities, with respect to other archaeological sites of this period.
A number of pottery types represented at contemporary Judean sites are absent from
Qumran’s ceramic assemblage. No amphoras, Roman mold-made oil lamps, or Terra Sigillata
sherds were unearthed. The fine, thin-walled, painted Nabatean pottery is also absent.
The most distinctive type of pottery is undoubtedly the cylindrical jars, the so-called
scroll jars.
Cylindrical jars are common in
Qumran both in the caves and the
settlement, proving the organic connection
between them, but no other places outside
Qumran have this type of ceramic ware
(Fig. 10). According to the Bedouins,
scrolls wrapped in linen were stacked in
these pottery jars in the caves, but there
were quite some pieces in the settlement,
too, without any fragmentary piece of
parchment. In nearby caves which didn’t
contain scrolls, pottery sherds, including
scroll jars were also recognized.
Storing scrolls in jars was an ancient
practice, that is known to us from
Jeremiah, 32:14, where there is an advice,
that sealed and unsealed books and
purchase contracts are best placed in pottery containers if one wants to preserve them for a
long period of time.
Figure 10. Sroll jars at Qumran exhibition
The pseudepigraphical work of the Assumption of Moses (1:16-18) also refers to
storing scrolls in jars. Moses who is about to die, gives Joshua certain books of prophecies,
which Joshua is supposed to treat with cedar oil and store in jars in a place appointed by God.
55
Qumran Pottery Project
Ancient authors, like e.g. the Christian scholar Origen, the church historian Eusebius,
and later Timotheus I, the Nestorian patriarch of Seleucia mention biblical texts found in jars
near Jericho.
Whether or not the scrolls were stored in jars, they were manufactured to suit special
needs and they are undoubtedly site-specific. Lids are associated with them, some of them can
be attached with a string to pierced ledge handles on the shoulder of the jars. Lids are
common both in caves and the settlement.
Other types of jars, like ovoid jars, bag shaped jars are also common, but also these
represent a regional type (Magness 2002, p.101.).
The other unusual, but not without parallels, pottery type is represented by the
inkwells. Different sources give different numbers, but at least five inkwells made of
earthenware and one of bronze were found in the settlement.
All pottery is plain, undecorated, the vessels are made of well-levigated, light red, or
grey clay, often with a white slip on the surface. The presence of a potters’workshop
indicates, that at least part of the ceramic material was manufactured locally.
de Vaux stated that this workshop produced the large number of vessels discovered at
Khirbet Qumran, and that the monotony of pottery and its unique character at the same time
can be explained by the local manufacture.
If all the Qumran pottery was locally made we have a “hapax” settlement which had
no connection with its environment. This closeness of the community needs a thorough study
though, as with all groups of people during history, material remains of basic human relations
are always found. Where people have lived, one is bound to find its traces among the
population itself and those with others. If Qumran had relations with other sites, we have to
find these. Concerning pottery, in spite of de Vaux’s statement, there remains the uncertainty
which pottery is Qumranic for sure, which is dubious, and which has to be excluded as locally
made, and from where did it come instead. Scroll jars are of special interest, perhaps even part
of the scrolls can be traced by the provenience of the jars.
56

Chemical provenancing of Qumran pottery
10. Chemical provenancing of Qumran pottery
This pottery project, initiated by Jan Gunneweg of the Hebrew University started in
1998, in co-operation with Jean-Baptiste Humbert of the École Biblique et Archaeologique,
Jerusalem.
The main goals of the research were:
- to trace the Qumran pottery by its chemistry to their place(s) of manufacture
- to establish the relation between the pottery found in the Qumran settlement and
the surrounding caves
- to study what pottery was locally made and which was brought in from elsewhere
to learn the interregional trade between Qumran and its surroundings.
10.1. Sample selection The main objective in sample selection was to analyse a representative portion of the
original de Vaux’s assembly of pottery of
all sorts of household ware and site-
specific pottery from the settlement and
the caves.
34 samples were taken from
materials thought to serve as Qumran
reference materials, as well as 166 other
samples were taken from pottery that
consisted of a variety of styles, including
scroll jars. Ceramic material from further
archaeological sites, such as Jericho,
Jerusalem, Hebron, Callirhoe, EnGedi,
Masada and ‘Ain Feshkha were also
sampled and involved into the research
57Figure 11. Map of the sites (Gunneweg 2003)

Chemical provenancing of Qumran pottery
(Fig. 11). The total number of analysed samples reached 225. The complete list of samples is
given in the Appendix.
10.2. Reference material for Qumran
To start a provenancing process it is of great help to construct a reference group, that
is to get the chemical profile of ceramic materials, definitely local to the site. For Qumran
reference material samples of kiln linings, clay balls, mud-bricks, oven covers and jar
stoppers, local marl and Dead Sea mud samples were chosen.
Besides, two kiln wasters, i.e. collapsed or misfired pottery, whose trade can be
excluded, were found and analyzed with great expectation. An extra set of six samples
coming from the Motza Clay Formation, Hebron and Jericho was also involved.
To get the local chemical fingerprint it seems obvious to sample raw clay used by the
local potter. The problem is, that no real clay is found at, or near the site that could have been
used for the pottery under study. de Vaux claimed that “…the marl terrace of Qumran can be
made into excellent mud bricks but it is too calcareous and not malleable enough to be used as
potter’s clay. Nor are there any beds of clay in the immediate environment of Khirbet
Qumran. There is clay on the plateau above the Dead Sea and the winter rains carried it down
to Wadi Qumran. These deposits are still far calcareous.” (de Vaux 1973). Zeuner performed
chemical analysis on two samples from L75 Potter’s basin, and on two further samples from
cisterns, defining their CaCO3, MgCO3 and CaSO4 content (Zeuner 1960). His results are
comprised in Table 19.
To test the suitability of local marl and Dead Sea mud for making pottery vessels some
experiments were performed: the upper layer of a dried up puddle after the first rain in
Qumran was taken and a vessel was formed and fired. Another pot was made of Dead Sea
mud. The tests succeeded, the final products looked as good as any ceramic material in
Qumran. Their analytical results are involved in the pottery data.
There are some theories for transporting raw clay to Qumran from other locations. Up
till now, however, there is no decisive evidence for the movement of clay prior to the
58

Chemical provenancing of Qumran pottery
industrial era. The proximity of raw materials to production sites is a major issue in ancient
procurement patterns. According to Arnold’s notes (Arnold 1985) on 111 ethnographic cases,
33 per cent of potters obtained clays within a 1km radius of their workshops, and 84 per cent
within 7km. (Whitebread 2001).
There should be clays to be found around Qumran, or further away: but we have to
find those. A Polish team surveyed the site and the nearby wadis and took 22 clay samples
from different places, the Judean Mountains, Jerusalem, En Gedi, El-Jib, Hebron, Cave 4,
Qumran aqueduct, Wadi Qumran. Laboratory tests (colour, texture, porosity) as well as
petrographic and geochemical investigation were performed not only on these clay samples
but also on 55 ceramic jars from Qumran caves. They concluded that Qumran jars were made
of a raw material, which is not present in the vicinity of the site, and most of the jars were
probably produced from the Motza Formation clays, known and widely utilized in Judea
(Michniewicz 2003).
10.3. Analysis
Selected samples were analysed by instrumental neutron activation, according to the
validated standard operation procedure detailed in Chapter 7.
Due to the implemented quality control/quality assurance system accurate and precise
data has been generated in an organized, transparent and thoroughly documented system.
10.4. Data processing
Elemental concentrations and combined standard uncertainties were processed by the
multivariate statistical procedure given in Chapter 8.1.
Scraping samples of QUM 222, 223, 230, 233, 235 were not analyzed but were saved
to be investigated by other methods.
To avoid problems caused by missing values, big measuring uncertainties, or other
practical reasons (e.g. volatility of As and Br during firing) some elements were subtracted
59

Chemical provenancing of Qumran pottery
from calculations. The data matrix processed thus was determined by 16 elements and 220
samples.
10.5. Analytical results
Data treatment has resulted in five chemically distinct groups of samples. (Fig. 12) and
Table 20.
Data points in PC1-PC2 space
-40
-20
0
20
40
60
80
100
0 50 100 150 200 250 300 350
PC1
PC2
outlayers
group 5
group 1
group 2
group 3
group 4 ?
group 5 ?
group 2 - subgroup ?
group 3 ?
Conf. ellip. - group 5
Conf. ellip. - group 1
Conf. ellip. - group 2
Conf. ellip. - group 3
Conf. ellip. - group 4
PC1-PC2-PC3
-433 -389.4 -345.8 -302.2 -258.6 -215 -171.4 -127.8 -84.2 -40.6 3-54
-43.2
-32.4
-21.6
-10.8
0
10.8
21.6
32.4
43.2
54
centers for the iteration
Co - La projection
0
1020
3040
50
0 10 20 30
Figure 12. Chemical groups of Qumran pottery samples
60
Chemical provenancing of Qumran pottery
Fig 12. exhibits different approaches for the representation of the subdivision of
Qumran pottery samples. The basis is a two-dimensional plot, where data points are projected
into the plane of the first two principal components, containing the maximum variance of the
related data. The upper left segment shows the projection of sample points to the PC space,
determined by the first three principal components. The bottom left figure is a bivariate plot
the Parzen-Rosenblatt density functions with local
aximums as iteration centres are presented.
10.5.1
d ceiling (146), and mortar samples of the “scriptorium table” (175-178). Three
oven c
5) and perforated clay balls
(127, 1
p makes it highly
probab
however, didn’t live up to the expectations, they do
not ma
aterial failed in the firing, because the composition was not adequate, or that these
sherds
ains many types of household vessels of daily use, cups, bowls,
lids, a l hem ten scroll jars.
of raw data, while in bottom right
m
Columns of Table 17. comprise code numbers of samples belonging to the different
chemical groups defined. The separation of different pottery types within the groups proved to
be useful in the interpretation of the results.
. Chemical Group I.
A large group of pottery (44 samples) comprises most of the samples that were
thought to produce Qumran’s local chemical fingerprint: samples of the inner and outer lining
of the kiln (101, 103, 104), the puddle-marl and Dead Sea mud (225, 226), a piece from a
stucco-line
overs (150-152) and two clay-balls (128, 130) were certainly made of material
available on the site.
All these samples are highly calcareous, with an average calcium content of 24
percent. However, there are other samples of crude covers (142, 14
30) with a calcium content around 7 percent, which means that law calcium clay was
also available. The great number of Qumran reference samples of this grou
le that this unique chemical fingerprint corresponds the local pottery production of
Qumran.
The two kiln-wasters (140, 197),
tch anything in the data set. They are different also from each other. It either means
that their m
represent earlier (Iron Age) or later (Late Roman) pottery.
The local group cont
amp, a juglet and different kinds of jars, among t
61

Chemical provenancing of Qumran pottery
Out of the ten scroll jars six come from caves (132, 139, 163, 186, 231, 240) and four
from the settlement (120, 156, 162, 187). All of them are typical cylindrical jars, but the
settlement pieces are all of smaller size.
even nto this local assembly, but none of them comes from
caves.
ttery made of this clay has been published in several papers
erlm
two samples of Hebron clay (228, 229) found a statistical match with this
roup, giving the confirmation for the provenance of this group of pottery being the Hebron-
eit’Ummar type Motza clay.
Twenty out of the 41 samples constructing this group are scroll jars, six from various
of t n from caves. This means that the majority of the
analysed
El storage jars are grouped i
Two ovoid jars are made of the local makeup, one unearthed in the settlement (133)
and one from Cave 7 (134).
The cups and bowls are all from the settlement.
10.5.2. Chemical Group II.
Based on the similarities of their chemical pattern 41 samples are grouped together,
forming the second largest subset of the data matrix. The distinction is characteristic, so it is
fair to say that these vessels are not locally made, or made from not local raw material. The
unique high potassium values proved to be useful in tracing the provenance of ceramics
belonging to this group to the Motza Clay Formation.
This Cenomanian geological formation is one of the few levels of clay rocks that
occurs in the area of the Jerusalem Hills and Hebron Mountains and was employed in
different periods of history. Po
(P an 1986, Gunneweg 1985b, 1994). It was found, that the Motza clay source chemically
is not homogeneous, although homogeneous enough to be recognized. A slightly different
chemical composition can be seen regionally and also vertically, concerning its different
concordant layers. Based on these previous studies it became very probable that Qumran
Group II. potteries have a Motza clay connection, which could be confined to Beit ‘Ummar,
near Hebron. The
g
B
locations he settlement and fourtee
scroll jars were manufactured of this material. Lids and storage jars from the
settlement and the caves as well, a funnel, three bowls and a lamp also belong to Chemical
62

Chemical provenancing of Qumran pottery
Group II., which means that this kind of raw material was not used specifically for making
scroll jars only.
10.5.3. Chemical Group III.
41 ceramics of the Qumran settlement and Caves analyzed as local Jericho pottery.
ent is based on the results of four samples analysed from the Hasmonean and
in Jericho. In 1989, Yellin and Gunneweg published a study,
t of Jericho pottery found in these sites.
Two scroll jars, found in Cave 1 and Cave 3, can be traced back to the Jericho local
akeup
on the comprehensive studies on Edomite and Nabatean pottery of
unneweg (1988, 1991) and Gunneweg and Mommsen (1990, 1995).
0.5.5. Chemical Group V.
samples clustered together are considered to be originated from Jericho, but this
group is different from Chemical Group III. The six Qumran samples analyse as QUM 224, a
bowl from Jericho itself.
Assignm
Herod’s winter palaces
determining the local chemical fingerprin
m , both of them are of the so-called bulging cylindrical type. QUM 198 (Cave 1) is one
of the two complete scroll jars exhibited in the Shrine of the Book at the Israel Museum.
Storage jars as well as ovoid jars of Jericho provenance are also represented here,
together with six cups, fourteen bowls and nine jugs.
10.5.4. Chemical Group IV.
A small group of nine samples, a large cup, an ovoid jar and a storage jar, two jugs
and four bowls refers to Qumran’s connection with the other side of the Dead Sea, i.e. Edom.
The conclusion is based
G
1
Seven
63

Chemical provenancing of Qumran pottery
10.5.6
s
ithstand great temperature differences when in use. Although
no quality criteria is known for producing a good cooking pot, it is very probable, that the
clay us
nous limestone
An oil shale sequence is found in the Judean Desert uplands, providing a black
mesto
ated and proved to be chemically similar, with about 30 percent calcium content and a
lative low lanthanide and high uranium concentration.
s
any other pottery, as was mentioned
bove.
. Outliers
There are quite some samples which cannot be associated with any of the five group
given above.
Cooking pots
Cooking wares have to w
ed for the manufacture of cooking ware is different from that used for other vessels.
Four cooking pots, QUM 168, 169, 195 and 196 were analyzed, and all of them were
found to be without identifiable provenience.
Bitume
li ne, which is widely used in Qumran as filler in the plasters of the many pools.
According to the analysis of samples 181 and 285 this material is enriched in a number of
metals, e.g. chromium, molybdenum, uranium and zinc.
Stucco
Plaster pieces of the “scriptorium table” and a sample from a stuccoed ceiling were
investig
re
Waster
The two kiln wasters (140, 197) had no match with
a
Ceramics
There are some pieces of pottery, like QUM 148,155, 208, 209, 211, 215, 219, 232 and 277
for which a chemical parallel has not been found yet.
64
Chemical provenancing of Qumran pottery
10.6. Discu
ssion
ical fingerprint of the Hebron (Beit ‘Ummar)
ostly in the caves, but were found in the
settlem
ho jars are slightly different in shape, a bit
bulging opposed to the cl
chemically to the group of scroll
ade and dominate on the settlement, although
some were found in caves, too. All four groups have ovoid jar representatives.
ux as “Crockery”. L 86 is adjacent to L 77,
According to the analytical results, about 33 percents of the analyzed pottery has a
provenience local to Qumran. A relatively large part of pottery has connection with Jericho,
and another bigger group of vessels have a chem
type Motza Clay. There are quite some pottery wares alighting a possible Edom connection.
No difference in the chemical composition of pottery analyzed from the settlement and
that of the caves was found, each chemical groups have representative pieces in both contexts.
The elongated cylindrical jars appear m
ent as well. In the caves they are associated with scrolls, but no scrolls were found
with them in the settlement. Of the 34 scroll jars analysed ten represent the local manufacture,
twenty are related to Hebron, two originate from Jericho, while the provenance of a scroll jar
from Cave 4 remained unidentified. The two Jeric
assic cylindrical type.
Lids are grouped into Group I. and II., which is quite reasonable, they belong
jars. Jars and lids should have been made simultaneously so
as to fit to each other.
Most of the storage jars are locally m
Ceramic assemblage of the caves consisted mostly of the cylindrical jars, other types
of storage jars, lids and lamps, but some bowls and jugs were also found. Pottery was found
also in caves which didn’t contain scrolls. This implies that the caves were used by people on
more than one occasion of hiding the scrolls.
A great number of cups, bowls and jugs were unearthed on the settlement. Locus 86
contained 279 shallow, carinated bowls, 798 hemispherical cups, 150 deep cups, 37 large
bowls, 11 jugs and 8 jars and was called by de Va
65

Chemical provenancing of Qumran pottery
the biggest room of Khirbet Qumran, called the Assembly Hall, or p
stock of pottery beside, the “Refectory”. The large number as we
robably because of the
ll as the
dishes points to communal meals with many participants, and a con
cups and bowls analysed from the crockery proved to have originate
This part of the settlement was destroyed, the broken vesse
area was sealed off.
kraters and oil lamps
were found. Samples
analysed from this and
the surrounding rooms
were either locally made
or represent the Hebron-type Motza com
nfamiliar to the rest of Qumran pottery. Another trial was made to establish Qumran’s
ossible relation to another site on the Eastern shore of the Dead Sea: ‘Ain ez-Zara
allirhoe). Balsam juglets were chosen for analysis, in the hope of defining their provenance.
The four balsam juglets (QUM 295-299) proved to be chemically different. Two of them were
ourth one remained unparalleled.
Nevertheless, the connection of Ez-Zara with Qumran and Jericho became highly probable.
uniformity of the
cern of purity as well. All
d in Jericho.
ls were left in place, the
There was
another store of dining
dishes in L 114,(Fig. 13.)
next to the round cistern.
Bowls, more than one
hundred hemispherical
and deep cups, jugs and
Figure 13. Dishes in Locus 114 (Magness 2002)
position. This information needs further studies,
mostly into the different time periods of the settlement.
10.6.1. West-East connection
Some bowls, cups and jars mark the connection with Edomite sites with types quite
u
p
(C
produced in Qumran, one came from Jericho, the f
66

Chemical provenancing of Qumran pottery
traces of writing on them (Gunneweg
ls, or on sherds with ink or paint, on
after firing. Fifty-five sam
bearing signs of measurement, names, students’excercises, dated ‘deeds’, fragm
ent
ity. The
decipherment and interpretation of
the writings is given by Lemaire
ples were treated
togethe
criptions were
proved to be locally made in Qumran
10.6.2. Inscriptions on Pottery (Ostraca)
ples were found
ents of letters,
or just incised lines. Forty-one of
them have been analyzed by NAA.
The primary goal of these analyses
were to define the provenance of the
shards with inscription, which in
special cases gives the origin of the
script, too, to corroborate the
connection of caves and settlem
A special study was performed on potteries with
and Balla 2003b). Writing was found on whole vesse
pottery engraved before firing, or scratched
through writing activ
(2001).
These samFigure 14. The R
r with all the ceramic samples
by the analytical and statistical
procedures given above.
Four jars (121, 134, 311, 315)
and a jug (312) with ins
OMA jar (Lemaire 2003)
Figure 15. The “Roma” insription (Lemaire 2003)
and it seemed obvious that also a local scribe wrote the inscriptions. The most interesting
vessel in this group is a jar (QUM 134) with two ROMA inscriptions in black ink or paint.
(Fig. 14-15.)
67

Chemical provenancing of Qumran pottery
The jar was found in Cave 7 together with many Greek papyri of various texts. Some
fragments of papyri were identified as the Gospel of St. Mark, and those thought to be the
earliest written Christian documents ( Thiede 1992), although most biblical scholars refute the
theory. Thiede suggests, that the inscription ROMA on the jar might indicate the provenance
of its c
leven ostraca have been found, ten in the settlement and one in Cave 6, with a
chemic
which is of special interest. QUM 205 is the “Eleazar” bowl, with the name inscribed before
inscribed in Jericho and brought to Qumran.
ied time
there is another ostraca found in Qumran, menti
ions as
Nabate
Qumran living quarters and its caves, through scribal links: certain
scribal remains appeared on pottery that was made locally in Qumran and found in the caves.
As Lem ire (2001) claims, the type of writing in given scrolls as well as some on pottery is
ontents, i.e. the scrolls had been identified as coming from Rome (Thiede 1996). This
New testamentary connection has to stand or fall only on the texts themselves as the jar was
proved to be locally manufactured in Qumran (Gunneweg and Balla 2001).
E
al composition that can be traced to the Hebron-type Motza clay. Where the
inscriptions were born, cannot be localized, they could have been written in Qumran, or in the
place where the pottery was manufactured.
The Jericho chemical group includes ten jugs, a plate, a handle and two bowls, one of
firing, which means that the bowl was made and
The name Eleazar is quite common in the stud period, but it is still interesting, that
oning Eleazar and Jericho (Cross and Eshel
1997).
Two jugs with inscription on their
shoulder were assigned to Chemical group
IV, i.e. coming from Edom (Fig. 16).
Lemaire deciphered the inscript
an names, thus corroborating the
results of provenance studies, putting the
place of manufacture as well as the writing
to the eastern side of the Dead Sea.
In conclusion, provenance studies of
ostraca furnished further evidence for the
connection betweenFigure 16. The Edom jug QUM 201 Lemaire 2003
a
68
Chemical provenancing of Qumran pottery
similar, too. Besides, the Jericho, as well as the Edom/Nabatea connection is corroborated by
written evidences.
iring temperature
(Rasmu
onclusion was supported by the determination of
firing tem th
timated firing temperature of Qumran ceramics under study varies between
710 C and 860oC. It is interesting, that for the waster sample (QUM 196), which is one of the
outliers, it proved to be much lower, 570oC.
is conclusion of the results of TL dating is that “there is nothing in the data of the
remaining eleven samples that speaks against a date in the 3rd century BC to the second
de Vaux’s view, however, claiming that pottery serves as connecting link between the
settlem
10.6.3. Another source, providing complementary information
K.Rasmussen has attempted a fairly new method for provenance determination on
Qumran pottery and a completely new approach for determining their f
ssen 2003). He measured magnetic susceptibility and thermoluminescence sensitivity
on twelve samples, the same of which were analysed by neutron activation analysis. Three
samples were identified as imports, and this c
peratures of the samples too. One of the outliers was TL dated to the 20 century,
while the two others remained unparalleled also in the INAA data set.
The eso
H
century AD”.
10.7. Summary
As a conclusion of the provenance study it can be stated, that the main goals were
reached: by its chemistry Qumran pottery was traceable to their places of manufacture. The
widely accepted standpoint of de Vaux, that all the pottery was locally manufactured has
proved to be insupportable. It was possible to determine five chemically different groups of
pottery and to localize their probable provenance.
ent and the caves has been corroborated. It can be stated with some confidence, that
there is no difference in chemical composition between the pottery from the settlement and
69

Chemical provenancing of Qumran pottery
that of the caves. A new evidence, connecting the settlement to the habit of scribal activity,
and by this to the caves has also been provided.
the analytical results, can help understand who the people were who lived in Qumran and with
whom they were in contact.
Because a diverse interrelation is traceable trough the ceramic material, not only with
sites quite near to Qumran, like Jericho, but also with the farther Eastern side of the Dead Sea.
A careful inquire in the settlement’s setup, the study of the distribution of pottery
types and possible functions of the different rooms, as well as cave materials in the light of
70
Synthesis
Synthesis
Qumran’s unique cultural heritage has been the object of intense fascination and
extreme controversy. Thousands of research studies focused on the better understanding of
the spiritual, as well as material inheritance of the Dead Sea community. Nevertheless,
Qumran research evokes innumerable questions, much more than we can answer reliably.
Part of these questions cannot be answered by the own conventional methods of
archaeology. Science provides a different and less subjective approach. Within the past few
years Qumran research has received a new dimension: a multidisciplinary project has been
started, aiming the study of the site and its people by scientific means, among them neutron
activation analysis.
Instrumental neutron activation analysis has been applied to Qumran ceramics with the
primary objective of establishing the chemical composition of potteries that can be traced to
site-specific manufacture centres and so translated into trade patterns and interregional
contacts. Reliable scientific information must be based on results produced by an analytical
technique, which has an appropriate accuracy, precision, sensitivity, resolution power and
fitness of purpose to be applied to the archaeological problem.
Neutron activation analysis is a highly developed analytical method, where
fundamental research has been limited for some time. Nevertheless, the inherent
characteristics of nuclear analysis justify studies of, and with INAA. To make the existing
knowledge on the technique available for utilization, i.e. a kind of “strategic” research, is an
obvious demand in each laboratory. To offer long-term opportunities for the multi-element
analysis of archaeological ceramics, the following developments have been directed:
Irradiation channels with the highest thermal neutron flux were chosen and spatial and
spectral variations of the neutron-flux were monitored. By independent experiments k-factors
for the most important (n,γ) reactions and γ-ray energies of the resulting isotopes were
determined. A systematic analysis of different clays, as well as archaeological ceramics of
different dates, pastes and fabrics was performed to define the most informative elements.
Sampling technique, necessary and sufficient sample masses, the optimal number of samples,
monitors and standards per batches were defined. Timing protocols were set, counting
geometry was fixed. On different ceramic types homogeneity studies were performed, to
71

Synthesis
check, whether a simple sample of about 50 mg can be considered representative for a whole
vessel.
To demonstrate the full potential of the technique, a Standard Operation Procedure has
been elaborated for the analysis of archaeological ceramics. This procedure comprises the
pottery-optimized analytical protocol, the estimation of the uncertainty budget of the
measurements, performance capabilities of the technique and the validation of the method in a
quality control/quality assurance system.
Aiming to improve the laboratory’s overall performance, a quality assurance program
has been accomplished, which resulted in the accreditation of the laboratory according to the
ISO/IEC 17025 International Standard.
The power of the technique has been proved, but to exploit its great potential to
address cultural and social issues, involving ceramics, an archaeologically coherent research
design was elaborated. It must be applied within a clearly formulated archaeological context,
where questions can be posed knowing the given socio-economic structure, historical
background, basic forms of human behaviour.
The Qumran pottery project meets these requirements. On the basis of the immense
knowledge built up by the means of exegesis, historical research and archaeological evidence
concerning the cultural heritage of the Dead Sea Scrolls and Qumran, definite questions have
been formulated to answer them by scientific means. In all of the many research studies
focused on Qumran the primary objective has always been to establish a connection between
the finds of Qumran settlement with those of the caves. Pottery can provide the best evidence
for proving the contact as the same unique ceramic types were discovered in the building
complex and in the caves. Peculiarities of Qumran’s ceramic corpus led to a general opinion
that all the pottery was made at the site, propping the idea of a closed ascetic community as
Qumran’s inhabitants. Stylistic approach however has its shortcomings, style is a cultural
trait, without geographical specificity. Nevertheless, pottery has a specific characteristic
giving definite answer concerning its provenience: chemical composition. By determining the
chemical fingerprint of pottery pieces they can be traced back to their place(s) of manufacture,
thus enabling us to establish trade links or find proofs for human relations.
The main goals of this project were to uncover the interrelations between the
Qumranites and the ceramic remains in the caves, and also to establish Qumran’s relations to
other people and sites by the Dead Sea and farther remote.
Systematic sampling and subsequent analysis of clay and mud samples, inner lining of
kilns, unfired and fired clay-balls, oven stoppers, kiln wasters served as reference material for
72
Synthesis
defining Qumran’s local chemical fingerprint. Clay and ceramic samples from other places,
like Jericho, Jerusalem, Hebron, Callirhoe and ‘Ain Feshkha were also sampled and analysed
to help workshop assignment. The Qumran pottery set consisted of 166 samples, representing
a variety of styles including the unique scroll jars, found in the settlement as well as the caves.
As a result of the analysis of all these samples, a data-bank of ceramic materials has
been developed, comprising the chemical profile of different pottery types of Qumran and the
Dead Sea region, in the time period of 200 BC-70 AD.
To help place the derived analytical data into archaeological context different
procedures of multivariate statistics have been applied. By an iterative classification treatment
the partitioning of the data-set has been achieved, compositional groups were created and
placed into spatial perspective.
The main goals of the provenance study were reached: by its chemistry Qumran
pottery was traceable to their places of manufacture. According to our results, about 33
percents of the analysed pottery were produced locally, in Qumran. A relatively large part of
pottery has connection with Jericho, and another bigger group of vessels has a chemical
fingerprint of the Hebron (Beit ‘Ummar) type Motza Clay. There are quite some pottery
wares enlightening a possible Edom/Nabatea connection.
The idea, claiming that pottery serves as a connecting link between the settlement and
the caves has been corroborated, there is no difference in the chemical composition between
the pottery from the settlement and that of the caves.
The question of the settlement’s closeness has got a different new light: through the
ceramic material a diverse interrelation is traceable, not only with sites and people near to
Qumran, but also with people of the Eastern side of the Dead Sea.
The intention to enrich Qumran studies by the application of methods of analysis from
the field of natural sciences proved to be fruitful. The extent to which these results can
contribute to the wider historical and archaeological narrative is difficult to asses, but
different methodological and intellectual approaches can provide complex and more accurate
explanations, and the impact of a joint acquisition of knowledge can be considerable.
73
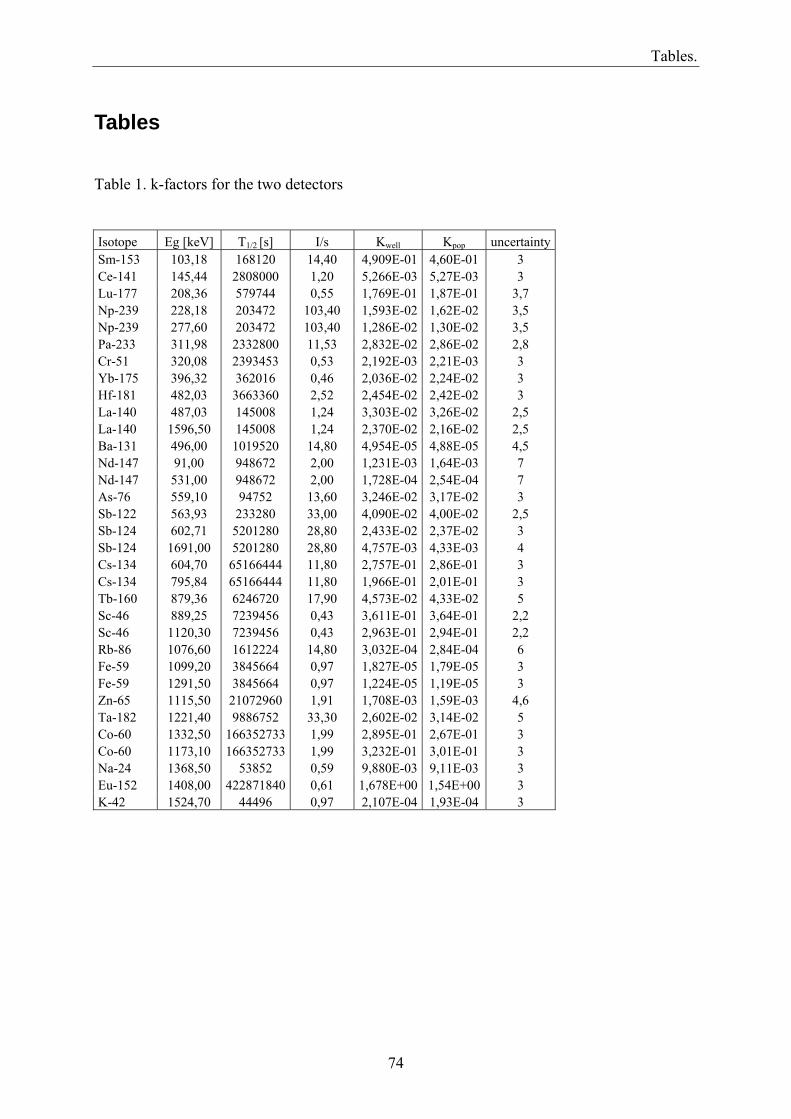
Tables.
Tables Table 1. k-factors for the two detectors Isotope Eg [keV] T1/2 [s] I/s Kwell Kpop uncertaintySm-153 103,18 168120 14,40 4,909E-01 4,60E-01 3 Ce-141 145,44 2808000 1,20 5,266E-03 5,27E-03 3 Lu-177 208,36 579744 0,55 1,769E-01 1,87E-01 3,7 Np-239 228,18 203472 103,40 1,593E-02 1,62E-02 3,5 Np-239 277,60 203472 103,40 1,286E-02 1,30E-02 3,5 Pa-233 311,98 2332800 11,53 2,832E-02 2,86E-02 2,8 Cr-51 320,08 2393453 0,53 2,192E-03 2,21E-03 3 Yb-175 396,32 362016 0,46 2,036E-02 2,24E-02 3 Hf-181 482,03 3663360 2,52 2,454E-02 2,42E-02 3 La-140 487,03 145008 1,24 3,303E-02 3,26E-02 2,5 La-140 1596,50 145008 1,24 2,370E-02 2,16E-02 2,5 Ba-131 496,00 1019520 14,80 4,954E-05 4,88E-05 4,5 Nd-147 91,00 948672 2,00 1,231E-03 1,64E-03 7 Nd-147 531,00 948672 2,00 1,728E-04 2,54E-04 7 As-76 559,10 94752 13,60 3,246E-02 3,17E-02 3 Sb-122 563,93 233280 33,00 4,090E-02 4,00E-02 2,5 Sb-124 602,71 5201280 28,80 2,433E-02 2,37E-02 3 Sb-124 1691,00 5201280 28,80 4,757E-03 4,33E-03 4 Cs-134 604,70 65166444 11,80 2,757E-01 2,86E-01 3 Cs-134 795,84 65166444 11,80 1,966E-01 2,01E-01 3 Tb-160 879,36 6246720 17,90 4,573E-02 4,33E-02 5 Sc-46 889,25 7239456 0,43 3,611E-01 3,64E-01 2,2 Sc-46 1120,30 7239456 0,43 2,963E-01 2,94E-01 2,2 Rb-86 1076,60 1612224 14,80 3,032E-04 2,84E-04 6 Fe-59 1099,20 3845664 0,97 1,827E-05 1,79E-05 3 Fe-59 1291,50 3845664 0,97 1,224E-05 1,19E-05 3 Zn-65 1115,50 21072960 1,91 1,708E-03 1,59E-03 4,6 Ta-182 1221,40 9886752 33,30 2,602E-02 3,14E-02 5 Co-60 1332,50 166352733 1,99 2,895E-01 2,67E-01 3 Co-60 1173,10 166352733 1,99 3,232E-01 3,01E-01 3 Na-24 1368,50 53852 0,59 9,880E-03 9,11E-03 3 Eu-152 1408,00 422871840 0,61 1,678E+00 1,54E+00 3 K-42 1524,70 44496 0,97 2,107E-04 1,93E-04 3
74

Tables.
Table 2. Trace element concentrations in different clay-minerals Element Kaolinite Kaolinite Kaolinite Kaolinite Illite Bentonite Halloysite Mád Szegi Budakeszi Sárisáp Fűzérradvány Istenmezeje Cserszegtomaj
Sc 7,6 13,7 10,3 15,9 7,0 4,3 4,4 Cr 12,3 480,0 58,5 39,5 7,9 35,2
Fe% 0,2 3,02 1,19 0,89 0,29 1,89 0,14 Co 0,6 5,7 3,3 0,17 0,9 0,8 Rb 47,4 51,2 477,0 Sb 19,5 48,9 2,1 4,2 Cs 1,02 5,6 10,1 3,2 53,6 0,9 1,8 Ba 200 195 175 566 91 188 La 12,6 62,2 39,0 13,0 18,0 12,1 1,8 Ce 31,1 66,0 18,9 28,4 31,3 29,9 10,2 Nd 26,2 21,3 13,3 16,7 Sm 6,1 21,5 32,9 2,5 2,6 7,3 10,2 Eu 0,3 3,2 0,4 0,4 0,7 Tb 1,0 6,5 5,0 0,6 1,1 0,5 Tm 3,2 3,4 0,6 1,3 Yb 1,8 9,7 10,5 1,0 0,5 1,5 0,6 Lu 0,35 1,8 2,0 0,21 0,14 0,3 0,7 Hf 4,0 14,0 11,1 2,8 6,0 1,8 Ta 1,5 4,6 2,0 0,8 1,3 3,3 Th 23,1 91,7 41,8 8,2 9,3 12,0 0,7 U 2,8 4,0 16,6 2,0 1,8 7,0 20,7
Table 3. Homogeneity study of Terra Sigillata pottery (10 samples from one sherd)
Element Mean value STDEV ppm %
Sc 12,1±0,2 1,8 Cr 94±14 14,4
Fe% 3,34±0,14 4,2 Co 12,3±0,4 2,9 Rb 271±30 11,1 Cs 55,9±2,5 4,4 La 46,6±1,9 4,0 Ce 102±17 16,0 Eu 1,15±0,10 8,4 Yb 2,2±0,2 9,4 Lu 0,36±0,04 12,0 Hf 3,4±0,3 8,5 Th 19,4±0,9 4,5 U 4,9±1,0 20,0
75

Tables.
Table 5.Uncertainty components of INAA Uncertainty components Typical value Sample preparation Balance: standard deviation of 3x10 measurements.
0.016 mg
Mass determination of the sample 0.05-0.1g Mass determination of gold foil 5-10 mg ≈0.3% Mass determination of zirconium foil 30-40 mg, ≈0.03% Concentration of gold foil: according to certificate 0.02% Moisture determination: depends on sample type; can be evaluated by repetitive measurements.
Generally negligible
Variation of isotopic abundance: in our case only for uranium it may be important.
Negligible
Impurities of irradiation vials: concentration of some elements in PE vials is high comparing to measurand .(See Table 6.)
below 1%
Irradiation Irradiation geometry: neutron gradient practically very low, but using 3 gold foils in sandwich type geometry, can be minimised
0.1-0.5 %
Neutron self-shielding: in most cases negligible 0.1% Irradiation time: samples and gold foils are irradiated together, uncertainty is max. 5 min compare to 8 hour of duration.
Negligible,
Nuclear reaction interference: in case of high uranium concentration correction is needed.
in most cases negligible
Neutron spectrum variation: using Zr foils correction can be derived. Calculated by Spread Sheet Method.
after correction negligible
Gamma spectrometry Counting statistic: standard uncertainty is calculated by Sampo90 evaluation software.
0.2-30%
Gamma self-absorption: Negligible Dead time effect: up to 10% dead time
after correction less then 2%
Random coincidences: standardisation performed in the same geometry there is no difference between coincidences.
Negligible
Decay timing: 5 min/week or month Negligible Counting time: 0.2 sec/5000-10000 sec Negligible Background correction: in our laboratory correction for Co-60 is needed. in most cases negligible Counting geometry differences: the measurement is done at least 5 cm from the detector; the sample and the comparator are measured in the same geometry (see Table 7).
2-3% mainly from sample volume differences
Gamma interference: should be minimised by using more gamma lines and by repeating the counting. In special cases correction is needed.
Negligible
Uncertainty of standardisation: Uncertainty of the k-factors had been estimated by repeated measurements of different RMs. (see Table 8.and 9.)
2-10%
76
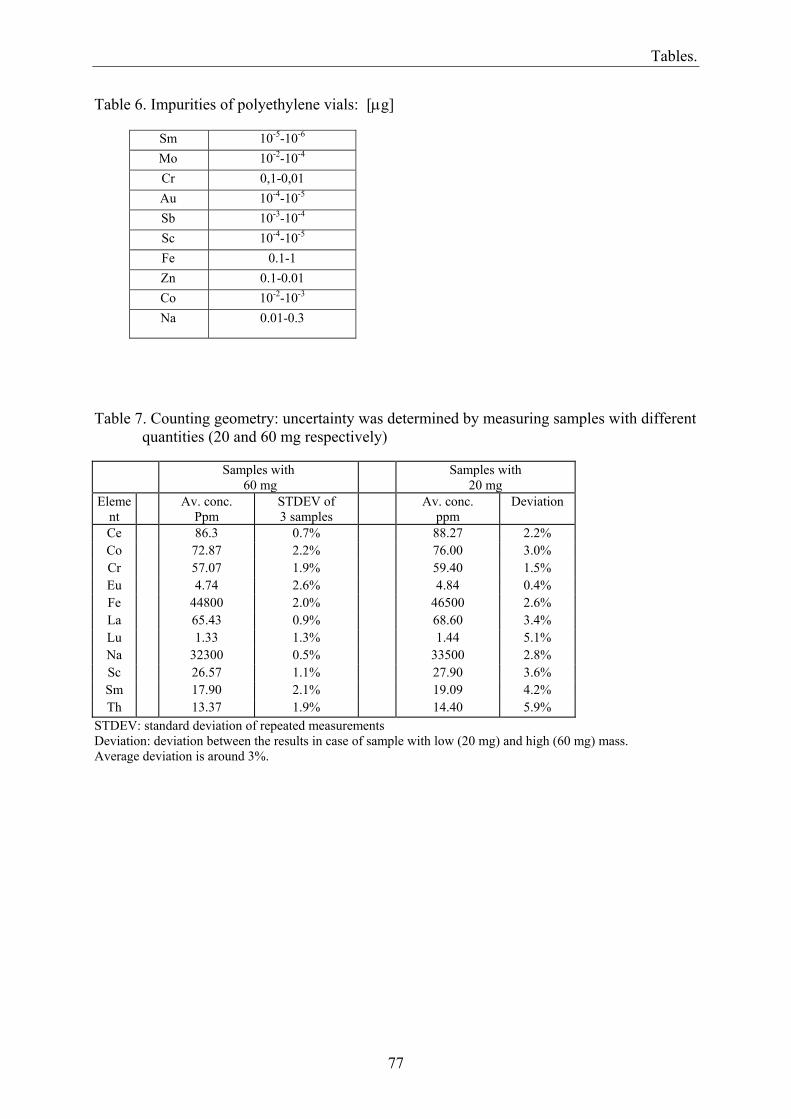
Tables.
Table 6. Impurities of polyethylene vials: [µg]
Sm 10-5-10-6
Mo 10-2-10-4
Cr 0,1-0,01 Au 10-4-10-5
Sb 10-3-10-4
Sc 10-4-10-5
Fe 0.1-1 Zn 0.1-0.01 Co 10-2-10-3
Na 0.01-0.3
Table 7. Counting geometry: uncertainty was determined by measuring samples with different quantities (20 and 60 mg respectively)
Samples with 60 mg
Samples with 20 mg
Element
Av. conc. Ppm
STDEV of 3 samples
Av. conc. ppm
Deviation
Ce 86.3 0.7% 88.27 2.2% Co 72.87 2.2% 76.00 3.0% Cr 57.07 1.9% 59.40 1.5% Eu 4.74 2.6% 4.84 0.4% Fe 44800 2.0% 46500 2.6% La 65.43 0.9% 68.60 3.4% Lu 1.33 1.3% 1.44 5.1% Na 32300 0.5% 33500 2.8% Sc 26.57 1.1% 27.90 3.6% Sm 17.90 2.1% 19.09 4.2% Th 13.37 1.9% 14.40 5.9%
STDEV: standard deviation of repeated measurements Deviation: deviation between the results in case of sample with low (20 mg) and high (60 mg) mass. Average deviation is around 3%.
77

Tables.
Table 8. Results of measurement of RMs: FA: NBS SRM 1633a Coal Fly Ash; S7: IAEA Soil 7; MS: GBW 07313 Marine Sediment:
FA S7 MS FA S7 MS FA S7 MS No. of measurements
9 3 15 9 3 15 9 3 15
As As As Ba Ba Ba Ce Ce Ce Cert. val.[ppm] 145 13.4 5.8 1500 159 4400 180 61 92
u 15 0.8 0.8 30 200 7 8 Meas. Val.[ppm] 138 13.30 6.18 1422 170 4455 170 61.0 93.6
σ 2.6 0.36 0.71 91 8.02 192 9.8 1.0 4.3
Co Co Co Cr Cr Cs Cs Cs Cert. val.[ppm] 46 8.9 76.7 196 58.4 11 5.4 9.4
u 0.9 1.2 6 1.3 0.76 0.7 Meas. Val.[ppm] 42 8.67 71.1 193 58.5 10 5.43 8.66
σ 0.51 0.38 2.1 6.2 2.3 0.21 0.21 0.32
Eu Eu Eu Fe% Fe% Fe% Hf Hf Hf Cert. val.[ppm] 4 1 5.3 9.4 2.57 4.6 7.6 5.1
U 0.2 0.3 0.1 0.1 0.4 Meas. Val.[ppm] 3 0.94 4.84 10 2.69 4.43 7.16 5.13 4.45
σ 0.10 0.09 0.14 0.20 0.08 0.13 0.49 0.47 0.20
FA S7 MS FA S7 MS FA S7 MS La La La Lu Lu Lu Na Na % Na %
Cert. val.[ppm] 28 67.8 0.3 1.46 1700 0.24 3.568 u 2.0 2.9 0.19 100 0.04
Meas. Val.[ppm] 77.6 25.7 65.5 0.98 0.29 1.32 1730 0.22 3.21 σ 1.97 0.70 2.34 0.04 0.01 0.07 80.09 0.01 0.09
Nd Nd Nd Rb Rb Rb Sb Sb Sb Cert. val.[ppm] 30 91.8 131 51 97.3 7 1.7 1.85
u 5 3.9 2 4.5 2.6 0.2 0.35 Meas. Val.[ppm] 58.1 29.0 81.6 128 48 84 6.43 1.70 2.08
σ 11.6 11.3 12.8 11.4 5.5 13 0.10 0.20 0.08
Sc Sc Sc Sm Sm Sm Ta Ta Ta Cert. val.[ppm] 40 8.3 25.6 5.1 21.5
u 1.1 2.9 0.36 1.3 Meas. Val.[ppm] 38.5 8.47 26.5 16.4 4.84 20.0 2.0 0.96 1.11
σ 0.71 0.12 0.76 0.29 0.20 0.59 0.2 0.08 0.13
Tb Tb Tb Th Th Th U U U Cert. val.[ppm] 2.53 3.4 24.7 8.2 13.9 10.2 2.6 1.98
u 0.04 0.3 1 1.1 1.1 0.3 0.55 0.47 Meas. Val.[ppm] 2 0.67 3.18 24.45 8.07 13.45 10.1 2.63 1.83
σ 0.3 0.07 0.20 0.53 0.47 0.58 0.18 0.15 0.43
Yb Yb Yb Zn Zn Zn Cert. val.[ppm] 7.5 2.4 9.8 220 104 160
u 0.13 0.4 1.1 10 6 3 Meas. Val.[ppm] 8 2.29 9.88 241 106 194
σ 0.2 0.11 0.37 45 15 25 σ: standard deviation of the results [ppm]
78

Tables.
Table 9. Uncertainty of k-factors:
Radionuclide Energy
keV Uncertainty of Radionuclide Energy
keV Uncertainty ofk-factors % k-factors %
As-76 559.1 3 Na-24 1368.5 3 As-76 657.0 5 Nd-147 91 7
Au-198 411 2 Nd-147 531 7 Ba-131 496 4.5 Np-239 228.2 3.5 Ce-141 145.4 3 Np-239 277.6 3.5 Co-60 1173.1 3 Pa-233 312 2.8 Co-60 1332.5 3 Rb-86 1076.6 6
320.1 3 Sb-122 563.9 2.5 Cr-51 Cs-134 604.7 3 Sb-124 602.7 3 Cs-134 795.8 3 Sb-124 1691 4 Eu-152 1408 3 Sc-46 889.3 2.2 Fe-59 1099.2 3 Sc-46 1120.3 2.2 Fe-59 1291.5 3 Sm-153 103.2 3
Hf-181 482 3 Ta-182 1221.4 5 La-140 487 2.5 Tb-160 879.4 5 La-140 1596.5 2.5 Yb-175 396.3 3 Lu-177 208.4 3.7 Zn-65 1115.5 4.6
Table 10. Typical values of detection limit
Det. limit Det.
Limit Element ppm Element ppm
As 2,80 Nd 25 Ba 300 Rb 35 Ce 4,5 Sb 0,4 Co 2 Sc 0,06 Cr 9 Sm 0,1 Cs 0,9 Ta 0,2 Eu 0,12 Tb 0,6 Fe 600 Th 0,7 Hf 0,8 U 1,7 La 0,5 Yb 0,7 Lu 0,1 Zn 20 Na 80
79

Tables.
Table 11. Results of NBS SRM 1633a Coal Fly Ash. Reference values from Bode (1992)
Element Measured Reference Relative Value[ppm] STDEV[ppm] Value[ppm] STDEV[ppm] deviation As 138,0 2,6 145 15 -0,048 Ba 1422 91 1420 100 0,001 Ce 170,0 9,8 175 7 -0,029 Co 42,0 0,5 43 3 -0,023 Cr 193 6 196 6 -0,015 Cs 10,0 0,2 10,5 0,7 -0,048 Eu 3,50 0,10 3,7 0,2 -0,054 Fe % 10,00 0,200 9,4 0,1 0,064 Hf 7,16 0,49 7,4 0,3 -0,032 La 77,6 2,0 84 8 -0,076 Lu 0,98 0,04 1,12 0,18 -0,125 Na % 1730 80 1700 100 0,018 Nd 58 11 Rb 128 11 131 2 -0,023 Sb 6,43 0,10 6,8 0,4 -0,054 Sc 38,5 0,7 39 3 -0,013 Sm 16,4 0,3 17 1,5 -0,035 Ta 2,0 0,2 2 0,2 0,000 Th 24,5 0,5 24,7 0,3 -0,010 U 10,1 0,2 10,2 0,1 -0,010 Yb 8,0 0,2 7,4 0,7 0,081 Zn 241 45 220 10 0,095
Element u result P% Result As 0,46 passed 10,5 passed Ba 0,01 passed 9,5 passed Ce 0,42 passed 7,0 passed Co 0,33 passed 7,1 passed Cr 0,35 passed 4,4 passed Cs 0,68 passed 7,0 passed Eu 0,89 passed 6,1 passed Fe % 2,68 passed 2,3 passed Hf 0,42 passed 8,0 passed La 0,78 passed 9,9 passed Lu 0,76 passed 16,6 passed Na % 0,23 passed 7,5 passed Nd Rb 0,27 passed 8,7 passed Sb 0,90 passed 6,1 passed Sc 0,16 passed 7,9 passed Sm 0,39 passed 9,0 passed Ta 0,00 passed 14,1 passed Th 0,41 passed 2,5 passed U 0,49 passed 2,0 passed Yb 0,82 passed 9,8 passed Zn 0,46 passed 19,2 passed Accuracy criteria (u-test acceptance): u<=3.29 Precision criteria: P<=25%
80
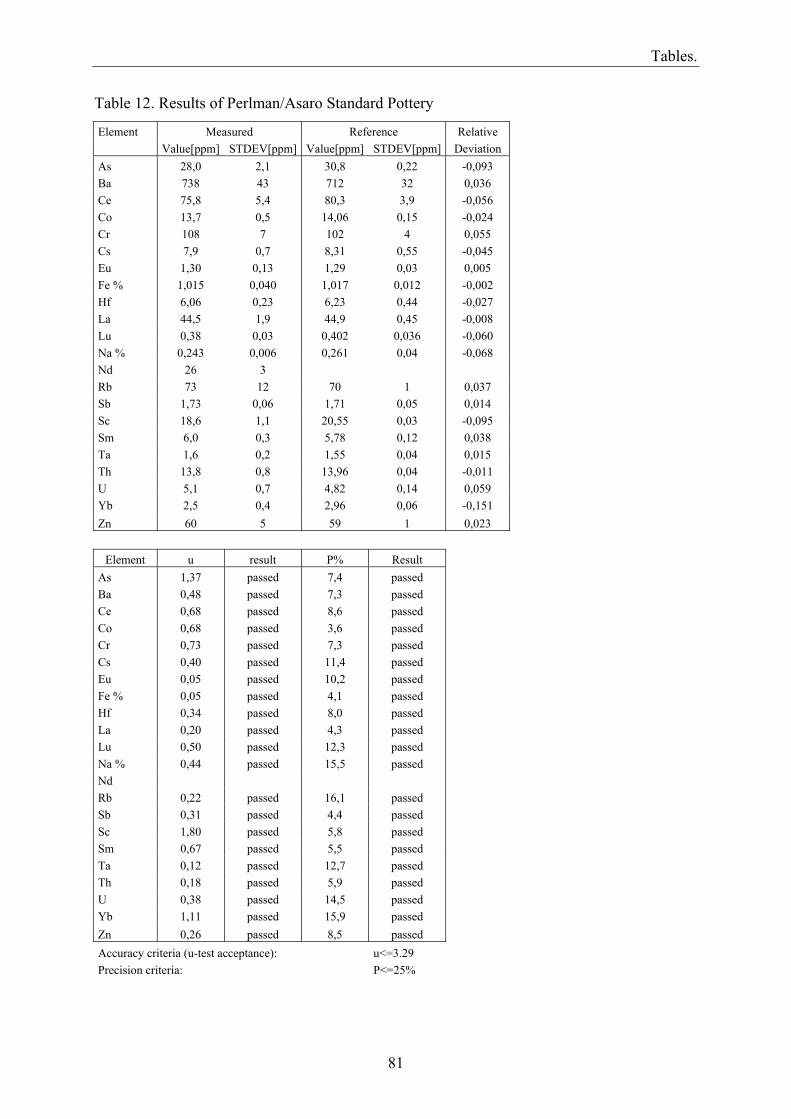
Tables.
Table 12. Results of Perlman/Asaro Standard Pottery
Element Measured Reference Relative Value[ppm] STDEV[ppm] Value[ppm] STDEV[ppm] Deviation As 28,0 2,1 30,8 0,22 -0,093 Ba 738 43 712 32 0,036 Ce 75,8 5,4 80,3 3,9 -0,056 Co 13,7 0,5 14,06 0,15 -0,024 Cr 108 7 102 4 0,055 Cs 7,9 0,7 8,31 0,55 -0,045 Eu 1,30 0,13 1,29 0,03 0,005 Fe % 1,015 0,040 1,017 0,012 -0,002 Hf 6,06 0,23 6,23 0,44 -0,027 La 44,5 1,9 44,9 0,45 -0,008 Lu 0,38 0,03 0,402 0,036 -0,060 Na % 0,243 0,006 0,261 0,04 -0,068 Nd 26 3 Rb 73 12 70 1 0,037 Sb 1,73 0,06 1,71 0,05 0,014 Sc 18,6 1,1 20,55 0,03 -0,095 Sm 6,0 0,3 5,78 0,12 0,038 Ta 1,6 0,2 1,55 0,04 0,015 Th 13,8 0,8 13,96 0,04 -0,011 U 5,1 0,7 4,82 0,14 0,059 Yb 2,5 0,4 2,96 0,06 -0,151 Zn 60 5 59 1 0,023
Element u result P% Result As 1,37 passed 7,4 passed Ba 0,48 passed 7,3 passed Ce 0,68 passed 8,6 passed Co 0,68 passed 3,6 passed Cr 0,73 passed 7,3 passed Cs 0,40 passed 11,4 passed Eu 0,05 passed 10,2 passed Fe % 0,05 passed 4,1 passed Hf 0,34 passed 8,0 passed La 0,20 passed 4,3 passed Lu 0,50 passed 12,3 passed Na % 0,44 passed 15,5 passed Nd Rb 0,22 passed 16,1 passed Sb 0,31 passed 4,4 passed Sc 1,80 passed 5,8 passed Sm 0,67 passed 5,5 passed Ta 0,12 passed 12,7 passed Th 0,18 passed 5,9 passed U 0,38 passed 14,5 passed Yb 1,11 passed 15,9 passed Zn 0,26 passed 8,5 passed Accuracy criteria (u-test acceptance): u<=3.29 Precision criteria: P<=25%
81

Tables.
Table 13. Reproducibility measurements of GBW 07313 Marine Sediment
(five samples) Element Average conc.
ppm STDEV
ppm Uncertainty
ppm Precision index %
As 5.42 0.63 0.60 17.7 Ba 4400 235 250 7.3 Ce 89.9 1.4 3.30 9.4 Co 73.8 1.81 2.50 3.7 Cr 58.5 2.33 3.00 5.6 Cs 8.50 0.31 0.40 8.8 Eu 4.82 0.16 0.18 6.8 Fe 45300 1000 1500 4.0 Hf 4.38 0.13 0.22 La 66.3 1.46 2.20 5.4 Lu 1.37 0.06 0.06 13.7 Na 32600 561 1100 3.6 Nd Rb 93.0 10 10 11.1 Sb 2.05 0.06 0.10 19.5 Sc 26.94 0.62 0.70 11.6 Sm 18.32 0.64 0.60 6.8 Ta Tb 3.24 0.09 0.21 10.9 Th 13.60 0.48 0.50 8.7 U 0.30
Yb 9.75 0.25 0.40 12 Zn 224 15 25 11.3
Conclusion: Standard deviation of 5 measurements are lower then the calculated uncertainty.
Acceptance criteria: Precision index is lower then 25% for all elements.
82

Tables.
Table 14. Results of “Tea leaves”
Intercomparison 2002 INCT-TL-1 Element Unit Results Reference Relative Abs. % Measured Unc. Unc. Ref value Unc. deviation As ppb 93,0 8,0 8,6 106,0 21,0 -0,123 Ba ppm 45,9 7,2 15,7 43,2 3,9 0,062 Br ppm 12,5 0,6 5,0 12,3 1,0 0,012 Ca ppm 6820,0 886,6 13,0 5820,0 520,0 0,172 Ce ppb 847,0 31,3 3,7 790,0 76,0 0,072 Cl ppm 573,0 48,0 Co ppb 383,0 16,9 4,4 387,0 42,0 -0,010 Cr ppm 2,12 0,1 5,9 1,9 0,2 0,110 Cs ppm 4,0 0,1 3,3 3,6 0,4 0,094 Cu ppm 20,4 1,5 Eu ppb 116,0 10,0 8,6 49,9 9,4 Fe ppm 513 16,9 3,3 432,0 0,188 Hg ppb 4,9 0,7 Hf ppb 28,0 K % 1,77 0,1 5,2 1,7 0,1 0,041 La ppb 983,0 32,4 3,3 1000,0 70,0 -0,017 Lu ppb 18,3 0,9 4,9 16,8 2,4 0,089 Mn ppm 1733,0 60,7 3,5 1570,0 110,0 0,104 Na ppm 26,3 0,9 3,3 24,7 3,2 0,065 Rb ppm 85,9 5,5 6,4 81,5 6,5 0,054 Sb ppb 52,7 2,3 4,4 50,0 0,054 Sc ppb 257,0 6,7 2,6 266,0 24,0 -0,034 Sm ppb 190,0 6,3 3,3 177,0 22,0 0,073 Th ppb 31,7 5,5 17,3 34,3 4,8 -0,076 Ti ppm 30,0 V ppm 2,0 0,4 -1,000 Yb ppb 107,0 4,9 4,6 118,0 13,0 -0,093 Zn ppm 35,5 1,7 4,8 34,7 2,7 0,023
83
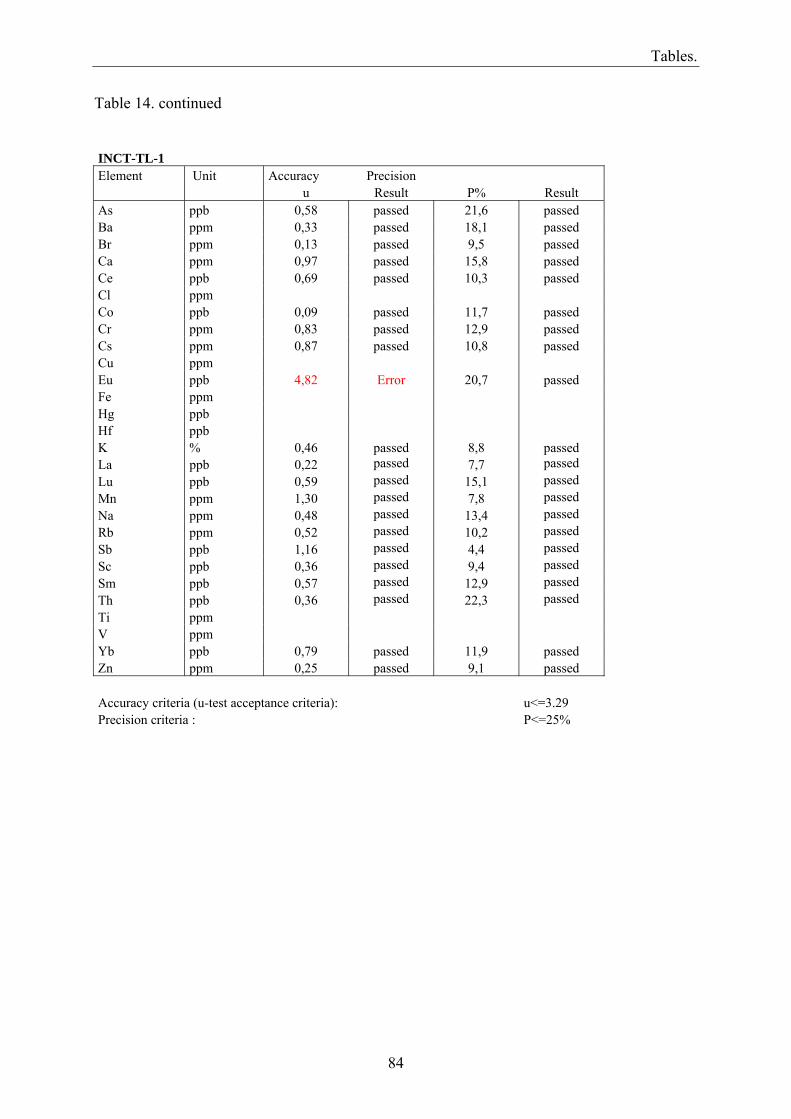
Tables.
Table 14. continued
INCT-TL-1 Element Unit Accuracy Precision u Result P% Result As ppb 0,58 passed 21,6 passed Ba ppm 0,33 passed 18,1 passed Br ppm 0,13 passed 9,5 passed Ca ppm 0,97 passed 15,8 passed Ce ppb 0,69 passed 10,3 passed Cl ppm Co ppb 0,09 passed 11,7 passed Cr ppm 0,83 passed 12,9 passed Cs ppm 0,87 passed 10,8 passed Cu ppm Eu ppb 4,82 Error 20,7 passed Fe ppm Hg ppb Hf ppb K % 0,46 passed 8,8 passed La ppb 0,22 passed 7,7 passed Lu ppb 0,59 passed 15,1 passed Mn ppm 1,30 passed 7,8 passed Na ppm 0,48 passed 13,4 passed Rb ppm 0,52 passed 10,2 passed Sb ppb 1,16 passed 4,4 passed Sc ppb 0,36 passed 9,4 passed Sm ppb 0,57 passed 12,9 passed Th ppb 0,36 passed 22,3 passed Ti ppm V ppm Yb ppb 0,79 passed 11,9 passed Zn ppm 0,25 passed 9,1 passed Accuracy criteria (u-test acceptance criteria): u<=3.29 Precision criteria : P<=25%
84

Tables.
Table 15. Results of “Mixed Polish Herbs” Intercomparison 2002 INCT-MPH-2 Element Unit Reference Relative abs. % Measured Unc. Unc. Ref.value Unc. deviation As ppb 200,0 11,8 5,9 191,0 23,0 0,047 Ba ppm 32,5 2,5 Br ppm 7,4 0,4 5,0 7,7 0,6 -0,047 Ca % 1,3 0,1 7,0 1,1 0,1 0,204 Ce ppm 1,2 3,3 1,1 0,1 0,045 Cl % 0,3 0,0 Co ppb 220,0 7,3 3,3 210,0 25,0 0,048 Cr ppm 1,94 0,1 3,7 1,7 0,1 0,148 Cs ppm 88,0 7,3 8,3 76,0 7,0 0,158 Cu ppm Eu ppb 22,0 1,5 6,8 15,7 1,8 0,401 Fe ppm 518 17,1 3,3 460,0 0,126 Hg ppb 17,6 1,6 Hf ppb 236,0 20,0 K % 1,95 0,1 5,2 1,9 0,1 0,021 La ppb 583,0 19,2 3,3 571,0 46,0 0,021 Lu ppb 8,0 0,5 6,3 9,0 1,5 -0,111 Mn ppm 202,0 7,1 3,5 191,0 12,0 0,058 Na ppm 458,0 31,1 6,8 350,0 0,309 Rb ppm 11,8 0,7 6,2 10,7 0,7 0,103 Sb ppb 64,0 2,4 3,7 65,5 9,1 -0,023 Sc ppb 127,0 3,3 2,6 123,0 9,0 0,033 Sm ppb 96,3 3,2 3,3 94,4 8,2 0,020 Th ppb 160,0 5,8 3,6 154,0 13,0 0,039 Ti ppm 34,0 V ppm 952,0 163,0 Yb ppb 52,5 3,4 6,5 52,7 6,6 -0,004 Zn ppm 36,7 1,8 4,8 33,5 2,1 0,096
85

Tables.
Table 15. continued INCT-MPH-2 Element Unit Accuracy Precision u Result P% Result As ppb 0,35 passed 13,4 passed Ba ppm Br ppm 0,51 passed 9,4 passed Ca ppb 1,92 passed 9,5 passed Ce ppb 0,50 passed 8,9 passed Cl ppm Co ppb 0,38 passed 12,4 passed Cr ppm 1,68 passed 8,5 passed Cs ppm 1,19 passed 12,4 passed Cu ppm Eu ppb 2,69 passed 13,3 passed Fe ppm Hg ppb Hf ppb K % 0,25 passed 8,2 passed La ppb 0,24 passed 8,7 passed Lu ppb 0,63 passed 17,8 passed Mn ppm 0,79 passed 7,2 passed Na ppm 3,47 passed 6,8 passed Rb ppm 1,09 passed 9,0 passed Sb ppb 0,16 passed 14,4 passed Sc ppb 0,42 passed 7,8 passed Sm ppb 0,22 passed 9,3 passed Th ppb 0,42 passed 9,2 passed Ti ppm V ppm Yb ppb 0,03 passed 14,1 passed Zn ppm 1,17 passed 7,9 passed Accuracy criteria (u-test acceptance criteria): u<=3.29 Precision criteria : P<=25%
86

Tables.
Table 16. Results of “Vienna Dust” NAT-7 Vienna dust V-25 Element Unit Measured Reference Relative Value Unc. Value Unc deviation As mg/cm2 Ca mg/cm2 21320 2550 22060 4007 -0,034 Co mg/cm2 12,4 0,6 14,63 2,62 -0,152 Cr mg/cm2 312 9 486 57 -0,358 Cu mg/cm2 2270 160 1443 159 0,573 Fe mg/cm2 48000 1600 50660 6664 -0,053
Mn mg/cm2 570 30 566,7 130 0,006 Accuracy Precision Element u result P% Result
As Ca 0,16 passed 21,75 passed Co 0,83 passed 18,55 passed Cr 3,02 passed 12,08 passed Cu 3,67 failed 13,08 passed Fe 0,39 passed 13,57 passed Mn 0,02 passed 23,54 passed Accuracy criteria (u-test acceptance): U≤3.29 Precision criteria: P≤25% Table 17. Results of “Prague Dust” NAT-7 Prague dust P-76 Element Unit Measured Reference Relative Value Unc. Value Unc. deviation As mg/cm2 31 4 29 4 0,069 Ca mg/cm2 Co mg/cm2 16,7 0,8 16,15 2,16 0,034 Fe mg/cm2 58000 1940 58830 5949 -0,014 Mn mg/cm2 660 30 621 84 0,063 Sb mg/cm2 179 6 171,9 16,2 0,041
Ti mg/cm2 3600 330 3486 451 0,033 Accuracy Precision Element u result P% result As 0,36 passed 18,6 passed Ca passed passed Co 0,24 passed 14,2 passed Fe 0,13 passed 10,7 passed Mn 0,44 passed 14,3 passed Sb 0,41 passed 10,0 passed Ti 0,20 passed 15,9 passed Accuracy criteria (u-test acceptance): U≤3.29 Precision criteria: P≤25%
87

Tables.
Table 18. Analysis of “Motza Clay” samples Element Measured Hebrew University Relative Value[ppm] STDEV[ppm] Value[ppm] STDEV[ppm] deviation As 7,43 0,8 7,79 0,66 -0,046 Ba Ce 44,4 5,8 45,2 1,45 -0,018 Co 11,2 1,1 11,8 0,23 -0,053 Cr 94 6 93,8 2,07 -0,001 Cs 5,1 0,3 5,68 0,16 -0,102 Eu 1,15 0,17 1,08 0,02 0,065 Fe % 3,13 0,32 3,01 0,01 0,040 Hf 3,52 0,25 3,3 0,01 0,067 K% 3,65 0,19 4,04 0,01 -0,097 La 22,8 1,9 21,09 0,16 0,081 Lu 0,29 0,02 0,3 0,02 -0,033 Na % 650 180 490 100 0,327 Nd Rb 95,30 8 113,5 2,2 -0,160 Sb 0,40 0,03 0,4 0,01 0,000 Sc 14,63 1,02 16,16 0,06 -0,095 Sm 4,94 0,50 4,27 0,06 0,157 Ta 0,69 0,14 0,63 0,07 0,095 Th 6,60 0,69 6,91 0,1 -0,045 U 2,57 0,38 2,17 0,05 0,184 Yb 1,98 0,15 2,02 0,11 -0,020 Zn 76,10 9,35 Element u result P% Result As 0,35 passed 13,7 passed Ba Ce 0,13 passed 13,5 passed Co 0,55 passed 10,2 passed Cr 0,01 passed 7,1 passed Cs 1,90 passed 5,8 passed Eu 0,41 passed 14,9 passed Fe % 0,37 passed 10,2 passed Hf 0,88 passed 7,1 passed La 0,88 passed 8,5 passed Lu 0,35 passed 9,6 passed Na % 0,78 passed 34,4 failed Nd Rb 2,25 passed 8,4 passed Sb 0,00 passed 7,9 passed Sc 1,50 passed 7,0 passed Sm 1,33 passed 10,2 passed Ta 0,38 passed 23,1 passed Th 0,44 passed 10,6 passed U 1,04 passed 15,0 passed Yb 0,22 passed 9,3 passed Zn Accuracy criteria (u-test acceptance): u<=3.29 Precision criteria: P<=25%
88

Tables.
Table 19. Zeuner’s results Zeuner's analysis of Qumran samples List of samples: 1. L 75 2. L75 3. L B2 4. Cistern 58 5. Lisan Marl Sample 5.Lisan Marl unleached leached Silica, clay minerals 41.7% 48.7% Limestone + dolomite dust 43.9% 51.3% Soluble salts 14.4% Sample CaCO3% MgCO3% CaSO4% silica+clay%
1. 14,8 16,9 0,3 68,0 2. 18,1 16,0 2,6 63,4 3. 64,4 16,7 0,9 18,0 4. 56,0 16,1 1,9 26,1
89

Tables.
Table 20. Chemical Groups of Qumran Pottery
I.
Local to Qumran II.
Hebron type MotzaIII.
Jericho IV.
Jordan connection V.
Jericho 2
Scroll jars 120, 132, 139, 156 115, 116, 117, 118, 198, 256 162, 163, 186, 187, 119, 122, 123, 124, 231, 240 125, 138, 153, 166, 164, 165, 199, 238, 245, 250, 255, 257 Store jars 121, 126, 127, 131 160, 184, 212, 241 234, 251, 267, 102 158 135, 136, 183, 210 236, 237, 276 142, 211, 284 265, 268, 284
Ovoid jars 133, 134 244 220, 239 237 242, 243
Lids 154, 161, 182 137, 246, 247, 248, 249, 279
Bowls 112, 190, 191, 213 173, 264, 188, 179 113, 170, 171, 172 180, 189, 269, 270 109, 253
263, 271, 151, 152 204, 253, 261, 262 275, 110, 111, 114 252 Jugs 203, 206, 207, 214 201, 202 216, 218, 266, 200 217 Cups 105, 106, 108, 273 107, 205, 258, 259, 272 260, 274
Various 193, 225, 150, 185 194, 228, 229 281, 283, 286, 290 266, 224
288, 289, 130, 150 291, 292 293, 294, 275
Ostraca 121, 134, 311, 312 120, 131, 212, 304 200, 203, 204, 205 201, 202 315 310, 313, 314, 318 206, 207, 211, 213 319, 320, 321 214, 216, 218, 220 309, 316, 308
90

Samples
List of samples QUM 100 Clay taken from Jericho brick QUM 101 Kiln inner lining L.84 QUM 102 Sherd from kiln make-up QUM 103 Kiln outer lining L.84 QUM 104 Kiln inner lining (other side of QUM 101) QUM 105 KHQ 1057 Cup L.59 QUM 106 KHQ 1055 Cup L.59 QUM 107 KHQ 1286 Cup L.65 QUM 108 KHQ 733 Cup L.39 lower floor, early QUM 109 KHQ 1624 Bowl, large, warped QUM 110 KHQ 1079 Bowl L.61 QUM 111 KHQ 1080 Bowl L.44 QUM 112 KHQ 1052 Bowl L.59 upper corner of L.44 QUM 113 KHQ 24 Bowl L.1 QUM 114 KHQ 1574-6 Decanter L.89 QUM 115 CAVE 8 Lump of clay on bottom of jar QUM 116 CAVE 8 Scroll jar of QUM 115 itself QUM 117 KHQ 27 Scroll jar L.2 QUM 118 KHQ 768 Scroll jar L.13 QUM 119 KHQ 764 Scroll jar L.13 QUM 120 KHQ 2553 Scroll jar L.124 QUM 121 KHQ 621 Jar with inscription L.34 QUM 122 CAVE 8 Scroll jar XVII (reddish fabric) QUM 123 CAVE 8 Scroll jar 11 (reddish fabric) QUM 124 CAVE 8 Scroll jar 3 (greyish fabric) QUM 125 CAVE 8 Scroll jar 1 QUM 126 KHQ 522 Silo QUM 127 KHQ 800 Funnel-filter L.45A QUM 128 KHQ 1301 Clay ball L.66 multiple perforation QUM 129 KHQ 2574 Clay ball L.131 whitish clay QUM 130 KHQ 2209 Clay ball L.130 reddish clay QUM 131 KHQ 1401 Jar with inscription in ink L.84 kiln QUM 132 CAVE GQ8 Scroll jar with blisters QUM 133 KHQ 1486 Ovoid jar L.81 QUM 134 CAVE 7Q6 Jar with ROMA inscription QUM 135 KHQ 49 Two handled cloche-storage jar L.4 QUM 136 KHQ 2107 Torpedo jar L.116 QUM 137 Q7 Bowl/lid on top of scroll jar QUM 138 Q7 Scroll jar as above, white wash QUM 139 GQ7 39 Scroll jar QUM 140 KHQ 2114 Real waster of pottery L.104 QUM 141 KHQ 2296 Oval lump oven lid L.130 QUM 142 KHQ 2045 Oval flat oven lid L.105 ins. oven QUM 143 KHQ 377 Round ball-like oven lid L.10A QUM 144 KHQ 2271 Round ball-like oven lid L.130 QUM 145 KHQ 1669 Oven cover with handle
91

Samples
QUM 146 KHQ 130 Roof stucco QUM 147 KHQ 376 Cover of oven L.10A QUM 148 KHQ 2622 40cm vat with fingerpierced handles QUM 149 KHQ 2465 Large handle QUM 150 KHQ 2046 Lid from oven lid+hillshaped handle L.105 QUM 151 KHQ 638 Miniature footbath lid L.31 QUM 152 KHQ 1139 Oval lid with bas. Relief cut handle QUM 153 GQ 29-25 Scroll jar QUM 154 GQ8 Q7 347742 Lid of scroll jar QUM 155 11 Q13 Chalcolitic crude pot (fishgrade design) QUM 156 KHQ 2504 Storage jar QUM 157 CAVE 11 „Negev” S-shape + fingerpr. Rim QUM 158 Feshka 256 Storage jar (Villa Locus 5.) QUM 159 GQ 29-22 Scroll jar QUM 160 KHQ 1492 Small scroll jar & lid L.81 QUM 161 KHQ 1466 Lid with 4 pierced handles L.80 QUM 162 KHQ 1465 Small scroll jar with 4 pierced handles QUM 163 GQ 39-1 Large scroll jar QUM 164 GQ8 Large scroll jar QUM 165 KHQ 2561A (2661A) larger scroll jar L.120 QUM 166 Q 39-7 Scroll jar QUM 167 Kiln lining QUM 168 KHQ 2050 Cooking pot carinated shoulder L.101 QUM 169 KHQ 2342 Cooking pot large L.130 QUM 170 KHQ 365 Pseudo Nabatean base QUM 171 KHQ 2611 Pseudo Nabatean base QUM 172 KHQ 501 Pseudo Nabatean dish L.28 QUM 173 Ein Feshka 203 Pseudo Nabatean base QUM 174 KHQ 891 Small bowl red slip buff circ. On red slip QUM 175 KHQ Scriptorium table large mortar piece QUM 176 KHQ Scriptorium table small mortar piece QUM 177 KHQ Scriptorium yellow inner clay mould of QUM 175 QUM 178 KHQ Scriptorium grey clay mold of QUM 175 QUM 179 KHQ 2576 Incurved low dish L.28 QUM 180 KHQ 2577 Incurved low dish L.28 QUM 181 KHQ Bitumenous rock from Qumran quarry QUM 182 KHQ 2463 Lid paint + brown paint L.100 fill QUM 183 KHQ 2091 Jar for 182 painted+pierced holes L.115 QUM 184 KHQ 2507 Small jar 25cm round base carinated shoulder QUM 185 KHQ 2596-1 Small juglet(Afarsimon) buff L.114 deposit QUM 186 GQ8:11 Highest scroll jar QUM 187 KHQ 2548 Small scroll jar QUM 188 KHQ 2591-2Deep small bowl L.114 of JB QUM 189 KHQ 2600-2 Deep small bowl L.114 of JB QUM 190 KHQ 1620 Carinated dish as NABPF no paint L.40 QUM 191 KHQ 1621 Carinated dish as NABPF no paint L.40 QUM 192 KHQ 2595 High pinch rim dish L.114 JB QUM 193 Ein Feshka 15 Inkwell QUM 194 KHQ2093 „Herodian” lamp with two crc on nozzle L.115 QUM 195 KHQ 2265 Cooking pot red upstanding rim
92
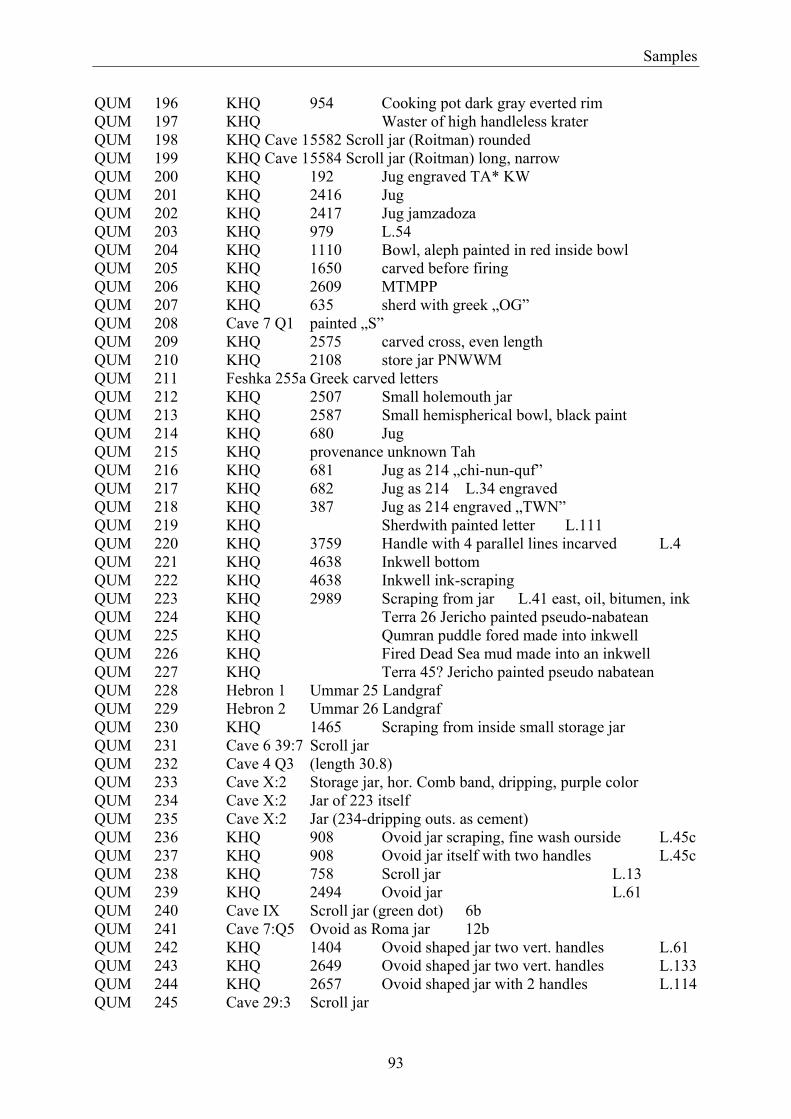
Samples
QUM 196 KHQ 954 Cooking pot dark gray everted rim QUM 197 KHQ Waster of high handleless krater QUM 198 KHQ Cave 1 5582 Scroll jar (Roitman) rounded QUM 199 KHQ Cave 1 5584 Scroll jar (Roitman) long, narrow QUM 200 KHQ 192 Jug engraved TA* KW QUM 201 KHQ 2416 Jug QUM 202 KHQ 2417 Jug jamzadoza QUM 203 KHQ 979 L.54 QUM 204 KHQ 1110 Bowl, aleph painted in red inside bowl QUM 205 KHQ 1650 carved before firing QUM 206 KHQ 2609 MTMPP QUM 207 KHQ 635 sherd with greek „OG” QUM 208 Cave 7 Q1 painted „S” QUM 209 KHQ 2575 carved cross, even length QUM 210 KHQ 2108 store jar PNWWM QUM 211 Feshka 255a Greek carved letters QUM 212 KHQ 2507 Small holemouth jar QUM 213 KHQ 2587 Small hemispherical bowl, black paint QUM 214 KHQ 680 Jug QUM 215 KHQ provenance unknown Tah QUM 216 KHQ 681 Jug as 214 „chi-nun-quf” QUM 217 KHQ 682 Jug as 214 L.34 engraved QUM 218 KHQ 387 Jug as 214 engraved „TWN” QUM 219 KHQ Sherdwith painted letter L.111 QUM 220 KHQ 3759 Handle with 4 parallel lines incarved L.4 QUM 221 KHQ 4638 Inkwell bottom QUM 222 KHQ 4638 Inkwell ink-scraping QUM 223 KHQ 2989 Scraping from jar L.41 east, oil, bitumen, ink QUM 224 KHQ Terra 26 Jericho painted pseudo-nabatean QUM 225 KHQ Qumran puddle fored made into inkwell QUM 226 KHQ Fired Dead Sea mud made into an inkwell QUM 227 KHQ Terra 45? Jericho painted pseudo nabatean QUM 228 Hebron 1 Ummar 25 Landgraf QUM 229 Hebron 2 Ummar 26 Landgraf QUM 230 KHQ 1465 Scraping from inside small storage jar QUM 231 Cave 6 39:7 Scroll jar QUM 232 Cave 4 Q3 (length 30.8) QUM 233 Cave X:2 Storage jar, hor. Comb band, dripping, purple color QUM 234 Cave X:2 Jar of 223 itself QUM 235 Cave X:2 Jar (234-dripping outs. as cement) QUM 236 KHQ 908 Ovoid jar scraping, fine wash ourside L.45c QUM 237 KHQ 908 Ovoid jar itself with two handles L.45c QUM 238 KHQ 758 Scroll jar L.13 QUM 239 KHQ 2494 Ovoid jar L.61 QUM 240 Cave IX Scroll jar (green dot) 6b QUM 241 Cave 7:Q5 Ovoid as Roma jar 12b QUM 242 KHQ 1404 Ovoid shaped jar two vert. handles L.61 QUM 243 KHQ 2649 Ovoid shaped jar two vert. handles L.133 QUM 244 KHQ 2657 Ovoid shaped jar with 2 handles L.114 QUM 245 Cave 29:3 Scroll jar
93

Samples
QUM 246 Cave 7-1 Lid scroll jar, red ware 1 QUM 247 Cave 12-5 Lid scroll jar, grey ware QUM 248 Cave 3-5 Lid scroll jar QUM 249 Cave 8-15 Lid scroll jar grey ware QUM 250 Cave 28-1 Scroll jar with blisters QUM 251 KHQ 1239 Store jar QUM 252 KHQ 1601 Small deep hemisph. bowl L.89 QUM 253 KHQ 1601 Small deep hemisph. bowl L.89 QUM 254 KHQ 2563 Afaesimon Juglet QUM 255 Cave 29-24 Scroll jar in 6a QUM 256 Cave 3-1 Scroll jar in 6c QUM 257 KHQ 42 Scroll jar 4 small vert. handles L.2 QUM 258 KHQ 1587 Cup 11a L.89 QUM 259 KHQ 1587 Cup 11b L.89 QUM 260 KHQ 1587 Cup 11c L.89 QUM 261 KHQ 1591 Dish 10a L.89 QUM 262 KHQ 16 Sharp carinated dish flat base L.1 QUM 263 KHQ 795 Sharp carinated dish flat base L.45 QUM 264 Cave 8 Q8 Hemispherical bowl stringcut base QUM 265 KHQ 1627 Outflaring jar without handles L.91 QUM 266 KHQ 1237 Lagynos QUM 267 Cave 001 Jar with two loop handles QUM 268 KHQ 917 Store jar with 4 piercing L.44 QUM 269 KHQ Q4 Small platter stringcut base L.1 QUM 270 Cave 31-3 Small hemisph. bowl QUM 271 Cave 1 Q1 Hemisph. bowl QUM 272 KHQ 1270 Large cup, ringbase L.65 QUM 273 KHQ 216 Small cup, stringcut L.8 QUM 274 KHQ 1050 Large cup, ringbase L.59 QUM 275 KHQ 179 Platter(very flat) QUM 276 KHQ 1452 Funnel&soot&clean piece L.86 QUM 277 Cave 8 Q11 Lid, sharp carination QUM 278 Cave 3 Lid (had before) QUM 279 KHQ 3000 Lid rounded with purple dye QUM 280 KHQ 3000 Scraping of purple. Mercury? QUM 281 KHQ 582 Long pipe QUM 282 Jericho bowl 28 QUM 283 Jericho bowl 29 QUM 284 Large storage jar QUM 285 Bituminous limestone QUM 286 KHQ Q43 Oil lamp Cave 1 QUM 287 KHQ 10151 Hellenistic lamp L.44 QUM 288 KHQ 1009 Bowl QUM 289 KHQ 5084 Lamp L.62 QUM 290 KHQ 5085 Lamp L.66 QUM 291 KHQ 2206 Hellenistic lamp L.130 QUM 292 KHQ 5087 Lamp L.130 QUM 293 KHQ 2093 Herodian lamp QUM 294 KHQ q2541 Herodian lamp QUM 295 Ez-Zara L.043/682 balsam juglet
94

Samples
QUM 296 Ez-zara L. 206/96 balsam juglet QUM 297 Ez-Zara L. 114/104 balsam juglet QUM 298 Ez-Zara L.329/435 balsam juglet QUM 299 Ez-Zara L. 336/483 cream ware bowl (white ware) QUM 300 Ez-Zara L. 202/24 cream ware bowl (white ware) QUM 301 KHQ Scraping inside pipe L.51 QUM 302 KHQ Pipe itself L.51 QUM 303 KHQ 935 Jar with shin inscribed before firing QUM 304 Cave 6Q1 Ovoid jar with inscription in ink QUM 305 No.11 Pipe cistern 110 (dark grey soil) QUM 306 No. 11 Pipe deposit at inside of round cistern 110 QUM 307 KHQ 2419 Funnel vessel, white ware QUM 308 KHQ 461 Grafitto QUM 309 KHQ 711 Grafitto QUM 310 KHQ 1236 Grafitto QUM 311 KHQ 2556 Grafitto QUM 312 KHQ 386 Grafitto QUM 313 KHQ 425 Grafitto QUM 314 KHQ Grafitto QUM 315 KHQ 2176 Grafitto QUM 316 KHQ 426 Grafitto QUM 317 KHQ 734 Grafitto QUM 318 KHQ 2554 Grafitto QUM 319 KHQ 1313 Grafitto QUM 320 KHQ 2109 Grafitto QUM 321 KHQ 2125 Grafitto QUM 322 Roof tile, Legio X Fretensis QUM 323 Curved roof tile QUM 324 Aquaba city kiln waster QUM 325 Other sample of QUM 324
95

List of figures
List of figures FIGURE 1:CILYNDRICAL SCROLL JAR WITH LID (DAVIES 2002)............................................................. 4 FIGURE 2 : HORIZONTAL CROSS SECTION OF THE CORE OF THE NUCLEAR REACTOR AT THE
INSTITUTE OF NUCLEAR TECHNIQES................................................................................................ 30 FIGURE 3 PARZEN-ROSENBLATT DENSITY FUNCTION IN PRINCIPAL COMPONENT SUBSPACE . 42FIGURE 4 QUMRAN SETTLEMENT................................................................................................................ 44 FIGURE 5 ARCHAEOLOGICAL SITES AROUND THE DEAD SEA (BEIT-ARIEH 1997).......................... 45 FIGURE 6 CAVE 1 (DAVIES 2002) ................................................................................................................... 46 FIGURE 7 PLAN OF THE KHIRBET QUMRAN (GUNNEWEG 2003)........................................................... 47 FIGURE 8 THE “CROCKERY” AT L.89. (MAGNESS 2002) ........................................................................... 48 FIGURE 9 CAVE 4. ............................................................................................................................................. 49 FIGURE 10 SROLL JARS AT QUMRAN EXHIBITION .................................................................................. 55 FIGURE 11 MAP OF THE SITES (GUNNEWEG 2003).................................................................................... 57 FIGURE 12 CHEMICAL GROUPS OF QUMRAN POTTERY SAMPLES ...................................................... 60 FIGURE 13 DISHES IN LOCUS 114 (MAGNESS 2002)................................................................................... 66 FIGURE 14 THE ROMA JAR QUM 134 (LEMAIRE 2003) .............................................................................. 67 FIGURE 15 THE “ROMA INSRIPTION” (LEMAIRE 2003)............................................................................. 67 FIGURE 16 THE EDOMJUG QUM 201 LEMAIRE 2003................................................................................. 68
96

Elemental data
Elemental data QUMRAN SAMPLES Concentrations in ppm
100 101 102 103 104 105 106 107
As 9.4±0.2 12.6±0.3 9.6±0.3 7.9±0.3 11.1±0.22 5.9±0.2 7.6±0.3 9.3±0.4 Ba 285±26 246±37 460±46 307±43 233±30 284±48 Br 15±0.2 16±1 34±0.4 27±1 17±0.3 7.1±0.2 8.5±0.3 11.4±0.3 Ce 49.6±1.0 45.8±0.9 79.3±1.6 40.2±1.2 47.6±1.0 62.3±2.0 61.5±1.2 71.0±2.0 Co 11.2±0.2 11.5±0.4 13.5±0.4 9.3±0.4 10.9±0.3 12.8±0.4 10.6±0.6 14.9±0.5 Cs 2.55±0.13 0.6±0.09 2.0±0.2 3.87±0.27 4.26±0.3 3.61±0.3 Cr 88.9±1.8 164±3 157±3 133±3 190±4 111±2 121±4 163±3 Eu 0.92±0.06 0.89±0.07 1.82±0.1 0.89±0.1 1.0±0.1 1.4±0.1 1.49±0.1 1.56±0.11
Fe% 2.59±0.03 2.68±0.05 4.87±0.05 2.03±0.04 2.84±0.03 3.74±0.04 4.32±0.04 4.76±0.05Hf 4.2±0.1 4.1±0.2 7.5±0.2 3.9±0.2 4.06±0.16 5.02±0.2 5.2±0.3 7.24±0.3
K% 0.86±0.1 1.03±0.1 1.98±0.1 1.11±0.1 0.72±0.06 2.10±0.10 2.4±0.12 2.08±0.15La 23.2±0.1 22±1 37.7±0.4 20.8±0.2 24.6±0.3 25.6±0.3 28.0±0.3 32.5±0.3 Lu 0.23±0.01 0.27±0.01 0.39±0.02 0.27±0.01 0.31±0.01 0.34±0.01 0.35±0.01 0.39±0.01Mo
Na% 0,299±0.001 0,062±0.001 0,999±0.001 0,462±0.001 0.47±0.01 0.476±0.01 0.46±0.01 0.76±0.01Nd 18±4 21±3 24±4 12±3 21±4 Rb 36.9±4.1 50.7±7.1 86.0±7.0 91±9 63±10 Sb 1.38±0.03 1.11±0.04 0.7±0.05 0.91±0.05 1.29±0.04 0.35±0.03 0.54±0.04 0.74±0.05Sc 8.4±0.1 8.7±0.1 14.6±0.2 6.60±0.1 8.63±0.1 16.3±0.1 16.5±0.1 14.9±0.2 Se 4.4±0.9 6.1±1.4 3.95±0.8 2.8±1 2.54±0.8 6.4±1.3 Sm 4.96±0.1 4.97±0.1 8.03±0.1 4.33±0.1 5.39±0.1 6.43±0.1 6.78±0.1 6.67±0.07Ta 0.72±0.1 0.71±0.09 1.33±0.12 0.61±0.09 1.0±0.1 1.13±0.14Tb 0.78±0.1 0.91±0.1 0.93±0.16 0.7±0.1 0.57±0.12 1.06±0.20Th 5.55±0.11 5.03±0.2 8.9±0.3 5.5±0.2 5.85±0.18 8.2±0.2 8.26±0.25 8.83±0.26U 6.9±0.1 11.3±0.2 3.1±0.2 9.9±0.3 11.8±0.2 3.7±0.2 3.61±0.22 3.92±0.27
Yb 1.696±0.05 1.91±0.04 2.89±0.09 1.85±0.09 1.98±0.06 2.41±0.1 2.5±0.1 2.83±0.06Zn 90±5 250±8 177±9 169±8 300±10 75±6 108±8 142±8
97

Elemental data
QUMRAN SAMPLES Concentrations in ppm
108 109 110 111 112 113 114 115
As 7.9±0.3 10.1±0.3 9.3±0.4 9.4±0.3 5.8±0.4 9.4±0.4 7.8±0.4 5.6±0.2 Ba 1170±120 230±32 357±36 271±30 300±30 256±36 Br 9.7±0.3 10.2±0.3 17.2±0.3 7.7±0.2 33.2±0.3 21±1 14.6±0.5 15.5±0.2 Ce 64.4±1.3 75.0±1.5 71.1±1.4 74.5±1.5 57.3±1.2 75.7±0.8 68.5±1.4 57.8±1.2 Co 10.2±0.3 15.0±0.3 14.8±0.4 15.4±0.3 10.4±0.4 15.1±0.3 13.6±0.3 17.3±0.4 Cs 3.6±0.3 3.72±0.26 3.28±0.26 4.12±0.25 4.81±0.2 3.98±0.24 1.86±0.13 6.7±0.3 Cr 112±2 158±3 153±3 168±4 99.0±2.0 153±3 146±3 97.0±3.0 Eu 1.36±0.1 1.47±0.07 1.77±0.10 1.76±0.07 1.40±0.07 1.64±0.08 1.58±0.05 1.34±0.10
Fe% 4.13±0.04 5.13±0.05 4.92±0.05 5.19±0.05 3.87±0.04 5.10±0.05 4.63±0.05 4.22±0.04Hf 4.87±0.19 6.34±0.19 6.12±0.24 6.0±0.2 4.76±0.19 5.36±0.16 6.64±0.13 3.95±0.28
K% 2.25±0.11 2.29±0.14 2.20±0.15 2.06±0.12 2.51±0.18 1.98±0.14 2.24±0.2 3.54±0.11La 28.2±0.2 36.3±0.3 36.0±0.2 37.7±0.3 26.6±0.2 35.9±0.3 33.2±0.3 26.9±0.3 Lu 0.35±0.01 0.4±0.02 0.35±0.03 0.41±0.02 0.34±0.02 0.41±0.02 0.35±0.02 0.29±0.01Mo 3.3±0.7
Na% 0.54±0.01 0.83±0.01 0.71±0.01 0.57±0.01 0.86±0.01 0.55±0.01 1.19±0.01 0.42±0.01Nd 24±4 27±4 25±4 34±5 18±3 28±4 23±3 16±2 Rb 80±7 66±7 71±9 77±8 78±7 79±7 49±7 116±8 Sb 0.52±0.1 0.57±0.04 0.63±0.04 0.89±0.13 0.42±0.04 0.62±0.04 0.72±0.05 0.52±0.03Sc 16.2±0.1 17.1±0.1 16.5±0.1 17.4±0.1 15.9±0.1 16.6±0.1 14.4±0.1 16.7±0.1 Se 3.2±0.9 2.2±1 2.1±0.6 3.9±1.1 Sm 6.82±0.1 7.77±0.1 7.85±0.1 8.12±0.1 6.56±0.1 7.98±0.1 7.30±0.1 5.59±0.1 Ta 0.76±0.08 1.28±0.10 1.0±0.1 1.08±0.10 0.64±0.10 1.24±0.10 1.14±0.07 0.77±0.09Tb 0.87±0.12 0.94±0.14 0.99±0.14 0.97±0.13 0.85±0.12 0.75±0.13 0.99±0.09 0.92±0.16Th 8.10±0.16 9.42±0.19 8.65±0.26 8.93±0.09 7.16±0.21 8.88±0.18 8.06±0.16 7.56±0.23U 3.17±0.19 4.04±0.2 3.68±0.22 4.39±0.22 3.33±0.2 3.89±0.19 3.69±0.26 2.94±0.21
Yb 2.49±0.07 2.79±0.03 3.08±0.03 3.25±0.06 2.52±0.08 2.96±0.06 2.67±0.05 1.99±0.08Zn 106±10 133±8 141±6 165±5 76±8 161±8 129±6 68±8
98

Elemental data
QUMRAN SAMPLES Concentrations in ppm
116 117 118 119 120 121 122 123
As 5.8±0.2 8.1±0.2 7.2±0.2 14.8±0.2 7.2±0.4 7.6±0.2 5.97±0.24 5.9±0.2 Ba Br 12.7±0.3 17.3±0.2 9.2±0.2 9.05±0.18 16±5 14.8±0.2 4.45±0.22 6.5±0.2 Ce 58.3±1.2 65.1±0.7 60.2±1.2 52.5±1.0 53.3±1.6 68.5±1.4 55.9±1.7 56.8±1.1 Co 18.5±0.4 17.1±0.3 18.8±0.4 17.8±0.4 14.4±0.6 13.6±0.4 19.7±0.4 18.1±0.4 Cs 6.15±0.31 2.94±0.23 4.92±0.25 4.49±0.22 3.13±0.41 3.95±0.28 6.30±0.31 6.26±0.31Cr 108±3 107±2 110±2 120±2 88±4 119±4 102±3 104±3 Eu 1.15±0.07 1.37±0.07 1.22±0.07 1.32±0.07 1.18±0.13 1.64±0.10 1.17±0.08 1.18±0.08
Fe% 4.42±0.04 4.48±0.05 4.57±0.05 4.37±0.04 4.18±0.08 4.46±0.05 4.47±0.05 4.40±0.04Hf 4.63±0.23 5.02±0.2 4.02±0.2 4.54±0.18 4.35±0.39 6.24±0.31 4.15±0.25 4.26±0.26
K% 3.38±0.10 3.19±0.1 3.77±0.11 2.34±0.1 1.40±0.15 2.51±0.15 3.70±0.18 3.47±0.17La 27.0±0.22 28.1±0.2 25.1±0.2 22.6±0.2 26.7±4 28.2±0.3 27.1±0.3 26.9±0.3 Lu 0.32±0.01 0.34±0.01 0.33±0.01 0.33±0.01 0.27±0.03 0.34±0.01 0.32±0.02 0.30±0.01Mo 3.8±1.0 7.6±0.9 4.8±0.9 4.8±1.2 3±1 6.6±1.1 4.1±0.9 1.6±0.5
Na% 0.96±0.01 0.80±0.01 0.69±0.01 1.08±0.01 0.66±0.01 0.66±0.01 0.52±0.01 0.41±0.01Nd 13±2 12±3 16±4 14±3 18±5 18±5 18±5 Rb 120±10 72±8 104±8 69±8 65±8 95±10 112±10 Sb 0.5±0.03 0.59±0.03 0.56±0.03 0.67±0.03 0.39±0.05 0.7±0.03 0.56±0.04 0.50±0.03Sc 17.6±0.1 16.0±0.1 18.1±0.1 18.3±0.1 16.8±0.1 16.9±0.2 17.9±0.1 17.6±0.2 Se Sm 5.51±0.1 6.13±0.1 5.48±0.1 5.36±0.1 5.43±0.1 6.56±0.1 5.43±0.1 5.22±0.1 Ta 1.46±0.12 1.78±0.11 0.98±0.10 0.81±0.10 0.86±0.11 0.94±0.11 0.86±0.09Tb 1.17±0.14 0.83±0.16 0.87±0.14 0.97±0.16 Th 7.29±0.22 7.58±0.23 8.07±0.24 6.36±0.19 6.86±0.34 7.46±0.22 7.61±0.23 7.18±0.22U 2.19±0.2 4.18±0.21 3.26±0.2 2.13±0.15 2.32±0.35 3.76±0.26 3.04±0.24 2.51±0.23
Yb 2.25±0.14 2.54±0.08 2.19±0.11 2.24±0.07 2.12±0.11 2.71±0.08 2.30±0.05 2.27±0.09Zn 108±11 123±14 87±10 113±14 98±13 120±17 72±10
99
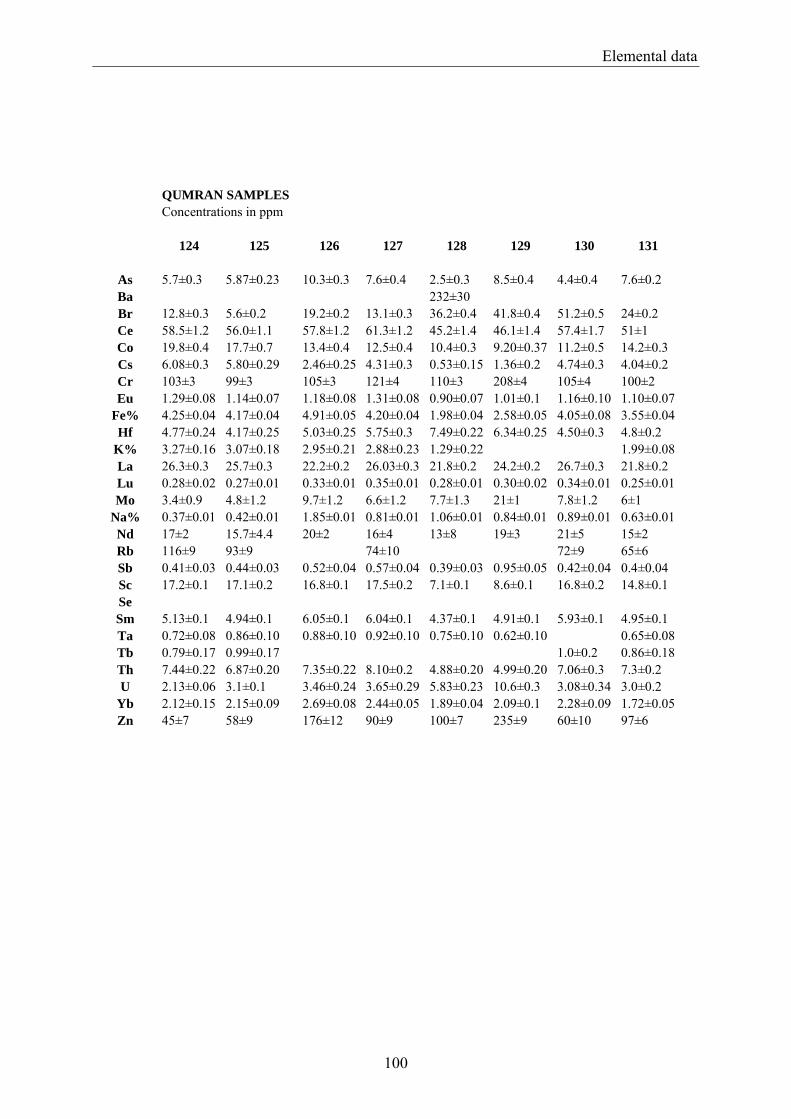
Elemental data
QUMRAN SAMPLES Concentrations in ppm
124 125 126 127 128 129 130 131
As 5.7±0.3 5.87±0.23 10.3±0.3 7.6±0.4 2.5±0.3 8.5±0.4 4.4±0.4 7.6±0.2 Ba 232±30 Br 12.8±0.3 5.6±0.2 19.2±0.2 13.1±0.3 36.2±0.4 41.8±0.4 51.2±0.5 24±0.2 Ce 58.5±1.2 56.0±1.1 57.8±1.2 61.3±1.2 45.2±1.4 46.1±1.4 57.4±1.7 51±1 Co 19.8±0.4 17.7±0.7 13.4±0.4 12.5±0.4 10.4±0.3 9.20±0.37 11.2±0.5 14.2±0.3 Cs 6.08±0.3 5.80±0.29 2.46±0.25 4.31±0.3 0.53±0.15 1.36±0.2 4.74±0.3 4.04±0.2 Cr 103±3 99±3 105±3 121±4 110±3 208±4 105±4 100±2 Eu 1.29±0.08 1.14±0.07 1.18±0.08 1.31±0.08 0.90±0.07 1.01±0.1 1.16±0.10 1.10±0.07
Fe% 4.25±0.04 4.17±0.04 4.91±0.05 4.20±0.04 1.98±0.04 2.58±0.05 4.05±0.08 3.55±0.04Hf 4.77±0.24 4.17±0.25 5.03±0.25 5.75±0.3 7.49±0.22 6.34±0.25 4.50±0.3 4.8±0.2
K% 3.27±0.16 3.07±0.18 2.95±0.21 2.88±0.23 1.29±0.22 1.99±0.08La 26.3±0.3 25.7±0.3 22.2±0.2 26.03±0.3 21.8±0.2 24.2±0.2 26.7±0.3 21.8±0.2 Lu 0.28±0.02 0.27±0.01 0.33±0.01 0.35±0.01 0.28±0.01 0.30±0.02 0.34±0.01 0.25±0.01Mo 3.4±0.9 4.8±1.2 9.7±1.2 6.6±1.2 7.7±1.3 21±1 7.8±1.2 6±1
Na% 0.37±0.01 0.42±0.01 1.85±0.01 0.81±0.01 1.06±0.01 0.84±0.01 0.89±0.01 0.63±0.01Nd 17±2 15.7±4.4 20±2 16±4 13±8 19±3 21±5 15±2 Rb 116±9 93±9 74±10 72±9 65±6 Sb 0.41±0.03 0.44±0.03 0.52±0.04 0.57±0.04 0.39±0.03 0.95±0.05 0.42±0.04 0.4±0.04 Sc 17.2±0.1 17.1±0.2 16.8±0.1 17.5±0.2 7.1±0.1 8.6±0.1 16.8±0.2 14.8±0.1 Se Sm 5.13±0.1 4.94±0.1 6.05±0.1 6.04±0.1 4.37±0.1 4.91±0.1 5.93±0.1 4.95±0.1 Ta 0.72±0.08 0.86±0.10 0.88±0.10 0.92±0.10 0.75±0.10 0.62±0.10 0.65±0.08Tb 0.79±0.17 0.99±0.17 1.0±0.2 0.86±0.18Th 7.44±0.22 6.87±0.20 7.35±0.22 8.10±0.2 4.88±0.20 4.99±0.20 7.06±0.3 7.3±0.2 U 2.13±0.06 3.1±0.1 3.46±0.24 3.65±0.29 5.83±0.23 10.6±0.3 3.08±0.34 3.0±0.2
Yb 2.12±0.15 2.15±0.09 2.69±0.08 2.44±0.05 1.89±0.04 2.09±0.1 2.28±0.09 1.72±0.05Zn 45±7 58±9 176±12 90±9 100±7 235±9 60±10 97±6
100
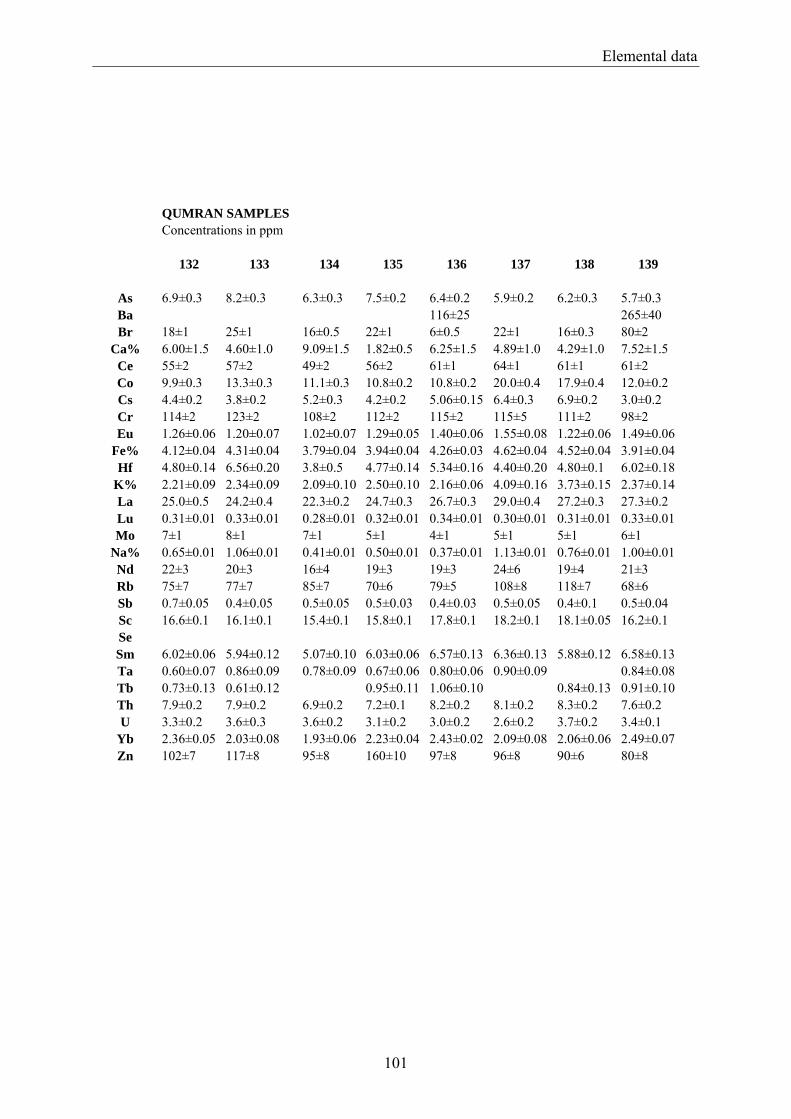
Elemental data
QUMRAN SAMPLES Concentrations in ppm
132 133 134 135 136 137 138 139
As 6.9±0.3 8.2±0.3 6.3±0.3 7.5±0.2 6.4±0.2 5.9±0.2 6.2±0.3 5.7±0.3 Ba 116±25 265±40 Br 18±1 25±1 16±0.5 22±1 6±0.5 22±1 16±0.3 80±2
Ca% 6.00±1.5 4.60±1.0 9.09±1.5 1.82±0.5 6.25±1.5 4.89±1.0 4.29±1.0 7.52±1.5 Ce 55±2 57±2 49±2 56±2 61±1 64±1 61±1 61±2 Co 9.9±0.3 13.3±0.3 11.1±0.3 10.8±0.2 10.8±0.2 20.0±0.4 17.9±0.4 12.0±0.2 Cs 4.4±0.2 3.8±0.2 5.2±0.3 4.2±0.2 5.06±0.15 6.4±0.3 6.9±0.2 3.0±0.2 Cr 114±2 123±2 108±2 112±2 115±2 115±5 111±2 98±2 Eu 1.26±0.06 1.20±0.07 1.02±0.07 1.29±0.05 1.40±0.06 1.55±0.08 1.22±0.06 1.49±0.06
Fe% 4.12±0.04 4.31±0.04 3.79±0.04 3.94±0.04 4.26±0.03 4.62±0.04 4.52±0.04 3.91±0.04Hf 4.80±0.14 6.56±0.20 3.8±0.5 4.77±0.14 5.34±0.16 4.40±0.20 4.80±0.1 6.02±0.18
K% 2.21±0.09 2.34±0.09 2.09±0.10 2.50±0.10 2.16±0.06 4.09±0.16 3.73±0.15 2.37±0.14La 25.0±0.5 24.2±0.4 22.3±0.2 24.7±0.3 26.7±0.3 29.0±0.4 27.2±0.3 27.3±0.2 Lu 0.31±0.01 0.33±0.01 0.28±0.01 0.32±0.01 0.34±0.01 0.30±0.01 0.31±0.01 0.33±0.01Mo 7±1 8±1 7±1 5±1 4±1 5±1 5±1 6±1
Na% 0.65±0.01 1.06±0.01 0.41±0.01 0.50±0.01 0.37±0.01 1.13±0.01 0.76±0.01 1.00±0.01Nd 22±3 20±3 16±4 19±3 19±3 24±6 19±4 21±3 Rb 75±7 77±7 85±7 70±6 79±5 108±8 118±7 68±6 Sb 0.7±0.05 0.4±0.05 0.5±0.05 0.5±0.03 0.4±0.03 0.5±0.05 0.4±0.1 0.5±0.04 Sc 16.6±0.1 16.1±0.1 15.4±0.1 15.8±0.1 17.8±0.1 18.2±0.1 18.1±0.05 16.2±0.1 Se Sm 6.02±0.06 5.94±0.12 5.07±0.10 6.03±0.06 6.57±0.13 6.36±0.13 5.88±0.12 6.58±0.13Ta 0.60±0.07 0.86±0.09 0.78±0.09 0.67±0.06 0.80±0.06 0.90±0.09 0.84±0.08Tb 0.73±0.13 0.61±0.12 0.95±0.11 1.06±0.10 0.84±0.13 0.91±0.10Th 7.9±0.2 7.9±0.2 6.9±0.2 7.2±0.1 8.2±0.2 8.1±0.2 8.3±0.2 7.6±0.2 U 3.3±0.2 3.6±0.3 3.6±0.2 3.1±0.2 3.0±0.2 2.6±0.2 3.7±0.2 3.4±0.1
Yb 2.36±0.05 2.03±0.08 1.93±0.06 2.23±0.04 2.43±0.02 2.09±0.08 2.06±0.06 2.49±0.07Zn 102±7 117±8 95±8 160±10 97±8 96±8 90±6 80±8
101

Elemental data
QUMRAN SAMPLES Concentrations in ppm
140 141 142 143 144 145 146 147
As 13±1 4.1±0.3 7.0±0.1 4.1±0.2 6.0±0.2 5.6±0.5 4.9±0.2 2.4±0.1 Ba 280±20 660±30 100±18 Br 16±1 84±2 48±1 82±1 36±1 40±1 39±1 40±0.5
Ca% 21±5 12.5±2 37.9±5.0 30.2±5.0 14.3±3.0 26.8±3.0 39.7±5.0 Ce 97±2 32±2 65±2 12.7±0.3 27.5±0.8 76.9±1.5 26.1±0.5 12.3±0.3 Co 26.8±0.3 7.4±0.3 12.8±0.4 2.01±0.08 5.35±0.27 16.2±0.5 5.42±0.11 2.19±0.09 Cs 2.16±0.11 2.5±0.3 2.56±0.23 1.87±0.28 0.8±0.07 0.2±0.03 Cr 115±2 115±2 140±3 163±2 130±3 167±3 115±2 141±1 Eu 1.62±0.03 0.84±0.07 1.30±0.08 0.34±0.02 0.54±0.06 1.33±0.09 0.62±0.03 0.37±0.03
Fe% 6.13±0.02 1.89±0.04 3.89±0.04 0.41±0.01 2.03±0.04 4.47±0.05 1.49±0.01 0.37±0.04 Hf 12.6±0.1 4.64±0.19 8.18±0.25 0.47±0.05 1.88±0.17 8.81±0.26 3.4±0.1 8.9±0.2
K% 0.92±0.04 1.09±0.09 2.07±0.15 0.25±0.03 1.47±0.12 1.51±0.17 0.59±0..05 0.29±0.045La 41.2±0.2 17.0±0.2 32.7±0.3 9.4±0.1 14.8±0.2 37.1±0.4 14.7±0 9.6±0.1 Lu 0.44±0.01 0.37±0.01 0.15±0.01 0.17±0.02 0.43±0.02 0.19±0.01 0.17±0.01 Mo 67±2 14±1 19±1 15±2 18±2 13±1 17±2
Na% 0.56±0.01 1.05±0.01 1.35±0.01 0.30±0.02 0.40±0.02 1.62±0.01 0.35±0.01 0.248±0.10Nd Rb 45±4 58±8 50±6 48±8 16±3 Sb 0.78±0.08 0.47±0.05 0.8±0.06 0.72±0.03 0.6±0.02 0.7±0.1 0.48±0.02 Sc 15.0±0.1 6.12±0.06 13.3±0.13 2.42±0.03 8.01±0.08 13.27±0.13 4.83±0.02 2.39±0.02 Se 4.0±0.6 3.8±0.4 3±1 Sm 8.26±0.17 3.48±0.10 6.66±0.13 1.87±0.09 2.60±0.08 7.34±0.22 3.06±0.09 2.03±0.1 Ta 1.7±0.05 0.52±0.08 0.97±0.11 1.06±0.13 0.37±0.04 Tb 1.12±0.07 0.44±0.10 1.07±0.15 0.20±0.03 0.99±0.16 0.39±0.05 0.23±0.08 Th 10.8±0.2 3.75±0.15 7.30±0.22 0.91±0.04 4.3±0.2 8.3±0.3 3.10±0.1 0.81±0.05 U 4.1±0.1 4.8±0.2 4.6±0.3 11.8±0.2 2.89±0.26 4.6±0.4 7.5±0.08 12.9±0.1
Yb 3.15±0.03 1.43±0.10 2.62±0.1 0.97±0.04 1.0±0.1 3.37±0.13 1.31±0.04 1.08±0.04 Zn 110±7 143±9 149±9 207±5 121±8 150±7 134±8
102

Elemental data
QUMRAN SAMPLES Concentrations in ppm
148 149 150 151 152 153 154 155
As 7.2±0.3 5.4±0.5 8.6±0.8 7.6±0.5 14±1 6.5±0.4 5.9±0.5 8.5±0.3 Ba 360±30 310±30 Br 43±1 22±1 34±1 65±2 36±2 25±1 29±1 44±1
Ca% 10.02±2.0 12.9±2.0 11.2±1.5 9.6±2.0 10.7±2.0 3.72±1.0 8.23±1.5 3.85±1.0 Ce 64±2 66±1 65±1 56±2 53±2 60±2 54±2 90±2 Co 16.6±0.3 13.3±0.1 11.2±0.5 11.6±0.4 12.7±0.4 18.0±0.4 11.9±0.4 16.0±0.3 Cs 2.0±0.2 1.94±0.16 4.0±0.3 2.9±0.2 3.1±0.3 7.2±0.2 4.7±0.3 4.1±0.2 Cr 125±3 126±3 142±4 109±2 123±3 113±3 111±2 97±2 Eu 1.32±0.05 1.30±0.06 1.97±0.14 1.31±0.08 1.22±0.07 1.35±0.07 1.21±0.08 1.10±0.04
Fe% 3.87±0.04 3.37±0.04 3.81±0.08 3.51±0.04 4.15±0.04 4.58±0.04 4.24±0.04 4.77±0.05Hf 9.22±0.18 10.9±0.2 5.19±0.30 4.23±0.21 4.19±0.21 4.91±0.15 4.37±0.22 8.65±0.17
K% 1.60±0.12 1.24±0.14 2.60±0.01 2.62±0.18 2.98±0.21 3.90±0.23 1.97±0.28 1.26±0.14La 30.0±0.2 30.0±0.3 30.8±0.6 24.4±0.2 24.4±0.2 28.1±0.3 25.0±0.3 40.7±0.4 Lu 0.35±0.02 0.39±0.02 0.42±0.02 0.30±0.02 0.32±0.017 0.33±0.01 0.29±0.01 0.39±0.01Mo 12±1 10±1 21±2 10±2 11±2 5±1 4±1 5±1
Na% 0.84±0.04 0.56±0.01 2.17±0.02 0.76±0.01 0.41±0.01 0.64±0.05 0.45±0.01 0.25±0.01Nd 36±5 20±2 22±2 27±2 Rb 40±5 41±6 53±6 54±8 120±10 82±9 58±5 Sb 0.6±0.04 0.6±0.04 0.8±0.1 0.45±0.05 0.75±0.06 0.4±0.04 0.4±0.05 0.5±0.05 Sc 11.2±0.1 10.1±0.1 16.4±0.2 14.4±0.1 15.5±0.2 18.3±0.1 15.9±0.2 12.8±0.1 Se Sm 6.38±0.13 6.45±0.13 8.06±0.16 6.18±0.19 5.91±0.12 6.14±0.12 5.70±0.11 6.83±0.14Ta 1.23±0.07 1.14±0.22 0.59±0.09 0.72±0.10 1.02±0.08 0.82±0.10 Tb 0.87±0.12 1.04±0.11 0.86±0.13 1.02±0.16 0.70±0.11 1.04±0.17 0.69±0.09Th 7.2±0.1 8.5±0.1 7.5±0.3 6.7±0.2 7.3±0.2 8.7±0.2 7.4±0.2 12.2±0.2 U 3.8±0.2 4.2±0.2 4.0±0.5 4.7±0.2 3.8±0.3 3.9±0.2 2.7±0.3 3.6±0.2
Yb 2.56±0.08 2.72±0.08 2.85±0.14 2.25±0.09 2.16±0.06 2.19±0.07 2.08±0.08 2.97±0.06Zn 120±6 100±5 130±10 103±6 92±8 98±8 85±7 160±10
103

Elemental data
QUMRAN SAMPLES Concentrations in ppm
156 157 158 159 160 161 162 163
As 4.9±0.2 7.5±0.5 6.2±0.3 6.4±0.3 9.0±0.4 7.2±0.3 5.5±0.3 6.7±0.3 Ba 470±40 250±40 200±40 Br 16±1 30±0.3 40±0.4 17±0.4 62±1 26±0.3 21±0.4 100±1
Ca% 6.57±1.5 28.16±2.0 4.74±1.5 4.61±1.0 9.87±1.5 6.77±1.5 7.62±1.5 9.94±1.5 Ce 51.4±1.0 36.4±0.7 50.3±1.0 54.4±1.1 58.7±1.2 55.8±1.1 51.0±1.0 54.0±1.1 Co 10.5±0.2 9.7±0.3 17.5±0.4 17.4±0.4 19.0±0.4 10.8±0.3 10.5±0.2 12.2±0.2 Cs 4.0±0.2 1.9±0.2 5.5±0.3 6.0±0.2 3.9±0.3 4.35±0.22 2.9±0.2 3.9±0.2 Cr 92±2 80±2 141±3 108±2 114±2 108±2 115±2 100±2 Eu 1.03±0.04 0.84±0.06 1.16±0.07 1.17±0.06 1.26±0.06 1.24±0.06 1.20±0.06 1.22±0.06
Fe% 3.68±0.04 3.27±0.04 4.51±0.05 4.25±0.03 4.07±0.04 3.65±0.04 3.72±0.04 4.35±0.04Hf 4.08±0.12 2.49±0.15 4.44±0.18 4.08±0.16 5.2±0.2 5.05±0.15 5.3±0.2 4.38±0.18
K% 1.94±0.06 1.27±0.04 2.91±0.09 3.75±0.11 2.88±0.12 2.32±0.02 2.56±0.13 2.23±0.13La 24.5±0.3 17.6±0.2 22.1±0.2 26.5±0.3 28.4±0.3 26.0±0.3 24.7±0.3 25.4±0.3 Lu 0.29±0.01 0.21±0.01 0.29±0.01 0.32±0.01 0.33±0.01 0.31±0.01 0.27±0.01 0.31±0.01Mo 2.5±0.6 3.8±0.6 5.0±0.8 5.1±0.8 9.5±1.0 6.0±0.5 4.7±0.8 4.4±0.9
Na% 0.24±0.01 0.83±0.01 1.12±0.01 1.07±0.04 0.87±0.01 0.81±0.01 2.04±0.01Nd 20±4 15±4 16±2 14±3 22±4 19±3 18±2 21±4 Rb 70±5 90±6 118±6 70±8 80±5 58±5 76±6 Sb 0.44±0.03 0.37±0.04 0.47±0.04 0.45±0.04 0.69±0.05 0.46±0.04 0.54±0.04 0.53±0.05Sc 15.1±0.1 10.3±0.1 18.8±0.1 17.0±0.1 14.9±0.1 14.3±0.1 13.5±0.05 15.6±0.1 Se Sm 5.42±0.05 3.80±0.08 5.72±0.06 5.62±0.06 6.24±0.06 6.55±0.07 5.49±0.05 5.90±0.12Ta 0.60±0.05 0.86±0.08 0.80±0.07 1.03±0.08 0.85±0.07 0.72±0.08 0.75±0.08Tb 0.64±0.08 0.58±0.10 0.66±0.11 0.80±0.12 0.91±0.12 0.85±0.13 0.51±0.11 0.71±0.11Th 6.7±0.1 4.9±0.2 6.79±0.14 7.9±0.2 7.71±0.15 6.7±0.1 7.1±0.1 7.2±0.1 U 2.81±0.14 2.2±0.2 2.18±0.20 2.9±0.2 4.3±0.2 3.4±0.2 3.3±0.2 3.2±0.3
Yb 2.06±0.06 1.44±0.03 2.24±0.07 2.24±0.02 2.25±0.09 2.41±0.05 2.29±0.05 2.13±0.09Zn 61±5 190±10 84±7 86±7 114±7 90±6 100±6 80±6
104

Elemental data
QUMRAN SAMPLES Concentrations in ppm
164 165 166 167
As 4.6±0.3 5.2±0.3 4.8±0.3 8.4±0.5 Ba 135±30 Br 20±0.4 20±0.4 12±0.4 44±2
Ca% 6.07±1.5 5.24±1.5 5.67±1.5 23.4±2.0 Ce 58.3±1.2 61.2±1.2 52.4±1.1 27.7±0.6 Co 17.9±0.4 17.5±0.4 18.4±0.4 7.09±0.3 Cs 5.9±0.2 5.9±0.2 4.54±0.23 Cr 112±2 125±3 124±2 116±2 Eu 1.25±0.06 1.22±0.1 1.4±0.07 0.54±0.05
Fe% 4.37±0.04 4.47±0.03 4.35±0.04 1.55±0.03 Hf 4.13±0.17 4.83±0.14 4.16±0.17 2.81±0.14
K% 3.87±0.15 3.55±0.14 2.60±0.26 2.20±0.15 La 28.2±0.3 29.5±0.3 23.7±0.2 14.2±0.1 Lu 0.31±0.01 0.33±0.01 0.31±0.01 0.14±0.02 Mo 4.6±0.7 5.3±0.8 2.3±0.6 45±2
Na% 0.71±0.01 0.77±0.01 0.70±0.01 3.26±0.02 Nd 21±4 19±3 18±3 Rb 118±7 108±5 73±7 Sb 0.43±0.04 0.42±0.04 0.7±0.1 Sc 17.7±0.1 18.1±0.1 18.2±0.1 5.07±0.05 Se Sm 5.95±0.06 6.11±0.06 5.88±0.06 3.04±0.09 Ta 0.81±0.08 0.89±0.07 0.55±0.08 0.39±0.06 Tb 0.81±0.13 0.78±0.09 0.76±0.11 0.37±0.08 Th 7.9±0.2 8.1±0.2 6.7±0.1 3.1±0.1 U 3.3±0.2 3.9±0.2 2.3±0.2 7.6±0.3
Yb 2.22±0.07 2.43±0.05 2.36±0.21 1.31±0.13 Zn 70±10 106±7 106±10 210±8
105

Elemental data
QUMRAN SAMPLES Concentrations in ppm
168 169 170 171 172 173 174 175
As 8.5±0.3 6.5±0.3 8.7±0.4 9.8±0.3 12.9±0.3 9.5±0.3 9.0±0.4 3.3±0.2 Ba 330±50 320±40 290±50 300±30 350±40 Br 15±0.3 18±1 33±1 82±2 23±1 65±2 53±1 43±1
Ca% 10.03±1.5 8.83±1.5 7.10±1.5 8.87±1.5 31.82±2.0Ce 92±2 94±2 82±2 79±2 79±2 54±1 50±2 7.3±0.5 Co 22.6±0.5 21.8±0.5 15.2±0.5 15.7±0.3 14.6±0.3 20.7±0.5 12.6±0.4 1.29±0.08Cs 1.77±0.23 2.46±0.22 2.46±0.25 1.68±0.20 2.87±0.23 5.42±0.27 3.01±0.2 0.78±0.06Cr 145±5 143±3 172±5 174±5 173±3 122±3 110±3 38.1±1.1 Eu 1.83±0.11 1.80±0.9 1.60±0.1 1.89±0.09 1.75±0.09 1.19±0.07 1.10±0.08 0.17±0.02
Fe% 5.34±0.05 5.29±0.05 5.14±0.05 5.08±0.05 5.27±0.05 4.35±0.04 4.07±0.04 0.24±0.01Hf 12.9±0.3 12.8±0.3 9.3±0.3 8.6±0.3 8.2±0.2 3.7±0.2 3.67±0.22 0.35±0.05
K% 1.52±0.01 1.54±0.08 1.66±0.09 1.70±0.08 4.34±0.17 4.75±0.19 0.23±0.03La 40.0±0.4 42.2±0.4 40.0±0.3 37.3±0.3 39.0±0.4 24.3±0.2 21.6±0.2 5.12±0.05Lu 0.40±0.02 0.50±0.02 0.45±0.02 0.41±0.02 0.42±0.02 0.29±0.01 0.28±0.02 0.67±0.02Mo 6.2±1.2 4.0±1.3 7.1±1.2 10.3±1.3 8.0±0.8 5.2±0.8 3.0±0.7 11.6±0.5
Na% 0.87±0.03 1.0±0.03 0.76±0.01 0.98±0.01 0.64±0.01 0.60±0.01 0.60±0.01 0.25±0.01Nd 22±3 30±5 25±5 26±6 24±4 19±3 18±3 Rb 53±10 63±9 66±10 52±8 76±8 95±9 90±10 Sb 0.87±0.05 0.55±0.04 0.96±0.05 0.99±0.06 0.61±0.04 0.54±0.04 0.54±0.05 0.47±0.02Sc 15.1±0.2 14.9±0.1 15.1±0.1 14.9±0.2 15.4±0.2 18.1±0.2 16.7±0.2 1.06±0.01Se 3.5±1.5 2.7±0.3 Sm 8.62±0.09 8.94±0.09 8.42±0.17 7.97±0.16 8.37±0.17 5.85±0.12 5.61±0.06 1.13±0.06Ta 1.35±0.12 1.67±0.12 1.60±0.13 1.12±0.11 1.42±0.11 0.72±0.09 Tb 1.3±0.2 1.08±0.14 1.01±0.17 1.09±0.14 1.24±0.14 0.90±0.15 1.58±0.03Th 10.9±0.2 10.9±0.2 9.2±0.3 8.8±0.3 9.2±0.2 7.9±0.2 7.1±0.2 0.62±0.05U 2.95±0.21 2.95±0.21 4.60±0.23 3.97±0.20 4.65±0.19 2.82±0.20 2.94±0.15 6.45±0.06
Yb 3.52±0.07 3.38±0.07 3.15±0.09 3.13±0.09 3.0±0.1 2.09±0.08 2.13±0.06 0.51±0.03Zn 120±8 110±8 156±10 168±8 189±8 210±10 126±10 56±6
106

Elemental data
QUMRAN SAMPLES Concentrations in ppm
176 177 178 179 180 181 182 183 Ag 4.2±0.4 As 3.4±0.2 6.4±0.3 4.2±0.3 10.7±0.3 10.0±0.5 13.6±0.5 6.2±0.4 7.6±0.2 Ba 320±25 180±30 180±30 198±40 Br 53±1 97±2 260±2 58±2 52±2 20±2 39±2 28±2
Ca% 36.5±2.0 25.41±2.0 19.65±2.0 6.67±1.5 6.87±1.5 32.44±2.0 6.41±1.5 5.62±1.5 Ce 8.45±0.51 36.2±0.7 11.1±0.6 54.5±1.1 53.5±1.6 25.0±0.8 63.4±0.6 66.6±1.3 Co 1.77±0.11 8.6±0.2 2.6±0.2 18.4±0.4 18.0±0.5 4.8±0.3 12.1±0.4 12.5±0.4 Cs 0.2±0.02 1.49±0.04 0.2±0.03 5.37±0.27 4.6±0.3 4.12±0.25 4.40±0.22Cr 40±2 170±3 53±2 120±2 120±4 350±5 118±4 123±3 Eu 0.70±0.04 1.31±0.08 1.20±0.08 0.83±0.08 1.42±0.07 1.39±0.08
Fe% 0.32±0.01 2.07±0.02 0.48±0.01 4.46±0.05 4.46±0.05 1.26±0.04 4.36±0.04 4.58±0.05Hf 0.78±0.07 2.97±0.12 1.0±0.07 4.4±0.2 4.5±0.2 1.57±0.19 5.64±0.23 7.14±0.21
K% 0.39±0.07 1.34±0.09 0.73±0.11 3.15±0.22 2.61±0.23 2.50±0.23 2.02±0.08La 5.23±0.10 19.1±0.2 6.2±0.1 23.9±0.2 25.0±0.3 20.1±0.4 29.0±0.3 30.9±0.3 Lu 0.81±0.04 0.21±0.01 0.65±0.04 0.31±0.01 0.33±0.01 0.38±0.02 0.35±0.01 0.42±0.02Mo 11.2±0.7 14.2±0.7 15.6±0.8 6.0±1.0 4.8±0.9 44±2 4.6±1.0 6.1±0.9
Na% 0.44±0.01 0.52±0.01 1.01±0.01 0.82±0.01 0.85±0.01 0.26±0.01 1.13±0.01 0.53±0.02Nd 14±3 33±2 19±5 21±4 16±2 21±5 21±3 Rb 35±5 60±8 74±10 77±8 84±7 Sb 0.94±0.03 0.82±0.03 0.60±0.04 0.44±0.04 0.67±0.05 1.2±0.1 0.44±0.04 0.51±0.04Sc 1.30±0.03 6.64±0.07 1.57±0.02 19.2±0.1 19.0±0.2 6.91±0.07 17.8±0.1 16.6±0.2 Se 3.0±0.4 4.8±0.3 2.5±0.4 25±2 Sm 1.15±0.06 3.95±0.12 1.43±0.07 6.14±0.12 5.92±0.12 4.55±0.23 6.75±0.14 7.28±0.07Ta 0.57±0.06 1.05±0.08 1.07±0.1 Tb 0.48±0.07 0.21±0.04 0.77±0.15 0.95±0.12 0.80±0.13Th 0.73±0.05 3.92±0.12 1.00±0.05 7.03±0.21 6.7±0.2 2.49±0.20 8.4±0.2 8.9±0.2 U 5.9±0.18 8.4±0.1 7.6±0.2 2.9±0.2 2.03±0.24 26.5±0.5 3.2±0.2 4.3±0.2
Yb 0.57±0.04 1.53±0.05 0.50±0.06 2.40±0.07 2.33±0.07 2.76±0.11 2.55±0.08 2.85±0.10Zn 89±8 155±5 125±5 92±8 108±9 280±12 88±8 118±7
107

Elemental data
QUMRAN SAMPLES Concentrations in ppm
184 185 186 187 188 189 190 191
As 3.9±0.3 6.1±0.3 4.9±0.2 6.03±0.24 3.8±0.3 8.1±0.2 6.0±0.4 6.5±0.3 Ba 230±30 340±50 Br 30±1 56±1 40±1 16±1 55±1 40±1 30±1 48±1
Ca% 3.63±1.5 6.56±1.5 5.93±1.5 8.91±1.5 3.99±1.5 7.75±1.5 4.25±1.5 2.94±0.5 Ce 47.9±1.0 53.4±1.1 58.7±1.2 61.1±1.2 59.0±1.8 49.7±1.0 54.8±1.1 54.2±0.6 Co 16.1±0.5 16.1±0.5 13.0±0.4 11.3±0.3 17.9±0.4 17.5±0.4 12.8±0.5 11.9±0.4 Cs 5.0±0.3 3.02±0.24 3.80±0.23 3.13±0.22 5.24±0.26 4.66±0.28 4.84±0.34 3.83±0.27Cr 98±3 130±3 114±2 148±3 120±2 112±2 120±5 112±2 Eu 0.93±0.1 1.20±0.08 1.26±0.08 1.13±0.07 1.27±0.08 1.45±0.09 1.47±0.10 1.22±0.09
Fe% 3.69±0.04 4.68±0.05 4.38±0.04 4.12±0.04 4.20±0.05 4.25±0.04 4.13±0.25 4.02±0.04Hf 3.48±0.21 4.66±0.23 4.48±0.18 6.16±0.18 4.12±0.21 3.45±0.17 4.13±0.25 5.1±0.2
K% 2.36±0.10 2.51±0.11 2.27±0.09 1.74±0.09 2.88±0.12 2.61±0.13 2.26±0.16 2.83±0.17La 23.4±0.3 23.9±0.3 27.3±0.3 29.0±0.3 28.0±0.4 23.0±0.3 25.4±0.3 24.3±0.2 Lu 0.26±0.11 0.29±0.01 0.34±0.08 0.35±0.02 0.29±0.02 0.29±0.01 0.32±0.02 0.33±0.02Mo 3.8±0.9 6.1±1.2 6.7±0.8 6.5±0.8 4.7±1.0 4.4±0.2 6.1±0.9 7.4±0.8
Na% 1.23±0.04 1.08±0.02 1.03±0.02 0.55±0.01 1.39±0.04 0.74±0.07 0.59±0.04 0.73±0.01Nd 14±3 24±2 22±2 20±3 18±3 19±2 24±3 21±2 Rb 86±8 50±8 75±7 66±6 86±8 76±8 72±8 80±8 Sb 0.33±0.04 0.63±0.04 0.42±0.04 0.6±0.04 0.37±0.04 0.41±0.04 0.43±0.04Sc 14.7±0.2 16.9±0.2 16.6±0.1 13.3±0.2 17.4±0.2 17.9±0.2 16.8±0.2 16.2±0.2 Se Sm 5.13±0.15 5.79±0.12 6.23±0.12 6.42±0.13 5.86±0.06 5.67±0.11 6.25±0.12 5.90±0.12Ta 0.61±0.09 0.88±0.1 0.92±0.08 0.95±0.09 0.87±0.10 0.69±0.10Tb 0.75±0.15 0.69±0.12 1.02±0.15 0.74±0.13 0.73±0.14Th 6.8±0.2 7.9±0.2 7.9±0.2 7.0±0.2 8.1±0.2 6.46±0.19 7.6±0.2 7.32±0.22U 2.29±0.23 3.42±0.21 2.75±0.14 4.24±0.17 4.13±0.21 3.0±0.2 3.0±0.2 3.1±0.3
Yb 2.17±0.08 1.97±0.06 2.29±0.07 2.43±0.05 2.22±0.09 2.19±0.09 2.23±0.09 2.27±0.09Zn 70±7 142±10 100±8 184±7 130±10 91±10 99±10
108
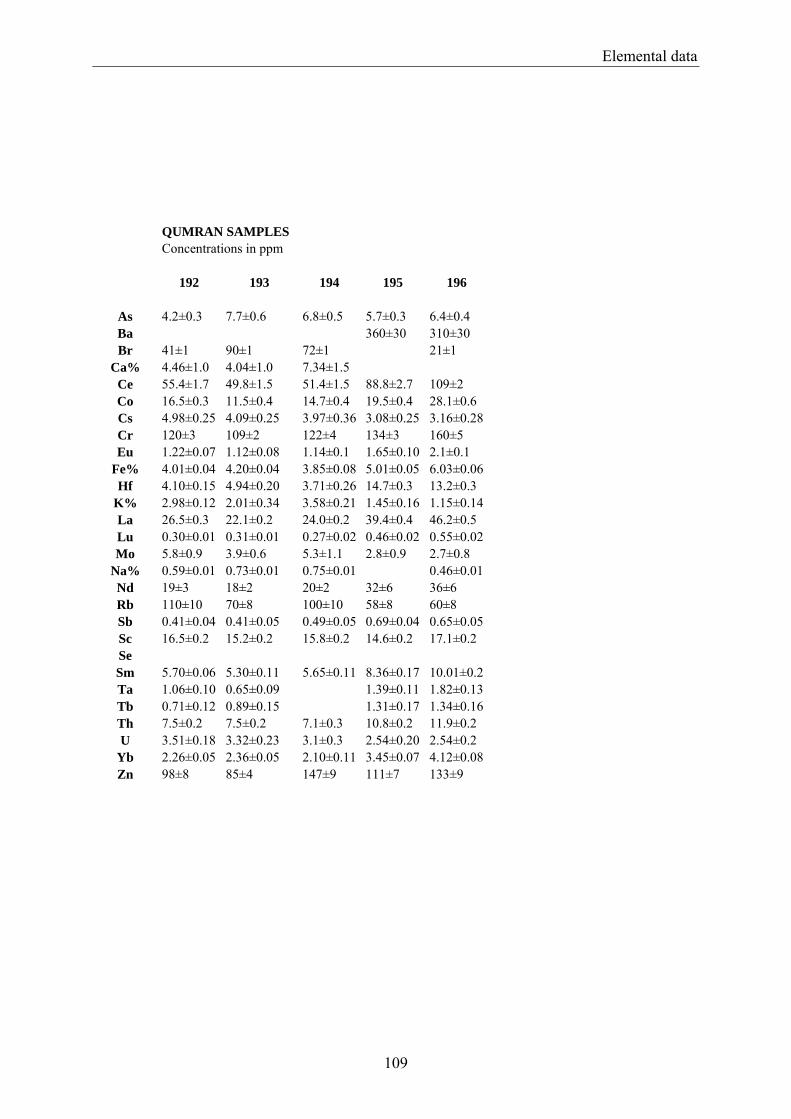
Elemental data
QUMRAN SAMPLES Concentrations in ppm
192 193 194 195 196
As 4.2±0.3 7.7±0.6 6.8±0.5 5.7±0.3 6.4±0.4 Ba 360±30 310±30 Br 41±1 90±1 72±1 21±1
Ca% 4.46±1.0 4.04±1.0 7.34±1.5 Ce 55.4±1.7 49.8±1.5 51.4±1.5 88.8±2.7 109±2 Co 16.5±0.3 11.5±0.4 14.7±0.4 19.5±0.4 28.1±0.6 Cs 4.98±0.25 4.09±0.25 3.97±0.36 3.08±0.25 3.16±0.28Cr 120±3 109±2 122±4 134±3 160±5 Eu 1.22±0.07 1.12±0.08 1.14±0.1 1.65±0.10 2.1±0.1
Fe% 4.01±0.04 4.20±0.04 3.85±0.08 5.01±0.05 6.03±0.06Hf 4.10±0.15 4.94±0.20 3.71±0.26 14.7±0.3 13.2±0.3
K% 2.98±0.12 2.01±0.34 3.58±0.21 1.45±0.16 1.15±0.14La 26.5±0.3 22.1±0.2 24.0±0.2 39.4±0.4 46.2±0.5 Lu 0.30±0.01 0.31±0.01 0.27±0.02 0.46±0.02 0.55±0.02Mo 5.8±0.9 3.9±0.6 5.3±1.1 2.8±0.9 2.7±0.8
Na% 0.59±0.01 0.73±0.01 0.75±0.01 0.46±0.01Nd 19±3 18±2 20±2 32±6 36±6 Rb 110±10 70±8 100±10 58±8 60±8 Sb 0.41±0.04 0.41±0.05 0.49±0.05 0.69±0.04 0.65±0.05Sc 16.5±0.2 15.2±0.2 15.8±0.2 14.6±0.2 17.1±0.2 Se Sm 5.70±0.06 5.30±0.11 5.65±0.11 8.36±0.17 10.01±0.2Ta 1.06±0.10 0.65±0.09 1.39±0.11 1.82±0.13Tb 0.71±0.12 0.89±0.15 1.31±0.17 1.34±0.16Th 7.5±0.2 7.5±0.2 7.1±0.3 10.8±0.2 11.9±0.2 U 3.51±0.18 3.32±0.23 3.1±0.3 2.54±0.20 2.54±0.2
Yb 2.26±0.05 2.36±0.05 2.10±0.11 3.45±0.07 4.12±0.08Zn 98±8 85±4 147±9 111±7 133±9
109
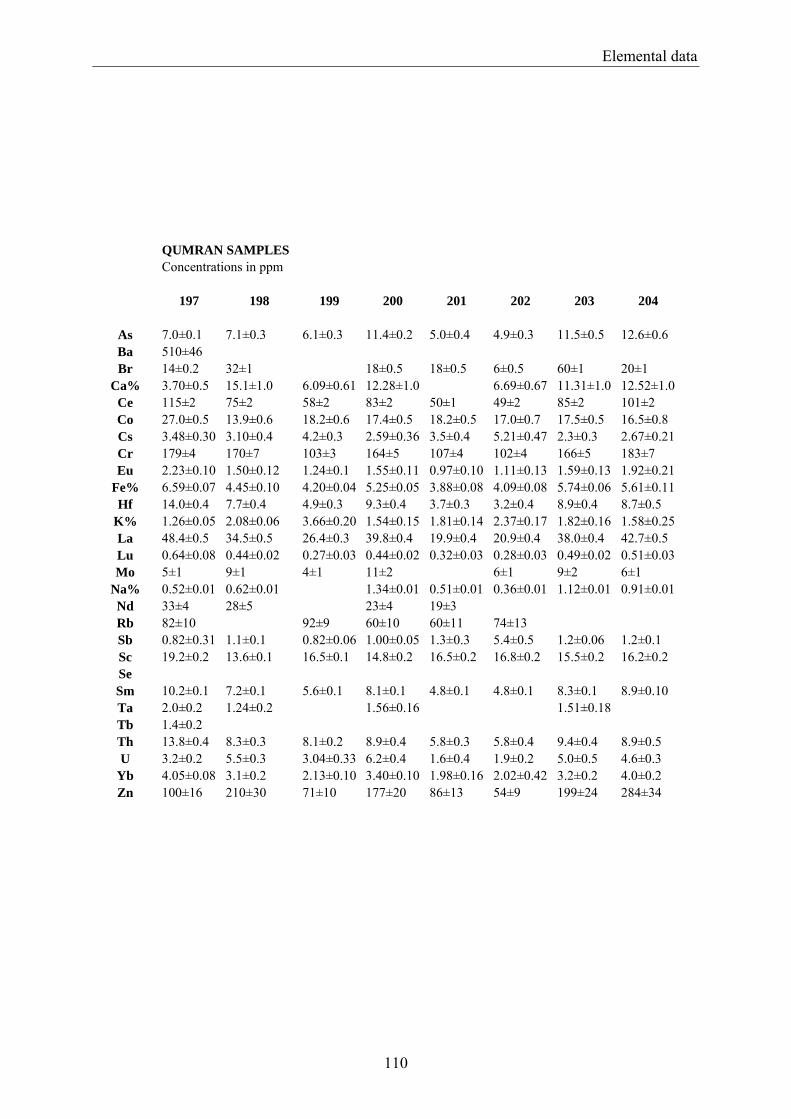
Elemental data
QUMRAN SAMPLES Concentrations in ppm
197 198 199 200 201 202 203 204
As 7.0±0.1 7.1±0.3 6.1±0.3 11.4±0.2 5.0±0.4 4.9±0.3 11.5±0.5 12.6±0.6 Ba 510±46 Br 14±0.2 32±1 18±0.5 18±0.5 6±0.5 60±1 20±1
Ca% 3.70±0.5 15.1±1.0 6.09±0.61 12.28±1.0 6.69±0.67 11.31±1.0 12.52±1.0Ce 115±2 75±2 58±2 83±2 50±1 49±2 85±2 101±2 Co 27.0±0.5 13.9±0.6 18.2±0.6 17.4±0.5 18.2±0.5 17.0±0.7 17.5±0.5 16.5±0.8 Cs 3.48±0.30 3.10±0.4 4.2±0.3 2.59±0.36 3.5±0.4 5.21±0.47 2.3±0.3 2.67±0.21Cr 179±4 170±7 103±3 164±5 107±4 102±4 166±5 183±7 Eu 2.23±0.10 1.50±0.12 1.24±0.1 1.55±0.11 0.97±0.10 1.11±0.13 1.59±0.13 1.92±0.21
Fe% 6.59±0.07 4.45±0.10 4.20±0.04 5.25±0.05 3.88±0.08 4.09±0.08 5.74±0.06 5.61±0.11Hf 14.0±0.4 7.7±0.4 4.9±0.3 9.3±0.4 3.7±0.3 3.2±0.4 8.9±0.4 8.7±0.5
K% 1.26±0.05 2.08±0.06 3.66±0.20 1.54±0.15 1.81±0.14 2.37±0.17 1.82±0.16 1.58±0.25La 48.4±0.5 34.5±0.5 26.4±0.3 39.8±0.4 19.9±0.4 20.9±0.4 38.0±0.4 42.7±0.5 Lu 0.64±0.08 0.44±0.02 0.27±0.03 0.44±0.02 0.32±0.03 0.28±0.03 0.49±0.02 0.51±0.03Mo 5±1 9±1 4±1 11±2 6±1 9±2 6±1
Na% 0.52±0.01 0.62±0.01 1.34±0.01 0.51±0.01 0.36±0.01 1.12±0.01 0.91±0.01Nd 33±4 28±5 23±4 19±3 Rb 82±10 92±9 60±10 60±11 74±13 Sb 0.82±0.31 1.1±0.1 0.82±0.06 1.00±0.05 1.3±0.3 5.4±0.5 1.2±0.06 1.2±0.1 Sc 19.2±0.2 13.6±0.1 16.5±0.1 14.8±0.2 16.5±0.2 16.8±0.2 15.5±0.2 16.2±0.2 Se Sm 10.2±0.1 7.2±0.1 5.6±0.1 8.1±0.1 4.8±0.1 4.8±0.1 8.3±0.1 8.9±0.10 Ta 2.0±0.2 1.24±0.2 1.56±0.16 1.51±0.18 Tb 1.4±0.2 Th 13.8±0.4 8.3±0.3 8.1±0.2 8.9±0.4 5.8±0.3 5.8±0.4 9.4±0.4 8.9±0.5 U 3.2±0.2 5.5±0.3 3.04±0.33 6.2±0.4 1.6±0.4 1.9±0.2 5.0±0.5 4.6±0.3
Yb 4.05±0.08 3.1±0.2 2.13±0.10 3.40±0.10 1.98±0.16 2.02±0.42 3.2±0.2 4.0±0.2 Zn 100±16 210±30 71±10 177±20 86±13 54±9 199±24 284±34
110

Elemental data
QUMRAN SAMPLES concentrations in ppm 205 206 207 208 209 210 211 212
As 10.7±0.5 10.6±0.5 9.5±0.5 7.6±0.5 8.2±0.4 6.7±0.4 12.4±0.5 5.1±0.5 Ba 750±90 470±90 Br 18±1 8±0.4 115±5 20±1 30±2 20±1 80±2 28±2 Ce 93±2 86±2 84±2 66±3 90±2 65±2 70±2 58±2 Co 18.4±0.7 18.0±0.7 19.3±0.6 19.2±0.8 25.1±0.8 10.6±0.5 14.5±0.6 19.4±0.8 Cs 2.6±0.3 2.7±0.4 7.2±0.5 3.8±0.5 5.14±0.46 4.2±0.4 6.0±0.5 Cr 181±5 152±5 150±6 135±5 157±6 116±5 108±3 108±5 Eu 1.89±0.15 1.95±0.16 1.78±0.14 135±5 1.45±0.15 1.32±0.13 1.28±0.12 1.37±0.14
Fe% 5.68±0.11 5.78±0.12 5.15±0.10 4.82±0.10 6.06±0.12 4.30±0.09 3.98±0.08 4.62±0.09Hf 11.0±0.4 9.2±0.5 9.6±0.5 6.3±0.5 13.0±0.5 5.5±0.4 6.2±0.3 4.8±0.4
K% 1.61±0.23 2.12±0.21 2.66±0.27 4.33±0.35 2.80±0.31 2.92±0.29 3.38±0.27 3.13±0.3 La 40.0±0.4 37.9±0.4 38.0±0.4 31.1±0.6 38.1±0.8 26.6±0.5 28.0±0.6 26.9±0.5 Lu 0.50±0.05 0.62±0.03 0.48±0.03 0.53±0.03 0.50±0.04 0.43±0.03 0.37±0.02 0.36±0.03Mo 8±1 7±1 8±1 6±2 5±1 6±1 9±2
Na% 0.49±0.02 1.19±0.01 0.44±0.01 0.78±0.01 0.67±0.01 1.00±0.01 0.61±0.01Nd 29±6 25±4 Rb 50±12 126±19 87±11 133±15 Sb 0.85±0.06 1.06±0.07 1.68±0.08 0.82±0.07 0.95±0.06 0.72±0.06 0.50±0.06 Sc 16.2±0.2 14.8±0.2 14.9±0.2 18.9±0.2 17.6±0.2 17.3±0.2 14.9±0.2 17.0±0.2 Se Sm 8.5±0.1 8.3±0.1 8.3±0.1 6.6±0.1 8.4±0.1 6.7±0.2 7.0±0.1 5.9±0.2 Ta 1.84±0.18 1.81±0.2 1.76±0.19 1.48±0.19 0.87±0.14 Tb 1.46±0.26 1.33±0.27 1.45±0.23 1.45±0.25 Th 9.4±0.4 9.2±0.4 9.0±0.4 8.5±0.5 10.1±0.4 7.8±0.4 8.9±0.4 8.8±0.4 U 3.8±0.3 6.6±0.5 5.5±0.3 4.6±0.7 3.3±0.3 4.6±0.6 2.8±0.3 3.0±0.5
Yb 3.39±0.17 3.92±0.12 3.16±0.22 2.81±0.17 3.29±0.20 2.69±0.21 3.07±0.15 2.28±0.21Zn 188±20 139±17 217±22 206±25 194±19 89±15 52±9 46±10
111

Elemental data
QUMRAN SAMPLES concentrations in ppm 213 214 215 216 217 218 219 220
As 6.8±0.3 9.7±1.0 6.1±0.5 11.9±0.4 9.3±0.4 10.7±0.4 8.9±0.5 13.1±0.4 Ba 470±90 427±70 1145±104Br 17±1 36±1 6±1 40±1 32±1 45±2 20±1 36±2 Ce 66±2 84±2 70±2 90±2 86±1 87±2 78±2 87±2 Co 12.3±0.5 18.0±0.5 16.4±0.7 17.7±0.5 17.0±0.5 17.4±0.5 17.1±0.5 18.6±0.6 Cs 4.7±0.4 2.4±0.3 5.6±0.6 1.4±0.3 2.8±0.3 2.04±0.31 4.9±0.3 2.8±0.3 Cr 135±4 169±3 155±6 168±5 166±3 165±3 137±3 170±5 Eu 1.49±0.12 1.83±0.11 1.69±0.15 1.74±0.12 3.81±0.23 2.02±0.10 1.76±0.11 1.71±0.12
Fe% 4.42±0.01 5.30±0.05 5.02±0.10 5.54±0.06 5.06±0.05 5.88±0.06 5.58±0.06 5.01±0.04Hf 6.0±0.3 9.3±0.3 5.8±0.4 9.4±0.4 8.8±0.3 9.1±0.3 7.3±0.3 7.88±0.32
K% 2.80±0.22 2.03±0.20 1.83±0.26 1.77±0.21 1.45±0.16 2.57±0.23 2.62±0.21 1.93±0.24La 27.1±0.5 36.9±0.4 29.7±0.6 37.4±0.8 36.8±0.4 36.8±0.4 33.1±0.3 36.7±0.4 Lu 0.43±0.03 0.52±0.03 0.40±0.03 0.43±0.03 0.53±0.03 0.48±0.02 0.45±0.02 0.45±0.02Mo 11±2 12±2 12±2 10±2 7±2 10±2
Na% 0.61±0.01 0.79±0.01 0.32±0.01 0.92±0.01 0.72±0.01 1.20±0.01 0.61±0.01 0.62±0.01Nd 31±6 24±7 30±5 20±5 Rb 70±9 85±12 52±7 52±7 82±8 63±8 Sb 0.75±0.04 2.12±0.08 1.0±0.06 1.07±0.05 0.90±0.06 4.28±0.09 1.05±0.06Sc 17.8±0.2 15.2±0.2 19.1±0.2 15.1±0.2 14.5±0.2 16.2±0.2 18.2±0.2 14.9±0.2 Se Sm 6.6±0.1 7.8±0.1 6.4±0.1 7.9±0.1 7.9±0.1 7.8±0.1 7.6±0.1 7.5±0.2 Ta 0.97±0.13 1.25±0.14 0.93±0.20 1.23±0.16 1.33±0.12 1.29±0.12 1.03±0.12 1.36±0.14Tb 1.05±0.16 1.18±0.15 1.0±0.2 1.02±0.18Th 8.7±0.3 8.6±0.3 8.4±0.4 8.9±0.3 8.7±0.2 9.5±0.3 9.2±0.3 9.0±0.3 U 4.4±0.3 5.1±0.3 3.2±0.4 4.3±0.3 5.1±0.3 4.5±0.4 2.8±0.3 4.9±0.3
Yb 2.68±0.19 3.38±0.2 2.87±0.23 2.95±0.21 3.39±0.17 3.11±0.12 3.0±0.3 3.40±0.14Zn 109±16 169±19 90±17 202±20 150±18 223±16 95±14 158±17
112
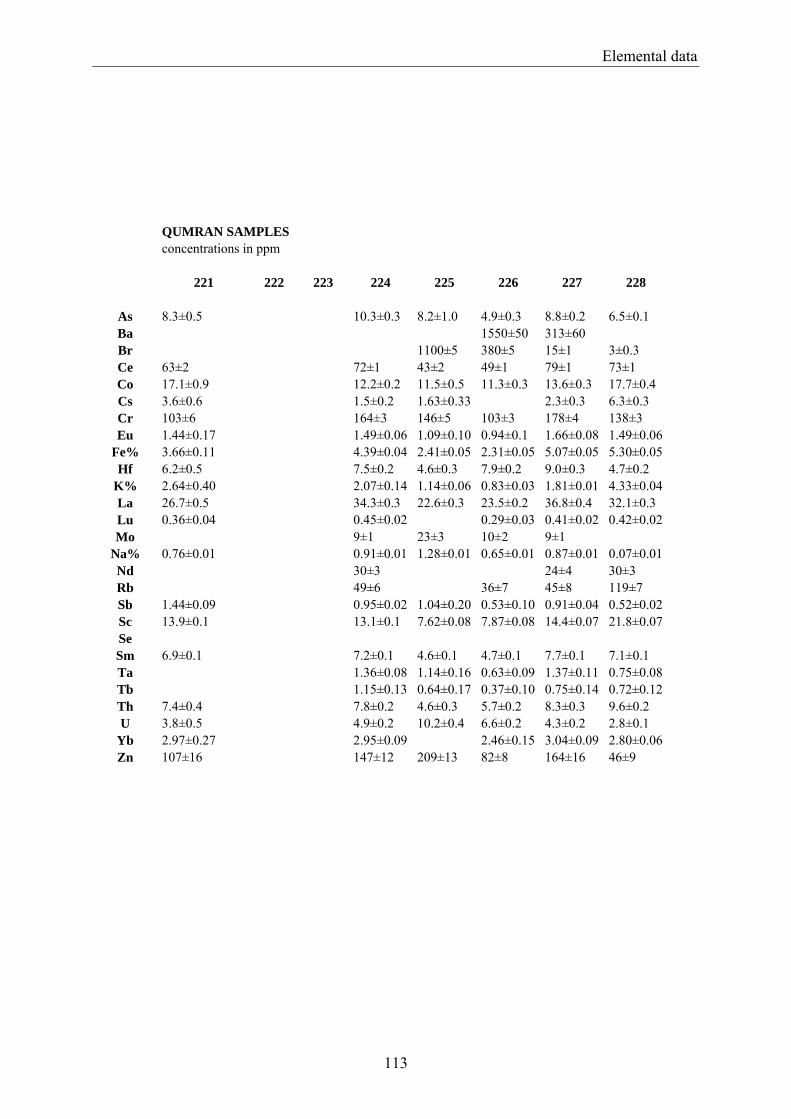
Elemental data
QUMRAN SAMPLES concentrations in ppm 221 222 223 224 225 226 227 228
As 8.3±0.5 10.3±0.3 8.2±1.0 4.9±0.3 8.8±0.2 6.5±0.1 Ba 1550±50 313±60 Br 1100±5 380±5 15±1 3±0.3 Ce 63±2 72±1 43±2 49±1 79±1 73±1 Co 17.1±0.9 12.2±0.2 11.5±0.5 11.3±0.3 13.6±0.3 17.7±0.4 Cs 3.6±0.6 1.5±0.2 1.63±0.33 2.3±0.3 6.3±0.3 Cr 103±6 164±3 146±5 103±3 178±4 138±3 Eu 1.44±0.17 1.49±0.06 1.09±0.10 0.94±0.1 1.66±0.08 1.49±0.06
Fe% 3.66±0.11 4.39±0.04 2.41±0.05 2.31±0.05 5.07±0.05 5.30±0.05Hf 6.2±0.5 7.5±0.2 4.6±0.3 7.9±0.2 9.0±0.3 4.7±0.2
K% 2.64±0.40 2.07±0.14 1.14±0.06 0.83±0.03 1.81±0.01 4.33±0.04La 26.7±0.5 34.3±0.3 22.6±0.3 23.5±0.2 36.8±0.4 32.1±0.3 Lu 0.36±0.04 0.45±0.02 0.29±0.03 0.41±0.02 0.42±0.02Mo 9±1 23±3 10±2 9±1
Na% 0.76±0.01 0.91±0.01 1.28±0.01 0.65±0.01 0.87±0.01 0.07±0.01Nd 30±3 24±4 30±3 Rb 49±6 36±7 45±8 119±7 Sb 1.44±0.09 0.95±0.02 1.04±0.20 0.53±0.10 0.91±0.04 0.52±0.02Sc 13.9±0.1 13.1±0.1 7.62±0.08 7.87±0.08 14.4±0.07 21.8±0.07Se Sm 6.9±0.1 7.2±0.1 4.6±0.1 4.7±0.1 7.7±0.1 7.1±0.1 Ta 1.36±0.08 1.14±0.16 0.63±0.09 1.37±0.11 0.75±0.08Tb 1.15±0.13 0.64±0.17 0.37±0.10 0.75±0.14 0.72±0.12Th 7.4±0.4 7.8±0.2 4.6±0.3 5.7±0.2 8.3±0.3 9.6±0.2 U 3.8±0.5 4.9±0.2 10.2±0.4 6.6±0.2 4.3±0.2 2.8±0.1
Yb 2.97±0.27 2.95±0.09 2.46±0.15 3.04±0.09 2.80±0.06Zn 107±16 147±12 209±13 82±8 164±16 46±9
113

Elemental data
QUMRAN SAMPLES concentrations in ppm 229 230 231 232 233 234 235 236
As 5.7±0.1 1.0±0.05 5.9±0.2 6.0±0.2 4.0±0.4 6.3±0.2 5.1±0.2 6.5±0.2 Ba 374±70 1024±270 313±80 Br 2±0.02 15±1 85±2 13±1 30±1 15±1 20±1 55±1 Ce 65±1 3.9±0.4 54±2 62±2 29±3 67±1 33±1 54±1 Co 18.3±0.4 1.31±0.09 11.0±0.5 15.9±0.5 7.86±0.80 15.1±0.5 4.26±0.26 17.8±0.4 Cs 5.2±0.2 0.2±0.03 2.02±0.26 2.4±0.3 2.51±0.28 0.88±0.21Cr 116±2 19.3±1.0 103±4 114±3 68±7 128±4 57±2 124±2 Eu 1.31±0.05 0.09±0.01 1.15±0.09 1.34±0.09 1.27±0.10 0.56±0.06 1.24±0.06
Fe% 4.41±0.04 0.25±0.01 3.83±0.08 3.71±0.07 1.19±0.08 3.56±0.07 1.35±0.03 4.36±0.04Hf 4.22±0.21 0.71±0.07 4.22±0.30 9.3±0.4 7.5±0.4 2.8±0.2 4.1±0.2
K% 3.67±0.04 0.15±0.01 2.01±0.08 2.32±0.07 0.91±0.01 1.22±0.07 0.44±0.01 1.52±0.01La 27.6±0.1 2.29±0.05 24.3±0.3 26.8±0.3 11.1±0.4 31.1±0.03 15.0±0.2 22.9±0.2 Lu 0.40±0.02 0.37±0.02 0.43±0.02 0.40±0.02 0.16±0.02 0.38±0.02Mo 3±0.5 7±1 9±1 17±1
Na% 0.06±0.01 0.13±0.01 1.17±0.012 0.67±0.01 1.28±0.01 0.45±0.01 0.30±0.01 2.63±0.02Nd 24±4 Rb 88±7 55±10 53±10 58±10 Sb 0.46±0.02 0.14±0.01 0.57±0.03 3.5±0.1 0.78±0.03 0.42±0.03 0.56±0.04Sc 18.1±0.07 0.79±0.02 15.4±0.2 12.5±0.2 3.3±0.1 11.5±0.1 3.39±0.03 17.9±0.1 Se 13.3±0.7 Sm 6.1±0.1 0.46±0.01 5.5±0.1 5.8±0.1 2.4±0.05 6.6±0.1 3.0±0.01 5.7±0.1 Ta 0.66±0.07 0.88±0.11 0.92±0.13 0.43±0.08 0.72±0.08Tb 0.73±0.10 0.68±0.20 0.35±0.09 0.56±0.13Th 7.9±0.2 0.52±0.06 6.6±0.3 6.8±0.1 3.7±0.5 7.2±0.3 3.8±0.2 6.2±0.2 U 2.4±0.1 0.9±0.08 3.8±0.3 3.9±0.2 3.5±0.7 5.3±0.2 2.4±0.2 2.6±0.2
Yb 2.53±0.03 0.21±0.04 2.32±0.14 2.95±0.12 2.27±0.14 1.06±0.07 2.07±0.10Zn 40±6 24±2 58±8 74±12 455±27 136±12 46±5 86±10
114
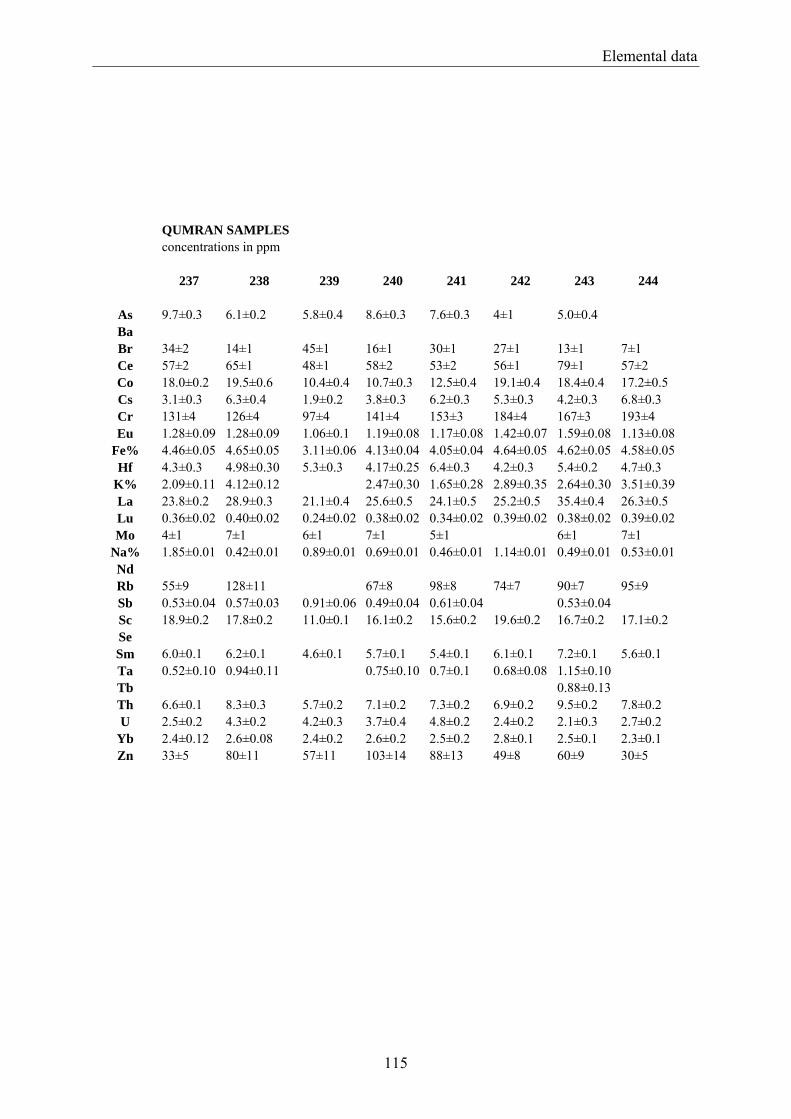
Elemental data
QUMRAN SAMPLES concentrations in ppm 237 238 239 240 241 242 243 244
As 9.7±0.3 6.1±0.2 5.8±0.4 8.6±0.3 7.6±0.3 4±1 5.0±0.4 Ba Br 34±2 14±1 45±1 16±1 30±1 27±1 13±1 7±1 Ce 57±2 65±1 48±1 58±2 53±2 56±1 79±1 57±2 Co 18.0±0.2 19.5±0.6 10.4±0.4 10.7±0.3 12.5±0.4 19.1±0.4 18.4±0.4 17.2±0.5 Cs 3.1±0.3 6.3±0.4 1.9±0.2 3.8±0.3 6.2±0.3 5.3±0.3 4.2±0.3 6.8±0.3 Cr 131±4 126±4 97±4 141±4 153±3 184±4 167±3 193±4 Eu 1.28±0.09 1.28±0.09 1.06±0.1 1.19±0.08 1.17±0.08 1.42±0.07 1.59±0.08 1.13±0.08
Fe% 4.46±0.05 4.65±0.05 3.11±0.06 4.13±0.04 4.05±0.04 4.64±0.05 4.62±0.05 4.58±0.05Hf 4.3±0.3 4.98±0.30 5.3±0.3 4.17±0.25 6.4±0.3 4.2±0.3 5.4±0.2 4.7±0.3
K% 2.09±0.11 4.12±0.12 2.47±0.30 1.65±0.28 2.89±0.35 2.64±0.30 3.51±0.39La 23.8±0.2 28.9±0.3 21.1±0.4 25.6±0.5 24.1±0.5 25.2±0.5 35.4±0.4 26.3±0.5 Lu 0.36±0.02 0.40±0.02 0.24±0.02 0.38±0.02 0.34±0.02 0.39±0.02 0.38±0.02 0.39±0.02Mo 4±1 7±1 6±1 7±1 5±1 6±1 7±1
Na% 1.85±0.01 0.42±0.01 0.89±0.01 0.69±0.01 0.46±0.01 1.14±0.01 0.49±0.01 0.53±0.01Nd Rb 55±9 128±11 67±8 98±8 74±7 90±7 95±9 Sb 0.53±0.04 0.57±0.03 0.91±0.06 0.49±0.04 0.61±0.04 0.53±0.04 Sc 18.9±0.2 17.8±0.2 11.0±0.1 16.1±0.2 15.6±0.2 19.6±0.2 16.7±0.2 17.1±0.2 Se Sm 6.0±0.1 6.2±0.1 4.6±0.1 5.7±0.1 5.4±0.1 6.1±0.1 7.2±0.1 5.6±0.1 Ta 0.52±0.10 0.94±0.11 0.75±0.10 0.7±0.1 0.68±0.08 1.15±0.10 Tb 0.88±0.13 Th 6.6±0.1 8.3±0.3 5.7±0.2 7.1±0.2 7.3±0.2 6.9±0.2 9.5±0.2 7.8±0.2 U 2.5±0.2 4.3±0.2 4.2±0.3 3.7±0.4 4.8±0.2 2.4±0.2 2.1±0.3 2.7±0.2
Yb 2.4±0.12 2.6±0.08 2.4±0.2 2.6±0.2 2.5±0.2 2.8±0.1 2.5±0.1 2.3±0.1 Zn 33±5 80±11 57±11 103±14 88±13 49±8 60±9 30±5
115

Elemental data
QUMRAN SAMPLES concentrations in ppm 245 246 247 248 249 250 251 252
As 6.6±0.5 7.9±1.4 6.4±0.5 6.9±0.6 7.4±0.4 8.8±0.6 7.5±0.6 9.6±0.2 Ba Br 10±1 17±1 16±1 12±1 15±1 53±2 64±1 Ce 63±2 64±1 62±2 70±2 62±1 54±1 62±2 80±2 Co 19.3±0.4 19.4±0.4 19.6±0.6 18.8±0.4 19.9±0.4 20.5±0.6 14.7±0.4 16.7±0.5 Cs 6.6±0.3 4.6±0.3 6.0±0.4 6.9±0.3 6.7±0.3 3.7±0.4 3.1±0.3 2.3±0.3 Cr 211±4 168±4 256±5 210±4 224±5 283±6 339±5 425±8 Eu 1.43±0.09 1.38±0.08 1.18±0.09 1.47±0.01 1.22±0.09 1.18±0.09 1.44±0.09 1.47±0.10
Fe% 4.64±0.05 4.50±0.01 4.43±0.04 4.71±0.05 4.45±0.05 4.54±0.05 4.31±0.04 4.88±0.05Hf 5.4±0.3 4.7±0.2 4.6±0.3 5.0±0.3 4.6±0.3 4.8±0.3 6.9±0.3 9.3±0.4
K% 4.68±0.47 3.94±0.43 3.77±0.49 4.07±0.45 La 30.3±0.3 27.6±0.6 28.4±0.6 31.8±0.6 27.3±0.6 22.3±0.5 28.7±0.6 36.6±0.7 Lu 0.39±0.02 0.40±0.03 0.40±0.03 0.38±0.03 0.34±0.02 0.33±0.03 0.41±0.02 0.44±0.04Mo 10±2 8±1 8±2 6±2 5±1 2±0.4 9±2 10±2
Na% 0.72±0.01 0.79±0.01 0.63±0.01 0.68±0.02 0.81±0.01 1.17±0.01 1.05±0.01 1.53±0.02Nd 21±1 Rb 130±10 108±9 134±11 133±11 98±10 70±12 Sb 0.53±0.05 0.83±0.06 0.75±0.06 0.72±0.05 1.2±0.3 0.71±0.06 0.96±0.10Sc 18.2±0.2 17.5±0.3 17.3±0.2 18.4±0.2 17.0±0.2 18.4±0.2 13.6±0.1 13.6±0.2 Se Sm 6.4±0.1 6.1±0.1 6.0±0.1 6.6±0.1 6.2±0.1 5.8±0.1 6.3±0.1 7.4±0.1 Ta 0.98±0.11 0.84±0.10 1.09±0.11 0.99±0.12 0.93±0.11 0.77±0.11 1.42±0.16Tb 0.75±0.13 0.70±0.16 Th 8.5±0.3 8.3±0.3 8.8±0.3 9.2±0.3 7.9±0.2 6.9±0.3 7.4±0.2 8.0±0.3 U 3.6±0.3 3.5±0.1 4.2±0.3 3.4±0.3 3.3±0.5 2.5±0.5 4.5±0.4 4.8±0.8
Yb 2.46±0.15 2.55±0.15 2.55±0.08 2.67±0.16 2.41±0.14 2.42±0.19 2.77±0.17 3.26±0.23Zn 66±12 79±15 70±10 89±13 63±11 86±17 132±13 137±14
116

Elemental data
QUMRAN SAMPLES concentrations in ppm 253 254 255 256 257 258 259 260
As 6.8±0.6 12.3±0.9 6.8±0.7 6.9±0.6 12±1 11±1 12±1 Ba 520±70 580±60 Br 40±2 82±2 88±2 56±2 17±1 18±1 29±1 29±2 Ce 70±1 65±2 59±1 83±2 66±1 96±2 87±2 86±2 Co 14.5±0.4 15.2±0.6 20.5±0.4 16.5±0.5 20.8±0.4 16.4±0.5 16.3±0.5 18.3±0.6 Cs 3.2±0.3 5.3±0.5 2.7±0.3 2.3±0.3 6.6±0.3 1.6±0.3 3.4±0.3 2.2±0.3 Cr 140±4 139±6 109±3 181±4 115±2 188±4 155±5 169±5 Eu 1.48±0.12 1.41±0.15 1.17±0.07 1.78±0.10 1.44±0.07 1.71±0.1 1.89±0.11 1.83±0.11
Fe% 4.47±0.09 4.16±0.08 4.37±0.05 4.89±0.05 4.69±0.05 5.72±0.06 5.49±0.05 5.65±0.06Hf 7.4±0.2 4.4±0.4 4.7±0.2 9.8±0.3 4.8±0.2 10.9±0.4 8.4±0.3 9.6±0.4
K% 4.39±0.57 3.42±0.51 La 32.7±0.7 27.0±0.5 28.6±0.6 38.5±0.4 29.3±0.3 41.6±0.8 38.2±0.8 38.0±0.8 Lu 0.43±0.02 0.42±0.03 0.33±0.02 0.48±0.02 0.42±0.02 0.51±0.04 0.43±0.03 0.48±0.02Mo 11±2 10±2 11±2 10±2 10±2 9±2
Na% 1.12±0.01 1.01±0.01 2.52±0.05 0.78±0.01 0.73±0.01 1.62±0.03 0.95±0.02 1.28±0.03Nd Rb 88±16 72±9 57±8 130±10 67±12 80±10 50±11 Sb 0.8±0.1 0.9±0.1 0.7±0.2 1.0±0.08 1.1±0.1 0.9±0.1 Sc 13.8±0.1 17.0±0.2 17.0±0.2 14.5±0.1 18.3±0.1 16.2±0.2 16.5±0.2 15.7±0.2 Se Sm 7.0±0.1 6.55±0.13 5.74±0.11 8.23±0.08 6.1±0.1 8.6±0.2 8.3±0.1 8.1±0.1 Ta 1.11±0.14 1.22±0.11 1.38±0.12 0.93±0.09 1.76±0.16 1.24±0.15 1.47±0.16Tb 0.74±0.13 0.82±0.13 1.15±0.17Th 8.8±0.4 8.1±0.4 8.2±0.3 9.6±0.3 8.4±0.3 10.0±0.3 9.5±0.3 9.9±0.3 U 5.0±0.6 3.3±0.4 5.4±0.3 3.7±0.2 3.8±0.5 5.3±0.6 3.6±0.5
Yb 2.93±0.15 2.47±0.17 2.44±0.15 3.6±0.1 2.39±0.12 2.96±0.21 3.33±0.10 3.32±0.2 Zn 127±14 109±15 84±14 134±13 86±8 153±15 117±14 154±15
117

Elemental data
QUMRAN SAMPLES concentrations in ppm 261 262 263 264 265 266 267 268
As 12±1 7±1 7±1 Ba 560±100 420±80 Br 33±2 10±1 14±1 13±1 18±2 15±1 17±1 24±2 Ce 84±2 84±2 72±2 65±1 64±1 85±2 86±3 64±2 Co 18.2±0.7 18.7±0.6 14.6±0.4 18.3±0.6 13.6±0.4 16.3±0.7 14.5±0.7 13.0±0.4 Cs 3.8±0.4 3.9±0.4 5.4±0.4 5.2±0.4 5.0±0.3 4.2±0.4 3.0±0.4 4.2±0.3 Cr 165±5 200±4 124±4 115±5 124±4 167±5 220±7 140±3 Eu 1.86±0.15 2.08±0.12 1.59±0.11 1.54±0.11 1.47±0.09 1.72±0.14 1.83±0.17 1.43±0.09
Fe% 5.28±0.11 5.68±0.06 4.69±0.05 4.50±0.04 4.52±0.05 5.74±0.12 5.19±0.11 4.54±0.05Hf 8.8±0.4 7.75±0.31 5.7±0.3 5.3±0.3 7.4±0.3 8.3±0.4 7.0±0.5 5.1±0.3
K% 1.67±0.03 2.48±0.02La 37.8±0.8 41.4±0.8 29.5±0.6 29.9±0.6 26.2±0.5 35.7±1.1 37.7±0.4 25.9±0.3 Lu 0.57±0.03 0.58±0.03 0.48±0.02 0.43±0.03 0.40±0.02 0.48±0.02 0.49±0.02 0.42±0.03Mo 13±2 8±2 7±1 11±2 15±2 16±2 6±1
Na% 1.19±0.02 0.60±0.02 0.48±0.01 1.06±0.02 0.45±0.02 0.54±0.03 0.53±0.01 1.24±0.01Nd Rb 93±16 80±11 112±12 92±10 112±12 92±13 64±8 Sb 1.4±0.2 1.1±0.4 0.6±0.1 0.7±0.1 1.0±0.3 1.4±0.2 1.1±0.1 0.57±0.02Sc 16.1±0.2 17.9±0.2 18.7±0.2 17.3±0.2 17.9±0.2 17.9±0.2 14.9±0.2 17.7±0.2 Se Sm 8.2±0.1 9.0±0.1 7.6±0.2 7.0±0.1 6.9±0.1 8.1±0.1 7.8±0.1 5.9±0.1 Ta 1.49±0.16 0.94±0.13 0.95±0.13 0.8±0.1 0.91±0.1 Tb 1.21±0.21 1.05±0.22 Th 10.3±0.4 10.3±0.3 9.2±0.3 8.4±0.3 9.1±0.3 9.2±0.4 9.3±0.5 8.1±0.2 U 5.8±0.8 5.6±0.2 4.5±0.3 3.7±0.6 4.0±0.3 5.8±0.9 6.0±0.6 4.0±0.16
Yb 3.33±0.27 3.53±0.14 2.76±0.08 3.0±0.2 2.88±0.14 2.94±0.26 3.0±0.3 2.29±0.18Zn 153±18 152±15 70±10 37±6 72±12 107±15 230±20 128±13
118

Elemental data
QUMRAN SAMPLES concentrations in ppm 269 270 271 272 273 274 275 276
As 5.3±0.1 1.8±0.3 7.6±0.2 6.8±0.2 5.8±0.2 8.3±0.2 3.2±0.2 9.9±0.4 Ba Br 20±2 14±1 23±1 32±2 11±1 10±1 28±1 100±2 Ce 47±1 53±2 53±2 56±1 64±1 88±2 76±2 54±2 Co 16.5±0.5 19.0±1.0 12.8±0.5 19.4±0.6 14.0±0.4 15.6±0.6 13.6±0.5 20.1±0.6 Cs 4.0±0.3 3.6±0.6 3.5±0.5 4.59±0.37 4.0±0.3 2.3±0.4 2.2±0.4 3.9±0.5 Cr 126±4 250±8 147±4 160±5 156±3 248±5 240±5 245±7 Eu 1.01±0.08 1.05±0.12 1.10±0.1 1.48±0.1 1.92±0.13 1.71±0.12 1.32±0.13
Fe% 3.70±0.04 4.43±0.09 3.74±0.07 4.58±0.05 4.75±0.05 5.24±0.11 4.42±0.09 4.20±0.1 Hf 3.56±0.25 5.52±0.55 3.8±0.3 5.6±0.3 7.0±0.3 9.6±0.4 7.8±0.4 4.02±0.4
K% 1.84±0.02 1.56±0.06 1.98±0.04 2.06±0.04 1.98±0.04 1.71±0.03 1.50±0.05 2.90±0.06La 21.2±0.2 22.0±0.4 23.3±0.2 21.9±0.2 25.2±0.3 38.7±0.4 32.9±0.3 22.9±0.5 Lu 0.31±0.03 0.35±0.03 0.30±0.03 0.44±0.02 0.40±0.03 0.26±0.06Mo 13±2 6±1 12±1 7±1 11±1
Na% 0.42±0.01 2.15±0.01 1.08±0.01 0.80±0.01 0.98±0.01 0.61±0.01 0.77±0.01 2.39±0.01Nd Rb 63±9 67±8 79±14 89±13 Sb 0.43±0.04 0.8±0.1 0.5±0.1 0.4±0.09 1.0±0.05 0.9±0.1 0.74±0.12Sc 15.9±0.2 18.0±0.2 14.4±0.1 19.0±0.2 16.3±0.2 15.4±0.2 13.4±0.1 17.6±0.2 Se Sm 4.7±0.1 5.2±0.1 5.0±0.1 5.3±0.1 6.2±0.1 8.2±0.1 7.1±0.1 5.7±0.1 Ta 0.81±0.11 1.12±0.18 Tb 0.88±0.18 Th 5.9±0.2 6.7±0.5 6.3±0.3 7.2±0.3 8.0±0.2 9.0±0.4 7.9±0.3 7.0±0.4 U 2.6±0.2 3.9±0.6 1.33±0.7 3.2±0.2 6.3±0.3 4.7±0.2 3.7±0.8
Yb 2.06±0.21 2.27±0.45 1.51±0.23 2.25±0.18 2.51±0.18 3.39±0.17 2.91±0.17 2.17±0.35Zn 68±10 70±15 73±16 57±9 160±18 96±17 86±1
119

Elemental data
QUMRAN SAMPLES Concentrations in ppm 285 286 287 288 289 290 291 292
As 11,8±0,2 5,9±0,2 6,1±0,2 5,1±0,2 3,8±0,2 6,7±0,3 3,1±0,2 5,7±0,3 Ba 316±40 400±50 330±50 482±52 Br 3,3±0,1 24±1 18±1 20±1 9±0,2 50±1 17±1 34±1
Ca% 27,6±0,6 9,57±1,3 10,56±1,42 7,76±0,39 4,96±0,29 14,63±0,6 4,42±0,27 11,47±0,57Ce 12,5±0,6 64,4±1,3 42,4±1,7 50,2±1,5 50,5±1,5 56,1±1,2 43,0±0,9 61,8±1,2 Co 1,92±0,10 14,0±0,14 11,1±0,3 14,7±0,3 13,5±0,3 12,6±0,3 8,2±0,2 15,2±0,3 Cs 2,63±0,16 3,45±0,24 3,69±0,22 5,06±0,20 1,71±0,19 3,33±0,17 3,18±0,25 Cr 290±3 168±2 86±3 142±3 92±2 160±3 78±1 166±3 Eu 0,47±0,03 1,44±0,04 0,96±0,07 1,33±0,07 1,38±0,06 1,37±0,07 1,10±0,06 1,56±0,08
Fe% 0,34±0,01 4,90±0,05 3,45±0,04 4,20±0,04 3,64±0,04 4,55±0,05 2,99±0,03 4,58±0,05 Hf 0,60±0,05 7,36±0,10 3,19±0,19 5,66±0,23 7,16±0,21 7,41±0,22 4,49±0,13 7,22±0,22
K% 1,66±0,10 1,72±0,10 2,53±0,02 2,23±0,11 1,54±0,14 1,81±0,01 1,93±0,17 La 12,8±0,2 33,3±0,3 21,5±0,2 26,9±0,3 25,1±0,3 28,4±0,3 20,9±0,2 33,3±0,3 Lu 0,31±0,02 0,45±0,02 0,28±0,01 0,32±0,02 0,38±0,02 0,44±0,02 0,30±0,02 0,45±0,02 Mo 20±2 5±0,2 2±0,8 1,4±0,7
Na% 0,096±0,01 0,63±0,01 0,83±0,01 0,76±0,01 0,41±0,01 0,85±0,01 0,61±0,01 0,66±0,01 Nd 27±5 24±5 29±6 20±4 Rb 57±4 58±8 73±7 85±6 46±7 54±5 70±8 Sb 1,01±0,03 0,77±0,04 0,39±0,04 0,57±0,03 0,27±0,03 0,82±0,06 0,30±0,03 0,80±0,05 Sc 3,24±0,03 15,3±0,2 13,7±0,1 15,3±0,2 16,0±0,2 13,2±0,1 12,5±0,2 15,7±0,2 Se 32,8±1 3,6±0,6 Sm 2,68±0,11 5,81±0,17 3,87±0,12 4,94±0,10 4,96±0,15 5,09±0,15 4,06±0,12 5,84±0,18 Ta 1,55±0,08 1,05±0,12 1,08±0,09 1,3±0,12 0,70±0,07 1,42±0,11 Tb 0,34±0,05 0,94±0,08 0,82±0,11 0,73±0,12 0,88±0,11 0,47±0,08 0,96±0,13 Th 1,02±0,06 8,11±0,08 6,11±0,18 7,18±0,22 6,94±0,14 7,45±0,22 5,51±0,11 8,02±0,24 U 22,7±0,23 4,2±0,21 3,04±0,18 2,99±0,15 3,32±0,13 3,82±0,20 1,74±0,10 4,26±0,21
Yb 2,11±0,06 3,33±1 2,00±0,12 2,69±0,08 2,62±0,1 2,93±0,06 2,14±0,11 3,06±0,12 Zn 304±9 214±9 140±10 204±8 113±6 207±8 77±6 180±9
120

Elemental data
QUMRAN SAMPLES Concentrations in ppm 293 294 295 296 297 298 299 300
As 6,3±0,4 7,1±0,4 3,8±0,2 4,7±0,2 6,8±0,3 5,9±0,3 5,7±0,2 3,9±0,2 Ba 1000±50 650±65 722±50 Br 41±1 68±2 4±0,3 11±1 3±0,3 4±0,2 0,7±0,1 18±1
Ca% 8,86±0,53 17,30±2,7 7,95±0,40 5,87±0,35 8,36±0,50 8,18±0,33 8,21±0,49 12,57±0,4Ce 49,3±1,5 53,9±1,6 49,7±1,5 53,9±1,6 48,8±1,5 52,1±1,6 100±2 73,7±2,2 Co 15,9±0,5 9,7±0,3 12,4±0,3 12,2±0,2 16,9±0,3 14,2±0,3 9,94±0,2 27,6±0,6 Cs 5,50±0,27 1,72±0,16 4,97±0,25 5,10±0,20 7,46±0,30 6,92±0,28 10,5±0,1 3,81±0,23Cr 116±3 170±4 94±3 110±2 117±4 118±4 81±2 96±3 Eu 1,33±0,08 1,40±0,06 1,18±0,06 1,34±0,05 1,30±0,08 1,40±0,07 1,62±0,06 1,58±0,06
Fe% 4,18±0,05 3,10±0,03 3,90±0,04 4,27±0,04 4,49±0,05 4,85±0,05 3,68±0,04 3,43±0,03Hf 4,09±0,25 3,62±0,18 5,81±0,23 6,31±0,19 3,67±0,66 4,18±0,25 8,17±0,16 6,93±0,21
K% 3,74±0,22 1,95±0,16 1,84±0,09 2,19±0,09 4,22±0,17 4,28±0,17 1,44±0,10 1,16±0,13La 23,5±0,2 34,2±0,34 24,7±0,3 25,5±0,3 24,6±0,3 24,5±0,2 45,0±0,5 38,0±0,3 Lu 0,41±0,02 0,49±0,03 0,37±0,02 0,41±0,04 0,34±0,02 0,37±0,02 0,41±0,02 0,41±0,02Mo 4±1 2±0,9
Na% 0,73±0,01 0,61±0,01 0,27±0,01 0,30±0,01 0,34±0,01 0,28±0,02 0,99±0,09 1,14±0,01Nd 22±6 25±5 19±5 20±4 31±7 16±2 26±5 Rb 106±10 42±5 83±8 76±7 103±9 117±11 88±6 Sb 0,82±0,20 0,53±0,05 0,41±0,03 0,48±0,03 0,49±0,04 0,47±0,04 0,46±0,03 0,28±0,04Sc 17,7±0,2 11,4±5,1 15,9±0,2 17,9±0,2 18,7±0,2 19,5±0,2 11,1±0,1 13,6±0,1 Se Sm 4,73±0,14 5,66±0,17 4,73±0,14 5,30±0,16 4,94±0,20 4,92±0,15 7,09±0,14 6,27±0,13Ta 0,81±0,13 1,09±0,10 1,17±0,09 1,07±0,09 1,07±0,11 1,07±0,11 1,66±0,08 1,41±0,12Tb 0,98±0,10 0,88±0,11 0,76±0,10 0,93±0,1 0,83±0,12Th 7,72±0,23 7,97±0,16 7,24±0,22 7,52±0,15 7,73±0,23 8,06±0,24 21,5±0,2 9,69±0,19U 3,08±0,18 6,25±0,19 2,81±0,14 2,99±0,15 3,17±0,16 2,83±0,20 3,29±0,16 2,93±0,21
Yb 2,21±0,15 3,22±0,13 2,60±0,05 2,75±0,08 2,48±0,25 2,45±0,12 2,64±0,08 2,87±0,11Zn 182±9 187±7 115±6 110±7 112±9 121±7 80±5 158±6
121

Elemental data
QUMRAN SAMPLES Concentrations in ppm 301 302 303 304 305 306 306/b 307
As 5,4±0,2 7,7±0,4 10,4±0,3 5,6±0,3 18,8±0,4 4,0±0,2 3,7±0,2 13,4±0,4 Ba 240±40 330±40 229±40 820±60 Br 22±1 100±2 26±1 6±0,6 23±0,6 19±0,4 14±1
Ca% 8,11±0,41 29,58±0,3 8,74±0,52 8,07±0,4 6,34±0,95 31,11±0,6 30,56±0,6 9,81±0,39Ce 48,9±1,5 34,0±0,7 66,4±1,3 48,6±1,5 43,6±1,3 26,4±1,1 17,2±0,9 93,2±1,9 Co 12,1±0,2 11,0±0,2 16,1±0,3 14,6±0,3 20,1±0,4 8,70±0,26 4,05±0,16 13,3±0,3 Cs 1,60±0,14 1,51±0,11 3,14±0,22 5,60±0,22 3,42±0,24 0,95±0,15 0,75±0,11 3,45±0,21Cr 130±3 135±3 160±3 114±3 122±2 105±2 72±2 101±3 Eu 1,24±0,05 0,70±0,03 1,65±0,07 1,30±0,06 1,30±0,06 0,68±0,05 0,44±0,04 1,62±0,06
Fe% 3,64±0,04 2,04±0,02 5,45±0,05 4,54±0,05 4,51±0,05 2,13±0,04 2,07±0,02 4,24±0,04Hf 7,01±0,21 3,60±0,10 5,98±0,24 3,73±0,22 4,16±0,25 2,25±0,16 1,46±0,12 5,91±0,18
K% 1,41±0,01 1,31±0,12 2,26±0,18 4,36±0,22 2,77±0,19 0,52±0,01 2,65±0,26La 25,7±0,3 19,7±0,2 35,2±0,4 23,7±0,2 21,9±0,2 17,02±0,34 9,60±0,19 44,5±0,5 Lu 0,38±0,06 0,24±0,02 0,46±0,02 0,35±0,02 0,35±0,02 0,21±0,05 0,14±0,01 0,37±0,02Mo 3±0,7 2±0,9 5±0,7 7±1
Na% 0,60±0,01 0,65±0,01 0,74±0,01 0,21±0,01 0,82±0,01 0,26±0,01 0,19±0,01 0,68±0,01Nd 21±5 21±5 24±9 24±8 Rb 42±5 29±4 72±9 84±9 70±8 86±9 Sb 0,63±0,04 0,90±0,05 0,52±0,04 0,40±0,04 0,70±0,05 0,45±0,03 0,32±0,02 0,74±0,04Sc 11,2±0,11 6,61±0,07 18,3±0,2 19,2±0,2 17,6±0,2 8,74±0,09 6,25±0,06 12,2±0,2 Se 43±1 5,7±1,0 Sm 4,63±0,09 3,19±0,10 6,15±0,18 4,52±0,18 4,29±0,13 2,60±0,08 1,89±0,08 6,85±0,21Ta 1,25±0,09 0,64±0,06 1,58±0,13 0,94±0,09 0,98±0,11 1,63±0,11Tb 0,70±0,11 0,36±0,06 0,80±0,13 1,06±0,13 0,64±0,09 Th 5,97±0,18 3,82±0,11 8,50±0,26 7,58±0,23 6,32±0,25 2,62±0,16 1,48±0,12 20,3±0,2 U 3,88±0,16 7,85±0,24 3,89±0,23 2,87±0,11 2,47±0,22 6,55±0,13 10,2±0,1 4,37±0,13
Yb 2,48±0,07 1,86±0,09 3,22±0,16 2,33±0,12 2,50±0,15 1,53±0,09 1,01±0,07 2,84±0,11Zn 153±6 230±20 174±7 137±8 121±7 115±6 70±3 134±7
122

Elemental data
QUMRAN SAMPLES Concentrations in ppm 308 309 310 311 312 313 314 315
As 6,3±0,3 7,1±0,2 6,1±0,3 7,5±0,2 6,67±0,27 4,71±0,24 6,3±0,3 8,9±0,3 Ba 470±50 Br 9±0,5 13±1 58±1 24±1 14±1 24±1 22±1 10±1
Ca% 8,88±0,53 10,92±0,4 17,44±0,5 12,02±0,5 4,25±0,3 6,83±0,34 9,73±0,4 6,20±0,3 Ce 67,8±1,4 75,0±2,0 37,5±1,2 58,2±1,3 50,6±1,0 40,2±0,8 53,9±1,1 57,5±1,2 Co 15,3±0,3 17,0±0,3 10,3±0,3 16,1±0,1 18,8±0,4 8,9±0,2 11,1±0,2 16,8±0,3 Cs 2,70±0,22 2,24±0,22 5,04±0,25 4,52±0,23 7,22±0,29 3,83±0,19 4,57±0,23 5,28±0,21Cr 211±4 201±4 133±3 153±3 154±4 133±3 138±3 150±3 Eu 1,62±0,08 1,74±0,07 0,91±0,06 1,41±0,06 1,19±0,06 1,04±0,05 1,29±0,05 1,39±0,06
Fe% 4,87±0,05 5,21±0,05 3,46±0,03 4,52±0,05 4,87±0,05 3,53±0,04 3,99±0,04 4,55±0,05Hf 7,25±0,22 10,2±0,3 2,90±0,17 4,97±0,20 3,77±0,19 4,87±0,15 4,90±0,20 5,34±0,21
K% 1,79±0,09 1,77±0,11 3,20±0,13 0,20±0,11 3,49±0,14 2,17±0,13 1,90±0,11 3,05±0,15La 33,5±0,3 36,7±0,4 18,6±0,2 27,2±0,3 24,1±0,2 20,5±0,2 24,5±0,2 27,7±0,3 Lu 0,44±0,02 0,45±0,02 0,26±0,01 0,37±0,02 0,32±0,02 0,32±0,02 0,38±0,02 0,40±0,04Mo 3±1 3±1 4±1 4±1 2±0,8
Na% 0,61±0,01 0,61±0,06 0,42±0,01 0,60±0,06 0,47±0,05 0,58±0,01 0,46±0,01 0,65±0,01Nd 32±8 14±4 30±5 21±4 20±4 18±4 26±5 Rb 59±2 44±7 95±9 89±10 89±6 69±6 84±7 106±7 Sb 0,75±0,05 0,62±0,04 0,49±0,04 0,42±0,04 0,31±0,03 0,45±0,04 0,57±0,03Sc 15,9±0,2 15,5±0,2 14,4±0,1 17,6±0,2 20,5±0,2 14,7±0,2 16,1±0,2 18,4±0,2 Se Sm 6,0±0,2 6,48±0,26 3,65±0,11 5,51±0,05 4,66±0,14 3,86±0,12 5,10±0,15 5,50±0,17Ta 1,61±0,13 2,06±0,14 0,56±0,09 1,07±0,11 0,96±0,10 1,01±0,08 0,99±0,08 1,11±0,09Tb 1,10±0,15 0,98±0,13 0,85±0,12 0,76±0,09 1,10±0,11 0,92±0,10Th 8,27±0,17 9,55±0,19 5,59±0,22 7,82±0,23 8,24±0,16 6,39±0,13 7,11±0,14 8,29±0,17U 4,29±0,21 4,41±0,18 2,18±0,22 3,41±0,20 2,85±0,17 3,14±0,22 3,15±0,16 3,23±0,16
Yb 2,67±0,32 3,37±0,07 1,86±0,22 2,71±0,12 2,37±0,07 2,07±0,10 2,57±0,15 2,94±0,09Zn 193±8 170±7 100±8 129±9 168±10 125±3 105±7 190±8
123

Elemental data
QUMRAN SAMPLES Concentrations in ppm 316 317 318 319 320 321
As 11,8±0,5 6,9±0,3 6,7±0,3 5,7±0,4 5,4±0,3 8,9±0,5 Ba 411±60 Br 18±1 7±0,5 37±0,5 23±0,5 20±1 6±0,3
Ca% 4,40±1,3 3,83±0,4 6,68±0,3 8,84±0,3 4,68±0,29 Ce 73,4±2,2 44,8±1,4 45,4±1,4 45,5±1,0 49,0±1,0 60,7±1,8 Co 16,1±0,3 9,2±0,2 12,2±0,2 17,8±0,4 10,4±0,2 15,4±0,3 Cs 3,81±0,23 7,55±0,23 5,78±0,23 5,45±0,22 5,43±0,22 6,16±0,25Cr 228±3 170±5 140±3 131±3 156±3 179±4 Eu 1,76±0,07 0,99±0,05 1,15±0,05 2,22±0,22 1,30±0,10 1,48±0,06
Fe% 5,52±0,06 4,84±0,05 4,19±0,05 3,95±0,04 4,31±0,04 4,95±0,05Hf 6,13±0,25 3,16±0,19 6,96±0,21 5,39±0,16 5,63±0,17 6,43±0,18
K% 1,60±0,19 4,82±0,24 1,65±0,18 2,22±0,22 2,79±0,25 2,74±0,27La 41,4±0,4 21,0±0,5 23,0±0,2 23,5±0,5 23,7±0,2 28,7±0,3 Lu 0,53±0,02 0,29±0,01 0,35±0,02 0,37±0,02 0,40±0,02 0,42±0,02Mo 2±0,5
Na% 0,68±0,01 0,31±0,01 0,50±0,01 0,59±0,01 0,74±0,01 0,57±0,01Nd 32±8 16±5 25±5 17±5 19±7 Rb 64±7 125±8 85±5 104±7 92±6 109±8 Sb 0,79±0,06 0,42±0,04 0,52±0,04 0,40±0,04 0,39±0,03 0,50±0,05Sc 17,5±0,2 19,2±0,2 16,3±0,2 15,8±0,2 18,2±0,2 20,1±0,2 Se 5,1±1,0 Sm 7,27±0,15 4,16±0,12 4,55±0,14 4,85±0,04 4,95±0,15 5,57±0,11Ta 2,13±0,13 1,10±0,09 1,24±0,09 1,10±0,10 1,00±0,08 1,53±0,11Tb 1,13±0,11 0,61±0,10 0,81±0,09 0,69±0,10 0,76±0,10 Th 9,58±0,19 7,65±0,15 7,53±0,15 7,09±0,14 7,74±0,15 9,23±0,18U 4,29±0,26 3,30±0,17 3,01±0,12 2,79±0,14 3,17±0,16 2,14±0,21
Yb 3,65±0,07 1,97±0,10 2,16±0,11 2,36±0,10 2,42±0,10 2,71±0,05Zn 188±8 137±8 102±6 78±5 106±6 114±9
124

Bibliography
Bibliography Ambrosino, G., Pindrus, P. (1953). Rev. Metall. 50, 136. Aspinall, A. (1977). Neutron activation analysis of medieval ceramics, Medieval Ceramics
1,5. Asaro, F., Michel, H.V., Mosier, D. (1977). Application of NAA archaeology and the
humanities, Rep. LBL-6877. Asworth, M.J., Abeles, T.P. (1966). Neutron Activation Analysis and Archaeology, Nature,
Vol.210., No 5031, p.9. Balla, M., Jerem, E., Balázs, l. (1998). Early Celtic stamped pottery in the Eastern Alpine
Area:Workshop Activity and Trade, In Archaeometrical Research in Hungary II., Budapest, p. 85
Balla, M., Zsidi, P., Balázs, L. (1999). Spread of Mortaria Types in Municipium Aquincum
(Óbuda, Hungary), Journal of Archaeological Science 26, p. 997.
Balla, M., Molnár, Zs., Kőrös, Á. (2004). Uncertainty budget and validation of NAA using Reference Materials, Journal of Radioanalytical and Nuclear Chemistry, Vol. 259, No.3. p.395.
Balázs, L. (2003). Archaeological data analysis (Data mining). In Khirbet Qumran et ’Ain
Feshkha II.Studies of Anthropology, Physics and chemistry. Academic Press Fribourg, Vandenhoeck & Ruprecht Göttingen. p.55.
Beier, T., Mommsen, H. (1994). Modified Mahalanobis filters for grouping pottery by chemical composition, Archaeometry 36, p. 287.
Beit-Arieh, I. (1997). The Dead Sea region: An archaeological perspective. In The Dead Sea.
The Lake and Its Setting, eds. Niemi, T.M., Ben-Avraham, Z., Gat, J.R., Oxford University Press. p.249.
Bishop, R.L. (2003). Instrumental neutron activation analysis of archaeological ceramics:
progress and challenges. In Nuclear Analytical techniques in Archaeological Investigations. IAEATechnical reports Series No. 416. p.35.
Bode,P., Blaauw,M., Obrusnik,I. (1992). Variation of Neutron Flux and Related Parameters in
an Irradiation Container in Use with k0-Based Neutron Activation Analysis, Journal of Radioanalytical and Nuclear Chemistry 157. p.301.
Bode, P. (1996). Instrumental and organizational aspects of a neutron activation analysis
125

Bibliography
laboratory. PhD Thesis, Interfacultair Reactor Instituut, Delft University of Technology.
Brothwell, D.R., Pollard, A.M. eds. (2001). Handbook of Archaeological Sciences, John
Wiley & Sons. Buck, C.E., Cavanagh, W.G., Litton, C.D. (1996). Bayesian Approach to Interpreting
Archaeological Data. John Wiley&Sons. Cross, E.M., Eshel, E. (1997). Ostraca from Khirbet Qumran, Israel Exploration Journal 47, p.
17. Crown, A.D., Cansdale, L. (1994). Qumran-Was it an Essene Settlement? Biblical
Archaeology Review 20, 5. p.25. Davies, P.R., Brooke, G., Callaway, P.R. (2002). A holt-tengeri tekercsek világa, Alexandra
Kiadó DeAtley,S.P., Bishop,R.L.(1991). Toward an integrated interface for archaeology and
archaeometry. In The Ceramic Legacy of Anna O. Sephard, eds. Bishop, R.L. and Lange, F.W., University Press of Colorado, Boulder, Colorado. p.358.
DeCorte, F. (1987). The k0- standardization method. PhD Thesis. University of Gent. De Vaux, R. (1973). Archaeology and the Dead Sea Scrolls. The Schweich Lectures of the
British Academy, 1959. Oxford University Press. Donceel, R., Donceel-Voute, P. (1994). The Archaeology of Khirbet Qumran, In Methods of
Investigation of the Dead Sea Scrolls and the Khirbet Qumran Site. Present Realities and Future Prospects, eds. Wise, M.O., Golb, N., Collins, J.J., Annales of the New York Academy of Sciences. p.1.
Emeleus, V.M. (1958). NAA as applied to trace element determination in pottery and coins,
Archaeometry 1., p.6. Emeleus, V.M. Simpson, G. (1960). Neutron activation analysis of ancient Roman potsherds.
Nature 185. 196. Eurachem Guide (1998). The fitness for Purpose of Analytical Methods. A Laboratory Guide
to Method Validation and related Topics, Developed by EURACHEM Working Group, produced by LGC(Teddington) Ltd.
126

Bibliography
Glascock, M.D. (1992). Characterization of archaeological ceramics at MURR by neutron activation analysis and multivariate statistics. In Chemical Characterization of Ceramic Pastes in Archaeology, ed. Neff, H., Prehistory Press, Madison, Wisconsin. p. 11.
Glascock, M.D., Fowler, W.R., Houston, S. (1993). Sourcing of archaeological obsidian by an abbreviated NAA procedure. Journal of Radioanalytical and Nuclear Chemistry,
Golb, N. (1995). Who wrote the Dead Sea Scrolls? The Search for the Secret of Qumran. A
Touchstone Book Published by Simon&Schuster. Guinn, P. ( 1992). A Short History of Nuclear Activation Analysis. In Nuclear Analytical
Methods in the Life Sciences, eds. Zeisler,R., Guinn, V.P., Humana Press, Clifton, New Yersey.
Guinn, P. (1999). Rapid growth, maturity current problems, future prospects of NAA. J. Radioanalytical and Nuclear Chemistry, Vol.244, No.1. p.23.
Gunneweg, J.,Perlman, I., Yellin, J. (1983). The Provenience, Typology and Chronology of
Eastern Terra Sigillata, Monograph of the Hebrew University, Jerusalem, QEDEM Series 17.
Gunneweg,J., Perlman, I., Meshel, Z.(1985). A Provenience Study on Pithoi from Kuntillet
‘Ajrud, Israel Exploration Journal 35, p.270 Gunneweg, J., Perlman, I. (1985b). The Origin of the ‘Herodian’ Lamp, Bulletin of the
Anglo-Israel Archaeological Society, p.79.
Gunneweg, J., Perlman, I., Asaro, F. (1988). The Origin, Classification and Chronology of
Nabatean Painted Fine Ware, Jahrbuch des Roemisch-Germanisches Museum Mainz, 35. p.315.
Gunneweg, J., Mommsen, H. (1990). Instrumental Neutron Activation Analysis and the Origin of Some Edomite Vessels and Cult Objects from Horvat Qitmit, Archaeometry, 32. p.7.
Gunneweg, J., Perlman, I., Asaro, F. (1994). Interregional contacts between Tell en-Nasbeh and littoral Philistine centers in Canaan during Early Iron Age I, Archaeometry 36, p. 227.
Gunneweg, J., Mommsen, H. (1995). Instrumental Neutron Activation Analysis of vessels and
127

Bibliography
cult objects. In Horvat Qitmit, an Edomite Shrine in the Biblical Negev, ed. Beit-Arieh, I., Monograph Series of the Institute of Archaeology, Tel Aviv University. p. 280.
Gunneweg, J., Balla, M. (2001). How Neutron Activation Analysis Can Assist Research into the Provenance of the Pottery at Qumran. In Historical Perspectives: From the Hasmoneans to Bar Kokhba in the Light of the Dead Sea Scrolls. Proceedings of the Fourth International Symposium of the Orion Center for the Study of the Dead Sea Scrolls and Associated literature, eds. Goodblatt, D., Pinnick, A., Schwartz, D.R., STDJ 37, Leiden, Brill. P.179.
Gunneweg, J., Balla, M. (2003).Neutron Activation Analysis. Scroll Jars and Common Ware, In Khirbet Qumran et ’Ain Feshkha II. Studies of Anthropology, Physics and Chemistry, eds. Humbert, J-B., Gunneweg, J., Academic Press Fribourg, Vandenhoeck & Ruprecht Göttingen. p.3.
Gunneweg, J., Balla,M. (2003b). Possible Connection Between the Inscriptions on Pottery,
the Ostraca and Scrolls found in the Caves, In Khirbet Qumran et ’Ain Feshkha II. Studies of Anthropology, Physics and Chemistry, eds. Humbert, J-B., Gunneweg, J., Academic Press Fribourg, Vandenhoeck & Ruprecht Göttingen. p.389.
Hancock, R.G.V. (1985). On the source of clay used for Cologne Roman pottery,
Archaeometry 26, p. 210.
Hancock, R.G.V., Millet, N.B., Mills, A.J. (1986). A rapid INAA method to characterize Egyptian ceramics, Journal of Archaeological Science 13. p.107.
Harbottle, G. (1982). Chemical characterization in archaeology. In Contexts for Prehistoric
Exchange, eds. Ericson, J.E. and Earle, T.K., Academic Press, New York, p.13. Harding, L. (1952). Khirbet Qumran and Wady Murabba’at: Fresh Light on the Dead Sea
Scrolls and New Manuscripts Discoveries in Jordan, Palestine Exploration Quarterly 84. p.104.
Hevesy, G., Levi, H. (1936). The Action of Neutrons on the Rare Earth Elements, Det. Kgl.
Danske Videnskabernes Selskab. Mathematisk-Fysike Meddelelser. 14 (5), p3. Humbert, J-B., Chambon, A. (1994). Fouilles de Khirbet Qumran et de Ain Feshka, Vol. I.
Éditions Universitaires Fribourg Suisse, Vandenhoeck&Rupprecht Göttingen. Kilikoglou, V.I., Papagiannopoulos, A., Doumas, C., Grimanis, A. (1984). Provenance studies
of Akrotiri pottery by NAA. An attempt to identify middle Cycladic pottery, In Proceedings of the Symposium of Archaeometry, Smithsonian Institution, Washington D.C.
128
Bibliography
Kilikoglou, V., Vekinis, G., Maniatis, Y. (1995). Toughening of ceramic earthenwares by
quartz inclusions: An ancient art revisited, Acta Metallurgica et Materiallia 43, 8. p. 2959.
Kuleff, I., Djingova, R., Penev, J. (1986). Instrumental Neutron Activation Analysis of
Pottery for Provenience Study, Journal of Radioanalytical and Nuclear Chemistry 99, 2. p.345.
Kuleff,I., Djingova,R. (1996). Provenance study of pottery: choice of elements to be
determined, Revue d’Archéometrie, 20. p.57. Kuleff, I., Djingova,R. (1998). Mean concentration of elements determined in Ohio Red Clay,
Journal of Radioanalytical and Nuclear Chemistry, 237, 2. p.3. Lemaire, A. (2003). Inscriptions du khirbeh, des grottes et de ’Ain Feshkha. In Khirbet
Qumran et ’Ain Feshkha II. Studies of Anthropology, Pysics and Chemistry, eds. Humbert, J-B., Gunneweg, J., Academic Press Fribourg, Vandenhoeck & Ruprecht Göttingen. p.341.
Libby, W.F. (1952). Radiocarbon Dating, University of Chicago Press Magness, J. (2003). The Archaeology of Qumran and the Dead Sea Scrolls. W.B. Eerdmans
Publishing Company, Grand Rapids, Michigan/ Cambridge, U.K. Michniewicz,J., Krzysko, M. (2003). The provenance of Scroll Jars in the Light of
Archaeometric Investigations. In Khirbet Qumran et ’Ain Feshkha II. Studies of Anthropology, Physics and Chemistry, eds. Humbert, J-B., Gunneweg, J., Academic Press Fribourg, Vandenhoeck & Ruprecht Göttingen. p.59.
Mommsen, H., Kreuser, A., Weber, J., Büsch, h. (1987). Neutron activation analysis of
ceramics in the X-ray energy region, Nuclear Instruments and Methods, Phys.Res. A.257. p. 451.
Mommsen, H., Lewandowski, E., Weber, J., Podzuweit, Ch. (1988). Neutron Activation Analysis of Mycenean Pottery from the Argolid: The search for Reference Groups, In Proceedings of the International Sympsium of Archaeometry, Toronto, eds. Farquar, R.M., Hancock, R.G.V., Pavlish, A., University of Toronto, p. 165.
Mommsen, H., Beier, T., Diehl, U., Podzuweit, C. (1992). Provenance determination of
Mycenean sherds found in Tell el Amarna by NAA, Journal of Archaeological Science, 19. p. 295.
129
Bibliography
Neff, H. (1992). Ceramic raw materials survey in Pacific Coastal Guatemala, In Chemical Characterization of Ceramic Pastes in Archaeology, ed. Neff, H., Prehistory Press, Madison, p. 59.
Neff, H. (1993). Theory, sampling and analytical techniques in the archaeological study of prehistoric ceramics, American Antiquity 58, p.23.
Niemi, T.M., Ben-Avraham, Z., Gat, J.R. (1997). The Dead Sea. The Lake and Its Setting. Oxford University Press.
Perlman, I., Asaro, F. (1969). Pottery Analysis by Neutron Activation. Archaeometry 11.,
p.21.
Perlman, I., Asaro, F. (1970). Deduction of provenience of pottery from trace element analysis, In Scientific Methods in Mediaeval Archaeology, ed. Berger, R., University of California Press, Berkeley, Los Angeles, p. 389
Perlman, I., Asaro, F. (1971). Pottery Analysis by Neutron Activation, In Science and Archaeology, ed. Brill, R.H., MIT Press, Cambridge, Mass. & London, England, p. 182.
Perlman, I. (1981). Applications to Archaeology, In Nondestructive Activation Analysis, Studies in Analytical Chemistry 3, ed. Amiel, S., Elsevier, p.259.
Perlman, I., Gunneweg, J., Yellin, J. (1986). Pseudo-Nabatean ware and pottery from Jerusalem, Bulletin of the American School of Oriental Research 262. p. 77.
Pollard,A.M., Heron,C. eds. (1996). Archaeological Chemistry, The Royal Society of
Chemistry. Rathgen, F. (1898). Die Konservierung von Alterthumsfunden, Berlin, W.Spemann Sayre, E.V., Dodson, R.W.(1957). Neutron activation study of Mediterranean potsherds.
American Journal of Archaeology 61. p.35.
Sayre, E., Chan, L.H., Sabloff, J.A. (1971). High-resolution gamma ray spectroscopic analysis of Mayan fine orange pottery, In Science and Archaeology, ed. Brill, R., MIT Press, Cambridge, p. 165.
Thiede, C.P., D’Ancona, M. (1996). The Jesus Papyrus, Weidenfeldicholson, London. p. 100.
130

Bibliography
Thiede, C.P.(2000). The Dead Sea Scrolls and the Jewish Origins of Christianity, Lion
Publishing plc. Oxford. p. 96. Tite, M. (1991). Archaeological science – past achievements and future prospects.
Archaeometry 31. p.139. Vermes, G. (1998). A qumráni közösség és a holt-tengeri tekercsek története. Osiris Kiadó,
Budapest.
Whitebread, I.K. (2001). Ceramic petrology, clay geochemistry and ceramic production – from technology to the mind of potter. In Handbook of Archaeological Sciences, eds. Brothwell, D.R., Pollard, A.M., John Wiley&Sons, p.449.
Widemann, F., Picon, M., Asaro, F., Michel, H.V., Perlman, I. (1975). A Lyons branch of the
pottery making firm of Ateius of Arezzo, Archaeometry 17. p.45. Widemann, F., Laubenheimer, F., Attas, M., Fontes, P., Gruel, K., Leblanc, J., Lleres, J.
(1978). Analytical and typological study of Gallo-Roman workshops producing amphorae in the area of Narbonne, Archaeophysika 10, Bonn, p. 317
Widemann, F. (1980). Neutron activation analysis for provenance studies of archaeological artifacts, Journal of Radioanalytical and Nuclear Chemistry 55, 2., p.271.
Widemann, F. (1980). Etudes analytiques de provenance pour les céramiques, Dossiers de’l archéologie 42, p. 28.
Wilson, L., Pollard, A.M. (2001). The provenance hypothesis. In Handbook of Archaeological
Sciences, eds. Brothwell, D.R., Pollard, A.M., John Wiley&Sons. p.507. Yellin, J., Perlman, I., Asaro, F., Michel, H.V., Mosier, D.F. (1978). Comparison of neutron
activation analysis from the Lawrence Berkeley Laboratory and the Hebrew University, Archaeometry 20, 1. p. 95.
Yellin, J. (1985). The provenance ot two red-on-black sherds from Tel Mevorakh, Israel Exploration Journal 35. p.46.
Yellin, J., Gunneweg, J. (1989). The Flower Pots from Herod’s Garden at Jericho, Israel
Exploration Journal 39. p. 87. Zeuner, P.E. (1960). Notes on Qumran. Palestine Exploration Quarterly, January-June. p.27.
131

Bibliography
Classic Authors Flavius Josephus, Bellum Judaicum. A zsidó háború, ford. Révay József, Gondolat Kiadó,
Budapest, 1965.
Pliny the Elder, Historia Naturalis, A természet históriája, ford. Váczi Kálmán, Kriterion Könyvkiadó 1973.
Philo of Alexandria, Every Good Man is Free Quotes and references from all of the three authors can be found in The Essenes According to the Classical Sources, Journal for the Study of the Old Testament, Sheffield, 1989.
132

Acknowledgements
I would like to thank to Professor Gyula Csom and Professor Zoltán Szatmáry for
giving me the opportunity of performing archaeological studies at the Institute of Nuclear
Techniques. I am grateful for their unflagging attention and support.
I am indebted to my colleagues, Nóra Vajda, Dénes Bódizs, József Szabó, Györgyi
Csuday, Katalin Jovicza, who have contributed in various ways to the production of this
Thesis.
I am particularly grateful to Zsuzsa Molnár, for helping me with her expertise in the
fild of neutron activation analysis, and to László Balázs for the statistical analyses, which
were of vital importance.
Finally, my special thanks go to Jan Gunneweg, wrapped in a text from Qumran
Cave4: “…he will not answer before he hears and he will not speak before he understands.
With patience he will reply and humbly he will express himself. He will seek truth and
justice, and in seeking for the righteousness he will find its origins.” (4Q421)
133