protracted displacement: uncertain paths to self …...protracted displacement: uncertain paths to...
TRANSCRIPT

Protracted displacement Uncertain paths to self-reliance in exile
Annexes 2 – 7 September 2015 Full report available at odi.org/hpg/protracted-displacement

Table of Contents
Annex 2 – Statistical analysis ............................................................................................................. 3
Annex 3 – Review methodology ..................................................................................................... 59
Annex 4 – Typology 2: Assessing the environment for successful self-reliance programming ............. 63
Annex 5 – Typology 2: Rubric ......................................................................................................... 68
Annex 6 – Typology 2: Results of the pilot application .................................................................... 71
Annex 7 – Protracted displacement - Terms of Reference ................................................................. 89
Protracted displacement: Uncertain paths to self-reliance in exile – Annexes | 2

Annex 2: statistical analysis
Data source selection criteria
The following criteria were taken into account in selecting data sources for the Level One typology.
• The underlying data should be publicly available with a clear published methodology. Ideally publicly
available figures should be more reliable than internal figures as they are subject to public scrutiny.
Public availability also means that the data would be reproducible – the typology could be extended to
cover additional years without requiring access to confidential data. This version of Annex 2 makes no
use of internal data sets, but only uses published data.
• The data had to cover a wide range of countries for a significant time-span.
There is no one perfect data source. An appendix at the end of this annex discusses the quality of the data
available. All data sources involved some sort of compromise. The main data sources used are:
For numbers of displaced:
1. The UNHCR Population Statistics Database as published on 22 June 2015.1 This major revision
included the cleaning of null data. The database contains data about UNHCR’s populations of concern
from 1951 up to 2014, and includes details of various aspects of these populations: their general
composition by location of residence or origin, their status (refugees, asylum-seekers, internally
displaced persons, etc.), their evolution over time and other factors. This dataset represents a huge
improvement on the previous version and UNHCR is to be congratulated on such an addition to the
resource data on refugee displacement. However, this data-set is less useful for IDPs as it only includes
‘conflict-generated IDPs to whom the Office extends protection and/or assistance’.2 The UNHCR data-
set omits some major caseloads of IDPs, particularly those living in protracted displacement such as in
Turkey or India. The UNHCR figures for IDPs often reflect official state figures, which frequently
understate or overstate the problem for internal political reasons.
2. IDMC data on IDPs displaced by conflict. IDMC gathers data on internal displacement from a variety
of sources, including UNHCR. Due to the way this data is collected and aggregated, IDMC’s annual
country-level estimates do not distinguish between different groups of IDPs within a country. It may
happen that one part of the total IDP national caseload is returning to their homes while another is in
the process of being displaced. IDMC’s estimates are based on an aggregation of: IDPs displaced in
previous years (i.e., living in protracted displacement); IDPs newly displaced within that year; and, in
some contexts, children born into displacement. When the data is available, the IDPs who have
returned, integrated locally, settled elsewhere, fled across international borders or died during that year
are subtracted from the total annual cumulative figure. IDMC reports IDPs in nearly twice as many
countries as UNHCR. However, while new movements of IDPs are reported, returns of IDPs are less
1 http://popstats.unhcr.org/en/persons_of_concern. The revised database (dating from 18 June) was first published on 20 June, but a revised (22 June) version, with about 15,000 additional records, was downloaded on 26 June 2015. 2 http://popstats.unhcr.org/en/overview
Protracted displacement: Uncertain paths to self-reliance in exile – Annexes | 3

reported, while data on IDPs who have integrated locally or settled elsewhere is reported in only a few
cases.
3. UNRWA reporting on the UNRWA caseload (various UNRWA reports at http://www.unrwa.org/).
Since the end of 2011 UNRWA has split its caseload figures into registered refugees and other registered
persons receiving UNRWA assistance (approx. 7% of the UNRWA caseload). The figures in the table
are for all registered persons as the two categories were reported jointly for 2009 and 2010. UNRWA
provides support in Jordan, Lebanon, Syria and the West Bank and Gaza. Estimates for years prior to
2009 were developed by applying the average population growth rate for the period for which numbers
were available. UNRWA financial data was also used.
Financial data was abstracted from:
4. UNHCR country-level spending data for 2013. This data is from a new website launched by UNHCR in
early March 2015 (http://reporting.unhcr.org/financial). Previously, this information was not available
on any publicly accessible website.
5. WFP financial data from the Performance Report to the board.
6. UNICEF data from the UNICEF website and reports.
7. The financial summaries of humanitarian assistance produced by Development Initiatives in the Global
Humanitarian Assistance report at http://www.globalhumanitarianassistance.org/. This data-rich report
is the most comprehensive estimate of humanitarian funding.
Other important data sources were:
8. ReliefWeb posting data (at http://reliefweb.int/updates). ReliefWeb is the premier site for reports on
humanitarian action. Since 2005 there have been over 36,000 posts a year on average in English, and
the number of postings has been increasing by 2.2% a year over the last decade. Postings in English only
were considered to avoid double counting translated postings. As discussed below, the number of
ReliefWeb postings is a good proxy for the overall level of humanitarian funding for any given country.
9. The Fund for Peace’s Fragile States Index (FSI) (methodology at http://ffp.statesindex.org/methodology).
This is an index composed of 12 indicators with an average of 14 sub-indicators each. The Index is
based on the Fund for Peace’s proprietary Conflict Assessment System Tool analytical platform.
Millions of documents are analysed by this software every year. By applying highly specialised search
Protracted displacement: Uncertain paths to self-reliance in exile – Annexes | 4

parameters, scores are apportioned for every country based on 12 key political, social and economic
indicators.
10. World Bank data, especially on the classification of countries by income level
(http://data.worldbank.org/about/country-and-lending-groups) and the Size of the Economy indicators
in the World Development Indicators (http://wdi.worldbank.org/table/1.1).
11. A series of tables published by UNHCR as part of the UNHCR Global Trends Report for 2014.3
12. Tables for the Human Development Index from the UNDP’s Human Development report 2014.4
13. The CIA World Factbook table of land borders, for determining whether countries were neighbouring
or not.5
Some of these sources contain large numbers of data points. The FSI is based on millions of documents. The
UNHCR database and ReliefWeb contain approximately half a million data points each. The UNRWA data is
the least dense in terms of underlying data. The World Bank data is generally based on national statistics. These
ten main data sources were supplemented by reviewing data from the OECD’s Development Statistics Database
and the UN’s Financial Tracking System.
Who’s counted?
One of the limitations of available data is that different groups are included in totals. UNHCR offers the
following definitions of different groups6.
Refugees
Refugees include individuals recognised under the 1951 Convention relating to the Status of Refugees; its 1967
Protocol; the 1969 OAU Convention Governing the Specific Aspects of Refugee Problems in Africa; those
recognised in accordance with the UNHCR Statute; individuals granted complementary forms of protection; or
those enjoying temporary protection. The refugee population also includes people in a refugee-like situation.
Asylum-seekers
Asylum-seekers are individuals who have sought international protection and whose claims for refugee status
have not yet been determined, irrespective of when they may have been lodged.
Some countries have a large proportion of their refugee and asylum-seeker caseload as asylum-seekers.7 The ten
countries of refuge that have at least 1,000 asylum-seekers and the highest proportion of their refugee and
asylum-seeker caseload as asylum-seekers are shown on the following table.
3 https://s3.amazonaws.com/unhcrsharedmedia/2015-06-18-global-trends/14-WRD-tab_v2_external.zip 4 http://hdr.undp.org/sites/default/files/hdr14_statisticaltables.xls 5 https://www.cia.gov/library/publications/resources/the-world-factbook/fields/2096.html 6 http://popstats.unhcr.org/en/overview#_ga=1.142422322.1838606709.1422528458 7 Mongolia and Sint Maarten (Dutch part) have asylum-seekers but no refugees.
Protracted displacement: Uncertain paths to self-reliance in exile – Annexes | 5

Country Refugees Asylum- seekers Proportion of refugee and asylum-
seeker caseload as asylum-seekers
1 Hong Kong SAR, China 130 2,183 94.4%
2 Hungary 2,819 15,629 84.7%
3 South Africa 112,112 463,875 80.5%
4 Japan 2,552 9,274 78.4%
5 Somalia 2,717 9,252 77.3%
6 Greece 10,262 31,881 75.6%
7 Republic of Korea 1,149 3,446 75.0%
8 Mozambique 4,524 13,311 74.6%
9 Malawi 5,871 14,489 71.2%
10 Angola 15,458 30,200 66.1%
South Africa hosts just over one-quarter (25.9%) of all UNHCR-registered asylum-seekers.
World Bank Income
classification
Proportion of refugee and
asylum-seeker caseload as
asylum-seekers
Proportion of asylum-
seekers from
neighbouring countries
Low-income 8.5% 22.5%
Lower-middle-income 5.4% 6.7%
Upper-middle-income 21.8% 37.1%
High-income 0.5% 5.6%
Upper-middle-income countries have a higher proportion of their refugee and asylum-seeker caseloads as
asylum-seekers. The reasons for this are not clear, but may include upper-middle-income countries being easier
for asylum-seekers to access (over one-third are from neighbouring countries), not having a history of receiving
refugees from non-neighbouring countries or lacking the bureaucracy to deal with asylum claims.
Proportion of caseload from: Asylum-seekers Refugees
Neighbouring countries 16% 86%
Non-neighbouring countries 84% 14%
Contrary to the pattern for refugees, where five-sixths are from neighbouring countries, only one-seventh of
asylum-seekers are from countries bordering the country where they are seeking asylum.
There are over 100,000 asylum-seekers from Iraq: Afghanistan, Syria, DRC, Ethiopia, Eritrea, Myanmar and
Somalia all have over 50,000 asylum-seekers in countries of refuge. These seven countries account for 37.6% of
all asylum-seekers for whom UNHCR identifies a country of origin.8
8 Just over 25% of the asylum-seekers caseload is recording with ‘various’ as their country of origin.
Protracted displacement: Uncertain paths to self-reliance in exile – Annexes | 6

This study has not included numbers of asylum-seekers in the analysis of protracted displacement as asylum
application should, in theory, be dealt with relatively quickly.9 The number of refugees climbed steeply at the
end of the 1970s with the start of the Afghan crisis, and peaked in 1992 during the Balkans crisis. 2014 saw the
highest number or refugees since 1993.
Internally Displaced Persons
Internally displaced persons (IDPs) are people or groups of individuals who have been forced to leave their
homes or places of habitual residence, in particular as a result of, or in order to avoid the effects of, armed
conflict, situations of generalised violence, violations of human rights or natural or man-made disasters, and
who have not crossed an international border. For the purposes of UNHCR’s statistics, this population only
includes conflict-generated IDPs to whom the Office extends protection and/or assistance. IDMC provides data
on conflict-displaced IDPs in 58 countries in 2014 compared with UNHCR’s 2410 in that year. The difference in
totals is just under 6 million.
It should be noted that, with the sole exception of Cyprus, all countries for which IDMC reports IDPs are also
the source of refugee movements.
Stateless persons
Stateless persons are defined under international law as
persons who are not considered as nationals by any state
under the operation of its law. In other words, they do
not possess the nationality of any state. UNHCR
statistics refer to persons who fall under the agency’s
9 This is not always the case. A study of the Irish asylum processing system in 2014 found that some 59% had been awaiting processing for over three years, 31% for over three years and 9% for over seven years. Joyce, C., & Quinn, E. (2014). The Organisation of Reception Facilities for Asylum-seekers in Ireland (pp. 50). Dublin: Economic and Social Research Institute. 10 The countries for which UNHCR provides no IDP data but IDMC does are Nigeria, Turkey, India, Bangladesh, Ethiopia, Kenya, El Salvador, Mexico, State of Palestine, Guatemala, Cyprus, Peru, Indonesia, Chad, Cameroon, Zimbabwe, Thailand, Uganda, Honduras, Russia, Senegal, Liberia, Lebanon, Niger, Eritrea, Togo, Armenia, Congo, Papua New Guinea, Laos, Turkmenistan, Uzbekistan, Timor-Leste, and FYR Macedonia.
Protracted displacement: Uncertain paths to self-reliance in exile – Annexes | 7

statelessness mandate because they are stateless according to this international definition, but data from some
countries may also include persons with undetermined nationality. Others of concern refers to individuals who
do not necessarily fall directly into any of the groups above, but to whom UNHCR extends its protection and/or
assistance services, based on humanitarian or other special grounds.
Some stateless persons may have travelled from the country of their birth to gain refugee status. UNHCR
registers these has having the country of origin of ‘Stateless’. However, the bulk of stateless persons are not
displaced and are therefore not included in the summary statistics for the displaced. UNHCR estimates that the
number of stateless person is ten million, about three times high than the number recorded in UNHCR statistics.
UNHCR also records numbers of other persons of concern to whom it provides assistance. However, there are
normally not displaced persons and are not included in the numbers here.
UNRWA Palestinian refugees
These are persons whose normal place of residence was
Palestine during the period 1 June 1946 to 15 May 1948,
and who lost both home and means of livelihood as a
result of the 1948 conflict. Palestine refugees, and
descendants of Palestine refugee males, including legally
adopted children, are eligible to register for UNRWA
services.11
UNRWA also registers other persons including the
Jerusalem Poor, non-refugee wives and others. Their numbers were including in the UNRWA totals until 2010,
after which they were reported separately. The reported numbers of UNRWA registered persons for 2009 and
2010 have been reduced by an estimate of the non-refugee population based on extrapolating the growth rate in
this population from 2011–13.
The growth rate observed from 1997 to 2007 was used to extrapolate the Registered Refugee Population of
West Bank and Gaza12 to give a more accurate estimate for these populations. UNRWA has not published any
summary numbers for the end of 2014 yet13 but the annual report to the General Assembly contains the figures
for December 2014 that were used in the calculations.14 Estimates for 1989 to 2008 were generated by
extrapolating the growth rate seen in 2009–13 backwards for UNRWA refugees in Lebanon, Syria and Jordan.
Jordan and the State of Palestine (the West Bank and Gaza) are home to over 80% of UNRWA Registered
Refugees.
The challenges of estimating IDP numbers
11 http://www.unrwa.org/sites/default/files/ceri_24_may_2006_final.pdf 12 Using the data from: UNRWA, & Ajluni, S. (2010). West Bank and Gaza Strip Population Census of 2007 Briefing Paper (pp. 35). Amman: UNRWA. 13 By the end of June 2015. 14 http://www.unrwa.org/sites/default/files/report_of_the_commissioner-general_to_the_general_assembly_of_the_united_nations_2014_english.pdf
Protracted displacement: Uncertain paths to self-reliance in exile – Annexes | 8

One of the main challenges in estimating the scale of global displacement is the lack of a common conceptual
framework and accepted definition of an IDP at the operational and data collection level. Frameworks and
definitions used for the purposes of data collection are inconsistent and usually narrower than the descriptive
IDP definition in the Guiding Principles on Internal Displacement. Data collection exercises on the ground may,
for example, exclude some causes of displacement altogether (e.g. large-scale development projects, gang
violence, some forms of human rights violations) as well as certain groups – e.g. stateless persons, foreigners and
other migrants. They may also exclude whole geographic areas. As a result, it is likely that a large number of
IDPs are regularly excluded from the total count.
As well as limitations in capturing all people displaced in a comprehensive and systematic manner,
methodological gaps are problematic for tracking what happens to people beyond their initial flight, i.e.
displacement dynamics and trends over time. The implication is that, rather than painting a complete picture of
displacement in a country, the estimates give a general indication of the scale of a number of situations at a given
point in time.
Reported IDP figures usually represent multiple situations that have been aggregated into a national figure. For
these reasons, it is difficult to make comparisons between countries, or even to compare different displacement
situations within a country. In Syria, for example, different IDP definitions and data collection methods are used
in different areas depending on which party to the conflict controls the territory at the time.
Moreover, internationally reported IDP figures do not necessarily reflect the true number of IDPs or the number
of IDPs in need. IDPs may have difficulty registering or not wish to do so if they are in isolated, insecure or less
visible areas, they lack the documents required to register, or they fear conscription, reprisals or social
stigmatisation if they identify as IDPs. Some may also believe that registration could bring them more harm than
benefits if their personal information is leaked. As such, the figures can be skewed in favour of one group while
excluding another, rendering the figures inaccurate.
The result of all of these challenges around data collection is that comprehensive IDP data does not exist. It may
be available for some but not all areas of a country, or it may be collected for some but not all of the factors that
determine an overall caseload. Such factors include the number of IDPs who have returned, integrated locally or
settled elsewhere, and the number of those born or who have died in displacement. IDP figures are also
inherently conservative. People reported as having returned without knowing whether they have achieved
durable solutions or not are subtracted, while IDPs living outside of camps, collective centres and camp-like
settings are difficult to capture.
IDPs in protracted displacement – numbers and trends
Calculating the number of IDPs in protracted displacement, whether displaced by conflict or disasters, is not
possible with the data available. This study defines protracted displacement as having lasted at least three years.
As the scale of internal displacement has on the whole increased over the past 15 years, one may be tempted to
say that the cumulative global IDP figure at the end of 2011 can be taken as the number of IDPs living in
protracted internal displacement at the end of 2014. That is, IDPs who were displaced at the end of 2011 are
Protracted displacement: Uncertain paths to self-reliance in exile – Annexes | 9

likely still displaced since the global figure in 2014 is larger than it was in 2011. And since they have been
displaced for at least three years, the 2011 cumulative IDP figure is the number of IDPs in protracted
displacement at the end of 2014.
This would be erroneous since there is no evidence that the same IDPs are included in each country figure from
year to year. Some drop off the list, including because of return, loss of IDP status, death or re-registration
exercises, while others are added to the list because they are newly displaced, born to IDPs in displacement or
they manage to get registered after some time in displacement.
In the absence of real-time data collection, IDP figures represent the number of IDPs who were on the register at
a certain point in time. IDMC’s cumulative IDP figure for the Philippines in December 2014, for example, was
‘at least 77,700’.15 During 2014, IDMC estimates that at least 123,800 people were newly displaced and 70,700
returned.16 The cumulative IDP figure obscures the large flows that occurred throughout the year – flows that,
taken together, are three times as large as the ‘cumulative’ IDP figure. Thus, without taking into account the new
displacement, returns and the other factors that influence displacement figures, it is impossible to determine the
duration of displacement from aggregated annual point-in-time estimates.
Plotting national IDP figures over time allows one to see the evolution of IDP figures in a country. This often
says more about the reporting of internal displacement rather than an increase or decrease in displacement from
year to year given the limitations of IDP data collection. In addition, producing a single national estimate usually
involves aggregating displacement figures from various regions in a country, new displacement situations within
a region or both. Combining various figures in this way makes it impossible to determine how long a given
individual or group has been displaced. The data is not disaggregated by date of displacement, so it is not
possible to have accurate figures for the length of displacement of the different IDPs included in the aggregate
figure. As such, it is not possible to ascertain how many IDPs in a given country caseload are protractedly
displaced.
IDP figures also obscure other important dynamics of internal displacement. Many people living in protracted
displacement have been forced to flee more than once in their lives. IDMC’s qualitative analysis has found that
people already displaced by conflict and violence before 2014 were forced to uproot their lives again during the
year in a third of the countries monitored. In more than 80% of cases, those affected are thought to have fled to
escape further exposure to conflict or generalised violence in their places of refuge.17 Also, new waves of IDPs
join those previously displaced, many blend in with others displaced for different reasons and migrants in search
of better opportunities. Displaced children grow up, elderly IDPs die and new generations are born into
displacement. These changes in demographic composition are generally concealed in country and global IDP
figures.
15 IDMC 2015 Global Overview 2015: People Internally Displaced by Conflict and Violence, p. 86. 16 Ibid. 17 Op. cit., p. 11.
Protracted displacement: Uncertain paths to self-reliance in exile – Annexes | 10

Total number of displaced in 2014
The analysis of the data yields the following:
Classification Number Source of data
Refugees 14,376,295 UNHCR Database update of 22 June 2015
Asylum-seekers 1,792,408 UNHCR Database update of 22 June 2015
UNRWA refugee caseload 5,149,748 Various UNRWA reports
IDPs 38,207,193 IDMC data from the 6-year IDMC dataset
Total displaced 59,525,644
Non-displaced reported numbers
Stateless Persons 3,492,250 UNHCR Database update of 22 June 2015
Other UNHCR Persons of
Concern
1,052,666 UNHCR Database update of 22 June 2015
UNRWA non-refugee caseload 397,795 Extrapolation from end 2013 and mid 2014 UNRWA
reports
There are now more persons forcibly displaced than at any time in history.18
• While IDPs were just under 50% of the total displaced caseload in 1989 they have accounted for over 60%
of all displaced since 2001.
• This increase in the proportion of IDPs in the caseload appears to be enduring.
18 Although the figure is often given as being larger than at any time since the Second World War, forcible displacement in the wake of the Second World War has been estimated as being in the order of 11 to 20 million. http://www.dpcamps.org/migration.html gives the number as 12 million.
Protracted displacement: Uncertain paths to self-reliance in exile – Annexes | 11

Where are the displaced from?
• Five countries account for over half of all 59.5 million displaced at the end of 2014.
• Syria alone was the origin for nearly one in 5 displaced in 2015.
The Syrian caseload was a mix between internal displacement (IDPs) and external displacement (refugees and
asylum-seekers). As can be seen from the following table, IDPs make up the largest numbers of the displaced in
seven of the ten largest displacement contexts. Somalia has approximately equal numbers in internal and
external displacement.
In only two of the top ten cases is the displacement predominantly in the form of refugee displacement. These
are Israel, the country of origin for the UNRWA caseload, and Afghanistan.
Protracted displacement: Uncertain paths to self-reliance in exile – Annexes | 12

Top ten countries of
displacement
Percentage of caseload
internally displaced
Percentage of caseload
externally displaced
Syria 66% 34%
Colombia 94% 6%
Israel 0% 100%
Sudan 82% 18%
Iraq 87% 13%
Afghanistan 23% 77%
DRC 83% 17%
Pakistan 83% 17%
Somalia 49% 51%
South Sudan 71% 29%
• In the case of Syria the total number of displaced in 2014 was nearly half the country’s population in that
year (World Bank population data).
Syria was the country with the largest proportion of its population in displacement both for refugees and IDPs.
Country
Displaced in 2014 per
million of population As IDPs As Refugees
Syria 492,841 326,170 166,671
Somalia 204,779 102,423 102,356
Cyprus 184,206 184,206 -
Central African
Republic
180,608 93,116 87,492
South Sudan 180,121 127,629 52,492
Colombia 130,890 123,527 7,363
Afghanistan 108,654 25,748 82,906
Eritrea 57,071 1,530 55,541
Refugee crises have shifted over time. In 1978 Sub-Saharan Africa was the source of the bulk of refugees. This
quickly changed with the Soviet intervention in Afghanistan in 1979. This led to a large increase in refugees in
South and Central Asia. The Iranian Revolution of 1979 and the subsequent Gulf Wars led to slowly growing
refugee movements in the Middle East.19
19 This analysis only includes refugees and asylum-seekers as good-quality data on IDPs prior to 2009 is not available and the data on the UNRWA caseload before 2009 has been extrapolated.
Protracted displacement: Uncertain paths to self-reliance in exile – Annexes | 13

What this graphs tells us is that:
• The locus of refugee displacement crises has changed over time, and displacement is driven by the context.
• There is no one over-riding pattern for displacement.
Where do the displaced go?
The study demonstrates that external displacement is not a simple country ‘a’ to country ‘b’ phenomena, but
that the displaced from any one country go to many other countries. The first choice for refugees is an adjoining
country. Less than one in seven refugees (13.5%) is in refuge in a country other than an adjoining one.
• Displacement is not bilateral: it goes from one country of origin to many countries of refuge.
Protracted displacement: Uncertain paths to self-reliance in exile – Annexes | 14

Refugees and asylum-seekers from Syria could be found in 92
countries of refuge and those from Pakistan could be found in 56
countries. Thus the nature of refugee displacement is fractured and
widely distributed. In terms of countries hosting the conflict-
displaced in 2014, two-thirds of all displaced people were displaced
within the borders of their countries. IDPs are not reflected in this
table.
Seven countries account for over half the total number of refugees (including UNRWA and asylum-seekers).
Jordan hosts over one in eight of all refugees between the UNRWA caseload from 1948 and the recent Syria
crisis refugees.
Country of origin Countries of refuge
Syria 92
Somalia 87
DRC 84
Iraq 80
Sudan 74
Afghanistan 72
Iran 65
Eritrea 63
State of Palestine 60
Pakistan 56
Protracted displacement: Uncertain paths to self-reliance in exile – Annexes | 15

For IDPs, the new IDPs in Syria outnumber those in the historic IDP crisis of Colombia. Just four countries
(Syria, Colombia, Iraq and Sudan) account for over half of all IDPs listed in the IDMC data.
Again, this illustrates one very significant problem with current displacement. Some of the largest caseloads are
in countries with very limited humanitarian access (for example, Syria and Iraq), meaning assisting IDPs in those
countries or planning for the return of refugees to those countries is difficult.
• For refugees and asylum-seekers, refugee-hosting countries in Europe have on average refugees from 70
other countries.
Protracted displacement: Uncertain paths to self-reliance in exile – Annexes | 16

What is interesting here is that even countries in Sub-Saharan
Africa have refugees from 23 countries of origin on average.
However, the countries with refugees and asylum-seekers for
the largest number of countries of origin are Canada (with
163) and the United States (with 161). South Africa has
refugees from 44 countries of origin. Brazil and Argentina
have refugees from 49 and 45 countries respectively.
Cameroon, Kenya, Angola, and Ghana all have refugees from
17 countries. Hosting refugees from diverse countries of origin
is not a monopoly of the rich world.
In 2013 (for which more complete GNI data is available than for 2014), 77% of the refugee caseload for which
GNI data was available was taking refuge in countries with a higher GNI (Atlas method) than the country of
origin ($12,634 higher on average). When comparing the World Bank income class of origin and refuge the
impact of this can be seen, with over four million UNHCR refugees from lower middle-income countries taking
refuge in upper-middle-income countries.
Country of refuge Countries of origin
Canada 163
United States 161
Germany 125
France 115
United Kingdom 112
Sweden 103
Switzerland 89
Italy 88
Netherlands 87
Belgium 83
Protracted displacement: Uncertain paths to self-reliance in exile – Annexes | 17

No refugees from high-income countries took refuge in low-income countries, but over half a million refugees
from low-income countries took refuge in high-income countries.
• Refugees are more likely to take refuge in countries which are richer than their countries of origin.
Most large refugee movements are not predicated by choice but by the nearest border. Even so there are a
number of potential mechanisms that might explain why countries of refuge are richer than countries of origin,
including:
• The conflict that leads to displacement may also have a negative impact on the economy of the country
of origin.
• Refugees may have a positive impact on the economy of their country of refuge.20
• Refugees, when moving to third countries from initial country of asylum, deliberately select richer
countries.
20 This is a much contested issue. Maystadt and Verwimp (2014) found that the economic impact was positive in aggregate, but that it could be positive or negative for different groups in the hosting population. Winners and Losers among a Refugee-Hosting Population. Economic Development and Cultural Change, 62(4), 769-809. doi: 10.1086/676458
Protracted displacement: Uncertain paths to self-reliance in exile – Annexes | 18

However, it is not possible to say which, if any, of these possible mechanisms predominates. It may simply be a
data artefact generated by a few specific cases such as Syria and Afghanistan, where the countries to which most
Syrian and Afghan refugees have fled (Iran and Pakistan for Afghanistan, and Jordan, Lebanon, Turkey and Iraq
for Syria) being in a higher World Bank income class.
High-income countries are the only group which have a majority of their refugee caseload from non-adjoining
countries.
Protracted displacement
For the purpose of this study, protracted displacement is defined as a situation in which refugees or IDPs have
been displaced for three years or more, and where the process for finding durable solutions, such as repatriation,
integration into host communities or resettlement in a third location, has stalled.
The number of refugees in protracted displacement was estimated by looking at the refugee flows between 6,697
different country of origin and country of refuge pairs from 1978 to 2014. The calculation was based on two
assumptions:
• First, it was assumed that no refugees were returning from a particular country of refuge to a particular
country of origin in a particular year and being replaced by other refugees from that country of origin in
that year. This meant that we assumed that there was zero churn for a particular country pair.
• Second, it was assumed that, when refugees returned, it was the most recently displaced refugees that
returned rather than those that had been in displacement the longest. This is the first-in last-out
assumption.
This assumption of zero churn for a country pair is a reasonable one, in that the level of churn in refugee crises
tends to be small once the population has been displaced for a few years. Where there is churn it may happen
that refugees are returning from one country of refuge while others are fleeing to another country of refuge due
to political changes in the country of origin. Asylum-seekers were excluded from the analysis as they are the
refugee group most subject to churn as their asylum applications are accepted or rejected.
The second assumption again is a reasonable one, in that longer-established refugees have children in school in
the host country, and may also have livelihoods there. Newly arrived refugees have fewer such constraints, and
Protracted displacement: Uncertain paths to self-reliance in exile – Annexes | 19

more livelihood links to the country of origin. This means that return has a lower opportunity cost for them
than for longer-established refugees.
Of course, both of these assumptions do not hold true in the case of every single refugee, but we considered that
any error introduced from using these assumptions was probably smaller than the precision of measurement of
refugee caseloads.
The following calculation for refugees from Haiti illustrates the technique.
Country hosting Haitian
refugees
2011 2012 2013 2014 In protracted
displacement in 2014
Angola 1 2 2 0 0
Argentina 57 58 62 66 57
Belgium 6 4 2 0 0
Brazil 3 3 3 0 0
Canada 4,963 6,798 7,872 8,422 4,963
Chile 1 1 1 0 0
Colombia 1 1 1 0 0
Costa Rica 38 38 38 38 38
Cuba 1 1 1 0 0
Dominican Republic 595 750 716 603 595
Ecuador 24 27 25 22 22
France 3,619 3,710 3,741 3,523 3,523
Germany 47 45 15 15 15
Honduras 6 6 6 6 6
Italy 8 8 8 8 8
Jamaica 19 19 18 18 18
Mexico 191 173 175 175 173
Netherlands 2 2 2 0 0
Norway 2 2 2 0 0
Panama 13 17 17 16 13
Peru 15 16 19 24 15
Spain 18 20 21 21 18
Sweden 1 1 1 0 0
Switzerland 0 1 2 0 0
Trinidad and Tobago 2 0 2 0 0
United Kingdom 0 1 1 0 0
United States 24,013 26,849 25,891 24,170 24,013
Venezuela 15 15 15 15 15
Total 33,661 38,568 38,659 37,142 33,492
Protracted displacement: Uncertain paths to self-reliance in exile – Annexes | 20

In the case of Haitian refugees in Mexico, the number dropped to 173 in 2012, so only this many out could be
in protracted displacement in 2014. In the case of the United States, although the number of refugees increased
to 26,849 in 2012 and then decreased, it was assumed that the departing refugees were the most recently arrived
ones. The overall percentage of protracted displaced for refugees from Haiti in 2014 was 33,492/37,142 or
90%. The same calculation was repeated for all countries of origin and of refuge.
Who is in protracted displacement?
• All of the UNRWA registered refuge caseload.
• Currently 54% of the non-UNRWA refugee caseload.
• A part of the global IDP caseload, but the data is not collected in a ways that permits one to estimate
the total number of protracted IDPs.
The percentage of the refugee caseload in protracted displacement varies as new refugees are generated and old
refugees return. Today’s percentage of non-UNRWA refugees in protracted displacement is the lowest
proportion in protracted displacement since 1982; and then, as now, that lower figure is due in part to the large
number of new refugees within the previous three years. The percentage of the non-UNRWA refugee caseload in
protracted displacement has been over 75% for 14 of the last 30 years. Refugee protracted displacement peaked
in 2005 at 87%, as was at 83% in 2011, just before the start of the Syria Crisis. If we include the UNRWA
refugee population (all in protracted displacement), the percentage of refugees in protracted displacement stood
at 91% in 2005, 88% in 2010 and 2011 and 66% at the end of 2014, the lowest percentage of refugees in
protracted displacement for 20 years.
What we can say is that:
• Protracted displacement is the norm for refugees.
• The proportion of the UNHCR refugee caseload in protracted displacement has not dropped below 50%
for the last 30 years.
• Two-thirds of the UNHCR refugee caseload has been in protracted displacement for 21 of the last 40 years.
Although there are some long-standing IDP crises, as in Darfur or Colombia, with many millions of persons
displaced, it is not possible due to the aggregation of multiple IDP caseloads within a country to estimate the
Protracted displacement: Uncertain paths to self-reliance in exile – Annexes | 21

percentage of the IDP caseload that is in protracted displaced. Estimating the numbers of IDPs in protracted
displacement is especially difficult for the reasons set out earlier.
There is a strong correlation21 between the proportion of the population from any country in internal
displacement and the proportion of the population in external displacement.
The proportion of population was used rather than overall numbers as this is a better measure of the scale of the
problem and prevents the size of a country’s population from biasing the correlation.22 While internal
displacement is different in many respects from external displacement we can say that:
• Countries experiencing large-scale internal displacement are likely also to experience large-scale refugee
displacement.
The one exception to this is Cyprus, which has large numbers of displaced following the partition of the island
but no refugees in exile.
21 We have used the following table for describing correlations based on Pearson’s r: less than 0.30 negligible; 0.30-0.49 weak; 0.50-0.69 moderate; 0.70-0.89 strong; 0.90+ very strong. 22 When numbers rather than proportions are compared the Pearson r is 0.678 with p<.05.
Protracted displacement: Uncertain paths to self-reliance in exile – Annexes | 22

• The proportion of the caseload in protracted displacement varies by region.
Patterns of displacement: How long do refugee crises last?
Examining the patterns of displacement makes clear that most refugee crises last for decades not years. The
following plot shows the pattern of refugee displacement for the 20 largest refugee crises from 1978 to 2014.
Protracted displacement: Uncertain paths to self-reliance in exile – Annexes | 23

These tell us several things:
• Most of these large refugee crises last for decades, not years. Of the 20 crises shown here, 13 still have
significant numbers in displacement in 2014.
• The variety in the shapes of the plots shows that there is no single overriding pattern for refugee
displacement. Some crises rise and then fall away, like Sierra Leone, others wax and wane over time, like
Afghanistan.
• The onset of a refugee crisis can slowly build, as for Sudan, or rapidly explode, as for Syria.
• Crises that drag on for years may suddenly explode in scale, as for Iraq or Rwanda (albeit with different
caseloads).
• Even where refugee crises are resolved, as in Mozambique, there can be a tail of refugee cases for several
years.
The same patterns can be seen whatever the scale. The following charts plot 80 refugee crises over the last 37
years. To facilitate the comparison the crises have all been plotted as the percentage of their maximum
displacement.
Protracted displacement: Uncertain paths to self-reliance in exile – Annexes | 24

The intervals were selected for each graph to give 20 crises.
Protracted displacement: Uncertain paths to self-reliance in exile – Annexes | 25

As can be seen:
• Small-scale crises can last for decades just as large-scale crises do.
• Smaller-scale crises are just as variable as larger-scale ones.
• The variability of refugee displacement crises are scale-invariant. The same phenomena can be seen for
5,000 or 5 million.
• The 1990s saw a jump in the number of refugee crises.
Protracted displacement: Uncertain paths to self-reliance in exile – Annexes | 26

We can test this last observation by counting the number of refugee crises with over 1,000 displaced from 1978
to 2014.
It can be seen that, from the late 1980s to the mid-1990s, the number of countries with refugee crises more than
doubled (from 38 in 1988 to 81 in 1996). Part of the increase may be an artefact of the UNHCR database, in
that UNHCR provided data on countries of origin for only 83% of the refugee caseload in 1988 and 90% in
1990.23 1978 was excluded as UNHCR only provided data on origin for 70% of the caseload in that year.
However, the increase seen far outweighs any impact that this data artefact might have. Checking the countries
involved reveals that many of the new caseloads were due to the end of the Cold War and the breakup of the
Soviet Union.
It also appears from this graph that the number of origin/refuge pairs has increased more quickly than the
number of countries of origin. We can confirm this by looking at the numbers.
The average number of countries of refuge with at least 1,000 refugees from a particular crisis has increased
from approximately two in 1979 to approximately four and a half in 2014.
23 See the appendix on data quality.
Protracted displacement: Uncertain paths to self-reliance in exile – Annexes | 27

These charts led to the following conclusions:
• There was an explosion in the number of countries generating refugees between the late 1980s and the mid-
1990s with a doubling of the number of countries of origin with more than 1,000 refugees in exile.
• The number of refugee crises continued to grow from the mid-1990s to the mid-2000s but at a slower rate.
• The number of refugee crises has been stable since the mid-2000s.
• Refugee displacement has become more disperse with the average number of countries hosting at least
1,000 from any one country of refugee increasing from three in 1978 to four and a half in 2014.
In terms of protracted refugee displacement, similar increases can be seen as for overall refugee displacement
(again for countries with caseloads of at least 1,000).
The orange line (for the number of country pairs) rises much faster than the blue bars (for the number of
countries). This suggests that the average number of countries of refuge with refugees in protracted displacement
per country of origin has grown. The following graph makes this explicit.
What is more interesting is that the proportion of refugee crises where a country of origin is generating at least
1,000 refugees in protracted displacement, or where a given origin/refuge pair has at least 1,000 refugees in
protracted displacement has also grown since 1990. This can be seen from the following graph by the fact that
both the red (country) line and the green (origin/refuge pairs) show a strong upward trend.
Protracted displacement: Uncertain paths to self-reliance in exile – Annexes | 28

These graphs tell us that, since 1990, situations of protracted displacement are increasingly becoming the norm
for refugee crises. The reasons for this are not clear.
• Since 1990, the likelihood that a refugee crisis would become protracted has increased.
• At the end of 2014, for countries of origin with at least 1,000 refugees in exile, more than nine out of ten
such countries had refugees in protracted displacement.
• 96% of non-UNRWA refugee crises with at least 1,000 refugees in exile now have at least 1,000 refugees in
protracted displacement.
• 82% of all non-UNRWA refuge/origin pairs with at least 1,000 refugees have at least 1,000 refugees in
protracted displacement.
How long do refugee crises last?
The crisis duration was measured for 213 countries and territories of origin from 1978 to 2014 using the
UNCHR data. Each crisis was assumed to begin when the number of refugees generated reached 10% of the
peak number. The crisis was assumed to end when the number of refugees dropped below 10%.
Obviously, if a different percentage is used for picking the start and end of crises, then the average duration of
the crises will vary. Picking 5% of the peak displacement as the start and end point increases the average length
of the crises, and picking 20% reduced the average length. Again, picking a large level of peak displacement gave
lower average lengths.
Percentage of peak
displacement at which
the crisis is assumed to
begin and end
Average length of the longest crisis in years for 213 countries
and territories with this number of UNHCR refugees at peak
51-500 501-5,000 5,001-
50,000
50,001-
500,000
Over
500,000
5% 17.8 16.4 21.3 19.2 23.6
10% 14.9 14.2 17.8 16.1 22.1
20% 10.8 11.2 13.9 12.8 18.2
Although there is a tendency for larger crises to last longer, the difference is not statistically significant.
Protracted displacement: Uncertain paths to self-reliance in exile – Annexes | 29

Several countries experience multiple crises by these definitions, as the refugee numbers may have dropped
below 10% for a year or more at the beginning or the end of the crises. A visual example of the plots of the data
showed that few refugee crises had more than one large-scale phase and to avoid crises being segmented
artificially by this rule, the longest-lasting crisis between the limits was taken for each country.
The frequency distribution shows that only a tiny proportion of refugee crises are resolved quickly.
If we analyse the data for 1978 to 2014, excluding South Sudan and Syria (as they were less than four years old
at the end of 2014), we can see that:
• Durations of over three years are the norm for refugee crises.
• Less than one-in-forty refugee crises are resolved24 within three years. Of the 91 refugee crises displacing
5,000 or more from 1978 to 2014, only one (Togo in 1993) saw 90% of the peak displaced population
return in less than four years.25
• More than four-fifths of refugee crises displacing 5,000 or more last for ten years or more.
• Two in five refugee crises displacing over 5,000 people lasted 20 years or more.
The following table presents an analysis of the duration of refugee crises for countries of origin. The length of a
crisis was taken to be the maximum number of consecutive years for which the number of refugees was at least
10% of the peak level of displacement.
Refugee flows 1978-2014
with a peak displacement
of at least
No. of
countries
of origin
Number of
crises lasting
less than 4
years
Percentage
lasting 4 years
or more
Percentage
lasting 10
years or more
Percentage
lasting 20
years or
more
50 165 3 98.2% 81.2% 36.4%
500 132 3 97.7% 81.8% 37.9%
24 Resolved is used here to indicate that the caseload was reduced to 10% of the peak caseload. 25 Togo has continued to generate refugees since, but the numbers were small compared to the 1993 caseload.
Protracted displacement: Uncertain paths to self-reliance in exile – Annexes | 30

5,000 91 1 98.9% 81.3% 41.8%
50,000 55 1 98.2% 80.0% 47.3%
500,000 15 0 100.0% 93.3% 60.0%
It can be noted from this table that the likelihood of a crisis lasting for 20 years or more is higher as the crisis
grows in scale. The number of years was plotted against the case size to check the strength of this relationship. It
was only weakly correlated.26
The correlation is negligible27 but it is statistically significant. An analysis of the data shows that the correlation
was being biased by the shorter duration of crises with less than 5,000 refugees.
The correlation is weaker if the comparison is limited to cases over 5,000 max displacement. The correlation for
crises over 5,000 is not statistically significant.
26 All correlations reported here exclude zero values to increase the accuracy of the calculation of Pearson’s r. 27 We earlier defined a correlation of 0-0.30 as negligible. Conventionally the proportion of variation in one variable accounted for by an association with another variable is r2 or 3.6% in this case.
Protracted displacement: Uncertain paths to self-reliance in exile – Annexes | 31
• The length of refugee displacements is only negligibly correlated with the scale of displacement.
Short term crises
There have been a small number of dramatic short-term refugee flows and returns. Examples are the flow of
Burundian refugees to Tanzania in late 1993 and refugees from Kosovo in 1999. The bulk of Burundian refugees
had returned to Burundi by early 1994. Their data is captured in the dataset as they were in exile at the end of
December 1994.
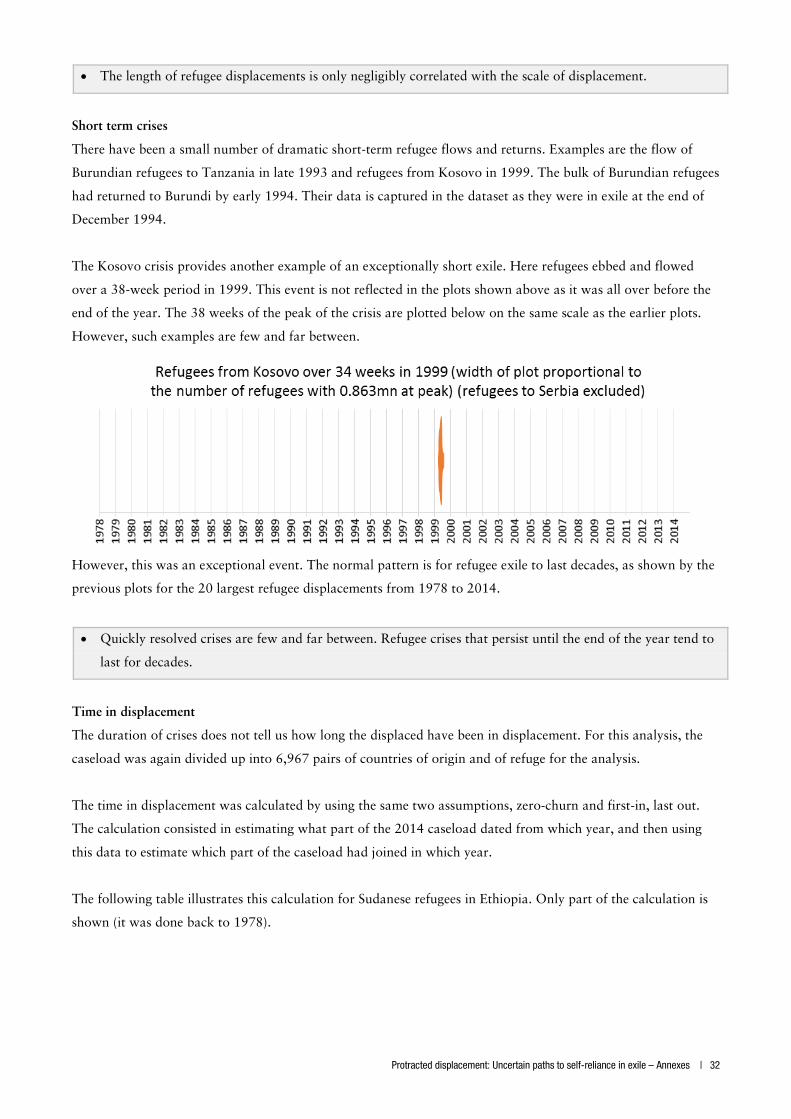
The Kosovo crisis provides another example of an exceptionally short exile. Here refugees ebbed and flowed
over a 38-week period in 1999. This event is not reflected in the plots shown above as it was all over before the
end of the year. The 38 weeks of the peak of the crisis are plotted below on the same scale as the earlier plots.
However, such examples are few and far between.
However, this was an exceptional event. The normal pattern is for refugee exile to last decades, as shown by the
previous plots for the 20 largest refugee displacements from 1978 to 2014.
• Quickly resolved crises are few and far between. Refugee crises that persist until the end of the year tend to
last for decades.
Time in displacement
The duration of crises does not tell us how long the displaced have been in displacement. For this analysis, the
caseload was again divided up into 6,967 pairs of countries of origin and of refuge for the analysis.
The time in displacement was calculated by using the same two assumptions, zero-churn and first-in, last out.
The calculation consisted in estimating what part of the 2014 caseload dated from which year, and then using
this data to estimate which part of the caseload had joined in which year.
The following table illustrates this calculation for Sudanese refugees in Ethiopia. Only part of the calculation is
shown (it was done back to 1978).
Protracted displacement: Uncertain paths to self-reliance in exile – Annexes | 32

Year 2004 2005 2006 2007 2008 2009 2010 2011 2012 2013 2014
Yearly total 90,451 73,927 66,980 35,493 25,913 23,516 25,238 45,286 27,175 33,582 35,447
Of which still
in place in 2014
23,516 23,516 23,516 23,516 23,516 23,516 25,238 27,175 27,175 33,582 35,447
Number in
2014 dating
from this year
23,516 0 0 0 0 0 1,722 1,937 0 6,407 1,865
Years ago >10 10 9 8 7 6 5 4 3 2 1
Percentage of
2014 caseload
97.3% 0.0% 0.0% 0.0% 0.0% 0.0% 7.1% 8.0% 0.0% 26.5% 7.7%
This calculation was carried out for refugees in place in 2014 and refugees in place in 2011 for all 6,967 country
pairs.
The UNHCR caseload was considered first for 2014, and then for 2011. The reason for looking at 2011 is that,
as already noted, the onset of the Syria crisis (and, to a lesser extent, South Sudan) has seen the proportion of
refugees in protracted displacement fall to its lowest level in 20 years.
As already noted, 54% of the UNHCR refugee caseload were in protracted displacement (displaced over three
years) at the end of 2014.
Protracted displacement: Uncertain paths to self-reliance in exile – Annexes | 33

Looking at the situation prior to the Syria and South Sudan crises, in 2011, shows that 83% of UNHCR
refugees then were in protracted displacement.
UNHCR refugees are only part of the refugee caseload. The UNRWA caseload have been displaced for over 60
years.
• When UNRWA figures are taken into account the proportion of refugees in protracted displacement at the
end of 2014 rises to two-thirds of all refugees. Again, the situation before the Syria and South Sudan crises
is more typical of the general picture.
Protracted displacement: Uncertain paths to self-reliance in exile – Annexes | 34

With the inclusion of the UNRWA caseload the proportion of refugees in protracted displacement at the end of
2011 rises to 88%.
We could only estimate the average (mean) length of displacement if we knew how long each and every refugee
had been displaced. We don’t have this because the earlier UNHCR data is of lower quality. The often quoted
statistic that the average length of stay in a refugee camp28 is 17 years cannot be confirmed or refuted by the
available data. However, we can estimate the median length of displacement:
• At the end of 2014, half the UNHCR and UNRWA refugee caseload had been in exile for over ten years.
• At the end of 2011 (prior to the large Syrian and South Sudan displacements) half the UNHCR and
UNRWA refugee caseload had been in exile for over 22 years.
Livelihoods and refugee displacement
To what extent does poverty contribute to displacement? We are not able to answer this with the data available,
as low incomes could be either a cause or a result of displacement, or could both be generated by the factors
leading to displacement. We also tested the case as to whether low GNI per capita is associated with the number
of displaced.
28 https://singularthings.wordpress.com/2015/07/04/17-years-in-a-refugee-camp-on-the-trail-of-a-dodgy-statistic/
Protracted displacement: Uncertain paths to self-reliance in exile – Annexes | 35

What this graph tell us is that:
• There is a negligible association between lower GNI per capita and the percentage of the population that is
in external exile. Countries with lower GNI are slightly more likely to have a larger part of their population
in exile.
Again we can only identify the association and cannot say anything about the direction of any causal
relationship, or even whether both the GNI and the proportion in exile were being determined by another cause.
We examined a large number of factors, such as the Human Development Index (HDI) from UNDP, the
inequality adjusted HDI, the UNDP Coefficient of inequality, and the Gini Coefficient for incomes, but found no
correlation with the number of displaced generated by a particular country of origin.
However, we found that the proportion of the population in severe poverty (UNDP 2014 HDI report) was
negligibly correlated with the proportion of the population in external exile.
Again this was a negligible but statistically significant correlation.
Protracted displacement: Uncertain paths to self-reliance in exile – Annexes | 36

The correlation between the percentage in severe poverty and IDP numbers is effectively nil.
What we can say is that:
• It is likely that poverty, in itself, is not a major driver of displacement.
Where are the displaced?
UNRWA notes that one-third of their registered refugee caseload is in camps. However, these camps are not the
tented camps that might house recent influxes but towns built of bricks and mortar. Similarly the UNHCR
category ‘planned camps’ can be thought of as ‘once-planned’ camps as many have grown far beyond their
original layout.
Just over one-half of UNHCR refugees are staying in private accommodation, just under one-third are in camps
and the accommodation type for the remaining one-sixth is not known. There are regional differences between
Protracted displacement: Uncertain paths to self-reliance in exile – Annexes | 37

different types of accommodation. Given half of the UNHCR caseload lives in private accommodation and two-
thirds of the UNRWA population lives in private accommodation we can say that:
• Just over half of all refugees (UNHCR and UNRWA) are in private accommodation.
• Refugee camps predominated in the Far East and Sub-Saharan Africa, but private accommodation
predominates elsewhere.
If the UNRWA caseload were urbanised to the same extent as the host population of their countries of refuge
78% would be in urban settings. However, the percentage is likely to be much higher as refugees in the Middle
East normally don’t have access to land to pursue rural livelihoods. Thus it is likely that well over 90% of the
UNRWA caseload is in an urban setting.
The bulk of UNHCR refugees are in urban settings. When we combine this with the very conservative
assumption that UNRWA refugees are no more urbanised than their host populations we find that:
• At least 59% of all refugees (UNHCR and UNRWA) are living in urban settings.
Protracted displacement: Uncertain paths to self-reliance in exile – Annexes | 38

Again there is a marked regional variation.
Only Sub-Saharan Africa has a clear majority of the caseload in rural settings. South and Central Asia has about
equal numbers in urban and rural settings, but elsewhere urban settings predominate.
No correlations (other than trivial, statistically insignificant correlations) were found between the percentage of
the caseload in protracted displacement and the proportion in either individual accommodation or in urban
settings. The variation between contexts was too great.
Estimating international focus
Humanitarian agencies post approximately 40,000 updates and reports to ReliefWeb every year. ReliefWeb
provides a good indication of the focus of the international community on humanitarian crises. The attention of
the international community was measured by the percentage of ReliefWeb postings referring to that country in
2014.
Percentage of
postings re country
Classification Number of
countries
0.0% to 0.099% Negligible focus 139
0.1% to 0.499% Almost forgotten 47
0.5% to 0.999% Some attention 13
1.0% to 2.999% Significant focus 16
3.0% to 4.999% Strong focus 6
5.0% to 100.000% Main focus 4
The ten countries characterised as strong or main focus account for 48% of all postings in 2014. We also
examined how the focus of the international community had changed from 2013 to 2014. Countries whose total
number of posts for 2013 and 2014 was less than 0.01% of the number of posts in 2014 were excluded.
Protracted displacement: Uncertain paths to self-reliance in exile – Annexes | 39

Condition Descriptive term Countries
Decreasing by more than 50% Strongly decreasing 14
Decreasing by 10-50% Decreasing 47
Less than 10% change Little change in numbers 21
Increasing by 10-50% Increasing 8
Increasing by more than 50% Strongly increasing 25
Focus on IDPs and refugees in 2014
The focus on IDPs and refugees was defined for this study as the proportion of ReliefWeb postings for that
country (as the primary country) that were tagged by ReliefWeb as referring to IDPs or refugees. Of course this
is an imperfect measure as not all postings about IDPs or refugees may be tagged by ReliefWeb, especially if they
make no use of refugee or IDP keywords.
% 2014 posts for tagged as
referring to IDPs or refugees
Classification Number of
countries
0% Nil 91
0.01–3.99% Negligible 12
3–9.99% Slight 30
10–2499% Weak 34
25–49.99% Moderate 27
50–84.99% Strong 21
85–100% Very strong 10
The focus has changed over the years. The following table shows the ranking of countries by references to
refugees and IDPs in ReliefWeb Postings from 2012–2015.
2012 2013 2014 2015 (to 14 July)
Syria Syria South Sudan Iraq
South Sudan Sudan Iraq Syria
Sudan Lebanon Syria South Sudan
Somalia South Sudan Lebanon Ukraine
DRC Jordan Sudan Lebanon
Myanmar Myanmar CAR Sudan
Mali Philippines Palestine Yemen
Pakistan Mali Jordan Myanmar
Jordan CAR Pakistan Nepal
Lebanon Somalia Ukraine Jordan
Protracted displacement: Uncertain paths to self-reliance in exile – Annexes | 40

The protection environment
Originally we planned to estimate the overall protection environment by using an indicator of state fragility such
as the Fragile States Index. The refugee and IDP portion of the index was excluded to avoid double counting.
The index was calculated both for the country of refuge and as a weighted average for countries of origin.
However, the indicator correlated poorly (very weak and statistically insignificant correlation) with the
percentage in displacement, the scale of displacement, and the crisis duration. Testing with a variety of other
indicators, including the difference between the fragile states index of the country of refuge and the country of
origin, produced no significant correlations.
• Neither the level of the fragility index nor changes in the fragility index of countries of origin were a useful
indicator of trends in displacement numbers.
Estimating funding for displacement
The level of financial support
Estimating the level of financial support has proved very difficult. The two biggest spenders in refugee
operations are UNHCR and WFP. UNHCR began to publish expenditure by country in March 2015, and this
data has been used. However, the other big spender, WFP, has operations which can include multiple
beneficiaries.
While there is a specific OECD/DAC category for refugee support in donor countries, there is no broader
category for refugee and IDP support. Searching the Creditor Reporting System (CRS) for project descriptions
proved less useful than expected as the totals clearly reflected only part of the international spending on
displacement.
Protracted displacement: Uncertain paths to self-reliance in exile – Annexes | 41

Another approach was to use the fact that a small number of donors appear to account for the bulk of support.
However, this does not match the pattern of UNHCR and WFP overall funding, suggesting that the pattern seen
is an artefact of the type of reporting. This is a common issue with OECD/DAC data, whose quality is
dependent on the effort made by reporting donors.
Approaching the problem from the donor end also proved difficult. Donor reports examined did not normally
provide detailed information on the assistance provided for protracted displaced. Similarly, UN appeals only
cover some crises and it is not possible to identify which part of the assistance was for protracted displacement.
Another approach was to consider the UN appeals system. This represents a large slice of humanitarian funding
and has been growing significantly in recent years (the funding level for 2014 was nearly double that for 2012).
Protracted displacement: Uncertain paths to self-reliance in exile – Annexes | 42

However, the UN appeals system does not cover private or direct funding for NGOs and the Red Cross. Private
humanitarian funding is estimated to be one-third of official humanitarian funding.29 The system focuses more
on new crises than on protracted refugee or IDP situations.
The best estimate of overall humanitarian assistance is the annual Global Humanitarian Assistance report by
Development Initiatives. This combines OECD/DAC, UN and private agency data to provide an overall estimate
of humanitarian spending by year.
The 2015 Global Humanitarian Assistance report estimated the global spend on Humanitarian Action at $24.5
billion in 2014. The following graph illustrates the general trend in humanitarian funding. The detailed data for
2014 is not yet available30 for inclusion here.
The team tested the correlation between funding by country (from the GHA Report, 2014) and the number of
ReliefWeb postings for 2006 to 2013. It should be noted that the funding figures by country of destination
include donor data from the OECD/DAC, and UN and NGO data from the OHCA Financial Tracking Service
(FTS); they do not include all private funding. Nevertheless the distribution of funding correlates31 strongly with
the distribution of ReliefWeb postings.
Correlation between funding per country (as reported by GHA)
and ReliefWeb postings (by primary country)
Year Pearson's R r2
2006 0.90 0.80
2007 0.88 0.77
29 The 2015 Global Humanitarian Assistance report estimates private funding for humanitarian action at $5.8 billion compared with $18.7 billion for official humanitarian assistance. 30 The June 2015 update to the OECD/DAC data does not include full details for 2014. 31 For this correlation zero values were included, as there was no null data in the set. Normally the correlations presented in this report exclude pairs from the correlation calculation where at least one member of the pair is zero. This is because null values have been replaced by zero in some of the datasets.
Protracted displacement: Uncertain paths to self-reliance in exile – Annexes | 43

2008 0.79 0.62
2009 0.87 0.75
2010 0.92 0.84
2011 0.84 0.70
2012 0.87 0.76
2013 0.80 0.65
These strong and very strong correlations suggested that:
• The distribution of ReliefWeb posts can be used as an approximate proxy for the distribution of
humanitarian expenditure.
The appeal of using ReliefWeb as a proxy is that there is a considerable time lag between expenditure and
reporting for humanitarian expenditures. By contrast, the ReliefWeb data is available up to the minute. The
percentage of ReliefWeb postings was used to estimate the distribution of humanitarian funding in 2014.
Estimating international spending on protracted displacement using agency reportingA number of approaches
were tried to develop an estimate of spending on protracted displacement. The publication of UNHCR data by
country in March 2015 finally allowed an estimate of spend for UNHCR. The estimates were developed by
estimating:
• The total expenditure of the agency
• The proportion of expenditure for the displaced
• The proportion of expenditure on the displaced for the protracted displaced
However, it should be emphasised that the estimate is based on a large number of assumptions, including that:
• Non-country-specific expenditures can be distributed pro-rata with country-specific expenditures.
• Assumptions about the proportions for displacement and protracted displacement. These vary with each
case.
Thus the expenditure estimates made here should be regarded with great caution.
UNRWA
All UNRWA expenditure can be regarded as being for protracted displacement. Even though some spending is
for recent displacement, these are in fact recently displaced people who were already in protracted displacement.
• Total expenditure for 2014: $1,311 million.32 This was split between the regular programme budget
(about half of this total), and special appeals for the West Bank and Gaza and for the Syrian crisis.
• Proportion of expenditure for displacement: 100%: $1,311 million.
• Proportion of expenditure on the displaced for protracted displacement: 100%: $1,311 million.
32 http://www.unrwa.org/sites/default/files/report_of_the_commissioner-general_to_the_general_assembly_of_the_united_nations_2014_english.pdf
Protracted displacement: Uncertain paths to self-reliance in exile – Annexes | 44

UNHCR
The total UNHCR expenditure for 2013 was $3,348.1 million.33 However, of this, $36 million was for stateless
persons, so the full refugee expenditure was $3,312.119 million. However, not all of this was for protracted
displacement. One would imagine that new caseloads attract higher levels of UNHCR spending than do
protracted caseloads. We tested this by comparing the correlation between overall UNHCR refugee displacement
and UNHCR spending on refugees, and between non-protracted UNHCR refugee displacement and UNCHR
spending on refugees.
There was a moderate correlation between the UNHCR caseload and the spending by UNHCR on the refugee
pillar of their budget. In theory, recent refugee movement should be receiving more support per head, so we
tested the correlation between funding and the non-protracted UNHCR refugee population.
33 UNCHR expenditure reporting from http://reporting.unhcr.org/financial.
Protracted displacement: Uncertain paths to self-reliance in exile – Annexes | 45

There was a stronger correlation between UNHCR funding and non-protracted refugees than there is between
the full UNHCR refugee caseload and the UNHCR refugee funding. One of the confounding factors here is that
UNHCR spending per refugee varies greatly with the size of the caseload and the support provided by host
governments. Spending by UNHCR on the refugee pillar in 2014 varied from $10 per refugee in Canada to
$9,788 per refugee in Sri Lanka.
When we compare the numbers of refugee in protracted displacement with UNHCR refugee spending we find
that the correlation is negligible.
Protracted displacement: Uncertain paths to self-reliance in exile – Annexes | 46

When the strong correlation between numbers of non-protracted refugees and UNHCR’s funding distribution is
compared with the negligible correlation between the numbers of protracted refugees and UNHCR’s funding
distribution this suggests that:
• UNHCR’s funding is focused more on new arrivals than on protracted refugees.
In order to estimate the UNHCR spend on protracted displacement, the percentage of the caseload in the
country that was in protracted displacement was multiplied by the funding for that country and then summed.
This was then divided by the total funding to give an estimate of the level of UNHCR funding for protracted
displacement.
This calculation suggested that 43.5% of UNHCR funding in 2014 was for protracted displacement. This may
be an overestimate as it implicitly assumes that funding per capita is the same in any given country for
protracted and non-protracted refugees. However, without a good method for estimating the imbalance, we will
use this estimate of 43.5%. It should be noted that this proportion of funding is less than the 54% of the
UNHCR caseload that are in protracted displacement.
This percentage can be expected to rise by 2016 when, unless there are major improvements, most of the Syrian
caseload will be in protracted displacement.
• Total expenditure for 2014: $3,348.1 million
• Of which expenditure for displacement: $3,312.1million.
• Proportion of expenditure on the displaced for protracted displacement: 43.5%: $1,440.3 million.
Protracted displacement: Uncertain paths to self-reliance in exile – Annexes | 47

Interestingly, UNHCR’s overall expenditure correlates better with overall displacement than the protracted
displacement expenditure correlates with UNHCR’s refugee expenditure. The overall expenditure includes
funding for stateless persons, IDPs and returnees.
• The distribution of UNHCR’s overall expenditure is moderately correlated with all displacement.
WFP
WFP’s funding is reported at $5.38 billion in 2014.34 However, the report on direct expenditure gives a total of
$4,717.6 million excluding PSA (this is typically 7%). If a 7% PSA is applied this brings the total expenditure to
$5,072.7 million in 2014. WFP reports that 7.3% of direct expenditures went for development. Another 4.6%
was for bilateral and trust fund projects, many of which are developmental in nature. Many of the special
operations are in support of relief operations. This gives a total of $4,470 million for humanitarian action.
Of WFP Relief Operations, 54% of expenditure was for emergency operations and 44% for protracted relief
and recovery operations. Both of these types of projects may include refugees. In fact, the cost of food in
protracted relief and recovery operations means that WFP’s contribution may out-weight UNHCR’s in
protracted displacement.
The problem with estimating WFP expenditures is that while refugees and IDPs only represent 26% of WFP’s
total caseload in 2014. However, these types of beneficiaries typically cost much more per head to service than
school feeding, or food for asset programmes for example.
34 http://www.un.org/en/ecosoc/qcpr/pdf/wfp_annual_report_2013.pdf
Protracted displacement: Uncertain paths to self-reliance in exile – Annexes | 48

WFP gives the total assisted in emergencies as 42 million. Emergency funding is given as 56% of all relief
funding. Of the six crises that WFP responded to in 2014, four involved significant conflict-driven displacement
(Iraq, Syria, South Sudan and the Central African Republic).
The distribution of WFP’s relief expenditure correlates moderately well with the distribution of total UNHCR
expenditure. The distribution of WFP’s relief expenditure also correlates well with the distribution of all
displaced (r = 0.65). This correlation would suggest that WFP’s spending on displacement is higher than the
caseload proportion of 25%. An estimate of 35% may be realistic.
Assessing the distribution of WFP’s relief expenditure by the level of protracted displacement in the countries
with WFP funding suggests that 50% of WFP expenditure for displacement is for protracted displacement. This
is higher than for UNHCR, but is not surprising as food assistance is often far larger than other types of
assistance to the displaced after a few years.
• Total (other than development) expenditure for 2014: $4,470 million.
• Proportion of expenditure for displacement: 35%: $1,565 million.
• Proportion of expenditure on the displaced for protracted displacement: 50%: $782 million.
Protracted displacement: Uncertain paths to self-reliance in exile – Annexes | 49

UNICEF
2014 expenditure by UNICEF was $4,868 million.35 We have been unable to locate any country breakdown.
UNICEF presents all its spending as development spending, but reports that 30.5% of the $5,169 million it
raised in 2014 ($1,579 million) was for humanitarian assistance. It can be assumed that all of this was spent as
the report talks about humanitarian needs outstripping resources.
Year UNICEF posts Of which tagged as
refugee or IDP
as %
2015 (to 10 March) 277 121 44%
2014 1,313 614 47%
2013 974 457 47%
Nearly half (47%) of all UNICEF posts on ReliefWeb refer to IDPs or refugees ($742 million). Assuming that
the distribution follows the UNHCR pattern, about 43.5% of the funding for displacement is for the protracted
displaced ($308 million).
• Total humanitarian funding in 2014: $1,579 million
• Proportion of expenditure for displacement: 47%: $743 million.
• Proportion of expenditure on the displaced for protracted displacement: 43.5%: $323 million.
Summary
Using the above data, and assuming that other humanitarian funding follows the pattern of UNICEF and WFP
as these are not dedicated to displacement (with 38% of their expenditures for displacement and 18% for
protracted displacement), we developed the following estimate.
Organisation Humanitarian
expenditure or funding
in 2014 ($ millions)
Of which for
refugees or IDPs ($
millions)
Of which for
protracted displaced
($ millions)
UNRWA 1,311 1,311 1,311
UNHCR 3,348 3,312 1,441
WFP 4,470 1,565 783
UNICEF 1,579 743 324
Total for 2014 10,708 6,931 3,859
Other humanitarian funding 13,792 5,241 2,516
Overall funding 24,500 12,172 6,375
As percentage of total 100% 50% 26%
The figure for other humanitarian funding was obtained by subtracting the identified humanitarian funding
from the GHA estimate of $24.5 billion of humanitarian funding in 2014. Of this approximately 50% was
estimated to be spent on displacement and roughly half of the total on protracted displacement.
35 http://www.unicef.org/publications/files/UNICEF_Annual_Report_2014_Web_07June15.pdf
Protracted displacement: Uncertain paths to self-reliance in exile – Annexes | 50

It should be clear that this estimate is based on a tower of assumptions, and is little better than an informed
guess as to the extent of funding for protracted displacement.
Description of fields in Annex 1
All of the columns have a filter function, allowing you to select a proportion of the overall data set such as only
low-income or Sub-Saharan African countries or countries with a population over a particular size. The filters
also allow sorting on any of the columns.
In most cases the total is the total for the current set. The percentage of the unfiltered total gives the percentage
of the overall number represented by the current set. The average is an unweighted average for the current set. In
some cases, the total is not a simple total, but a calculation of the appropriate value for the current set.
Factor Source Comments
Filtered Row Count Generated Allows the user to filter or a limited number of
countries, e.g. the top ten countries for whatever the
current sort order is. The total is the number of
countries in the current set.
Country Name Mostly used the
standard UNHCR
name of the state
The need to accommodate different forms of the
names used in different databases and in different
years meant that translation tables had to be
developed. In some datasets names were not used
consistently between years in some cases, requiring a
significant effort to develop translation tables.
Region Regions taken from the
OECD/DAC
classification of
geographical regions
Any additional cases were classified geographically
World Bank Income
class
Classification taken
from the Word Bank
list for 2014
Some states and territories are not classified by the
World Bank (due to their small size etc.). They were
classified by the authors using the best available
estimate of GDP
Classified as a fragile
state in 2014 by:
Fragile states list from
the OECD/DAC, World
Bank and the FSI
The OECD/DAC Fragile Sates Report 2014 classifies
51 countries and territories as fragile states, against
37 states on the WB/AfDB/ADB harmonised list for
2014 and 34 states with a score of 90 or over on the
FSI list for 2014
Protracted displacement: Uncertain paths to self-reliance in exile – Annexes | 51

Factor Source Comments
Fragile States Index
classification 2015
Fragile States Index The 2015 values were used as they were based largely
on 2014 data.
Classification No of countries
Unclassified 48
Very Sustainable 1
Sustainable 14
More Stable 11
Stable 15
Less Stable 12
Low Warning 18
Warning 41
High Warning 28
Alert 21
High Alert 12
Very High Alert 4
World Bank
Population (millions)
World Bank De facto population at the end of 2014 as estimated
by the World Bank. This figure is for the population
regardless of status. Populations for sites not listed by
the World Bank as the most recent population given
on Wikipedia. There may be some minor double
counting in the total population as the populations for
some territories are included in the population for the
controlling state e.g. French Overseas Territories.
IDPs IDMC estimates of IDP
numbers
Used the data for 2014 from the six-year (2009-2014)
data set available on the IDMC website
Refugees (UNHCR
and UNRWA) here
UNHCR and UNRWA Uses data from the UNHCR online database as
updated on 22 June 2015 for this country of refuge.
Various UNRWA publications.
Asylum-seekers here UNHCR Uses data from the UNHCR online database as
updated on 22 June 2015 for this country of refuge.
Total displaced in
this country
UNHCR, UNRWA,
IDMC
Sum of the above data
Displaced here as %
of total
UNHCR, UNRWA,
IDMC
The number of displaced in this country as a
percentage of the total number of displaced.
Protracted displacement: Uncertain paths to self-reliance in exile – Annexes | 52

Factor Source Comments
Scale of displacement
in this country
UNHCR, UNRWA,
IDMC
A one word descriptor for the scale of displacement in
this country.
Displaced in 2014 Descriptor Countries
0 Nil 60
1–1,000 Trivial 38
1,001–5,000 Minor 24
5,001–20,000 Small 17
20,001–50,000 Medium 16
50,001–200,000 Significant 29
200,001–500,000 Major 16
500,001–2,000,000 Large 16
2,000,001+ Huge 9
Total displaced here
per million
population
UNHCR, UNRWA,
IDMC and WB
Calculated using the de facto population for the
World Bank . No adjustments were made to the
population figure for refugees or IDPs. The total
shown is not the column total but the displacement
per million population for the current set.
Number of countries
sending refugees here
UNHCR and UNRWA A count of the numbers of countries of origin sending
refugees here. The total shown is the range of values
for the current set.
Proportion of
caseload here as
refugees or asylum-
seekers
UNHCR, UNRWA,
and IDMC
The refugee and asylum-seeker caseload as a
proportion of the total caseload in country. The total
shown is not a column total but a calculated
proportion for the current set.
Proportion of refugee
and asylum-seeker
caseload here as
asylum-seekers
UNHCR and UNRWA The number of asylum-seekers divided by the sum of
the refugee and asylum-seeker caseloads in this
country
Number of refugees
in protracted
displacement here
UNHCR and UNRWA Calculated for each pair of asylum/refuge countries.
Protracted displacement taken to be those displaced
for over three years. 100% of UNRWA caseload
taken to be in protracted displacement (i.e. no
adjustment for children under three).
Proportion of refugee
caseload here in
protracted
displacement
UNHCR and UNRWA By calculation from previous figures. The total shown
is not a column total but a calculated proportion for
the current set.
Protracted displacement: Uncertain paths to self-reliance in exile – Annexes | 53

Factor Source Comments
Percentage of refugee
caseload from
neighbouring
countries
UNHCR and UNRWA Based on the percentage of the refugee caseload
(UNHCR and UNRWA) from countries with an
adjoining land border. The total shown is not a
column total but a calculated proportion for the
current set.
Refugees (UNHCR
and UNRWA) from
here
UNHCR and UNRWA Uses data from the UNHCR online database as
updated on 22 June 2015 for this country of origin.
Various UNRWA publications. All UNRWA refugees
taken to be from Israel.
Asylum-seekers from
this country
UNHCR Uses data from the UNHCR online database as
updated on 22 June 2015 for this country of origin.
Total displaced by
this country
UNHCR, UNRWA,
IDMC
Sum of the above data plus the IDP number
previously given
Displaced from here
as % of all displaced
UNHCR, UNRWA,
IDMC
The number of displaced from this country as a
percentage of the total number of displaced.
Scale of displacement
from this country
UNHCR, UNRWA,
IDMC
A one-word descriptor for the scale of displacement
from this country.
Displaced in 2014 Descriptor Countries
0 Nil 34
1–1,000 Trivial 77
1,001–5,000 Minor 30
5,001–20,000 Small 17
20,001–50,000 Medium 17
50,001–200,000 Significant 14
200,001–500,000 Major 17
500,001–2,000,000 Large 9
2,000,001+ Huge 10
Displacement from
here per million
population
UNHCR, UNRWA,
IDMC and WB
Calculated using the de facto population for the
World Bank. No adjustments were made to the
population figure for refugees or IDPs. The total
shown is not a column total but the calculated value
for the current set.
Number of countries
to which this country
sends refugees
UNHCR and UNRWA A count of the numbers of countries of refuge with
refugees from this country. The total shown is the
range of values for the current set.
Proportion of
caseload from here as
refugees or asylum-
seekers
UNHCR, UNRWA,
and IDMC
The refugee and asylum-seeker caseload from this
country as a proportion of the total caseload from this
country. The total shown is not a column total but a
calculated proportion for the current set.
Protracted displacement: Uncertain paths to self-reliance in exile – Annexes | 54

Factor Source Comments
Proportion of refugee
and asylum-seeker
caseload from here as
asylum-seekers
UNHCR and UNRWA The number of asylum-seekers divided by the sum of
the refugee and asylum-seeker caseloads from this
country
Number of refugees
from here in
protracted
displacement
UNHCR and UNRWA Calculated for each pair of asylum/refuge countries.
Protracted displacement taken to be those displaced
for over three years. 100% of UNRWA caseload
taken to be in protracted displacement (i.e. no
adjustment for children under three).
Proportion of refugee
caseload from here in
protracted
displacement
UNHCR and UNRWA By calculation from previous figures. The total shown
is not a column total but a calculated proportion for
the current set.
Max duration of
refugee crisis here
from 1978–2014
UNHCR and UNRWA This is based on the maximum period that the number
of refugees from this country was above 10% of the
peak refugee displacement. The total shown is the
range of values for the current set.
Percentage of refugee
caseload in
neighbouring
countries
UNHCR and UNRWA Based on the percentage of the refugee caseload
(UNHCR and UNRWA) in countries with an
adjoining land border. The total shown is not a
column total but a calculated proportion for the
current set.
UNHCR refugee
caseload in this
country of refuge
UNHCR Uses data from the UNHCR online database as
updated on 22 June 2015 for this country of refuge.
Proportion of
UNHCR refugee
caseload here in
camps
UNHCR UNHCR Supplemental tables published in June 2014
as background data for the Global Trends Report
(http://www.unhcr.org/statistics/14-WRD-
tab_v3_external.zip). Proportion based on the number
in camps of all types. The total shown is not a column
total but a calculated proportion for the current set.
Proportion of
UNHCR refugee
caseload here in
individual
accommodation
UNHCR UNHCR Supplemental tables published in June 2014
as background data for the Global Trends Report
(http://www.unhcr.org/statistics/14-WRD-
tab_v3_external.zip). The total shown is not a column
total but a calculated proportion for the current set.
Protracted displacement: Uncertain paths to self-reliance in exile – Annexes | 55

Factor Source Comments
Proportion of
UNHCR refugee
caseload here with
unknown
accommodation
UNHCR UNHCR Supplemental tables published in June 2014
as background data for the Global Trends Report
(http://www.unhcr.org/statistics/14-WRD-
tab_v3_external.zip). The total shown is not a column
total but a calculated proportion for the current set.
Proportion of
UNHCR refugee
caseload here in
urban settings
UNHCR UNHCR Supplemental tables published in June 2014
as background data for the Global Trends Report
(http://www.unhcr.org/statistics/14-WRD-
tab_v3_external.zip). The total shown is not a column
total but a calculated proportion for the current set.
Proportion of
UNHCR refugee
caseload here in rural
settings
UNHCR UNHCR Supplemental tables published in June 2014
as background data for the Global Trends Report
(http://www.unhcr.org/statistics/14-WRD-
tab_v3_external.zip). The total shown is not a column
total but a calculated proportion for the current set.
Proportion of
UNHCR refugee
caseload here in
unknown settings
UNHCR UNHCR Supplemental tables published in June 2014
as background data for the Global Trends Report
(http://www.unhcr.org/statistics/14-WRD-
tab_v3_external.zip). The total shown is not a column
total but a calculated proportion for the current set.
Proportion of
UNHCR country-
specific spend for this
country of refuge
UNHCR Downloaded data from
http://reporting.unhcr.org/financial
Proportion of WFP
country- specific
spend for this country
of refuge
WFP Data abstracted from Annual Report to the Board
from
http://documents.wfp.org/stellent/groups/public/docu
ments/eb/wfpdoc063825.pdf
Estimated proportion
of global
humanitarian spend
in this country of
refuge
ReliefWeb Based on the proportion of ReliefWeb country-
specific references referring to this country as the
primary country in 2014. This is based on the
observation of the high correlation between funding
and ReliefWeb posts observed in 2011.
Protracted displacement: Uncertain paths to self-reliance in exile – Annexes | 56

Factor Source Comments
Degree of focus of
international
community on this
country of refuge
ReliefWeb This is a descriptive term based on the proportion of
ReliefWeb country-specific references referring to this
as the primary country in 2014.
% of posts Descriptive term Countries
0.0% to 0.099% Negligible focus 139
0.1% to 0.499% Almost forgotten 47
0.5% to 0.999% Some attention 13
1.0% to 2.999% Significant focus 16
3.0% to 4.999% Strong focus 6
5.0% to 100% Main focus 4
Trend in focus
(2013–2014)
ReliefWeb This is a descriptive term reflecting the change in the
percentage of country specific references on
ReliefWeb posts between 2013 and 2014. It is only
applied to countries where the combined number of
posts for 2013 and 2014 was at least 0.1% of the
number of posts in 2014.
Change Descriptive term Countries
50+% less Strongly decreasing 14
10–50% less Decreasing 47
10% less to
10% more
Little change in
numbers 20
10–50% more Increasing 8
50+% more Strongly increasing 25
Degree of attention to
refugees and IDPs in
international focus
ReliefWeb This is a descriptive term referring to the proportion
of ReliefWeb posts for a country that are tagged by
ReliefWeb as referring to refugees or IDPs.
% posts for 2014
tagged as referring to
IDPs or refugees Classification Countries
0% Nil 91
0.01–3.99% Negligible 12
3–9.99% Slight 30
10–2499% Weak 34
25–49.99% Moderate 27
50–84.99% Strong 21
85–100% Very strong 10
Protracted displacement: Uncertain paths to self-reliance in exile – Annexes | 57

Appendix to Annex 2: Assessing the quality and availability of the data
Given the lack of ideal data for estimating the state of protracted displacement, the study team spent some time
on analysis of the quality of the datasets that have been used to report on displacement and to estimate the
frequency of situations of protracted displacement and the numbers of refugees who can be considered in a state
of protracted displacement.
The different datasets were subject to Benford analysis36 to assess the extent to which the data was synthetic, the
findings of which confirmed the study team’s conclusion that better and more exact estimates of protracted
displacement would require improvements in the available global data sets. The Benford analysis suggested that
UNHCR data, dating back to 1960, has improved over time, with improvements after 1979 and again from
1990 onwards. For IDP data, the Benford analysis suggested that figures for IDPs from both UNHCR and
IDMC were subject to a higher degree of estimates and rounding than recent UNHCR data – a finding
consistent with IDMC’s own reporting on the challenges and limitations of current IDP data.37
The quality of UNHCR data has improved over time. The current UNHCR database only provides data on
countries of origin from 1960 and only provides data on at least 80% of the total caseload from 1980.
These limits were why the study used data from 1978 only.
By contrast, UNHCR data on the caseloads in the countries of refuge was much more complete.
36 This analysis makes use of the property that the frequency of the first significant digit varies by the digit in many naturally occurring countable numbers. 37 IDMC 2015 Global Overview 2015: People Internally Displaced by Conflict and Violence, introduction.
Protracted displacement: Uncertain paths to self-reliance in exile – Annexes | 58

Annex 3: Review methodology
Type of documents reviewed
The study reviewed both primary and secondary literature published between 2000 and 2014. Generally, grey
literature did not feature in this review. It was only considered if recommended by one of the experts or if cited
heavily. In total, 157 documents were consulted in total, 84 of which were peer-reviewed articles published in
academic journals and (mostly) peer-reviewed research studies.
All documents were systematically compared using a spreadsheet matrix according to type of source, type of
document, geographical scope and case studies covered. They were compared on their use of primary and
secondary data, the inclusion of quantitative data and their sensitivity to gender dynamics. It was also noted
whether documents discussed the effect of government policy frameworks and evaluated the effectiveness of
food security and education initiatives or other specific self-reliance or livelihood interventions. The review also
compared documents with regard to whether they drew on cost–benefit analyses of some sort, evaluating for
example the value for money38 of self-reliance and livelihood programmes and care and maintenance regimes.
Finally, documents were also compared according to whether they discussed the appropriateness of funding for
the interventions featured in the research.
Sources of documents reviewed
Documents reviewed were identified from bibliographies in recent key publications. Experts identified by the
study team were also contacted and asked to provide leads and bibliographies. To avoid potential selection
biases, the majority of documents were identified through key word searches in search engines, library
catalogues and the websites of academic journals, think thanks, policy institutes and intergovernmental agencies.
The research team was advised to apply two search strings for the literature review:
(1) protracted displacement/refugees/IDPs AND livelihoods/ jobs/ employment/ self reliance/
(2) protracted displacement/refugees/IDPs AND protection/rights/durable solutions/
The search strings often failed to identify applicable literature, particularly case studies. Additional case study-
specific key word searches proved more effective. Additional search terms included cash-based interventions,
labour market access, refugee/IDP integration, refugee/IDP camp economies and food safety. It is important to
note here that the terminology around livelihoods and self-reliance in the context of protracted displacement is
vast and extremely diverse. Thus, while certain key word combinations worked extremely well in the case of one
case study, they generated no hits in another.
38 Documents qualified for the ‘value for money’ category if programme evaluations included a general or specific discussion on the returns on investments. The majority of documents reviewed, however, did not specifically disclose actual programme costs. Instead they discussed positive or negative cost-to-benefit ratios in terms of programme efficiency and effectiveness, while monetary or material concerns were mostly expressed in relation to maintenance costs or funding constraints.
Protracted displacement: Uncertain paths to self-reliance in exile – Annexes | 59

From the academic journals consulted, the following seven featured relevant literature most frequently:
Disasters, Refugee Survey Quarterly, Development Policy Review, Forced Migration Review, Journal of Refugee
Studies, Refuge (Canada) and International Migration Review.
The researchers prioritised countries that appeared less frequently in the literature. They also aimed to achieve a
balance between literature on theory and empirical evidence or accounts by distributing the search time evenly
across academic and non-academic sources. No literature was excluded from the review process in order to
achieve a balance between theoretical and empirical studies.
Timeframe
The review focused on literature published between 2000 and 2014. Studies outside of this date range were
omitted from the review.
Geographic scope
Bearing in mind the need to put practical limits on the scope of the literature review, the study was limited to 12
case studies. The case studies chosen represent the top six refugee and IDP countries in the world.
Refugees IDPs
Jordan Colombia
Pakistan Sudan
Iran DRC
Kenya Somalia
Chad Iraq
Uganda Azerbaijan
It is important to note that this separation between IDP and refugee contexts is somewhat arbitrary. Both
populations of concern are found in most of the case studies, and much of the literature does not distinguish
between IDPs and refugees in situations of protracted displacement, but addresses the issue of protracted
displacement more holistically.
Quality of the evidence
In order to ensure a rigorous literature review, all the documents consulted provided evidence with
methodologies and/or peer review. Reviewed documents either constituted academic peer-reviewed research or
research institution/policy/think-tank reports that provided evidence on populations in protracted displacement
based on a sound methodology. Of the total number of 157 sources, 84 were peer reviewed (approximately
55%). Grey literature was only consulted if it was recommended by one of the experts or if it was highly cited.
The majority of the reviewed literature was qualitative in nature. Only approximately 20% of sources referred
to or presented quantitative research. Many of the reviewed documents had a practitioner focus, while
approximately 12% was produced by intergovernmental agencies, predominantly UNHCR.
Protracted displacement: Uncertain paths to self-reliance in exile – Annexes | 60

Challenges and limitations
Due to the limited timeframe of the literature review, documents published prior to 2000 fell outside the scope
of this study and were omitted by the research team, although older publications that had been cross-referenced
multiple times by the relevant literature were also consulted.
The uneven coverage of the case studies posed a significant challenge. While some, such as Kenya, Uganda and
Somalia, were prominently represented, others, such as Azerbaijan and Chad, were not. In the case of Azerbaijan
in particular relevant available literature is extremely scarce. While researchers aimed to prioritise case studies
that appeared less frequently in the literature, a balanced representation of all 12 case studies could not be
achieved.
The preset search strings often proved unsuccessful; although generating a large number of hits, most of the
literature detected was not applicable to the case studies or the protracted displacement context. Thus, general
key word searches as well as country specific ones where conducted for each country. Researchers searched
websites of academic journals, think thanks, policy institutes and intergovernmental agencies directly, always
applying the same key words.
Another methodological challenge lay in the analysis and comparison of documents in the spreadsheet matrix. A
lack of conceptual clarity in existing guidance on the definition of value for money and self-reliance sometimes
made it difficult to objectively assign documents to a certain Yes/No category in the spreadsheet matrix.
Some guidance is provided below on how researchers approached their answers to the following Yes/No
questions covered by the spreadsheet matrix.
Sensitivity to gender dynamics? Yes/No
Documents qualified as ‘gender sensitive’ if the presented data was gender disaggregated, or if women/gender
was mentioned specifically as an issue. Gender did not have to be the main theme in the document for it to
qualify for the ‘yes’ category; however, simply mentioning the issue would not suffice. If a document included at
least one sub-section that discussed the findings through a gender-sensitive lens, researchers marked it as being
sensitive to gender dynamics. It is therefore important to note that, while many documents have been identified
as being gender sensitive in their analysis, not all of are so to the same degree.
Value for money of self-reliance and livelihoods? Yes/No
Value for money of care and maintenance regimes? Yes/No
For both of these questions, researchers generally selected ‘Yes’ if the issue was explicitly discussed and if it was
implied in the overall findings/recommendations. Of course, it still remains difficult to measure. From our review
we can say that there appears to be a gap in the literature as only a couple of documents qualified for the ‘Yes’
category.
Protracted displacement: Uncertain paths to self-reliance in exile – Annexes | 61

Evaluates specific self-reliance or livelihood intervention? Yes/No
‘Yes’ was selected if a specific intervention was mentioned, whether it was cited as an example or in a box.
Literature that included references to certain types of interventions, such as ‘food for work’ or cash vouchers,
would be included in the ‘Yes’ category, but only when their effectiveness and outcomes were discussed. If
interventions were mentioned without any evaluation of their appropriateness, effectiveness or outcomes, ‘No’
would be the selected answer.
Appropriateness of funding architecture? Yes/No
‘Yes’ was selected if the author mentioned whether the funding structure in place was appropriate/working/not
working, or how funding structures could be changed for the better. For example, for agencies to be able to plan
their projects with an eye towards durable solutions, they need access to multi-year funding, rather than one-
year grants from donors. Another example could be that local staff of international agencies should have the
opportunity to provide more input into how funds are used, as they possess local knowledge and know what is
appropriate to the local context. Thus, in order to qualify for the ‘Yes’ category, some sort of commentary was
required regarding whether the funding structure in place was appropriate for the desired outcomes (enabling
self-sufficiency of refugees, long-term livelihood programming, etc.).
Protracted displacement: Uncertain paths to self-reliance in exile – Annexes | 62

Annex 4:
Typology 2: Assessing the environment for successful self-reliance programming
Rationale
This typology draws on the findings of the literature review, covering hundreds of documents that draw
attention not only to the factors that enable the displaced to achieve sustainable livelihoods, but also to the
factors that hamper efforts by external aid actors to implement successful programmes.
These have been grouped into four themes:
The legal framework and protection environment
This typology recognises that several key rights form the foundation of and the limits to what
displaced people may be able to achieve. Freedom of movement is crucial so that the displaced
can get to places where they can match their skills with opportunity; property rights are
important for everything from security of tenure to an incentive to invest; and the right to work
opens up the possibility of formal employment. However, this section also recognises that, in
the absence of these formal rights, the displaced often achieve de facto recognition of their right
to earn a living in the (often far larger) informal economy, or respect for their control over land
that has been purchased through customary procedures. Likewise, the existence of rights mean
little if the host state is not able to ensure that they are upheld, or provide protection to the
displaced.
Access to markets and the private sector
The ability of the displaced to access markets is fundamental to the scope they have to buy or
sell goods, services and labour. In cases where access is limited, notwithstanding the economies
that form in places like closed camps, it is highly unlikely that they will be able to achieve self-
reliance. The displaced can also be economically isolated by language barriers and cultural
The environment for sucessful self-reliance programming
Capacities, resources and assets of the
displaced
Environment for external intervention
Legal framework and
protection environment
Dynamics of the local economy
Protracted displacement: Uncertain paths to self-reliance in exile – Annexes | 63

attributes, such as belonging to a clan which does not possess the ‘right’ affiliation. Lastly, the
threat of abuse and violence limits and distorts the economic opportunities open to any
community.
The capacities, assets and resources of the displaced
The displaced also arrive with – and develop – a set of characteristics that have a significant
influence on their ability to find sustainable livelihoods. At a minimum, displaced people
should not still be exhibiting emergency symptoms – injury, malnutrition – but they will also be
at a disadvantage if their skills are not matched to the local economy. Within a given
population, the degree of social capital and spread of information will also be crucial in linking
the displaced with opportunities. The need for material inputs and credit is a recurring theme in
the livelihoods literature. Lastly, access to basic services constitutes an important resource for
any economic actor.
The environment for external intervention
The attitude of the government (or host state in the case of refugees) provides an overarching
framework determining whether attempts by external aid actors succeed or fail. Even if the
factors falling under the other three themes are largely positive, if the government is strictly
opposed to greater economic integration of the displaced, or if dialogue between aid actors and
the state is hostile or difficult, then programming encouraging self-reliance is likely to be
opposed or denied. Likewise, if donors do not recognise the developmental needs of the
displaced as important, or provide funds in such a way that long-term livelihoods work can be
implemented, then the response will remain limited to emergency modalities.
The interplay of these four themes shapes the environment for any potential self-reliance programming.
Purpose of this typology
The purpose of the typology is to provide a system for grading and characterising situations with the greatest
chance of successful livelihoods programming – this is an aid-centric typology. The typology could help to
determine where political and material resources would be best spent to further self-reliance.
The process of answering the checklist can also be used to identify issues that reduce the likelihood of successful
livelihoods programming in a particular context. For example, identifying which themes generate the lowest
score should indicate where efforts could yield the biggest improvements in the environment for self-reliance.
Caveats
This typology makes an assessment about the likelihood that livelihoods work will be successful at scale, but it
does not deal with highly disaggregated data. It involves generalising across large groups, which may contain a
diverse range of livelihoods situations.
Protracted displacement: Uncertain paths to self-reliance in exile – Annexes | 64

A low score does not preclude the possibility of small-scale or under-the-radar livelihoods projects. Neither does
it suggest that livelihoods should not be an important element in the analysis and design of programmes – even
in the most acute emergencies, the livelihoods strategies of the displaced should be taken into account from the
start, even if only to ensure that these strategies are not undermined.
The typology is not prescriptive about the type of livelihoods programming that could be viable in a particular
context, or how host government policies and programmes might accommodate self-reliance strategies for the
displaced. Nor does it provide a detailed picture of the market in which the displaced pursue their livelihoods, or
their capacities.
This typology does not require economic training in order to complete it, though it does require some familiarity
with basic concepts related to livelihoods – market supply and demand, the role of social capital in facilitating
employment etc. It should be completed by staff familiar with these terms, or a mixed team incorporating people
with expertise in protection issues for displaced persons, livelihoods and familiarity with the context.
Applying the typology
Go through the checklist of questions associated with each criterion in order to assign it a score, both for each
theme and cumulatively for the typology as a whole. The questions are equally scored in all themes, bar theme 3.
Here the scores for each question are doubled. The aggregate measure is composed of the addition of the scores
for each theme.
These statements are written in a formulation that conveys a favourable condition for livelihoods work.
A score should be given to each of the key questions, grading them according to the following scale:
• Not true in most cases = -1
• Sometimes true (or true for a significant minority) = +1
• Frequently true = +2
• True in almost all cases = +3
Ideally several people with knowledge of the context should complete this exercise, with first-hand experience of
the livelihoods activities and economic environment of the displaced. This could take the form of several people
sitting down to fill out the checklist together, or the checklist could be sent to several different people to fill out
alone, with the modal score for each question feeding into the final result.
The rubric – see annex 5
The total score for each theme will place the context on a spectrum in the rubric. Generic scenarios are described
to give a sense of the ways in which each theme can constrain or facilitate livelihoods work. Do not expect your
scenario to align perfectly with one of these descriptions.
When all four themes have been addressed then total up the score.
Protracted displacement: Uncertain paths to self-reliance in exile – Annexes | 65

Theme Score
Legal and protection
Access to the market and private sector actors
Capacities, assets and resources
Environment for intervention
Total:
This final score places the context under examination on a scale from ‘Highly Constraining’ to ‘Highly
Conducive’.
Scoring
0–21: ‘Social Protection Priorities’
In these scenarios it is likely that little is possible beyond care and maintenance or protection activities, probably
because of acute obstacles with regard to the needs of the displaced, political constraints on livelihoods work,
instability in the local environment and weak leverage or interest of the international community, or an interplay
of these factors. This does not mean that livelihoods are unimportant and should not be analysed and factored
into programming, but just that resources spent promoting ‘self-reliance’ are highly unlikely to achieve that
result at scale and may detract from core emergency activities.
22–30: ‘Precarious Providers’
This scenario also displays a range of harsh constraints on livelihoods work, though there may be space for
small projects to exploit ‘grey areas’ in legal or political frameworks or engage in work that may reap benefits
when conditions change. These scenarios may require humanitarian modalities in the present, though possible
links to development programmes or the integration of development approaches should not be ignored where
these do not compromise humanitarian space.
31–39: ‘Hopeful Providers’
In these scenarios there is scope to do innovative programming, though perhaps not at scale. There is capacity
and willingness in some parts of government to improve the self-reliance of the displaced, though this probably
does not enjoy widespread political support. The scope may exist for integration into some development plans.
The environment is probably enabling for spontaneous income generating activities and for some of the
displaced to cover basic needs and still have surplus income.
40–57: ‘Partners in Prosperity’
In this scenario there is scope for meaningful collaboration with host governments and an enabling environment
for innovative approaches. Dialogue can be held on integrating the displaced into national and local
development frameworks. The displaced are free to work or own businesses and property without extraordinary
Most Conducive Most Constraining
Protracted displacement: Uncertain paths to self-reliance in exile – Annexes | 66

discrimination. With some support, they could achieve economic integration and make investments in their
future.
Scorecard
Scorecards present the overall score and generic description of the possibilities in this context. They also include
indicators – which are not calculated in the score – to help to contextualise the scale of need for livelihood
approaches. These are the scale and duration of the crises and the scope for durable solutions.
Example summary scorecard
Environment for successful self-reliance programming for Y Displaced Group in X Context
[TAILORED TO CONTEXT, and highlighting where the largest constraints to self-reliance programming lie]: This
scenario displays a range of harsh constraints on livelihoods work, though there may be space for small
projects to exploit ‘grey areas’ in legal or political frameworks or engage in work that may reap benefits when
conditions change. These scenarios may require humanitarian modalities in the present, though possible links
to development programmes or the integration of development approaches should not be ignored where these
do not compromise humanitarian space.
Scale and duration 300,000 refugees, most of whom have been displaced for 10 ten
years
Durable solutions?
Settlement options available, including
combinations where they exist
Return is unlikely as country/place of origin is still unstable
Few resettlement places are open to these refugees
Local integration has been ruled out by the host state.
Most Constraining Most Conducive
28 Precarious Provider
Protracted displacement: Uncertain paths to self-reliance in exile – Annexes | 67

Annex 5: Typology 2 rubric
Characteristics of conducive and constraining environments for self-reliance programming Most constraining – Most conducive 0–3
4–7 8–11 12–15
Countries in this range typically exhibit these characteristics: Legal framework and protection environment
The displaced have no or few recognized rights of residence, employment, property ownership and movement (and, in the case of IDPs, political rights). Their environment is characterised by acute threats to security and high volatility. Some evade restrictions, but legal constraints effectively suppress economic activity, or there is capricious and corrupt tolerance of economic activity which the displaced take advantage of with risk. Volatility and abuses are major setbacks. Organisations may be able to do limited advocacy/programming to redress abuses or reduce threats, but these can have little influence on the basic drivers of insecurity or the legal framework.
The displaced possess some but probably not all of the core rights that encourage self-reliance. Any existing livelihoods work with the displaced is likely to be unofficial or precarious. The government may tolerate only a narrow range of activities, or accept livelihoods work in principle but be unable to overcome obstacles to implementing it in practice. Abuses and instability jeopardise gains made towards self-reliance, and the government struggles to ensure rule of law.
The legal framework contains gaps in recognising the rights of the displaced or is not fully implemented, but there is a positive or tolerant attitude on the part of the authorities to livelihoods or self-reliance. While some protection threats exist these do not make the pursuit of livelihoods impossible. Rule of law more or less pertains and the displaced benefit from this stability. External organisations may be able to work with the state to improve legal frameworks or address threats to the displaced.
The displaced enjoy recognised rights of residence, employment, property ownership and movement (and, in the case of IDPs, political rights). If these rights are infringed they have means of redress. There is a positive attitude by the government to the self-reliance activities of the displaced. They do not face acute threats en masse and enjoy a degree of stability and security that makes livelihoods possible. The government maintains rule of law and the displaced benefit from this too.
0–4 4–6 7–15 15–18 Access to markets and the private sector
The displaced are strictly confined or only have access to small or remote markets. The local population themselves only have very limited access to economic opportunities, which are not diverse. The displaced probably have few or weak connections to the local private sector, perhaps exacerbated by language or other cultural barriers. The displaced may regularly suffer discrimination in gaining access to markets and employment, or there may be acute threats to their safety in accessing livelihoods opportunities.
The displaced may be partially confined, or have access to markets but face severe difficulties accessing them, for example because of distance and transport expenses. The barriers to entry in the local economy are formidable, including periodic discrimination, but some of the displaced have established livelihoods. Language barriers or other cultural attributes may isolate the displaced to an extent from the local private sector. Only a few of the displaced have established relationships with customers/suppliers/ contacts/mentors in the host community. Concerns about safety, discrimination or other threats constrain efforts to search for livelihoods.
The majority of the displaced have access to markets for labour, services and goods. The majority of the displaced have adequate if costly access to transport or proximity to markets, or are near enough to these locales to walk to them. They still face barriers to entry, but through their social networks, political capital or other means some are able to access opportunities within the host community. While there may be threats to their safety while engaging in livelihoods activities these do not preclude the majority from pursuing them.
The local economy is connected to district, regional and even international markets and the displaced have the right and the ability to access these markets. The displaced are integrated into the local economy and connected with local private sector actors. In general, they do not face significant protection threats in pursing livelihoods
Protracted displacement: Uncertain paths to self-reliance in exile – Annexes | 68

0–3 4–6 7–9 10–12 Capacities, assets and resources of the displaced
Many of the displaced are destitute and have few avenues for support. They may be highly socially isolated. Few receive remittances, and inputs from e.g. external aid actors cannot form the basis of a sustainable livelihood. The skills that the displaced possess are inappropriate to the local economy. Cultural beliefs or ethnic differentiation militate strongly against them or certain groups within the population taking advantage of available work opportunities. The displaced have only poor, precarious or low-quality access to the basic services necessary for them to pursue stable and sustainable livelihoods. If the displaced are or wish to be reliant on land for agriculture, land is unavailable or in poor condition.
The displaced still exhibit emergency needs, and many may be unfit for work. They have access to financial or material support in emergencies but it is inadequate or counter-productive to self-reliance. The displaced show signs of adapting skills and livelihood approaches to the local economy, but may lack information, finance or other resources to put these to use. The displaced have only poor, precarious or low-quality access to basic services and it is difficult for the displaced to achieve access to health, housing, education in areas where they can pursue self-reliance. If the displaced are or wish to be reliant on agriculture, land is hard to access and/or is in poor condition.
The displaced are not or are no longer in need of an emergency response. Remittances and other forms of external support (potential sources include social networks as well as international assistance and the social welfare system) enable some members to set up income-generating businesses or be self-reliant. Some self-reliant members are able to provide opportunities for others in the displaced group. Some are able to put skills, education, qualification or livelihoods assets to use. The displaced have access to the basic services necessary to pursue stable and sustainable livelihoods. It is possible, if not guaranteed, for the displaced to access health, housing and education in areas where they can pursue self-reliance. If the displaced are or wish to be reliant on land for agriculture, it is possible to access viable land, though there may be difficulties in using the land in terms of location, safety and inputs.
The displaced have access to resources for establishing enterprises and to cover emergency needs should these arise. They may have strong social networks that facilitate trade and employment. They have appropriate skills for sustainable livelihoods and are able to educate their children. They do not suffer from extraordinary levels of discrimination in the local economy. The displaced have access to the services (basic, health, housing, education) necessary for them to pursue stable and sustainable livelihoods. If the displaced are or wish to be reliant on agriculture, they have access to viable plots of land.
Protracted displacement: Uncertain paths to self-reliance in exile – Annexes | 69

0–3 4–6 7–9 10–12
Environment for external intervention
In this scenario the government is likely to be both formally and informally opposed to livelihoods work by international organisations. There is a fractious or unstable relationship between external aid actors and the host state. The delivery of international assistance may be difficult because of ongoing widespread insecurity, sanctions or other blockages, and/or there is an absence of international attention (forgotten crises). Funding is most likely delivered for short, emergency-oriented cycles only. There is no or little collaboration between different actors to discuss the development needs of the displaced.
The host state attitude towards the displaced and/or their livelihoods is ambiguous or hostile, or inconsistent between national and local levels. The state may have low capacity or will to implement or support livelihood programmes itself, or high capacity but low political will to do so. There is an unstable relationship between external aid actors and the host state. External funding levels are precarious or decreasing, or funding is problematic because of limitations on its use. There is lip service paid to addressing the development needs of the displaced, but no concrete action is taken.
The host state has positive attitudes towards the self-reliance of the displaced, and/or is tolerant of de facto integration. International agencies and their local partners have a workable relationship with the host state. Funding levels are adequate or sustainable in the medium term, and/or funds may be used to support long-term livelihoods work. There may be dialogue and coordination between the appropriate actors to meet the developmental needs of the displaced.
There is an established partnership between external actors and the government. The government exhibits a willingness to find a solution to the livelihoods situation of the displaced. There are established protocols and policies and institutions for channelling external assistance to host government programmes for livelihoods for the displaced. There is international attention, goodwill and material commitment to solve the livelihood challenges of the displaced. Different actors collaborate to support self-reliance for the displaced.
Protracted displacement: Uncertain paths to self-reliance in exile – Annexes | 70

Annex 6: Typology 2 – results of the pilot application
Aim, approach and limitations
This typology was applied to the 12 contexts that were also the subject of the literature review.39 The exercise
was intended to provide a preliminary categorisation of the contexts and test the typology itself, refining the
methodology where necessary.
The typology should ideally be applied with the combined expertise of several individuals familiar with the
context. However, for the purpose of this exercise and working with available resources, the pilot was
conducted drawing on one Internal Displacement Monitoring Centre country expert per country for the six IDP
contexts, and one refugee expert for the six refugee contexts. Experts drew primarily on desk research.
Research was limited to desk-based information sources. The main sources were the UN, international NGOs,
human rights NGOs, academic papers and think tanks. The number of sources used to answer the checklists
varied. For the refugee contexts, 3–15 sources were used, while for IDP contexts 2–10 sources were used. Many
respondents had to rely heavily on one or two reports which provided detailed information about the livelihoods
of the displaced, reflecting the paucity of livelihoods-related research in some contexts. A small number of
sources might mean that information sources were substituted with a reliance on relevant country experience to
answer the checklist. Respondents may have answered conservatively on statements for which there were no
clear answers in the literature or their country experience.
Comments on the checklist were received at the beginning and end of the process. The lead ODI and IDMC
analysts then revised the checklists and the broader methodology. Final scores were calculated and the
scorecards were completed, with some input from the IDMC country experts.
This approach allowed the exercise to be completed within the allotted time, though it is important to note that
more ‘grounded’ responses to the questions would have been gained by including experts in-country, and by
having the checklists completed by several respondents in order to introduce more rigour and replicability. In
other circumstances, drawing on in-country expertise and triangulation between several respondents remains the
standard guidance for using the typology.
39 The checklist was applied to six refugee contexts (Chad, Iran, Jordan, Kenya, Pakistan, Uganda) and six IDP contexts (Azerbaijan, Colombia, Democratic Republic of Congo, Iraq, Somalia, Sudan).
Protracted displacement: Uncertain paths to self-reliance in exile – Annexes | 71

Results
This section of the annex presents the scorecards for each of the 12 countries analysed. The full checklists are
available on request, and include justifications for each response as well as references where available. A full list
of references drawn on for each checklist is included here.
Environment for successful self-reliance programming for urban IDPs in AZERBAIJAN
The state has implemented numerous positive discrimination measures to help IDPs gain access to
employment and education and meet their basic needs over the course of 25 years of displacement. For the
vast majority of IDPs in urban areas these measures have not led to self-reliance, but to dependency on
state welfare benefits. The state has allowed external actors to carry out livelihoods programmes for IDPs,
but these have mainly been implemented in rural areas.
Self-reliance is possible in urban areas. Not all those of working age have realigned their skills with the
urban environment, while youth are keenest and have the most appropriate skills and education. As an oil-
rich state and a humanitarian donor, Azerbaijan has the financial resources required for self-reliance
programming for IDPs in urban areas. The main constraining factor is the lack of political support. The state
prioritises the return of IDPs to their place of origin and considers that any efforts that facilitate their local
integration, especially on self-reliance, work against that priority.
Scale and duration 622,892 IDPs, most of whom have been displaced for 25 years
Settlement options available Return
Unlikely as place of origin is occupied by Armenia and peace
negotiations have not progressed for years.
Settlement elsewhere in the country
The state has been settling IDPs in new purpose-built
settlements for many years.
Local integration
The state tolerates the presence of IDPs in urban areas, but
does not facilitate their local integration.
Combination
Some IDP families in urban areas are combining local
integration with settlement elsewhere, using residences at
both locations.
Most Constraining Most Conducive
Hopeful Provider, Score: 33
Protracted displacement: Uncertain paths to self-reliance in exile – Annexes | 72

Environment for successful self-reliance programming for urban IDPs in COLOMBIA
The state is highly supportive of improving the self-reliance of IDPs. Colombia is an unprecedented example
of external actors supporting a strong state in its efforts to protect and assist IDPs, including some
collaboration between humanitarian and development organisations. However, most IDPs in urban areas
took refuge in informal settlements where they have poor access to services and are at risk of further
displacement due to eviction or urban violence. They find it difficult to insert themselves into local markets
because of stigma against IDPs and a lack of valuable skills and education. Self-reliance for urban IDPs is
possible and appropriate given the duration of stay in these areas and because most IDPs do not wish to
return to their place of origin.
Scale and duration 5,700,000 IDPs have been displaced over the last 50 years
Settlement options available Return
Unlikely as place of origin is often insecure, IDPs fear being
displaced again after return and new families created in
displacement generally do not wish to return. The 2011 law
establishing the land restitution process is facilitating the
return process.
Settlement elsewhere in the country
The state has settled IDPs in uninhabited areas.
Local integration
The state tolerates the presence of IDPs in urban areas, and in
some cases facilitates their local integration.
Combination
Some IDPs who have been settled elsewhere or who have
returned periodically go back to their area of displacement to
access services, social contacts and markets.
Most Constraining Most Conducive
Partner in Prosperity, Score: 40
Protracted displacement: Uncertain paths to self-reliance in exile – Annexes | 73

Environment for successful self-reliance programming for IDPs in North Kivu in the DEMOCRATIC
REPUBLIC OF CONGO
The DRC is characterised by poverty, weak governance and poor rule of law. Multiple waves of
displacement have eroded IDPs’ assets, increased their vulnerability and made them highly reliant on
personal contacts and networks made over the course of displacement. External actors struggle to address
acute humanitarian needs along with the long-term development needs of IDPs, especially in urban areas.
While the state has signed several regional legal instruments for the protection and assistance of IDPs, the
authorities lack the capacity and resources for self-reliance programming and prefer that IDPs return to
their place of origin, thereby making long-term livelihoods initiatives unnecessary.
Scale and duration 863,000 IDPs in North Kivu, many of whom have been
displaced more than once in the past 20 years
Settlement options Return
The state prefers the return of IDPs. IDPs report access to land,
property and employment is easier in place of origin than place
of refuge. However, for many their land and property has been
occupied or destroyed, complicating their return. Insecurity in
the place of origin and fear of renewed displacement also
prevent some IDPs from returning.
Settlement elsewhere in the country
The state is generally tolerant towards the integration of IDPs
throughout the country, though the official position has not
been indicated.
Local integration
The state is mostly tolerant of the integration of IDPs at their
place of refuge, but would prefer they return.
Combination
Some IDPs move daily or weekly to check on their belongings
and to cultivate their land in their place of origin, and also to
neighboring towns to find daily work.
Most Constraining Most Conducive
Precarious Provider, Score: 23
Protracted displacement: Uncertain paths to self-reliance in exile – Annexes | 74

Environment for successful self-reliance programming for IDPs displaced in 2006–2008 in IRAQ
The upsurge in conflict, violence, human rights violations and displacement, as well as ongoing religious
tension, renders self-reliance for IDPs a low political priority at the national level, while municipalities can
be more sympathetic to IDPs of a similar ethno-religious profile. The sectarian divide runs deep as the state
is increasingly representative of only the Shiite majority, Sunnis have been disenfranchised and mixed
neighbourhoods are now largely single-sect. The state supports IDP livelihoods and self-reliance, including
initiatives by international actors, and these actors have leverage with the state. However, they exert little
pressure or have been ineffective in persuading the state to resolve internal displacement. As most IDPs
intend to integrate in their place of refuge, and cite access to work as their most pressing need, self-
reliance programming is appropriate in these areas. Special thought in design and implementation is
necessary to ensure sustainability given sectarian divisions and the weak economy.
Scale and duration 1.1 million IDPs, most of whom have been displaced for eight
years
Settlement options Return
The state prioritises return of IDPs and provides financial
incentives to encourage returnee families to deregister as IDPs.
The longer IDPs are displaced the less likely they are to state
an intention to return. Barriers include insecurity, poor relations
with communities of origin, lack of access to property,
damaged homes and lack of employment.
Settlement elsewhere in the country
Tension and competition over land at all levels of governance
complicate the search for areas IDPs could be settled.
Residency can be restricted by administrative rules and
practices.
Local integration
In 2012, the vast majority of IDPs intended to integrate at their
current residence. Fifty per cent of registered IDPs live in
informal settlements with limited access to services and are at
risk of eviction.
Most Constraining Most Conducive
Precarious Provider, Score: 28
Protracted displacement: Uncertain paths to self-reliance in exile – Annexes | 75

Environment for successful self-reliance programming for IDPs in Darfur in SUDAN
The state has voiced its commitment to resolving displacement in Darfur and has adopted a national IDP
policy that sets out a number of rights related to livelihoods. However, the state has done little for IDPs and
has sometimes been counter-productive, though some authorities have supported IDP livelihoods
programming. Violence between government forces and armed groups continues and the conflict and
associated displacement have led to increased competition for resources and livelihoods. Successful self-
reliance programming requires due diligence on land rights, vocational adjustments and assistance to
recover from injuries and violations. Sustainability requires addressing insecurity, sometimes at the hand of
government forces, which limits IDPs’ freedom of movement and access to markets. In general, tense
relations persist between the state and the international community, especially Western countries. Some
Middle Eastern donor countries have more leverage. Donor fatigue has set in as Darfur has been
overshadowed by crises elsewhere.
Scale and duration 3,400,000 IDPs in Sudan, around 2,500,000 of whom have been
displaced in Darfur for up to 11 years
Settlement options Return
The state prioritises return of IDPs. Forced return as well as
secondary occupation and destruction of homes and crops
reported. Armed groups have an interest in preventing returns
and keeping the number of IDPs high to attract international
attention to the situation.
Settlement elsewhere in the country
There is no information on the state’s position on this
settlement option, or on IDPs’ preference for it.
Local integration
The state is not fully tolerant of integration of IDPs at their
place of refuge. Young IDPs would prefer to stay in the urban
areas where they have grown up.
Combination
Some IDPs divide their time between their places of refuge and
origin in order to cultivate and keep control of their land,
supplement their income and maintain relations with their
communities.
Most Constraining Most Conducive
Precarious Provider, Score: 20
Protracted displacement: Uncertain paths to self-reliance in exile – Annexes | 76

Environment for successful self-reliance programming for IDPs in South Central Somalia and
Puntland in SOMALIA
Despite a new government being established in 2012 and the eradication of armed militias from some
areas, governance is weak and there is potential for further instability. The state ratified a regional
instrument on IDP protection in 2011 and adopted an IDP policy in 2014. Local authorities have undermined
these steps by violating IDPs’ rights. Constraints to self-reliance include gatekeeping, insecurity, forced
relocations to remote areas, lack of appropriate clan affiliations, low level of education and skills and food
insecurity. International actors are attempting to meet humanitarian needs and improve self-reliance,
though a funding shortfall remains and access to areas in need is limited by insecurity and deliberate
obstruction.
Scale and duration
1,100,000 IDPs, most displaced for some 20 years
Settlement options
Return
The state prioritises return of IDPs to their place of origin.
Improvements in the security situation in some areas have led
to increased interest in return.
Settlement elsewhere in the country
The state does not oppose settlement elsewhere, though this
choice depends on living conditions, security and clan
affiliations in that area.
Local integration
Authorities have supported the local integration projects of
international agencies.
Most Constraining Most Conducive
Precarious Provider, Score: 16
Protracted displacement: Uncertain paths to self-reliance in exile – Annexes | 77

Environment for successful self-reliance programming for Sudanese in CHAD
Chad scores highly in terms of the government’s tolerant or positive attitude to achieving self-reliance for
the displaced, the rights they are accorded and the large degree of leverage external actors have to
encourage and support government policies that encourage self-reliance. Its low score derives from the
fact that displaced populations are largely in remote and destitute areas where the local population
frequently exhibits alarming rates of malnutrition, and there levels of insecurity are a concern.
Scale and duration 368,290 refugees, many displaced since 2003
Settlement options
Return
Return is unlikely as country/place of origin is still unstable and
communal clashes in Darfur are frequent.
Resettlement
Resettlement appears to be the only viable solution, but few
resettlement places are open to refugees.
Integration
Local integration is unlikely given the limited capacity of the
host country.
Most Constraining Most Conducive
Social Protection Priorities, Score 20
Protracted displacement: Uncertain paths to self-reliance in exile – Annexes | 78

Environment for successful self-reliance programming for Afghans in IRAN
Iran has the potential to be a far more enabling place for self-reliance approaches. It scores highly on
access to markets and the resources and capacities of the displaced. This is because the vast majority of
Afghans live in urban areas and are largely integrated into Iranian society through cultural and language
similarities. Transnational networks have existed for more than 30 years, making it easier for Afghans to
find support. However, Iran scores poorly on external engagement, and low scores on legal frameworks and
protection pull it into the Social Protection Priorities category. While the Iranian government already plays a
large role in the refugee response there is very limited scope for external actors to support progressive
policies, particularly as some of the largest threats to refugee livelihoods are related to human rights, a
highly sensitive issue. The government is increasingly focused on return and on limiting de facto
integration. This makes it difficult to resolve restrictions relating to movement, education, access to
professional employment and property.
Scale and duration 950,000 refugees, most of whom have been displaced for ten
years
Settlement options
Return
Return is unlikely as country/place of origin is still unstable.
Living conditions in Afghanistan are dire and many refugees in
Iran have never been to their home country.
Resettlement
Few resettlement places are open to these refugees.
Integration
Local integration has been ruled out by the host state.
Most Constraining Most Conducive
Social Protection Priorities, Score 21
Protracted displacement: Uncertain paths to self-reliance in exile – Annexes | 79

Environment for successful self-reliance programming for Iraqi refugees in JORDAN
The situation of Iraqi refugees in Jordan scores well in respect to access to markets, through Iraqis’
location in urban centres with large and dynamic informal sectors and sophisticated formal markets, and
their moderate integration through existing connections and language. It scores low to medium in respect
of the capacities of the displaced and legal frameworks and protection; although Jordan provides a
relatively safe and stable environment, Iraqis suffer due the limitations imposed by the irregular status of
many refugees and limitations placed on women’s mobility and employment. The most constraining factor,
however, revolves around the environment for external intervention, with a very restrictive attitude on the
part of the government towards livelihoods work with Iraqis.
Scale and Duration: 57,140 ‘refugees’ (21,920 registered with UNHCR), most of
whom have been displaced for nine years.
Settlement options
Return
While some Iraqi refugees are attempting to return many find it
unsustainable.
Resettlement
This group continues to benefit from resettlement, though on a
much smaller scale than previously, and this will not be the
solution for the majority.
Integration
Local integration has been ruled out by the host state.
Most Constraining Most Conducive
Precarious Provider, Score 22
Protracted displacement: Uncertain paths to self-reliance in exile – Annexes | 80

Environment for successful self-reliance programming for urban refugees in KENYA
Kenya’s urban refugees present a complex picture. On the one hand the Kenyan government is engaged in
refugee issues, while on the other wavering between tolerance of urban refugees and harsh crackdowns,
particularly on Somalis following a spate of terrorists attacks for which the Somali community has been
blamed. Many refugees in Nairobi are already achieving self-reliance, but many others lack crucial support
to achieve this. While there is promising research and programming in Nairobi it is small-scale and
overshadowed by the care and maintenance camps in northern Kenya.
Scale and duration 56,000 asylum-seekers and refugees were registered with
UNHCR in Nairobi and other urban centres in Kenya, the
majority from Somalia, Ethiopia and DRC.
Settlement options
Return
For refugees from Somalia, Ethiopia and DRC sustainable
return is highly unlikely as insecurity remains high in Somalia
and in eastern DRC, and many Ethiopians still fear political
persecution if they return.
Resettlement
Few resettlement places are open to these refugees.
Integration
Local integration has been ruled out by the host state.
Most Constraining Most Conducive
Precarious Provider, Score 25
Protracted displacement: Uncertain paths to self-reliance in exile – Annexes | 81

Environment for successful self-reliance programming for Afghans in PAKISTAN
Self-reliance programming for Afghans in Pakistan faces a range of obstacles, with low to medium scores
in all categories. While most Afghans have access to public services and many are, after long spells in
protracted displacement, integrated into local economies, with some well established in transport and other
sectors, a self-reliance agenda faces serious obstacles in the persistent security threats that confront many
residents of north-west Pakistan, the government’s reluctance to support livelihoods work, mobility
restrictions for women and a response from the international community that largely does not push for
more developmental policies to be applied to this group.
Scale and duration Almost 1.5 million registered Afghan refugees. Length of
displacement varies with some refugees displaced prior to the
US invasion in 2001, and many displaced (or re-displaced)
since then.
Settlement options
Return
Return is unlikely as country/place of origin is still unstable and
a large portion of Afghan refugees have never seen
Afghanistan.
Resettlement
Few resettlement places are open to these refugees.
Integration
Local integration has been ruled out by the host state.
Most Constraining Most Conducive
Precarious Provider, Score 25
Protracted displacement: Uncertain paths to self-reliance in exile – Annexes | 82

Environment for successful self-reliance programming for Congolese refugees in UGANDA
Uganda scores highly in respect to its legal and protection environment (which accords refugees a range of
important economic rights), refugees’ access to markets and economic integration (through attempts to
integrate rather than isolate the Settlements), and the environment for external intervention (with a
promising dialogue and coordination between domestic and external actors to promote refugee self-
reliance). Given language difficulties and the shorter duration of their displacement, Congolese refugees are
in some respects less conducive to a self-reliance. If applied to the South Sudanese or Somali case load, a
higher score may have been achieved.
Scale and duration 226,880 refugees, many of whom have been
displaced since 2010
Settlement options
Return
While Eastern DRC has seen modest improvements, it remains
highly volatile.
Resettlement
Few resettlement places are open to these refugees.
Integration
While the government is not strongly opposed to de facto
integration, de jure integration has been ruled out.
Most Constraining Most Conducive
Hopeful Provider, Score 39
Protracted displacement: Uncertain paths to self-reliance in exile – Annexes | 83

References
Azerbaijan
• Brookings-LSE, 2011, Can you be an IDP for twenty years?
• World Bank, 2011, Building Assets and Promoting Self-Reliance: The Livelihoods of Internally
Displaced Persons
• UNHCR, 2013, Participatory Assessment with IDPs in Azerbaijan (unpublished)
• UN Human Rights Committee, 13 August 2009, Concluding Observations
• IDMC missions
• HRW, 5 December 2014, “Azerbaijan: Investigative Journalist Arrested”
• Council of Europe, 2012, “The honouring of obligations and commitments by Azerbaijan”, Doc 13084
• UN Human Rights Committee, 13 August 2009, Concluding Observations
• UN Representative of the Secretary General on the Human Rights of IDPs, 23 December 2010,
A/HRC/16/43/Add.2
• World Bank, October 2014, Azerbaijan IDP Living Standards and Livelihoods Project
• State Committee on Refugees and IDPs of Azerbaijan, 15 December 2014, “Issues of mutual interest”
Colombia
• Cohen, 2008, Listening to the voices of the displaced : Lessons Learned
• Albuja & Ceballos, 2010, Urban displacement and migration in Colombia. Forced Migration Review
• Brookings LSE- Project on internal displacement, December 2014, Changing times: the international
response to internal displacement in Colombia
• Arias, A. V., 2012. From rural Colombia to urban alienation,
• Forced Migration Review, (40), 12–13
DRC
• World Vision & al., October 2014, Assessing the humanitarian response to chronic crisis in North Kivu
• NRC, November 2014, Living Conditions of Displaced Persons and host communities in Urban Goma,
DRC
• Brookings-LSE Project on Internal Displacement, December 2014. Now what? The international
response to internal displacement in the Democratic Republic of the Congo
Iraq
• http://www.brookings.edu/research/articles/2013/03/18-iraq-displaced-ferris
• http://iomiraq.net/file/167/download?token=kPJJCfnx
• http://www.al-monitor.com/pulse/originals/2014/11/iraq-sunnis-representation-government-islamic-
state.html
Protracted displacement: Uncertain paths to self-reliance in exile – Annexes | 84

Sudan
• Lind et al., 2012. Programming for secure livelihoods amid uncertainty: trends and directions in
livelihoods, nutrition and food security in Darfur.
http://www.fao.org/fileadmin/user_upload/emergencies/docs/Darfur_Livelihoods_Study_2012.pdf
• Young, Jacobsen, (2013) No Way Back? Adaptation and Urbanization of IDP Livelihoods in the Darfur
Region of Sudan.. Development and Change V.44, Iss. 1,
Somalia
• Samuel Hall and ILO, Market Opportunity Mapping in Somalia - A value chain analysis and rapid
market assessment in Baidoa and Beletweyne Provinces, October 2014
http://samuelhall.org/REPORTS/ILO%20Market%20Opportunity%20Mapping%20in%20Somalia.pdf
Chad
• UNHCR country operations profile 2015
• The Magazine of the International Red Cross and Red Crescent Movement. 2005. Darfur’s refugees in
Chad. Retrieved from: http://www.redcross.int/EN/mag/magazine2005_2/22-23.html
• US Department of State. 2012. 2012 Investment Climate Statement – Chad. Retrieved from:
http://www.state.gov/e/eb/rls/othr/ics/2012/191126.htm
• Geneva academy of international humanitarian law and human rights. 2008.
• Rule of Law in Armed Conflicts Project: Chad. Retrieved from: http://www.geneva-
academy.ch/RULAC/current_conflict.php?id_state=215
Iran
• IRIN. 2008. AFGHANISTAN-IRAN: Iran says it will deport over one million Afghans. Retrieved from:
http://www.irinnews.org/report/77107/afghanistan-iran-iran-says-it-will-deport-over-one-million-
afghans
• Human Rights Watch. 2013. Unwelcome Guests: Iran’s Violation of Afghan Refugee and Migrant
Rights. Retrieved from: http://www.hrw.org/sites/default/files/reports/iran1113_forUpload_0.pdf
• Newsweek. 2014. Photos: The Life of Afghan Refugees in Tehran. Retrieved from:
http://www.newsweek.com/photos-life-afghan-refugees-tehran-282794
• Human Rights Watch. 2013. Iran: Fleeing Afghans Face Abuse. Retrieved from:
http://mm.hrw.org/content/iran-fleeing-afghans-face-abuse
• ILO-UNHCR. 2008. Co-operation Towards Comprehensive Solutions for Afghan Displacement:
Research Study on Afghan Deportees from Iran.
• AREU. 2009. Afghan Transnational Networks: Looking Beyond Repatriation. Retrieved from:
http://www.areu.org.af/Uploads/EditionPdfs/627E-
Looking%20Beyond%20Repatriation%20SP%20web.pdf
• UNHCR. States Parties to the 1951 Convention relating to the Status of Refugees and the 1967 Protocol
Retrieved from: http://www.unhcr.org/3b73b0d63.html
Protracted displacement: Uncertain paths to self-reliance in exile – Annexes | 85

• Tolo News. 2012. Violence Against Afghans in Iran's Yazd City After Teenager's Death. Retirieved
from: http://tolonews.com/en/afghanistan/6686-violence-against-afghans-in-irans-yazd-city-after-
teenagers-death
• Nordland, R. 2013. Afghan Migrants in Iran Face Painful Contradictions but Keep Coming. The New
York Times. Retrieved from: http://www.nytimes.com/2013/11/21/world/asia/for-afghan-refugees-in-
iran-painful-contradictions.html?_r=0
• UNHCR. 2015. 2015 UNHCR country operations profile - Islamic Republic of Iran. Retrieved from:
http://www.unhcr.org/pages/49e486f96.html
Jordan
• Chatelard, G, with El-Abed, O and Washington, K (2009). Protection, mobility and livelihood
challenges of displaced Iraqis in urban settings in Jordan. International Catholic Migration Commission.
http://reliefweb.int/sites/reliefweb.int/files/resources/751268C72BA0BCD0492575EE0018E0D8-
Full_Report.pdf
• NEF/WRC. 2014. Enhancing the Economic Resilience of Displaced Iraqis and Poor Jordanians.
Economic Assessment: Opportunities and constraints for vulnerable women and youth in Zarqa,
Jordan. Summary. March 2014
• Pavanello, S with Haysom, S. 2012. Urban displacement and vulnerability in Amman. HPG Working
Paper. ODI: London
• UNHCR 2015 Jordan Profile
• Human Rights Watch: Jordan Profile. http://www.hrw.org/middle-eastn-africa/jordan
• REACH. 2014. Livelihoods, Employment and Tensions in Jordanian Communities Hosting Syrian
Refugees. Thematic Assessment Report. June 2014 http://reliefweb.int/report/jordan/livelihoods-
employment-and-tensions-jordanian-communities-hosting-syrian-refugees
• CIA World Fact Book –Jordan;
Kenya
• Danish Refugee Council. (2012). Living on the Edge: A Livelihood Status Report on Urban Refugees
Living in Nairobi, Kenya. 31 May 2012;
• Pavanello, Sara, Samir Elhawary and Sara Pantuliano. 2010. Hidden and exposed: Urban refugees in
Nairobi, Kenya. HPG Working Paper. ODI. London. http://www.odi.org/publications/4786-urban-
refugees-nairobi-kenya (1;2).
• UNHCR (2014) Kenya: UNHCR disturbed by arrests and deportations of Somali refugees. UNHCR
Press Releases, 17 April 2014
• Kiama, L and Karanja, R (2012) Asylum space in Kenya: evolution of refugee protection over 20 years.
Forced Migration Review. http://www.fmreview.org/25th-anniversary/kiama-
karanja#sthash.FrZIC9aC.dpuf
Protracted displacement: Uncertain paths to self-reliance in exile – Annexes | 86

Pakistan
• Grare, F., Maley, W. 2011. The Afghan Refugees in Pakistan. Middle East Institute, Fondation pour la
Recherche Stratégique.
• Pakistan: Foreigners Act, 1946. Retrieved from: http://www.unodc.org/res/cld/document/foreigners-act--
1946_html/Foreigners_Act.pdf
• USCRI. 2009. World Refugee Survey 2009: Pakistan. Retrieved from:
http://www.refugees.org/resources/uscri_reports/archived-world-refugee-surveys/2009-wrs-country-
updates/pakistan.html
• USAID. 2008. Pakistan Rule of Law Assessment. Final Report. Retrieved from:
http://pdf.usaid.gov/pdf_docs/PNADO130.pdf
• United States Institute for Peace. 2014. Mapping Conflict Trends in Pakistan. Retrieved from:
http://www.usip.org/publications/mapping-conflict-trends-in-pakistan
• OSAC. 2013. Pakistan 2013 Crime and Safety Report: Lahore. Retrieved from:
https://www.osac.gov/pages/ContentReportDetails.aspx?cid=13757
• UNHCR. 2015. 2015 UNHCR country operations profile – Pakistan. Retrieved from:
http://www.unhcr.org/pages/49e487016.html
• Bhutta, Z. 2013. New policy to guide Afghan repatriation till 2015. Tribune. Retrieved from:
http://tribune.com.pk/story/586277/new-policy-to-guide-afghan-repatriation-till-2015/
• European Resettlement Network. 2012. Afghan Refugees in Iran and Pakistan. Retrieved from:
http://www.resettlement.eu/page/afghan-refugees-iran-pakistan-0
• Koser, K., Van Hear, N. 2002. Asylum migration: implications for countries of origin. paper presented
at the WIDER Conference on Poverty, International Migration and Asylum, Helsinki, 27–28 September
2002.
• Netherlands Interdisciplinary Demographic Institute (NIDI). 2002. A profile of Afghan refugees in
Pakistan and their intentions to return: results of a rapid survey conducted between February and May
2002 for UNHCR.
• Norwegian Afghanistan Committee. Languages. Retrieved from:
http://www.afghanistan.no/English/Afghanistan/Languages/index.html
• Khan, M.A. 2014. Pakistan’s national refugee policy. FMR 46. Retrieved from:
http://www.fmreview.org/en/afghanistan/khan.pdf
• Tennant, V. 2008. Afghan Situation Regional Policy Review. UNHCR Internal Document.
PDES/2008/02 quoted in Long, K. 2008. Extending protection? Labour migration and durable solutions
for refugees. Refugee Studies Centre, University of Oxford.
• IQRA University Islamabad. 2013. Livelihoods of Afghan Refugees: The influencer of Social and
Human Capitals.
• Aga Khan Development Center. 2012. PR: First MicroFinance Bank Pakistan and JICA Sign Agreement
to Expand Access to Finance in Pakistan. Retrieved from: http://www.akdn.org/Content/1124
• UNHCR. 2015. 2015 UNHCR country operations profile – Pakistan. Retrieved from:
http://www.unhcr.org/pages/49e487016.html
Protracted displacement: Uncertain paths to self-reliance in exile – Annexes | 87

Uganda
• Refugee Law Project (2006) “Critique of the Refugees Act”, Refugee Law Project, Kampala. 2. UNHCR
Uganda Country Profile, 2014a, http://www.unhcr.org/pages/49e483c06.html.
• Buscher, Dale. 2011. The Living Ain’t Easy. Urban Refugees in Kampala. Women’s Refugee
Commission. http://womensrefugeecommission.org/programs/livelihoods/research-and-resources/701-
the-living-aint-easy-urban-refugees-in-kampala
• Omata, Naohiko and Kaplan, Josiah. 2014. Refugee livelihoods in Kampala, Nakivale, and Kyangwali:
Patterns of engagement with the private sector. Working Paper Series 95. Refugee Studies Centre:
Oxford.
• Betts, A. (2012a) Self-reliance for refugees: a view from Kyangwali settlement, Humanitarian Innovation
Project. Available at http://www.humanitarianinnovation.com/blog.html
• HRW: Uganda, 2015. http://www.hrw.org/africa/uganda
• UNHCR/Oxford Humanitarian Innovation Project (HIP) Joint Rwamwanja Livelihood Study (DRAFT),
2015.
• UNHCR (2014b) Uganda Joint Assessment Mission. Government of Uganda, Office of the Prime
Minister, Refugee Department, United Nations High Commission for Refugees, World Food Program.
October 2014
• JICA-UNHCR (2014) JICA-UNHCR Joint Projects; WFP (2011) WFP 2008 –2013 Purchase for
Progress (P4P) Initiative: A Strategic Evaluation (mid- term). Report number OE/2011/002. WFP:
Rome.
Protracted displacement: Uncertain paths to self-reliance in exile – Annexes | 88

Annex 7: Protracted Displacement - Terms of Reference How can policy frameworks, institutional arrangements and international and government assistance be
adjusted to improve livelihoods and enable greater self-reliance for people who are forcibly displaced for more
than 3 years?
Background
The majority of the world’s refugees and IDPs now live in situations of protracted exile where there is little or no
prospect of achieving a durable solution.40 This state of long-standing limbo has significant impact on peoples’
human, economic, social and cultural rights. However, there is no single experience of protracted displacement.
Displaced populations are sometimes confined to designated camps (predominantly in rural areas), but are also
integrated into host communities (often in more urban areas), where they can be invisible to service providers.
Indeed most displaced are today in urban settings. The policy framework and institutional arrangements set by
host countries and the international community is an important determinant of where displaced people reside
and the scope of opportunities that are available.
A significant proportion of refugees and IDPs living in protracted displacement are situated in developing
countries, with many of the displaced hosted in fragile and conflict affected states. In August 2011, the largest
protracted refugee situations (in terms of numbers) were reported in: Pakistan which hosted 1.8 million Afghans,
and Kenya which hosted around 400,000 Somalis41 (while in Somalia itself, more than 1.4 million people are
internally displaced). There are currently more than 2 million Syrian refugees hosted in neighbouring countries,
while more than 6million are estimated to be internally displaced in Syria. Similarly, a large proportion of
protracted IDP situations are located in fragile states. In Afghanistan there are estimated to be more than
660,000 IDPs, while in DRC there are estimated to be at least 2.6 million IDPs42. There are also large displaced
populations in Middle Income Countries: Columbia hosted at least 3.6 million protracted IDPs43.
In situations of protracted displacement, responses need to go beyond humanitarian assistance to address longer-
term issues around land, housing and productive assets restitution, service delivery, livelihoods, self-reliance,
voice and social cohesion – pending a durable solution. However there is typically disconnect between the
policies and institutional settings established for refugees during the initial emergency period and those required
to address protracted displacement. Moreover, a transition out of dependence on humanitarian support to
longer term development approaches is frequently impeded by political obstacles. These may take the form of
host country governments’ insistence on maintaining parallel systems (humanitarian aid for refugees,
development assistance for national citizens), of excluding refugees from social and economic opportunities, of
bilateral cooperation agreements that focus development aid on host country nationals, or even the absence of
40 Zetter, R. 2011. “Unlocking the Protracted Displacement of Refugees and Internally Displaced Persons: An Overview”. Refugee Survey Quarterly, 30 (4). 41 Long, K. 2011. “Permanent crises? Unlocking the protracted displacement of refugees and internally displaced persons.” Oxford: Refugees Study Centre. Available at: http://www.internal-displacement.org/8025708F004BE3B1/(httpInfoFiles)/9C65376E1F9DBAAEC125793D003ADC24/$file/unlocking-protracted-displacement-policy-overview.pdf [Last accessed 17 February 2014]. 42 http://www.internal-displacement.org/global-figures 43 IDMC/Brookings (2011) ‘IDPs in protracted displacement: Is local integration a solution?’ Report from the Second Expert Seminar on Protracted Internal Displacement, Geneva:www.internal-displacement.org.
Protracted displacement: Uncertain paths to self-reliance in exile – Annexes | 89

development assistance programmes in Middle Income Countries where refugees are present. The same may
apply to many IDPs who may be seen as ‘enemies of the state’. Protracted displacement therefore presents a
significant challenge for host countries and the international community as well as national governments and its
ability to address the interface between short-term humanitarian assistance and longer-term development
opportunities.
Developing a definition and typology of protracted displacement
The definition of protracted displacement has evolved and been redefined in line with the growing international
commitment to understanding the scope and scale of protracted displacement. In 2009, the UNHCR Executive
Committee Conclusion provided a refined definition for Protracted Refugee Situations (PRS) as situations where
refugees have been in exile “for 5 years or more after their initial displacement, without immediate prospects for
implementation of durable solutions.”44
Using this UNHCR definition, by 2012, almost 7.1 million people had been living in exile for five years or more
– accounting for almost 75% of the refugee population under UNHCR’s mandate45. Milner and Loescher
identified 30 major PRS globally and found that the average length of displacement in these situations was
almost 20 years in 2011, compared to 9 years in the early 1990s46. However, these estimates and definition
remain somewhat limited, excluding: those displaced for less than 5 years; PRS in urban settings or smaller
residual displaced populations; Palestinian refugees under the mandate of UNRWA; nor any of the millions of
IDPs worldwide.
By the end of 2013, there was an estimated 33.3 million IDPs displaced by conflict and violence, marking a
significant increase of 4.5 million from the previous year. 63% of the global figure came from just five countries:
Syria, Colombia, Nigeria, Democratic Republic of Congo (DRC) and Sudan47. These figures highlight both the
scale of new crises and IDPs situations such as Syria, as well as the protracted nature of conflict and
displacement in places such as DRC where the turmoil dates back to the 1990s.
IDMC defines internal displacement as a situation in which “persons or groups of persons […]have been forced
or obliged to flee or to leave their homes or places of habitual residence, in particular as a result of or in order to
avoid the effects of armed conflict, situations of generalised violence, violations of human rights or natural or
human-made disasters, and who have not crossed an internationally recognised state border.”48
For the purpose of this study, protracted displacement is defined more broadly as a situation in which refugees
and/or IDPs have been in prolonged exile for 3 years or more, and where the process for finding durable
solutions, such as repatriation, absorption in host communities, or resettlement in third countries, has stalled.
This definition includes refugee and IDP populations forced to leave their homes to avoid armed conflict,
44 UNHCR, ExCom. 2009. “Conclusion on Protracted Refugee Situations”, No. 109, LXI. 45 UNHCR. 2012. “Finding Durable Solutions”. UNHCR Global report 2012. Available at: http://www.unhcr.org/51b1d61d0.html 46 Milner and Loescher. 2011. “Responding to protracted refugee situations: Lessons from a decade of discussion”. Forced Migration Policy Briefing 6. Oxford: Refugee Studies Centre. 47 IDMC. 2014. Global Overview 2014: People internally displaced by conflict and violence. IDMC, NRC: Geneva. 48 Guiding Principles on Internal Displacement, U.N. Doc. E/CN.4/1998/53/Add.2 (1998), noted in Comm. Hum. Rts. res. 1998/50.
Protracted displacement: Uncertain paths to self-reliance in exile – Annexes | 90

violence, violations of human rights or natural or human-made disasters. It also includes those living in camp
settings or dispersed among host populations.
International response and evidence-base
In 2009, the UNHCR Executive Committee Conclusion highlighted the scale of the problem of PRS and called
for an urgent international response. The Conclusion emphasised the short-comings of ‘care and maintenance’
model of assistance for long-term displaced populations. While assistance under this model has provided asylum,
protection and basic needs for millions of refugees, many refugees have remained in camps indefinitely often
with restrictions placed on their rights and ability to establish a livelihood. The Conclusion argued there was a
need for a fundamental shift towards approaches based on the promotion of livelihoods and self-reliance,
pending a durable solution49. While the locus of this analysis was in relation to refugees (UNHCR’s key
responsibility), the same could be said in relation to IDPs.
As UNHCR have highlighted elsewhere, “self-reliance is not in itself a durable solution but can be a precursor to
any of the three durable solutions. Even in situations where local integration does not appear to be a viable
solution for a refugee population, self-reliance should be vigorously pursued as it…facilitates sustainable
reintegration.”50 Similarly, Milner and Loescher highlight that an increased focus on self-reliance and
livelihoods can improve short-medium term conditions and take place in parallel to work to reinforce durable
solutions51.
However, evaluations and evidence on the effectiveness of interventions to promote livelihoods, self-reliance and
social cohesion (pending a durable solution) remain limited. Humanitarian interventions are largely based on
annual budgets and designed to maintain populations above emergency thresholds; at the same time
developmental actors have only limited engagement with these populations. There is some evidence that the
space in which interventions can promote livelihoods, self-reliance and social cohesion is largely shaped by the
institutional framework set by the host country52. Within East Africa for example, the Uganda government
allows refugees to undertake employment and other economic activities, whereas in Kenya refugees are largely
constrained to camp settings and are not permitted to work.
Much of the literature on protracted displacement has focused on refugees in camp settings, rather than IDPs
and those dispersed in host communities. In addition, the literature has tended to focus on the political
challenges to durable solutions rather than how to overcome programmatic, policy and political challenges and
utilise opportunities for promoting livelihoods, self-reliance and social cohesion.
49 Guiding Principles on Internal Displacement, U.N. Doc. E/CN.4/1998/53/Add.2 (1998), noted in Comm. Hum. Rts. res. 1998/50. 50 UNHCR. 2005. “Local Integration and Self-Reliance”, 2 June 2005, EC/55/SC/CRP.15. Available at: http://www.refworld.org/docid/478b3ce12.html [accessed 28 January 2014] 51 Milner and Loescher. 2011. “Responding to protracted refugee situations: Lessons from a decade of discussion”. Forced Migration Policy Briefing 6. Oxford: Refugee Studies Centre. 52 Betts, A., (2013), Survival Migration: Failed Governance and the Crisis of Displacement, Cornell University Press.
Protracted displacement: Uncertain paths to self-reliance in exile – Annexes | 91

Where evidence is available it is generally small-scale, isolated, qualitative evaluations. There are a limited
number of evaluations that focus specifically on self-sufficiency as an outcome of aid.53 One useful example
includes a joint UNHCR-WFP impact evaluation on food assistance, which has tested the intervention logic for
programmes contributing to the attainment of durable solutions and self-reliance. It found that a shift from care
and maintenance to self-reliance had not occurred due to a combination of external factors including donor
funding policies, and factors within the control of the organisations. The impact evaluation highlights that WFP
and UNHCR did not use or create opportunities to find durable solutions, tended to reinforce contextual
barriers, and continued to conform to a care and maintenance model.
Research on protracted exile led by the Refugees Study Centre in partnership with the Norwegian Institute of
International Affairs and the Norwegian Refugee Council/Internal Displaced Monitoring Centre, suggests a
more multi-dimensional, experimental and innovative approach is needed to tackle the shifting and episodic
nature of protracted displacement54. Suggested examples of such flexible approaches towards greater self-
reliance (pending a durable solution) include developing more flexible legal regulation (temporary citizenship,
more flexible work permits, internal freedom of movement) and more innovative regional policies and tools. In
addition, Zetter calls for more people-centred approaches to protracted displacement that acknowledge and
build on the capacities, informal initiatives and strategies already employed by refugees and IDPs. Also
important will be to analyse the effectiveness of aid and financing and delivery models, and how they enable or
hinder integration and return to self-sufficiency.
Objective
In order for collaborations between humanitarian and development actors to promote impactful interventions
that support protracted displaced populations, policy-makers need better evidence on the typology, scale and
scope of protracted displacement and the effectiveness of interventions aimed at improving self-reliance and
psycho-social well-being.
The objectives of this study are to:
• map and analyse evidence on the scale and typology of protracted displacement globally;
• assess the impact of national policy frameworks, institutional arrangements and international assistance
to improve self-reliance and livelihoods in situations of protracted displacement;
• Identify innovative opportunities to promote people’s livelihoods and self-reliance (taking into account
the impact of psychosocial wellbeing on access to work and livelihoods). While it is important to note
that self-reliance is not a substitute for a durable solution, the main focus of this study will be how to
overcome programmatic and policy challenges and utilise opportunities pending a durable solution.
This study will aim to:
- Map and analyse the scale, dynamics and typology of protracted displacement. This will include: mapping
the scale, trends and dynamics of protracted displacement; analysing the scale and breakdown and structure
53 Mcloughlin, 2013. “Supporting self-sufficiency in situations of protracted population displacement”. (GSDRC Helpdesk Research Report no. 1028), Birmingham, UK: GSDRC, University of Birmingham. 54 Zetter, R. 2011. “Unlocking the Protracted Displacement of Refugees and Internally Displaced Persons: An Overview”. Refugee Survey Quarterly, 30 (4).
Protracted displacement: Uncertain paths to self-reliance in exile – Annexes | 92

of programmatic spend; and developing a comprehensive typology to capture the scope of protracted
displacement. Important components of a comprehensive typology to consider include:
o Single country or mutli-country (regional) displacement
o Trends and dynamics (active conflict, peace process underway, mixed population movements,
previous repatriation)
o Duration/longevity
o Population numbers
o Demography (structure, first, second, third generation etc)
o Ethnic, political or confessional complexity
o Socio-economic profile of displaced
o Locations (rural, urban, camps, settlements)
o Policy environment (restrictive, enabling, disabling on government, assistance side)
o Institutional arrangements (centralised, counterpart(s) within security domain (ie. Ministry of
Interior), political economy issues)
o Institutional capacities (assertive, weak, degree of external budget support). Security and
development implications
- Analysing the theory of change underpinning international interventions for populations who are displaced
for more than three years. Specifically: what are the interventions designed to achieve in terms of increasing
self-reliance and improving livelihoods versus care and maintenance approaches? What are the core
assumptions underpinning these interventions? How robust are these in practice? What evidence is there
that these interventions work in practice? How do host country policies and institutional arrangements
support or constrain interventions? This will include an exploration on how interventions
contribute/constrain food security, skills training, social protection and education - with a particular focus
on the graduation towards self-reliance and improved livelihoods. This should include and take into account
how psycho-social wellbeing impacts livelihoods and self-reliance outcomes. Effectiveness of international
assistance will be measured by: 1) success in meeting above-emergency thresholds, 2) the graduation of
protractedly displaced populations towards self-reliance and improved livelihoods, and 3) value for money.
The ToR has been developed in close collaboration with DFID, UNHCR and the World Bank’s Global
Programme on Forced Displacement (GPFD). Protracted Displacement has been identified as a significant
priority by all three actors, particularly given the scale of displacement in countries including Syria, South
Sudan, Somalia, Kenya, Mali, Ethiopia, DRC, Myanmar and Colombia, and the needs of host countries affected
by displacement including Jordan and Lebanon.
The study will be used to inform and contribute to: DFID’s practice, policy and advocacy position; the work of
other humanitarian and development actors (including UNHCR and GPFD); and the wider policy debate on
protracted displacement. It will do this by:
Protracted displacement: Uncertain paths to self-reliance in exile – Annexes | 93

- Providing the first comprehensive review of data on the scale, dynamics and typology of protracted
displacement and the impact of international assistance. The final study will appear in a peer-reviewed
journal and will provide an important evidence base for a range of humanitarian and development actors.
- Informing and shaping further research and innovative interventions. The study will identify key evidence
gaps and opportunities for innovation. Within DFID, it will help to inform the future direction of the
Humanitarian Innovation and Evidence Strategy and will be used by country offices and policy teams.
- Informing analysis of the cost-effectiveness of different international responses to protracted displacement.
- Influencing dialogue between key humanitarian and development partners. The study will identify the
strengths and constraints of humanitarian and development actors and identify examples and lessons
learned from strong and early collaboration.
Scope
The overarching research question for this study is: How can the impact of international and government
assistance be improved for people who are forcibly displaced for more than 3 years, with a particular emphasis
on whether and how such assistance can support livelihoods and enable greater self-reliance? The study should
also seek to address the following areas and sub-questions:
1. Scale, dynamics and typology of protracted displacement
- What evidence is there regarding the scale of protracted displacement globally? Over the last twenty
years, how many people (both IDPs and refugees) are displaced, how many years are they displaced for,
and are they in receipt of international assistance?
- Is there an upwards trending curve for number of people in situations of protracted displacement (and
does this differ between refugees and IDPs)? Is there an upward trending curve for average number of
years that refugees/IDPs remained displaced for?
- What are the various typologies of protracted displacement? How do humanitarian and development
needs differ between IDPs, refugees and the various typologies? (Please refer to p.4 and suggested
components of the typology to consider)
- Visualised data should be used here to illustrate the scale and trends of protracted displacement.
2. Programmatic spend
- Over the last twenty years, how much government and international humanitarian and development
assistance was spent per year on assistance to protracted refugees/IDP situations (both absolute and as a
percentage of humanitarian and development ODA)?
- What is the funding architecture for protracted displacement? How does this architecture
support/constrain government, humanitarian and development assistance?
- How is spend allocated between different countries and populations (e.g. refugees/IDPs,)? What is the
programmatic breakdown of this spend (how much is allocated to food, watsan, protection, livelihoods
etc)?
Protracted displacement: Uncertain paths to self-reliance in exile – Annexes | 94

- Over the last twenty years, how much did host governments contribute to displaced populations in their
care and what is the programmatic breakdown of this spend?55
- Visualised data should be used here to illustrate the scale and breakdown of programmatic spend. A
narrative should be provided documenting if/ where there are significant challenges in capturing this
data – what are the constraints in data collection?
3. Effectiveness of interventions to promote livelihoods and self-reliance
- What tested theories of change and systematic approaches have been used to define and measure the
effectiveness of humanitarian and developmental responses designed to support greater self-reliance of
populations who are displaced for long periods of time? Have innovative approaches to assistance to
protracted refugee/IDP situations been developed and tested? If so, what were the results? What were
the impacts on different social groups – women/men, refugee/IDP, camps/dispersed, rural/urban?
- What are the factors (both external and internal) that enable or constrain the transition from aid
dependency to self-reliance and strengthened livelihoods among refugees and IDPs in protracted
displacement? To what degree are these constraints the results of the external environment (violence,
legal framework); to what extent are they the result of the way in which international assistance is
currently organised? How do unmet mental health and psychosocial needs affect self-reliance and
livelihood outcomes? What role do host governments play in enabling or constraining the transition to
self-reliance, and what are their concerns?
- In what ways have interventions created or utilised opportunities to move from long-term care and
maintenance approaches towards approaches that effectively promote livelihoods, self-reliance and
social cohesion? To what extent have local factors and localised alternative strategies contributed
towards durable solutions (e.g. labour mobility, temporary migration, alternative forms of legal stay) –
even when existing political constraints remain?56
- What is the evidence base on value for money of care and maintenance approaches in situations of
protracted displacement? What is the evidence base regarding value for money of interventions designed
to support greater self-reliance?
- What evidence is there regarding the effectiveness of food security interventions for protracted
refugee/IDP situations?
- What evidence is there regarding the effectiveness of educational interventions both in the short term
and their long term effects on earning and social capacity?
4. Roles of and collaboration between humanitarian and development actors
- What have been the main roles/divisions of responsibility among different humanitarian and
development actors in responding to protracted displacement?
- What are the main strengths and constraints of these actors (e.g. what are their comparative
advantages)?
55 Lessons may be learned from the World Bank’s experience in Jordan: http://www.worldbank.org/projects/P132097/5m-displaced-people-jordan-lebanon?lang=en 56 Here it would be beneficial to refer to a recent GPFD funded study (implemented by the Danish Refugee Council) on livelihood programmes for displaced people.
Protracted displacement: Uncertain paths to self-reliance in exile – Annexes | 95
- What examples are there of strong and early collaboration between humanitarian and development
actors?
- What are the evidence gaps that could be addressed by DFID funded research?
- Based on the above analysis, the study should develop a theory of change relating to interventions that
support self-reliance of populations displaced for more than three years?57
Methodology
The literature review will provide an overview of the main evidence on protracted displacement. It will critically
appraise evidence from academic institutions as well as reports and policy documents from multilateral agencies
and NGOs. This will include the gathering and analysis of data on the scale and typology of protracted
displacement. Research teams will be expected to develop a structured approach to its search of the literature
and assess the relevance and quality of papers for the literature review. DFID strives to ensure that literature
reviews are as robust, objective and credible as possible and researchers should refer to the DFID Assessing the
Strength of Evidence How to Guide (enclosed) for full guidance. For a good example of a robust literature
review that meets these standards, please refer to Schreter, L.; Harmer, A. (2013) Delivering aid in highly
insecure environments. A critical review of the literature, 2007–2012. London: Humanitarian Outcomes Ltd.
Available at: http://r4d.dfid.gov.uk/pdf/outputs/Hum_Response/60995-
Delivering_aid_in_highly_insecure_environments_final_report.pdf
The case studies selected for the comparative analysis will be finalised during contract negotiations. We envisage
that four of the following case studies will be selected:
1. Rohingya refugees and IDPs (in Myanmar and Bangladesh)58
2. Protracted refugee situations in Ethiopia
3. Protracted refugee situations in Uganda
4. IDPs in Colombia
5. IDPs in DRC
6. IDPs in Afghanistan
7. Iraq IDPs and refugees
8. Palestinian refugees under the mandate of UNRWA
These case studies will be chosen to represent examples from both refugee and IDP situations, cover a broad
geographical remit and highlight differences in the typology of protracted displacement within each country. For
example, the Uganda case study is identified as a potential example of a more enabling government policy
environment where refugees are allowed to undertake employment and other economic activities. The analysis
will be particularly valuable in highlighting potential differences and similarities and identifying context-specific
barriers and opportunities to move from long-term care and maintenance approaches towards approaches that
effectively promote livelihoods and self-reliance. This will be a predominantly desk-based study and might also
57 Here it would also be beneficial to link up to the World Bank’s work on livelihoods and displacement. 58 Kiragu, E. et al. (2011). States of denial: A review of UNHCR’s response to the protracted situation of stateless Rohingya refugees in Bangladesh. Geneva: UNHCR. http://www.unhcr.org/4ee754c19.pdf
Protracted displacement: Uncertain paths to self-reliance in exile – Annexes | 96

include phone/skype-interviews with DFID, UNHCR and World Bank staff and partners where relevant and
other interviews with experts to identify literature sources.
While the literature review will make up the main body of report, the findings should draw on the detailed case
study analysis to provide more detailed examples. Gender analysis should be implemented throughout this study.
The final research output will appear in a peer reviewed journal.
Outputs
The final study should deliver the following outputs:
1. An analytical literature review and case-study analysis of approximately 30 pages (single spaced, size with
an executive summary, covering the topic areas outlined above, bringing together the themes in the literature
and case studies in an analytical form. A full reference bibliography should be included (not counted in the
page limit). The literature review should include:
• Visualised data (e.g. info-graphics and graphs) to: illustrate the scale, dynamics and trends in
protracted displacement; highlight key differences between the typologies of protracted
displacement; and detail programmatic spend.
• A comprehensive typology of protracted displacement (see p.4).
• A theory of change for existing interventions that are designed to promote greater self-reliance of
populations displaced for long periods, drawing on the existing literature, and annotated to
highlight the degree to which the assumptions and impacts are/are not substantiated by the
evidence. (Drawing on this, the consultants may wish to propose an alternative theory of change)
2. An additional policy brief
3. A discussion of where there are notable thematic gaps in the evidence, or a paucity of research in a
particular geographical area.
4. A record of any experts contacted or interviewed as part of the literature reviews, including contact points
or websites where appropriate.
5. A meeting to discuss the literature review with DFID and its key partners.
6. Methodological annex detailing how the literature review and case study analysis were conducted
The process should include provision for peer review of the report.
Skills and personnel
A multi-disciplinary team (one senior researcher and one researcher officer) will be required with expertise in the
following specialisms:
• Forced migration
• Livelihoods
• Financial analysis
• Policy and programming approaches
• Political Analysis
Protracted displacement: Uncertain paths to self-reliance in exile – Annexes | 97

DFID would encourage partnership between different organisations/institutions if it will help to deliver a strong
project
Inputs, Proposed Budget and Timeframe
A team of two researchers (one senior researcher and one research officer) will be required for a total of 98 days
work.
Estimated level of Inputs:
• Data and financial analysis and mapping of the scope and typology of protracted displacement: 18 days
researcher input (team of two researchers)
• Literature review and phone interviews for case study analysis: 65 days researcher input (team of two
researchers) and communication costs for case study interviews
• Write up: 10 days researcher input
• Peer review, redrafting and presentation of results (5 days): inputs will include travel and subsistence
costs for workshop at DFID HQ
Total estimated budget: £80,000
The timeframe for the research will be four months.
Deadline
Tbc (approx. day 18) Inception phase: analysis of scale of protracted displacement and programmatic
spend (including visualised data) and comprehensive typology of protracted
displacement developed.
Tbc (approx. day 80) Draft report (literature review and case study analysis)
Tbc (approx. 5 days) Peer review, redrafting and presentation of results
Tbc (approx. day 98) Final report
Contact Points
For any contractual or financial queries, the consultant should contact Dawn Wood at Dawn-
For queries relating to the content of the report, or for support in locating resources or experts, the consultant
should contact Jessie Kirk at [email protected] or Joanna Macrae at [email protected]..;
Protracted displacement: Uncertain paths to self-reliance in exile – Annexes | 98

References
Canteli, C., et al (2012). Synthesis report of the joint WFP and UNHCR impact evaluations on the contributions
of food assistance to durable solutions in protracted refugee situations. Geneva: UNHCR.
http://documents.wfp.org/stellent/groups/public/documents/reports/wfp254851.pdf
Harild/Christensen. 2010. "Development Challenge of Forced Displacement" Available
at: http://siteresources.worldbank.org/EXTSOCIALDEVELOPMENT/Resources/244362-
1265299949041/6766328-1265299960363/WDR-Background-Note-development-challenge-Displacement.pdf
[Last accessed 25 February 2014].
Health and Education Advice and Resource Team (HEART). 2013. Helpdesk report: Health and Nutrition for
Displaced Populations” Report available on request.
IDMC/Brookings (2011) ‘IDPs in protracted displacement: Is local integration a solution?’
Report from the Second Expert Seminar on Protracted Internal Displacement, Geneva:
www.internal-displacement.org.
Kamau, C., and Fox, J. (2013). The Dadaab Dilemma: A Study on Livelihood Activities and Opportunities for
Dadaab Refugees. Nairobi: Intermediaries in Development
https://kenya.humanitarianresponse.info/system/files/documents/files/Dadaab%20Livelihood%20Study%20-
Final%20Final%20Report.pdf
Kiragu, E. et al. (2011). States of denial: A review of UNHCR’s response to the protracted situation of stateless
Rohingya refugees in Bangladesh. Geneva: UNHCR. http://www.unhcr.org/4ee754c19.pdf
Long, K. 2011. “Permanent crises? Unlocking the protracted displacement of refugees and internally displaced
persons.” Oxford: Refugees Study Centre. Available at: http://www.internal-
displacement.org/8025708F004BE3B1/(httpInfoFiles)/9C65376E1F9DBAAEC125793D003ADC24/$file/unlocki
ng-protracted-displacement-policy-overview.pdf [Last accessed 17 February 2014].
Mcloughlin, 2013. “Supporting self-sufficiency in situations of protracted population displacement”. (GSDRC
Helpdesk Research Report no. 1028), Birmingham, UK: GSDRC, University of Birmingham.
Milner and Loescher. 2011. “Responding to protracted refugee situations: Lessons from a decade of discussion”.
Forced Migration Policy Briefing 6. Oxford: Refugee Studies Centre.
UN. 1998. Guiding Principles on Internal Displacement, U.N. Doc. E/CN.4/1998/53/Add.2 (1998), noted in
Comm. Hum. Rts. res. 1998/50.
UNHCR. 2005. “Local Integration and Self-Reliance”, 2 June 2005, EC/55/SC/CRP.15. Available at:
http://www.refworld.org/docid/478b3ce12.html [accessed 28 January 2014]
Protracted displacement: Uncertain paths to self-reliance in exile – Annexes | 99

UNHCR. 2008. “Protracted Refugee Situations”, 20 November 2008, UNHCR/DPC/2008/Doc. 02. Available
at: http://www.refworld.org/docid/492fb92d2.html [accessed 28 January 2014]
UNHCR, ExCom. 2009. “Conclusion on Protracted Refugee Situations”, No. 109, LXI.
UNHCR. 2012. “Finding Durable Solutions”. UNHCR Global report 2012. Available at:
http://www.unhcr.org/51b1d61d0.html
Zetter, R. 2011. “Unlocking the Protracted Displacement of Refugees and Internally Displaced Persons: An
Overview”. Refugee Survey Quarterly, 30 (4).
Protracted displacement: Uncertain paths to self-reliance in exile – Annexes | 100