protocol for evaluating the potential impact of forestry
TRANSCRIPT

FREP Forest and Range Evaluation Program
Protocol for Evaluating the Potential Impact of Forestry and Range Use on Water Quality 2018
i
Protocol for Evaluating the Potential Impact of Forestry and Range Use on Water Quality
(Water Quality Effectiveness Evaluation, 2018)
For the most current version of this document, please consult the FREP web site below: https://www2.gov.bc.ca/gov/content/industry/forestry/managing-our-forest-resources/integrated-resource-monitoring/forest-range-evaluation-. program/frep-monitoring-protocols/water-quality

FREP Forest and Range Evaluation Program
Protocol for Evaluating the Potential Impact of Forestry and Range Use on Water Quality 2018
ii
Citation D. Maloney, B. Carson, S Chatwin, M. Carver, P. Beaudry and S. Bleakley. 2018. Protocol for Evaluating the Potential Impact of Forestry and Range Use on Water Quality (Water Quality Effectiveness Evaluation). Forest and Range Evaluation Program, B.C. Min. Forest Range and Natural Resource Operations and B.C. Min. Env., Victoria, BC.

FREP Forest and Range Evaluation Program
Protocol for Evaluating the Potential Impact of Forestry and Range Use on Water Quality 2018
iii
ABOUT FREP The Forest and Range Practices Act (FRPA) introduces the transition to a results-based forest practices framework in British Columbia. Under this new approach to forest management, the forest industry is responsible for developing results and strategies, or using specified defaults, for the sustainable management of the 11 resource values (subject areas) identified under FRPA. The role of government is to ensure compliance with approved results and strategies, and other practice requirements, and evaluate the effectiveness of forest and range practices in achieving government’s objectives for FRPA’s resource values. Resource Stewardship Monitoring (RSM) is a key component of the provincial Forest and Range Evaluation Program (FREP). RSM will help identify implementation issues regarding forest policies, practices, legislation, and Forest Stewardship Plan results and strategies. As a result, RSM will be a fundamental component for implementing continuous improvement of forest management in British Columbia. FREP has been established as a multi-agency program to evaluate whether practices under FRPA are meeting not only the intent of the current FRPA objectives, but to determine whether the practices and the legislation itself are meeting government’s broader intent for the sustainable use of resources. FREP is a long-term commitment designed to:
Assess the effectiveness of FRPA and its regulations in achieving stewardship objectives,
Determine if forest and range policies and practices are achieving government’s objectives, with a priority on environmental parameters, and consideration for social and economic parameters where appropriate,
Identify issues regarding the implementation of forest policies, practices and legislation as they affect achieving stewardship objectives, and
Implement continuous improvement of forest management in British Columbia.
In order to accomplish these objectives, FREP will:
Develop specific monitoring and evaluation questions to be addressed,
Document the status and/or trends of resource values over time through the use of detailed protocols,
Identify causal factors where the status or trend is found to be undesirable,
Determine whether resource values are being managed in a sustainable manner through proven or alternative forest practices,
Communicate the results of evaluations, and
Recommend changes to forest and range policies and legislation, where required.

FREP Forest and Range Evaluation Program
Protocol for Evaluating the Potential Impact of Forestry and Range Use on Water Quality 2018
iv
Foreword British Columbia is a province of diverse landscapes, climates and soils as well as home to diverse forest management opportunities. The development of a standard Water Quality Effectiveness Evaluation (WQEE) system for Forest and Range Lands is challenging but necessary for ensuring best management of our water resources. The estimation of amount of fine sediment generated from roads and cutblocks reflects the magnitude of most other human generated water contamination should they be present at the site. Consequently, fine sediment alone acts as a good proxy to evaluate human impact on water quality. In order to maintain the brevity of this Field Manual, it is expected that Evaluators are familiar with the contents of the Forest Road Engineering Handbook printed by the Ministry of Forests and Range in 2002 and the Range Resources Assessment Procedure published by the Ministry of Forest And Range in 2006. This manual is a work in progress and changes are likely to occur as new information comes to light and more sophisticated data needs are required. Feedback from hydrologists and forest technicians on problems encountered and their suggestions for improvement are welcomed. Please contact David Maloney at [email protected].

FREP Forest and Range Evaluation Program
Protocol for Evaluating the Potential Impact of Forestry and Range Use on Water Quality 2018
v
Table of Contents
1 FOCUS USED IN DEVELOPING THIS METHODOLOGY ..................................................... 1
1.1 USING TURBIDITY AS A PRIMARY CHARACTERISTIC OF WATER QUALITY ............................. 1 1.2 IDENTIFYING POINT SOURCES OF SEDIMENT ............................................................................. 1 1.3 ASSESSING POTENTIAL SURFACE EROSION AND PRESENT MASS WASTING ........................... 2 1.4 PROVIDING A SIMPLE MEANS TO EXECUTE ROUTINE/EXTENSIVE EVALUATIONS ................. 2
2 GETTING STARTED .................................................................................................................... 4
3 WHEN TO DO WATER QUALITY EFFECTIVENESS EVALUATIONS ............................. 4
4 BASIC TASKS OF THE WATER QUALITY EFFECTIVENESS EVALUATION................. 5
4.1 TASK I: SELECTION OF SAMPLE AREA AND SITE IDENTIFICATION ........................................... 5 4.2 TASK II: COLLECTING FIELD OBSERVATIONS AT SAMPLE SITES .............................................. 9 4.2.1 LOCATION TAB ..................................................................................................................................... 10 4.2.2 COMPONENTS TAB............................................................................................................................... 12 4.2.2.1 Identify Individual Components of Site within Mini-Catchment (Column 1) ..... 12 4.2.2.2 Establish Connectivity (Column 2) ...................................................................................... 14 4.2.2.3 Estimate Portion of Fine Sediment within Soil Matrix (Column 3) ........................ 16 4.2.3 SURFACE EROSION TAB ...................................................................................................................... 18 4.2.3.1 Estimate Surface Area of Identified Components (Column 8) .................................. 20 4.2.3.2 Estimate Depth of Erosion for Surface of Each Component (Column 9a, 9b, 9c and 9d) 21 4.2.3.3 Calculated Volume of Material Removed by Surface Erosion (Column 10 (Column 8C x9d)) .......................................................................................................................................... 25 4.2.3.4 Calculated Total Sediment Contribution from Surface Erosion (Column 11 (Column 2 x Column 10)) ........................................................................................................................... 25 4.2.3.5 Calculated Fine Sediment Contribution from Surface Erosion (Column 12 (Column 3 x Column 11)) ........................................................................................................................... 25 4.2.4 MASS WASTING TAB ........................................................................................................................... 26 4.2.4.1 Estimate Mass Wasting Contribution WQEE (Column 1) ........................................... 26 4.2.4.2 Estimate Portion of Fine and Coarse Sediment in the Failed Material (Column 3) 27 4.2.4.3 Estimate Volume of Material Removed by Mass Wasting (Column 4) .................. 27 4.2.4.4 Estimate Volume of Failed Material Still on Site (Column 5) .................................... 27 4.2.4.5 Calculated Total Volume of Sediment Reaching Stream (Column 6) ..................... 27 4.2.4.6 Calculated Volume of Fine and Coarse Sediment from Mass Wasting Reaching Stream (Column 7) ........................................................................................................................................ 28 4.2.5 RANGE TAB ........................................................................................................................................... 30 4.3 TASK III: ASSIGN THRESHOLDS FOR WATER QUALITY IMPACTS ..........................................33 4.3.1 STREAM CHARACTERISTICS TAB ....................................................................................................... 33 4.3.2 STANDARD EVALUATION .................................................................................................................... 33 4.3.3 WATER QUALITY PROTOCOL AS A FRAMEWORK FOR MORE INTENSIVE WATER QUALITY
EVALUATIONS ..................................................................................................................................................... 34 4.3.4 COMPLEXITIES ASSOCIATED WITH DISCHARGE OF STREAM RECEIVING SEDIMENT ................ 35 4.3.5 HOW TO ESTIMATE DISCHARGE USING THE WQEE APP ............................................................. 36 5.4 TASK IV: DETERMINE MANAGEMENT OPTION TO REDUCE IMPACTS ......................................40

FREP Forest and Range Evaluation Program
Protocol for Evaluating the Potential Impact of Forestry and Range Use on Water Quality 2018
vi
5 CONCLUSION ..............................................................................................................................43
6 REFERENCES ..............................................................................................................................44
Tables Table 1 Typical Sample Sites within Sampling Area that Require Evaluation ....................................................... 9
Table 2 Individual Components of Forestry Disturbed Sites................................................................................ 13
Table 3 Estimating Connectivity .......................................................................................................................... 15
Table 4 Estimating Connectivity .......................................................................................................................... 16
Table 5 Estimating Fine Sediment Portion of Matrix............................................................................................ 17
Table 6 Expected Annual Surface Erosion Expected on Surfaces Commonly Found Associated with Mini-Catchments ........................................................................................................... 22
Table 7 Showing Predicted Depths of Surface Erosion (m) from Road Surface <2% Slope Gradient under Differing Conditions ....................................................................................................... 24
Table 8 Showing Predicted Depths of Surface Erosion (m) from Road Surface of 2-10% Slope Gradient under Differing Conditions ............................................................................................. 24
Table 9 Showing Predicted Depths of Surface Erosion (m) from Road Surface of >10% Slope Gradient under Differing Conditions ....................................................................................................... 24
Table 10 Summary of Fine Sediment Generated from Mass Wasting at Site Depicted in Figure 9 ............................................................................................................................................................. 29
Table 11 Rating of Total Fine Sediment Generation from Site (Independent of Stream Size) .............................. 34
Table 12 Used for Estimating Actual Stream Discharge at Time of Visit ............................................................... 36
Table 13 Thresholds for Increased Turbidity at Intake .......................................................................................... 39
Table 14 Turbidity level (and suspended sediment concentration) and the potential for ill Effects for Clear Water or Sensitive Fish ................................................................................................ 40
Table 15 Checklist of Possible Solutions to Reduce Fine Sediment Generation................................................... 42

FREP Forest and Range Evaluation Program
Protocol for Evaluating the Potential Impact of Forestry and Range Use on Water Quality 2018
vii
Figures Figure 1 Tasks Required to Complete Water Quality Effectiveness Evaluation ..................................................... 3
Figure 2 An Example of a Coastal Sampling Area and Sites Requiring Inspection ................................................ 8
Figure 3 Location Tab in the WQEE App .............................................................................................................. 11
Figure 4 Components Tab in the WQEE App ....................................................................................................... 12
Figure 5 Photograph of Site Showing Delineated Mini-Catchment and Components (Lightly Used Forest Road with Bridge Crossing) ............................................................................................... 13
Figure 6 Surface Erosion Tab in the WQEE App .................................................................................................. 18
Figure 7 Example of Surface Erosion Contribution ............................................................................................... 20
Figure 8 Mass Wasting Tab in the WQEE App ..................................................................................................... 26
Figure 9 Example of Mass Failure: Landslide Adjacent to Creek Caused by Excess Road Drainage on Class V Slope .................................................................................................................... 29
Figure 10 Range Tab in the WQEE App ................................................................................................................. 30
Figure 11 Checklist of Range Indicators Potentially Affecting Water Quality .......................................................... 32
Figure 12 Stream Characteristics Tab .................................................................................................................... 33
Figure 13 Stream Characteristics Used to Evaluate Discharge and Turbidity Impact ............................................ 37
Figure 14 Water Quality Characteristics ................................................................................................................. 38
Figure 15 Stream Channel Cross Section .............................................................................................................. 39
Figure 16 Summary Tab in the WQEE App ............................................................................................................ 41
Appendices Appendix 1 Sample Field Site Card........................................................................................................................... 46
Appendix 2 Summary of Reference Tables for WQEE (as numbered in main body of report) .................................. 48
Appendix 3 Newcombe Fish Sensitivity ..................................................................................................................... 56
Appendix 4 Assessing Riparian Windthrow for Fine Sediment Generation ............................................................... 59


FREP Forest and Range Evaluation Program
Protocol for Evaluating the Potential Impact of Forestry and Range Use on Water Quality 2018
1
DOCUMENT PURPOSE
The Forest and Range Practices Act (FRPA) makes provisions for independent assessments of the effectiveness of the Act to meet environmental objectives. Maintaining or improving water quality is one objective of FRPA. Field procedures developed here provide a means to quantify the effect of forestry and range related disturbances on water quality and how that impact might be mitigated.1
1 Focus Used in Developing this Methodology
1.1 Using Turbidity as a Primary Characteristic of Water Quality
For the purpose of this evaluation, the primary characteristic of interest is turbidity, which is a measure of the cloudiness of water.2 When forestry related disturbances generate fine sediment that is then transported to a stream, turbidity pulses occur which degrade water quality for both drinking water and fisheries. Any process that is capable of transporting fine sediment3 is also capable of carrying any other pollutants associated with the disturbance be it fecal coliform, hydraulic oil or pesticides associated with the site. Although the evaluation methodology focuses on fine sediment generating turbidity, it also acts as an indicator for other potential contaminants.
1.2 Identifying Point Sources of Sediment For a landscape assessment, forestry related sediment generation can be modeled as a diffuse source. However in terms of watershed management virtually all sediment generated by forest activities comes from discrete easy-to-identify point sources. Such sources or sites occur wherever artificial surface drainage from roads, harvesting or livestock disturbed terrain can reach natural streams.
1 This procedure has also been accepted as a Standard Methodology by the Forest Investment Account
for the Land Base Investment Program. This standard is listed as an eligible activity under the “Information Gathering and Management” component of the program (http://www.for.gov.bc.ca/ hcp/fia/landbase/info_gathering_eligible_activities.htm). When this manual is used for FRPA effectiveness evaluations, all “tasks” listed in this manual (Figure 1) must be completed as per the requirements of the manual. However, when used for the FIA program (e.g. for forest certification purposes), only the specific tasks and computations that are tailored to meet a particular Licensee’s program are required. 2 Finer textured materials discussed here include particle size classes under 1 mm diameter- fine sand,
silt and clay portion of the material matrix. Finer particle size classes will remain suspended with even slightly turbulent flow and contribute to turbidity of stream flow. Coarser particle sizes will fall out of suspension where any temporary quiet water occurs and generally do not contribute to turbidity. 3 More specifically turbidity can be defined as a “ decrease in the transparency of a solution due to the
presence of suspended and some dissolved substances, which causes incident light to be scattered, reflected, and attenuated rather than transmitted in straight lines; the higher the intensity of the scattered or attenuated light, the higher the value of turbidity.”(Ziegler, 2002)

FREP Forest and Range Evaluation Program
Protocol for Evaluating the Potential Impact of Forestry and Range Use on Water Quality 2018
2
1.3 Assessing Potential Surface Erosion and Present Mass Wasting
Forest hydrology research has determined that many of the turbidity pulses generated on a stream are connected with different forms of mass failures associated with roads and cutblocks. With increasing attention to preventing mass failures since 1985, more recently surface erosion has been recognized as increasingly important for fine sediment generation4. This methodology provides a means to randomly sample representative forestry and livestock disturbed sites, estimate fine sediment generated from surface erosion and mass wasting and assign thresholds of concern for a wide variety of sites. When required, the methodology can be used to help determine if or how changed management could reduce that sediment load. Where livestock disturbed sites are noted, fine sediment generated by livestock will be evaluated although the overwhelming concern of water purveyors is fecal contamination by livestock.
1.4 Providing a Simple Means to Execute Routine/Extensive Evaluations
The evaluation is meant to be conducted quickly by non- specialists. It does not provide a rigorous account of all factors that contribute to sediment generation, nor does it profess to accurately predict exact quantities of sediment being generated for any particular site. To achieve such a goal, the methodology would become so cumbersome that it would negate its value as a Routine Evaluation. The methodology assumes its predictions are accurate to within an order of magnitude. For example, if the field evaluation predicts 1 m3 of fine sediment will be generated by the site, this is an indication that the true sediment delivery from the site is likely to be much more than 0.1 m3 and much less than 10 m3. The methodology allows sites to be prioritized into very low, low, moderate, high, and very high sediment loading. By considering characteristics of receiving waters, specific information about water quality impacts can be made. With this information, supportable recommendations can be made on management options to reduce water quality impacts. Some water quality concerns associated with forestry and range management do not lend themselves to routine results based evaluation. Concerns such as pesticide use and hydrocarbon spills cannot be directly evaluated by one-off field observations. However the specific surface areas defined by the evaluation can provide valuable information about where existing contaminants are most likely to be transported to a stream.
4 Assessing downstream water quality effects of forestry operations is difficult. While on a watershed
scale, modeling the sources as diffuse might be reasonable, on the cutblock level or road permit level, it is not. Most forestry related water quality effects are actually distinct “point” sources draining specific disturbed sites. By estimating sediment generation transported to streams at these discrete “points” one can infer the kinds of water quality changes expected in the receiving waters immediately downstream. In theory, should all these discrete sediment- generating sources for all forestry operations be considered together within one watershed, the evaluator would have amassed a reasonable assessment of the cumulative effect of forestry operations on water quality of a particular stream reach.

FREP Forest and Range Evaluation Program
Protocol for Evaluating the Potential Impact of Forestry and Range Use on Water Quality 2018
3
The four major tasks associated with this methodology are outlined in Figure 1.
Figure 1 Tasks Required to Complete Water Quality Effectiveness Evaluation
Task 1: Selection of the Sample Area and Site Identification
•For overview FREP evaluations, determine sampling area from randomly selected cutblocks and roads in district that will undergo field evaluation, select approximate transect within sampling area associated with cutblock and roads and make preliminary selection of potential sediment generating sites along that transect. Non FREP users will likely require some pre-stratification of samples to address specific evaluation needs.
Task II: Collecting Field Observations at Sample Sites
•Collection of field data addressing erosion, sedimentation and stream characteristics. Observations regarding livestock are undertaken when site is within 10 km upstream of a drinking water intake.
Task III: Assign thresholds for water quality impacts
•Assign the relative impact of different magnitudes of fine sediment being introduced into the stream. In the original evaluation, these threshold values are independent from the size of the receiving stream. As of 2016, evaluators collect stream characteristics data in order to be able to evaluate impact to water quality immediately downstream of the sample site should it be required.
Task IV: Determine management option to reduce impacts
•Assess management practices associated with component or site in relation to predicted water quality impact of sediment generation and potential fecal contamination.

FREP Forest and Range Evaluation Program
Protocol for Evaluating the Potential Impact of Forestry and Range Use on Water Quality 2018
4
2 Getting Started The following is a list of actions and materials required to conduct a routine water quality effectiveness (WQEE) evaluation:
iPads using updated File Maker Go program on iOS 10.2 or later.
At the start of each field season (April), the latest version of the WQEE digital Application (App)5 will be made available to users and will need to be downloaded from the government website.
Updated checklists, tables and forms are included as background information in the Protocol manual although they are not to be used in the field except in emergencies.
Read the 2018 Water Quality Protocol text imbedded within the WQ App.
Review the training videos using link on Location Tab of WQ App.
New users of the Protocol or those uncertain about aspects of the methodology should attend a training session.
List showing sampling areas chosen from those randomly generated by FREP.
1:20,000 TRIM maps showing drainages within chosen Random Sampling Area.
Contour maps at available scale (1:20,000- 1:50,000) within chosen Random Sampling Area.
Forest Development maps showing up-dated roads, cutblocks and streams within chosen Random Sampling Area.
Normal field gear (raingear, hard hat, vest, and safety / first aid supplies).
Suitable foot gear, which may or may not include steel toed caulk boots.
3 When to do Water Quality Effectiveness Evaluations
The field inspection requires sufficient daylight to make observations and snow free ground within the site being sampled. Otherwise, the results should not be particularly sensitive to time of visit. There are some advantages in observing sites immediately post spring breakup before any road maintenance has been conducted, as signs of erosion are most apparent at this time. However the presence of obvious signs of erosion is not essential when making a prediction of future surface erosion expected at the site. Two different evaluators conducting the evaluation during heavy rains in the fall or
5 The WQEE App provides allowable choices via a series of drop down menus, performs complex
calculations automatically and is self contained in terms of GPS receiver, digital camera, digital note book for comments. The program interface also includes detailed training documents, videos and simple pop-ups to direct the user in the field. The data entered into this App can be uploaded onto the provincial database directly.

FREP Forest and Range Evaluation Program
Protocol for Evaluating the Potential Impact of Forestry and Range Use on Water Quality 2018
5
in the middle of the hot, dry summer should get similar results for predicted surface erosion that will occur. Evaluators are encouraged to spend time along forest roads and active harvesting areas during spring break up, during major rainstorms and especially when active hauling is underway to become familiar with the processes by which sediment is generated and transported. Unless one has had this experience, there is a tendency to disbelieve the prediction of the amount of fine sediment that can be generated at a given site.
4 Basic Tasks of the Water Quality Effectiveness Evaluation
The methodology has been developed to proceed in a stepwise fashion. Provisions and observations made during each task lead directly to the final evaluation results. The four tasks involved are shown in Figure 1 and are described further below.
4.1 Task I: Selection of Sample Area and Site Identification For the standard FREP WQEE evaluation the selection of the sampling areas is carried out as follows:
1. As with the other FREP Evaluations, a randomly selected list of cutblocks is generated using the provincial forestry database (“RESULTS”) for each district. The evaluator proceeds down the list and selects between 15 and 20 cutblocks that were developed within the previous 2 years and where water features occur on, or along the road accessing the block. Generally, Non-Classified Drainages (NCDs) will not be chosen as sampling sites because their connectivity to downstream water is uncertain. While range characteristics are not specifically considered in this initial selection, presence of livestock and close proximity of water and roads will ensure that sampling sites are high use areas for livestock if present.
2. Once the cutblocks are selected the location of each cutblock will be plotted (by MoFR GIS database) on a 1:400,000 base map for the District. For each of the selected cutblocks, 1:20,000 maps showing roads, drainages and cut blocks will be produced, again using “RESULTS” from the provincial database.
3. Out of these 15 or 20 cutblocks, an undetermined number will be
chosen by district staff to become “sampling areas” requiring on site evaluation. Should two (or more) of the originally selected cutblocks share a majority of sample sites along common haul roads (branch and mainline) only one of the blocks will be sampled, the rest will be rejected as samples. The exact number of sampling areas chosen will

FREP Forest and Range Evaluation Program
Protocol for Evaluating the Potential Impact of Forestry and Range Use on Water Quality 2018
6
depend on district priorities, the availability of human resources, budgets, ease of access and other logistical considerations.
4. The primary objective of the sampling is to capture a representative sample of all types of site disturbance within the watershed. Obviously sampling should include varying site characteristics, major road types and degree of use. Considering the need for representative sampling, the evaluator will then select the initial sample sites to be visited. These sites are to be associated with each randomly selected sampling area as shown in the example depicted in Figure 2. This will include sites associated with the development of and transport to the cutblock such as the mainline, branch roads, spur roads and harvested areas in proximity to natural drainage6 with a high potential to degrade water quality as shown in Table 1 (showing typical sample sites). Once in the field, these sites will be assigned reference numbers, (usually a block number referencing transect initiation and whole number sequences, 1, 2, 3 4, etc. depending on number of samples taken).
5. Once the sampling areas are determined, the evaluator will collect updated information for each of these areas available at their office and in discussions with Licensees. This will include a map showing actual cutblock boundaries, streams as determined by ground survey7 and the updated road network which will be required for the field evaluation. Most detailed Licensees road maps include culvert location and size which can make location of sites easier.
6. The number of required sampling sites associated with a particular
sampling area is not fixed because of the great variability in drainage density found over the diverse terrain of British Columbia. On the coast, there might be 10 potential sampling sites within the first 3 km of haul road. However, in the Chilcotin, there may be only 2 or 3 identifiable sites associated with a selected cutblock and 20 or 30 km of road between each site. The ideal number of sites to be sampled associated with a sampling area would be around 8. In many cases, reaching this ideal will not be possible and the evaluator will not be able to sample all potential sites within their planned transect. The length of road required to make up the number of sites that can be evaluated in one sampling day will vary considerably, depending on the nature of the terrain, condition of the road and drainage density. As mentioned above, where drainage density is high, it will be necessary to ensure that there is a representative subset of samples along each road segment. Spur roads, branch roads and mainlines should be sampled according to their occurrence and active use on the
6 All streams labeled S1 through S6. Non Classified drainages, (NCDs) only considered when observed to be directly connected
with a larger stream or lake.
7 There are often discrepancies between Trim Data and field collected data. Streams shown on Trim maps may not exist and
streams may exist that are not shown on Trim maps. Unless field observations prove otherwise, always take engineers’ field maps
with culvert locations to be correct.

FREP Forest and Range Evaluation Program
Protocol for Evaluating the Potential Impact of Forestry and Range Use on Water Quality 2018
7
landscape8. The mainline and branch road accessing the cutblock, and not the cutblock itself, will provide most of the sites to be evaluated.
The value of the initial office review is to ensure that the evaluator is familiar with the information relevant to water quality sampling (for instance, occurrence of fine textured lacustrine soil in cutbanks along the sampling transect). The evaluator will endeavour to visit all office-selected sample sites associated with randomly selected cutblock and road development on his field visit. In addition, other sites, not initially selected in the office but associated with the same cutblock and segment of road, may also require evaluation. For instance, unmapped streams may be found and would need to be sampled. Recent land failures may have occurred. Inter-drainage culverts may generate considerable storm flow and, if they drain particularly large road segments, storm discharge from them may travel much further than anticipated. While in most cases it should be captured during the office investigation, there may be instances where the evaluator must make a decision to only sample a subset along a given road segment. It will be especially important that the selection of this subset of samples is pre-determined (such as first 3 crossings along any particular road segment) to ensure no bias in the sampling, field selected sample sites may occasionally make up a substantial portion of the sites actually inspected. Conversely, some streams displayed on TRIM maps may not exist in the field and thus do not require sampling. Road segments within 20 m of a water body may require a slight modification to the procedure in order to capture situations where a road parallels a stream or lake for a considerable distance. In these cases, the evaluator should assess the connectivity of a number of inter-drainage culvert segments along the road to determine whether the road actually impacts water quality. Where inter-drainage culverts drain similar surface areas of road and pass through similar terrain below the road, the evaluator may choose to consider the whole segment with an average connectivity. In such a case the “site“ may be a stretch of road 500 m or even 2 km long. This will avoid assigning separate sites to each inter-drainage culvert and greatly speed up the evaluation process.
8 In some instances, such as along mainlines of considerable length, it might be preferable to assign an interval of distance on road
whereby the stream crossing nearest that interval will be the focus of the sample.

FREP Forest and Range Evaluation Program
Protocol for Evaluating the Potential Impact of Forestry and Range Use on Water Quality 2018
8
Figure 2 An Example of a Coastal Sampling Area and Sites Requiring Inspection

FREP Forest and Range Evaluation Program
Protocol for Evaluating the Potential Impact of Forestry and Range Use on Water Quality 2018
9
Table 1 Typical Sample Sites within Sampling Area that Require Evaluation
Road Related
1 All road stream crossings (bridge and culvert). Some streams may be missing from TRIM maps and upon discovery of such streams in the field, will be added to sites requiring evaluation.
2 Inter- drainage (ditch relief) culverts. Road segments located within 20 meters of stream or lake or where there is a chance that road drainage reaches the natural water body.
3 Road generated slope failure. Any failure either immediately above or below road. (These will not generally be known until the field visit but are extremely important to consider).
Harvesting Related
4 Harvesting / yarding within or adjacent to riparian zone. 5 Skidder/ mechanized harvester trails in proximity to riparian
zone. 6 Harvesting generated slope failure (all new failures within or
below cutblock). 7 Other forestry harvesting disturbances resulting in bare,
unvegetated soil.
Silviculture Related
8 Silvicultural- related- activities leading to water quality degradation.
Livestock Related
9 Livestock presence noted within riparian zone and stream channel. Where livestock presence is noted and a drinking water intake or intakes are known to occur within 10 km downstream, the site will require further evaluation using Range Checklist Indicator Sheet. (Figure 11 or the Range Tab within the WQ App).
4.2 Task II: Collecting Field Observations at Sample Sites The evaluation of each sample site originally required the completion of a sample site field card. Once a site has been chosen for evaluation, the original WQEE field card provided the framework upon which the assessment of each site is based. Since the development of the WQEE App for the iPad, all of this data must be input under the tabs as described in this report. As mentioned before each field season, the evaluators must ensure they have the latest version of the iPad operating systems, File maker Go Program and the FREP Water Quality App, the last of which will be made available by program officers. An example of the sample site field card is provided in Appendix 1 which includes the additional information now required to complete the evaluation. A summary of reference tables presented in this report is provided in Appendix 2.

FREP Forest and Range Evaluation Program
Protocol for Evaluating the Potential Impact of Forestry and Range Use on Water Quality 2018
10
Forestry –or Livestock Disturbed sites are delineated by their disturbed drainage contributing areas. These are called “mini-catchments”. A mini-catchment encompasses the whole area of disturbance associated with any sample site that drains towards a recognized water body. It might include a portion of forest road drained by a particular culvert, cutbank face along the road and the pathway of any concentrated water as it flows off a disturbed site toward an adjacent stream. It does not include surfaces where the forest floor, logged or not, is largely undisturbed9. A mini-catchment boundary could be natural, such as caused by a local swale in the topography or a result of management, where an existing water bar directs water away from a surface that would otherwise flow within the mini-catchment. Mini-catchments are usually small and simple with surface areas between 100 and 600 m2. Occasionally they can be very large and complex, such as with massive slope failures or a long road segment drained by an uninterrupted road ditch. Field evaluation is necessary to determine the boundaries and characteristics of any mini-catchment associated with a sample site. Generally, standard topographic maps used by the forest industry with 10 m or 20 m contours are of no use in delineating boundaries of mini-catchments. The difference in topography and consequential drainage resulting from a 10 cm deep water bar, which appears on no topographic map, may decisively direct surface drainage to a natural settling basin and thus avoid any impact on water quality. There are some instances where LIDAR might assist in determining the extent of a mini-catchment under investigation but these are the exception rather than the rule. In simple cases, Forestry or Livestock Disturbed Sites might be made up of only one type of disturbed surface requiring no further break down of its components. A yarding- induced stream bank slump may have failed directly into a stream. Here, the slump face may be the only surface requiring evaluation. In Figure 5, there is an example of a typical site with a number of components that will require evaluation. The initial “Opening” Tab within the WQEE App provides an overview training presentation for new users including:
1. An introductory presentation of the Water Quality Effectiveness Evaluation App and how it is conducted (90 slides)
2. This manual (revised WQEE Protocol) 3. A manual outlining use of iPad and the File Maker Go program,
within which the WQEE App is embedded 4. A link to on line videos explaining various aspects of the evaluation
itself
4.2.1 Location Tab The opening screen for the WQEE App shows the “Location” Tab (Figure 3). It records information related to the basic characteristics of the site being 9Largely undisturbed forest floors, even when logged, will have an infiltration rate capable of absorbing high intensity rainfall. Storm drainage and any
sediment it might be carrying, will be absorbed.

FREP Forest and Range Evaluation Program
Protocol for Evaluating the Potential Impact of Forestry and Range Use on Water Quality 2018
11
evaluated. GPS is captured and recorded directly from the App and is presented as Latitude and Longitude as well as Easting and Northing. A reasonable estimation of altitude is generated. For FREP evaluators the Cutblock Opening ID must correspond to the official list as provided by FREP. Any other site identification, name or number, can be entered under “Other ID”. Site numbers within the established opening are generated automatically starting with 1, 2, 3, etc. The evaluator is required to input his or her email address and this will be used later to provide a receipt for synced data. Drop downs provide selection of districts and other required site information. When at sites with stream crossings (which will represent the great bulk of samples), presence of culverts or bridges and their respective diameter and length will be recorded using the provided boxes and drop downs. As in any File maker Go Application, input data can be modified at any time by re-tapping the box requiring change and choosing another drop-down option or holding finger on box to bring up the delete option.
Figure 3 Location Tab in the WQEE App

FREP Forest and Range Evaluation Program
Protocol for Evaluating the Potential Impact of Forestry and Range Use on Water Quality 2018
12
4.2.2 Components Tab The Components Tab of the WQEE App is shown in Figure 4.
Figure 4 Components Tab in the WQEE App
4.2.2.1 Identify Individual Components of Site within Mini-Catchment (Column 1) Once the boundaries of the mini-catchment are defined, its individual components (with differing actual or potential erosion capabilities) are identified. These may include road surface, cutbanks, fill slopes or other disturbed ground resulting from road construction and use. The disturbance may be causing surface erosion gullying or slope failures each of which will require incorporation into the evaluation. Typical components are shown on Table 2. These components can be further broken down into Left or Right side of road (facing downstream from the crossing) or Upslope or downslope of the road.

FREP Forest and Range Evaluation Program
Protocol for Evaluating the Potential Impact of Forestry and Range Use on Water Quality 2018
13
Table 2 Individual Components of Forestry Disturbed Sites
Possible Components Found within Sample Site (suggested abbreviation)
a Road Surface (RS) b Road Cutback (RC) c Road Ditch (RD) d Fill or sidecast (F) e Gullies or rills generated by artificially concentrated storm flow (G) f Landslides (L) g Upturned Root Wads (URW) (associated with Riparian Harvesting and
Yarding (See Appendix 4) h Livestock Disturbance Noted (LDN) i Other Disturbed Area (ODA)
An example of a site’s delineated mini-catchment and partitioning of components is provided in Figure 5.
Figure 5 Photograph of Site Showing Delineated Mini-Catchment and Components (Lightly Used Forest Road with Bridge Crossing)
FREP Forest and Range Evaluation Program
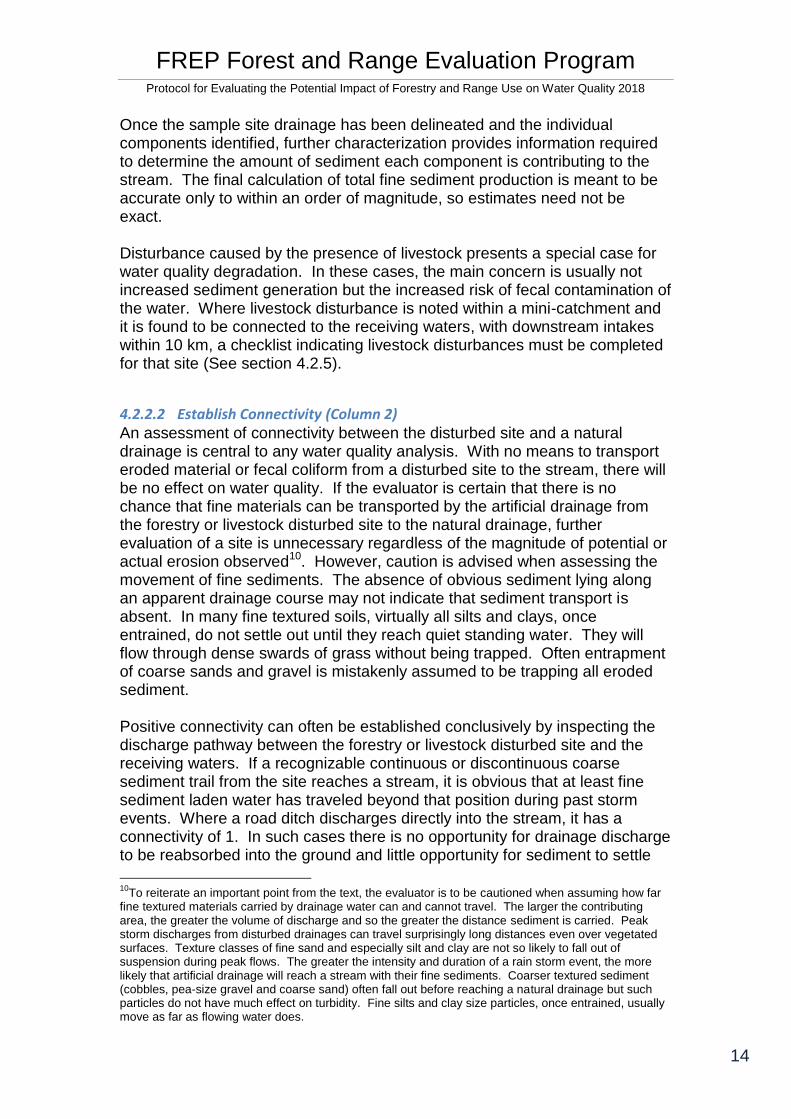
Protocol for Evaluating the Potential Impact of Forestry and Range Use on Water Quality 2018
14
Once the sample site drainage has been delineated and the individual components identified, further characterization provides information required to determine the amount of sediment each component is contributing to the stream. The final calculation of total fine sediment production is meant to be accurate only to within an order of magnitude, so estimates need not be exact. Disturbance caused by the presence of livestock presents a special case for water quality degradation. In these cases, the main concern is usually not increased sediment generation but the increased risk of fecal contamination of the water. Where livestock disturbance is noted within a mini-catchment and it is found to be connected to the receiving waters, with downstream intakes within 10 km, a checklist indicating livestock disturbances must be completed for that site (See section 4.2.5).
4.2.2.2 Establish Connectivity (Column 2) An assessment of connectivity between the disturbed site and a natural drainage is central to any water quality analysis. With no means to transport eroded material or fecal coliform from a disturbed site to the stream, there will be no effect on water quality. If the evaluator is certain that there is no chance that fine materials can be transported by the artificial drainage from the forestry or livestock disturbed site to the natural drainage, further evaluation of a site is unnecessary regardless of the magnitude of potential or actual erosion observed10. However, caution is advised when assessing the movement of fine sediments. The absence of obvious sediment lying along an apparent drainage course may not indicate that sediment transport is absent. In many fine textured soils, virtually all silts and clays, once entrained, do not settle out until they reach quiet standing water. They will flow through dense swards of grass without being trapped. Often entrapment of coarse sands and gravel is mistakenly assumed to be trapping all eroded sediment. Positive connectivity can often be established conclusively by inspecting the discharge pathway between the forestry or livestock disturbed site and the receiving waters. If a recognizable continuous or discontinuous coarse sediment trail from the site reaches a stream, it is obvious that at least fine sediment laden water has traveled beyond that position during past storm events. Where a road ditch discharges directly into the stream, it has a connectivity of 1. In such cases there is no opportunity for drainage discharge to be reabsorbed into the ground and little opportunity for sediment to settle
10
To reiterate an important point from the text, the evaluator is to be cautioned when assuming how far fine textured materials carried by drainage water can and cannot travel. The larger the contributing area, the greater the volume of discharge and so the greater the distance sediment is carried. Peak storm discharges from disturbed drainages can travel surprisingly long distances even over vegetated surfaces. Texture classes of fine sand and especially silt and clay are not so likely to fall out of suspension during peak flows. The greater the intensity and duration of a rain storm event, the more likely that artificial drainage will reach a stream with their fine sediments. Coarser textured sediment (cobbles, pea-size gravel and coarse sand) often fall out before reaching a natural drainage but such particles do not have much effect on turbidity. Fine silts and clay size particles, once entrained, usually move as far as flowing water does.

FREP Forest and Range Evaluation Program
Protocol for Evaluating the Potential Impact of Forestry and Range Use on Water Quality 2018
15
out or become trapped in ground vegetation. Ditch waters made turbid by silts and clays will not be cleared to any degree by the typical settling basin dug on the upper side of mid- drainage culverts. Such settling basins may remove coarser sediments and thus reduce potential blockages of culverts. Partial connectivities must be estimated in instances where the pathway of drainage flows over irregular, vegetated surfaces before reaching the stream. Distances over vegetated surfaces between disturbed sites and streams, volume of discharge, density of ground cover, slope gradients and surface roughness will determine if and how much storm drainage will be absorbed down-slope before reaching a natural drainage. Estimates from visual observations can be directed by thresholds set in Table 3 and Table 4. Mass wasting provides a special case because the evaluator assesses the amount of failed material and what is still on site.
Table 3 Estimating Connectivity
Estimated Connectivity
Typical Example Actual Range
Connectivity Value used in Column 2
None Ditch-blocked interceptor culvert draining 70m of road discharging onto long, hummocky forested slope.
(<0.1) 0
A little A 200 m2 road surface collecting storm flow and dropping it onto forest floor within 15 meters of creek
(0.1-0.3)
0.2
About half A small area of disturbed cutbank (50 m2) with 2 meters of forest floor separation from stream
(0.3-0.7)
0.5
A lot Ditch-blocked interceptor culvert draining 200 m of road discharging onto a steep forested slope within 4m of stream
(0.7-0.9)
0.8
All Ditch drainage running directly into stream or road surface drainage running off road bridge
(>0.9) 1
For newly trained evaluators, a slightly more rigorous measure of connectivity is provided in Table 4 that considers the relationship between the size of the drainage area generating storm flow for a particular storm discharge11 and the distance traveled over vegetated ground between disturbed site and stream. Connectivities are assigned to recognize portions of a mini-catchment that share a common drainage pathway. There may be more than one drainage pathway between the disturbed site and the receiving waters. For example
11 Note that this disturbed drainage area may be considerably larger or smaller than that of a single component itself. For instance, half of a crowned road surface and a cutbank may all drain into a ditch so that the whole area of this drainage must be considered when estimating connectivity.

FREP Forest and Range Evaluation Program
Protocol for Evaluating the Potential Impact of Forestry and Range Use on Water Quality 2018
16
storm drainage from a single sample site may flow to the stream along two inner road ditches, along a rill within a tire rut directly to a bridge deck and from an inter-drainage culvert. Once a drainage pathway has been identified, all components or portions of components drained by it, also share a common connectivity value.
Table 4 Estimating Connectivity
Distance over Forest Floor between Ditch Outlet and Stream (m)
Approximate Area of Disturbed Drainage Upslope of Storm Drainage Outfall (m2) <10 10-
50 50-100
100-250
250-500
500-1000
1000-2000
>2000
0.5-1 0.5 0.8 1 1 1 1 1 1 1-2 0.2 0.5 0.8 1 1 1 1 1 2-5 0 0.2 0.5 0.8 1 1 1 1 5-10 0 0 0.2 0.5 0.8 1 1 1 10-20 0 0 0 0.2 0.5 0.8 1 1 20-30 0 0 0 0 0.2 0.5 0.8 0.8 >30 0 0 0 0 0 0 0 0.5
The value of this table for management is straightforward. The greater the drainage area associated with any artificial catchment, the less likely that fine sediment generated by it can be recaptured. Storm drainage and the fine sediment generated from a 50 m2 section of road may be effectively captured by five meters of rough forest floor. Conversely, it may be almost impossible to recapture storm drainage collected from a 300 m stretch of uncrowned, un-culverted mainline. There are a number of other factors that can influence connectivity that were not incorporated into this evaluation technique. Introducing them greatly increases the complexity of the evaluation, reducing its value as a quick field assessment.
4.2.2.3 Estimate Portion of Fine Sediment within Soil Matrix (Column 3) The portion of fine sand, silt and clay within any disturbed material matrix will strongly influence how any sedimentation event will influence water quality. A landscape dominated by shales, silty lacustrines or dispersible clays will tend to generate much more turbid waters when disturbed than a landscape dominated by coarse glacio-fluvial sands, rotted granites, competent bedrock or colluvium. With the exception of components made up of active road surfaces that are repeatedly disturbed by vehicular traffic and/ or grading (see Section 4.2.3), all other surfaces require an assessment of matrix texture to provide an estimate of how much sediment is fine enough to be transported and actually contribute to water quality degradation. Sediment coarser than fine sands generally moves downstream as bed load and is often captured by various natural filters and traps within the mini-catchment or stream channel itself. When fishery values are of primary importance, this coarse textured sediment can play a significant role in degrading fish habitat although it is not primarily due to water quality decline. For instance, a landslide failing directly

FREP Forest and Range Evaluation Program
Protocol for Evaluating the Potential Impact of Forestry and Range Use on Water Quality 2018
17
into a creek may include 10 % fines which will ultimately contribute directly to turbidity. The remaining 90% of the landslide material is destined to become bed load which can, in turn, affect hydraulic efficiency of the channel, composition of river bed and depth of pools. This coarse sediment may indirectly contribute to reduced water quality but is not a primary consideration of this evaluation. In any case, a licensee who manages for fine sediment generation will capture all sediment before it reaches a creek. A licensee who manages for coarse sediment by the inclusion of small settling ponds between ditches and a natural water body may fail completely to prevent water quality degradation. Most settling ponds placed to filter out sediment from long ditch lines may have little or no effect on transport of fine sediments. For this evaluation the determination of texture involves an estimate of the portion of the fine sediments (fine sand, silt and clay) within the matrix of the soil/ material undergoing erosion. Hand texturing is preferred and should be conducted by those familiar with the technique. However, in lieu of hand texturing, a simple shaking of the dispersed soil material in a wide mouthed jar will give a reasonable estimate of the portion of fines within the soil under question. Any sediment still in suspension 15 seconds after shaking stops can be considered to be the fine portion and will influence turbidity. Once the evaluator has carried out texture measurements a few times and becomes familiar with the local materials found in their district, rapid visual estimates of textures become possible. To standardize the results, values for ranges are given on Table 5.
Table 5 Estimating Fine Sediment Portion of Matrix
Estimate of portion of fine sand, silt and clay in eroded/erodible material (excluding active road surfaces)
Actual Range Value used in Column 3
None (<0.1) 0 A little (0.1-0.3) 0.2 About half (0.3-0.7) 0.5 A lot (0.7-0.9) 0.8 All (>0.9) 1

FREP Forest and Range Evaluation Program
Protocol for Evaluating the Potential Impact of Forestry and Range Use on Water Quality 2018
18
4.2.3 Surface Erosion Tab The Surface Erosion Tab is shown in Figure 6.
Figure 6 Surface Erosion Tab in the WQEE App
When assessing surface erosion, all active road surfaces are treated differently from other disturbed surfaces because they are constantly being disturbed by the passage of vehicular traffic to varying degrees. This repeated disturbance churns the road surface material, breaks down aggregates, liquefies fine materials at depth when the road is wet and constantly exposes new fines from below, making them available for erosion. So although a road might only have 10% fines distributed throughout the profile, these are selectively forced to the surface during wet weather and removed by surface erosion. Consequently when one estimates 1 mm erosion from an active road surface, it means 1 mm of fine material is expected to be eroded. No discounting for coarser materials that may be on the surface is required because generally the coarse fragments are not transported unless there is mass wasting. A mass wasting component on the sample site will need to be evaluated using both the Components Tab and the Mass Wasting Tab. The original mass transport of failed soil material is considered within the Mass Wasting Tab of the App, whereas the exposed surface left behind and now subject to surface erosion that will be considered separately within the Surface Erosion Tab.

FREP Forest and Range Evaluation Program
Protocol for Evaluating the Potential Impact of Forestry and Range Use on Water Quality 2018
19
Besides the obvious differences in ease of recognizing their occurrence, it is important to separate mass wasting from surface erosion because of their different abilities to transport different classes of sediments. A storm flow induced gully on a road surface will generate a large portion of coarse material as compared with non channelized road surface erosion where only fines are transported. If concentrated flow has created substantial landslides, slumps, rills or gullies (> ½ m3 of material), they will be accounted for under mass wasting on the separate “Mass Wasting” Tab (see Section 4.2.4). When mass movement is associated with road fill, it will be necessary to estimate the portions of fines in the road prism as well as the coarse fraction, as all will be transported during a mass wasting event. The evaluation is designed to be performed with a single visit to each site, during which sediment volumes from surface erosion predicted to reach the creek from the site in the upcoming year are estimated. When more intensive analysis of a site is required, the Stream Characteristics Tab must be competed which will be discussed in Section 4.3 below. Surface erosion involves finer textured surface materials dislodged and segregated by the energy of raindrops12 and moved via sheet erosion down slope. It is an estimate of potential surface erosion that would occur on the site in the upcoming year13. Surface erosion is estimated by assessing the surface area and erosivity of different types of disturbed ground. In addition to their mass wasting contribution, the surface areas of new slumps and gullies should be inspected for ongoing surface erosion. See Figure 7 for an example of surface erosion contribution.
12
These estimates of potential surface erosion are made without considering variation in climate
throughout the province. This is because given the best climate data possible, the attempt to develop a meaningful provincial climatic erosion/sedimentation factor would be unrewarding. It is not yet possible to incorporate total rainfall, distribution of rainfall, intensity of rainfall, length of freeze up, number of thaws, nature of spring melt and how these factors interact with ongoing road management into any meaningful assessment of propensity to erode. 13
This estimate also reflects, on average, the minimum amount of soil erosion that would have occurred
over the previous year. This is a more realistic way of incorporating the sediment into the analysis as the licensee may have been planning to deactivate the road on the following day, in which case all predictions are meaningless. That is why the potential surface erosion and past mass wasting are added together to represent a reasonable assessment of the magnitude of sediment generation from a site over one year.

FREP Forest and Range Evaluation Program
Protocol for Evaluating the Potential Impact of Forestry and Range Use on Water Quality 2018
20
Figure 7 Example of Surface Erosion Contribution
4.2.3.1 Estimate Surface Area of Identified Components (Column 8) A surface area can be established by simply estimating lengths and widths of individual eroding surfaces of interest within the mini-catchment. Because of the order of magnitude nature of the evaluation results, estimations within 20 -30 % of actual distances are still reasonable. Range finders might be used initially to help evaluators who are unfamiliar with estimating distances. Evaluators should estimate first the total surface area of the component and then estimate the portion of the total surface area that is actually bare, and vulnerable to erosion. As in the completion of Column 3 on the Components Tab, which estimates portions of fines within the matrix, road surfaces must be considered differently from other components when assessing the erodible portion. This is because an active road is subject to ongoing disturbance from differing degrees of traffic and grading. The whole surface is always assigned a value of 1 for proportion erodible. Only if the road becomes inactive to the point that it supports vegetation growth, then the vegetated portions can be considered non erosive. For all other surfaces, this erodible portion measures the nature and condition of the surface material only and the degree to which the surface has become protected by gravel, stones, debris, or vegetation with the passage of time.

FREP Forest and Range Evaluation Program
Protocol for Evaluating the Potential Impact of Forestry and Range Use on Water Quality 2018
21
The Gross area (L x W) of component x Portion Erodible = Net Area (m2). The WQEE App calculates this area automatically.
4.2.3.2 Estimate Depth of Erosion for Surface of Each Component (Column 9a, 9b, 9c and 9d)
High erosion hazard sites that are disturbed and improperly managed initially experience high rates of surface erosion. With some materials, erosivity can fall off dramatically as the site self-armours14 or re-vegetates during the following growing season(s). For normal logging operations, the great majority of generated sediment occurs during the first year or two after road construction and harvesting. Eventually, road cutbanks, ditches and fill slopes either re-vegetate or self-armour thus greatly reducing surface erosion from those sources. Where disturbances are ongoing, such as on active roads, erosion products can be generated indefinitely if there is no change in management. The greater the disturbance, the greater the amount of sediment generated. Table 6 provides estimates of rates of erosion from disturbed surfaces other than road surfaces. For any component, only that portion of exposed, bare, fine textured soil is considered to be erodible and assigned an erosion rate of 1cm (0.01m). Cobble, gravel or even coarse sand surfaces, if undisturbed, are considered to be non-eroding and are not counted in the evaluation. For a newly excavated cutbank 100% of the surface could be subject to a high rate of surface erosion, whereas over time, as the surface is either re-vegetated or armoured, the portion of bare, eroded soil will drop proportionally and usually dramatically. After a few seasons, most cutbanks are covered by at least moss or algae and such coatings also indicate that the surface is no longer erosive. It is apparent from this table why heavy sediment generation is skewed towards new road construction and other recent disturbances. On landscapes with a soil matrix with a high silt content (or very fine sand) repeated needle ice formation can act as a continual disturbance of cutbank surfaces and result in chronic, long term sediment generation.
14 As finer materials are washed away by erosion, the coarser stony material within the soil matrix
remains behind to protect the surface from further erosion.

FREP Forest and Range Evaluation Program
Protocol for Evaluating the Potential Impact of Forestry and Range Use on Water Quality 2018
22
Table 6 Expected Annual Surface Erosion Expected on Surfaces Commonly Found Associated with Mini-Catchments
Surface Erosion Ratings
Typical Surface (other than road running surfaces) within Mini-Catchments Draining Forestry-Disturbed Sites
Estimated Annual Depth of Surface Erosion Expected under Existing Conditions15(m)
Nil Forest floor, cutbanks, sidecast, fill slopes or ditch lines with good moss, grass or litter cover or naturally or artificially armoured.16 (Generally associated with well established roads).
0
Bedrock outcrop in any location. 0 Colluvial/morainal stone rubble
gravel in any location. 0
High Disturbed forest floor, cutbanks, sidecast, fill slopes or ditch lines with bare, unvegetated, unarmoured, unconsolidated surface material (other than lacustrine). (Generally associated with new roads and other recent disturbances. After a road becomes established, often only a small portion of a cutbank or road ditch is subject to erosion.).
0.01
Natural or artificial surface with heavy live-stock use and presence of compacted bare soil.
0.01
Extreme Cutbanks, sidecast, fill slopes and ditches with no vegetation cover on stone-free, very fine sandy and silty lacustrine.
0.02+
Because of the wide variation in characteristics and processes contributing to surface erosion from forest roads, making accurate predictions of the amount of expected surface erosion from a gravel road is difficult. However it is not difficult to make order of magnitude estimates based on the wide range of literature dealing with sediment generation from gravel roads under a wide variety of conditions.
15
In most cases, any disturbed surface will be made up of a portion of non-eroding (vegetated or armoured) (0 mm surface erosion) or eroding (non-vegetated or non-armoured) (10 mm erosion). The evaluator should estimate the portion of bare soil within the component being considered and pro- rate the actual expected sediment generated from that slope. (i.e. a 50 x 3 meter cutbank with 60 % unarmoured and unvegetated = (150 m
2 x 0.6 x 0.01 m) = 0.9 m
3)
16A surface can be armoured artificially by placement of rip-wrap or naturally by revegetation and
selective removal of fines during rainfall leaving coarser, protective material on surface.

FREP Forest and Range Evaluation Program
Protocol for Evaluating the Potential Impact of Forestry and Range Use on Water Quality 2018
23
The estimates of surface erosion used in the methodology are anchored to research literature that show that gravel roads experience a wide range of sediment generation depending on their particular characteristics and management. Measured depths of surface erosion on gravel roads throughout North America fall into a range between 0.5 mm to 50 mm per year depending on climate, amount of traffic, condition of surfacing material and length and gradient of any road segment. (Coe, D.B., 2006, Dunne and Reid, 1984, Cederholm, 1980.) In terms of volume of fine sediment generated per 100 meters or road, these erosion depths would generate between 0.25 m3 to 25 m3 of fine textured sediment (1/50th to 3 dump truck loads) per 100 meter segment of road each year. As a road’s use increases, or with increased grader passage, the migration of fines to the surface increases, which in turn increases the potential rate of erosion. Less used road surfaces have greater opportunity for at least temporary self armouring and therefore reduced levels of surface erosion. Based on simple verification techniques conducted over a wide range of locations throughout British Columbia, erosion rates between 0.0 mm and 20 mm depth were chosen to represent the range of surface erosion likely to occur on forestry roads under normal conditions throughout the province. This corresponds to a range of 0.0 m3 to 10 m3 of fine sediment generation per 100 meters of road. Most active road surfaces will fall somewhere between these two extremes. Table 7, Table 8, and Table 9 provide approximate rates of expected road surface erosion associated with roads located on different slope gradients with differing degrees of use and quality of materials. Slopes are determined by measuring the average slope gradient of the road surface from the receiving waters to the farthest edge of the mini-catchment boundary. They are put into three classes: gentle (< 2%), moderate (2-10%) and steep (>10 %) in Column 9a of the Surface Erosion Tab in the WQEE App. The proportional erosion values determined from these thresholds (0.5, 1.0 and 2) were based on the average values for Revised Universal Soil Loss Equation (RUSLE) developed for a road segment of 100 meters (which reflects average culvert spacing density). Road use categories include heavy, moderate, light and deactivated and are input in Column 9b. Road capping quality depends on the relative amount and nature of materials laid down. A 15 cm crushed granite capping on a firm road bed is best, and native material made up from fine textured soils, the worst (Column 9c). In the event that the evaluator is not familiar with how to assess road surface material quality on a given road system, they should default to average values. This is important to remember because less experienced evaluators tend to rate dry roads as good and wet roads as poor based solely on the how

FREP Forest and Range Evaluation Program
Protocol for Evaluating the Potential Impact of Forestry and Range Use on Water Quality 2018
24
the road looked on the day the observation was made. To be effective, the assessment must come up with the same numbers regardless of the weather.
Table 7 Showing Predicted Depths of Surface Erosion (m) from Road Surface <2% Slope Gradient under Differing Conditions17
<2% Slope Road Surfacing Quality
Road Use
Paved or Coarse Ballast Good Average Poor
Heavy use, all season road 0 0.001 0.002 0.005 Moderate use, all season road 0 0.0005 0.001 0.002 Light seasonal use (4x4 and occasional logging truck)
0 0.0002 0.0005 0.001
Deactivated (and unused) 0 0.0001 0.0002 0.0005
Table 8 Showing Predicted Depths of Surface Erosion (m) from Road Surface of 2-10% Slope Gradient under Differing Conditions
2-10% Slope Road Surfacing Quality
Road Use
Paved or Coarse Ballast Good Average Poor
Heavy use, all season road 0 0.002 0.005 0.01 Moderate use, all season road 0 0.001 0.002 0.005 Light seasonal use (4x4 and occasional logging truck)
0 0.0005 0.001 0.002
Deactivated (and unused) 0 0.0002 0.0005 0.001
Table 9 Showing Predicted Depths of Surface Erosion (m) from Road Surface of >10% Slope Gradient under Differing Conditions
>10% Slope Road Surfacing Quality
Road Use
Paved or Coarse Ballast Good Average Poor
Heavy use, all season road 0 0.005 0.01 0.02 Moderate use, all season road 0 0.002 0.005 0.01 Light seasonal use (4x4 and occasional logging truck)
0 0.001 0.002 0.005
Deactivated (and unused) 0 0.0005 0.001 0.002
17
Note: Estimates are based in part on the Revised Universal Soil Loss Equation (RUSLE) combined
with observations of behaviour of wide range of forestry- disturbed surfaces and their sediment generating capacity. It is the relative rate of sediment generation between different surfaces that is important to the evaluation. The absolute numbers given here for annual rates of surface soil erosion should be considered order of magnitude estimates.

FREP Forest and Range Evaluation Program
Protocol for Evaluating the Potential Impact of Forestry and Range Use on Water Quality 2018
25
4.2.3.3 Calculated Volume of Material Removed by Surface Erosion (Column 10 (Column 8C x9d))
By multiplying the results from Column 8 and 9 together, we can get a value for the expected annual volume in m3 of sediment removed by surface erosion of the component under consideration. This estimate is based on what might be expected to happen to the given component averaged over a few years to take into account normal variation in weather and management. The WQEE App calculates this value automatically.
4.2.3.4 Calculated Total Sediment Contribution from Surface Erosion (Column 11 (Column 2 x Column 10))
The product of Column 2 (giving the portion of sediment bearing artificial drainage reaching the stream) and Column 10 (which gives the total volume of material removed by erosion) provides an estimate of the total sediment load received by the water body from surface erosion. The WQEE App calculates this value automatically.
4.2.3.5 Calculated Fine Sediment Contribution from Surface Erosion (Column 12 (Column 3 x Column 11))
When considering water quality degradation caused by sediment, it is only the finer particle classes that contribute to turbidity18. In low gradient streams, all particles larger than medium sands are transported as bed loads and do not influence turbidity. In more turbulent streams, coarse sand may be temporarily suspended. Column 12 makes an adjustment for those surfaces that are less likely to be able to transport larger particles sizes to the stream. The WQEE App calculates this value automatically. The App also calculates the coarse textured sediment (>1mm diameter) reaching the stream. This is presented separately under the Summary Tab. By adding the total fine sediment contribution from mass wasting and surface erosion components, we get the total fine sediment contribution for the site, which is presented on the summary tab.
18
Medium sand and coarser sediments may have a serious effect on fish habitat (spawning grounds,
infilling of natural pools, etc.).

FREP Forest and Range Evaluation Program
Protocol for Evaluating the Potential Impact of Forestry and Range Use on Water Quality 2018
26
4.2.4 Mass Wasting Tab The Mass Wasting Tab of the WQEE App is shown in Figure 8.
Figure 8 Mass Wasting Tab in the WQEE App
4.2.4.1 Estimate Mass Wasting Contribution WQEE (Column 1) The evaluator is asked in column 1 to differentiate between the three major types of mass wasting (Road fill slope failures, Gullies and Landslides or Slumps). If there is no mass wasting contribution or if volumes are small (< 0.5 m3), the evaluator can ignore mass wasting tab altogether and proceed with the onsite investigation. Skipping mass wasting contributions will be the norm for many sites being evaluated as mass wasting events are uncommon. Occasionally, however, sediment delivered from mass wasting will overwhelm sediment generated from surface erosion. The mass wasting component does not require an assessment of connectivity because the portion reaching the stream is calculated differently. The mass wasting component does require a measure of the portion of fines within the matrix regardless of any evident self armouring. Unlike road surfaces where fines are selectively removed, mass failures from roads do not selectively remove fines. The portion of fines selected for most road fill materials that have experienced mass wasting will be (0.2) “a little”.

FREP Forest and Range Evaluation Program
Protocol for Evaluating the Potential Impact of Forestry and Range Use on Water Quality 2018
27
4.2.4.2 Estimate Portion of Fine and Coarse Sediment in the Failed Material (Column 3)
A failed slope is made up of unconsolidated material, in the example shown in Figure 9 with a portion of fines (50%) and coarse material (50%). A simple visual estimate of the portion of fines within the matrix is good enough for the purposes of the protocol. Values chosen include estimates of;
None: 0.0 fines
A little: 0.2 fines
Half: 0.5 fines
A lot: 0.8 fines
All 1.0 fines
4.2.4.3 Estimate Volume of Material Removed by Mass Wasting (Column 4) To assess the contribution of mass wasting and gullying processes to water quality degradation, the evaluator must observe what obvious erosion (>1/2 m3) has already occurred on site. Immediate past degradation of sites by slides and gullying is easy to recognize. The more recent the mass failure, the more obvious the remaining evidence. An estimate of length, width and depth (L x W x D) of landslide scars, gullies or rills provides the volume of the material eroded from the site. These values need only be approximate as their relative magnitude will be sufficient for this evaluation19.
4.2.4.4 Estimate Volume of Failed Material Still on Site (Column 5) Depending on the nature of the terrain down slope from a failure, the volume of material recaptured can be substantial. Broad alluvial terraces may capture virtually all of the failed material from upslope. Failures on cutbanks may end up mostly on road surfaces and thus do not reach a natural drainage enmasse.20 These materials may be removed by road maintenance and not have the chance to impact water quality. Only those mass wasted materials that have reached the stream are considered in the mass wasting portion of the evaluation. On the other hand, fill slopes directly above a stream channel may send all failed material directly into a stream. The evaluator must determine the volume of failed material still on site by roughly estimating the dimensions of the failure run-out materials.
4.2.4.5 Calculated Total Volume of Sediment Reaching Stream (Column 6) To estimate how much sediment actually enters the stream, the WQEE App compares the volume of material estimated to have failed with the volume of material still on the site. This is done by subtracting total volume of sediment initiated in mass failure from that still found on site. Again the Protocol is
19
If the slide occurred more than one year before the visit, the evaluator can apportion the volume to give a sediment load per annum. (The volume estimated from a 5 year old slide would be divided by 5 to give a proxy for an annual contribution). 20
However the disturbed surface material from a slide may be subject to surface erosion which is considered separately under Column 8 in Surface Erosion tab.

FREP Forest and Range Evaluation Program
Protocol for Evaluating the Potential Impact of Forestry and Range Use on Water Quality 2018
28
interested in orders of magnitude (0.1 m3, 1 m3, 100 m3, etc.) not precise figures.
4.2.4.6 Calculated Volume of Fine and Coarse Sediment from Mass Wasting Reaching Stream (Column 7)
Unlike surface erosion, erosion by mass failures is not selective about the particle size classes that it transports. Large rocks, stones, and gravel as well as finer textured materials are transported down slope with landslides. Gullies incise downward until the base of the gully becomes armoured or a sufficient low gradient is achieved to reduce discharge velocities. In order to determine the effect that the sediment will have on water quality, one must consider portion of fines in relation to the coarser material involved in the initial mass failure or gully incision. This is done by multiplying the portion of fine material in the slide matrix with the total amount of failed material reaching the stream. This result is expressed in m3 of fine sediment and is calculated automatically by the WQEE App. For some applications, where stream channel characteristics are considered important, the coarse sediment delivered to the stream strongly influences stream channel characteristics. The coarse sediment load is the difference between the total sediment and the fine sediment delivered to the stream. This value may be of particular interest where pool infilling of channels is a concern. A simple example of a landslide at a forestry-disturbed site is provided in Figure 9. Table 10 shows a summary of fine sediment generated from mass wasting at this site.

FREP Forest and Range Evaluation Program
Protocol for Evaluating the Potential Impact of Forestry and Range Use on Water Quality 2018
29
Figure 9 Example of Mass Failure: Landslide Adjacent to Creek Caused by Excess Road Drainage on Class V Slope
Table 10 Summary of Fine Sediment Generated from Mass Wasting at Site Depicted in Figure 9
Landslide Caused by Excess Ditch Drainage (on “Shallow over Steep” Terrain)
Component is identified as a landslide surface Portion of fine sediment = 50% (estimated
visually)
Volume of surficial material moved = 20 x 10 x 1 = 200 m3 Volume of failed material still on site = 40 x 2 x 2 = 160 m3 Total volume of sediment reaching creek
= 200 m3 - 160 m3 = 40 m3
Volume of fine sediment from failure reaching creek
= 40 m3 x 0.5 = 20 m3
Volume of coarse sediment from failure reaching creek
= 40 m3 x 0.5 = 20 m3
Note: Most new landslide surfaces will also have a surface erosion component that should be considered in the evaluation.

FREP Forest and Range Evaluation Program
Protocol for Evaluating the Potential Impact of Forestry and Range Use on Water Quality 2018
30
4.2.5 Range Tab The Range Tab of the WQEE Protocol is shown in Figure 10.
Figure 10 Range Tab in the WQEE App
For evaluators working in regions of the Province with extensive livestock utilization of rangeland and presence of domestic water intakes on local streams, an evaluation of potential livestock effect on water quality is required. A checklist of Range Condition Indicators (Figure 11) is used to conduct this evaluation. Indicators considered in this checklist include:
Grazing of Plant Community
Damage to Ground Surface
Damage to Stream Bank and Channel
Presence of Livestock Dung
Observed presence or absence of best range management practices

FREP Forest and Range Evaluation Program
Protocol for Evaluating the Potential Impact of Forestry and Range Use on Water Quality 2018
31
This form should be completed only if two conditions are both met while completing the WQEE. These being;
1. There is a drinking water intake with 10 km downstream from the site, and
2. Livestock presence is noted around sampling site. Some areas with high rural population densities and a high proportion of range land, such as around Kamloops or Vernon, may be filling out this section at every site. Other districts are unlikely to ever use this form at all.
This checklist was developed with the assistance of the Range Branch and is a subset of the range characteristics normally evaluated when assessing range conditions. The primary purpose of filling in this checklist is to provide a description of the nature of livestock disturbance when it might lead to water quality degradation.
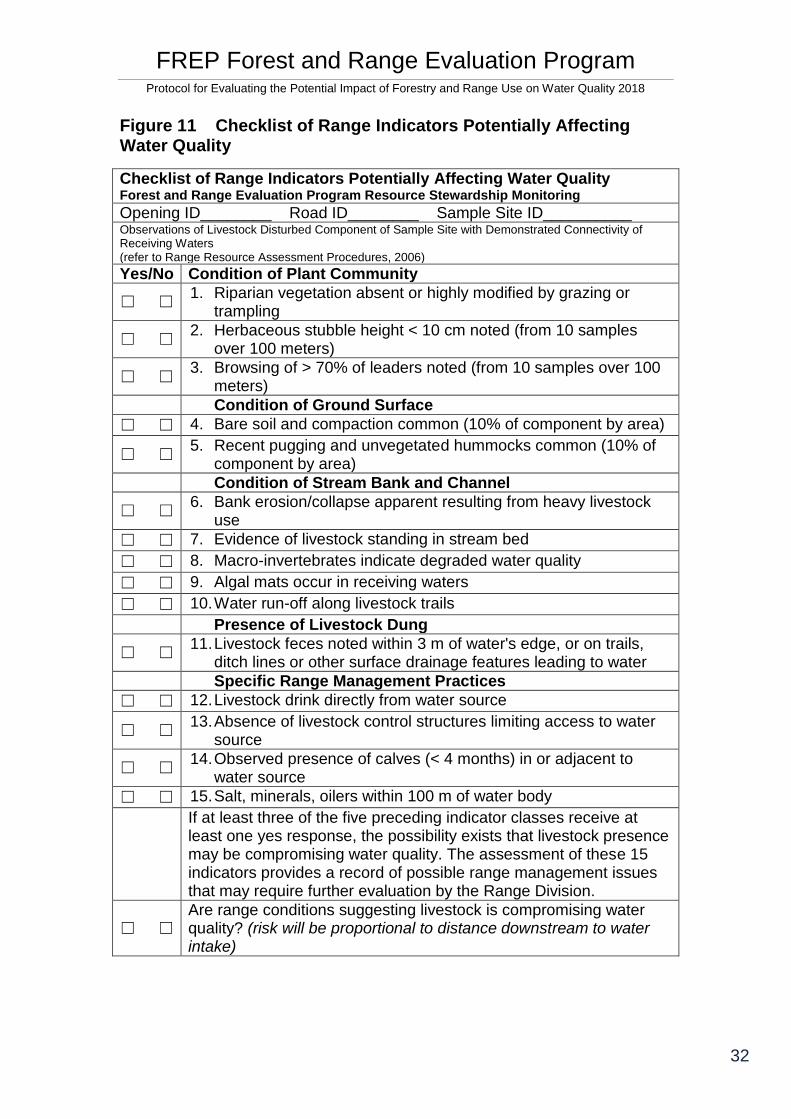
FREP Forest and Range Evaluation Program
Protocol for Evaluating the Potential Impact of Forestry and Range Use on Water Quality 2018
32
Figure 11 Checklist of Range Indicators Potentially Affecting Water Quality
Checklist of Range Indicators Potentially Affecting Water Quality Forest and Range Evaluation Program Resource Stewardship Monitoring
Opening ID________ Road ID________ Sample Site ID__________ Observations of Livestock Disturbed Component of Sample Site with Demonstrated Connectivity of Receiving Waters (refer to Range Resource Assessment Procedures, 2006) Yes/No Condition of Plant Community
☐ ☐ 1. Riparian vegetation absent or highly modified by grazing or
trampling
☐ ☐ 2. Herbaceous stubble height < 10 cm noted (from 10 samples
over 100 meters)
☐ ☐ 3. Browsing of > 70% of leaders noted (from 10 samples over 100
meters)
Condition of Ground Surface
☐ ☐ 4. Bare soil and compaction common (10% of component by area)
☐ ☐ 5. Recent pugging and unvegetated hummocks common (10% of
component by area)
Condition of Stream Bank and Channel
☐ ☐ 6. Bank erosion/collapse apparent resulting from heavy livestock
use
☐ ☐ 7. Evidence of livestock standing in stream bed
☐ ☐ 8. Macro-invertebrates indicate degraded water quality
☐ ☐ 9. Algal mats occur in receiving waters
☐ ☐ 10. Water run-off along livestock trails
Presence of Livestock Dung
☐ ☐ 11. Livestock feces noted within 3 m of water's edge, or on trails,
ditch lines or other surface drainage features leading to water
Specific Range Management Practices
☐ ☐ 12. Livestock drink directly from water source
☐ ☐ 13. Absence of livestock control structures limiting access to water
source
☐ ☐ 14. Observed presence of calves (< 4 months) in or adjacent to
water source
☐ ☐ 15. Salt, minerals, oilers within 100 m of water body
If at least three of the five preceding indicator classes receive at least one yes response, the possibility exists that livestock presence may be compromising water quality. The assessment of these 15 indicators provides a record of possible range management issues that may require further evaluation by the Range Division.
☐ ☐ Are range conditions suggesting livestock is compromising water quality? (risk will be proportional to distance downstream to water intake)

FREP Forest and Range Evaluation Program
Protocol for Evaluating the Potential Impact of Forestry and Range Use on Water Quality 2018
33
4.3 Task III: Assign Thresholds for Water Quality Impacts
4.3.1 Stream Characteristics Tab Figure 12 shows the stream characteristics tab of the WQEE Protocol.
Figure 12 Stream Characteristics Tab
4.3.2 Standard Evaluation For the standard evaluation estimated volumes of fine sediment generated at each site are then assigned to different classes as shown in Table 11. The thresholds for different classes were originally determined by a group of specialists.21 Each was asked to judge their concern over the sediment generation capacity of the site under observation and that in turn was compared to the actual values calculated by the protocol. There was a consensus among all those involved that the thresholds of concern were appropriate, and mirrored the general classes of very low, low, moderate, high and very high water quality impact. Sediment Generation Potential Classes reflect the absolute magnitude of impact on forestry-related disturbances upon the whole drainage network
21
Including road builders, grade management crews, sedimentologists, fisheries officers and water
purveyors.

FREP Forest and Range Evaluation Program
Protocol for Evaluating the Potential Impact of Forestry and Range Use on Water Quality 2018
34
being considered. The thresholds chosen for site sediment generating potential classes broadly reflect levels of management undertaken at the site. With better management, we expect to lower the sediment generating potential from evaluated sites.
Table 11 Rating of Total Fine Sediment Generation from Site (Independent of Stream Size)
Total Volume of Fine Sediment Generated (WQ Index)
Site Sediment Generation Potential Classes
General Level of Management
< 0.2 (m3) very low Good 0.2 - 1 (m3) low 1 - 5 (m3) moderate 5 - 20 (m3) high > 20 (m3) very high Poor
The break down of the Site Sediment Generation Potential into these classes provides the appropriate detail for rating water quality impacts. These general classes have been used to rate the outcome of the water quality effectiveness evaluation field seasons since 2007. These results provide the Ministry of Forests and Range and the Licensee with a means to prioritize water quality impacts of specific sites requiring improvements to management. The rating system provides the government with an independent assessment of how well Licensees are maintaining water quality in a Results Based Management System. “Very Low” and “Low” values indicate that no action is required,” Moderate”, that some concerns are noted and “High” and “Very High”, that major water impact problems exist at the landscape level. However, that is the extent of its value. If the watershed manager has specific concerns about a particular intake or a particular stretch of stream, a meaningful assessment would require a more intensive investigation of a range of variables.
4.3.3 Water Quality Protocol as a Framework for More Intensive Water Quality Evaluations
The initial routine/extensive level of assessment provided by the WQEE Protocol provides a preliminary level of evaluation. It is a screening mechanism for raising flags on specific sites indicating different levels of potential water quality impact. For more refined evaluations, when required at specific sites, the original assumptions made to determine the general significance of the fine sediment generating capacity must be revisited. Independent factors besides the amount of sediment generated at the site must be considered to properly assign water quality impacts of a specific disturbance. On streams with a low discharge, low background turbidity and high downstream values (fish or water intake), small fine sediment additions may

FREP Forest and Range Evaluation Program
Protocol for Evaluating the Potential Impact of Forestry and Range Use on Water Quality 2018
35
have severe environmental consequences. Conversely, for streams with high discharge, high background turbidities and few downstream values, large volumes of sediment generated at a site may result in no significant environmental degradation. In this more intensive evaluation three factors; stream discharge, duration of a turbidity event and the consequence for the fishery resource are considered. Only the background water quality of the stream at the time of sediment generation is not considered. Whether the upstream water is normally clear or muddy does not alter the impact rating. This factor is excluded from the evaluation because seasonal water quality data is often lacking.
4.3.4 Complexities Associated with Discharge of Stream receiving Sediment
For the Protocol, it was assumed that most sediment is generated during bankfull capacity, which is much greater than low flows but somewhat less than peak flows. The Ministry of Forest uses a simple stream classification to indicate the relative importance of fish streams based on stream width at bankfull capacity. Wider stream channels are likely to discharge more water than narrow stream channels, and theoretically, be more important to fish. The thresholds of impacts to water quality for the original WQEE Protocol were based on the discharge of receiving streams being 1 m3/sec. This stream discharge was used as it reasonably represented a mid size stream at bankfull capacity. For evaluators not familiar with stream discharges a simple table can be used for estimating actual discharge at time of visit (Table 12). Additionally there are photo examples contained on the WQEE App under the Stream Characteristics tab.

FREP Forest and Range Evaluation Program
Protocol for Evaluating the Potential Impact of Forestry and Range Use on Water Quality 2018
36
Table 12 Used for Estimating Actual Stream Discharge at Time of Visit
Estimated bankfull discharge
Ease of crossing drainage during rainstorm or flood
MoFR Stream Classification (Fish)
Bankfull width
Estimated time to fill imagined container during bankfull discharge
1 L/s Can block stream for second with boot
S4 <0.5 m 4 sec to fill ice cream bucket
10 L/s Can step across S4 <0.5 m 4 sec to fill 10 gallon aquarium
100L/s Can jump across S4 0.5-1.5 m 2 sec to fill bathtub
1000L/s or 1 m3/s
Can walk/wade across
S3 1.5-5 m 2 sec to fill hot tub
10 m3/s Can walk on a log across
S2 5-20 m 10 sec to fill backyard swimming pool
100 m3/s Can throw a stone across
S1 >20 m 10 seconds to fill Olympic size pool
For more specific, on- site investigations or to investigate cumulative impacts of multiple disturbances on a watershed, a more rigorous assessment of discharge is required.
4.3.5 How to Estimate Discharge using the WQEE App The more intensive version (using the Stream Characteristics Tab) of the WQEE protocol uses Manning’s formula to estimate discharge of a stream during bankfull capacity at the site undergoing investigation. To conduct this evaluation requires an estimate of:
Stream width at bankfull capacity
Stream depth at bankfull capacity
Stream slope gradient
Roughness of the stream channel22 The methodology used by the protocol is provided in Figure 13, 14 and 15. The reader should note that while these figures outline how the results are obtained, the evaluator does not need to conduct the calculations nor be familiar with conversions. This is all accomplished automatically within the WQEE App.
22
Tables are provided to select a dimensionless number that represents the roughness of the river channel. A sand bottom is the least “rough” whereas boulders and thick brush make for very “rough” stream channels. The rougher the stream channel, the more resistance flowing water will experience and the slower will be the stream’s velocity.

FREP Forest and Range Evaluation Program
Protocol for Evaluating the Potential Impact of Forestry and Range Use on Water Quality 2018
37
Figure 13 Stream Characteristics Used to Evaluate Discharge and Turbidity Impact
a. Estimated discharge at time of visit (see Table 12) ________ m3/s b. Wetted width at bankfull capacity (w) (see Figure 15) _________m c. Average depth of water at bankfull capacity (d) (see Figure 15)______m d. Stream Cross Section (w x d) (see Figure 15) __________ m2 e. Wetted Perimeter (A) w + 2 d (see Figure 15) __________m f. Effective Radius of Stream
(Stream Cross Section / Wetted Perimeter A/P) ___________m g. Stream Channel Gradient (%) ___________% h. Manning Coefficient of roughness n (dimensionless) __________
Sand = 0.2
Gravel= 0.3
Cobbles= 0.4
Boulders= 0.6
Heavy Brush= 0.8
i. Average Velocity of Stream (m/sec)(Using Manning’s Formula) Manning’s Formula V= R2/3 S ½/n Where;
V= Average Velocity of Stream (m/s)
R= Effective Stream Radius (m)
S= Stream Channel Gradient (%)
n= Hydraulic Roughness _________m/sec j. Discharge (D) m3 per sec (Average Stream Velocity x Stream Cross section) turbidity increase over duration _________ m3/sec
Based on the calculated discharge and the volume of fine sediment generated at the site, this provides a simple means to determine the expected increase to downstream turbidity one might expect over a given time period. This calculation is shown in the Water Quality Characteristics box below in Figure 14.
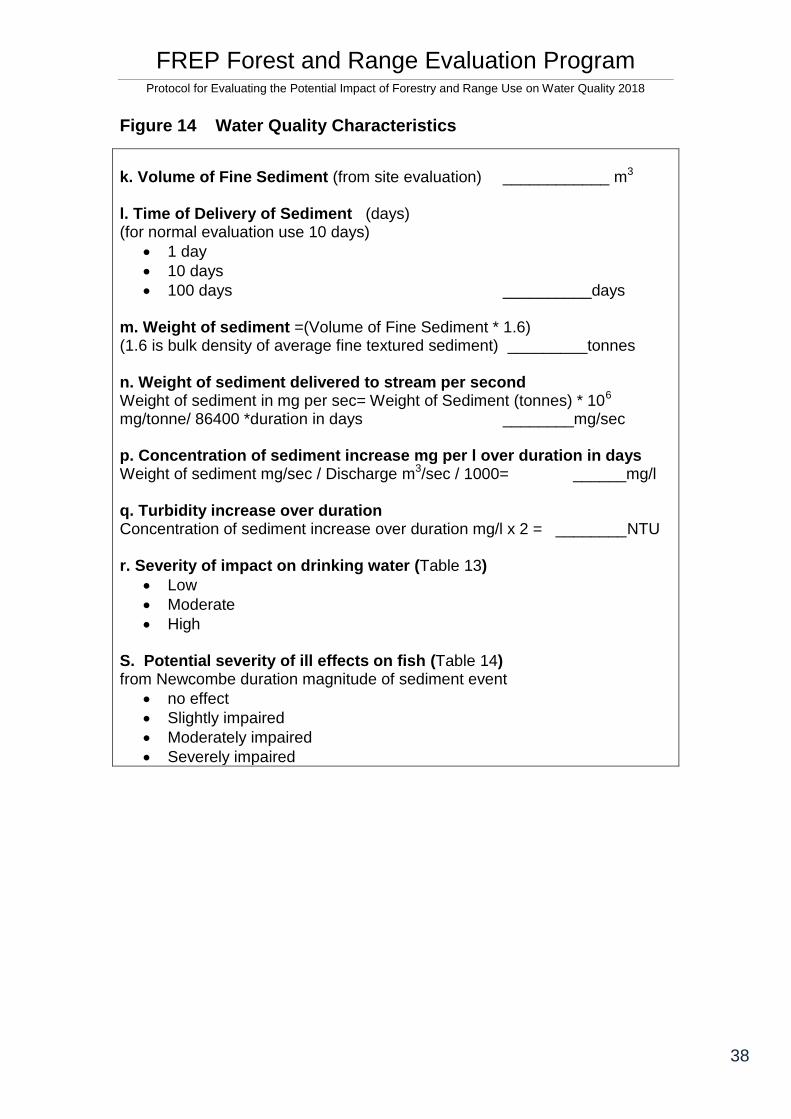
FREP Forest and Range Evaluation Program
Protocol for Evaluating the Potential Impact of Forestry and Range Use on Water Quality 2018
38
Figure 14 Water Quality Characteristics
k. Volume of Fine Sediment (from site evaluation) ____________ m3 l. Time of Delivery of Sediment (days) (for normal evaluation use 10 days)
1 day
10 days
100 days __________days m. Weight of sediment =(Volume of Fine Sediment * 1.6) (1.6 is bulk density of average fine textured sediment) _________tonnes n. Weight of sediment delivered to stream per second Weight of sediment in mg per sec= Weight of Sediment (tonnes) * 106 mg/tonne/ 86400 *duration in days ________mg/sec p. Concentration of sediment increase mg per l over duration in days Weight of sediment mg/sec / Discharge m3/sec / 1000= ______mg/l q. Turbidity increase over duration Concentration of sediment increase over duration mg/l x 2 = ________NTU r. Severity of impact on drinking water (Table 13)
Low
Moderate
High S. Potential severity of ill effects on fish (Table 14) from Newcombe duration magnitude of sediment event
no effect
Slightly impaired
Moderately impaired
Severely impaired

FREP Forest and Range Evaluation Program
Protocol for Evaluating the Potential Impact of Forestry and Range Use on Water Quality 2018
39
Figure 15 Stream Channel Cross Section
5.3.5 Severity of Impact on Drinking Water Thresholds of concern for drinking water quality have been adopted based on the premise that any turbidity level that impedes chlorination or other water treatments from destroying fecal coliform is a concern. Table 13 provides an example of how the evaluator might assign thresholds for increased turbidity of raw water. The > 5 NTU threshold limit for a high rating was tied to the normal threshold of turbidity the Ministry of Health uses to invoke a boiled water notice23. This would apply only to those streams where there is a run of river intake immediately downstream of the site and chlorination was the only treatment available. If the site is high up in the watershed, the dilution effect will greatly lessen any turbidity increase downstream.
Table 13 Thresholds for Increased Turbidity at Intake
Increase in turbidity at intake contributed by sample sites evaluated in watershed (NTU)
Cumulative impact threshold on water quality at site
<1 Low
1-5 Moderate
>5 High
23 At turbidities above 5 NTU, chlorine disinfection is no longer effective. Obviously if water is treated by
settling ponds, filtration and or flocculation before chlorination these thresholds are irrelevant.

FREP Forest and Range Evaluation Program
Protocol for Evaluating the Potential Impact of Forestry and Range Use on Water Quality 2018
40
5.3.6 Potential Severity of Ill Effects on Sensitive Fish Should fisheries resources be considered, we borrow heavily from (Newcombe C.P and D.D. MacDonald, 1991)24 in which the most exhaustive work on turbidity and clear water fish health has been completed. By comparing Table 13 and Table 14, we see that the threshold concentration of concern for sensitive fish is much higher than that for drinking water. More information on Newcombe’s work on sensitive fish is provided in Appendix 3.
Table 14 Turbidity level (and suspended sediment concentration) and the potential for ill Effects for Clear Water or Sensitive Fish
Duration of Turbidity Event
Severity of ill effects for sensitive fish (trout and salmon) 1day 10 days 100 days
No effect <10 NTU (<20mg/l)25
<5 NTU (<10 mg/l)
<1 NTU <2 mg/l)
Slightly Impaired 10-50 NTU (20-100mg/l)
5-20 NTU (10-40 mg/l)
1-5 NTU (2-10 mg/l)
Moderately Impaired
50-500 NTU 100- 1000 mg/l
20-100 NTU 40-200 mg/l
5-50 NTU 10-100 mg/l
Severely impaired >500 NTU (>1000mg/l)
>100 NTU (>200 mg/l)
>50 NTU (>100 mg/l)
5.4 Task IV: Determine Management Option to Reduce Impacts The selection of appropriate management options to reduce or prevent sediment entering streams strongly influence whether water quality degradation will occur. This task will help the evaluator to determine how management has influenced fine sediment generation, how that sediment load will impact downstream values and, where required, determine what changes to management at a site could minimize that negative impact. The Summary Tab of the WQEE App is shown in Figure 16.
24 Newcombe, C.P. and D.D. MacDonald. 1991. Effects of Suspended Sediments on Aquatic
Ecosystems. North American Journal of Fisheries Management. 11: 72-82 25
The relationship between turbidity and concentration of suspended sediment is complex, dependant on particle size and amount of organic matter. From the literature we have chosen an average conversion rate of 1 ntu = 2 mg/l which is used throughout this report.

FREP Forest and Range Evaluation Program
Protocol for Evaluating the Potential Impact of Forestry and Range Use on Water Quality 2018
41
Figure 16 Summary Tab in the WQEE App
The assessment of water quality effectiveness requires that the evaluator be familiar with forestry operations associated with roads and harvesting. They must recognize what sort of practices put water quality at risk and what management opportunities are available to minimize that risk. A tentative list of practices that might reduce sediment generation is considered in Table 15. For the routine assessment, Table 11 is used to determine the significance of a given sediment volume into a stream. For more intensive assessments, where changes to downstream turbidity have been estimated, Table 13 and Table 14 are used. From Table 11 if we determine that impacts are very low or low, we consider management has avoided impacting water quality and consequently, the Licensee’s management can be considered to be effective. When moderate, high or very high levels of sedimentation were observed at a site, management has been proportionally less effective. In the same manner for more intensive evaluations Table 13 and Table 14 indicate that a turbidity increase of greater than 5 NTU for drinking water and 50 NTU for fish will have a significant negative impact on water quality and should trigger further examination.

FREP Forest and Range Evaluation Program
Protocol for Evaluating the Potential Impact of Forestry and Range Use on Water Quality 2018
42
Whenever a moderate, high or very high water quality impact or impairment was observed, suggestions of opportunities for improvement are provided in Table 15. The evaluator will choose one or more means to mitigate the water quality impact at the site. Other observations may also be desirable and should be noted under the Comments Tab.
Table 15 Checklist of Possible Solutions to Reduce Fine Sediment Generation
Activity of Concern Possible Means to Reduce Stream Sedimentation
Location of Road (To be considered in future road alignments)
1. Locate road away from stream. 2. Avoid steep unstable slopes and ensure adequate engineering of alignment. 3. Avoid stream crossings where lay of land requires road approaches with long gradients flowing towards stream.
Design of Road and Cutblock (To be considered in future road drainage and cutblock boundary design)
4. Avoid deeply dug ditches in proximity to streams. (Possibly use rock ballast to raise road.) 5. Plan for sufficient number of strategically located culverts to avoid excess drainage water concentration. 6. Design bridge deck to be slightly higher than road grade, with gentle slope away from the bridge. 7. Design narrower road that follows natural breaks in topography to channel surface water safely off road away from natural drainage. 8. Ensure that remaining trees left within riparian zone are wind firm.
Construction/Harvesting (To be considered during construction of road and harvesting of cutblocks)
9. Avoid soil disturbance wherever possible. 10. Armour, seed or spread out logging debris over disturbed area to protect soil. 11. Avoid wet areas or use brush mats to avoid compaction and incision of skid trails. 12. Use good quality road subgrade and capping materials. 13. Place rock armouring over areas of concentrated flow. 14. Construct sediment basin capable of handling coarse sediment expected from new road construction.
Management/Maintenance (To be considered during ongoing management and maintenance of road and cutblock)
15. Ensure good quality road fill and surfacing used and grader produces crowned road. 16. Remove and/or manage grader berms. 17. Reduce or prevent vehicular traffic during very wet weather or just after spring thaw. 18. Reduce unnecessary use of all vehicular traffic on road. 19. Fall away, yard away or clean stream to former conditions. 20. Improve range management by reducing livestock damage within riparian zone.
Deactivation (Seasonally or permanently)
21. Install strategically placed cross ditches, water bars and ditch blocks. 22. Pull back and end haul unstable road fill to safe location. 23. Pull culverts and armour crossing.
Other Other information to be added to Comments Tab

FREP Forest and Range Evaluation Program
Protocol for Evaluating the Potential Impact of Forestry and Range Use on Water Quality 2018
43
5 Conclusion The water quality protocol provides a means to evaluate the impact of a given site on water quality. It does so firstly, by determining how much fine sediment from a site is transported to the stream and secondly by estimating the actual increase of turbidity expected immediately downstream from the site. From this information, the land manager can more effectively prioritize sites requiring improvement to management and, in addition, what actions might be used to reduce those impacts. The use of the WQEE digital App is strongly recommended over the use of original paper field cards. The App standardizes evaluator observations, avoids calculation errors and greatly facilitates the ease of data collection, transfer and analysis. The digital App has also been designed for eventual use on cumulative impact assessments within watersheds. This use is presently being tested. As FREP WQEE evaluations become more focused on specific land management issues, appropriate sampling procedures will be developed for those issues.

FREP Forest and Range Evaluation Program
Protocol for Evaluating the Potential Impact of Forestry and Range Use on Water Quality 2018
44
6 References Beaudry, P.G. 2004. A water quality indicator for sustainable forest management: the SCQI
experience. Pages 157-162 in G.J. Scrimgeour, G. Eisler, B. McCulloch, U. Silins and M. Monita. Editors. Forest Land–Fish Conference II – Ecosystem Stewardship through Collaboration. Proc. Forest-Land-Fish Conf. II, April 26-28, 2004, Edmonton, Alberta.
Carson, B.R. and Michael Younie. 2003. Results Based Forest Road Management to Maintain Water
Quality in Coastal Watersheds. CD produced under Contract CLM02-13. Ministry of Water, Land and Air Protection.
Cederholm C. J., L. M. Reid, E. 0. Salo, 1980. Cumulative Effects Of Logging Road Sediment On
Salmonid Populations In The Clearwater River, Jefferson County, Washington. Presented to the conference “Salmon-Spawning Gravel: A Renewable Resource in the Pacific Northwest?” Contribution No. 543, College of Fisheries, University of Washington.
Coe, D.B. 2006. Sediment Production and Delivery from Forest Roads in the Sierra Nevada, California.
Department of Forest, Rangeland, and Watershed Stewardship. In partial fulfillment of the requirements For the Degree of Master of Science. Colorado State University, Fort Collins, Colorado.
Fraser, D.A. 2006. Range Resources Assessment Procedures. BC Ministry of Forests and Range.
Range Branch, Kamloops B.C. Rangeland Health Brochure 9. FREP Water Quality Home page 2018 https://www2.gov.bc.ca/gov/content/industry/forestry/managing-our-forest-resources/integrated-resource-monitoring/forest-range-evaluation-. program/frep-monitoring-protocols/water-quality Forest Practices Code. (FPC) 2002. Forest Road Engineering Guidebook. 2nd Edition. Ministry
of Forests, Victoria B.C. Luce, Charles H.; Black, Thomas A. 1999. Sediment production from forest roads in western
Oregon. Water Resources Research. 35(8): 2561-2570. Newcombe, C.P. and D.D. MacDonald. 1991. Effects of Suspended Sediments on Aquatic
Ecosystems. North American Journal of Fisheries Management. 11: 72-82. Newcombe, C.P. 1996. Channel Sediment Pollution: A Provisional Fisheries Field Guide for
Assessment of Risk and Impact. Habitat Protection Branch. MELP. Victoria, B.C. Newcombe, C.P. J.O.Jensen. 1996. Channel Suspended Sediment and Fisheries: A synthesis
for Quantitative Assessment of Risk and Impact. North American Journal of Fisheries Management. Vol. 16 Number 4
Newcombe, C.P. 2000. Excess Stream Channel Sediment: Six impact assessment models for
fisheries- a primer. Ministry of Environment Habitat Protection Branch. Renard, K.G. et al. 1996. Predicting Soil Erosion by Water: A Guide to Conservation Planning with
the Revised Universal Soil Loss Equation. USDA Handbook Number 703 Schiess, Peter, Finn Krogstad and Florentiu Damian, 2004. Locating Ditch Relief Culverts To
Reduce Sediment Delivery To Streams - An Interactive Design Tool. Paper presented at the Joint Conference of IUFRO 3.06 Forest Operations under Mountainous Conditions and the 12th International Mountain Logging Conference. June 13-16 2004, Vancouver B.C.
Soil Conservation Service, 1978, USDA Handbook Number 703.
http://www.iwr.msu.edu/rusle/constructionsite/ls_construction.html. Tables of LS Factor of Disturbed sites.
Washington State Department of Natural Resources. 2005. Forest Practices Watershed
Analysis. Manual. https://www.dnr.wa.gov/watershed-analysis Ziegler, Andrew C. 2002. Issues Related To Use Of Turbidity Measurements As A Surrogate
For Suspended Sediment. Turbidity and Other Sediment Surrogates Workshop, Reno.

FREP Forest and Range Evaluation Program
Protocol for Evaluating the Potential Impact of Forestry and Range Use on Water Quality 2018
45
Appendices

FREP Forest and Range Evaluation Program
Protocol for Evaluating the Potential Impact of Forestry and Range Use on Water Quality 2018
46
Appendix 1 Sample Field Site Card

FREP Forest and Range Evaluation Program
Protocol for Evaluating the Potential Impact of Forestry and Range Use on Water Quality 2018
47

FREP Forest and Range Evaluation Program
Protocol for Evaluating the Potential Impact of Forestry and Range Use on Water Quality 2018
48
Appendix 2 Summary of Reference Tables for WQEE (as numbered in main body of report)
Table 2 Individual Components of Forestry Disturbed Sites
Possible Components Found within Sample Site (suggested abbreviation)
a Road Surface (RS) b Road Cutback (RC) c Road Ditch (RD) d Fill or sidecast (F) e Gullies or rills generated by artificially concentrated storm flow (G) f Landslides (L) g Upturned Root Wads (URW) h Livestock Disturbance Noted (LDN) i Other Disturbed Area (ODA)
Table 3 Estimating Connectivity
Estimated Connectivity
Typical Example Actual Range
Connectivity Value used in Column 2
None Ditch-blocked interceptor culvert draining 70m of road discharging onto long, hummocky forested slope.
(<0.1) 0
A little A 200 m2 road surface collecting storm flow and
dropping it onto forest floor within 15 meters of creek
(0.1-0.3) 0.2
About half A small area of disturbed cutbank (50 m2) with 2
meters of forest floor separation from stream (0.3-0.7) 0.5
A lot Ditch-blocked interceptor culvert draining 200 m of road discharging onto a steep forested slope within 4m of stream
(0.7-0.9) 0.8
All Ditch drainage running directly into stream or road surface drainage running off road bridge
(>0.9) 1
Table 4 Estimating Connectivity
Distance over Forest Floor between Ditch Outlet and Stream (m)
Approximate Area of Disturbed Drainage Upslope of Storm Drainage Outfall (m
2)
<10 10-50 50-100
100-250
250-500
500-1000
1000-2000
>2000
0.5-1 0.5 0.8 1 1 1 1 1 1 1-2 0.2 0.5 0.8 1 1 1 1 1 2-5 0 0.2 0.5 0.8 1 1 1 1 5-10 0 0 0.2 0.5 0.8 1 1 1 10-20 0 0 0 0.2 0.5 0.8 1 1 20-30 0 0 0 0 0.2 0.5 0.8 0.8 >30 0 0 0 0 0 0 0 0.5
Table 5 Estimating Fine Sediment Portion of Matrix
Estimate of portion of fine sand, silt and clay in eroded/erodible material (excluding active road surfaces)
Actual Range Value used in Column 3
None (<0.1) 0 A little (0.1-0.3) 0.2 About half (0.3-0.7) 0.5 A lot (0.7-0.9) 0.8 All (>0.9) 1

FREP Forest and Range Evaluation Program
Protocol for Evaluating the Potential Impact of Forestry and Range Use on Water Quality 2018
49
Table 6 Expected Annual Surface Erosion Expected on Surfaces Commonly Found Associated with Mini-Catchments
Surface Erosion Ratings
Typical Surface (other than road running surfaces) within Mini-Catchments Draining Forestry-Disturbed Sites
Estimated Annual Depth of Surface Erosion Expected under Existing Conditions (m)
Nil Forest floor, cutbanks, sidecast, fill slopes or ditch lines with good moss, grass or litter cover or naturally or artificially armoured. (Generally associated with well established roads).
0
Bedrock outcrop in any location. 0 Colluvial/morainal stone rubble gravel in any
location. 0
High Disturbed forest floor, cutbanks, sidecast, fill slopes or ditch lines with bare, unvegetated, unarmoured, unconsolidated surface material (other than lacustrine). (Generally associated with new roads and other recent disturbances. After a road becomes established, often only a small portion of a cutbank or road ditch is subject to erosion.).
0.01
Natural or artificial surface with heavy live-stock use and presence of compacted bare soil.
0.01
Extreme Cutbanks, sidecast, fill slopes and ditches with no vegetation cover on stone-free, very fine sandy and silty lacustrine.
0.02+
Table 7 Showing Predicted Depths of Surface Erosion (m) from Road Surface <2% Slope Gradient under Differing Conditions
<2% Slope Road Surfacing Quality
Road Use Paved or Coarse Ballast Good Average Poor
Heavy use, all season road 0 0.001 0.002 0.005 Moderate use, all season road 0 0.0005 0.001 0.002 Light seasonal use (4x4 and occasional logging truck)
0 0.0002 0.0005 0.001
Deactivated (and unused) 0 0.0001 0.0002 0.0005
Table 8 Showing Predicted Depths of Surface Erosion (m) from Road Surface of 2-10% Slope Gradient under Differing Conditions
2-10% Slope Road Surfacing Quality
Road Use Paved or Coarse Ballast Good Average Poor
Heavy use, all season road 0 0.002 0.005 0.01 Moderate use, all season road 0 0.001 0.002 0.005 Light seasonal use (4x4 and occasional logging truck)
0 0.0005 0.001 0.002
Deactivated (and unused) 0 0.0002 0.0005 0.001
Table 9 Showing Predicted Depths of Surface Erosion (m) from Road Surface of >10% Slope Gradient under Differing Conditions
>10% Slope Road Surfacing Quality
Road Use Paved or Coarse Ballast Good Average Poor
Heavy use, all season road 0 0.005 0.01 0.02 Moderate use, all season road 0 0.002 0.005 0.01 Light seasonal use (4x4 and occasional logging truck)
0 0.001 0.002 0.005
Deactivated (and unused) 0 0.0005 0.001 0.002

FREP Forest and Range Evaluation Program
Protocol for Evaluating the Potential Impact of Forestry and Range Use on Water Quality 2018
50
Table 10 Summary of fine sediment generated from mass wasting at site depicted in Figure 9
Landslide Caused by Excess Ditch Drainage (on “Shallow over Steep” Terrain)
Component is identified as a landslide surface Portion of fine sediment = 50% (estimated visually) Volume of surficial material moved = 20 x 10 x 1 = 200 m
3
Volume of failed material still on site = 40 x 2 x 2 = 160 m3
Total volume of sediment reaching creek = 200 m3 - 160 m
3 = 40 m
3
Volume of fine sediment from failure reaching creek = 40 m3 x 0.5 = 20 m
3
Volume of coarse sediment from failure reaching creek
= 40 m3 x 0.5 = 20 m
3
Note: Most new landslide surfaces will also have a surface erosion component that should be considered in the evaluation.

FREP Forest and Range Evaluation Program
Protocol for Evaluating the Potential Impact of Forestry and Range Use on Water Quality 2018
51
Figure 11 Checklist of Range Indicators Potentially Affecting Water Quality
Checklist of Range Indicators Potentially Affecting Water Quality Forest and Range Evaluation Program Resource Stewardship Monitoring
Opening ID________ Road ID________ Sample Site ID__________
Observations of Livestock Disturbed Component of Sample Site with Demonstrated Connectivity of Receiving Waters (refer to Range Resource Assessment Procedures, 2006)
Yes/No Condition of Plant Community
☐ ☐ 1. Riparian vegetation absent or highly modified by grazing or trampling
☐ ☐ 2. Herbaceous stubble height < 10 cm noted (from 10 samples over 100 meters)
☐ ☐ 3. Browsing of > 70% of leaders noted (from 10 samples over 100 meters)
Condition of Ground Surface
☐ ☐ 4. Bare soil and compaction common (10% of component by area)
☐ ☐ 5. Recent pugging and unvegetated hummocks common (10% of component by area)
Condition of Stream Bank and Channel
☐ ☐ 6. Bank erosion/collapse apparent resulting from heavy livestock use
☐ ☐ 7. Evidence of livestock standing in stream bed
☐ ☐ 8. Macro-invertebrates indicate degraded water quality
☐ ☐ 9. Algal mats occur in receiving waters
☐ ☐ 10. Water run-off along livestock trails
Presence of Livestock Dung
☐ ☐ 11. Livestock feces noted within 3 m of water's edge, or on trails, ditch lines or other
surface drainage features leading to water
Specific Range Management Practices
☐ ☐ 12. Livestock drink directly from water source
☐ ☐ 13. Absence of livestock control structures limiting access to water source
☐ ☐ 14. Observed presence of calves (< 4 months) in or adjacent to water source
☐ ☐ 15. Salt, minerals, oilers within 100 m of water body
If at least three of the five preceding indicator classes receive at least one yes response, the possibility exists that livestock presence may be compromising water quality. The assessment of these 15 indicators provides a record of possible range management issues that may require further evaluation by the Range Division.
☐ ☐ Are range conditions suggesting livestock is compromising water quality? (risk will be proportional to distance downstream to water intake)
Table 11 Rating of Total Fine Sediment Generation from Site (Independent of Stream Size)
Total Volume of Fine Sediment Generated (WQ Index)
Site Sediment Generation Potential Classes
General Level of Management
< 0.2 (m3) very low Good
0.2 - 1 (m3) low
1 - 5 (m3) moderate
5 - 20 (m3) high
> 20 (m3) very high Poor

FREP Forest and Range Evaluation Program
Protocol for Evaluating the Potential Impact of Forestry and Range Use on Water Quality 2018
52
Table 12 Used for Estimating Actual Stream Discharge at Time of Visit
Estimated bankfull discharge
Ease of crossing drainage during rainstorm or flood
MoFR Stream Classification (Fish)
Bankfull width
Estimated time to fill imagined container during bankfull discharge
1 L/s Can block stream for second with boot
S4 <0.5 m 4 sec to fill ice cream bucket
10 L/s Can step across S4 <0.5 m 4 sec to fill 10 gallon aquarium
100L/s Can jump across S4 0.5-1.5 m 2 sec to fill bathtub 1000L/s or 1 m
3/s
Can walk/wade across S3 1.5-5 m 2 sec to fill hot tub
10 m3/s Can walk on a log
across S2 5-20 m 10 sec to fill
backyard swimming pool
100 m3/s Can throw a stone
across S1 >20 m 10 seconds to fill
Olympic size pool

FREP Forest and Range Evaluation Program
Protocol for Evaluating the Potential Impact of Forestry and Range Use on Water Quality 2018
53
Figure 13 Stream Characteristics used to evaluate discharge and turbidity impact
a. Estimated discharge at time of visit (see Table 1) ____________ m3/s
b. Wetted width at High Flow (w) (see Figure 15) __________m c. Average Depth of Water at high flow (d) (see Figure 15) __________m d. Stream Cross Section (w x d) (see Figure 15) __________ m
2
e. Wetted Perimeter (A) w + 2 d (see Figure 15) __________m f. Effective Radius of Stream
(Stream Cross Section / Wetted Perimeter A/P) ___________m g. Stream Channel Gradient (%) ___________% h. Manning Coefficient of roughness n (dimensionless) __________
Sand = 0.2
Gravel= 0.3
Cobbles= 0.4
Boulders= 0.6
Heavy Brush= 0.8 i. Average Velocity of Stream (m/sec) (Using Manning’s’ Equation.
Manning’s Equation being : V= R2/3 S ½/n Where;
V= Average Velocity of Stream (m/s)
R= Effective Stream Radius (m)
S= Stream Channel Gradient (degrees)
n= Hydraulic Roughness _________m/sec j. Discharge (D) m
3 per sec
(Average Stream Velocity x Stream Cross section) turbidity increase over duration _________ m
3/sec
Figure 14 Water Quality Characteristics
k. Volume of Fine Sediment (from site evaluation) ____________ m3
l. Time of Delivery of Sediment (days)
(for normal evaluation use 10 days)
1 day
10 days
100 days __________days m. Weight of sediment =(Volume of Fine Sediment * 1.6)
(1.6 is bulk density of average fine textured sediment) _________tonnes n. Weight of sediment delivered to stream per second
Weight of sediment in mg per sec= Weight of Sediment (tonnes) * 109 mg/tonne/ 86400 *duration in days ________mg/sec p. Concentration of sediment increase mg per l over duration in days
Weight of sediment mg/sec / Discharge m3/sec / 1000= ______mg/l
q. Turbidity increase over duration
Concentration of sediment increase over duration mg/l x 2 = ________NTU r. Severity of impact on drinking water (Table 13)
Low
Moderate
High S. Severity of ill effects on fish ( Table 14)
from Newcombe duration magnitude of sediment event
no effect
Slightly impaired
Moderately impaired
Severely impaired

FREP Forest and Range Evaluation Program
Protocol for Evaluating the Potential Impact of Forestry and Range Use on Water Quality 2018
54
Table 13 Thresholds for increased turbidity at intake
Increase in turbidity at intake contributed by sample sites evaluated in watershed (NTU)
Cumulative impact threshold on water quality at site
<1 Low
1-5 Moderate
>5 High
Table 14 Turbidity and the severity of ill effects for sensitive fish
Duration of Turbidity Event
Severity of ill effects for sensitive fish (trout and salmon) 1day 10 days 100 days
No effect <10 NTU (<20mg/l)26
<5 NTU (<10 mg/l)
<1 NTU <2 mg/l)
Slightly Impaired 10-50 NTU (20-100mg/l)
5-20 NTU (10-40 mg/l)
1-5 NTU (2-10 mg/l)
Moderately Impaired
50-500 NTU 100- 1000 mg/l
20-100 NTU 40-200 mg/l
5-50 NTU 10-100 mg/l
Severely impaired >500 NTU (>1000mg/l)
>100 NTU (>200 mg/l)
>50 NTU (>100 mg/l)
26
The relationship between turbidity and concentration of suspended sediment is complex, dependant on particle size and amount of organic matter. From the literature we have chosen an average conversion rate of 1 ntu = 2 mg/l which is used throughout this report.

FREP Forest and Range Evaluation Program
Protocol for Evaluating the Potential Impact of Forestry and Range Use on Water Quality 2018
55
Table 15 Checklist of Possible Solutions to Reduce Fine Sediment Generation
Activity of Concern Possible Means to Reduce Stream Sedimentation
Location of Road (To be considered in future road alignments)
1. Locate road away from stream. 2. Avoid steep unstable slopes and ensure adequate engineering of alignment. 3. Avoid stream crossings where lay of land requires road approaches with long gradients flowing towards stream.
Design of Road and Cutblock (To be considered in future road drainage and cutblock boundary design)
4. Avoid deeply dug ditches in proximity to streams. (Possibly use rock ballast to raise road.) 5. Plan for sufficient number of strategically located culverts to avoid excess drainage water concentration. 6. Design bridge deck to be slightly higher than road grade, with gentle slope away from the bridge. 7. Design narrower road that follows natural breaks in topography to channel surface water safely off road away from natural drainage. 8. Ensure that remaining trees left within riparian zone are wind firm.
Construction/Harvesting (To be considered during construction of road and harvesting of cutblocks)
9. Avoid soil disturbance wherever possible. 10. Armour, seed or spread out logging debris over disturbed area to protect soil. 11. Avoid wet areas or use brush mats to avoid compaction and incision of skid trails. 12. Use good quality road subgrade and capping materials. 13. Place rock armouring over areas of concentrated flow. 14. Construct sediment basin capable of handling coarse sediment expected from new road construction.
Management/Maintenance (To be considered during ongoing management and maintenance of road and cutblock)
15. Ensure good quality road fill and surfacing used and grader produces crowned road. 16. Remove and/or manage grader berms. 17. Reduce or prevent vehicular traffic during very wet weather or just after spring thaw. 18. Reduce unnecessary use of all vehicular traffic on road. 19. Fall away, yard away or clean stream to former conditions. 20. Improve range management by reducing livestock damage within riparian zone.
Deactivation (Seasonally or permanently)
21. Install strategically placed cross ditches, water bars and ditch blocks. 22. Pull back and end haul unstable road fill to safe location. 23. Pull culverts and armour crossing.
Other Other recommendations (Use the Comments Tab)

FREP Forest and Range Evaluation Program
Protocol for Evaluating the Potential Impact of Forestry and Range Use on Water Quality 2018
56
Appendix 3 Newcombe Fish Sensitivity
Appendix Figures 1, 2 and 3 were used to develop Table 14 in the main body of the report. They were formulated by Charles Newcombe in his development of sediment impacts on sensitive fish.
For this protocol, the duration over which the estimated sediment volume was entering the stream was chosen to be 10 days which provides a reasonable estimate of the number of bankfull flood days, (as this is when sediment would most likely be moving) within streams over a year. This value has been used by default for most investigations although it is a simple conversion whereby a shorter time period of sediment movement is associated with a proportional increase in sediment concentration. This relationship is central to the work of Newcombe which is presented below. The tables presented in the figures below are for the evaluator to understand the process by which the impact on fish is determined. But they need not be referred to when conducting an evaluation. For WQEE evaluators using the app the impact on fish value is generated automatically upon completion of the Stream Characteristics tab with the WQEE App. These tables must be seen as preliminary. They will need to be further developed and verified over the years to fine tune the evaluation. The WQEE Protocol has chosen the “average” duration of sediment event as 10 days over the year, a bankfull discharge of 1 m3/s. It has ignored background levels of turbidity in a stream when estimating the effects of a given amount of sediment on fish. This discharge volume reflects what might be considered an “average” storm flow of an “average” fish stream. Similar volumes of fine sediment have a greater impact, the smaller the discharge of the stream. While natural background stream turbidity levels are important to determining the consequences of fine sediment introduced for disturbed sites on stream water quality, they are not considered in this evaluation because of lack of data records.

FREP Forest and Range Evaluation Program
Protocol for Evaluating the Potential Impact of Forestry and Range Use on Water Quality 2018
57
Appendices 3 Figure 1. Showing the potential for Severity of Ill Effect of Turbidity and Duration (after Newcombe, C.P. 2000.)
Appendices 3 Figure 2. Auxiliary Legend for Appendices Figure 1

FREP Forest and Range Evaluation Program
Protocol for Evaluating the Potential Impact of Forestry and Range Use on Water Quality 2018
58
Appendices 3 Figure 3. Showing the potential for Severity of Ill Effect of Turbidity (mg/l) and Duration (Hours, Weeks and Months)
After Newcombe, C.P. and J.O.Jensen. 1996.

FREP Forest and Range Evaluation Program
Protocol for Evaluating the Potential Impact of Forestry and Range Use on Water Quality 2018
59
Appendix 4 Assessing Riparian Windthrow for Fine Sediment Generation
FREP Water Quality evaluators use randomly selected cutblocks to initiate their sampling transects. Whenever they encounter a riparian zone leave strip within or adjacent to that initial randomly selected cutblock they should conduct a riparian windthrow assessment. These leave strips are occasionally subject to windthrow after they have been exposed by harvesting of adjacent cutblock. There are many important environmental impacts caused by such windthrow. The WQEE only addresses the propensity of such sites to generate fine sediment, thus impacting downstream water quality. This assessment is quick and simple. It is meant to provide only rough idea of water quality impact. Many variables can influence how riparian windthrow influences water quality. As with the whole WQEE, the riparian fine sediment generation results are meant to be “precise” to an order of magnitude. Even with more exhaustive evaluation, significantly more precise results are unlikely to be forthcoming. The riparian zone under consideration should be inspected visually (usually from the road is sufficient) to determine whether windthrow is an important feature of the exposed riparian stand. It is almost always associated with a stream crossing that will normally be evaluated during a standard WQEE sampling transect. If there is no wind throw, merely noting the absence of windthrow is all that is required to evaluate a riparian site for water quality impacts. The evaluator is not meant to walk the full length of the windblown riparian area as he would in a FREP riparian assessment. A view from the

FREP Forest and Range Evaluation Program
Protocol for Evaluating the Potential Impact of Forestry and Range Use on Water Quality 2018
60
distance is usually sufficient to determine how many trees have fallen. Where and how they fall strongly influences the outcome. In order for sediment to be generated, the upturned root wad must be directly connected to the creek channel (as the channel would appear at annual bankfull capacity). If there are wind thrown trees but their root wads are not directly in contact with stream channel, they are not counted in this evaluation. This is because although bare soil is exposed, there is no means to transfer sediment generated from a small patch of ground surrounded by forest floor to the stream. Once you have established the number of trees that have root wads exposed within the visible stream channel area, the next step is to determine the average surface area covered by each upturned root wad in m2. The total number of trees multiplied by the average area of root wads exposed per tree gives the evaluator the total area of root wad erodible ground. It is estimated around 0.1 meter (10 cm) depth of sediment will be eroded from the combination of the loose soil sloughing off the root wad and the incision of the stream into the open ground left by the exposed root wad. This depth value is used for all sites in the riparian evaluation. To complete the evaluation, an estimate of the portion of fines within the stream bank is conducted. When the evaluator is assessing a targeted riparian area for the impacts of windthrow on fine sediment generation using the WQEE App, the Site Type drop down located on the Location Tab is opened and Riparian Harvesting or Yarding is selected. This will bring up a simple sub-Tab as shown on Appendix 4 Figure 1.

FREP Forest and Range Evaluation Program
Protocol for Evaluating the Potential Impact of Forestry and Range Use on Water Quality 2018
61
Appendix 4 Figure 1. Automatic drop down chart on WQEE App “Location Tab” when “Riparian Harvesting or Yarding” is chosen as “Site Type”
If no windthrow is noted along the stream reach, a sample site is completed merely by recording its location and entering 0 for the number of trees that have fallen over with their root wad connected to the flood channel. The evaluator can move along to their next site. Where windthrow is observed three more pieces of information must be input:
1. The number of trees with root wads overturned within direct contact of the stream at high flow.
2. The average surface area of the upturned root wad within or immediately adjacent to the stream
3. The portion of fine sediment within stream bank From these three observations the volume of fine sediment generated within the riparian windthrow area can be determined.
Example of riparian site with root wads of wind thrown trees in or adjacent to stream channel: 1. Let us say that, from the road, within the targeted cutblock, the observer can see four windthrown trees, with an average surface area of the root wad of 1.5 m2. This means 4 x 1.5 m2 =6 m2 of riparian forest floor has been disturbed by windthrow and is subjected to erosion. The soil along the stream bank was found to be coarse textured with the portion of fines being 0.2.

FREP Forest and Range Evaluation Program
Protocol for Evaluating the Potential Impact of Forestry and Range Use on Water Quality 2018
62
These values are entered in to appropriate boxes as shown on Appendix 4 Figure 1 and the amount of fine sediment is automatically calculated and transferred to the Summary page of the App. In this example the amount of fine sediment generated by this site is 0.12 m3, or a very low rating for Water Quality Impact. The evaluation is complete. Note that this assessment is indirectly connected to the FREP Riparian Assessment. However, the WQEE riparian assessment addresses only the water quality impact resulting from the disturbance of upturned root wads. It does not consider other biological or physical effects. Data collected to date indicate that although riparian windthrow is very common, its effect on water quality is not as large as was anticipated. If values continue to be found mostly in the ”Very Low” range, this portion of the evaluation may be dropped.