protocol for double blind controlled study of static
TRANSCRIPT

Double blind placebo-controlled Pilot study of UlcerCare Static Magnets in Chronic Leg Ulcer Healing
Dr N.K. Eccles BSc MBBS PhD MRCP & H. Hollinworth BA MSc RGN RNT

Eccles & Hollinworth, 2004, Magnopulse Report 2
The Authors
Dr N.K. Eccles, Medical Director, The Chiron Clinic, 121 Harley St, London W1G 6AX
Helen Hollinworth, Senior Teaching Practitioner, Faculty of Health, Suffolk College, Ipswich

Eccles & Hollinworth, 2004, Magnopulse Report 3
Table of Contents Page No.
Abstract 3 Introduction 4 Methods 7 Results 9 Summary and Discussion 33 References 36 Appendices 37

Eccles & Hollinworth, 2004, Magnopulse Report 4
Abstract A randomised telephone based survey of 160 UlcerCare users had shown a highly significant reduction (p < 0.0001) in ulcer size of 68% was achieved over an average of 4 months. Average ulcer duration was 49 months i.e. just over 4 years. The results of the above survey were of such import that they encouraged this randomised double blind controlled pilot study. Despite the small numbers (26) and other problems encountered in conducting this pilot study, the results are strongly in favour of a significant chronic ulcer healing effect in the UlcerCare group but not in the placebo group. All trial patients were having evidence based care, and the only intervention was the leg wrap. There were statistically significant differences in the rates of change in ulcer measurements for perimeter (p=0.01), length (p=0.02) and width (p=0.01). The difference in rate of change of area was marginally significant (p=0.04). Four patients that had data measurements at 12 weeks in the UlcerCare group had no measurable ulcer at the end of the 12 weeks. Of the 12 placebo group patients, 7 had data measurements at 12 weeks and all still had measurable ulcers. There were no statistically significant differences in the changes from baseline in any measures of pain status, daily activity, feelings, overall health, changes in health or quality of life at any time point. Leg ulcers are a major drain on health care resources and represents 8-22% of district nurse workload. There are estimated to be 100,000 ulcer patients in the UK with 450 patients per health district of 250,000 population. Ulcer chronicity and recurrence are a problem. With £100-120 million a year was being spent on ulcer care i.e. between £1100 and £5000 per patient per year clearly, chronic ulceration is a problem and a major financial burden on the NHS. Even using evidence based practice leg ulcer healing rates are very variable, and ulcers frequently reoccur. This double blind study shows that an easy to apply static magnetic device UlcerCare significantly promotes ulcer-healing rate. The implications in terms of cost savings to the NHS are obvious.

Eccles & Hollinworth, 2004, Magnopulse Report 5
Introduction Whilst there is much anecdotal evidence for the effectiveness of static magnets to promote ulcer healing there are no controlled studies that have been published to confirm this. On review of the literature there was only one double blind study that has examined the effects of static magnets in wound healing and this study focussed on surgical wounds. This study was a double blind placebo controlled trial performed by Man et al in 1999 on 20 patients (aged 18 to 75) who underwent suction lipectomy surgery of various regions (abdomen, saddlebags, love handles and thighs) by the same surgeon and whose postoperative wound progress was investigated with and without static magnets. They found a statistically significant (p<0.05) reduction in pain between days 1 to 7 in the magnet group, a 37 to 65% reduction in pain levels in the magnet group with a reduction in the number of analgesics consumed compared to the control group, a statistically significant reduction in oedema (p< 0.05) by 40 to 53% in the magnet group compared with the control group on days 1 to 4, a statistically significant (p< 0.05) decrease in discolouration occurred when compared with the control group on post-operative days 1,2 and 3. No side effects were observed in either group. The authors made the important comment that in procedures in which significant bruising occurs, one would normally expect manifestations such as these to take 2 to 3 weeks to resolve, whereas with the use of magnetic field therapy, they resolved in 48 to 72 hours. Although well-controlled studies have been performed on the stimulation of bone growth by electric and magnetic fields, the effects of magnetic fields on soft tissues remains unclear. Electrical stimulation has been used to facilitate wound healing for more than 30 years and it has been known since Galvani’s observations in 1792 that injured tissues generate small electrical currents. More recently, researchers have described and measured these injury currents and suggested that they play a key role in triggering wound repair mechanisms. All electrical currents generate magnetic fields and all magnetic fields cause a change in electrical potential. Therefore, an interaction of magnetic fields with ion fluxes across the cell membrane, which are fundamental to the preservation of normal cellular function, is very likely. Furthermore, much research confirms the existence of an injury current, as mentioned above, and it is logical to think that magnets could influence and enhance this current in much the same way that externally applied electrical currents have been shown to. Leg ulcers are a major drain on health care resources Mekkes et al (2003), particularly in community settings, with an increasing incidence in the elderly population. In addition, pain reduces the quality of life in most patients with leg ulcers (Noonan and Burge, 1998). Even using evidence based practice (RCN 1998), leg ulcer healing rates are very variable, and ulcers frequently reoccur. The prevalence of active leg ulceration in the UK is 0.15-0.18% which represents 450 patients per health district of 250,000 population. There are estimated to be 100,000 ulcer patients in the UK. Seventy to 90% are venous in origin, 5-20% arterial, 10-15% combined and 5-10% due to other causes such as diabetes, vasculitis, neoplasm,

Eccles & Hollinworth, 2004, Magnopulse Report 6
infection, trauma etc. There is an increased prevalence with age so that the average of 1.5 to 1.8 per 1000 population rises to 3 per 1000 at age 61-70 and 20 per 1000 at age 80 and above. Nearly 1% of the population are affected by leg ulcers at some point in their lives. Over two thirds of leg ulcer sufferers have recurrence and a third have 4 or more episodes. Fifty percent of ulcers are open for 9-12 months, 20% are open for 2 years and 8% are open for more than 5 years. Sixty to 90% are managed in the community and this represents 8-22% of district nurse workload. From an expenditure point of view it has been estimated that in the late 1980’s £100-120 million a year was being spent on ulcer care although other estimates put the figure much higher than this at £600 million per year. These estimates amount to between £1100 and £5000 being spent on each patient per year. For comparison, in the USA the annual cost of wound care has been estimated to be $3 billion annually (National Institutes of Health release, Oct 2000). Clearly, chronic ulceration is a problem and a major financial burden on the NHS. A recent systematic review of randomised control trials of static magnets for pain relief (Eccles, 2003, In Press) reported that 9 of the 12 studies reported a significant analgesic effect due to static magnets. Of 8 of the better quality studies, 7 demonstrated a positive effect of static magnets in achieving analgesia across a broad range of different types of pain (neuropathic, inflammatory, musculoskeletal, fibromyalgic, rheumatic and post-surgical). Anecdotal evidence (or evaluations) from patients using static magnets (UlcerCare) appears to indicate accelerated healing, reduced pain, and increased quality of life. As a precursor to this trial a randomised telephone survey was undertaken of 160 randomly selected users of Magnopulse UlcerCare static magnet leg wraps to determine the effectiveness on Leg Ulcer Healing and Leg pain (Eccles & Price, 2003, Unpublished). Average ulcer duration was 49 months i.e. just over 4 years. The device had been worn for an average of 4 months at the time of the survey. The key findings were as follows:
A highly significant reduction (p < 0.0001) in ulcer size of 68% was achieved over the treatment period. Forty one percent (41%) of patients experienced complete ulcer healing with only 11% of patients had no effect on ulcer size. The average time to heal in those that had complete healing was 3.9 months.
72% of those with associated swelling had a reduction in swelling after
wearing UlcerCare with an average reduction in swelling of 71%. This reduction in swelling was highly statistically significant, p < 0.0001.
84.5% had a reduction in associated leg pain with UlcerCare. This reduction in
pain was highly statistically significant, p < 0.0001. There was a statistically significant reduction in painkiller consumption after using UlcerCare (p< 0.030), with 57% of patients no longer taking painkillers at all.
The majority, 54.5% reported an improvement in ability to perform daily tasks
with 64% reported an improvement in the quality of life. This was at least in part due to less pain, less restriction and greater mobility.

Eccles & Hollinworth, 2004, Magnopulse Report 7
The results of the above survey were of such import that they encouraged this randomised double blind controlled pilot study.

Eccles & Hollinworth, 2004, Magnopulse Report 8
Methods The aim was to recruit 100 male or female patients with chronic leg ulcers (not healed after 12 weeks) of multiple origins but excluding cancer related ulcers, diabetic foot ulcers and neuropathic ulcers. Leg ulcer categories were those described by Hofman et al (1997). All trial patients were having evidence based care, and the only intervention was the leg wrap. Subjects were randomly allocated to receive either a sham control non-magnetic or real magnets (UlcerCare). Both devices were identical in appearance. The device is a self-securing leg wrap worn just below the knee, and proximal to the calf. The UlcerCare wrap contains four powerful neodymium magnets (2000gauss). Each magnet has patented and unique directional plates that allow the negative enhanced magnetic field to be absorbed deeper into the tissues; it is thought that this gives more effective and longer lasting effect. The wraps are fitted below the knee and above the calf muscle and are held in place by “hook and loop” fastening tape. The product is registered as a Class 1 Medical Device. Neither the observer nor the patient was aware of whether the device applied is a magnet or a control (each device was coded and the code revealed only at the end of the study after analysis of results). Subjects were not told that this was a study of a magnetic device. Both groups continued with their conventional therapy i.e. dressings, wound care, and compression therapy as appropriate to the underlying aetiology. Ulcer assessment and measurement carried out once every four weeks by nurses normally caring for these patients, supported by the nurse researcher. Ulcer assessment was made by digital photography of the ulcer at each assessment. Photographs were analysed by specialised ulcer assessment software using the Verge Videometer. This required that the whole circumference of the ulcer be visible to the nurse assessor in the camera viewfinder. Each patient had a coded disk onto which all photos for that patient were stored for analysis. Photo dates were noted separately as hard copy. At the end of the study the photos were extracted centrally and filed under the patients code number on computer with the date clearly marked for each photo. Data was stored according to Data Protection Act (1998). Ulcer size was assessed using the Verge Videometer mentioned above. This provided measurements of ulcer perimeter, area, maximum length, maximum width and hue. Identification and treatment for infection was noted and dated on the patient’s log. Patients’ level of pain in the lower limb was logged using a visual analogue scale (VAS) 1-5 (where 1 = no pain and 5 = severe pain). The questionnaire used is shown in Appendix 1. A modified COOP Measure of Functional Status (Beaufait et al 1992, See Appendix 1) was employed for each patient throughout the study in order to assess Daily Activities, Feelings, Overall Health, Change in Health and Quality of Life. Each of these was graded on a scale of 1-5 at monthly intervals (See Appendix 1). Details of wound care, dressings and compression therapy being applied were recorded.

Eccles & Hollinworth, 2004, Magnopulse Report 9
The study endpoint was defined as 12 weeks on the basis of other previous ulcer studies (RCN 1998, Stacey et al 2002). Ethical approval was sought and obtained from East Suffolk Local Research Ethics Committee prior to commencement of the trial. Statistical Methods Ulcer Size and Hue All the data describing ulcer size and hue were very skewed with a number of outliers. There were also some missing values. The raw data for each measure at each time point are summarised using median (inter-quartile range (IQR)) and the profile over time is graphically represented by box whisker plots. In order to evaluate the between treatment group differences the changes over time are described by an average rate of change. This was calculated for each patient by subtracting the measurements furthest apart in time and dividing by the number of weeks. So, for a patient with measurements at weeks 4 and 12 the calculation would be (week 12 – week 4) /8 to give an average rate of change per week. A negative value would therefore indicate a reduction. These rates of change are also summarised using median (IQR) for each treatment group, and the Mann Whitney test is used to compare them. Pain and Functional Status The data for pain and functional status are discrete (scores of 1-5) and again are represented graphically by box-whisker plots. Baseline (week 0) values and changes from baseline at 4,8,and 12 weeks are summarised using median (IQR) point for each treatment group. Between group differences in the changes are evaluated using the Mann-Whitney test and unadjusted (for multiple comparisons (3 time points)) p-values are reported. To give an overall significance level of 5% (per outcome measure) a p-value of less than 0.015 should be considered statistically significant. To evaluate whether these outcomes significantly change over time, a Friedman test was used for each group separately.

Eccles & Hollinworth, 2004, Magnopulse Report 10

Eccles & Hollinworth, 2004, Magnopulse Report 11
Results

Eccles & Hollinworth, 2004, Magnopulse Report 12
Results Twenty-eight patients with chronic leg ulcers entered the study (20 male). All trial patients had received evidence based ulcer care throughout the study period. Patients were allocated to Placebo (sham, 12 subjects) or Live (real, 16 subjects) magnet treatment. Age was similar in the groups (mean (sd): Placebo 81(8), Live 79(8)). Two patients in the Live group did not complete the study and one patient in the Placebo group died between 8 and 12 weeks after the start of the study. The results of these 3 patients are included in the analysis. We were very disappointed with the number of volunteers that actually enrolled given our aims to achieve a sample of 100. Some of the difficulties encountered were as follows:
Gaining approval for access to three different PCTs proved to be a lengthy convoluted process
Patients suitable for enrolling spread over a wide rural area under the care of many different nurses/general practitioners
Difficulty in supervising research/data collection involving multiple practitioners
Issues around digital cameras/images used for data collection (e.g. incorrect placements of reference marker for photographs, incorrect picture angle for reliable analysis)
Limited number of patients being enrolled into the study despite strategies to address this
Despite concerted efforts to engage with practitioners, no patients at all enrolled from one PCT
Change in Dressings Four of the 12 patients in the placebo group and in 4 of 16 in the UlcerCare group had their type of dressing changed during the 12-week study period. Ulcer Size and Hue The data for swelling, area, perimeter, length, width and hue are given in tables 1(a)-(f). These data are also represented graphically as box – whisker plots in Figures 1(a)- (f). The rate of change (per week) for each type of measure was calculated as above and these are summarised for each treatment group in Table 2. Note that some patients only had a measurement recorded at 1 time point and so a rate of change could not be calculated. A rate of change for swelling was available for all patients, but 5 (4 live) were not evaluated for the other measures. The results in table 2 indicate that there was, on average, no change over time for these measures in the placebo group. In the live group there was on average a reduction of 0.1 units per week in, area, length and width, and a reduction of 0.3 units per week in perimeter. The between group differences in these rates of change were statistically significant for perimeter (p=0.01), length (p=0.02) and width (p=0.01). The difference in rate of change of area was marginally significant (p=0.04). Four patients that had data measurements at 12 weeks in the UlcerCare group had no measurable ulcer at the end of the 12 weeks. Of the 12 placebo
Eccles & Hollinworth, 2004, Magnopulse Report 13
group patients, 7 had data measurements at 12 weeks and all still had measurable ulcers. Pain and Functional Status Pain and functional measures are presented graphically as Box-Whisker Plots in Figure 2. The baseline values and changes from baseline are summarised in Table 3(a)-(f). There were no statistically significant differences in the changes from baseline in any measures at any time point. A Friedman test was carried out for each measure on each group separately. In the Placebo group there was significant association between time and : pain (p=0.01) and changes in health (p=0.02). In the Live group, changes in health approached significance (p=0.05).

Eccles & Hollinworth, 2004, Magnopulse Report 14
Age
79.4 80.8
0
10
20
30
40
50
60
70
80
90
100
UlcerCare Placebo
Yea
rs
There was no significant difference in age of patients in the two groups.

Eccles & Hollinworth, 2004, Magnopulse Report 15
Sex
75
25
67
33
0
10
20
30
40
50
60
70
80
Male Female Male Female
UlcerCare Placebo
%
There was a preponderance of male patients in both groups but the sex distribution was similar in both groups.

Eccles & Hollinworth, 2004, Magnopulse Report 16
Ulcer Origin
0
37.5
62.5
25
67
80
10
20
30
40
50
60
70
80
Mixed Venous Rheumatoid
%
uc placebo
Ul
uc = UlcerCare
The ulcer origin was similar in both groups. The majority of ulcers (65%) were of venous origin.
Eccles & Hollinworth, 2004, Magnopulse Report 17
Figure 1 – Ulcer size and hue at each time point The following graphs illustrate the change in ulcer and ulcer-related measurements with time. In all cases the asterixes represent outlying values.

Eccles & Hollinworth, 2004, Magnopulse Report 18
Change in Ulcer area
Time (weeks)
12840
Are
a
100
90
80
70
60
50
40
30
20
10
0
GROUP
Placebo
Live
There was a median 91% reduction reduction in ulcer size in the UlcerCare group compared to the placebo group (1% increase in size) after 12 weeks. At 4 weeks there was a median 32% decrease in ulcer area in the UlcerCare group compared with a 19% median reduction in the placebo group. The reduction in ulcer area over the 12 weeks was significantly greater in the UlcerCare group (p < 0.04). See Table 1 for measurement details.

Eccles & Hollinworth, 2004, Magnopulse Report 19
Change in Ulcer Perimeter
Time (weeks)
12840
Per
imet
er
50
40
30
20
10
0
GROUP
Placebo
Live
Consistent with the finding above for ulcer area, there was a median 72% reduction in ulcer perimeter in the UlcerCare group at 12 weeks compared with a 5% increase in size in the placebo group. The difference between the 2 groups was statistically significant (p < 0.01). See Table 1 for measurement details.
Eccles & Hollinworth, 2004, Magnopulse Report 20
Change in Ulcer Length
Time (weeks)
12840
Leng
th
16
14
12
10
8
6
4
2
0
GROUP
Placebo
Live
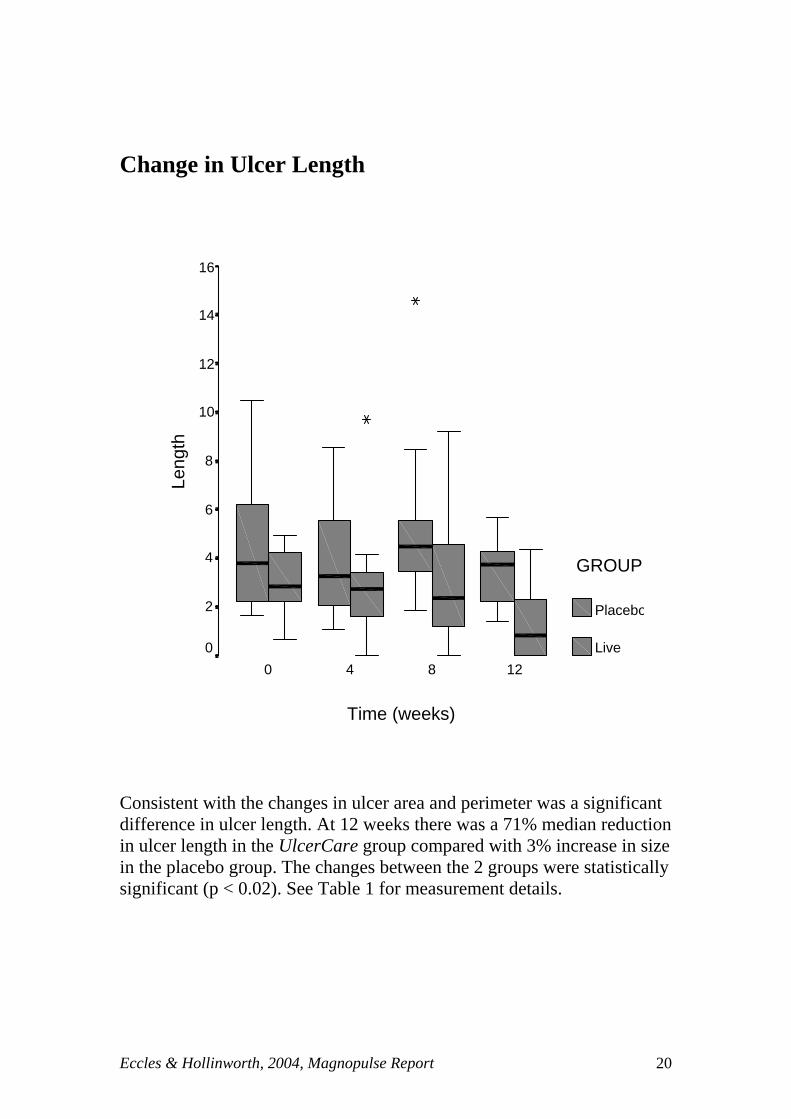
Consistent with the changes in ulcer area and perimeter was a significant difference in ulcer length. At 12 weeks there was a 71% median reduction in ulcer length in the UlcerCare group compared with 3% increase in size in the placebo group. The changes between the 2 groups were statistically significant (p < 0.02). See Table 1 for measurement details.

Eccles & Hollinworth, 2004, Magnopulse Report 21
Change in Ulcer Width
Time (weeks)
12840
Wid
th
10
8
6
4
2
0
GROUP
Placebo
Live
Change in ulcer width had the same trend with a significant progressive reduction in the UlcerCare group over 12 weeks (p < 0.01). Reduction of median width was 65% at 12 weeks in the UlcerCare group compared with 16% increase in width in the placebo group. See Table 1 for measurement details.

Eccles & Hollinworth, 2004, Magnopulse Report 22
Change in Ulcer Hue
Time (weeks)
12840
Hue
1.0
.9
.8
.7
.6
.5
.4
.3
.2
.1
0.0
GROUP
placebo
Live
Ulcer hue as assessed by the computer software showed no consistent difference between the 2 groups (p = 0.34). See Table 1 for measurement details.

Eccles & Hollinworth, 2004, Magnopulse Report 23
Table 1 - Ulcer Size and Hue Measurements All data are median (IQR); n = no. of patients at this time point. (a) – Area Time (weeks) Placebo Live 0 (baseline) 5.2 ( 2.6,12.6) n=12 3.4 (1.4, 6.5) n=10 4 4.2 ( 2.0,12.9) n=10 2.3 (1.0, 3.9) n=9 8 8.0 ( 3.7,11.6) n=10 2.2 (0.7, 9.6) n=9 12 5.4 ( 1.6, 8.8) n= 7 0.3 (0.0, 3.5) n=11 (b) – Perimeter Time (weeks) Placebo Live 0 (baseline) 10.2 ( 6.2,17.4) n=12 8.6 (5.8, 11.1) n=10 4 8.4 ( 5.6,17.9) n=10 6.9 (4.2, 8.9) n=9 8 13.6 ( 8.6,18.6) n= 9 5.7 (2.1, 12.5) n=9 12 10.8 ( 5.9,13.3) n= 7 2.4 (0.0, 7.1) n=11 (c) – Length Time (weeks) Placebo Live 0 (baseline) 3.7 ( 2.2, 6.7) n=12 2.8 (2.1, 4.4) n=10 4 3.2 ( 2.0, 6.3) n=10 2.7 (1.2, 3.8 ) n=9 8 4.5 ( 3.3, 6.3) n= 10 2.4 (0.7, 4.9) n=9 12 3.8 ( 1.9, 4.4) n= 7 0.8 (0.0, 2.7) n=11
(d) – Width Time (weeks) Placebo Live 0 (baseline) 1.9 ( 1.3, 2.9) n=12 1.7 (1.1, 2.1) n=10 4 1.9 ( 1.5, 2.9) n=10 1.4 (0.8, 2.0) n=9 8 2.8 ( 1.5, 3.4) n=10 0.9 (0.6, 2.5) n=9 12 2.2 ( 1.5, 3.4) n= 7 0.6 (0.0, 1.8) n=11

Eccles & Hollinworth, 2004, Magnopulse Report 24
Table 1 - Ulcer Size and Hue Measurements (cont’d) (e) – Hue Time (weeks) Placebo Live 0 (baseline) 0.56 (0.53, 0.59)
n=12 0.53 (0.51, 0.57) n=10
4 0.55 (0.51, 0.57) n=10
0.53 (0.50, 0.56) n=8
8 0.55 (0.52, 0.57) n= 10
0.53 (0.49, 0.56) n=8
12 0.55 (0.51, 0.59) n= 7
0.53 (0.00, 0.54) n=9

Eccles & Hollinworth, 2004, Magnopulse Report 25
Table 2 – Ulcer Size & Hue Statistical Analyses Rates of change (units per week) for each treatment group [median (IQR)] Measure Placebo Live p-value * Area 0.0 (0.0, 0.4) -0.1 (-0.2, 0.0) 0.04 Perimeter 0.1 (-0.1, 0.6) -0.3 (-0.7, 0.1) 0.01 Length 0.0 (0.0, 0.1) -0.1 (-0.2, 0.0) 0.02 Width 0.0 (0.0, 0.1) -0.1 (-0.1, 0.0) 0.01 Hue 0.0 (0.0, 0.0) 0.0 (0.0, 0.0) 0.34
* Mann- Whitney test.

Eccles & Hollinworth, 2004, Magnopulse Report 26
Figure 2: Pain and Functional Status over time. The following graphs illustrate the change in pain and functional status measurements with time

Eccles & Hollinworth, 2004, Magnopulse Report 27
Pain Status
Time (weeks)
12840
Pai
n6
5
4
3
2
1
0
GROUP
placebo
Live
There was a significant time related reduction in pain in the placebo group (p<0.01) over the 12-weeks but not in the UlcerCare group but there was no significant difference between the 2 groups at any time point. (Table 2).

Eccles & Hollinworth, 2004, Magnopulse Report 28
Daily Activity
Time (weeks)
12840
Dai
ly A
ctiv
ity5.0
4.5
4.0
3.5
3.0
2.5
2.0
1.5
1.0
.5
0.0
GROUP
placebo
Live
There was a tendency towards an increase in daily activities in the placebo group but not the UlcerCare group at 12-weeks but these apparent differences were not statistically significant (Table 2).

Eccles & Hollinworth, 2004, Magnopulse Report 29
Feelings
Time (weeks)
12840
Fee
lings
6
5
4
3
2
1
0
GROUP
placebo
Live
There were no significant changes in feelings between the 2 groups over the 12-week study (Table 2).

Eccles & Hollinworth, 2004, Magnopulse Report 30
Overall Health
Time (weeks)
12840
Ove
rall
Hea
lth
6
5
4
3
2
1
0
GROUP
placebo
Live
There were no significant changes in overall health between the 2 groups over the 12-week study (Table 2).

Eccles & Hollinworth, 2004, Magnopulse Report 31
Changes in Health
Time (weeks)
12840
Cha
nges
in H
ealth
6
5
4
3
2
1
0
GROUP
placebo
Live
There appeared to be a significant change for the better in health in the placebo group at 12 weeks compared with the UlcerCare group (p < 0.04) (Table 2).

Eccles & Hollinworth, 2004, Magnopulse Report 32
Quality of Life
Time (weeks)
12840
Qua
lity
of L
ife
6
5
4
3
2
1
0
GROUP
placebo
Live
There were no significant changes in quality of life between the 2 groups over the 12-week study (Table 2).

Eccles & Hollinworth, 2004, Magnopulse Report 33
Table 3 – Pain and Functional status Measurements All data are presented as median (IQR). (a) Pain Placebo Live Baseline 3.5 (3.0, 4.8) 2.0 (2.0, 4.0) week 4 3.0 (2.3, 4.8) 3.0 (1.0, 3.0) week 8 3.0 (2.0, 3.0) 2.0 (1.0, 3.3) week 12 2.0 (2.0, 3.0) 2.0 (1.8, 3.3) (b) Activities Placebo Live Baseline 3.0 (2.0 ,3.8) 3.0 (2.0, 4.0) Change at week 4
2.5 (2.0, 3.0) 3.0 (2.0, 3.0)
Change at week 8
2.0 (1.3, 3.8) 3.0 (2.0, 4.0)
Change at week 12
2.0 (1.0, 3.0) 3.0 (1.8, 3.2)
(c) Feelings Placebo Live Baseline 3.0 (1.0 ,3.0) 2.5 (2.0, 4.0) Change at week 4
3.0 (1.0, 3.8) 2.0 (2.0, 3.0)
Change at week 8
3.0 (1.0, 3.0) 2.5 (1.8, 4.0)
Change at week 12
2.0 (1.0, 3.0) 2.5 (1.0, 3.0)

Eccles & Hollinworth, 2004, Magnopulse Report 34
Table 3 – Pain and Functional status Measurements (Cont’d) (d) Overall Health
(e) Changes in Health Placebo Live Baseline 3.0 (3.0 ,3.0) 3.0 (3.0 ,3.0) Change at week 4
3.0 ( 3.0, 3.0) 3.0 (3.0 ,3.0)
Change at week 8
3.0 (2.0, 3.0) 3.0 (3.0 ,3.0)
Change at week 12
3.0 (2.0, 3.0) 3.0 (3.0 ,3.0)
(f) Quality of Life Placebo Live Baseline 3.0 (2.0 ,3.8) 3.0 (2.0 ,3.0) Change at week 4
2.5 (2.0, 3.8) 3.0 (2.0, 3.0)
Change at week 8
2.5 (2.0, 3.0) 3.0 (2.0, 3.0)
Change at week 12
2.0 (2.0, 2.0) 3.0 (2.0, 3.0)
Placebo Live Baseline 3.0 (2.0 ,4.0) 3.0 (2.0 ,4.0) Change at week 4
3.0 (2.0, 3.8) 3.0 (2.0, 4.0)
Change at week 8
3.0 (2.0, 3.0) 2.8 (3.0, 4.0)
Change at week 12
2.0 (2.0, 3.0) 3.0 (3.0, 4.0)

Eccles & Hollinworth, 2004, Magnopulse Report 35
Table 4 – Pain and Functional status Statistical Analyses All data are presented as median (IQR) and p-values refer to Mann Whitney test. (a) Pain Placebo Live p-value Baseline 3.5 (3.0 , 4.8) 2.0 (2.0, 4.0) Change at week 4
0.0 (-1.0, 0.0) 0.0 (-1.0, 0.0) 0.72
Change at week 8
0.0 (-1.0, 0.0) 0.0 (-1.0, 0.0) 0.63
Change at week 12
-1.0 (-2.0, -1.0) 0.0 (-1.0, 0.3) 0.07
(b) Activities Placebo Live p-value Baseline 3.0 (2.0 ,3.8) 3.0 (2.0, 4.0) Change at week 4
0.0 (0.0, 0.0) 0.0 (-1.0, 0.0) 0.33
Change at week 8
0.0 (-0.8, 0.0) 0.0 (-1.0, 0.3) 0.93
Change at week 12
0.0 (-1.0, 0.0) -0.5 (-1.3, 0.0) 0.59
(c) Feelings Placebo Live p-value Baseline 3.0 (1.0 ,3.0) 2.5 (2.0, 4.0) Change at week 4
0.0 (0.0, 0.0) 0.0 (-1.0, 0.0) 0.23
Change at week 8
0.0 (0.0, 0.0) 0.0 (-0.3, 0.0) 0.72
Change at week 12
0.0 (0.0, 0.0) 0.0 (-1.3, 1.0) 0.79

Eccles & Hollinworth, 2004, Magnopulse Report 36
Table 4 – Pain and Functional status Statistical Analyses (Con’d) (d) Overall Health Placebo Live p-value Baseline 3.0 (2.0 ,4.0) 3.0 (2.0 ,4.0) Change at week 4
0.0 (-1.0, 0.0) 0.0 (-1.0, 0.0) 0.89
Change at week 8
-0.5 (-1.0, 0.0) 0.0 (-1.3, 0.3) 0.50
Change at week 12
0.0 (-1.0, 1.0) 0.0 (-0.3, 1.0) 0.36
(d) Changes in Health Placebo Live p-value Baseline 3.0 (3.0 ,3.0) 3.0 (3.0 ,3.0) Change at week 4
0.0 ( 0.0, 0.0) 0.0 (-1.0, 0.0) 0.17
Change at week 8
0.0 (-1.0, 0.0) 0.0 (-0.3, 0.0) 0.24
Change at week 12
0.0 (-2.0, 0.0) 0.0 ( 0.0, 0.3) 0.04
(e) Quality of Life Placebo Live p-value Baseline 3.0 (2.0 ,3.8) 3.0 (2.0 ,3.0) Change at week 4
0.0 (-0.8, 0.0) 0.0 (0.0, 0.0) 0.79
Change at week 8
0.0 (-1.0, 0.0) 0.0 (-0.3, 0.0) 0.39
Change at week 12
0.0 (-1.0, 0.0) 0.0 (-1.0, 0.0) 0.44

Eccles & Hollinworth, 2004, Magnopulse Report 37
Summary and Discussion

Eccles & Hollinworth, 2004, Magnopulse Report 38
Summary and Discussion Despite the small numbers (26) and other problems encountered in conducting this pilot study, the results are strongly in favour of a significant healing of chronic ulcers in the UlcerCare group but not in the placebo group. The between group differences in these rates of change in ulcer measurements were statistically significant for perimeter (p=0.01), length (p=0.02) and width (p=0.01). The difference in rate of change of area was marginally significant (p=0.04). Four patients that had data measurements at 12 weeks in the UlcerCare group had no measurable ulcer at the end of the 12 weeks. Of the 12 placebo group patients, 7 had data measurements at 12 weeks and all still had measurable ulcers. The results of this double blind placebo controlled trial confirm the results found in a previously conducted randomised survey of UlcerCare users that demonstrated a highly significant reduction (p < 0.0001) in ulcer size of 68% over an average of 4 months. The hue measurements were a function of the computer software program. There were no significant differences between the 2 groups but we do not feel that these make any useful contribution to the outcomes of in this study. There were no statistically significant differences in the changes from baseline in any measures of pain status, daily activity, feelings, overall health, changes in health or quality of life at any time point. Statistically speaking, the interpretation of the pain and functional status results with this type of scoring system is often very insensitive. Furthermore, these results again contrast with the results found in the randomised survey where 84.5% had a reduction in associated leg pain with UlcerCare (76% of subjects had associated leg pain). This reduction in pain was highly statistically significant, p < 0.0001. There was also a statistically significant reduction in painkiller consumption after using UlcerCare (p< 0.030), with 57% of patients no longer taking painkillers at all. The majority, 54.5% reported an improvement in ability to perform daily tasks with 64% reported an improvement in the quality of life. Leg ulcers are a major drain on health care resources. Sixty to 90% are managed in the community and this represents 8-22% of district nurse workload. There are estimated to be 100,000 ulcer patients in the UK with 450 patients per health district of 250,000 population. Over two thirds of leg ulcer sufferers have recurrence and a third have 4 or more episodes. With fifty percent of ulcers open for 9-12 months, 20% open for 2 years and 8% open for more than 5 years creating a continuing drain on health resources. £100-120 million a year was being spent on ulcer care in the late 1980’s but the real figure may be much higher. This amount of spending equates to between £1100 and £5000 being spent on each patient per year. Clearly, chronic ulceration is a problem and a major financial burden on the NHS. Even using evidence based practice (RCN 1998), leg ulcer healing rates are very variable, and ulcers frequently reoccur. The double blind study shows that a static magnetic device UlcerCare significantly promotes ulcer-healing rate in people with chronic ulcers. These findings of enhanced resolution of chronic ulceration and the likelihood of a similar effect on non-chronic ulcers in general; have enormous potential cost saving implications to the NHS.

Eccles & Hollinworth, 2004, Magnopulse Report 39
There is a section in the appendix that discusses the possible mechanisms of action of Static Magnetic fields in achieving enhanced ulcer healing (Appendix 2).

Eccles & Hollinworth, 2004, Magnopulse Report 40
References: Bassett C. A. L., Hermann I. The effect of electrostatic fields on macromolecular synthesis by fibroblasts I vitro. J. Cell Biol. 1968;39:9a. Bassett C. A. L., Mitchell S. N., Gaston S. R. Treatment of un-united tibial diaphyseal fractures with pulsing electromagnetic fields. J. bone Joint Surg.1981;63a:511. Beaufait, D., Nelson, E., Landgraf, J., Hayes, R., Kirk, J., Wasson, J., and Keller, A. (1992) COOp Measures of Functional Status, Chapter 13 in Stewart, M., Tudiver, F., Bass, M., Dunn, E., and Norton, P. (eds) Tools for Primary Care Research, Sage Publications, London Bruce G. K., Howlett C. R., Huckstep R. L. Effect of a static magnetic field on fracture healing in a rabbit radius. Clinical Orthopaedics and Related Research. 1985; 222, 300-306. Gmitrov J., Ohkubo Ch., Okano H. (2002). Effect of 0.25 T static magnetic field on microcirculation in rabbits. Bioelectromagnetics 23:224-229. Hofman, D., Arnold, F., Cherry, G., Lindholm, C., Bijellerup, M. and Glynn, C. (1997) Pain in venous leg ulcers, Journal of Wound Care, 6 (5), pp. 222-224 Ichioka S., Iwasaka M., Shibata M., Harii K., Kamiya A., Ueno S. (1998). Biological effects of static magnetic fields on the microcirculatory blood flow in vivo: a preliminary report. Med. Biol. Eng. Comput, vol 36, 91-95. Kanai S; Okano H; Susuki R & Hiroko A (1998). Therapeutic effectiveness of static magnetic fields for low back pain monitored with thermography and deep body thermometry. J. of Japanese Soc of Pain Clinicians, 5(1):5-10 Man D., Man B., Plosker H. (1999). The influence of permanent magnetic field therapy on wound healing in suction lipectomy patients: A double-blind study. Plastic and reconstructive surgery . 104: 2261-2266 Mayrovitz HN & Larsen PB (1992). Effects of pulsed electromagnetic fields on skin microvascular blood perfusion. Wounds, 4:197-202 Mekkes J R et al (2003) Causes, investigations and treatment of leg ulceration, British Journal of Dermatology, 148: 388-401 Noonan, L. and Burge, S. (1998) Venous leg ulcers: is pain a problem? Phlebology, 13, pp. 14-19 Royal College of Nursing (1998) The management of patients with venous leg ulcers. Clinical practice guidelines, RCN London. Stacey, M., Falanga, V., Marston, W., Moffatt, C., Phillips, T., Sibbald, R., Varnscheidt, W., and Lindholm, C. (2002) Compression therapy in the treatment of

Eccles & Hollinworth, 2004, Magnopulse Report 41
venous leg ulcers: a recommended management pathway, EWMA Journal, 2 (1), pp. 9-13 Szor JK & Topp R. (1998). Use of Magnet therapy to heal an abdominal wound: A case study. Ostomy/Wound Management. 44(5): 24-29

Eccles & Hollinworth, 2004, Magnopulse Report 42
APPENDICES

Eccles & Hollinworth, 2004, Magnopulse Report 43
APPENDIX 1 – THE QUESTIONNAIRE
Patient ID Number
Male or Female (Please circle)
M F
Patient Date of Birth
Nurse name
Nurse Contact . Work phone No
GP Address
GP letter sent (please tick and initial)
DEVICE CODE
Table 1 - Wound Assessment
Study duration
Date
Digital photo taken (Tick)
Current wound care Treated for Infection Yes or No
Other comment
Start
4 weeks
8 weeks
12 weeks

Eccles & Hollinworth, 2004, Magnopulse Report 44
Table 2 - Quality of Life Assessment
Date Pain Score 1-5
Daily Activity Score 1 – 5
Feelings Score 1 – 5
Overall Health Score 1 – 5
Change in Health Score 1 – 5
Quality of Life Score 1 - 5
Start of study
End of 4 weeks
End of 8 weeks
End of 12 weeks
The following assessments are based on the following QOL questionnaires (The COOP system, Tools for Primary Care Research, Stewart et al, 1991)

Eccles & Hollinworth, 2004, Magnopulse Report 45
PAIN
During the past four weeks…. How much bodily pains have you generally had?
No pain
1
Very mild pain
2
Mild pain
3
Moderate pain
4
Severe pain
5

Eccles & Hollinworth, 2004, Magnopulse Report 46
CHANGE IN HEALTH
How would you rate your overall health now compared to 4 weeks ago?
Much better 1
A little better
2
About the same 3
A little worse 4
Much worse 5

Eccles & Hollinworth, 2004, Magnopulse Report 47
DAILY ACTIVITIES
During the past four weeks…. How much difficulty have you had doing your usual activities or tasks, both inside and outside the house because of your physical and emotional health?
No difficulty at all
1
A little bit of difficulty
2
Some difficulty
3
Much difficulty
4
Could not do
5

Eccles & Hollinworth, 2004, Magnopulse Report 48
FEELINGS During the past 4 weeks…
How much have you been bothered by emotional problems such as feeling anxious, depressed, irritable or downhearted and blue?
Not at all
1
Slightly
2
Moderately
3
Quite a bit
4
Extremely
5

Eccles & Hollinworth, 2004, Magnopulse Report 49
OVERALL HEALTH During the past 4 weeks…
How would you rate your health in general?
Excellent
1
Very good
2
Good
3
Fair
4
Poor
5

Eccles & Hollinworth, 2004, Magnopulse Report 50
QUALITY OF LIFE
How have things been going for you during the past 4 weeks?
Very well: Could hardly be better.
Pretty good.
Good & bad parts About equal.
Pretty bad.
Very bad: Could hardly be worse.
1. 2. 3. 4.
5.

Eccles & Hollinworth, 2004, Magnopulse Report 51
APPENDIX 2 Putative Mechanisms of action of Static Magnetic fields in ulcer healing Promotion of injury current Many studies have demonstrated the efficacy of electrical current in promoting wound healing. It seems likely that this is due to promotion of the so called injury current that is generated rapidly at a wound site and which is a crucial part of the wound healing mechanism. Perhaps the best recognised and acknowledged effect of electric current is in the promotion of fracture healing. A bone growth stimulator, which works by electromagnetism, has an 80% success rate in promoting the union of non-healing fractures and has FDA approval (Bassett et al, 1981). All electrical currents generate magnetic fields and all magnetic fields cause a change in electrical potential. Therefore, an interaction of magnetic fields with ion fluxes across the cell membrane is very likely. The study of Bruce et al (1985) of the effects of static magnetic fields on fracture healing in the rabbit radius that demonstrated significantly greater bone strength at the fracture site perhaps suggests that static magnetic fields could promote bone healing in a similar fashion. Furthermore it has been shown that connective tissue cells placed in a static magnetic field increase proliferative and functional capacity by 20% (Bassett & Herrmann, 1968). Magnets and circulation Chronic wounds have a reduced supply of oxygen and nutrients due to poor blood flow. Healing requires an environment that will optimise supply of nutrients and oxygen. Increased blood perfusion and skin temperature have been observed in human arms exposed to pulsed magnetic fields (Mayrovitz & Larsen, 1992). Many of the studies that demonstrate a beneficial effect of electrical currents on wound healing report an improved circulation as well as pain relief as a consequence of treatment. There are studies both in animals and humans that suggest that static magnetic fields have a circulation enhancing effect (Gmitrov et al, 2002; Ichioka et al 1998; Kanai,1998).