proteomics fingerprinting of phagosome maturation and evidence
TRANSCRIPT
Proteomics Fingerprinting of PhagosomeMaturation and Evidence for the Roleof a G� during Uptake*□S
Daniel Gotthardt,a,b,c Vincent Blancheteau,c,d Armin Bosserhoff,e Thomas Ruppert,e
Mauro Delorenzi,f,g,h and Thierry Soldatia,d,i,j
Phagocytosis, whether of food particles in protozoa orbacteria and cell remnants in the metazoan immune sys-tem, is a conserved process. The particles are taken upinto phagosomes, which then undergo complex remodel-ing of their components, called maturation. By using two-dimensional gel electrophoresis and mass spectrometrycombined with genomic data, we identified 179 phagoso-mal proteins in the amoeba Dictyostelium, including com-ponents of signal transduction, membrane traffic, and thecytoskeleton. By carrying out this proteomics analysisover the course of maturation, we obtained time profilesfor 1,388 spots and thus generated a dynamic record ofphagosomal protein composition. Clustering of the timeprofiles revealed five clusters and 24 functional groupsthat were mapped onto a flow chart of maturation. Twoheterotrimeric G protein subunits, G�4 and G�, appearedat the earliest times. We showed that mutations in thegenes encoding these two proteins produce a phagocyticuptake defect in Dictyostelium. This analysis of phago-some protein dynamics provides a reference point forfuture genetic and functional investigations. Molecular& Cellular Proteomics 5:2228–2243, 2006.
Phagocytosis is the complex process by which eukaryotesingest large particles of over 200-nm diameter. Many primitiveeukaryotic cells phagocytose food particles, whereas in meta-zoa so-called “professional phagocytes” like the neutrophilsand macrophages of the immune system specialize in engulf-ing invading microorganisms and parasites as well as necroticand apoptotic cell remnants. Usually phagocytosis is trig-
gered by contact of the particle with the cell surface, whichinduces its actin-mediated engulfment into a membrane-bound phagosome derived from the plasma membrane. Otherendomembrane compartments such as endosomes and theendoplasmic reticulum (ER)1 contribute to the newly formedphagosomes. After killing of the engulfed microorganism, thecontents of the phagosome are digested, and finally the lyso-somal hydrolases are recycled for further use. During thismaturation process, the phagosome remodels the protein andlipid components of its membrane as well as the solubleluminal components (1). Maturation of the phagosome is thusa normal part of its function, but the organelle can also beremodeled by some bacterial pathogens and eukaryotic par-asites that “hijack” phagosomes and use them as a refugewhere they can proliferate and evade the surveillance of theimmune system (2).
Numerous studies have contributed to our understanding ofthe importance of many factors in phagosome maturationincluding phosphoinositides (3) and other lipids (4), small GT-Pases (5), signaling and actin dynamics (6, 7), and fusion withendocytic compartments (8, 9). Yet despite a century of study,the mechanisms of phagocytic uptake and maturation are stillrelatively poorly understood. Exciting progress has beenmade, however, since the advent of large scale proteomicsmethods, which have revealed new facets of this organelle(10). By combining two-dimensional (2D) gel electrophoresiswith mass spectrometry, the first proteomics analysis of pha-gosomes from mouse macrophages identified over 140 pro-teins (11). This analysis found diverse protein classes includ-ing not only the expected lysosomal proteins but also a largevariety of proteins involved in regulating membrane traffick-ing, such as SNAREs and Rab GTPases as well as a subset ofheterotrimeric G protein subunits involved in signal transduc-tion and many others (11). Despite these pioneering studiesand recent technical advances, time-dependent organelleproteomics is still in its infancy. This is largely due to thepaucity of appropriate bioinformatics tools to extract andintegrate large scale and time-profiled proteomics data.
From the aDepartment of Molecular Cell Research, Max PlanckInstitute for Medical Research, bDepartment of Internal Medicine IV,University Hospital of Heidelberg, and eZentrum fur Molekulare Biolo-gie der Universitat Heidelberg (ZMBH), D-69120 Heidelberg, Ger-many, dDepartment of Biological Sciences, Imperial College, LondonSW7 2AZ, United Kingdom, fISREC National Centre of Competence inResearch (NCCR) Molecular Oncology, Swiss Institute of Experimen-tal Cancer Research (ISREC), Epalinges, CH-1006 Switzerland , gIS-REC Swiss Institute of Bioinformatics (SIB), CH-1015 Lausanne, Swit-zerland, and iDepartment de Biochimie, Faculte des Sciences,Universite de Geneve, CH-1211 Geneve-4, Switzerland
Received April 3, 2006, and in revised form, August 10, 2006Published, MCP Papers in Press, August 22, 2006, DOI 10.1074/
mcp.M600113-MCP200
1 The abbreviations used are: ER, endoplasmic reticulum; 2D, two-dimensional; NSF, N-ethylmaleimide-sensitive factor; SNARE, solubleNSF attachment protein receptor; PMF, peptide mass fingerprint;HSP, heat shock protein.
Research
© 2006 by The American Society for Biochemistry and Molecular Biology, Inc.2228 Molecular & Cellular Proteomics 5.12This paper is available on line at http://www.mcponline.org

The social amoeba Dictyostelium is a very effective phag-ocyte, and its experimental versatility makes it an ideal can-didate for multidisciplinary studies of cell function. Its genomeis fully sequenced, assembled, and thoroughly and accuratelyannotated (12), confirming that amoebae are the closestgroup to metazoa and fungi. Large scale analyses are nowpossible in Dictyostelium by random insertion of plasmid se-quences (13), microarrays (14), and proteomics (15, 16). Dic-tyostelium is also a well established model organism in whichto study interactions between the host cell and a variety ofhuman pathogens (17) including Legionella (18, 19), Mycobac-terium (20), and Pseudomonas aeruginosa (21, 22). Further-more the morphology and mechanisms of macropinocytosisand phagocytosis in Dictyostelium are very similar to those inmetazoa (16, 23–26). Protozoan amoebae in general are nat-ural hosts for bacterial pathogens and can be made to hostexperimental species of bacteria (27). Proteomics studies ofphagosomes isolated from the amoeba Entamoeba histo-lytica, for example, have revealed several aspects of phago-some signaling, uptake mechanisms, and time-dependentmaturation in common with phagocytosis in mammalian pro-fessional phagocytes (28–31). Interestingly as in mouse pha-gosomes, a subset of heterotrimeric G protein subunits wereidentified in the phagosomes of E. histolytica (31).
Here we used a combination of time-resolved 2D gel elec-trophoresis and mass spectrometry-assisted protein identifi-cation to generate a protein history of the life of a phagosomein Dictyostelium, incorporating 179 phagosomal components.By clustering proteins that appear and disappear from thephagosome at similar times, we defined groups of proteinsand functions that can be placed on a flow chart of phago-some maturation. Validating this approach, we found that twoheterotrimeric G protein subunits, G�4 and G� belong to twodistinct but related groups of proteins present at early times inphagosome maturation. By studying Dictyostelium strainswith ablations of the genes encoding G�4 and G� using a flowcytometry-based assay for phagocytic uptake, we demon-strated that both G�4 and G� function in an early step ofphagocytosis.
EXPERIMENTAL PROCEDURES
Cell Culture—Dictyostelium discoideum cells of wild-type strainAx2 were grown axenically in HL5c medium (32) supplemented with10 units/ml penicillin and 10 �g/ml streptomycin on plastic dishes orin shaking culture (at 180 rpm) at 22 °C. Mutant cell lines wereselected and grown in HL5c medium supplemented with 5 �g/mlG418.
Antibodies—The antibodies used in this study were mouse mono-clonal antibodies and rabbit polyclonal antibodies raised against Dic-tyostelium proteins as listed in Supplemental Table SII.
Quantitative Immunoblotting—After SDS-PAGE (33) and transferonto nitrocellulose membranes (Protran, Schleicher & Schuell), immu-nodetection was performed as described previously using horserad-ish peroxidase-coupled goat anti-mouse or goat anti-rabbit IgGs(BioRad) at 1:5,000 dilution (34). Detection was performed with ECLPlus (Amersham Biosciences) using a chemiluminescence imager
(LAS-1000, Fuji Film). Data quantification was carried out with ImageGauge version 3.0 (Fuji Film).
Buffers—Soerensen buffer contained 15 mM KH2PO4, 2 mM
Na2HPO4, pH 6. Homogenization buffer contained 20 mM HEPES-KOH, pH 7.2, 0.25 M sucrose, 1� CompleteTM EDTA-free proteaseinhibitor (Roche Applied Science). Membrane buffer contained 20 mM
HEPES-KOH, pH 7.2, 20 mM KCl, 2.5 mM MgCl2, 1 mM DTT, 20 mM
NaCl. Storage buffer contained 25 mM HEPES-KOH, pH 7.2, 1.5 mM
magnesium acetate, 1 mM NaHCO3, 1 �M CaCl2, 25 mM KCl, 1 mM
ATP, 1 mM DTT, 1� Complete EDTA-free protease inhibitor, 100 mM
sucrose.Isolation of Phagosomes—Phagosomes were prepared as de-
scribed before (16, 35) and as briefly outlined in the supplementalinformation.
Carbonate Extraction—Carbonate extraction of phagosome mem-branes was carried out as described previously (36). In brief, freshlyprepared phagosome pellets (about 7 � 1010 phagosomes preparedfrom 1.5 � 109 cells containing an average of 46.7 beads/cell) wereresuspended in carbonate buffer (200 mM Na2CO3 (Sigma), pH 11) byvortexing. After homogenization by five passages through the needleof a 1-ml insulin syringe, samples were kept on ice for 1 h. Strippedphagosome membranes were repelleted by ultracentrifugation for 1 hat 100,000 � g in a Beckmann MLA130 rotor. Pellets were resus-pended in lysis buffer containing 7 M urea (GE Healthcare), 2 M
thiourea (Amersham Biosciences), 2% (w/v) CHAPS (Calbiochem),2% (w/v) ASB-C8Ø (Calbiochem), 1% (w/v) DTT (Pharmacia Biotech),2% (v/v) ampholytes (IPG buffer, pH 3–10 non-linear, AmershamBiosciences), and a protease inhibitor mixture (Complete EDTA-free).After sonication, isoelectric focusing gel electrophoresis was carriedout as described below. Supplemental information is available.
Sample Preparation and 2D Gel Electrophoresis—Intact purifiedphagosomes were resuspended in lysis buffer containing 7 M urea(Merck), 2 M thiourea (Merck), 2% (w/v) CHAPS (Sigma), 1% (w/v) DTT(Sigma), 2% (v/v) Pharmalyte pH 3–10 (Amersham Biosciences), anda protease inhibitor mixture (Complete EDTA-free, Roche AppliedScience) (37, 38). Suspensions were sonicated 3 � 10 min at 4 °C ina bath sonicator, incubated at room temperature for 2 h, and centri-fuged for 60 min at 75,000 � g in a Beckmann TL120 centrifuge, andsupernatants were stored at �80 °C until further use.
Extracts were separated in the first dimension using 18-cm stripswith immobilized non-linear gradients from pH 3–10 pH (AmershamBiosciences) followed by standard SDS-PAGE as described previ-ously (37, 39–42) with minor modifications described in the supple-mental information. 2D gels were either stained with silver (43) or withcolloidal Coomassie Blue (Novex/Invitrogen) according to the manu-facturer’s instructions. The gels were scanned using a Sharp JX-330scanner and Imagemaster Labscan software. Procedures were car-ried out under standardized conditions for all gels. Supplementalinformation is available.
Mass Spectrometry—Individual spots were excised from 2D gels,reduced with DTT, alkylated with iodoacetamide, and digested withtrypsin as described previously (44). Following digestion, tryptic pep-tides were extracted from the gel pieces with 50% acetonitrile, 0.1%TFA; concentrated; and analyzed by mass spectrometry.
For peptide fingerprinting by MALDI-TOF mass spectrometry (Ul-traflex, Bruker), samples were desalted using ZipTip (Millipore) ac-cording to the manufacturer’s instructions and spotted onto a steeltarget using �-cyano-4-hydroxycinnamic acid as matrix. The peptidemass fingerprint (PMF) was acquired after external calibration (pep-tide calibration standard II, Bruker) in positive ion reflector mode. Forprotein identification by PMF, peptide masses were labeled manuallyusing the SNAP algorithm (signal to noise ratio � 3; quality factorthreshold, 100) (flexAnalysis, Bruker) by comparison with a controlsample taken from a spot of an empty area of the same gel. The PMF
Phagosome Protein Dynamics
Molecular & Cellular Proteomics 5.12 2229

was searched against the Dictyostelium database (protein sequencesfor dictyBase primary features, 13,676 sequences, at dictybase.org)using Mascot version 2.0.5 (Matrix Science). The algorithm was set touse trypsin as the enzyme, allowing for one missed cleavage site andassuming carbamidomethyl as a fixed modification of cysteine andoxidized methionine as a variable modification. Mass tolerance wasset to 100 ppm unless otherwise indicated. Protein hits were consid-ered identified if the Mascot score exceeded the significance level(p � 0.05).
For peptide sequencing by ESI Q-TOF mass spectrometry, pep-tides were desalted and concentrated using custom-made chromato-graphic columns (Poros 50 R2, Perseptive Biosystems) (45). Theywere eluted directly into a precoated borosilicate nanoelectrosprayneedle (MDS Protana, Odense, Denmark). Mass spectrometry wasperformed on a Q-TOF mass spectrometer (PE Sciex, Weiterstadt,Germany) equipped with a nano-ESI ion source (MDS Protana). Apotential of 900 V was applied to the nanoelectrospray needle. De-clustering potential and focusing potential were set to 40 and 100,respectively. Fragmentation of selected peptides (unit resolution) wasusually performed at three different collision energies (22, 27, and 35V). The data were processed using the Bioanalyst software (PE Sciex).
Image Processing and Dataset and Statistical Analyses—The digi-talized 2D gels of the time series were analyzed using the Phoretix 2DEvolution (version 2005) software (Nonlinear Dynamics, Newcastle-upon-Tyne, UK) for spot detection, gel matching, and backgroundcorrection (mode of nonspot, vector size 100 pixel), and these datawere normalized to the sum of the total spot volume. Data wereexported to a spreadsheet program (Microsoft Excel).
Temporal Profile Data Analysis—Data analysis was performed in R(cran.r-project.org). For data normalization, the spot intensity vectorsper time point were first scaled to a constant sum of intensities, andthen the time series vector per spot was rescaled so that the maxi-mum intensity was standardized to a value of 1,000. Spots wereclassified into groups with similar time profiles with the partitioningaround medoids (PAM) algorithm (46) and a predefined number of 24groups because silhouette width values did not support any specificnumber of groups in the data. Details about the choice of this value of24 is available in the supplemental information. Only the 898 spotsthat were found in at least two time points were used. Of the 490spots detected at only one time point, only one representative fromeach of the six time points was taken for analysis. The distancemeasure was 1 � Pearson correlation for the transformed variableZ � log2 (1 � ratio of the intensity to the mean intensity). Color-codedintensity plots for Z were produced with the function “heatmap.”Relationships between the 24 groups were visualized in a hierarchicalclustering dendrogram of their average profiles (hclust function in R,average linkage method, 1 � Pearson correlation as distance). Forcross-correlation analysis, the pairwise Pearson correlations werecomputed between each of the averaged profiles of the 24 groups,and this correlation matrix was represented on a false color scale.
Flow Cytometry-based Uptake Assay—We used a flow cytometry-based particle uptake assay detailed in the supplemental information.Briefly 107 cells grown on plates were harvested, resuspended in 5 mlof HL5c medium, placed in one well of a 6-well plate, and shaken at150 rpm. After washing, 2 � 109 1-�m fluorescent beads (FluoresbriteYG 1-�m microspheres, Polysciences, Inc.) were added to the cells insuspension and incubated at room temperature under constant shak-ing at 120 rpm. At each time point, 0.5 ml of cells was harvested, andbead uptake was stopped. Then cells were centrifuged at 500 � g for5 min at 4 °C, resuspended in 0.5 ml of ice-cold Soerensen buffercontaining 120 mM sorbitol, and kept on ice until fluorescence-acti-vated cell sorter data acquisition. For each time point, 30,000 fluo-rescence events were acquired using a FACScan flow cytometer (BDBiosciences), and bead uptake was quantified. Mean fluorescence
was calculated by analyzing histograms showing fluorescence versusevents. Supplemental information is available.
RESULTS AND DISCUSSION
In analyzing the proteome of Dictyostelium phagosomes,we had two aims: to identify new protein components and tosee how phagosome proteins change during maturation. Todo so, we prepared large amounts of latex bead phagosomesby using a protocol that includes physiological concentrationsof ATP, ensuring high yields and purity (see supplementalinformation). Briefly using markers for a variety of organelles, wecalculated that our phagosome fractions were enriched up toabout 100-fold over a crude membrane fraction and were de-pleted about 10-fold of major contaminants, such as contractilevacuole, endoplasmic reticulum, and mitochondria (16, 35). Inaddition, our pulse-chase protocol allows purification of phago-some at various times that were shown previously to cover allthe steps of Dictyostelium phagosome maturation from uptakethrough digestion and finally to exocytosis of the undigestedremnants (16). We separated phagosome proteins by 2D gelelectrophoresis using preparative gels from which we pickedspots and identified the corresponding proteins (Fig. 1) andanalytical gels of six different time points during maturation fromwhich we computed a time profile for each spot (Figs. 2 and 3).
Identification of Phagosome Proteins—We began by apply-ing standard protein extraction, solubilization, and 2D gelprocedures (see “Experimental Procedures”) to analyze theprepared phagosomes. This resulted in highly reproduciblegels with very good spot quality (see for example, Fig. 1A (gelA); see also Ref. 16). However, because these procedures donot solubilize hydrophobic and transmembrane proteins verywell, we also explored a variety of the latest generation de-tergents (see supplemental information) as well as variousextraction methods and 2D gel protocols. Carbonate extrac-tion (36) followed by solubilization in a buffer containing 2%CHAPS and 2% 4-octylbenzoylamidopropyldimethylammo-niopropanesulfonate (47) yielded excellent results; a prepar-ative gel (gel B) from a phagosome extract prepared accord-ing to this method is shown in Fig. 1B.
A total of 180 and 232 spots were picked from gels A andB, respectively, and analyzed by peptide fingerprinting (see“Experimental Procedures” and Supplemental Figs. S1 andS2 for spectra). Among these, 11 spots were keratin, and 72others could not be identified for technical reasons. In addi-tion, four proteins corresponding to spots 134 and 135 of gelA and spots 136 and 166 of gel B were identified by ESI-MS/MS (see Supplemental Table SI and Figs. S1 and S2 forrepresentative spectra). In total, 137 spots from gel A and 192spots from gel B were identified as known proteins or pre-dicted open reading frames in the Dictyostelium genome (dic-tybase.org (12)). Taking into account the proteins common toboth gels and counting proteins present as multiple spots,including degradation products, as one protein, a total of 179different proteins were finally identified. Table I lists all these
Phagosome Protein Dynamics
2230 Molecular & Cellular Proteomics 5.12

proteins, their location(s) on each gel, their known or pro-posed functions and cellular locations, whether they werefound previously in the mouse phagosome proteome (11), andwhether their presence has been confirmed by our ongoinglarge scale analysis of Dictyostelium phagosomes by one-dimensional gel electrophoresis and liquid chromatographytandem mass spectrometry.2 Supplemental Table SI presents
additional basic information about each spot identification.The phagosomal proteins we identified belonged to a vari-
ety of functional classes (Fig. 1C). Reflecting the digestivecharacter of phagosomes and their export of nutrients to thecytosol, 37% of the proteins were members of the “energy,transport, and metabolism” class. The second largest group,comprising 13% of polypeptides, was proteins involved inmembrane traffic, reflecting the importance of transport toand from the maturing phagosome. Among them, we found alarge collection of small GTPases, some of which are known
2 M. Desjardins, M. Hagedorn, R. Dieckmann, and T. Soldati,unpublished data.
FIG. 1. 2D gel electrophoresis of phagosome proteins, their predicted functions, and subcellular locations. Preparative 2D gels ofphagosome proteins extracted under standard conditions (A) or under conditions that favor extraction of membrane proteins (B) are shown.The phagosomes analyzed in gel A are a pool of the early three time points of a pulse-chase feeding (see Fig. 2), whereas gel B is derived froma pool from the three late time points. The pH range of the first dimension isoelectric focusing gel is shown at the bottom, and the sizes ofmolecular mass standards for the second dimension are indicated on the left in kDa. The proteins corresponding to 137 spots on gel A and192 spots on gel B (circled in blue) were identified by mass spectrometry and comparison with the Dictyostelium genome. Further data arecompiled in Table I and Supplemental Table SI. The identified phagosomal proteins were classified according to their predicted or knownfunctions (C) and subcellular locations (D).
Phagosome Protein Dynamics
Molecular & Cellular Proteomics 5.12 2231

to play a role in uptake processes in Dictyostelium (24, 48–50)and macrophages (51, 52). Of these, Rab11B, Rab14, Rab7,and Rap1 were also found in mouse phagosomes (11), andRab7 was found in E. histolytica phagosomes (31), indicatingthat the phagocytic mechanisms have been conservedthrough evolution. In the membrane traffic group, we alsodetected members of the SNARE machinery responsible forthe specificity of membrane fusion. Of these, only �- and�-SNAP (soluble NSF attachment protein) have been found inmouse phagosomes. We also found dynamin, a protein in-volved in vesicle fission.
Other large groups of proteins we identified function insignal transduction (9%) and cytoskeleton organization (7%).These signaling proteins included the heterotrimeric G proteinsubunits G�, another G�-like protein, and G�4. G�2, G�1, andG�2 have been found previously in mouse phagosomes (11).Not surprisingly, in view of their richly documented role inphagocytosis, we found a large variety of cytoskeleton pro-teins, some of which have also been found in mouse phago-somes. In addition to the signaling and cytoskeleton func-
tional groups, we found a large group of heat shock proteins(HSPs) and other chaperones (9% of all proteins). HSPs act aschaperones and assist protein synthesis, folding, and break-down. They also regulate actin polymerization/capping, un-coating of clathrin-coated vesicles, and phagocytosis in mac-rophages (53). Besides proteins known to play a role inphagocytosis and known proteins for which a role in phago-cytosis has not been described, the functions of over 35conserved proteins we identified (8%) are not known. Addi-tional research will be necessary to assess the role of thesenovel candidates in phagocytic functions.
Fig. 1D shows the known or predicted subcellular locationsof the phagosome components we identified. Cytosolic pro-teins comprise 34%, endosomal and lysosomal proteins com-prise 12%, and plasma membrane proteins comprise 8% ofthe total. The subcellular locations of 28% of them, however,are not known. This broad variety of functions and subcellularlocations reflects the complex processes involved in the up-take of particles and the subsequent maturation of the pha-gosome into a killing and digestive compartment. It is impor-
FIG. 2. Changes in protein composition accompanying phagosome maturation. 2D gels of phagosomal proteins purified at six timepoints during a pulse-chase feeding regime as indicated at the top right corner of each gel are shown. With the exception of spots thatcompletely disappear or appear (see Table III) the spots that are at least 2-fold more abundant than at the previous time point (e.g. in Bcompared with A) are circled in red; spots that are at least 2-fold less abundant are circled in green. B shows 116 red and 128 green spots;C shows 111 red and 65 green spots; D shows 65 red and 105 green spots; E shows 74 red and 63 green spots; F shows 49 red and 72 greenspots. Labeling of the gels is as in Fig. 1.
Phagosome Protein Dynamics
2232 Molecular & Cellular Proteomics 5.12

tant to note that it is difficult to judge a priori the specificity ofthe presence of cytosolic proteins on phagosomes. As de-tailed in the supplemental information, some abundant cyto-solic proteins are represented, but many are not. In addition,the fact that the presence of most proteins follows a complextemporal profile speaks against a simple piggy-backing dur-
ing purification but in favor of a specific and regulatedrecruitment.
Many of the proteins we identified have evident roles to playat one or another stage of phagosome maturation (seeabove), but the presence of others is more surprising andmight reveal additional processes linked to the phagosome.
FIG. 3. Temporal profiling of phagosome proteins by 2D gel and Western blotting. A, a composite image of a 2D gel in which all 1,388spots from the six time points in Fig. 2 have been superimposed on the gel from time point 5�/0�. The 490 spots present at a single time pointare circled in green; the 125 spots matched to spots identified on the two preparative gels are circled in red. The remaining 773 spots are circledin blue. Labeling of the gels is as in Fig. 1. B, a heat map showing the computed and normalized intensities of 904 spots over the six time points,including the 898 spots present at two or more time points and the six representative spots present at a single time point. C, Western blottingof a selection of 21 endosomal/phagosomal proteins over the time course of phagocytosis. Only the 10 previously unpublished blots areshown. D, a heat map derived from the quantitative data produced by densitometry of the 21 blots, obtained from the various experimentsindicated on the right: “a,” blots and profiles published in Ref. 16; “b,” profiles but not blots published in Ref. 16; “c,” blot and profile publishedin Ref. 68. The “w” (also used in Supplemental Figs. S3-1 to S3-6) indicates that these profiles were obtained from Western blotting.
Phagosome Protein Dynamics
Molecular & Cellular Proteomics 5.12 2233
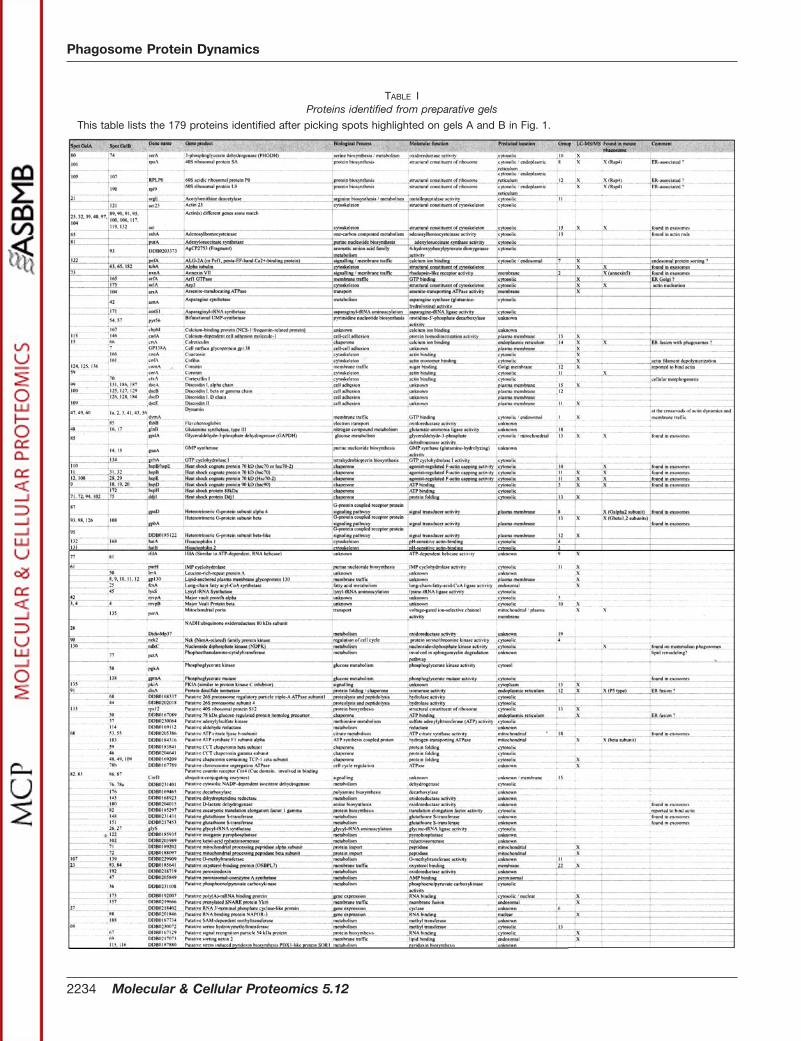
TABLE IProteins identified from preparative gels
This table lists the 179 proteins identified after picking spots highlighted on gels A and B in Fig. 1.
Phagosome Protein Dynamics
2234 Molecular & Cellular Proteomics 5.12

One such example is the identification of proteins from theER, Golgi apparatus, and peroxisomes among the phago-some proteins. The presence of four ribosomal components,four tRNA synthetases, the 54-kDa subunit of the signal rec-ognition particle, and three translation elongation factors(which are actin-binding proteins), all factors involved in pro-tein biosynthesis, may be explained either by protein synthe-sis taking place on the phagosome itself or substantial asso-ciation/fusion of phagosomes with the ER (54). This latter
hypothesis is supported by the presence of a subset of ER-resident proteins (calreticulin, protein-disulfide isomerase,and a homologue of the immunoglobulin Binding Protein BiP)and ER export/trafficking regulators (Sar1 and Rab1D) in thephagosomes.
Dynamics of the Phagosome Proteome—To generate tem-poral profiles of phagosome proteins during maturation, wemade use of our established pulse-chase protocol (see sup-plemental information). For each maturation stage we quan-
TABLE I—continued
Phagosome Protein Dynamics
Molecular & Cellular Proteomics 5.12 2235

titate the number of purified phagosomes by measuring lightscattering in the fraction collected from the sucrose gradient.This measure is exquisitely precise and allows us to adjust thephagosome fractions for identical concentration of phago-somes. This is further demonstrated both by the almost iden-tical protein concentration measured in each normalized frac-tion (data not shown) and the equal loading of total proteinson one-dimensional gels (16, 35). We concluded that the totalamount of protein per phagosome does not vary significantlythroughout maturation (less than 15%) and is �12 �g/109
phagosomes. Therefore, each 2D gel of the series was loadedwith an equal amount of phagosomes and of total protein andstained to a similar extent. Fig. 2 presents a gallery of 2D gelsof phagosome extracts obtained at six time points including a5-min pulse (5�/0�), a 15-min pulse (15�/0�), and 15-min (15�/15�), 45-min (15�/45�), 105-min (15�/105�), and 165-min (15�/165�) chases after a 15-min pulse. The colored circles aroundthe spots indicate a difference compared with the precedingtime point: red circles indicate spots that increased more than2-fold in intensity, whereas green circles indicate spots thatdecreased more than 2-fold in intensity. (The spots that weredetected at all time points (in varying amounts) are circled inblue in Supplemental Fig. S1.)
This simple analysis revealed substantial remodeling duringthe different phases. For example, the 5-min pulse (Fig. 2A) hadthe greatest number of different spots (1,029); of these, 259were specific for this time point (more than at any other timepoint) (Table II). This complexity at early times likely reflects thefact that early phagosomes contain both proteins derived fromthe plasma membrane and newly recruited phagosome-specificproteins (16). Not surprisingly, comparison of the second timepoint with the first revealed the disappearance of 469 spots andappearance of 130 others (Table III). This substantial remodelinglikely includes sorting to recycle plasma membrane proteinsback to the surface (55, 56). Overall the total number of spotsdetected decreased over time except at the last time point(Table II). Vast remodeling of the phagosomes during maturationwas indicated by the fact that, on average, 184 spots appearedand 291 spots disappeared between any two consecutive timepoints (Table III). Again on average, 35% of the spots detectedwere present only at one time point, 20% were detected at only
two time points, and 7% were detected at five time points.Nevertheless 12% of all spots were present at all six time points(Supplemental Fig. S1 and Table IV).
In summary, this analysis clearly indicates distinct phases inthe maturation program. We detected the most remodeling atthe beginning and end of the pathway and thus propose thatuptake and exocytosis are the most complex “multidisci-plinary” stages, requiring integration of signaling, membranetrafficking, and cytoskeleton reorganization. The more “spe-cialized” intermediate stages, we suggest, are more uniquelydevoted to successive membrane trafficking steps necessaryfor efficient accumulation of digestive enzymes and extractionand transport of nutrients and may thus require a simplerrepertoire of proteins.
Temporal Changes in Phagosome Components—The com-plexity of the maturation process can be seen from Fig. 3. Thereference gel (Fig. 3A) shows an overlay of the 1,388 spotsdetected in the whole time series superimposed on the gel oftime point 5�/0�. Spots that were present at two or more time
TABLE IIStatistics of detection of protein spots
Time point Not detected Detected At peakPercentage
at peakSpecific for
this time
Percentagespecific for
this time
5�/0� 359 1,029 472 34.0 259 18.615�/0� 698 690 226 16.3 68 4.915�/15� 812 576 204 14.7 30 2.215�/45� 877 511 178 12.8 54 3.915�/105� 937 451 159 11.5 38 2.715�/165� 897 491 149 10.7 41 3.0Sum 1,388 100.0 490 35.3Average 763 625 231 16.7
TABLE IIIChanges between time points
Time points Appearing Disappearing StayingPercentage
staying
5�/0� vs. 15�/0� 130 469 560 54.415�/0� vs. 15�/15� 178 292 398 57.715�/15� vs. 15�/45� 194 259 317 55.015�/45� vs. 15�/105� 198 258 253 49.515�/105� vs. 15�/165� 219 179 272 60.3Average 184 291 360 55.4
TABLE IVDetection statistics
Number ofdetections
Number ofspots
Percentage
1 490 35.32 280 20.23 195 14.04 164 11.85 97 7.06 162 11.7
Sum 1,388 100.0
Phagosome Protein Dynamics
2236 Molecular & Cellular Proteomics 5.12
points are circled in blue or red; the 125 spots circled in redcorrespond to proteins identified from the preparative gels(see Table I, column “Group”). The 490 spots present at onlyone time point are circled in green. Although these spotsinclude proteins that potentially are the most stage-specific,they are also most prone to artifact (degradation and spotsthat could not be matched to other gels), therefore they werenot all included in the cluster analysis; instead six spotsrepresentative of the proteins that appear only at one of eachof the six time points were included. The spots circled in blueor red were analyzed further to monitor how their intensitychanged over time. Spot intensities were quantified by den-sitometry, normalized for the complete temporal profile, anddepicted as heat maps in which red corresponds to highintensity and green corresponds to low intensity (see “Exper-imental Procedures”). To extend the 2D gel data, we alsoanalyzed the pulse-chased phagosome preparations for thepresence of known endosomal and phagosomal proteins byusing quantitative Western blotting (Fig. 3C). This approachalso allowed us to compare the data obtained for a selectionof seven proteins by both Western blotting and 2D gels (seebelow). Again signal intensities were quantified by densitom-etry, normalized for the temporal profile, and depicted as heatmaps (Fig. 3D).
Altogether we obtained 925 profiles (for 898 spots presentat more than one time point, plus the profiles of the six spotsrepresentative of the 490 stage-specific spots, plus the 21profiles obtained by Western blotting) representing 5,550 in-dividual intensity measurements that are presented in the heatmap in Fig. 3B. These “temporal profiles” were submitted tocluster analysis, a method also used to group microarray“expression profiles” according to their degree of similarity.Exploratory analysis using a variety of clustering methods anddistance metrics gave fairly robust results and similar clustersand revealed that the profiles do not fall into a well definednumber of well separated groups. Therefore, the optimal num-ber of clusters was determined so that it would result in (a) arelatively homogeneous number of profiles per group (Fig.4A), (b) fairly distinct average group profiles (as judged byinspection and by cross-correlation (Fig. 4B), see below), and(c) rather homogeneous groups (as judged by the standarddeviation from the average group profile, Fig. 5 and Supple-mental Fig. S3). Finally we used the partition around medoids(PAM) algorithm (46) to classify the 925 profiles into 24 groups(a detailed argument is presented in the supplemental infor-mation and Supplemental Fig. S2). At a higher level in thedendrogram there are five major clusters (Fig. 4, I–V) thatcorrespond roughly to different times of maximal abundanceof each protein during the maturation program.
Many of the 24 groups had simple average profiles, con-sistent with the proteins they represent having a major func-tion at one stage of phagocytosis and with a relatively simple,linear model of phagosome maturation (Fig. 4C). For example,groups 1–6 had a major sharp peak of red (high spot intensity)
and could easily be aligned in such a sequence in associationwith groups that have a slightly broader peaks (groups 8, 10,19, and 22). About a fifth of the groups (groups 7, 9, 12, 13,and 17) comprise proteins that appeared at two stages ofmaturation, including the first time point for four of them. Atthe other extreme, some groups (groups 11, 16, 18, 20, and21) comprise proteins present at most time points, perhapsreflecting an unchanging feature of phagosomes identity or arecurrent function. Finally some groups (groups 14, 15, 23,and 24) comprise proteins that appeared and disappearedfrom the maturing phagosomes in more complex ways, re-flecting either a periodic need for a specific function or theexistence of parallel maturation pathways in which they act atdifferent times.
From Temporal Profiling to Functional Grouping—Clusteranalysis revealed that the 24 groups are organized into fivemajor clusters that are apparent on the tree structure (Fig. 4A,clusters I–V) and are also visible on the cross-correlation mapas square regions of “hot” colors aligned along the diagonal(Fig. 4B, boxes). The groups inside each cluster share a majorpeak at a common time point, and this reflects the fact thatthe clusters (from I to V) can be roughly aligned along an axisof maturation in order of appearance of that major peak. Thisfinding is also consistent with a simple, linear model of pha-gosome maturation as illustrated in Fig. 4C, but more com-plex alternative pathways of maturation are discussed below.
A detailed description of clusters, groups, and proposedassociated functions in maturation is presented in the supple-mental information, and the composition of each group ispresented in Supplemental Figs. S2-1 to S2-6. Briefly lookingat cluster I (groups 1, 2, 8, and 11) and the earliest time point,the presence of group 1 proteins reflects the involvement ofthe actin cytoskeleton, membrane trafficking, and moleculesthat bridge the two functions to trigger and carry out uptake;group 11 includes many enzymes, probably reflecting theearly establishment of the degradative phases of phagocyto-sis, and group 8 includes G�4, suggesting a signaling functionduring uptake (see below). Cluster II (groups 3, 9, 14, and 18)comprises a diverse collection of proteins likely reflecting themetabolic role of the phagosome as well as other functionsthat were proposed recently (see below). Cluster III (groups 4,7, 12, 16, and 20) reflects functions related to late endosomesand multivesicular body formation, including the necessarysignaling, cytoskeleton, and membrane trafficking machinery.The proteins representative of cluster IV (from groups 5, 13,15, 21, and 22) also reflect late endosomal/lysosomal char-acteristics featuring digestive components as well as thecomponents of trafficking associated with recycling/exocyto-sis. Cluster V (groups 6, 17, 19, 23, and 24) completes thisseries, finishing the evolution started in cluster IV, with thepresence of factors typical of late endosomes and recycling/exocytosis, but the prominent digestive character of cluster IVis missing.
Phagosome Protein Dynamics
Molecular & Cellular Proteomics 5.12 2237

FIG. 4. Clustering and cross-correlation analyses of temporal profiles and flow chart of phagosome maturation. A, heat map resultingfrom cluster analysis of 925 temporal profiles and showing the average intensities over the six time points of the 24 groups of proteins indicatedon the left by a Roman numeral (Groups). The number of profiles in each group (Nr profiles) and their attributed name (Names) are indicatedon the right. The tree on the left also illustrates the computed relatedness of the groups and their organization into five clusters (clusters I–V).We named each group according to one representative known protein. When no known and studied protein was present in the group, we
Phagosome Protein Dynamics
2238 Molecular & Cellular Proteomics 5.12

Cross-correlation Analysis Reveals Further Relatedness be-tween Functional Groups—Although clustering is important tointegrate the information and reveal order in large datasets, awell known and inherent feature of most clustering methods isthat sometimes related profiles end up in relatively distant
clusters/groups. Therefore, to extend and strengthen theclustering data, we calculated what we call cross-correlation,that is all the pairwise correlation coefficients between theaverage profiles across all 24 groups. This analysis quanti-tates and highlights the strength of the relationship between
FIG. 5. Two examples of groups. Two of the 24 groups (see complete Supplemental Fig. S3) are illustrated here. Group 8 GpaD (A) includesG�4, three other identified proteins, and 65 unidentified spots, whereas group 13 GpbA (B) includes G�, six other identified proteins, and 40unidentified spots. The top panel shows the average temporal profile of the group (red line) plus or minus one standard deviation (light and darkblue, respectively), the middle panel shows the heat map of the profiles of all group members, and the bottom panel shows a portion of eachgel of the time series (see Fig. 2) containing one representative spot from the group. Data for the other 22 groups are given in SupplementalFigs. S3-1 to S3-6. (Note that the timescale in the diagram on top is linear, whereas the spots and clusters are discrete time points, resultingin a slight shift of alignment.)
attributed a name based on the dictyBase identification number. Group 24 contained no identified protein and was thus named after spot 660,which has a representative profile. B, heat map matrix of pairwise cross-correlation between the groups indicated by the Arabic numerals alongthe top and left sides. Red indicates identity, and the “cooler colors” indicate less relatedness. Clusters are indicated by Roman numerals onthe left and by boxes along the diagonal. Additional strong correlations are emphasized by circles, squares, and diamonds (see main text). C,the scheme in the central panel illustrates the various phases of phagosome maturation from uptake of particles (stars on the left) to the finalegestion of undigested remnants (small triangles on the right). Arrows indicate pathways of membrane traffic and crucial processesaccompanying the various phases of maturation. The upper panel indicates the timing of acidification and neutralization. This scheme is basedon one published previously for macropinocytosis (69). The lower panel shows the heat maps of the average temporal profiles of the 24 groupsindicated at the left, illustrating the stages of the maturation program at which these groups of proteins are present.
Phagosome Protein Dynamics
Molecular & Cellular Proteomics 5.12 2239

any two average temporal profiles of contiguous or non-contiguous groups of the hierarchical clustering tree. On theresulting heat map matrix (Fig. 4B), the index of correlationbetween the average temporal profiles of two groups is indi-cated at the intersection by a color-coded square. Red (on thediagonal) indicates identity, and decreasing similarity is indi-cated by colors that become closer to green.
The cross-correlation map reveals additional relatednessbetween groups outside the major five clusters, visible asisolated or small groups of hot squares off the diagonal (Fig.4B, emphasized by circles, squares, and diamonds). For ex-ample, groups 1, 8, 12, and 13 are highly related (Fig. 4B,circles). In addition to the proteins already mentioned above,group 12 also contains signaling and membrane traffickingproteins, and group 13 also contains some enzymes. Similarlygroups 10 and 11 from cluster I are closely related to groups3, 9, and 18 from cluster II, and finally group 10 from clusterI is related to groups 7 and 20 from cluster III. Overall itappears that group 10 has a remarkable position, being aclose relative of many groups, both inside and outside its
cluster. Altogether these complex patterns of appearanceand disappearance of some protein groups during matura-tion emphasize that the linear maturation program depicted inFig. 4C is an oversimplification and should be completed bycomplex cross-talk between endocytic and phagocytic or-ganelles and/or the existence of alternative parallel maturationpathways (57).
We also focused on proteins for which we had both West-ern blotting and spot quantification data. For example, theprofiles obtained for vacuolin by Western blotting (with anantibody that recognizes both vacA and vacB (58)) and for thevacA spot both fall into group 19, but the profile for vacB is ingroup 15. These groups are in two different but related clus-ters (IV and V) and also show a relatively strong cross-corre-lation (Fig. 4B, see the intersection of groups 19 and 15). Theprofiles obtained for coronin by Western blotting (group 1) andfor the CorA spot (group 11) fall into different groups of thesame cluster (cluster I), but these groups are among thosewith highly cross-correlated average profiles. Similarly theprofile obtained for G� by Western blotting (group 1) and the
FIG. 6. Quantification of phagocytosis in two Dictyostelium G protein mutants. Time courses of the phagocytic uptake of 1-�mfluorescent microspheres by various strains of Dictyostelium are shown. A, fluorescence uptake by G�4-null cells (red curve) and wild-type cells(blue curve) measured by flow cytometry. C, fluorescence uptake by G�-null cells (red curve) and G�� cells (blue curve) (see main text fordetails). Uptake was normalized to wild-type cells or G�� cells, respectively. B and D show the proportion of cells that acquired one or morebeads (red and dark blue curves) and the proportion of cells that contained one bead only (yellow and light blue curves). The red and yellowcurves indicate data for the mutant cell lines, and the dark and light blue curves indicate data for the wild-type and G�� cells. Uptake wasassayed in triplicate, and error bars represent standard deviations.
Phagosome Protein Dynamics
2240 Molecular & Cellular Proteomics 5.12

corresponding GpbA spot (group 13) are neither in the samegroup nor the same cluster (clusters I and IV, respectively) butshow highest pairwise cross-correlation. These data demon-strate that the use of different methods to obtain the temporalprofiles can result in some degree of discrepancy and thusshow some of the limitations of our approach. Neverthelessthe discrepancies are small and do not really affect our overallconclusions and the concept presented here.
Our analysis of time-dependent proteomics data has al-lowed us to establish a model of phagocytic mechanisms thatwill be useful for further functional analysis in Dictyosteliumand other organisms. We next aimed to test a prediction ofthis model as a proof of principle for future investigations.
Heterotrimeric G Protein Function in Early Phagocytosis—Many signaling pathways are activated when a ligand binds toits G protein-coupled receptor; this receptor-ligand bindingactivates the downstream heterotrimeric G protein (consistingof one �, one �, and one � subunit) thus converting theextracellular signal into an intracellular response. Subunits oftrimeric G proteins have been reported in phagosomes frommouse (11) and E. histolytica (31), and a study based on useof inhibitors and toxins has found evidence for a role duringphagocytosis (59). The latter data are contradicted by a recentreport that knock-down of multiple G� and G� in a macro-phage line abolished G protein-coupled signaling without af-fecting phagocytosis (60). In Dictyostelium, there are 14 dif-ferent G� subunits, one G� and one G�-like subunit (12), andone G� subunit. G proteins are essential in this organism forchemotaxis, cell aggregation, and differentiation. In particular,G�2 (61) and G�4 (62, 63) are important for chemotaxis anddifferentiation, but no G� has been shown to play a role inphagocytosis. G�, on the other hand, is required for chemo-tactic responses and multicellular development as well asphagocytosis (64–66).
On our 2D gels, there was a strong signal from G�4 at thetwo earliest time points (Fig. 5A, lower panel) suggesting thatit may be involved in phagocytic uptake. Likewise group 13proteins, including G� (GpbA), were also present around thebeginning of phagocytosis (Fig. 5B). Interestingly both G�4
and G� also peaked at a later time point, perhaps indicating adual role both during the early uptake phase and in a latematuration phase that might reflect the documented role ofG� in actin reorganization (66) and the function of the actincytoskeleton in both uptake and exocytosis (67). Because ofits presence on early phagosomes, we wondered whetherG�4 might also play a role in uptake similar to the functionreported for G� in phagocytosis (66) and thus might be onemissing link upstream of G� linking the G��� complex to anunknown receptor. We therefore compared phagocytosis incells deficient in G�4 subunit (G�4-null cells) with wild-typecells (Ax2 cells) and, as a positive control, cells deficient in G�
subunit (G�-null cells) with cells expressing a fully functionalHis-tagged form of the G� (G��). To do so, we used a flowcytometry-based particle uptake assay to monitor the uptake
kinetics of brightly fluorescent beads (see “Experimental Pro-cedures”). The knock-out strains grew at rates indistinguish-able from their respective controls, demonstrating their rela-tive fitness. Both mutant cell lines had a pronounced defect inbead uptake (Fig. 6). During the 120-min course of the assay,the G�4-null cell population showed an uptake rate of fluo-rescent beads 50% lower than that of the wild-type cells (Fig.6A), and the rate of uptake in the G�-null cell population wasreduced to 40% of that of the G�� cells (Fig. 6C). All the cellsin both mutant strains possessed some phagocytic activityand were able to ingest at least one particle at a rate onlyslightly slower than their respective controls (Fig. 6, B and D,red curves compared with dark blue curves). By contrast, thephagocytic rate in both mutant strains was markedly slowerthan in the controls when the proportion of cells containingonly one bead was plotted against time. In the wild-type andG�� strains, this population appeared and disappeared rap-idly (Fig. 6, B and D, light blue curves), whereas in both mutantstrains (yellow curves), the peak of cells with only one beadappeared later and disappeared only slowly, illustrating thelower initial rate of uptake of both the first and second bead.We therefore conclude that both G�4-null and G�-null strainsare inefficient in an early step of phagocytosis, unambiguouslyimplicating a G� in this mechanism. A similar functional anal-ysis can now be performed for the proteins of unknown func-tion in these groups with the aim of both validating our ap-proach and strengthening the understanding of the role ofheterotrimeric G proteins in phagocytic uptake. The strategycan equally be expanded to any other group of phagosomeproteins.
Acknowledgments—We thank all the laboratory members whocontributed thoughts and comments to this investigation as well ashelp with phagosome purification, in particular Hans-Jorg Warnatz,Eva Neuhaus, and Regis Dieckmann.
* This work was supported in part by the Max Planck Society, TheWellcome Trust, and the Swiss National Science Foundation (to T. S.).The costs of publication of this article were defrayed in part by thepayment of page charges. This article must therefore be herebymarked “advertisement” in accordance with 18 U.S.C. Section 1734solely to indicate this fact.
□S The on-line version of this article (available at http://www.mcponline.org) contains supplemental material.
c Both authors contributed equally to this work.h Supported by the National Centre of Competence in Research
(NCCR) Molecular Oncology, a research program of the Swiss Na-tional Science Foundation.
j To whom correspondence should be addressed. Tel.: 41-22-379-6496; Fax: 41-22-379-6470; E-mail: [email protected].
REFERENCES
1. Desjardins, M., Huber, L. A., Parton, R. G., and Griffiths, G. (1994) Biogen-esis of phagolysosomes proceeds through a sequential series of inter-actions with the endocytic apparatus. J. Cell Biol. 124, 677–688
2. Jutras, I., and Desjardins, M. (2005) Phagocytosis: at the crossroads ofinnate and adaptive immunity. Annu. Rev. Cell Dev. Biol. 21, 511–527
3. Botelho, R. J., Scott, C. C., and Grinstein, S. (2004) Phosphoinositideinvolvement in phagocytosis and phagosome maturation. Curr. Top.
Phagosome Protein Dynamics
Molecular & Cellular Proteomics 5.12 2241

Microbiol. Immunol. 282, 1–304. Anes, E., Kuhnel, M. P., Bos, E., Moniz-Pereira, J., Habermann, A., and
Griffiths, G. (2003) Selected lipids activate phagosome actin assemblyand maturation resulting in killing of pathogenic mycobacteria. Nat. CellBiol. 5, 793–802
5. Niedergang, F., and Chavrier, P. (2005) Regulation of phagocytosis by RhoGTPases. Curr. Top. Microbiol. Immunol. 291, 43–60
6. Niedergang, F., and Chavrier, P. (2004) Signaling and membrane dynamicsduring phagocytosis: many roads lead to the phagos(R)ome. Curr. Opin.Cell Biol. 16, 422–428
7. Castellano, F., Chavrier, P., and Caron, E. (2001) Actin dynamics duringphagocytosis. Semin. Immunol. 13, 347–355
8. Bajno, L., Peng, X. R., Schreiber, A. D., Moore, H. P., Trimble, W. S., andGrinstein, S. (2000) Focal exocytosis of VAMP3-containing vesicles atsites of phagosome formation. J. Cell Biol. 149, 697–706
9. Braun, V., Fraisier, V., Raposo, G., Hurbain, I., Sibarita, J. B., Chavrier, P.,Galli, T., and Niedergang, F. (2004) TI-VAMP/VAMP7 is required foroptimal phagocytosis of opsonised particles in macrophages. EMBO J.23, 4166–4176
10. Desjardins, M., Houde, M., and Gagnon, E. (2005) Phagocytosis: the con-voluted way from nutrition to adaptive immunity. Immunol. Rev. 207,158–165
11. Garin, J., Diez, R., Kieffer, S., Dermine, J.F., Duclos, S., Gagnon, E., Sadoul,R., Rondeau, C., and Desjardins, M. (2001) The phagosome proteome:insight into phagosome functions. J. Cell Biol. 152, 165–180
12. Eichinger, L., Pachebat, J. A., Glockner, G., Rajandream, M. A., Sucgang,R., Berriman, M., Song, J., Olsen, R., Szafranski, K., Xu, Q., Tunggal, B.,Kummerfeld, S., Madera, M., Konfortov, B. A., Rivero, F., Bankier, A. T.,Lehmann, R., Hamlin, N., Davies, R., Gaudet, P., Fey, P., Pilcher, K.,Chen, G., Saunders, D., Sodergren, E., Davis, P., Kerhornou, A., Nie, X.,Hall, N., Anjard, C., Hemphill, L., Bason, N., Farbrother, P., Desany, B.,Just, E., Morio, T., Rost, R., Churcher, C., Cooper, J., Haydock, S., vanDriessche, N., Cronin, A., Goodhead, I., Muzny, D., Mourier, T., Pain, A.,Lu, M., Harper, D., Lindsay, R., Hauser, H., James, K., Quiles, M., MadanBabu, M., Saito, T., Buchrieser, C., Wardroper, A., Felder, M., Thangav-elu, M., Johnson, D., Knights, A., Loulseged, H., Mungall, K., Oliver, K.,Price, C., Quail, M. A., Urushihara, H., Hernandez, J., Rabbinowitsch, E.,Steffen, D., Sanders, M., Ma, J., Kohara, Y., Sharp, S., Simmonds, M.,Spiegler, S., Tivey, A., Sugano, S., White, B., Walker, D., Woodward, J.,Winckler, T., Tanaka, Y., Shaulsky, G., Schleicher, M., Weinstock, G.,Rosenthal, A., Cox, E. C., Chisholm, R. L., Gibbs, R., Loomis, W. F.,Platzer, M., Kay, R. R., Williams, J., Dear, P. H., Noegel, A. A., Barrell, B.,and Kuspa, A. (2005) The genome of the social amoeba Dictyosteliumdiscoideum. Nature 435, 43–57
13. Takeda, K., Saito, T., Tanaka, T., Morio, T., Maeda, M., Tanaka, Y., andOchiai, H. (2003) A novel gene trap method using terminator-REMI and 3�rapid amplification of cDNA ends (RACE) in Dictyostelium. Gene (Amst.)312, 321–333
14. Van Driessche, N., Demsar, J., Booth, E. O., Hill, P., Juvan, P., Zupan, B.,Kuspa, A., and Shaulsky, G. (2005) Epistasis analysis with global tran-scriptional phenotypes. Nat. Genet. 37, 471–477
15. Alexander, S., Srinivasan, S., and Alexander, H. (2003) Proteomics opensdoors to the mechanisms of developmentally regulated secretion. Mol.Cell. Proteomics 2, 1156–1163
16. Gotthardt, D., Warnatz, H. J., Henschel, O., Bruckert, F., Schleicher, M.,and Soldati, T. (2002) High-resolution dissection of phagosome matura-tion reveals distinct membrane trafficking phases. Mol. Biol. Cell 13,3508–3520
17. Steinert, M., and Heuner, K. (2005) Dictyostelium as host model for patho-genesis. Cell. Microbiol. 7, 307–314
18. Chen, J., de Felipe, K. S., Clarke, M., Lu, H., Anderson, O. R., Segal, G., andShuman, H. A. (2004) Legionella effectors that promote nonlytic releasefrom protozoa. Science 303, 1358–1361
19. Solomon, J. M., Rupper, A., Cardelli, J. A., and Isberg, R. R. (2000) Intra-cellular growth of Legionella pneumophila in Dictyostelium discoideum, asystem for genetic analysis of host-pathogen interactions. Infect. Immun.68, 2939–2947
20. Solomon, J. M., Leung, G. S., and Isberg, R. R. (2003) Intracellular replica-tion of Mycobacterium marinum within Dictyostelium discoideum: effi-cient replication in the absence of host coronin. Infect. Immun. 71,3578–3586
21. Cosson, P., Zulianello, L., Join-Lambert, O., Faurisson, F., Gebbie, L.,Benghezal, M., Van Delden, C., Curty, L. K., and Kohler, T. (2002)Pseudomonas aeruginosa virulence analyzed in a Dictyostelium discoi-deum host system. J. Bacteriol. 184, 3027–3033
22. Pukatzki, S., Kessin, R. H., and Mekalanos, J. J. (2002) The human patho-gen Pseudomonas aeruginosa utilizes conserved virulence pathways toinfect the social amoeba Dictyostelium discoideum. Proc. Natl. Acad.Sci. U. S. A. 99, 3159–3164
23. Cardelli, J. (2001) Phagocytosis and macropinocytosis in Dictyostelium:phosphoinositide-based processes, biochemically distinct. Traffic 2,311–320
24. Duhon, D., and Cardelli, J. (2002) The regulation of phagosome maturationin Dictyostelium. J. Muscle Res. Cell Motil. 23, 803–808
25. Maniak, M. (2002) Conserved features of endocytosis in Dictyostelium. Int.Rev. Cytol. 221, 257–287
26. Neuhaus, E. M., Almers, W., and Soldati, T. (2002) Morphology and dy-namics of the endocytic pathway in Dictyostelium discoideum. Mol. Biol.Cell 13, 1390–1407
27. Steinert, M., Leippe, M., and Roeder, T. (2003) Surrogate hosts: protozoaand invertebrates as models for studying pathogen-host interactions. Int.J. Med. Microbiol. 293, 321–332
28. Marion, S., Voigt, H., and Guillen, N. (2000) Cellular and biochemicalanalysis of phagocytosis in Entamoeba histolytica. Arch. Med. Res. 31,S178–S180
29. Mitra, B. N., Yasuda, T., Kobayashi, S., Saito-Nakano, Y., and Nozaki, T.(2005) Differences in morphology of phagosomes and kinetics of acidi-fication and degradation in phagosomes between the pathogenic Enta-moeba histolytica and the non-pathogenic Entamoeba dispar. Cell. Motil.Cytoskelet. 62, 84–99
30. Okada, M., Huston, C. D., Mann, B. J., Petri, W. A., Jr., Kita, K., and Nozaki,T. (2005) Proteomic analysis of phagocytosis in the enteric protozoanparasite Entamoeba histolytica. Eukaryot. Cell 4, 827–831
31. Marion, S., Laurent, C., and Guillen, N. (2005) Signalization and cytoskel-eton activity through myosin IB during the early steps of phagocytosis inEntamoeba histolytica: a proteomic approach. Cell. Microbiol. 7,1504–1518
32. Sussman, M. (1987) Cultivation and synchronous morphogenesis of Dic-tyostelium under controlled experimental conditions. Methods Cell Biol.28, 9–29
33. Laemmli, U. K. (1970) Cleavage of structural proteins during the assemblyof the head of bacteriophage T4. Nature 227, 680–685
34. Schwarz, E. C., Neuhaus, E. M., Kistler, C., Henkel, A. W., and Soldati, T.(2000) Dictyostelium myosin IK is involved in the maintenance of corticaltension and affects motility and phagocytosis. J. Cell Sci. 113, 621–633
35. Gotthardt, D., Dieckmann, R., Blancheteau, V., Kistler, C., Reichardt, F.,and Soldati, T. (2006) Preparation of intact, highly purified phagosomesfrom Dictyostelium. Methods Mol. Biol. Dictyostelium discoideum Pro-tocols edited by Eichinger and Rivero, pp. 439–448, Humana Press,Totowa, NJ
36. Wu, C. C., MacCoss, M. J., Howell, K. E., and Yates, J. R., III (2003) Amethod for the comprehensive proteomic analysis of membrane pro-teins. Nat. Biotechnol. 21, 532–538
37. Gorg, A., Postel, W., and Gunther, S. (1988) The current state of two-dimensional electrophoresis with immobilized pH gradients. Electro-phoresis 9, 531–546
38. Rabilloud, T., Adessi, C., Giraudel, A., and Lunardi, J. (1997) Improvementof the solubilization of proteins in two-dimensional electrophoresis withimmobilized pH gradients. Electrophoresis 18, 307–316
39. Gorg, A., Obermaier, C., Boguth, G., Csordas, A., Diaz, J. J., and Madjar,J. J. (1997) Very alkaline immobilized pH gradients for two-dimensionalelectrophoresis of ribosomal and nuclear proteins. Electrophoresis 18,328–337
40. Gorg, A., Obermaier, C., Boguth, G., Harder, A., Scheibe, B., Wildgruber,R., and Weiss, W. (2000) The current state of two-dimensional electro-phoresis with immobilized pH gradients. Electrophoresis 21, 1037–1053
41. Gorg, A., and Weiss, W. (1999) Analytical IPG-Dalt. Methods Mol. Biol. 112,189–195
42. Regula, J. T., Ueberle, B., Boguth, G., Gorg, A., Schnolzer, M., Herrmann,R., and Frank, R. (2000) Towards a two-dimensional proteome map ofMycoplasma pneumoniae. Electrophoresis 21, 3765–3780
43. Blum, H., Beier, H., and Gross, H. J. (1987) Improved silver staining of
Phagosome Protein Dynamics
2242 Molecular & Cellular Proteomics 5.12

plant-proteins, RNA and DNA in polyacrylamide gels. Electrophoresis 8,93–99
44. Catrein, I., Herrmann, R., Bosserhoff, A., and Ruppert, T. (2005) Experi-mental proof for a signal peptidase I like activity in Mycoplasma pneu-moniae, but absence of a gene encoding a conserved bacterial type ISPase. FEBS J. 272, 2892–2900
45. Opitz, C., Di Cristina, M., Reiss, M., Ruppert, T., Crisanti, A., and Soldati, D.(2002) Intramembrane cleavage of microneme proteins at the surface ofthe apicomplexan parasite Toxoplasma gondii. EMBO J. 21, 1577–1585
46. Kaufman, L., and Rousseuw, P. J. (1990) Finding Groups in Data: anIntroduction to Cluster Analysis, Wiley-Interscience, New York
47. Chevallet, M., Santoni, V., Poinas, A., Rouquie, D., Fuchs, A., Kieffer, S.,Rossignol, M., Lunardi, J., Garin, J., and Rabilloud, T. (1998) New zwit-terionic detergents improve the analysis of membrane proteins by two-dimensional electrophoresis. Electrophoresis 19, 1901–1909
48. Harris, E., Yoshida, K., Cardelli, J., and Bush, J. (2001) Rab11-like GTPaseassociates with and regulates the structure and function of the contract-ile vacuole system in Dictyostelium. J. Cell Sci. 114, 3035–3045
49. Harris, E., and Cardelli, J. (2002) RabD, a Dictyostelium Rab14-relatedGTPase, regulates phagocytosis and homotypic phagosome and lyso-some fusion. J. Cell Sci. 115, 3703–3713
50. Seastone, D. J., Zhang, L., Buczynski, G., Rebstein, P., Weeks, G.,Spiegelman, G., and Cardelli, J. (1999) The small Mr Ras-like GTPaseRap1 and the phospholipase C pathway act to regulate phagocytosis inDictyostelium discoideum. Mol. Biol. Cell 10, 393–406
51. Scianimanico, S., Desrosiers, M., Dermine, J. F., Meresse, S., Descoteaux,A., and Desjardins, M. (1999) Impaired recruitment of the small GTPaserab7 correlates with the inhibition of phagosome maturation by Leish-mania donovani promastigotes. Cell Microbiol. 1, 19–32
52. Uchida, H., Kondo, A., Yoshimura, Y., Mazaki, Y., and Sabe, H. (2001)PAG3/Pap�/KIAA0400, a GTPase-activating protein for ADP-ribosylationfactor (ARF), regulates ARF6 in Fc� receptor-mediated phagocytosis ofmacrophages. J. Exp. Med. 193, 955–966
53. Vega, V. L., and De Maio, A. (2005) Increase in phagocytosis after geldana-mycin treatment or heat shock: role of heat shock proteins. J. Immunol.175, 5280–5287
54. Gagnon, E., Duclos, S., Rondeau, C., Chevet, E., Cameron, P. H., Steele-Mortimer, O., Paiement, J., Bergeron, J. J., and Desjardins, M. (2002)Endoplasmic reticulum-mediated phagocytosis is a mechanism of entryinto macrophages. Cell 110, 119–131
55. Ravanel, K., de Chassey, B., Cornillon, S., Benghezal, M., Zulianello, L.,Gebbie, L., Letourneur, F., and Cosson, P. (2001) Membrane sorting inthe endocytic and phagocytic pathway of Dictyostelium discoideum. Eur.
J. Cell Biol. 80, 754–76456. Neuhaus, E. M., and Soldati, T. (2000) A myosin I is involved in membrane
recycling from early endosomes. J. Cell Biol. 150, 1013–102657. Griffiths, G. (2004) On phagosome individuality and membrane signalling
networks. Trends Cell Biol. 14, 343–35158. Jenne, N., Rauchenberger, R., Hacker, U., Kast, T., and Maniak, M. (1998)
Targeted gene disruption reveals a role for vacuolin B in the late endo-cytic pathway and exocytosis. J. Cell Sci. 111, 61–70
59. Damiani, M. T., and Colombo, M. I. (2001) Involvement of heterotrimeric Gproteins in phagocytosis and recycling from the phagosomal compart-ment. Exp. Cell Res. 271, 189–199
60. Hwang, J. I., Choi, S., Fraser, I. D., Chang, M. S., and Simon, M. I. (2005)Silencing the expression of multiple G�-subunits eliminates signalingmediated by all four families of G proteins. Proc. Natl. Acad. Sci. U. S. A.102, 9493–9498
61. Natarajan, K., Ashley, C. A., and Hadwiger, J. A. (2000) Related G� subunitsplay opposing roles during Dictyostelium development. Differentiation66, 136–146
62. Hadwiger, J. A., and Firtel, R. A. (1992) Analysis of G�4, a G-protein subunitrequired for multicellular development in Dictyostelium. Genes Dev. 6,38–49
63. Hadwiger, J. A., and Srinivasan, J. (1999) Folic acid stimulation of the G�4G protein-mediated signal transduction pathway inhibits anterior prestalkcell development in Dictyostelium. Differentiation 64, 195–204
64. Wu, L., Valkema, R., Van Haastert, P. J., and Devreotes, P. N. (1995) The Gprotein � subunit is essential for multiple responses to chemoattractantsin Dictyostelium. J. Cell Biol. 129, 1667–1675
65. Lilly, P., Wu, L., Welker, D. L., and Devreotes, P. N. (1993) A G-protein�-subunit is essential for Dictyostelium development. Genes Dev. 7,986–995
66. Peracino, B., Borleis, J., Jin, T., Westphal, M., Schwartz, J. M., Wu, L.,Bracco, E., Gerisch, G., Devreotes, P., and Bozzaro, S. (1998) G protein� subunit-null mutants are impaired in phagocytosis and chemotaxis dueto inappropriate regulation of the actin cytoskeleton. J. Cell Biol. 141,1529–1537
67. Lee, E., and Knecht, D. A. (2002) Visualization of actin dynamics duringmacropinocytosis and exocytosis. Traffic 3, 186–192
68. Lefkir, Y., Malbouyres, M., Gotthardt, D., Ozinsky, A., Cornillon, S., Bruck-ert, F., Aderem, A. A., Soldati, T., Cosson, P., and Letourneur, F. (2004)Involvement of the AP-1 adaptor complex in early steps of phagocytosisand macropinocytosis. Mol. Biol. Cell 15, 861–869
69. Maniak, M. (2003) Fusion and fission events in the endocytic pathway ofDictyostelium. Traffic 4, 1–5
Phagosome Protein Dynamics
Molecular & Cellular Proteomics 5.12 2243