proteomics 1 …...blocks and sectioned (4 m thickness) on a base sledge microtome (leitz wetzlar)....
TRANSCRIPT

Emma McGregor1
Lee Kempster1
Robin Wait2
Sandy Y. Welson2
Martin Gosling1
Michael J. Dunn3
Janet T. Powell1, 4
1Department of Vascular Surgery,Imperial CollegeSchool of Medicine,Charing Cross Hospital,London, UK
2Kennedy Institute ofRheumatology Division,Imperial College Schoolof Medicine,London, UK
3Department of CardiothoracicSurgery, National Heart andLung Institute, Imperial CollegeSchool of Medicine,Heart Science Centre,Harefield Hospital,Middlesex, UK
4University Hospitals ofCoventry and Warwickshire,Coventry, UK
Identification and mapping of human saphenousvein medial smooth muscle proteins by two-dimen-sional polyacrylamide gel electrophoresis
Changing smooth muscle phenotype and abnormal cell proliferation are important fea-tures of vascular pathology, including the failure of saphenous vein bypass grafts. Wehave characterised and mapped protein expression in human saphenous vein medialsmooth muscle, using two-dimensional (2-D) polyacrylamide gel electrophoresis. The2-D system comprised a nonlinear immobilised pH 3–10 gradient in the first dimension(separating proteins with isoelectric point values between pH 3–10), and 12%T totalgel concentration sodium dodecyl sulphate polyacrylamide gel electrophoresis in thesecond dimension (separating proteins in the range 14 000–200 000 Daltons). Using acombination of peptide mass fingerprinting by matrix-assisted laser desorption/ionisa-tion-time of flight mass spectrometry and partial amino acid sequencing by nanospraytandem mass spectrometry, a subset of 149 protein spots was analysed, with 129 pro-tein spots being identified and mapped. The data presented here are an importantaddition to the limited knowledge of venous medial smooth muscle protein expressionin vivo. Our protein map will facilitate the identification of proteins differentiallyexpressed in human saphenous vein bypass grafts. In turn, this may lead to the eluci-dation of molecular events involved in saphenous vein bypass graft failure. The mapshould also provide a basis for comparative studies of protein expression in vascularsmooth muscle of varying origins.
Keywords: Human saphenous vein / Vascular smooth muscle / Bypass grafting / Two-dimen-sional polyacrylamide gel electrophoresis / Matrix-assisted laser desorption/ionization-time offlight mass spectrometry PRO 0116
1 Introduction
Vein bypass grafting using human saphenous vein (HSV)remains the most commonly used method to bypassoccluded vessels, since HSV is readily accessed, relativelyplentiful, easily harvested [1] and provides adequate flowto the recipient artery. Saphenous vein bypass surgerydepends on the successful adaptation of the vessel tohigh pressure and pulsatile flow of the arterial circulation.However, the tendency of venous bypass grafts to occludeis an important drawback, emphasising the problemswhich may arise when vein is transposed into the arterialcirculation. During the first year after coronary arterybypass surgery up to 15% of venous grafts occlude [2]. Inthe first year after femoropopliteal bypass surgery up to28% of venous grafts occlude [3]. Migration of smoothmuscle cells into the intima, with alteration to a synthetic,proliferative phenotype, causing intimal hyperplasia, is animportant underlying cause of vein graft failure [2, 4]. Simi-
lar cellular changes are observed following angioplasty ofdiseased arteries. Superficially, it might appear importantto characterise the protein expression of smooth musclecells cultured from different vessels to investigate pheno-typic variability and phenotypic switching. However, cul-tured smooth muscle cells are not contractile and exhibita phenotype very different from the smooth muscleembedded in the connective tissue of the medial layer ofblood vessels. The structure of saphenous vein lends itselfto straightforward dissection of the medial smooth musclelayer away from the adventitia. The main advantage ofusing intact medial smooth muscle tissue is an enrichedsource of smooth muscle cells that retain a contractilephenotype. However, a consequence of using dissectedintact tissue is contamination by other cell types, e.g.endothelial and red blood cells in the case of medialsmooth muscle. Little is known about the initiating factorsleading to the development of intimal hyperplasia. 2-DPAGE is therefore an ideal technique to exploit in order toinvestigate protein expression, post-translational modifi-cation, function and regulation in vein graft disease.
The aim of this study was to generate a reference proteinmap that would facilitate the identification of proteins dif-ferentially expressed in HSV bypass grafts. Here we pre-
Correspondence: Dr. Emma McGregor, Proteome Sciences plc,South Wing Laboratory, Institute of Psychiatry, KCL, De CrespignyPark, London SE5 8 AF, UKE-mail: [email protected]: +44-207-848-5114
Abbreviation: HSV, human saphenous vein
Proteomics 2001, 1, 1405–1414 1405
ª WILEY-VCH Verlag GmbH, 69451 Weinheim, 2001 1615-9853/01/1111–1405 $17.50+.50/0
sent the first map of HSV medial smooth muscle proteinexpression, mapping 149 distinct proteins, of which 129are identified. Our long-term goal is to establish a refer-ence database of HSV medial smooth muscle proteinexpression, which could be used to progress our under-standing of the molecular events involved in saphenousvein bypass graft failure.
2 Materials and methods
2.1 Human saphenous vein samples
Saphenous vein was harvested from patients undergoingaortocoronary or infrainguinal bypass, or high ligation ofsaphenous vein for correction of varicose veins, and imme-diately brought to the laboratory in M199 media (Life Tech-nologies, Paisley, UK) containing penicillin (50 U/mL) andstreptomycin (50 �g/mL) (Sigma, Poole, UK). The RiversideResearch Ethics Committee approved the use of saphen-ous vein for the investigations discussed in this report.
2.2 Medial dissection from humansaphenous vein
Connective tissue was removed from sections of vein (1–2 cm) and the lumen opened longitudinally. Endotheliumwas removed by scraping the opened lumen with a scal-pel and washing with PBS, pH 7.2. Using forceps themedia was peeled from the adventitia. Dissected tissuewas immediately frozen between aluminium tongs (pre-cooled in liquid N2) and samples stored at –70�C prior topreparation for 2-DE or was preserved in formalin (10%formaldehyde), pH 7, prior to immunohistochemistry.
2.3 Immunohistochemical validation of medialdissections
Dissected media for immunostaining was set in paraffinblocks and sectioned (4 �m thickness) on a base sledgemicrotome (Leitz Wetzlar). Immunohistochemistry wasperformed using the avidin-biotin complex (ABC) method[5]. Consecutive sections from the same medial dissec-tion were incubated with monoclonal antibodies specificfor smooth muscle markers, alpha smooth muscle actin(dilution 1:400) and smooth muscle myosin (dilution1:250), both obtained from Sigma. Sections were alsoincubated with a monoclonal antibody specific for theendothelial cell marker, CD-31 (dilution 1:50) (Serotec,Oxford, UK). A biotinylated secondary antibody (rabbitantimouse IgG) (Vector, Peterborough, UK) was used at a1:100 dilution. Staining was visualised by developmentwith DAB (3, 3‘-diamino-benzidine-tetrahydrochloride)(Vector).
2.4 Preparation of tissue samples
Sample preparation was performed according to Weekeset al. [6] and Heinke et al. [7]. Briefly, frozen tissue samples(70–110 mg) were pulverised under liquid N2 into a finepowder using a pestle and mortar. The resulting powderwas collected, homogenised in lysis buffer (9.5 M urea,2% w/v CHAPS, 0.8% w/v Pharmalyte, pH 3–10, and1% w/v DTT), in 1.5 mL Eppendorf tubes, (for preparativeand analytical gels, 150 �L of lysis buffer was added to10 mg wet weight of tissue), sonicated at 4�C for 5 minand centrifuged at 13 000 g at 20�C for 1 h. The superna-tant was harvested and protein concentration was deter-mined [6] using a modification of the method describedby Bradford [8]. Solubilised protein samples were dividedinto 50 �L aliquots and stored at –70�C.
2.5 2-D PAGE
2-D PAGE was performed according to Weekes et al. [6]and Heinke et al. [7]. IEF was performed using 180 mm,immobilised, nonlinear pH gradient strips (IPG DryStrips)of pH 3–10 (Amersham Pharmacia Biotech, Uppsala,Sweden). For preparative gels a protein load of 400 �gwas applied to each IPG strip using an in-gel rehydrationmethod, as described by Rabilloud et al. [9] and Sanchezet al., [10]. Samples were diluted in rehydration solution(8 M urea, 0.5% w/v CHAPS, 0.2% w/v DTT and 0.2% w/v Pharmalyte) pH 3–10 and rehydrated overnight in areswelling tray (Amersham Pharmacia Biotech). Stripswere focussed at 0.05 mA/IPG strip for 60 kVh at 20�C[11]. Once IEF was completed the strips were equilibratedin 6 M urea containing 30% v/v glycerol, 2% w/v SDS and0.01% w/v Bromophenol blue, with the addition of 1% w/vDTT for 15 min, followed by the same buffer without DTT,but with the addition of 4.8% w/v iodoacetamide for 15min [12]. SDS-PAGE was performed using 12%T, 2.6%Cseparating polyacrylamide gels without a stacking gel,using the Hoefer DALT system [13]. The second dimen-sion was carried out overnight at 20 mA/gel at 8�C andwas terminated when the Bromophenol dye front hadmigrated off the lower end of the gels.
2.6 Protein visualisation
After electrophoresis, preparative 2-D gels were fixed fora minimum of 1 h in a methanol:acetic acid:water solution(4:1:5 v/v/v). 2-D protein profiles were visualised by silverstaining using the PlusOne silver staining kit (AmershamPharmacia Biotech) with slight modifications to ensurecompatibility with subsequent MS analysis [14]. Analyticalgels were fixed and silver stained in the same way butwithout modifications.
1406 E. McGregor et al. Proteomics 2001, 1, 1405–1414

2.7 Sample preparation for MS
Protein spots were excised with a 2 mm diameter roundcutter. Multiple cores were taken from weakly stainedspots, and in some cases corresponding proteins werepooled from several gels. In-gel trypsin digestion was per-formed according to published methods [15–17] modifiedfor use with a robotic digestion system (Genomic Solu-tions Investigator ProGest, Huntington, UK). Gel pieceswere destained by washing with 30 �L of 15 mM potas-sium ferricyanide/50 mM sodium thiosulphate [18] fol-lowed by three washes with 100 �L Milli-Q H2O (Millipore,Bedford, MA, USA). Cysteine residues were reduced withDTTand were derivatized with iodoacetamide. Gel pieceswere then dehydrated with acetonitrile, dried at 60�C andreswollen with 10 �L digestion buffer (containing modifiedtrypsin, 6.5 ng/�L) (Promega, Madison, WI, USA) in 25 mM
ammonium hydrogen carbonate. After 8 h incubation at37�C, products were recovered by sequential extractionswith 25 mM ammonium hydrogen carbonate, 5% v/v for-mic acid, and acetonitrile. Extracts were lyophilized,resuspended in 20 �L of 0.1% v/v TFA / 10% v/v aceto-nitrile, and 0.5 �L aliquots were removed for MALDI anal-ysis. Extracts for ESI-MS were desalted on Millipore Zip-tips, according to the manufacturers instructions.
2.8 MALDI-MS
MALDI-MS was performed using a Micromass TofSpec 2Espectrometer (Manchester, UK), equipped with a 337 nmnitrogen laser. The instrument was operated in the positiveion reflectron mode at 20 kV accelerating voltage withtime-lag focusing. The matrix was a mixture of �-cyano-4-hydroxy-cinnamic acid and nitrocellulose and was appliedas a microcrystalline thin film by a modification of the proce-dure of Vorm and Mann [19]. Aliquots (0.5 �L) of the digestsolution were deposited on the matrix film, allowed to dryand were desalted by brief washing with a few microlitres of0.1% v/v TFA. Spectra were internally calibrated using tryp-sin autolysis products, and the resulting peptide masseswere searched against a local copy of the nonredundantdatabase maintained by the National Centre for Biotechnol-ogy Information (http://www.ncbi.nlm.nih.gov) using theProtein Probe search engine (Micromass). Where necessaryadditional searches were performed using the programsMascot [20] or ProFound (http://prowl.rockefeller.edu) [21].An initial mass tolerance of 50 ppm was used inall searches.
2.9 ESI-MS
Desalted samples were dissolved in 1–2 �L of 50% v/vmethanol/0.1% v/v aqueous formic acid, loaded into pal-ladium coated borosilicate nanoelectrospray needles
(Protana, Odense, Denmark), and mounted in the sourceof a Micromass Q-Tof hybrid quadrupole/orthogonalacceleration time of flight spectrometer. Stable electro-spray was obtained at capillary voltages between 900and 1200 V. The collision gas was argon, and collisionenergies and argon pressure were tuned to optimise thefragmentation pattern of individual precursor ions.Daughter ion spectra were charge-state de-encryptedand de-isotoped using a proprietary maximum entropyalgorithm (MaxEnt 3, Micromass), and amino acidsequences were manually deduced with the assistanceof Micromass’s peptide sequencing program PepSeq.The resulting sequences were searched against NCBI’snonredundant database using BLAST [22].
2.10 Computer analysis
Silver stained gels were scanned at 100 �m resolutionusing a Molecular Dynamics Personal SI Laser Densi-tometer (Sunnyvale, CA, USA). Protein spots were ana-lysed qualitatively using the PDQuest 2-D software V6.2.0 (Bio-Rad, Hercules, CA, USA). Briefly, backgroundand vertical streaks were removed from each gel imageand spots digitised by Gaussian fit, giving rise to a syn-thetic image. In order for PDQuest to carry out automaticdetermination of observed pI and Mr values, it was firstnecessary to calibrate the digitised image for these para-meters. The length of the first dimension was divided into10% sections. The pH value at each division was theninterpolated from a published Amersham Pharmacia Bio-tech pH gradient plot which describes pH as a function ofdistance for a pH 3–10 nonlinear gradient [23]. Proteinspots were chosen that represented the full range of pHand pI values assigned according to the above calcu-lation. To calibrate for Mr, protein spots that migrated inline with Rainbow molecular weight markers (AmershamPharmacia, Biotech) were chosen and these valuesassigned accordingly.
3 Results and discussion
In this study we present a 2-D electrophoretic map of pro-tein expression from the medial (smooth muscle cell) layerof human saphenous vein (HSV). Tissue identity was con-firmed by immunohistochemistry, using antibodies speci-fic to smooth muscle markers, alpha smooth muscle actinand smooth muscle myosin, performed on sections ofdissected saphenous vein medial smooth muscle (datanot shown). The absence of contaminating endothelialcells was confirmed using an endothelial cell marker-spe-cific antibody, CD-31 (data not shown).
Proteomics 2001, 1, 1405–1414 Mapping of human vascular smooth muscle proteins 1407

Protein extraction was performed using two different lysisbuffers and compared for efficiency of extraction. Tissuesamples were prepared as in Section 2.4. Samples werelysed in standard lysis buffer (9.5 M urea, 2% w/v CHAPS,0.8% w/v Pharmalyte, pH 3–10, and 1% w/v DTT) (n = 6),or in a second choice of lysis buffer containing 5 M urea,2 M thiourea, 2% w/v CHAPS, 2% v/v sulphobetaine 3–10,2 mM TBP (n = 6) [24]. Protein extraction was more effi-cient using standard lysis buffer, 1.3 � 0.3 mg/mL of pro-tein (n = 6), than using the second choice of lysis buffer,1.0 � 0.2 mg/mL (n = 6), p = 0.038 (unpaired Students t-test). Therefore, the urea/thiourea extracts were not pro-cessed further.
Protein spots were separated from vein samples emanat-ing from three separate patients. Gels (pH 3–10) had130985.05, 236563.25 and 117534.1, valid spot quanti-ties respectively, according to PDQuest 2-D softwareand spot patterns of gels were highly reproduciblebetween samples (data not shown). The protein spotsexcised for sequencing were present in all three gels.
The 2-D PAGE map of HSV medial smooth muscle proteinexpression consists of protein spots ranging from mole-cular mass of 11 000 to 200 000 Da and pI of pH 3 to 10(Fig. 1). A subset of 149 protein spots have been analysedby MALDI-MS, and identifications assigned to 129
Figure 1. 2-D PAGE map of human saphenous vein medial smooth muscle proteins. Proteins (400 �gloading) were separated by IEF using 180 mm, immobilised, nonlinear pH gradient strips (IPG Dry-Strips) of pH 3–10, followed by 12%T gradient SDS-PAGE gels. Proteins were visualised by silverstaining. Spot numbers refer to numbers in Table 1. Proteins were identified by MALDI- MS andnanospray-MS.
1408 E. McGregor et al. Proteomics 2001, 1, 1405–1414

(Table 1). Twenty protein spots were unable to be identi-fied. Where required, nanospray MS was used to furtherconfirm protein identity by partial amino acid sequencing.
Arterialisation of saphenous vein bypass grafts is asso-ciated with the development of intimal hyperplasia(migration of smooth muscle cells into the intima, cell pro-liferation and establishment of a dense connective tissuematrix), which can cause graft occlusion. These well-described histological changes represent the chronicadaptation of saphenous vein to the arterial circulation.
Several of the identified spots have been characterisedpreviously in smooth muscle using 2-D PAGE. Calponin(spots 74–78) and SM22� (spots 19, 25, 32–36, 38, 39,41, 43–45, 47,) expression was investigated in avian andmammalian smooth muscle during smooth muscle differ-entiation, with multiple isoforms of each being expressed[25]. Our results are in keeping with this pattern of expres-sion, with protein spot location in the gel being similar.Other proteins such as myosin light chain (spots 3 and 4)have also been investigated in smooth muscle by 2-DPAGE [26].
Actin-fibre remodelling is an early event in the adaptationof saphenous vein to arterial haemodynamics. Therefore,potential proteins of interest that would be pertinent to theadaptation of human saphenous vein to arterial flow,would be cytoskeletal proteins e.g. actin fibres, and actindepolymerising factors e.g. gelsolin. After exposure toarterial haemodynamics one might expect changes inthe expression /regulation of these proteins.
Fifteen spots ranging from a molecular mass of 14 400 to26 300 Da and a pI of 5.78 to 9.90 were identified as theactin binding protein SM22� (theoretical Mr/pI 22500 Da/8.88). Spots 43–45 suggest isoelectric isoforms of thisprotein. Gimona and colleagues [25] have reported sev-eral such isoforms in chicken gizzard and porcine sto-mach smooth muscle. However, the average molecularmass of these isoforms is 26 000 Da. Spots 36, 38, and39 form a chain of isoelectric isoforms closely matchingthe theoretical molecular weight of SM22�, but exhibit amore acidic nature (pI 6.00–6.64). Spots 19, 25, and 32–35 with molecular mass ranging from 14 400 to 19 000 Daprobably represent proteolytic fragments. The range of pIvalues of these spots may also indicate this. Spots 41 and47 may represent aggregation of proteolytic fragments,due to their larger molecular masses.
Spots 74–78 were identified as calponin (theoreticalmass/pI 33 200 Da/9.14), a protein with high sequencehomology to SM22� [27, 28]. The spots form an isoformchain in a similar manner to SM22�. Gimona et al. havealso reported the existence of such calponin isoforms[25]. Charge trains in 2-DE are normally associated with
post-translational modifications such as acetylation andphosphorylation. Both SM22� and calponin are subjectto phosphorylation in vitro. However, neither protein isphosphorylated in vivo [25]. The possibility of other mod-ifications resulting in charge train formations cannot beruled out.
Spots 121 and 122 were identified as gelsolin, a humanactin depolymerization factor (theoretical mass/pI 85 700Da/5.90). Gelsolin is a Ca2+- and polyphosphoinositide4,5-bisphosphate (PIP2)1-regulated actin filament sever-ing and capping protein that is implicated in actin re-modelling in growing and in apoptotic cells [29]. It is themost potent actin filament severing protein identified todate [30]. Observed molecular masses of these spotswere 93 700 and 94 100 Da, respectively. However, reso-lution of large molecular weight proteins by 2-DE is rela-tively poor and so some artefactual discrepancies mayoccur. Nevertheless, spots 121 and 122 appear to bemembers of a charge train increasing in acidity. This maybe indicative of phosphorylation and indeed it has beenshown that actin depolymerization factor may be regu-lated by pathways including phosphorylation [31]. Otheractin binding proteins identified include filamin, spots117 and 118, and F-actin capping protein, spot 69.
Spots 84, 85, 126, 131 and 132 were identified as smoothmuscle �-actin 3 (theoretical mass/pI 41 900 Da/5.31).The average observed molecular weight of spots 84, 85,131 and 132 agreed approximately with the theoreticalvalue. However, pI was increased in the range 5.75–5.90.In this case, multiple spots may represent differing iso-forms, or modifications of the protein. Spot 126 wasobserved to have an extrapolated molecular mass of219 100 Da with a pI of 5.4. One possibility is that thisspot represents aggregation of �-actin 3 proteolytic frag-ments.
Spots 119, 120, 123–125 and 127 were identified as vin-culin (theoretical mass/pI 116 600 Da/5.83). Spots 123–125 may represent vinculin isoforms and perhaps post-translational modifications. Again, poor resolution of largeproteins in 2-DE may have prevented accurate estimationof vinculin molecular weight. The vinculin spots, however,exhibit increasing acidity. Again, phosphorylation may besuspected, as it has been demonstrated that vinculin is asubstrate for serine/threonine and tyrosine kinases bothin vivo and in vitro [32, 33]. Spots 119, 120 and 127 maybe proteolytic fragments.
Spot 141 was identified as microfibril-associated glyco-protein 4 (theoretical mass/pI 28 600 Da/5.38). Observedvalues were calculated to be 37 300 Da/5.13. The prob-able cause of this significant increase in molecular weightis the post-translational addition of N- and/or O-linked
Proteomics 2001, 1, 1405–1414 Mapping of human vascular smooth muscle proteins 1409
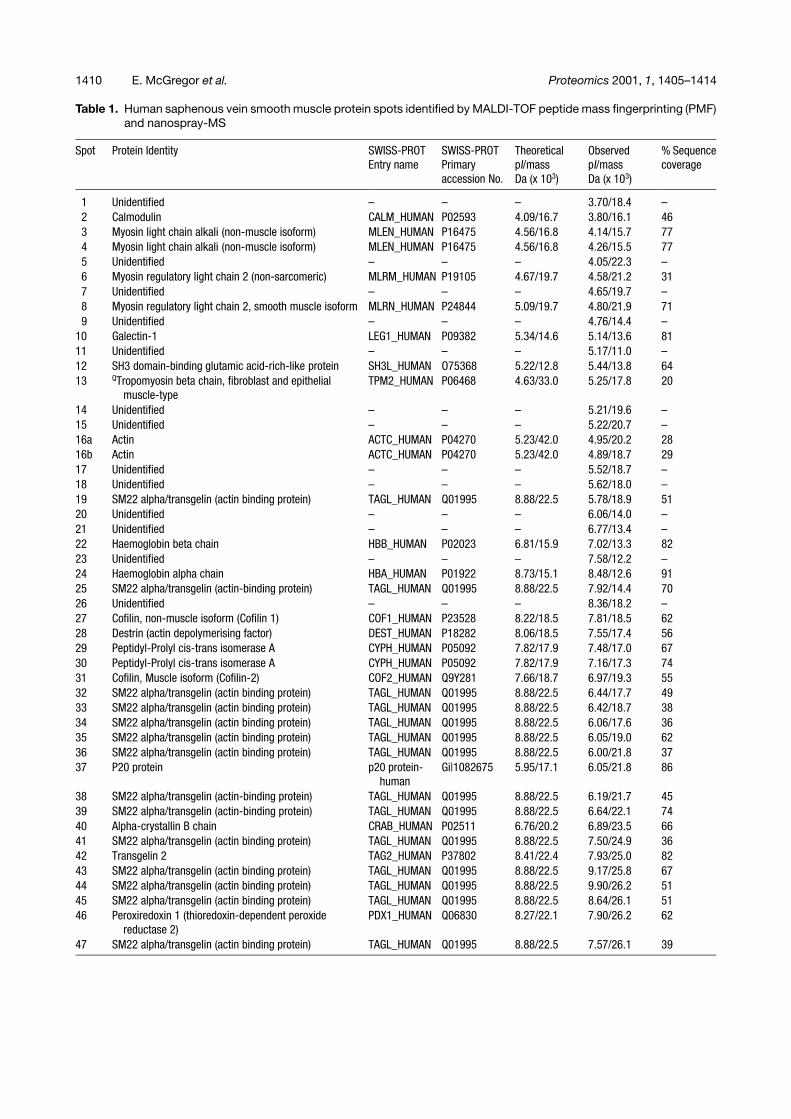
Table 1. Human saphenous vein smooth muscle protein spots identified by MALDI-TOF peptide mass fingerprinting (PMF)and nanospray-MS
Spot Protein Identity SWISS-PROTEntry name
SWISS-PROTPrimaryaccession No.
TheoreticalpI/massDa (x 103)
ObservedpI/massDa (x 103)
% Sequencecoverage
1 Unidentified – – – 3.70/18.4 –2 Calmodulin CALM_HUMAN P02593 4.09/16.7 3.80/16.1 463 Myosin light chain alkali (non-muscle isoform) MLEN_HUMAN P16475 4.56/16.8 4.14/15.7 774 Myosin light chain alkali (non-muscle isoform) MLEN_HUMAN P16475 4.56/16.8 4.26/15.5 775 Unidentified – – – 4.05/22.3 –6 Myosin regulatory light chain 2 (non-sarcomeric) MLRM_HUMAN P19105 4.67/19.7 4.58/21.2 317 Unidentified – – – 4.65/19.7 –8 Myosin regulatory light chain 2, smooth muscle isoform MLRN_HUMAN P24844 5.09/19.7 4.80/21.9 719 Unidentified – – – 4.76/14.4 –
10 Galectin-1 LEG1_HUMAN P09382 5.34/14.6 5.14/13.6 8111 Unidentified – – – 5.17/11.0 –12 SH3 domain-binding glutamic acid-rich-like protein SH3L_HUMAN O75368 5.22/12.8 5.44/13.8 6413 QTropomyosin beta chain, fibroblast and epithelial
muscle-typeTPM2_HUMAN P06468 4.63/33.0 5.25/17.8 20
14 Unidentified – – – 5.21/19.6 –15 Unidentified – – – 5.22/20.7 –16a Actin ACTC_HUMAN P04270 5.23/42.0 4.95/20.2 2816b Actin ACTC_HUMAN P04270 5.23/42.0 4.89/18.7 2917 Unidentified – – – 5.52/18.7 –18 Unidentified – – – 5.62/18.0 –19 SM22 alpha/transgelin (actin binding protein) TAGL_HUMAN Q01995 8.88/22.5 5.78/18.9 5120 Unidentified – – – 6.06/14.0 –21 Unidentified – – – 6.77/13.4 –22 Haemoglobin beta chain HBB_HUMAN P02023 6.81/15.9 7.02/13.3 8223 Unidentified – – – 7.58/12.2 –24 Haemoglobin alpha chain HBA_HUMAN P01922 8.73/15.1 8.48/12.6 9125 SM22 alpha/transgelin (actin-binding protein) TAGL_HUMAN Q01995 8.88/22.5 7.92/14.4 7026 Unidentified – – – 8.36/18.2 –27 Cofilin, non-muscle isoform (Cofilin 1) COF1_HUMAN P23528 8.22/18.5 7.81/18.5 6228 Destrin (actin depolymerising factor) DEST_HUMAN P18282 8.06/18.5 7.55/17.4 5629 Peptidyl-Prolyl cis-trans isomerase A CYPH_HUMAN P05092 7.82/17.9 7.48/17.0 6730 Peptidyl-Prolyl cis-trans isomerase A CYPH_HUMAN P05092 7.82/17.9 7.16/17.3 7431 Cofilin, Muscle isoform (Cofilin-2) COF2_HUMAN Q9Y281 7.66/18.7 6.97/19.3 5532 SM22 alpha/transgelin (actin binding protein) TAGL_HUMAN Q01995 8.88/22.5 6.44/17.7 4933 SM22 alpha/transgelin (actin binding protein) TAGL_HUMAN Q01995 8.88/22.5 6.42/18.7 3834 SM22 alpha/transgelin (actin binding protein) TAGL_HUMAN Q01995 8.88/22.5 6.06/17.6 3635 SM22 alpha/transgelin (actin binding protein) TAGL_HUMAN Q01995 8.88/22.5 6.05/19.0 6236 SM22 alpha/transgelin (actin binding protein) TAGL_HUMAN Q01995 8.88/22.5 6.00/21.8 3737 P20 protein p20 protein-
humanGi|1082675 5.95/17.1 6.05/21.8 86
38 SM22 alpha/transgelin (actin-binding protein) TAGL_HUMAN Q01995 8.88/22.5 6.19/21.7 4539 SM22 alpha/transgelin (actin-binding protein) TAGL_HUMAN Q01995 8.88/22.5 6.64/22.1 7440 Alpha-crystallin B chain CRAB_HUMAN P02511 6.76/20.2 6.89/23.5 6641 SM22 alpha/transgelin (actin binding protein) TAGL_HUMAN Q01995 8.88/22.5 7.50/24.9 3642 Transgelin 2 TAG2_HUMAN P37802 8.41/22.4 7.93/25.0 8243 SM22 alpha/transgelin (actin binding protein) TAGL_HUMAN Q01995 8.88/22.5 9.17/25.8 6744 SM22 alpha/transgelin (actin binding protein) TAGL_HUMAN Q01995 8.88/22.5 9.90/26.2 5145 SM22 alpha/transgelin (actin binding protein) TAGL_HUMAN Q01995 8.88/22.5 8.64/26.1 5146 Peroxiredoxin 1 (thioredoxin-dependent peroxide
reductase 2)PDX1_HUMAN Q06830 8.27/22.1 7.90/26.2 62
47 SM22 alpha/transgelin (actin binding protein) TAGL_HUMAN Q01995 8.88/22.5 7.57/26.1 39
1410 E. McGregor et al. Proteomics 2001, 1, 1405–1414
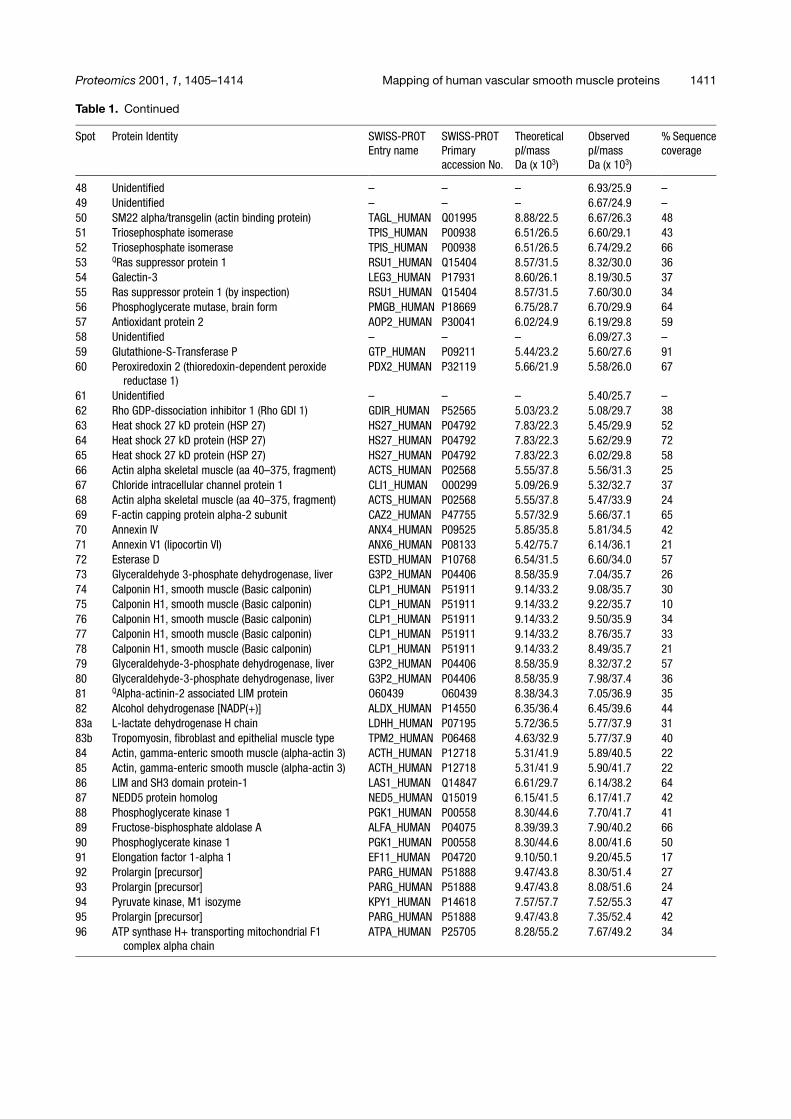
Table 1. Continued
Spot Protein Identity SWISS-PROTEntry name
SWISS-PROTPrimaryaccession No.
TheoreticalpI/massDa (x 103)
ObservedpI/massDa (x 103)
% Sequencecoverage
48 Unidentified – – – 6.93/25.9 –49 Unidentified – – – 6.67/24.9 –50 SM22 alpha/transgelin (actin binding protein) TAGL_HUMAN Q01995 8.88/22.5 6.67/26.3 4851 Triosephosphate isomerase TPIS_HUMAN P00938 6.51/26.5 6.60/29.1 4352 Triosephosphate isomerase TPIS_HUMAN P00938 6.51/26.5 6.74/29.2 6653 QRas suppressor protein 1 RSU1_HUMAN Q15404 8.57/31.5 8.32/30.0 3654 Galectin-3 LEG3_HUMAN P17931 8.60/26.1 8.19/30.5 3755 Ras suppressor protein 1 (by inspection) RSU1_HUMAN Q15404 8.57/31.5 7.60/30.0 3456 Phosphoglycerate mutase, brain form PMGB_HUMAN P18669 6.75/28.7 6.70/29.9 6457 Antioxidant protein 2 AOP2_HUMAN P30041 6.02/24.9 6.19/29.8 5958 Unidentified – – – 6.09/27.3 –59 Glutathione-S-Transferase P GTP_HUMAN P09211 5.44/23.2 5.60/27.6 9160 Peroxiredoxin 2 (thioredoxin-dependent peroxide
reductase 1)PDX2_HUMAN P32119 5.66/21.9 5.58/26.0 67
61 Unidentified – – – 5.40/25.7 –62 Rho GDP-dissociation inhibitor 1 (Rho GDI 1) GDIR_HUMAN P52565 5.03/23.2 5.08/29.7 3863 Heat shock 27 kD protein (HSP 27) HS27_HUMAN P04792 7.83/22.3 5.45/29.9 5264 Heat shock 27 kD protein (HSP 27) HS27_HUMAN P04792 7.83/22.3 5.62/29.9 7265 Heat shock 27 kD protein (HSP 27) HS27_HUMAN P04792 7.83/22.3 6.02/29.8 5866 Actin alpha skeletal muscle (aa 40–375, fragment) ACTS_HUMAN P02568 5.55/37.8 5.56/31.3 2567 Chloride intracellular channel protein 1 CLI1_HUMAN O00299 5.09/26.9 5.32/32.7 3768 Actin alpha skeletal muscle (aa 40–375, fragment) ACTS_HUMAN P02568 5.55/37.8 5.47/33.9 2469 F-actin capping protein alpha-2 subunit CAZ2_HUMAN P47755 5.57/32.9 5.66/37.1 6570 Annexin IV ANX4_HUMAN P09525 5.85/35.8 5.81/34.5 4271 Annexin V1 (lipocortin VI) ANX6_HUMAN P08133 5.42/75.7 6.14/36.1 2172 Esterase D ESTD_HUMAN P10768 6.54/31.5 6.60/34.0 5773 Glyceraldehyde 3-phosphate dehydrogenase, liver G3P2_HUMAN P04406 8.58/35.9 7.04/35.7 2674 Calponin H1, smooth muscle (Basic calponin) CLP1_HUMAN P51911 9.14/33.2 9.08/35.7 3075 Calponin H1, smooth muscle (Basic calponin) CLP1_HUMAN P51911 9.14/33.2 9.22/35.7 1076 Calponin H1, smooth muscle (Basic calponin) CLP1_HUMAN P51911 9.14/33.2 9.50/35.9 3477 Calponin H1, smooth muscle (Basic calponin) CLP1_HUMAN P51911 9.14/33.2 8.76/35.7 3378 Calponin H1, smooth muscle (Basic calponin) CLP1_HUMAN P51911 9.14/33.2 8.49/35.7 2179 Glyceraldehyde-3-phosphate dehydrogenase, liver G3P2_HUMAN P04406 8.58/35.9 8.32/37.2 5780 Glyceraldehyde-3-phosphate dehydrogenase, liver G3P2_HUMAN P04406 8.58/35.9 7.98/37.4 3681 QAlpha-actinin-2 associated LIM protein O60439 O60439 8.38/34.3 7.05/36.9 3582 Alcohol dehydrogenase [NADP(+)] ALDX_HUMAN P14550 6.35/36.4 6.45/39.6 4483a L-lactate dehydrogenase H chain LDHH_HUMAN P07195 5.72/36.5 5.77/37.9 3183b Tropomyosin, fibroblast and epithelial muscle type TPM2_HUMAN P06468 4.63/32.9 5.77/37.9 4084 Actin, gamma-enteric smooth muscle (alpha-actin 3) ACTH_HUMAN P12718 5.31/41.9 5.89/40.5 2285 Actin, gamma-enteric smooth muscle (alpha-actin 3) ACTH_HUMAN P12718 5.31/41.9 5.90/41.7 2286 LIM and SH3 domain protein-1 LAS1_HUMAN Q14847 6.61/29.7 6.14/38.2 6487 NEDD5 protein homolog NED5_HUMAN Q15019 6.15/41.5 6.17/41.7 4288 Phosphoglycerate kinase 1 PGK1_HUMAN P00558 8.30/44.6 7.70/41.7 4189 Fructose-bisphosphate aldolase A ALFA_HUMAN P04075 8.39/39.3 7.90/40.2 6690 Phosphoglycerate kinase 1 PGK1_HUMAN P00558 8.30/44.6 8.00/41.6 5091 Elongation factor 1-alpha 1 EF11_HUMAN P04720 9.10/50.1 9.20/45.5 1792 Prolargin [precursor] PARG_HUMAN P51888 9.47/43.8 8.30/51.4 2793 Prolargin [precursor] PARG_HUMAN P51888 9.47/43.8 8.08/51.6 2494 Pyruvate kinase, M1 isozyme KPY1_HUMAN P14618 7.57/57.7 7.52/55.3 4795 Prolargin [precursor] PARG_HUMAN P51888 9.47/43.8 7.35/52.4 4296 ATP synthase H+ transporting mitochondrial F1
complex alpha chainATPA_HUMAN P25705 8.28/55.2 7.67/49.2 34
Proteomics 2001, 1, 1405–1414 Mapping of human vascular smooth muscle proteins 1411

Table 1. Continued
Spot Protein Identity SWISS-PROTEntry name
SWISS-PROTPrimaryaccession No.
TheoreticalpI/massDa (x 103)
ObservedpI/massDa (x 103)
% Sequencecoverage
97 Integrin-linked protein kinase 1 ILK1_HUMAN Q13418 8.30/51.4 7.54/47.3 2498 Alpha enolase ENOA_HUMAN P06733 6.99/47.0 6.80/45.6 6199a QAnnexin XI ANXA_HUMAN P50995 5.20/37.2 7.03/52.7 2199b QProlargin [precursor] PARG_HUMAN P51888 9.47/43.8 7.03/52.7 28
100 Alpha enolase ENOA_HUMAN P06733 6.99/47.0 6.57/45.6 30101 Annexin XI ANXA_HUMAN P50995 7.53/54.4 6.63/52.6 28102 Aldehyde dehydrogenase, cytosolic DHAC_HUMAN P00352 6.29/54.7 6.19/52.4 39103 Aldehyde dehydrogenase, mitochondrial X DHA5_HUMAN P30837 6.01/55.3 6.17/50.3 35104 Aldehyde dehydrogenase, mitochondrial X [precursor] DHA5_HUMAN P30837 6.41/57.2 6.08/50.3 44105 Unidentified – – – 6.16/53.2 –106 Dihydropyrimidinase related protein-3 DPY3_HUMAN Q14195 6.04/62.0 6.08/56.5 22107 Dihydropyrimidinase related protein-3 DPY3_HUMAN Q14195 6.04/62.0 6.19/56.3 28108 Aldehyde dehydrogenase, cytosolic DHAC_HUMAN P00352 6.29/54.7 6.38/51.8 31109 Transforming growth factor-beta induced
protein IG-H3 [precursor]BGH3_HUMAN Q15582 7.62/74.7 6.47/59.1 51
110 Transforming growth factor-beta inducedprotein IG-H3 [precursor]
BGH3_HUMAN Q15582 7.62/74.7 6.69/58.6 31
111 Transforming growth factor-beta inducedprotein IG-H3 [precursor]
BGH3_HUMAN Q15582 7.62/74.7 6.58/59.1 42
112 DJ1092A11.3 WD repeat domain 1 Q9NTK7 Q9NTK7 6.37/51.6 6.31/61.5 57113 DJ1092A11.3 WD repeat domain 1 Q9NTK7 Q9NTK7 6.37/51.6 6.39/61.5 51114 Aconitate hydratase, mitochondrial [precursor] ACON_HUMAN Q99798 7.36/85.4 7.03/85.7 26115 Unidentified – – – 6.73/136.0 –116 Unidentified – – – 6.61/135.5 –117 Filamin ABP_HUMAN P21333 5.73/28.1 6.05/118.8 15118 QFilamin ABP_HUMAN P21333 5.73/28.1 6.03/120.0 13119 Vinculin VINC_HUMAN P18206 5.83/116.6 6.05/134.1 12120 Vinculin VINC_HUMAN P18206 5.83/116.6 6.02/134.9 25121 Gelsolin (actin depolymerization factor) GELS_HUMAN P06396 5.90/85.7 5.83/93.7 21122 Gelsolin (actin depolymerization factor) GELS_HUMAN P06396 5.90/85.7 5.74/94.1 41123 Vinculin VINC_HUMAN P18206 5.83/116.6 5.72/182.2 24124 Vinculin VINC_HUMAN P18206 5.83/116.6 5.65/173.7 18125 Vinculin VINC_HUMAN P18206 5.83/116.6 5.60/174.8 18126 Actin, gamma-enteric smooth muscle (alpha-actin 3) ACTH_HUMAN P12718 5.31/41.9 5.43/219.1 31127 Vinculin VINC_HUMAN P18206 5.83/116.6 5.44/111.5 16128 Heat shock cognate 71 kDa protein HS7C_HUMAN P11142 5.37/70.9 5.48/64.6 42129 Heat Shock 70 kDa protein 1 HS71_HUMAN P08107 5.48/70.1 5.54/63.3 53130 Protein disulphide isomerase ER-60 PDA3_HUMAN P30101 5.61/54.3 5.80/53.7 38131 Actin, gamma-enteric smooth muscle (alpha-actin 3) ACTH_HUMAN P12718 5.31/41.9 5.75/42.3 51132 Actin, gamma-enteric smooth muscle (alpha-actin 3) ACTH_HUMAN P12718 5.31/41.9 5.76/41.6 38133 Creatine kinase B chain KCRB_HUMAN P12277 5.34/42.6 5.59/42.5 70134 Actin, gamma-enteric smooth muscle (alpha-actin 3) ACTH_HUMAN P12718 5.31/41.9 5.53/42.7 34135 Beta tubulin TBB2_HUMAN P05217 4.79/49.8 5.50/37.4 39136 Osteoinductive factor [precursor] (OIF) OIF_HUMAN P20774 5.46/33.9 5.27/35.9 19137 Osteoinductive factor [precursor] (OIF) OIF_HUMAN P20774 5.46/33.9 5.26/36.9 26138 Annexin V ANX5_HUMAN P08758 4.94/35.8 5.01/34.8 33139 Tropomyosin, fibroblast TPM4_HUMAN P07226 4.67/28.5 4.50/33.4 24140 Tropomyosin beta chain, fibroblast and epithelial
muscle-typeTPM2_HUMAN P06468 4.63/33.0 4.53/38.7 17
141 Microfibril-associated glycoprotein 4 MFA4_HUMAN P55083 5.38/28.6 5.13/37.3 45142 Actin, gamma-enteric smooth muscle (alpha-actin 3) ACTH_HUMAN P12718 5.31/41.9 5.44/43.5 67143 Gamma enolase ENOG_HUMAN P09104 4.94/47.2 4.92/46.5 32
1412 E. McGregor et al. Proteomics 2001, 1, 1405–1414

Table 1. Continued
Spot Protein Identity SWISS-PROTEntry name
SWISS-PROTPrimaryaccession No.
TheoreticalpI/massDa (x 103)
ObservedpI/massDa (x 103)
% Sequencecoverage
144 ATP synthase beta chain, mitochondrial [precursor] ATPB_HUMAN P06576 5.26/56.6 5.11/49.2 52145 Tropomyosin, fibroblast and epithelial muscle-type TPM2_HUMAN P06468 4.63/33.0 4.60/46.6 40146 Calreticulin [precursor] CRTC_HUMAN P27797 4.29/48.1 4.11/65.7 23147 78 kDa glucose-regulated protein [precursor] GR78_HUMAN P11021 5.03/72.1 5.09/74.1 29148 Alpha actin, aortic smooth muscle ACTA_HUMAN P03996 5.24/42.0 5.37/105.9 28149 Alpha-1 collagen VI (aa 574–1009)(fragment) Q14040 Q14040 5.52/47.9 5.27/181.2 45
Protein identification from a two-dimensional gel of human saphenous vein medial smooth muscle (Fig. 1). Protein identity,primary SWISS-PROT/TrEMBL accession number or GenBank number, percentage coverage and observed and theoreti-cal pI/mass are indicated. Superscript ‘Q’ indicates protein spot identity confirmed by nanospray-MS.
glycan oligosaccharide chains. This has previously beendemonstrated to retard the migration of glycoprotein SDSpolyacrylamide gels [34].
Spots 63–65 were identified as the 27 000 Da heat shockprotein, HSP27. The shift in pI observed in this case is indi-cative of change in protein charge associated with varyingdegrees of phosphorylation. HSP27 has four major phos-phorylation isoforms: non-, mono-, di- and tri-phosphory-lated, exhibiting an accompanying increase in acidity.Armstrong and colleagues [35] demonstrated that HSP27from adult rabbit cardiomyocytes can be resolved as eightisoelectric isoforms. Scheler et al. [36] were able todemonstrate fifty-nine isoelectric isoforms of HSP27 withtwelve spots changing in dilated cardiomyopathy in the pIrange of 4.9–6.2 and mass range of 27 000–28 000 Da. Inthis study we have identified three distinct isoforms exhi-biting increasing degrees of acidity (pI values 6.02, 5.62and 5.45, spots 65, 64 and 63, respectively).
Spots 73, 79 and 80 were identified as glyceraldehyde 3-phosphate dehydrogenase (GAPDH, theoretical mass/pI 35 900 Da/8.58). Of the three spots, 79 and 80 form acharge train of molecular masses 37 200 and 37 400 Dawith pI values of 8.32 and 7.98, respectively. Here, thereis an obvious increase in GAPDH acidity. Phosphorylationof GAPDH has been demonstrated in rabbit muscle [37],porcine brain [38] and a human liver cell line [39]. It is likelythen, that spots 79 and 80 are GAPDH molecules in var-ious degrees of phosphorylation, spot 80 being morehighly phosphorylated than 79. Spot 73 was further iden-tified as a liver isoform of the protein, but may be a pro-teolytic fragment, as evidenced by its lower molecularmass and pI (35 700 Da/7.04)
MALDI-MS analysis of spot 83 revealed two distinctspectra. This would initially indicate that two protein spotshad comigrated at indistinguishable molecular weightand pI positions. This phenomenon may occur when pro-
teins are separated under low resolution conditions (i.e.pH 3–10 gradients). In this case spot 83 was identified asL-lactate dehydrogenase H-chain (83a) and tropomyosin(83b). However, the observed pI value obtained for spot83b of 5.77 appeared to be substantially more basic thanthe value obtained for the vast majority of tropomyosinidentified (spot 140). A possible explanation for this isthat during IEF a “smearing” effect of tropomyosin hasoccurred which may be due to the particular abundanceof this protein.
Two spots were identified as proteins of non-smoothmuscle cell origin. Analysis revealed that spots 22 and 24were haemoglobin � and � chains, respectively. The prob-able source of these contaminants is the saphenous veinmicrovasculature, which cannot be easily removed fromour medial layer dissections. However, these very abun-dant erythrocyte proteins constitute less than 2% of totalproteins identified.
Twenty protein spots were not identified. This in part mayhave been due to an insufficient amount of protein in thespot, despite pooling from replicate gels. Low molecularweight proteins may also compound this difficulty due toscarcity of tryptic digest sites. Indeed, 8 of the 20 uniden-tified spots ranged in molecular mass from 11 000 Da to18 700 Da. However, the possibility remains that someunidentified protein spots may be novel and therefore notdescribed in published databases.
4 Concluding remarks
The map of protein expression we have generated will bea useful tool in the identification and quantification of pro-teins, which may be differentially expressed, modified orregulated in HSV bypass vessels. In addition this mapcould be of use in investigating other pathologies centredaround vascular smooth muscle cells. The map may also
Proteomics 2001, 1, 1405–1414 Mapping of human vascular smooth muscle proteins 1413

facilitate the comparison of protein expression in smoothmuscle cells of varying origins, and be used to relate pro-tein expression to the various roles of these subtypes.
We thank the Graham Dixon Trust (Charing Cross), theBritish Heart Foundation, and the Charing Cross SpecialTrustees for financial support, and thank Jules A. West-brook (Heart Science Centre, Harefield Hospital) for histechnical help in running two-dimensional gels. RWthanks the Wellcome Trust for purchase of the MALDIspectrometer and SYW is grateful to the MedicalResearch Council for financial support.
Received April 30, 2001
5 References
[1] Nwasokwa, O. N., Ann. Intern. Med. 1995, 123, 528–545.[2] Motwani, J. G., Topol, E. J., Circulation 1998, 97, 916–931.[3] McCollum, C. N., Alexander, C., Kenchingtn, G., Franks,
P. J., Greenhalgh, R. M., J. Vasc. Surg. 1991, 13, 150–162.[4] Davies, M. G., Hagen, P. O., Br. J. Surg. 1994, 81, 1254–
1269.[5] Hsu, S. M., Raine, L., Fanger, H., J. Histochem. Cytochem.
1981, 29, 577–580.[6] Weekes, J., Wheeler, C. H., Yan, J. X., Weil, et al., Electro-
phoresis 1999, 20, 898–906.[7] Heinke, M. Y., Wheeler, C. H., Yan, J. X., Amin, V., et al., Elec-
trophoresis 1999, 20, 2086–2093.[8] Bradford, M. M., Anal. Biochem. 1976, 72, 248–254.[9] Rabilloud, T., Valette, C., Lawrence, J. J., Electrophoresis
1994, 15, 1552–1558.[10] Sanchez, J.-C., Rouge, V., Pisteur, M., Ravier, F., et al., Elec-
trophoresis 1997, 18, 324–327.[11] Görg, A., Boguth, G., Obermaier, C., Posch, A., Weiss, W.,
Electrophoresis 1995, 16, 1079–1086.[12] Görg, A., Postel, W., Weser, J., Günther, S., et al., Electro-
phoresis 1987, 8, 122–124.[13] Anderson, N. L., Two-Dimensional Electrophoresis: Opera-
tion of the ISO-DALT System, Large Scale Biology Press,Washington DC 1988.
[14] Yan, J. X., Wait, R., Berkelman, T., Harry, R. A., et al., Elec-trophoresis 2000, 21, 3666–3672
[15] Jeno P., Mini, T., Moes, S., Hintermann, E., Horst, M., Anal.Biochem. 1995, 224, 75–82.
[16] Wilm, M., Shevchenko, A., Houthaeve, T., Breit, S., et al.,Nature 1996, 379, 466–469.
[17] Shevchenko, A., Wilm, M., Vorm, O., Mann, M., Anal. Chem.1996, 68, 850–858.
[18] Gharahdaghi, F., Weinberg, C. R., Meagher, D. A., Imai, B. S.,Mische, S. M., Electrophoresis 1999, 20, 601–605.
[19] Vorm, O., Mann, M., J. Am. Soc. Mass Spectrom. 1994, 5,955–958.
[20] Perkins, D. N., Pappin, D. J., Creasy, D. M., Cottrell, J. S.,Electrophoresis 1999, 20, 3551–3567.
[21] Zhang, W., Chait, B. T., Anal. Chem. 2000, 72, 2482–2489.[22] Altschul, S. F., Madden, T. L., Schäffer, A. A., Zhang, J., et al.,
Nucleic Acids Res. 1997, 25, 3389–3402.[23] Amersham Pharmacia Biotech Brochure no. 18–1140–60.
Immobiline DryStrip Visualisation of pH gradients.[24] Rabilloud, T., Adessi, C., Giraudel, A., Lunardi, J., Electro-
phoresis 1997, 18, 307–316.[25] Gimona, M., Sparrow, M. P., Strasser, P., Herzog, M., Small,
J. V., Eur. J. Biochem. 1992, 205, 1067–1075.[26] Erdodi, F., Rokolya, A., Barany, M., Barany, K., Arch. Bio-
chem. Biophys. 1988, 266, 583–591.[27] Lees-Miller, J. P., Heeley, D. H., Smillie, L. B., Kay, C. M.,
J. Biol. Chem. 1987, 262, 2988–2993.[28] Takahashi, K., Nadal-Ginard, B., J. Biol. Chem. 1990, 266,
13284–13288.[29] Kwiatkowski, D. J., Curr. Opin. Cell Biol. 1999, 11, 103–108.[30] Sun, H., Yamamoto, M., Mejillano, M., Yin, H. L., J. Biol.
Chem. 1999, 274, 33179–33182.[31] Moon, A., Drubin, D. G., Mol. Biol. Cell. 1995, 6, 1423–1431.[32] Werth, D. K., Niedel, J. E., Pastan, I., J. Biol. Chem. 1983,
258, 11423–11426.[33] Sefton, B. M., Hunter, T., Ball, E. H., Singer, S. J., Cell 1981,
24, 165–174.[34] Poduslo, J. F., Anal. Biochem. 1981, 114, 131–139.[35] Armstrong, S. C., Delacey, M., Ganote, C. E., J. Mol. Cell.
Cardiol. 1999, 31, 555–567.[36] Scheler, C., Li, X., Salnikow, J., Dunn, M. J., Jungblut, P. R.,
Electrophoresis 1999, 20, 3623–3628.[37] Kawamoto, R. M., Caswell, A. H., Biochemistry 1986, 25,
657–661.[38] Wu, K., Aoki, C., Elste, A., Rogalski-Wilk, A. A., Siekevitz, P.,
Proc. Natl. Acad. Sci. USA. 1997, 94, 13273–13278.[39] Duclos-Vallee, J. C., Capel, F., Mabit, H., Petit, M. A., J. Gen.
Virol. 1998, 79 ,1665–1670.
1414 E. McGregor et al. Proteomics 2001, 1, 1405–1414