proteomic and metabolomic approaches christian laourdakis...molecular target identification of...
TRANSCRIPT

Molecular Target Identification of Antimalarial Drugs Using Proteomic andMetabolomic Approaches
Christian Laourdakis
Thesis submitted to the faculty of the Virginia Polytechnic Institute and StateUniversity in partial fulfillment of the requirements for the degree of
Masters of Life Science in Life Science in Biochemistry
Maria B. Cassera, ChairDennis R. Dean
Zachary B. MackeyAndrew P. Neilson
April 23, 2014Blacksburg, VA
Keywords: LC MS, DARTS, Purines and Pyrimidines, Plasmodium falciparum, Non Mevalonate pathway

Molecular Target Identification of Antimalarial Drugs Using Proteomic andMetabolomic Approaches
Christian Laourdakis
ABSTRACT
Malaria is a parasitic infectious disease that results in millions of clinical cases per year and
accounts for approximately 1 million deaths annually. Because the parasite has developed resistance to
all current antimalarials, new therapies are urgently needed. Purine and pyrimidine biosynthesis for DNA
and RNA synthesis has been recognized as a source of therapeutic targets. Targeted metabolite profiling
has aided in the understanding of several biological processes in the parasite besides drug discovery.
Therefore, having a robust analytical platform to quantify the purines and pyrimidines is of a great
value. For this purpose an ion pair reversed phase ultra performance liquid chromatography in tandem
with mass spectrometry method was developed and validated.
In addition, the apicoplast is an organelle present in the malaria parasite and other
apicomplexan parasites. It was demonstrated that the apicoplast is essential for parasite’s survival. The
supply of isopentenyl diphosphate and dimethylallyl diphosphate for isoprenoid biosynthesis is the sole
function of this organelle in the asexual intraerythrocytic stages. Isoprenoid precursors are synthesized
through the methylerythritol phosphate (MEP) pathway in the malaria parasite while humans utilize the
mevalonate pathway. Therefore, the MEP pathway is a source of drug targets for drug development.
Our group has identified MMV008138 as anti apicoplast inhibitor through phenotypic screening.
Preliminary data suggest that the molecular target of MMV008138 may be within the MEP pathway. We
used proteomic and metabolomic approaches to identify the molecular target of MMV008138 to aid
future medicinal chemistry to improve the efficacy of this inhibitor.

iii
ACKNOWLEDGMENTS
First, I would like to thank my advisor and mentor Dr. Maria Belen Cassera for granting me the
opportunity to grow as an undergraduate and graduate student at Virginia Tech. I am grateful that she
believed in me and gave me the opportunity to try new things and gave me the support and
encouragement to push myself as an academic and scientist. I will always use the skills and values that I
obtained from our work together.
Next, I would like to thank my fellow lab members. Dr. Emilio Fernando Merino was there to
teach me skills and techniques in the lab as well as help me grow in presenting data, in both written and
verbal formats. I would also like to thank him for giving me various other outlooks on life in general as it
pertains to science and job skills. Next, I would like to thank my fellow graduate student Jessica Bowman
for mentoring me and leading by example in showing me what it is to be a successful graduate student.
I also want to thank Dr. Rich Helm, Dr. Keith Ray, Dr. Sherry Hildreth, and Jody Jervis for their
help in growing as an LC MS and MALDI TOF operator including their time and effort in collaboration
and teaching techniques that pertained to my research. I would like to thank my committee members
Dr. Dennis Dean, Dr. Zachary Mackey, and Dr. Andrew Nielson for their feedback and assistance in my
research.
Finally, I would like to thank my family, with emphasis on my mom and dad, for their prolonged
encouragement and support in my life.

iv
TABLE OF CONTENTSABSTRACT............................................................................................................................. …………ii
ACKNOWLEDGMENTS.....................................................................................................................iii
LIST OF FIGURES..............................................................................................................................vi
LIST OF TABLES.............................................................................................................................. viii
LIST OF ABBREVIATIONS ................................................................................................................. ix
CHAPTER I………………………………………………………………………………………………………………………………….1
INTRODUCTION ....................................................................…………………………………………………...1
STATEMENT OF OBJECTIVES ....................................................................................................... 7
SIGNIFICANE AND NOVELTY........................................................................................................ 8
CHAPTER II....................................................................................................................................... 9
ABSTRACT .................................................................................................................................... 9
INTRODUCTION ........................................................................................................................... 9
MATERIALS AND METHODS ...................................................................................................... 11
Materials .............................................................................................................................................11
Plasmodium falciparum culture conditions and sample collection....................................................12
Sample preparation ............................................................................................................................13
IP RP LC MS/MS analysis ....................................................................................................................14
Data analysis .......................................................................................................................................15
Method validation...............................................................................................................................15
RESULTS AND DISCUSSION........................................................................................................ 16
IP RP LC MS/MS optimization ............................................................................................................16
Method validation...............................................................................................................................19
Purines and pyrimidines levels in P. falciparum and uninfected RBCs ...............................................21
CONCLUSIONS ........................................................................................................................... 23
CHAPTER III.................................................................................................................................... 24
INTRODUCTION ......................................................................................................................... 24
MATERIALS AND METHODS ...................................................................................................... 27

v
Cell extracts.........................................................................................................................................27
Sample preparation for DARTS analysis..............................................................................................27
MALDI TOF analysis for protein identification....................................................................................28
Band preparation ................................................................................................................................28
Liquid chromatography of peptides....................................................................................................30
MALDI TOF method ............................................................................................................................30
MASCOT analysis.................................................................................................................................30
Recombinant expression of the MEP pathway enzymes....................................................................31
Enzymatic reaction conditions............................................................................................................33
P. falciparum in vitro culture ..............................................................................................................34
Metabolite extraction of the MEP pathway intermediates from P. falciparum.................................34
Analysis of the MEP pathway intermediates by LC MS/MS ...............................................................35
Determination of the minimum inhibitory concentration (MIC) of MMV008138 against severalmicroorganisms...................................................................................................................................36
RESULTS AND DISCUSSION........................................................................................................ 37
Elucidating the molecular target of MMV008138 by targeted metabolomics...................................37
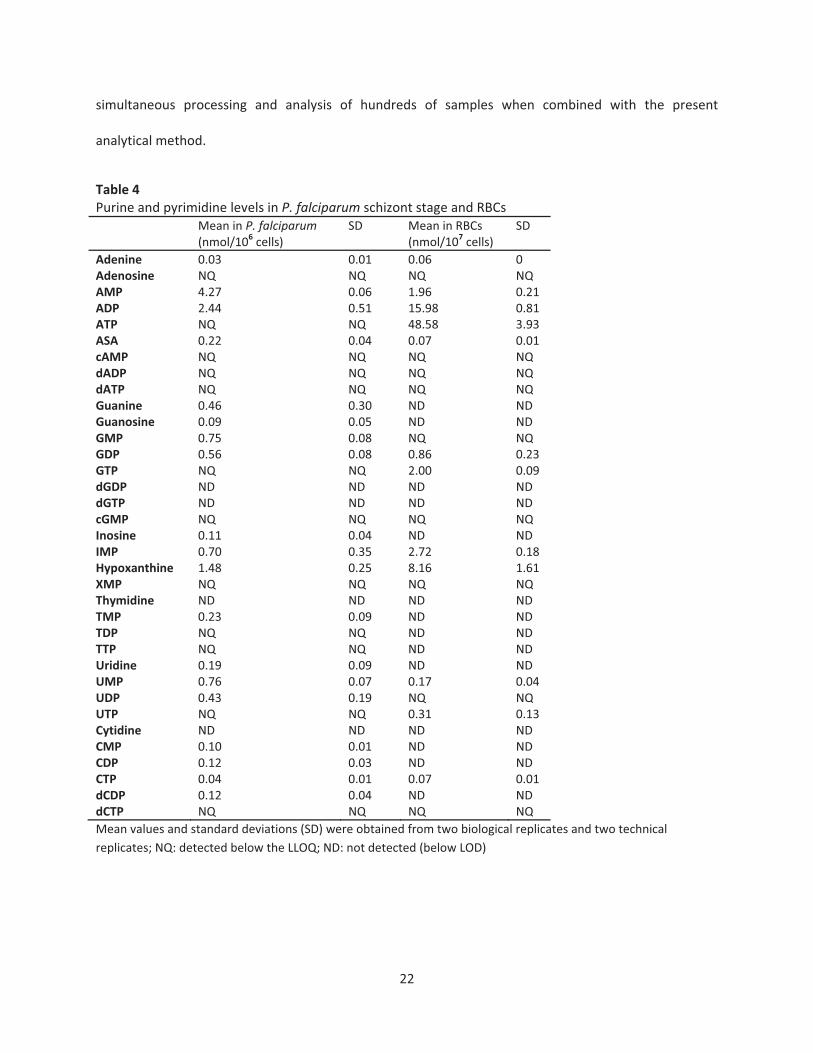
Elucidating the molecular target of MMV008138 by DARTS approach..............................................39
MEP pathway enzymes as potential molecular targets of MMV008138 ...........................................44
MEP pathway enzymes expression from E. coli..................................................................................46
CMS enzyme expression fromM. bovis ..............................................................................................51
CONCLUSIONS ........................................................................................................................... 56
FUTURE DIRECTIONS ................................................................................................................. 58
REFERENCES…………………………………………………………………………………………………………………………...59

vi
LIST OF FIGURES
CHAPTER I
Figure 1. The P. falciparum parasite life cycle ……………………………………….………………..…………………3
CHAPTER II
Figure 1. Structure of ion pairing reagent dibutylamine acetate ……..………………………………………11
Figure 2. Combined extracted ion chromatograms of standards of the selected 35 nucleobases,nucleosides and nucleotides …………………………………………………………………………………………..……….17
CHAPTER III
Figure 1. Molecular structure of MMV008138……………………………………………………………………….…24
Figure 2. Basic principle of drug affinity responsive target stability (DARTS)……………..………..……25
Figure 3. DARTS approach workflow ……………………………………………………..…………..…..……………….26
Figure 4. The MEP pathway in the malaria parasite ……………………………….…………..……………….….38
Figure 5. LC MS/MS analysis of the MEP Intermediates in P. falciparum after treatment withMMV008138……………………………………….………………………………………..…………………………..…………….39
Figure 6. E. coli DARTS optimization with FOS as ligand ……………………………………….….………………40
Figure 7. E. coli DARTS optimization with MMV008138 as ligand ………………….…………………………41
Figure 8. P. falciparum DARTS optimization using MMV008138…………….……………..…………………42
Figure 9. MASCOT peptide analysis of the excised band from P. falciparum DARTS analysis ……43
Figure 10. . Peptide mapping of enolase from P. falciparum ………..………………………………………….44
Figure 11. PCR amplification products of the MEP pathway enzymes ………………………..……………45
Figure 12. . CMS purification from E. coli …………………………………………………………………………………46

vii
Figure 13. E. coli CMS enzymatic activity and MMV008138 inhibition assay ……………..……….……47
Figure 14. Areas from E. coli CMS enzymatic activity and MMV008138 inhibition assay ……..….48
Figure 15. E. coliMCS expression and purification ……………………………………………..……………………49
Figure 16. E. coli CMK enzyme activity assay and in inhibition assay ………………..………..……...……50
Figure 17. Areas from E. coli CMK enzymatic activity and MMV008138 inhibition assay …………51
Figure 18.M. bovis CMS expression and purification ………………..…………………………………..………..52
Figure 19. M. bovisMBP CMS expression and purification ………………………..……………..……………52
Figure 20.M. bovisMBP CMS cleavage using TEV …………………………………………………………………..53
Figure 21.M. bovisMBP CMS enzymatic activity and inhibition assay ……………..……………..……..54
Figure 22. Areas from M. bovis MBP CMS enzymatic activity and MMV008138 inhibitionassay………………………………………………………………………………………………………………………………………..54
Figure 23.M. bovis CMS enzymatic activity and inhibition assay …………………..………….……..……..55
Figure 24. Areas from M. bovis CMS enzymatic activity and MMV008138 inhibition assay ….….55

viii
LIST OF TABLES
CHAPTER II
Table 1. Optimized UPLC inlet method ………………………………………………………………..…………………14
Table 2. Analytical conditions and retention times optimized for purine and pyrimidinenucleobases, nucleosides, and nucleotides ..……………………………………………………………………………18
Table 3. Parameters evaluated for method validation ……………………………………………….……………20
Table 4. Purine and pyrimidine levels in P. falciparum schizont stage and RBCs……………………….22
CHAPTER III
Table 1. Primers used for cloning of the MEP pathway enzymes……………………….……………….……31
Table 2. Analytical conditions and retention times optimized for MEP pathway intermediates…………………………………………………………………………………………………………………………………………………36
Table 3. Potential molecular targets of MMV008138 identified by DARTS ………………………………43
Table 4. Minimum inhibitory concentration (MIC) of growth for MMV008138 in severalpathogens. Absence of the MEP pathway is indicated (*)…………………………………………..……………44

ix
LIST OF ABBREVIATIONS
%CV: Percent coefficients of variation ACT: Artemisinin based combination therapies ADP: Adenosine 5’ diphosphate AMP: Adenosine 5’ monophosphate ASA: Adenosylsuccinic acid ATP: Adenosine 5’ triphosphate cAMP: Cyclic adenosine 5’ monophosphate CDP: Cytidine 5’ diphosphate cGMP: Cyclic guanosine 5’ monophosphate cMEPP: 2 C methyl D erythritol 2,4 cyclopyrophosphate CMK: 4 (cytidine 5' diphospho) 2 C methyl D erythritol kinase CMP: Cytidine 5’ monophosphate CMS: 2 C methyl D erythriol 4 phosphate cytidyltransferase CTP: Cytidine 5’ triphosphate dADP: Deoxyadenosine 5’ diphosphate DARTS: Drug affinity responsive target stability dATP: Deoxyadenosine 5’ triphosphate DBAA: Dibutylamine acetate dCDP: Deoxycytidine 5’ diphosphate dCTP: Deoxycytidine 5’ triphosphate dGDP: Deoxyguanosine 5’ diphosphate dGTP: Deoxyguanosine 5’ triphosphate DOX: Doxycycline DOXP: 1 Deoxy D xylulose 5 phosphate DXR: 1 deoxy D xylulose 5 phosphate reductoisomerase FOS: Fosmidomycin GDP: Guanosine 5’ diphosphate GMP: Guanosine 5’ monophosphate GTP: Guanosine 5’ triphosphate HMBPP: (E) 4 Hydroxy 3 methyl but 2 enyl pyrophosphate HPLC: High performance liquid chromatography IMP: Inosine 5’ monophosphate IPP: Isopentenyl diphosphate IP RP UPLC MS/MS: Ion pairing reverse phase ultra high performance liquid chromatography
tandem mass spectrometry IPTG: Isopropyl D 1 thiogalactopyranoside ISPP: Isopentenyl S thiolodiphosphate

x
LC/MS: Liquid chromatography mass spectrometry LLOQ: Lower limit of quantification LOD: Limit of detection MCS: 2 C methyl D erythritol 2,4 cyclodiphosphate synthase MEP: 2 C methylerythritol 4 phosphate MRM: Multiple reaction monitoring RBC: Red blood cell TDP: Thymidine 5’ diphosphate TEV: Tobacco Etch Virus protease TIC22: Translocon of the inner chloroplast TMP: Thymidine 5’ monophosphate TOC: Translocon of the outer chloroplast TTP: Thymidine 5’ triphosphate TTP UDP: Uridine 5’ diphosphate ULOQ: Upper limit of quantification UMP: Uridine 5’ monophosphate UPLC: Ultra performance liquid chromatography UTP: Uridine 5’ triphosphate XMP: Xanthine 5’ monophosphate

1
CHAPTER I
INTRODUCTION
Malaria: the disease
Human malaria is caused by five species of the genus Plasmodium including P. falciparum, P.
vivax, P. malariae, P. ovale and P. knowlesi. The parasites are transmitted through the Anopheles
mosquito vector. Malaria accounted for as many as 250 million clinical cases and 800,000 deaths mainly
in Africa in 2010, but the disease is also widespread across southern Asia, central America and north of
south America (2 4). Currently, there are 3.3 billion people worldwide at risk of infection (2 4). P. falciparum
is associated with the highest mortality rates among the five species and P. vivax is the most prevalent
infection.
P. falciparum is an intracellular parasite and has a complex life cycle involving the human host
and the Anophelesmosquito vector. P. falciparum infection of the human host is initiated by injection of
sporozoites into the bloodstream by an infected female mosquito when taking a blood meal (3). The
sporozoites are carried by the circulatory system to the liver where they invade hepatocytes and where
asymptomatic asexual multiplication occurs (exoerythrocytic schizogony) (3). Sporozoites express specific
proteins on their cellular membrane to bind to hepatocytes and uses motor proteins including an actin
and myosin system in tandem with secretory systems from the microneme and rhoptry to invade the
hepatocyte (5). Exoerythrocytic schizogony culminates in the production of several thousand merozoites,
which are released into the bloodstream and invade erythrocytes. This invasion of human red blood cells
is also aided by the specialized secretory vesicles and motor proteins in the apical end of the merozoite
(5). This invasion begins the erythrocytic cycle where the major parasite expansion occurs. During the P.
falciparum intraerythrocytic cycle (Figure. 1), each parasite produces 8 to 24 new merozoites every 48

2
hours. The asexual intraerythrocytic phase of the infection is responsible for malaria pathogenesis and,
therefore, is the target for most antimalarial compounds (6). Alternatively, a percentage of “pre
destined” rings will forsake asexual reproduction and develop into gametocytes (sexual intraerythrocytic
stages), the transmission stages of the malaria parasite. Gametocytes mature through five distinct
stages (I to V) within 10 to 14 days (6, 7). This process is triggered by environmental and/or host
conditions, so that future progeny may survive and that sexual reproduction can occur in the mosquito
(6, 7). The gametocytes are then ingested during a blood meal by a female mosquito allowing the
transmission cycle to continue, thus, resulting in subsequent infection of a new host (3, 7). Once
gametocytes are ingested during the female mosquito’s blood meal, the male gametocyte will
exflagellate and find a female gametocyte for sexual reproduction within the mosquito midgut (8). After a
macrogamete is fertilized by a microgamete, the formed zygote (ookinete) will secrete a chitinase that
allows the parasite to penetrate the peritrophic membrane surrounding the blood meal. The ookinete
will then migrate through the midgut epithelium to the basal lamina, where it will develop into an
oocyst which generates sporozoites that travel to the salivary glands of the mosquito and will be
injected into another human host upon the mosquito’s next blood meal allowing for the infection cycle
to continue (9).

3
Figure 1. The P. falciparum parasite life cycle. The parasite’s life cycle involves infecting two hosts,humans and the female Anopheles mosquitoes. When a female mosquito carrying the parasite feeds ona human host, sporozoites are injected into the bloodstream. Sporozoites travel to the liver to start thefirst round of asexual replication. Merozoites will then exit the liver reentering into the bloodstream tostart the asexual intraerythrocytic cycle, where the onset of the disease occurs. Some merozoites willleave the asexual cycle to develop the sexual forms called gametocytes (male and female). When afemale mosquito feeds on an infected human, gametocytes will further develop into gametes that willfuse to start the mosquito cycle which will generate new sporozoites that will be injected in a newhuman host to re start the cycle.
Malaria: the problem
Currently, malaria control relies on vector control by implementing insecticide treated bed nets
in low income regions, house spraying with insecticides, and the ability to treat infected humans with
chemotherapeutics. Artemisinin based combination therapies (ACTs) are presently the preferential
treatment for an infection with P. falciparum, the most lethal species in humans. However, the World
Health Organization do not recommend ACTs for pregnant women and children under a specified weight

4
due to toxicity (2). Furthermore, parasites are developing resistance to artemisinin as well as many other
drugs used to treat the disease in Southeast Asia (10, 11). Therefore, novel treatments with novel
mechanisms of action are greatly needed to stay ahead of resistance development.
The apicoplast and MEP pathway as a drug target
The apicomplexan parasites contain a unique organelle called the apicoplast, which is essential
for the parasite survival (12, 13). The apicoplast is a relic photosynthetic plastid that has been incorporated
into the parasite through endosymbiosis but has lost the ability to perform photosynthesis (14). Still the
apicoplast contains several metabolic pathways that are essential to the parasite and are likely evolved
from the endosymbiotic relationship between the parasite and the plastid, including new transporters
for metabolite and protein exchange between the apicoplast and the parasite (TIC and TOC complexes)
(14). Of the several biosynthetic reactions that take place within this organelle many do not occur in
humans, use differing enzymes, and/or use alternative pathways including isoprenoid biosynthesis, fatty
acid biosynthesis, and heme biosynthesis. As an example, humans rely on the mevalonate pathway for
isoprenoid biosynthesis while the parasite relies on the methylerythritol phosphate (MEP) pathway for
isoprenoid precursor synthesis. Therefore, the apicoplast has become a valuable target for development
of novel drugs (12, 13). Recently, Yeh and DeRisi revealed that the sole function of the apicoplast in the
asexual intraerythrocytic stages is to supply isopentenyl diphosphate (IPP) through the methylerythritol
phosphate (MEP) pathway for isoprenoid biosynthesis (15). They generated parasites lacking the
apicoplast by treating parasites with doxycycline (DOX), which inhibits translation in the apicoplast and
consequently this organelle is lost in the progeny, and by supplying IPP (chemical rescue). The natural
product fosmidomycin (FOS) isolated from Streptomyces lavendulae is an inhibitor of the second enzyme
in the MEP pathway, 1 deoxy D xylulose 5 phosphate reductoisomerase, which is essential for P.

5
falciparum survival (16). FOS treatment also causes loss of the apicoplast (17). Although the role of this
organelle in gametocytes remains unclear, studies performed by Dr. Cassera’s group indicates that the
apicoplast is essential for gametocytogenesis.
It has been shown in P. falciparum that antibiotics inhibiting prokaryotic transcription or
translation, affect apicoplast replication and maintenance in one life cycle and ends with irreversible
apicoplast loss and parasite’s death in the subsequent cycle, (15) which is known as “delayed death”
phenotype (18). There are several inhibitors that target different biological process involved in the
apicoplast maintenance including ciprofloxacin, rifampicin, and doxycycline which show delayed death
phenotypes (19). Ciprofloxacin targets DNA replication within the apicoplast blocking DNA gyrase activity
while rifampicin targets transcription as shown by the apicoplasts prokaryotic like structure. Doxycycline
blocks translation of transcribed genes by binding to the ribosome (19). In contrast, metabolic inhibition
of the MEP pathway with FOS does not display the delayed kill kinetic effect observed with classical
antibiotics and, thus, shows a rapid onset of action (20, 21).
The MEP pathway for isoprenoid precursor biosynthesis is essential to produce several
downstream products including ubiquinones, carotenoids, dolichols, prenylation of proteins, and
possible isoprenylation of tRNAs within the parasite (22 25). The MEP pathway uses a subset of enzymes
that differs from the human host’s mevalonate pathway allowing possible targeting of these MEP
pathway enzymes without affecting the human upon treatment.
Based on these phenotypic observations, it is now possible to identify apicoplast targeting
antimalarials using whole cell based screens by reversal of growth inhibition through IPP
supplementation or by observing delayed death phenotype. Moreover, since drugs can kill the parasite
by directly targeting IPP synthesis or by interfering with pathways essential for apicoplast survival such
6
as DNA replication or protein translation, these approaches will aid in the identification of molecular
targets for compounds selected by these phenotypic screens.
Drug discovery was driven by phenotypic based assays before the introduction of target based
approaches. Recently, it was demonstrated that phenotypic based screening identified more first in
class therapeutics for infectious diseases than target based screening (3). Moreover, many antimalarial
drugs such as artemisinin are administered without knowledge of the mechanism of action. Targeted
and untargeted metabolomics using liquid chromatography in tandem with mass spectrometry (LC MS)
can be used to assess metabolite levels which can then be used to answer the biological question of how
a drug affects the metabolism and what metabolites are being altered in a specific metabolic pathway.
In addition, proteomics approaches such as drug affinity responsive target stability (DARTS) have been
shown as a novel approach of elucidating the molecular targets of drugs with previously unknown
mechanisms of action through stabilization of the protein targeted upon binding of a ligand (1). This
approach has also implications in characterizing off target effects of previously discovered therapies.
We aimed to elucidate the molecular target of MMV008138 which was identified by our lab to
target the apicoplast by reversal of growth inhibition through IPP supplementation. To achieve this aim
several approaches were used including the proteomic technique DARTS, recombinant expression of
several enzymes of the MEP pathway and further enzymatic analysis, as well as targeted metabolomics
by LC/MS analysis to assess the response of the MEP pathway intermediates after treatment with
MMV008138. In addition, an IP RP UPLC MS/MS method was optimized and validated to quantify
purine and pyrmidine intermediates in P. falciparum and its host cell, the human erythrocyte. Purine
and pyrimidine biosynthesis in the malaria parasite has been recognized as a rich source of therapeutic
targets for drug development; therefore, having a robust platform to quantify the parasite’s
intermediates is of a great value.

7
STATEMENT OF OBJECTIVES
1. Develop and validate an optimized IP RP LC MS/MS method for quantification of several purine
and pyrimidine nucleobases, nucleosides, and nucleotides that will be suitable for analysis of a
large set of samples.
Hypothesis: Ion pairing in combination with UPLC can be used to optimize a robust
analytical UPLC MS/MS method for simultaneous quantification of several nucleobases,
nucleosides and nucleotides.
2. Elucidate the molecular target of the novel anti apicoplast inhibitor, MMV008138, to aid further
medicinal chemistry to improve efficacy and reduce human toxicity.
Hypothesis: The molecular target of MMV008138 within the apicoplast is among the
MEP pathway enzymes with the exception of 1 deoxy D xylulose 5 phosphate
reductoisomerase.

8
SIGNIFICANCE AND NOVELTY
This work aimed to optimize an IP UPLC MS/MS method to quantify purines and pyrimidines in
the malaria parasite using a one step chromatographic method suitable for high throughput analysis. A
previous IP UPLC MS/MS method proposed by Yamaoka and colleagues used to quantify 23 purines and
pyrimidines was used as starting point for optimization. Our method allows the quantification of 35
purines and pyrimidines simultaneously and can be applied for many types of cells and/or tissue. This
optimized method will provide a more in depth understanding of how rapid dividing cells such parasites
adapt their purines and pyrimidines metabolism to sustain rapid DNA and RNA synthesis.
DARTS has just started to be applied to P. falciparum as an approach to determining the
molecular targets of therapeutics that have been discovered through cell based assays. This method
opens new avenues to find novel targets for drug development not previously known. This method can
also be used to identify off target effects of current antimalarial with known mechanism of action.
Elucidation of molecular targets using DARTS approach has many advantages when compared to other
approaches including low cost, relatively easy work flow, and does not need to alter the native chemical
moieties of the drug, as is required in affinity based techniques. The preservation of the chemical
structure allows drug interactions that mimic native conditions. We aimed to use DARTS along with
other targeted approaches including recombinant expression of the MEP pathway enzymes, inhibition
assays, and targeted metabolomics to elucidate the molecular target of the anti apicoplast inhibitor
MMV008138. The long term goal of this project is to discover novel drugs that disrupt the function of
the apicoplast.

9
CHAPTER II
Quantification of nucleobases, nucleosides, and nucleotides in Plasmodium falciparum using ionpairing ultra performance liquid chromatography mass spectrometry
Christian D. Laourdakis, Emilio F. Merino, Andrew P. Neilson, Maria B. Cassera
ABSTRACT
Targeted metabolite profiling has aided in the understanding of a variety of biological processes
in the malaria parasite as well as in drug discovery. A fast and sensitive analytical method, based on ion
pairing reversed phase ultra high performance liquid chromatography tandem mass spectrometry (IP
RP UPLC MS/MS), was optimized for the simultaneous analysis of intracellular levels of 35 purine and
pyrimidine nucleobases, nucleosides, and nucleotides. This analytical method allows for
chromatographic separation of highly polar metabolites using reverse phase chemistry within 15
minutes. The method was validated and successfully applied to the quantification of purines and
pyrimidines in Plasmodium falciparum and its host cell, the human erythrocyte. In addition, this method
can be customized to include other related metabolites such as NADPH and NADP, among others.
INTRODUCTION
Human malaria is a vector borne disease caused by five species of parasites of the genus
Plasmodium. Plasmodium falciparum is the most lethal species and accounts for millions of clinical cases
and close to a million deaths each year (3). During the rapid intraerythrocytic asexual stage of malaria
infection (blood stages), where the onset of the disease occurs, there is a significant increase in DNA and
RNA synthesis, especially during the trophozoite and schizont stages. Therefore, an increased demand

10
for purine and pyrimidine intermediates occurs mainly during those stages (26). P. falciparum is a purine
auxotroph, salvaging purines from human erythrocytes to sustain DNA and RNA synthesis while
pyrimidines are synthesized de novo (26). Liquid chromatography in tandem with mass spectrometry (LC
MS) based approaches to quantify intracellular metabolite levels in the malaria parasite have been used
to identify a wide range of molecular classes, including purines, since their biosynthesis has been
recognized as a rich source of therapeutic targets for drug development (26 28); however, a
comprehensive purine and pyrimidine quantitative analysis has not been reported.
To date, several methods have been developed for analysis of purines and pyrimidines, including
gas chromatography (GC) MS and LC MS based methods (29 33). Purine and pyrimidine nucleobase,
nucleoside, and nucleotide quantification have previously been accomplished in cells and foods using
ion pairing chromatography due to the fact that highly charged phosphorylated molecules are retained
on a reverse phase column (32 37). However, the reported methods only account for a small subset of
purines and pyrimidines analyzed (up to 24 metabolites), and require long run times, such as 50 minutes
(33, 34, 36, 37). Currently, the simultaneous analysis of tens to hundreds of metabolites is now possible due
to continuous technological improvements in both LC resolution, such as ultra high performance liquid
chromatography (UPLC) and high speed mass spectrometers. In addition, modern triple quadrupole MS
can measure positive and negative ions by switching polarities within milliseconds while simultaneously
performing full scans for ion product confirmation (PIC) (38). However, these advances have not yet been
fully utilized to develop a comprehensive analytical method for the full spectrum of purines and
pyrimidines.
The present study aimed to develop and validate an optimized method for quantification of 35
purine and pyrimidine nucleobases, nucleosides, and nucleotides and be suitable for analysis of a large
set of samples. The selected purines and pyrimidines are key metabolites for DNA and RNA synthesis in
the malaria parasite (26). This goal was accomplished using ion pair reversed phase ultra performance

11
liquid chromatography in tandem with mass spectrometry (IP RP UPLC MS/MS) and using the volatile IP
reagent dibutylamine acetate (DBAA). The method was validated and applied to the quantification of
purines and pyrimidines in P. falciparum schizont stage parasites and their host cell, human red blood
cells (RBCs). The described method can be applied to many fields, from drug discovery to cell biology, as
well as be customized to include other related metabolites such as NADPH and NADP, among others.
Figure 1. Structure of ion pairing reagent dibutylamine acetate.
MATERIALS AND METHODS
Materials
All reagents were of the highest commercial quality available. The following reagents were
purchased from Sigma Aldrich: nucleobases (adenine, guanine, hypoxanthine), nucleosides (adenosine,
thymidine, inosine, uridine, guanosine, cytidine), nucleotides (inosine 5’ monophosphate (IMP),
xanthine 5’ monophosphate (XMP), cytidine 5’ monophosphate (CMP), cytidine 5’ diphosphate (CDP),
deoxycytidine 5’ diphosphate (dCDP), cytidine 5’ triphosphate (CTP), deoxycytidine 5’ triphosphate
(dCTP), uridine 5’ monophosphate (UMP), uridine 5’ diphosphate (UDP), uridine 5’ triphosphate (UTP),
guanosine 5’ monophosphate (GMP), cyclic guanosine 5’ monophosphate (cGMP), guanosine 5’
diphosphate (GDP), deoxyguanosine 5’ diphosphate (dGDP), guanosine 5’ triphosphate (GTP),
deoxyguanosine 5’ triphosphate (dGTP), adenosine 5’ monophosphate (AMP), cyclic adenosine 5’
CH3 NH CH3
CH3 OH
O

12
monophosphate (cAMP), adenosine 5’ diphosphate (ADP), deoxyadenosine 5’ diphosphate (dADP),
adenosine 5’ triphosphate (ATP), deoxyadenosine 5’ triphosphate (dATP), adenosylsuccinic acid (ASA),
thymidine 5’ monophosphate (TMP), thymidine 5’ diphosphate (TDP), thymidine 5’ triphosphate (TTP),
[13C9, 15N3]CTP), and dibutylamine acetate (DBAA). Mass spectroscopy grade acetonitrile, ammonium
formate, and formic acid (99%) were purchased from Fisher Scientific. Mass spectrometry grade water
was prepared with a Millipore Milli Q Plus system equipped with an LC Pak® cartridge. O positive human
red blood cells (RBCs) were purchased from The Interstate Companies (Memphis, TN). The following
reagents for P. falciparum in vitro culture were used: Albumax I (Gibco Life Technologies), glucose
(Sigma Aldrich), sodium bicarbonate (Sigma Aldrich), hypoxanthine (Sigma Aldrich), HEPES, and
gentamicin (Gibco Life Technologies).
Plasmodium falciparum culture conditions and sample collection
Experiments were performed with the P. falciparum Dd2 clone as described previously (39).
Briefly, parasites were maintained in O positive human erythrocytes (4% hematocrit) in RPMI 1640
medium supplemented with 5 g/L Albumax I, 2 g/L glucose, 2.3 g/L sodium bicarbonate, 370 M
hypoxanthine, 25 mM HEPES, and 20 mg/L gentamicin. The parasites were kept at 37 °C under reduced
oxygen conditions (5.06% CO2, 4.99% O2, and 89.95% N2). Development and multiplication of parasites
were monitored by microscopic evaluation of Giemsa stained thin smears. Ring stage parasites (1–20 h
after reinvasion) were synchronized by two treatments with 5% (w/v) D sorbitol solution in water (5 min
at 37 °C).
Schizont forms (30–45 h after reinvasion) were purified using magnetic activated cell sorting
(MACS, Miltenyi Biotec) columns. Briefly, CS columns were placed into the MACS magnetic support and
equilibrated with 10 mL of RPMI medium pre warmed at 37 °C. Parasites from each 20 mL culture (4%

13
hematocrit, 20% parasitemia) were centrifuged at 1000 g for 10 min, resuspended with 5 mL of
complete medium at 20% hematocrit, and then loaded on the top of the column. Flow through
containing the uninfected RBCs, ring, and young trophozoite infected RBCs was discarded and columns
were washed with 20 mL of RPMI medium pre warmed at 37 °C. Then, 10 mL of RPMI medium pre
warmed at 37 °C was loaded on the top of the column and the column was removed from the magnetic
field to elute the schizont forms that were counted using a Neubauer chamber. Parasites were isolated
from the host cell by treatment with 0.03% (w/v) saponin for 5 min and pellets were washed twice with
ice cold phosphate buffered saline (PBS), pH 7.2, at 10,000 × g for 10 min. Samples were kept at – 80 °C
until metabolite extraction.
Uninfected RBCs were maintained in complete media at 37 °C in parallel with parasite cultures
and recovered by centrifugation at 1000 g for 10 min. Pellets were washed twice with ice cold PBS, pH
7.2, at 2,000 × g for 10 min and the number of RBCs was determined by counting with the Neubauer
chamber.
Sample preparation
Two separate biological replicates of P. falciparum schizont stage parasites (6 x 10⁶ cells) and
uninfected RBCs (2 x 10⁷ cells) were extracted. During metabolite extractions, samples were kept on ice
and the centrifugation steps were performed at 4 °C as described previously (26). Briefly, the internal
standard [13C9, 15N3]CTP (CTP IS) was spiked into each sample for a final concentration of 50 μM after
metabolite extraction, which was initiated by adding 0.5 M perchloric acid at 1:7 (v/v, sample/HClO4) to
the cell pellet, mixed for 10 seconds with a vortex, and incubated on ice for 20 min. Then, extracts were
neutralized with 5 M potassium hydroxide at 10:1 (v/v, HClO4/KOH), mixed immediately for 10 sec, and
incubated for an additional 20 minutes on ice. Samples were then centrifuged for 10 min at 10,000 rpm

14
at 4 oC and supernatants were transferred to an Amicon Ultra (0.5 mL) centrifugal filter and centrifuged
for 20 minutes at 13,000 rpm at 4oC. After filtration, 100 μL of each sample was transferred to a
microplate for IP RP LC MS/MS analysis. Injections of 5 μL were performed for both standards and
samples. Calibration curves were freshly prepared from stocks and diluted in water.
IP RP LC MS/MS analysis
Separations and analyses were performed using a Waters ACQUITY H class UPLCTM (Waters,
USA) liquid chromatography system in tandem with an XEVO TQ MSTM mass spectrometer (Waters, USA)
equipped with an electrospray ionization (ESI) source. The LC system was equipped with a quaternary
pump and autosampler that was maintained at 10 oC. A Waters ACQUITY UPLCTM HSS T3 column (1.8
μm, 2.1 mm x 100 mm) and an ACQUITY column in line filter were used. The column temperature was
maintained at 40 oC. The standards and samples were separated using a gradient mobile phase
consisting of 1.25 mM DBAA, 10 mM ammonium formate in water, and 1% formic acid to adjust the pH
to 5.2 (A), and 1.25mM DBAA, and 10 mM ammonium formate in water:acetonitrile (1:9, v/v) (B). The
flow rate was set at 0.3 mL/min and the gradient conditions are summarized in Table 1.
a Flow rate was set at 0.3 mL/minA: Water containing 10 mM ammonium formate and 1.25 mM DBAA (pH 5.2, adjusted with 1 % formic acid)B: Water:acetonitrile (1:9, v/v) containing 10 mM ammonium formate and 1.25 mM DBAA
Table 1Optimized UPLC inlet methodTime (min)a Percent mobile phase
A (%) B (%)0 100 010 89 1111 67 3312 100 015 100 0

15
For the MS analysis, the capillary voltage was set at 3.75 kV for positive ion mode and 3.00 kV
for negative ion mode. The source and desolvation gas temperatures of the mass spectrometer were set
at 150 oC and 450 oC, respectively. The desolvation gas (N2) was set at 600 L/h. Quantitative
determination was performed in ESI positive and negative ion mode using multiple reaction monitoring
(MRM) mode. The ion transitions, cone voltage, and collision energy used for ESI MS/MS analysis were
determined using MassLynx V4.1 intellistart software and are presented in Table 2. The use of a
quantifier and a qualifier ion per metabolite is recommended for confirmatory purposes but this was not
always possible, especially with small molecules with masses below 150 Da. Instead, PIC functionality in
the Xevo TQ MS allows simultaneous confirmation and quantification by switching between MRM and
full scan MS mode (38).
Data analysis
Data acquisition and analysis were performed using MassLynx V4.1 and TargetLynx software
(Waters). Concentration of metabolites was performed by correlating the metabolite:internal standard
ratio of MS signals detected by MRM in the calibration curves. The amount of each metabolite detected
is expressed as the mean and standard deviation of two biological replicates and two technical
replicates run on different days.
Method validation
We previously reported both metabolite extraction and analysis of purines in uninfected RBCs
and P. falciparum (26, 40). In addition, the present method was optimized based on the previous report by
Yamaoka and colleagues (36); therefore, only linearity, intra and inter day precision, accuracy, and lower

16
and upper limits of detection/quantification of each metabolite were validated. Ion suppression or
enhancement caused by matrix interference was evaluated using CTP IS spiked in uninfected RBCs or P.
falciparum pellets before extraction and compared to the same amount in water. Intra and inter day
variation was computed by the percent standard deviation in relation to the mean values (%CV) of the
upper limit of quantification from within days and between days using the standard mixture. Limit of
detection (LOD) was defined as three times the signal to noise ratio and the lower limit of quantification
(LLOQ) was defined as 10 times the signal to noise ratio. Dynamic range (linearity) and upper limit of
quantification was determined by linear regression.
RESULTS AND DISCUSSION
IP RP LC MS/MS optimization
We aimed to achieve reduction in sample runtime while effectively resolving 35 purine and
pyrimidine nucleobases, nucleosides, and nucleotides (Figure 2). For this purpose, a previous method
reported by Yamaoka and colleagues was selected for optimization (36). The optimized analytical
conditions and retention times for each metabolite are shown in Table 2. For our analysis, DBAA was
selected as the ion pairing reagent instead of dihexylamine acetate to reduce hydrophobic interaction
with the stationary phase and, therefore, reduce retention times. A total runtime of 15 min was
achieved here compared to 50 min runtime in the previous method (a three fold decrease in runtime).
Also, an additional 12 compounds could be detected within the same run without decreasing sensitivity
(36). Special attention for chromatographic separation was only needed to resolve ADP from dGDP and
ATP from dGTP, as each pair of compounds have the same precursor and product ion (Table 2).
Representative chromatograms of the selected 35 purines and pyrimidines for this study are shown in
Figure 2.

17
Figure 2. Combined extracted ion chromatograms of standards of the selected 35 nucleobases,
nucleosides and nucleotides. The corresponding metabolite for each peak is indicated and metabolites
were prepared in water at the concentration corresponding to the ULOQ as indicated on table 3.
Reproducibility in retention times among different days was also evaluated and we found that
nucleobases and nucleosides presented less than ± 0.2 minutes of variability in retention time compared
to their phosphorylated counterparts, which varied from ± 0.5 to ± 0.9 minutes when only 1.25 mM
DBAA was present in eluent B. The addition of 10 mM ammonium formate in eluent B increased
reproducibility in the retention time for mono , di , and tri phosphate purines and pyrimidines.
In addition, our current method offers flexibility since other metabolites with similar chemical
properties can also be detected, including methylthioinosine (MTI), methylthioadenosine (MTA),
NADPH/NADP+, NADH/NAD+, as well as methylerythritol phosphate (MEP) intermediates (data not
shown). Despite time windows being set for data collection, we found that acceptable dwell times and
data points collected for each MRM can be maintained for the simultaneous detection of up to 43
compounds, depending on their retention times, without decreasing sensitivity.

18
aMRM: multiple reaction monitoring of precursor ion > product ion
Method validation
The LOD, LLOQ, ULOQ, and linearity for all compounds were evaluated using the optimized IP
RP LC MS/MS method. The correlation coefficient (r) for all calibration curves was > 0.98 indicating good
Table 2Analytical conditions and retention times optimized for purine and pyrimidine nucleobases,nucleosides, and nucleotidesCompound Ion mode MRMa (m/z) Cone
voltage (V)Collisionenergy (eV)
Retentiontime (min)
Adenine Positive 135.96 > 118.91 28 18 3.72Adenosine Positive 268.10 > 135.97 24 18 6.76AMP Negative 346.07 > 78.73 30 20 7.04ADP Negative 426.04 > 133.90 34 20 8.70ATP Negative 506.00 > 158.79 34 34 10.69Adenosylsuccinic acid (ASA) Negative 462.29 > 96.75 32 26 10.29cAMP Negative 328.21 > 133.90 36 24 10.72dADP Negative 410.20 > 78.79 30 30 9.74dATP Negative 490.18 > 158.74 32 24 11.20Guanine Positive 152.06 > 79.41 42 26 2.26Guanosine Positive 284.10 > 151.97 30 14 4.80GMP Negative 362.22 > 78.73 32 20 5.61GDP Negative 442.20 > 149.90 34 24 7.67GTP Negative 522.18 > 158.79 30 32 9.75dGDP Negative 426.20 > 158.74 32 20 8.52dGTP Negative 506.18 > 158.73 38 24 10.45cGMP Negative 344.20 > 149.89 38 24 8.16Inosine Positive 269.23 > 136.95 10 12 4.55IMP Negative 347.21 > 78.73 28 24 5.80Hypoxanthine Positive 137.11 > 109.93 44 20 2.27XMP Negative 363.20 > 210.84 32 20 6.94Thymidine Positive 243.23 > 127.00 10 8 6.01TMP Negative 321.21 > 78.73 28 16 7.04TDP Negative 401.19 > 78.80 36 44 8.66TTP Negative 481.17 > 158.73 28 30 10.69Uridine Positive 245.20 > 112.96 12 14 2.85UMP Negative 323.18 > 96.75 28 18 4.10UDP Negative 403.16 > 158.74 32 26 7.41UTP Negative 483.14 > 158.74 32 22 9.52Cytidine Positive 244.22 > 111.92 28 10 2.14CMP Negative 322.20 > 78.78 30 22 2.86CDP Negative 402.18 > 158.74 30 28 7.07CTP Negative 482.156 > 158.74 34 36 8.91dCDP Negative 385.99 > 158.73 32 18 7.32dCTP Negative 466.16 > 158.74 36 20 9.21[13C9,
15N3]CTP IS Negative 493.97 > 158.74 30 32 8.91

19
correlation between the concentration and metabolite:internal standard ratio of MS signals within the
tested ranges (Table 3). In general, the overall LOD and LLOQ increased with the number of phosphates:
nucleobases and nucleosides (0.025 – 0.063 M), monophosphates (0.098 – 1.563 M), diphosphates
(0.781 – 3.125 M), triphosphates (0.391 – 12.50 M). The greatest variation was observed among
triphosphate intermediates with UTP being the highest LLOQ determined (12.5 M) (Table 3), similar to
previous reports (32, 34, 36).
Intra day coefficients of variation (% CV) ranged between 0.3 and 18.6 % with most molecules
being between 0.3 and 7.1 %. Inter day variation presented higher CV values, especially for nucleobases
and nucleosides, similar to results obtained by Yamaoka and colleagues (36). Nevertheless, the % CV
values were within reasonable ranges, thus, the method is reproducible and was applied to two
different cell types for metabolite quantification.
Because we observed increased LLOQ, mostly for triphosphate compounds, ion suppression or
enhancement for triphosphate molecules in the cell matrix was monitored using stable isotopically
labelled CTP as the internal standard. [13C9, 15N3]CTP was spiked into the cell matrix before metabolite
extraction and the area of the CTP IS was integrated in both P. falciparum and RBC samples and
compared with the CTP IS area from the same amount spiked in the calibration curves in water. The
overall peak areas of the CTP IS were similar, showing no ion suppression or enhancement due to the
cellular matrix.

20
LOD: Limit of detection; LLOQ: lower limit of quantification; ULOQ: upper limit of quantification
Table 3Parameters evaluated for method validationCompound LOD
(μM)LLOQ(μM)
ULOQ(μM)
Calibrationcurver: correlationcoefficient
Intra dayreproducibility%CV of upperlimit
Inter dayreproducibility%CV of upper limit
Adenine 0.031 0.031 100 0.999 18.6 37.4Adenosine 0.025 0.063 50 0.996 4.2 0.3AMP 0.391 0.781 200 0.989 0.6 8.4ADP 1.563 3.125 200 0.999 2.4 2.5ATP 3.125 3.125 200 0.999 0.3 3.2Adenosylsuccinic acid (ASA) 0.781 1.560 200 0.999 2.8 1.5cAMP 0.098 0.391 200 0.998 0.8 24.7dADP 3.125 3.125 200 0.997 0.4 13.5dATP 3.125 3.125 200 0.995 1.4 3.7Guanine 0.025 0.063 50 0.996 7.1 14.1Guanosine 0.025 0.063 50 0.987 0.8 26.2GMP 0.391 0.781 200 0.995 2.0 3.6GDP 3.125 3.125 200 0.998 1.3 3.1GTP 3.125 3.125 200 0.997 3.9 2.4dGDP 3.125 3.125 200 0.999 1.7 10.0dGTP 3.125 3.125 200 0.999 1.5 4.1cGMP 0.098 0.391 200 0.985 1.2 0.8Inosine 0.031 0.063 50 0.999 1.5 20.8IMP 0.781 1.563 200 0.996 3.4 2.5Hypoxanthine 0.025 0.063 100 0.998 2.0 7.1XMP 0.391 0.781 200 0.998 1.2 1.0Thymidine 0.250 0.250 50 0.996 1.3 48.1TMP 0.781 1.563 50 0.987 0.7 2.1TDP 0.781 1.560 200 0.999 3.1 1.1TTP 3.125 6.250 200 0.999 3.5 4.0Uridine 0.031 0.063 100 0.998 13.6 11.8UMP 0.780 1.563 200 0.999 4.5 23.0UDP 1.563 3.125 200 0.999 4.2 0.1UTP 3.125 12.50 200 0.999 4.0 6.0Cytidine 0.025 0.063 50 0.999 3.6 19.7CMP 0.195 0.391 200 0.999 2.5 1.5CDP 1.563 3.125 200 0.997 5.2 1.1CTP 0.391 0.781 200 0.992 1.4 3.7dCDP 3.125 6.250 200 0.999 5.5 1.0dCTP 3.125 6.250 200 0.999 3.0 1.3

21
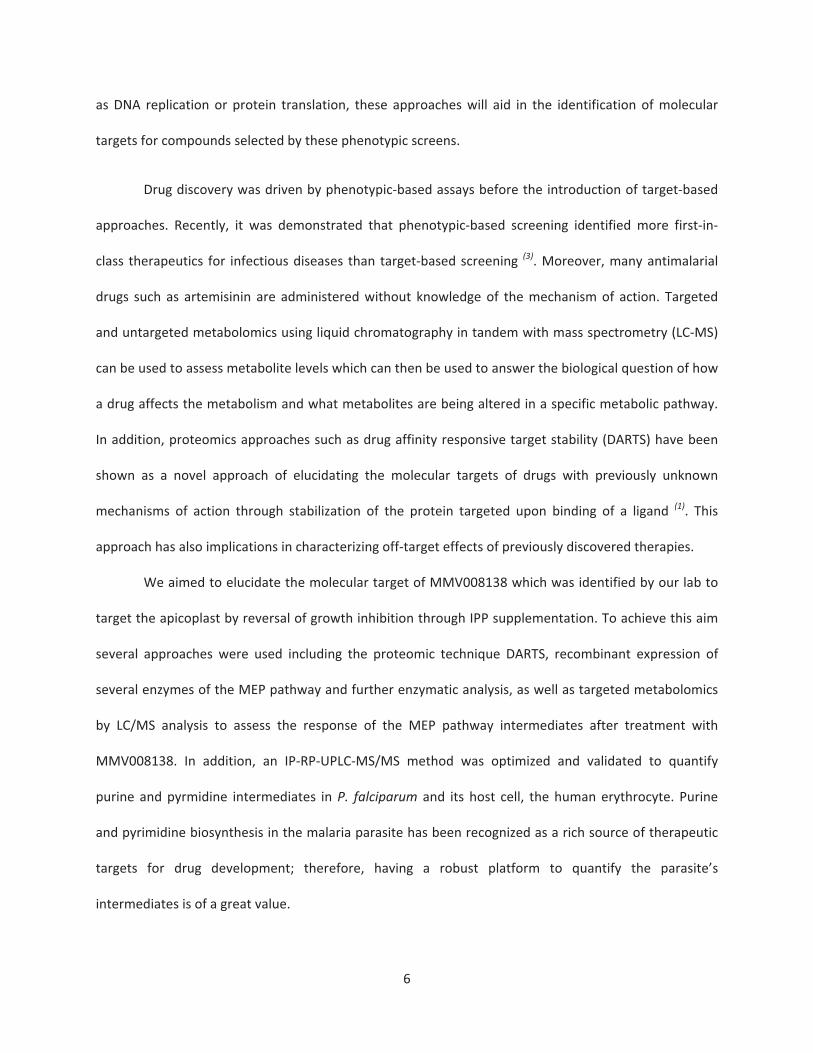
Purines and pyrimidines levels in P. falciparum and uninfected RBCs
The described method was successfully applied to the malaria parasite P. falciparum schizont
stages and uninfected human RBCs (Table 4). The metabolite levels reported here represent the
metabolic state of P. falciparum schizont stage and uninfected human RBCs under the culture conditions
described in the methods section. We used standard conditions for in vitro culture of the malaria
parasite where RPMI media was supplemented with 370 M hypoxanthine, a key precursor for all
purine synthesis in P. falciparum, and 2 g/L of glucose, which generates ATP through glycolysis (41). Both
metabolites are supplied at non physiological concentrations; therefore, the in vitrometabolic state may
differ from the in vivo state (26). Overall, more metabolites were detected and quantified in P. falciparum
schizont when compared to uninfected human RBCs (Table 4). It was previously shown that many
metabolites, including nucleosides and nucleotides, vary during the P. falciparum intraerythrocytic cycle
with peak abundance during the trophozoite and schizont stages (42). Under the experimental conditions
reported here, the most abundant metabolites in the schizont stage were AMP and ADP. High levels of
hypoxanthine were expected since P. falciparum salvages purines both from media as well as from the
RBC where ATP is in dynamic metabolic exchange with hypoxanthine via ADP, AMP, IMP, inosine, and
adenosine (40). In addition, similar levels of guanine, GMP, GDP, IMP, UMP, and UDP were detected in
the parasite. Twelve intermediates were detected below the LLOQ and four intermediates were below
the detection limit (Table 4). In contrast, human RBC presented high levels of ATP followed by ADP,
AMP, GTP and IMP, similar to previous reports (Table 4) (43). Nine intermediates were detected below
the LLOQ and fourteen intermediates were below the detection limit (Table 4).
It is worth mentioning that the metabolite extraction procedure used for infected and
uninfected blood can be performed using a 96 well plate format as described previously (26) allowing the
22
simultaneous processing and analysis of hundreds of samples when combined with the present
analytical method.
Table 4Purine and pyrimidine levels in P. falciparum schizont stage and RBCs
Mean in P. falciparum(nmol/106 cells)
SD Mean in RBCs(nmol/107 cells)
SD
Adenine 0.03 0.01 0.06 0Adenosine NQ NQ NQ NQAMP 4.27 0.06 1.96 0.21ADP 2.44 0.51 15.98 0.81ATP NQ NQ 48.58 3.93ASA 0.22 0.04 0.07 0.01cAMP NQ NQ NQ NQdADP NQ NQ NQ NQdATP NQ NQ NQ NQGuanine 0.46 0.30 ND NDGuanosine 0.09 0.05 ND NDGMP 0.75 0.08 NQ NQGDP 0.56 0.08 0.86 0.23GTP NQ NQ 2.00 0.09dGDP ND ND ND NDdGTP ND ND ND NDcGMP NQ NQ NQ NQInosine 0.11 0.04 ND NDIMP 0.70 0.35 2.72 0.18Hypoxanthine 1.48 0.25 8.16 1.61XMP NQ NQ NQ NQThymidine ND ND ND NDTMP 0.23 0.09 ND NDTDP NQ NQ ND NDTTP NQ NQ ND NDUridine 0.19 0.09 ND NDUMP 0.76 0.07 0.17 0.04UDP 0.43 0.19 NQ NQUTP NQ NQ 0.31 0.13Cytidine ND ND ND NDCMP 0.10 0.01 ND NDCDP 0.12 0.03 ND NDCTP 0.04 0.01 0.07 0.01dCDP 0.12 0.04 ND NDdCTP NQ NQ NQ NQMean values and standard deviations (SD) were obtained from two biological replicates and two technicalreplicates; NQ: detected below the LLOQ; ND: not detected (below LOD)

23
CONCLUSIONS
The present study aimed to develop and validate an optimized IP RP LC MS/MS method for
quantification of 35 purine and pyrimidine nucleobases, nucleosides, and nucleotides and be suitable for
analysis of a large set of samples. The method showed versatility and could be customized for other
metabolites with similar chemical properties including MTI, MTA, NADPH/NADP+, and NADH/NAD+,
broadening its potential applications. Purine and pyrimidine biosynthesis in the malaria parasite has
been recognized as a rich source of therapeutic targets for drug development; therefore, having a
robust platform to quantify the parasite’s intermediates is of great value. As a proof of concept, the
method was successfully applied to P. falciparum schizont stage parasites and uninfected human RBCs,
and it can be expanded to other types of cells and other parasites to monitor response to different
metabolic challenges such as purine starvation and drug treatment.

24
CHAPTER III
INTRODUCTION
Proteomic and targeted metabolomic approaches to identify the molecular target of MMV008138
Many antimalarials have been identified using cell based assays; however, their molecular
target remains unknown. Using reversal of growth inhibition by isopentenyl diphosphate (IPP)
supplementation as a phenotypic screening against asexual
intraerythrocytic stages of P. falciparum, our laboratory identified a
novel inhibitor that targets the apicoplast among compounds of the
Malaria Box. The Malaria Box is an open collection of 400
compounds available to the scientific community to use for further
malaria research to establish their mode of action and as well as to
address efficacy in other stages (44). These compounds were selected
from a prescreened library of more than 20,000 compounds (44). Our
laboratory identified that MMV008138 (Figure 1) targets the
apicoplast, but further experimentation is necessary to identify its molecular target within the apicoplast
(39). Microscopic analysis revealed that similar to fosmidomycin (FOS) which targets the second enzyme
of the MEP pathway, MMV008138 inhibited apicoplast elongation and disturbed the mitochondrial
membrane potential, and that these phenotypes were reversed by the presence of IPP. The rescue of
apicoplast elongation by IPP was not observed in doxycycline (DOX) treated parasites, which inhibits
translation in the apicoplast and consequently loss of this organelle. Therefore, we hypothesized that
MMV008138 could be targeting the MEP pathway in the apicoplast but at a different step than FOS
since FOS resistant parasites did not show change in its IC50 value of MMV008138 when compared with
Figure 1. Molecular structureof MMV008138.

25
that in its parental strain Dd2, suggesting that DXR is most likely not the molecular target (39). We aimed
to identify the molecular target of MMV008138 using targeted metabolomics and DARTS approaches.
DARTS has been shown by Lomenick and colleagues to stabilize
a drug target by inducing a conformational change upon ligand binding
that will then resist protease attack (Figure 2) (1). This occurs due to
loop regions and other susceptible protease sites being hidden upon
conformational changes due to binding of the drug (1). It has recently
been shown by Zheng and colleagues that DARTS is an effective method
to identify potential drug targets using malaria parasite lysates (45). They
showed that Torin 1 and 2 stabilize several molecular target candidates
that exhibited protection from pronase proteolysis, and the potential
candidates were subsequently identified by mass spectrometry (45). We
aimed to identify the molecular target of MMV008138 and DARTS
approach was selected to accomplish this aim because allows analyzes
of direct drug binding to its target protein without requiring
modification or immobilization of the drug. The work flow used for
DARTS approach is summarized in Figure 3 and was optimized using
both Escherichia coli and P. falciparum protein extracts (1).
Figure 2. Basic principle ofdrug affinity responsivetarget stability (DARTS).Upon digestion, all proteinsfrom the parasite controlsample are expected to beproteolyzed while in thereactions with a giveninhibitor the targeted proteinis expected to remainundigested. Adapted fromLomenick et al (1).

26
Figure 3. DARTS approach workflow.
Parasite Lysate
Incubation with drugand Digestion
1D SDS PAGE
Choose potentialcandidates
Band excision and in geltryptic digest
MALDI TOF
Database search andprotein ID
Reverse phase LC

27
MATERIALS AND METHODS
Cell extracts
E. coli BL21DE3 competent cells containing the MEP pathway were grown aseptically overnight
(37 0C) shaking in 500 mL. Cell pellet was recovered by centrifugation and re suspended in 2 mL of lysis
buffer (300 mM NaCl, 50 mM NaH2PO4, 10% glycerol) and subjected to 10 cycles of sonication (20
seconds bursts at 50 % power and 1 minute on ice). Cell lysates were centrifuged at 12,000 rpm and
supernatants containing soluble proteins were recovered and concentrated using Amicon Ultra
centrifugal filter (10 KDa) to a final concentration of 32 mg/mL. Protein concentration was determined
by Bradford protein assay using bovine serum albumin (BSA) as standard following manufacturer’s
instructions.
P. falciparum parasites were grown as described below. Parasite pellets weighing approximately
170 mg were lysed with 1 mL of BugBusterTM by shaking 20 minutes at room temperature. The lysate
was centrifuged and the supernatant containing soluble proteins was collected and concentrated to
approximately 13 mg/mL using an Amicon Ultra centrifugal filter (10 kD). Total protein concentration
was determined by Bradford protein assay.
Sample preparation for DARTS analysis
Concentration of protein (cell lysate or recombinant enzyme), pronase mixture, drug (FOS or
MMV008138), and composition of the reaction buffer were optimized for each cell lysate as well as for
recombinant proteins. Pronase stock was prepared at 14.4 mg/mL in water. A working solution was
prepared daily by diluting pronase stock with heated (37 0C) 0.1 M Tris (pH 7.5) and 0.5 % SDS to a final
concentration of 2 mg/mL. Reactions (10 L) were prepared by adding 52 to 128 μg of lysate, different

28
amounts of inhibitor (FOS or MMV008138) and reaction buffer (50 mM NaCl, 10 mM CaCl2, 50 mM Tris
HCl (pH 8.0)). All reactions were incubated 30 minutes at room temperature to allow drug target
interaction. After incubation, 1 to 7 μg of pronase working solution (5.5 % w/w) was added to the
reaction mixture and incubated at 40 0C for 30 minutes. Following incubation, mercaptoethanol was
added in equal proportions (10 L) to each reaction and incubated for 5 minutes at 95 0C. Samples were
then subjected to SDS PAGE (BioRad TGX miniprotean (5 10 % acrylamide) in Tris glycine SDS buffer.
Gels were stained with Coomassie blue R 250 0.1 %, in 50 % methanol and 10 % acetic acid.
MALDI TOF analysis for protein identification
Band preparation
Protocols for MALDI TOF analysis were provided by Dr. Keith Ray from the Virginia Tech Mass
Spectrometry Incubator (VT MSI). Briefly, bands that saw enrichment as compared to the control lane
which showed potential protection were excised from the 1D SDS PAGE gel using a methanol washed
razor blade. Each band was then chopped into approximately 1mm cubes using a pipette tip and
transferred to an ethanol cleaned 1.5 ml tube using a methanol rinsed spatula for each band. Tubes
were centrifuged briefly to collect gel pieces in the bottom and liquid removed. Gel pieces were de
stained using a 1:1 (v/v) mixture of 25 mM ammonium bicarbonate and HPLC grade acetonitrile at room
temperature overnight (approximately 16 hours using passive diffusion at 4 0C). Tubes were centrifuged
to recover the liquid from the bottom of the tubes leaving the gel pieces. The same volume of 1:1 (v/v)
mixture of 25 mM ammonium bicarbonate and HPLC grade acetonitrile was added again and incubated
for 2 hours with constant shaking at room temperature. If gel pieces still contained blue color, samples
were incubated for 15 30 min at 37 0C. Samples were centrifuged to collect the liquid from the bottom
of the tubes. An equal volume of HPLC grade acetonitrile was added to each tube and incubated for 15
minutes with constant shaking at room temperature. Tubes were centrifuged to collect liquid in the
bottom of the tubes and gels were dried using a vacuum concentrator for 10 minutes. A 10 mM

29
dithiothreitol (DTT) in 25 mM ammonium bicarbonate solution was prepared and added to cover the
dried gel pieces and incubated for 1 hour at 65 0C. Tubes were centrifuged to collect liquid in the
bottom of the tubes then the liquid was removed leaving behind the gel pieces. A solution of 50 mM
iodoacetamide in 25 mM ammonium bicarbonate was prepared and added to cover the gel pieces.
Samples were incubated at room temperature in the dark with shaking for 30 minutes. After
centrifugation, the gel pieces were washed with 1 mL of 10 mM DTT in 25 mM ammonium bicarbonate
at room temperature shaking for 15 minutes. Tubes were centrifuged to collect liquid in the bottom of
the tubes and gel pieces were then washed with 1 mL 1:1 (v/v) 25 mM ammonium bicarbonate and
HPLC grade acetonitrile at room temperature shaking for 15 minutes shaking. Tubes were centrifuged to
collect liquid in the bottom of the tubes then the liquid was removed leaving behind the gel pieces. One
mL HPLC grade acetonitrile was added to each tube and incubated for 15 minutes with shaking at room
temperature. Tubes were centrifuged to collect liquid in the bottom of the tubes then the liquid was
removed leaving behind the gel pieces. Gel pieces were then dried using a vacuum concentrator for 10
min. Trypsin was prepared in 25 mM ammonium bicarbonate at 10 μg/mL. Dried gel pieces were
covered with the diluted trypsin solution and incubated on ice for 15 minutes following by overnight
incubation at 37 0C (approximately 16 hours). After the digest tubes were centrifuged to collect the
solution containing the peptides and transferred to an ethanol cleaned 1.5 mL tube. A 100 μL of 0.1%
trifluoroacetic acid, 50% HPLC grade acetonitrile and 50% mass spectrometry grade water, was added to
the gel pieces and sonicated to remove remaining peptides from the gel pieces. Both fractions
containing the peptides were combined and vacuum concentrated to 15 μL. Then, 1 μL of digested
peptides was spotted on a 384 well MALDI plate and air dried. Alpha cyano 4 hydroxycinnamic acid
(matrix) was added to the peptide spot and air dried.

30
Liquid chromatography of peptides
Eksigent 384 well plate spotter was set to 60 0C and cleaned/purged 3 times with 10 μL
methanol. Then, 10 μL tryptic digest diluted with 15 μL of acetonitrile:water (2:98, v/v) was injected into
the spotter. The peptides were separated by C 18 chemistry and spotted onto the 384 well chip as the
elution solvent was passed through the column. The spots were allowed to air dry and matrix ( cyano
4 hydroxycinnamic acid) was then added to the peptide spots to cover them and air dried.
MALDI TOF method
Matrix assisted laser desorption/ionization was performed after trypic digest and liquid
chromatography of peptides. Samples were spotted on a stainless steel MALDI plate and air dried. Data
was acquired using the Applied Biosystems 4800 MALDI TOF/TOF. An MS scan for the m/z range of 950
Da 4000 Da was selected with an average of 1000 laser shots to each spot detected in positive ion
mode. The highest 15 peaks in signal intensity were selected based on a signal to noise ratio of (> 50),
and the 15 peaks were subjected to MS/MS analysis with an average of 3000 laser shots. MS/MS data
was collected in positive ion mode.
MASCOT analysis
Mass spectrometry data obtained from MALDI analysis were exported to the MASCOT web
database (MS/MS search) to search individual peptides against the NCBInr database to find potential
target proteins. The following generic MASCOT database parameters were used: allow one miss, fixed
modifications = carbamidomethylation of cysteines, variable modification = oxidation of methionine and
glutamine to pyroglutamine N ter(q), peptide tolerance 250 ppm, MS/MS tolerance 0.25 Da, ionization
state +1 using monoisotopic masses.

31
Recombinant expression of the MEP pathway enzymes
DNA and amino acid sequences of MEP pathway enzymes from E. coli BL21DE3 and
Mycobacterium bovis were obtained from the PATRIC databases. Sequences for P. falciparum enzymes
were obtained from PlasmoDB database. Primers were designed to amplify the coding region of the
following enzymes using the Primer3Plus web program: 2 C methyl D erythriol 4 phosphate
cytidyltransferase (CMS), 4 diphosphocytidyl 2 C methyl D erythritol kinase (CMK), and 2 C methyl D
erythritol 2,4 cyclodiphosphate synthase (MCS). A sequence extension for ligation downstream using
the infusion cloning enzyme (Clontech) was also included in the primer sequence. Primer3Plus was
employed to select optimal melting temperatures, GC content, and length parameters for PCR
amplification. Forward and reverse primer sequences for E. coli, P. falciparum and M. bovis are
described in table 1.
Table 1Primers used for cloning of the MEP pathway enzymesEnzyme fromM. bovis
FORWARD PRIMER REVERSE PRIMER
CMS CTGTACTTCCAGGCGATCGCCGTCAGGGAAGCGGGCGAAGTA
AGCTCGAATTCGTTTAAACCTACTAGCGCACTATAGCTTGGGCCA
CMK CTGTACTTCCAGGCGATCGCCTCCGCATCTGACGGCAACA
AGCTCGAATTCGTTTAAACCTACTAGACTCGAACGGTGCGACAAA
MCS CTGTACTTCCAGGCGATCGCCTGCTGGCTGGTGGGGTTGTT
AGCTCGAATTCGTTTAAACCTACTACCGCAACGAAACCACCAATG
Enzyme fromE. coli
FORWARD PRIMER REVERSE PRIMER
CMS CTGTACTTCCAGGCGATCGCCGCAACCACTCATTTGGATGTTTGC
AGCTCGAATTCGTTTAAACCTACTATGTATTCTCCTGATGGATGGTTCGG
CMK CTGTACTTCCAGGCGATCGCCCCCTCTCCGGCAAAACTTAATCTG
AGCTCGAATTCGTTTAAACCTACTACATGGCTCTGTGCAATGGGG
MCS CTGTACTTCCAGGCGATCGCCCGAATTGGACACGGTTTTGACG
AGCTCGAATTCGTTTAAACCTACTATTTTGTTGCCTTAATGAGTAGCGC
Enzyme fromP. falciparum
FORWARD PRIMER REVERSE PRIMER
CMS CTGTACTTCCAGGCGATCGCCAAATATTTGAAAAATCAAAAGGACGAT
AGCTCGAATTCGTTTAAACCTACTATTGTTTTTCATTTAAAGCATCATAGA

32
Genomic DNA was extracted from E. coli,M. bovis BCG, and P. falciparum DD2 using the Qiagen
all prep DNA/RNA mini kit. The PCR program for gene amplification used was: 95 0C for 2 minutes
followed by 35 cycles of 30 sec at 95 0C, 30 sec at 57 0C, and 1 min/kb at 72 0C. Amplification products
were subjected to a 1% agarose gel (TBE buffer) electrophoretic separation using gel red as a visualizing
intercalating agent. PCR products were excised and cleaned using the nucleospin PCR cleanup kit.
Fragments were cloned into the Pvp55A vector and Pvp56K vector, including ampicillin (55A) or
Kanamycin (56K) resistance gene for selection, six histidine tag (55A) or maltose binding protein (56K),
and multiple cloning site, using the infusion cloning system. Constructs for each plasmid were
transformed using the heat shock method into E. coli stellar cells, plated with ampicillin (100 μg/mL) or
Kanamycin (25 μg/mL), and grown overnight. Colony screening by PCR was used to select colonies for
subsequent sequencing and protein expression. Selected colonies were grown overnight and the
plasmid was extracted using GeneJet plasmid mini prep kit (Thermo Scientific) and sequenced at the
Virginia Bioinformatics Institute using a T7 primer and a primer specific for each gene. Sequenced
plasmids were checked for the absence of mutations and then transformed into E. coli BL21DE3 for
expression. Selected colonies were grown at 37 0C with shaking for 8 hours to an OD ~0.6, and induced
with 0.5 mM IPTG at 15 0C overnight. The next day the cells were pelleted at 4,000 rpm at 4 0C for 15
minutes. Cells were then resuspended and lysed using sonication. Purification was accomplished using
Ni NTA spin column (Qiagen) for His tagged proteins. Elution fractions were subjected to SDS PAGE to
determine successful expression and level of purification and stained using Coomassie blue R 250. The
recombinant proteins were concentrated using an Amicon 10 KDa cutoff filter and a buffer exchange
using the reaction buffer of each enzyme was also accomplished using this filter. Quantitation was
performed using a Nanodrop spectrophotometer including the mass and extinction coefficient
computed for each enzyme using the Expasy Prot Param tool.

33
Enzymatic reaction conditions
MEP pathway enzymes that were expressed and purified from E. coli were used for testing in
inhibition assays with MMV008138. Reactions were set in a total volume of 100 μL including substrates
and reaction buffer optimal for each enzyme being assayed. Product formation was analyzed by LC
MS/MS as described below. Briefly, reactions were set as follow:
A) 2 C methyl D erythriol 4 phosphate cytidyltransferase (CMS) was assayed by adding 0.5 mM
cytidine triphosphate (CTP), 0.05 mM 2 C methylerythritol 4 phosphate (MEP), 50 mM Tris
(pH=7.5), 1 mMMgCl2, and 1 μg/mL CMS enzyme.
B) 4 diphosphocytidyl 2 C methyl D erythritol kinase (CMK) was assayed by adding 0.05 mM 4
diphosphocytidyl 2 C methylerythritol (CDP ME), 0.5 mM adenosine triphosphate (ATP), 1 mM
reaction buffer, and 1 μg/mL CMK enzyme (Echelon inc.). This E. coli enzyme was from a
commercial source.
C) 2 C methyl D erythritol 2,4 cyclodiphosphate synthase (MCS) was assayed by adding 0.25 mM 4
diphosphocytidyl 2 C methyl D erythritol 2 phosphate (CDP MEP), 50 mM Tris (pH=7.5), 1 mM
MgCl2 and 2 μg/mL MCS enzyme.
Inhibition assays were set as controls but with addition of 0.01 mM of MMV008138 purchased
from Sigma Aldrich. Blank reactions containing the substrates without the enzymes were incubated in
parallel. All mixtures were incubated at 37 0C for 1 hour and then subjected to LC MS to detect the
product formation and potential product inhibition by MMV008138. For enzymes purified from the
Pvp56K plasmid, the maltose binding protein (MBP) was cleaved from the fusion MBP protein using the
Tobacco Etch Virus (TEV) protease by adding 100 μL of 0.7 mg/mL of TEV to every 350 μL of purified
protein, incubated for 2 hours at room temperature and pass through a Ni NTA spin column to remove
the MBP and TEV from the free soluble enzyme.

34
P. falciparum in vitro culture
P. falciparum strain Dd2, MRA 150, (deposited by D. Walliker) was obtained from MR4 Malaria
Reagent Repository (ATCC, Manassas, VA) as part of the BEI Resources Repository (NIAID, NIH). Dd2 is a
pyrimethamine , chloroquine , and mefloquine resistant strain. Parasites were maintained in O positive
human erythrocytes (4% hematocrit) in RPMI 1640 medium supplemented with 5 g/L Albumax I (Gibco
Life Technologies), 2 g/L glucose (Sigma Aldrich), 2.3 g/L sodium bicarbonate (Sigma Aldrich), 370 μM
hypoxanthine (Sigma Aldrich), 25 mM HEPES, and 20 mg/L gentamicin (Gibco Life Technologies).
Parasites were kept under reduced oxygen conditions (5.06 % CO2, 4.99 % O2, and 89.95 % N2) and kept
at 37 0C. To assess if MMV008138 is targeting the MEP pathway, twenty 75 cm2 flasks of P. falciparum
culture were grown to ~8 % parasitemia/per flask. Schizont stages were recovered using the MACS
column system (46). All purified parasites were combined after MACS column separation, resuspended in
complete media (described above) and 106 parasites per condition were set in duplicate as follows:
control, 5 μM MMV008138 alone, 20 μM FOS alone, 5 μM MMV008138 and 200 μM IPP, 20 μM FOS and
200 μM IPP, and 200 μM IPP alone. Parasites were gassed (5.06% CO2, 4.99% O2, and 89.95% N2) for 10
seconds and incubated at 37 0C for 4 hours. Cultures were then centrifuged (2,500 rpm for 5 min) and
immediately frozen at 80 0C until metabolite extraction.
Metabolite extraction of the MEP pathway intermediates from P. falciparum
Isopentenyl S thiolodiphosphate (ISPP) was used as internal standard at a final concentration of
100 M. ISPP was diluted in water and 1 mL was added to each sample and sonicated for 10 minutes in
water bath sonicator following by incubation at 60 0C for 1.5 hours. Samples were chilled on ice and
centrifuged 10 minutes at 10,000 rpm at 0C. Supernatant was transferred to a 10 kDa centricom tube
and centrifuged 10 minutes at 10,000 rpm at 4 0C. Filtered samples were dried in a speed vac with heat
and samples were stored at 80 0C until analysis.

35
Analysis of the MEP pathway intermediates by LC MS/MS
The method used for the analysis of the MEP intermediates was described in chapter II with a
slight modification in the mobile phase and gradient, necessary to achieve LC resolution for some
intermediates. Briefly, standards and samples were separated using a gradient mobile phase consisting
of 1.25 mM DBAA, 10 mM ammonium formate in water, and 1% formic acid to adjust the pH to 5.2 (A),
and 1.25mM DBAA in acetonitrile (B). The flow rate was set at 0.3 mL/min and the gradient conditions
were: 0 2 min (100% A); 2 7 min (100% A to 60% A); 7 9 min (60% A to 50% A); 9 11 min (50% A to 100%
A); 11 15 min (100% A). The autosampler was set at 10 0C. The following MS conditions were used for
the MEP intermediates analysis. Capillary voltage was set at 3.17 kV for negative ion mode. The source
and desolvation gas temperatures of the mass spectrometer were set at 150 0C and 450 0C, respectively.
The desolvation gas (nitrogen) was set at 700 L/h. The ion transitions, cone voltage, and collision energy
used for ESI MS/MS analysis were determined using MassLynx V4.1 intellistart software and are
presented in Table 2.
Samples were resuspended in 110 μL of water, centrifuged 10 minutes at 10,000 rpm at 4 0C,
filtered, transferred to microplate and 40 μL of each sample was injected for LC MS analysis. Two
technical replicates were analyzed for each sample. Data acquisition and analysis were performed using
MassLynx V4.1 and TargetLynx software (Waters). The area of each metabolite was expressed as the
mean and standard deviation of two biological replicates and two technical replicates.

36
aMRM: multiple reaction monitoring of precursor ion > product ion
Determination of the minimum inhibitory concentration (MIC) of MMV008138 against several
microorganisms
These experiments were performed in collaboration with Dr. Joseph Falkinham. MMV008138
was tested against the following microorganism for potential antimicrobial activity: Pseudomonas
aeruginosa, Candida albicans, Cryptococcus neoformans, Escherichia coli, Staphylococcus aureus,
Aspergillus niger and Mycobacterium bovis BCG. Briefly, serial dilutions of MMV008138 (1:2) were
performed in 50 l of sterile 1/10th strength Brain Heart Infusion Broth containing 0.2 % (wt/vol) sucrose
(BHIB+S) and 50 l of the suspension of each organism tested were added to each drug dilution for a
total of 100 l in each well. The plate was sealed and incubated at 30 0C. Daily, wells were checked for
turbidity and the first well displaying no growth after 7 days is considered the minimum inhibitory (MIC)
growth concentration. DMSO (vehicle) toxicity was also assayed.
Table 2Analytical conditions and retention times optimized for MEP pathway intermediatesCompound Ion mode MRMa (m/z) Cone
voltage (V)Collisionenergy (eV)
Pyruvate Negative 86.86 > 42.90 20 8.0Glyceraldehyde 3 phosphate Negative 168.90 > 96.83 16 8.0DOXP Negative 212.93 > 78.75 20 24MEP Negative 214.94 > 96.77 96 20IPP Negative 244.97 > 78.75 24 16HMBPP Negative 260.90 > 78.75 92 28ISPP Negative 260.95 > 158.76 22 14cMEPP Negative 276.96 > 78.74 38 24CDP ME Negative 520.05 > 321.99 38 22CDP MEP Negative 600.14 > 78.81 34 62

37
RESULTS AND DISCUSSION
Elucidating the molecular target of MMV008138 by targeted metabolomics
Using targeted metabolomics was the best approach to address our hypothesis that
MMV008138 may have its molecular target within the MEP pathway (Figure 4). The effect of
MMV008138 on the biosynthesis of the MEP pathway intermediates in the intraerythrocytic schizont
stage of P. falciparum was evaluated by IP RP UPLC MS/MS analysis as described in the method section.
The same number of treated and untreated parasites in the presence or absence of IPP supplementation
was analyzed. The experiment was repeated twice with comparable results and the results of a typical
experiment are shown in figure 5. FOS is a known inhibitor of the second enzyme in the MEP pathway
DXR (Figure 4) and was used as a control (47 49). Our analysis revealed that the levels of CDP ME were
reduced below the detection limit in both MMV008138 treated parasites and MMV008138 treated
parasites supplemented with IPP. Additionally both MMV008138 and FOS treated parasites presented
decreased levels of detected cMEPP intermediate regardless of IPP supplementation (Figure 5). No
reduction in the levels of MEP intermediate, the product of the enzyme targeted by FOS, was observed
after 4 hours of treatment similar to previous reports (22, 50). Taken together with previous finding
reported by our lab (39) and the results reported here, we hypothesized that the molecular target of
MMV008138 could then be narrowed to three potential targets: CMS, CMK and MCS enzymes (Figure 3
and 4). Therefore, further experimentation using proteomics (DARTS) and inhibition tests with
recombinant enzymes were pursued.

38
Figure 4. The MEP pathway in the malaria parasite. A P. falciparum infected erythrocyte is represented.The MEP pathway for isoprenoid precursor biosynthesis is located in the apicoplast of the malariaparasite. The only known inhibitor targeting this pathway is FOS and specifically targets DXR. Ourpreliminary results indicate that MMV008138 may target CMS within the MEP pathway.

39
Figure 5. LC MS/MS analysis of the MEP Intermediates in P. falciparum after treatment withMMV008138. The total ion counts (TIC) of each metabolite detected by LC MS is represented. Parasitestreated with MMV008183 showed complete reduction of the intermediate CDP ME after four hours oftreatment suggesting that MMV008138 may target CMS enzyme.
Elucidating the molecular target of MMV008138 by DARTS approach
It is well known that both P. falciparum and E. coli use the MEP pathway for isoprenoid
precursor biosynthesis (48, 51). In our metabolic studies shown above (Figure 5), we hypothesized that the
molecular target of MMV008138 could be within the MEP pathway and may be identified using DARTS.
DARTS was shown by Lomenick and colleagues to stabilize a potential drug target by inducing
conformational changes when ligand binds to the active site of the target (1). This change in
conformation will then hide susceptible loop regions protecting them from proteolysis which can be
visualized by SDS page gels and then, proteins can be identified by mass spectrometry (1). Therefore, the
first step was optimized the conditions for DARTS using E. coli since it was easier to obtain sufficient
protein for the proposed analysis. Simultaneously, a different method was attempted to prepare protein
0
50000
100000
150000
200000
250000
300000
350000
400000
G3P Pyruvate DOXP MEP CDP ME cMEPP HMBPP
TIC
Control +IPP FOS FOS+IPP MMV008138 MMV008138+IPP
0
500
1000
1500
2000
MEP CDP ME
TIC
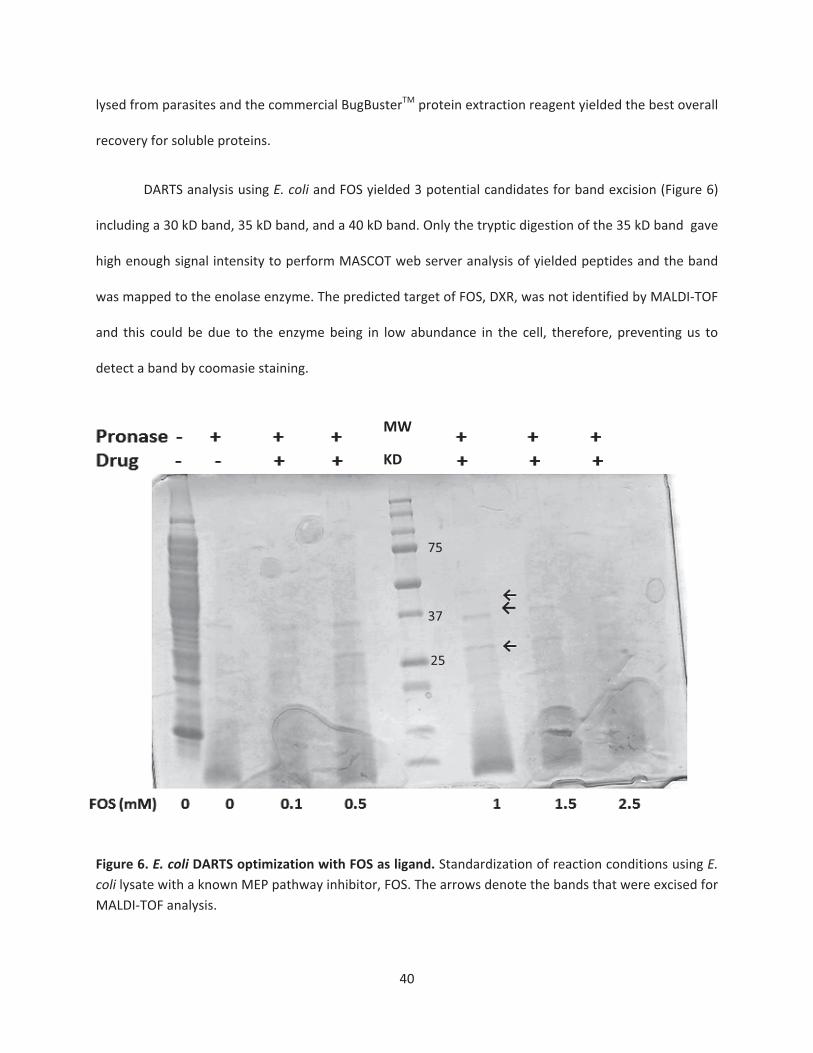
40
lysed from parasites and the commercial BugBusterTM protein extraction reagent yielded the best overall
recovery for soluble proteins.
DARTS analysis using E. coli and FOS yielded 3 potential candidates for band excision (Figure 6)
including a 30 kD band, 35 kD band, and a 40 kD band. Only the tryptic digestion of the 35 kD band gave
high enough signal intensity to perform MASCOT web server analysis of yielded peptides and the band
was mapped to the enolase enzyme. The predicted target of FOS, DXR, was not identified by MALDI TOF
and this could be due to the enzyme being in low abundance in the cell, therefore, preventing us to
detect a band by coomasie staining.
Figure 6. E. coli DARTS optimization with FOS as ligand. Standardization of reaction conditions using E.coli lysate with a known MEP pathway inhibitor, FOS. The arrows denote the bands that were excised forMALDI TOF analysis.
75
25
37
MW
KD

41
DARTS performed with E. coli and MMV008138 yielded two potential candidates for
proteomics analysis (Figure 7), a 30 kD band and a 35 kD band. Both bands gave sufficient signal
intensity from MALDI analysis to predict the precursor protein using the MASCOT web server. The 30 kD
band yielded peptide data that mapped to enolase and the 35 kD mapped to ketoacyl carrier protein
synthase, a protein involved in fatty acid biosynthesis. Interestingly, this protein is also present in the
malaria parasite and it is located to the apicoplast. It is possible that inhibition of this enzyme may cause
loss of apicoplast seen in our phenotypic assays but further research is necessary to confirm this
hypothesis (52). Additional enzymatic assays and drug binding assays would need to be performed to
answer this question.
Figure 7. E. coli DARTS optimization with MMV008138 as ligand. The arrows denote the bands thatwere excised for MALDI TOF analysis.
Pronase + + + + + + Drug + + + + + +
MMV008138 (mM) 0 0 1 0.1 0.5 1 1.5 2.5
75
37
25
MW
KD

42
DARTS performed with P. falciparum lysate and MMV008138 yielded 3 potential candidates for
band excision (Figure 8), a 30 kD band, 35 kD band and a 50 kD band. Only the 35 kD band gave high
enough signal intensity from MADLI TOF analysis to perform MASCOT analysis (Figure 9). The detected
peptides were aligned with the annotated enolase sequence obtain from PlasmoDB database as well as
a peptide also was mapped to the Translocon of the Inner Chloroplast 22 ,TIC22. All peptides obtained
from the trypitic digestion of enolase were derived from the C terminal TIM domain of enolase as shown
in figure 9. This could be due to that only the C terminal domain was stabilized and protected by the
ligand. The TIC 22 peptides were found on two separate analyses in low abundance. A summary of all
potential molecular targets of MMV008138 identified by DARTS is in table 3.
Figure 8. P. falciparum DARTS optimization using MMV008138. DARTS was performed with P.falciparum lysate using MMV008138 at increasing concentrations. The arrows denote what bands wereexcised for MALDI TOF analysis.

43
Figure 9. MASCOT peptide analysis of the excised band from P. falciparum DARTS analysis. Analysis ofthe 35 kD excised band yielded peptides mapping to enolase as the most probable protein identified(left). The negative control lane containing no drug was excised for peptide comparison.
Table 3Potential molecular targets of MMV008138 identified by DARTSOrganism andtreatment
Bands obtainedfrom DARTS
ID of peptides by MALDI TOF Expected size of the identified proteins
E. coli +MMV008138
30 kD, 35 kD 30 kD=Chain A, Beta KetoacylCarrier Protein Synthase
35 kD=Enolase
Beta Ketoacyl Carrier Protein Synthase= 84 kD dimer 42 kD monomer (53)
Enolase = 45.6 kD (54)
C terminal domain = 33 kDE. coli +Fosmidomycin
30 kD, 35 kD,40kD
30 kD and 35 kD=Enolase
40 kD= Not identified
Enolase = 45.6 kD (54)
C terminal domain = 33 kD
P. falciparum+ MMV008138
30 kD, 35 kD, 50kD
30 kD= Not identified
35 kD=Enolase, TIC22
50 kD= Not identified
Enolase = 48.6 kD
C terminal domain = 33 kD
TIC22 = 33.5kD (55)

44
MAHVITRINAREILDSRGNPTVEVDLETNLGIFRAAVPSGASTGIYEALELRDNDKSRYL GKGVQKAIKNINEIIAPKLIGMNCTEQKKIDNLMVEELDGSKNEWGWSKSKLGANAILAI SMAVCRAGAAPNKVSLYKYLAQLAGKKSDQMVLPVPCLNVINGGSHAGNKLSFQEFMIVP VGAPSFKEALRYGAEVYHTLKSEIKKKYGIDATNVGDEGGFAPNILNANEALDLLVTAIK SAGYEGKVKIAMDVAASEFYNSENKTYDLDFKTPNNDKSLVKTGAQLVDLYIDLVKKYPI VSIEDPFDQDDWENYAKLTAAIGKDVQIVGDDLLVTNPTRITKALEKNACNALLLKVNQI GSITEAIEACLLSQKNNWGVMVSHRSGETEDVFIADLVVALRTGQIKTGAPCRSERNAKY NQLLRIEESLGNNAVFAGEKFRLQLN
Figure 10. Peptide mapping of enolase from P. falciparum. Sequences of peptide fragments identifiedby MALDI TOF were mapped in the amino acid sequence of enolase from P. falciparum. The peptidesdetected are highlighted. Bolded and underlined amino acids indicates beginning of the C terminal TIMdomain.
MEP pathway enzymes as potential molecular targets of MMV008138
Because the MEP pathway is present in many other microorganisms, we decided to test
MMV008138 against microorganisms that contain the MEP pathway using growth inhibition assays. As
control, organisms that use the mevalonate pathway instead of the MEP pathway were included. The
results obtained are summarized in table 4. Interestingly, only Mycobacterium bovis BCG was sensitive
to MMV008138 and showed a MIC of 0.032 mM.
Table 4Minimum inhibitory concentration (MIC) of growth for MMV008138 in severalpathogens. Absence of the MEP pathway is indicated (*)
Microorganism MIC in mMPseudomonas aeruginosa > 0.25 mM
Candida albicans* > 0.25 mMCryptococcus neoformans* > 0.25 mM
Escherichia coli > 0.25 mMStaphylococcus aureus* > 0.25 mM
Aspergillus niger * > 0.25 mMMycobacterium bovis BCG 0.032 mM
Since experiments using DARTS approach yielded results that were inconclusive in order to
identify the molecular target of MMV008138, we decided to directly assay the recombinant enzymes of

45
the MEP pathway that showed metabolic inhibition using targeted metabolomics analysis (Figure 5).
Previous attempts in our laboratory to express MEP pathway enzymes from P. falciparum were
insoluble, we therefore decided to perform our analysis using the MEP pathway enzymes from E. coli.
Based on the previous LC MS/MS analysis and MIC analysis, we decided to also clone CMS fromM. bovis
to perform inhibition assays. Gene and protein sequences were obtained from PATRIC database.
PCR amplification of the three genes from E. coli and CMS from M. bovis can be seen in figure
11. PCR fragments were cleaned and ligated into the Pvp55A or 56K vector systems and plasmids were
transformed into E. coli. Plasmids were sequenced to confirm proper coding sequence for a full length
functional protein for each gene fragment.
Figure 11. PCR amplification products of the MEP pathway enzymes. PCR amplification for the genes ofCMS (705 bp), CMK (831 bp), and MCS (474 bp) from E. coli shown on panel (A), M. bovis CMS (686 bp)(B), and P. falciparum CMS (1863 bp) (C). CMS from P. falciparum was not possible to clone forexpression in E. coli.
MW CMS ( ) CMK ( ) MCS ( )
( ) MW CMS ( ) CMS MW
A
B C
500 bp
1500 bp
500 bp
200 bp

46
MEP pathway enzymes expression from E. coli
A) 2 C methyl D erythriol 4 phosphate cytidyltransferase (CMS)
Previous recombinant enzyme expression for CMS has been shown by several groups to produce
soluble protein from E. coli as well as F. tularensis and S. coelicolor (50, 56 58). The CMS Pvp55A plasmid
construct was transformed into E. coli BL21DE3 cells and grown to an optical density of ~0.6 at 600 nm,
after which induction with isopropyl D 1 thiogalactopyranoside (IPTG) was performed to initiate
protein expression. CMS was expressed at 15 0C to allow proper folding. Purification of E. coli CMS was
performed using a NTA Ni spin column and results are shown in figure 12.
Figure 12. CMS purification from E. coli. Recombinant CMS from E. coli (28kD) was purified as describedin the method section. S, soluble fraction; I, insoluble fraction; FT, flow through; W, wash; E, elution.
25 kD
MW S I FT W E1 E2
CMS
20 kD
CMS
47
Enzymatic assays were performed as described in the method section to assess if CMS activity
was inhibited by MMV008138. Substrate consumption and product formation was monitored by LC
MS/MS (Figure 13). A negative control (blank) in which only one substrate was added (MEP) was
performed to ensure no product catalysis (figure 13). Another control was performed with the addition
of all substrates but without CMS enzyme to assess if substrates were degrading under the assay
conditions. The areas for the detected peaks were quantified and no reduction in product formation was
observed in the presence of MMV0008138 indicating that CMS from E. coli is not the molecular target
for this inhibitor (Figure13).
Figure 13. E. coli CMS enzymatic activity and MMV008138 inhibition assay. A representative LC MS/MSchromatogram (extracted total ion counts) for each reaction condition is shown. Enzymatic activity ofCMS from E. coli was assessed in the absence (+ control) and presence (+ MMV008138) of the inhibitor.A blank was performed ( control) to asses potential substrate degradation under the experimentalconditions. MMV008138 does not inhibit CDP ME synthesis.

48
Figure 14. Areas from E. coli CMS enzymatic activity and MMV008138 inhibition assay. The total areafor peaks detected in figure 12 was quantified.
Enzymatic assays showed that there was no inhibition in E. coli CMS by MMV008138 (Figure 14).
This could be due to differences between E. coli and P. falciparum active site. The E. coli CMS is a 240
amino acid protein compared to P. falciparum CMS which is 734 amino acids long. Difference in catalytic
residues, substrate binding pocket, and other factors may contribute to the lack of MMV008138 activity.
Because it was not possible to express CMS from P. falciparum, analysis of the catalytic site was not
possible.
B) 2 C methyl D erythritol 2,4 cyclodiphosphate synthase (MCS)
Previous recombinant enzyme expression of MCS has been shown by several groups to produce
soluble and insoluble protein from P. falciparum, as well as E. coli,M. tuberculosis, and A. thaliana (59 63).
We again decided to use E. coli for initial expression and purification of MCS due to the previous
successful expression of this enzyme as soluble protein. The MCS Pvp55A plasmid construct was
0
500
1000
1500
2000
2500
3000
3500
MEP CDP ME
Area
E. coli CMS Metabolite Peak Area
E. coli CMS control
E. coli CMS Blank
E. coli CMS MMV008138
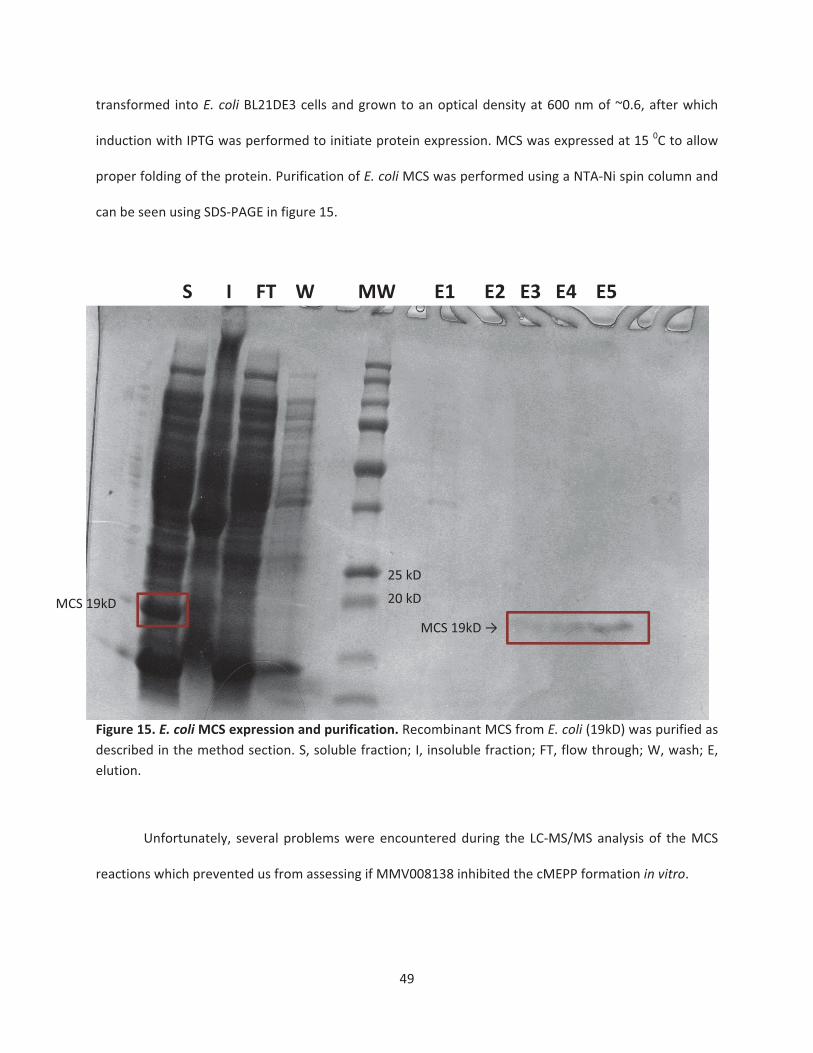
49
transformed into E. coli BL21DE3 cells and grown to an optical density at 600 nm of ~0.6, after which
induction with IPTG was performed to initiate protein expression. MCS was expressed at 15 0C to allow
proper folding of the protein. Purification of E. coli MCS was performed using a NTA Ni spin column and
can be seen using SDS PAGE in figure 15.
Figure 15. E. coliMCS expression and purification. Recombinant MCS from E. coli (19kD) was purified asdescribed in the method section. S, soluble fraction; I, insoluble fraction; FT, flow through; W, wash; E,elution.
Unfortunately, several problems were encountered during the LC MS/MS analysis of the MCS
reactions which prevented us from assessing if MMV008138 inhibited the cMEPP formation in vitro.
S I FT W MW E1 E2 E3 E4 E5
25 kD
20 kDMCS 19kD
MCS 19kD

50
C) 4 diphosphocytidyl 2 C methyl D erythritol kinase (CMK)
Previous recombinant enzyme expression for CMK has been shown by several groups to
produce soluble and protein from E. coli, M. tuberculosis, and Y. pestis (64 66). Though we designed
primers and observed a CMK PCR product, we decided to use E. coli CMK from a commercial source as
the first attempt. Enzymatic assays were performed as described in the method section to assess if CMK
activity was inhibited by MMV008138. Substrate consumption and product formation was monitored by
LC MS/MS (Figure 16). A negative control was performed with the addition of substrate but without
CMK enzyme to assess if the substrate was degrading under the assay conditions. CDP MEP formation
was not inhibited by MMV008138.
Figure 16. E. coli CMK enzyme activity assay and in inhibition assay. A representative LC MS/MSchromatogram (extracted total ion counts) for each condition is shown. Enzymatic activity of CMK fromE. coli was assessed in the absence (+ control) and presence (+ MMV008138) of the inhibitor. A blankwas performed ( control) to asses potential substrate degradation under the experimental conditions.MMV008138 does not inhibit CDP MEP synthesis.

51
Figure 17. Areas from E. coli CMK enzymatic activity and MMV008138 inhibition assay. The total areafor peaks detected in figure 15 was quantified.
CMS enzyme expression fromM. bovis
Expression of CMS from M. bovis was not previously reported. Initially, M. bovis CMS was
expressed using the CMS Pvp 55A construct. After expression and purification by Ni NTA spin column
the recombinant protein was in the insoluble fraction as seen in figure 18. This could be due to the E.
coli machinery not being able to properly fold the enzyme or due to the E. coli also having CMS which
may be toxic to the bacteria if the CMS activity increases. In general, we had observed that
overexpression of any enzyme from the MEP pathway causes less growth of E. coli when protein
expression is induced. Therefore, CMS was subsequently expressed using the Pvp56K plasmid construct
with a maltose binding protein (MBP) fused to the CMS enzyme to increase solubility. After purification
using Ni NTA spin column, soluble protein was abundant and could be used for enzymatic assays (figure
19).
0
20000
40000
60000
80000
100000
120000
140000
160000
180000
CDP ME CDP MEP
Area
E. coli CMK Metabolite Peak Area
E. coli CMK control
E. coli CMK Blank
E. coli CMK MMV008138

52
Figure 18. M. bovis CMS expression and purification. Recombinant CMS from M. bovis (25 kD) waspurified as described in the method section. S, soluble fraction; I, insoluble fraction; FT, flow through; W,wash; E, elution.
Figure 19. M. bovis MBP CMS expression and purification. Recombinant MBP CMS from M. bovis (70kD) was purified as described in the method section. S, soluble fraction; I, insoluble fraction; FT, flowthrough; W, wash; E, elution.

53
A fraction from purified M. bovis CMS was cleaved from the MBP tag using the tobacco etch
virus protease (TEV) and passed through a Ni spin column as described in the method section (Figure
19).
Figure 20.M. bovisMBP CMS cleavage using TEV. The MBP CMS (70 kD) was cleaved using the TobaccoEtch Virus protease (TEV, 27 kD) leaving CMS soluble without the MBP tag. Re purification of CMS toremoved MBP and TEV was performed with a Ni NTA spin column and proteins were visualized by SDSPAGE stained with coomassie blue. RM, reaction mixture; FT, flow through; E, elution.
Enzymatic assays were performed as described in the method section to assess if CMS activity
was inhibited by MMV008138. Even though we could not obtain a pure CMS protein without the MBP
tag, both protein preparations were tested for enzyme activity and potential MMV008138 inhibition.
Substrate consumption and product formation was monitored by LC MS/MS (Figure 21 and 23). A
negative control (blank) was performed in which all substrates were present but without CMS enzyme,
to assess if substrates were degrading under the assay conditions (figure 21 and 23). The areas for the
detected peaks were quantified and no reduction in product formation was observed in the presence of

54
MMV0008138 indicating that CMS from M. bovis is not the molecular target for this inhibitor (Figure 22
and 24). In addition, CMS was active in the presence or absence of the MBP tag.
Figure 21. M. bovis MBP CMS enzymatic activity and inhibition assay. A representative LC MS/MSchromatogram (extracted total ion counts) for reaction each condition is shown. Enzymatic activity ofMCS from M. bovis was assessed in the absence (+ control) and presence (+ MMV008138) of theinhibitor. A blank was performed ( control) to asses potential substrate degradation under theexperimental conditions. MMV008138 does not inhibit CDP ME synthesis.
Figure 22. Areas from M. bovis MBP CMS enzymatic activity and MMV008138 inhibition assay. Thetotal area for peaks detected in figure 20 was quantified.
0
1000
2000
3000
4000
5000
6000
MEP CDP ME
Area
M. bovisMBP CMS Metabolite Peak Area
M. bovis MBP CMScontrol
M. bovis MBP CMSBlank
M. bovis MBP CMSMMV008138

55
Figure 23. M. bovis CMS enzymatic activity and inhibition assay. A representative LC MS/MSchromatogram (extracted total ion counts) for reaction each condition is shown. Enzymatic activity ofMCS from M. bovis was assessed in the absence (+ control) and presence (+ MMV008138) of theinhibitor. A blank was performed ( control) to asses potential substrate degradation under theexperimental conditions. MMV008138 does not inhibit CDP ME synthesis.
Figure 24. Areas fromM. bovis CMS enzymatic activity and MMV008138 inhibition assay. The totalarea for peaks detected in figure 22 was quantified.
0
1000
2000
3000
4000
5000
6000
MEP CDP ME
Area
M. bovis CMS Peak Area
M. bovis CMScontrol
M. bovis CMS Blank
M. bovis CMSMMV008138

56
CONCLUSIONS
Many antimalarials have been identified using cell based assays; however, their molecular
target remains unknown. Using reversal of growth inhibition by IPP supplementation as phenotypic
screening against asexual intraerythrocytic stages of P. falciparum, our laboratory identified a novel
inhibitor MMV008138 that targets the apicoplast, but its molecular target was not identified. Previous
results revealed that similar to FOS, MMV008138 inhibited apicoplast elongation and disturbed the
mitochondrial membrane potential, and these phenotypes were reversed by the presence of IPP. The
rescue of apicoplast elongation by IPP supplementation was not observed with the antibiotic DOX,
which inhibits translation in the apicoplast and consequently loss of this organelle. Therefore, we
hypothesized that MMV008138 could be targeting the MEP pathway in the apicoplast but at a different
step than FOS since FOS resistant parasites did not show change in its IC50 value of MMV008138 when
compared with that in its parental strain Dd2, suggesting that DXR is most likely not the molecular target
(39). We aimed to identify the molecular target of MMV008138 using targeted metabolomics and DARTS
approach.
Our results supported that targeted metabolomics was the best approach to address our
hypothesis. The effect of MMV008138 on the biosynthesis of the MEP pathway intermediates in the
intraerythrocytic schizont stage of P. falciparum was evaluated by IP RP UPLC MS/MS and our analysis
revealed that the levels of CDP ME were reduced below the detection limit in both MMV008138 treated
parasites and MMV008138 treated parasites supplemented with IPP. Additionally, MMV008138
treatment decreased the levels of cMEPP, a downstream product of CDP ME.
Further experimentation using proteomics (DARTS) and inhibition tests with recombinant
enzymes were pursued. However, none of the experiments performed were conclusive for the
identification of the molecular target of MMV008138. The potential target identified through DARTS

57
approach could represent off target interactions of MMV008138 with E. coli and P. falciparum proteins,
possibly due to the high concentration of inhibitor required to observe protection from proteolysis. In
addition, inhibition assays with recombinant enzymes from E. coli and M. bovis revealed that
MMV008138 is not an inhibitor of E. coli CMS, CMK, and MCS enzymes and M. bovis CMS. Taking
together that MMV008138 did not inhibit the activity of recombinant CMS, CMK, and MCS enzymes, and
did not inhibit E. coli growth, we concluded that MMV008138 cannot be transported in E. coli and/or the
molecular target is different from that in P. falciparum. Similarly, the high MIC value forM. bovis and the
lack of inhibition of the CMS recombinant enzyme may indicate that the molecular target for
MMV008138 is also different from that in P. falciparum. Despite the molecular target could not be
identified, our results are encouraging since this supports selectivity of MMV008138 for the malaria
parasite. Non pathogenic E. coli is part of the natural human gut flora and the prolonged use of most
antibiotics causes its reduction or loss, and causes symptoms such as diarrhea and vomiting. Therefore,
the lack of activity of MMV008138 against E. coli is highly desirable as antimalarial drug candidate.

58
FUTURE DIRECTIONS
The second part of my thesis was to explore the potential target of MMV008138 in P.
falciparum using metabolomic and proteomic approaches. Our preliminary results from proteomics
analysis did not show results consistent with our previous findings. Potentially, molecular docking
experiments with P. falciparum CMS and other enzymes of the MEP pathway and MMV008138 could
indicate which enzyme is the molecular target of this compound. Additionally, knockout/knockdown
experiments in P. falciparum could aid to observe the biological implications of these proteins and their
lack of function.
Another potential experiment would be to synthesize conjugates of MMV008138 to a resin to
perform pull down assays with P. falciparum lysate and perform MALDI TOF experiments which allows
washing steps before recovering the bound proteins, therefore, reducing potential false positives.
Additionally, expression of P. falciparum CMS enzyme could be done using yeast cells or insect cells that
may have the machinery to properly fold and post transnationally modify the CMS enzyme.
Taking an untargeted metabolomics approach comparing MMV008138 treated and untreated
parasites may give insight on the potential molecular target of MMV008138 by observing the difference
between the metabolite pools in the treated and untreated samples. However, the disadvantages in
taking an untargeted approach include large data outputs and detection of unidentified metabolites.

59
REFERENCES
1. Lomenick, B., Hao, R., Jonai, N., Chin, R. M., Aghajan, M., Warburton, S., Wang, J., Wu, R. P.,Gomez, F., Loo, J. A., Wohlschlegel, J. A., Vondriska, T. M., Pelletier, J., Herschman, H. R., Clardy,J., Clarke, C. F., and Huang, J. (2009) Target identification using drug affinity responsive targetstability (DARTS), Proceedings of the National Academy of Sciences of the United States ofAmerica 106, 21984 21989.
2. (2010) World malaria reportWorld Health Organization3. Miller, L. H., Ackerman, H. C., Su, X. Z., and Wellems, T. E. (2013) Malaria biology and disease
pathogenesis: insights for new treatments, Nature medicine 19, 156 167.4. Murray, C. J., Rosenfeld, L. C., Lim, S. S., Andrews, K. G., Foreman, K. J., Haring, D., Fullman, N.,
Naghavi, M., Lozano, R., and Lopez, A. D. (2012) Global malaria mortality between 1980 and2010: a systematic analysis, Lancet 379, 413 431.
5. Wright, G. J., and Rayner, J. C. (2014) Plasmodium falciparum erythrocyte invasion: combiningfunction with immune evasion, PLoS pathogens 10, e1003943.
6. Dixon, M. W., Dearnley, M. K., Hanssen, E., Gilberger, T., and Tilley, L. (2012) Shape shiftinggametocytes: how and why does P. falciparum go banana shaped?, Trends in parasitology 28,471 478.
7. Baker, D. A. (2010) Malaria gametocytogenesis,Molecular and biochemical parasitology 172, 5765.
8. Paul, R. E., Brey, P. T., and Robert, V. (2002) Plasmodium sex determination and transmission tomosquitoes, Trends in parasitology 18, 32 38.
9. Meis, J. F., Pool, G., van Gemert, G. J., Lensen, A. H., Ponnudurai, T., and Meuwissen, J. H. (1989)Plasmodium falciparum ookinetes migrate intercellularly through Anopheles stephensi midgutepithelium, Parasitology research 76, 13 19.
10. Dondorp, A. M., Nosten, F., Yi, P., Das, D., Phyo, A. P., Tarning, J., Lwin, K. M., Ariey, F.,Hanpithakpong, W., Lee, S. J., Ringwald, P., Silamut, K., Imwong, M., Chotivanich, K., Lim, P.,Herdman, T., An, S. S., Yeung, S., Singhasivanon, P., Day, N. P., Lindegardh, N., Socheat, D., andWhite, N. J. (2009) Artemisinin resistance in Plasmodium falciparum malaria, The New Englandjournal of medicine 361, 455 467.
11. Fidock, D. A., Eastman, R. T., Ward, S. A., and Meshnick, S. R. (2008) Recent highlights inantimalarial drug resistance and chemotherapy research, Trends in parasitology 24, 537 544.
12. Lim, L., and McFadden, G. I. (2010) The evolution, metabolism and functions of the apicoplast,Philosophical transactions of the Royal Society of London. Series B, Biological sciences 365, 749763.
13. Ralph, S. A., van Dooren, G. G., Waller, R. F., Crawford, M. J., Fraunholz, M. J., Foth, B. J., Tonkin,C. J., Roos, D. S., and McFadden, G. I. (2004) Tropical infectious diseases: metabolic maps andfunctions of the Plasmodium falciparum apicoplast, Nature reviews. Microbiology 2, 203 216.
14. van Dooren, G. G., and Striepen, B. (2013) The algal past and parasite present of the apicoplast,Annual review of microbiology 67, 271 289.
15. Yeh, E., and DeRisi, J. L. (2011) Chemical rescue of malaria parasites lacking an apicoplast definesorganelle function in blood stage Plasmodium falciparum, PLoS biology 9, e1001138.
16. Grawert, T., Groll, M., Rohdich, F., Bacher, A., and Eisenreich, W. (2011) Biochemistry of thenon mevalonate isoprenoid pathway, Cellular and molecular life sciences : CMLS 68, 3797 3814.

60
17. Nair, S. C., Brooks, C. F., Goodman, C. D., Sturm, A., McFadden, G. I., Sundriyal, S., Anglin, J. L.,Song, Y., Moreno, S. N., and Striepen, B. (2011) Apicoplast isoprenoid precursor synthesis andthe molecular basis of fosmidomycin resistance in Toxoplasma gondii, The Journal ofexperimental medicine 208, 1547 1559.
18. Goodman, C. D., and McFadden, G. I. (2013) Targeting apicoplasts in malaria parasites, Expertopinion on therapeutic targets 17, 167 177.
19. Botte, C. Y., Dubar, F., McFadden, G. I., Marechal, E., and Biot, C. (2012) Plasmodium falciparumapicoplast drugs: targets or off targets?, Chemical reviews 112, 1269 1283.
20. Lanaspa, M., Moraleda, C., Machevo, S., Gonzalez, R., Serrano, B., Macete, E., Cistero, P., Mayor,A., Hutchinson, D., Kremsner, P. G., Alonso, P., Menendez, C., and Bassat, Q. (2012) Inadequateefficacy of a new formulation of fosmidomycin clindamycin combination in Mozambicanchildren less than three years old with uncomplicated Plasmodium falciparum malaria,Antimicrobial agents and chemotherapy 56, 2923 2928.
21. Wiesner, J., and Jomaa, H. (2007) Isoprenoid biosynthesis of the apicoplast as drug target,Current drug targets 8, 3 13.
22. Cassera, M. B., Gozzo, F. C., D'Alexandri, F. L., Merino, E. F., del Portillo, H. A., Peres, V. J.,Almeida, I. C., Eberlin, M. N., Wunderlich, G., Wiesner, J., Jomaa, H., Kimura, E. A., and Katzin, A.M. (2004) The methylerythritol phosphate pathway is functionally active in all intraerythrocyticstages of Plasmodium falciparum, The Journal of biological chemistry 279, 51749 51759.
23. Couto, A. S., Kimura, E. A., Peres, V. J., Uhrig, M. L., and Katzin, A. M. (1999) Active isoprenoidpathway in the intra erythrocytic stages of Plasmodium falciparum: presence of dolichols of 11and 12 isoprene units, The Biochemical journal 341 ( Pt 3), 629 637.
24. D'Alexandri, F. L., Kimura, E. A., Peres, V. J., and Katzin, A. M. (2006) Protein dolichylation inPlasmodium falciparum, FEBS letters 580, 6343 6348.
25. Jordao, F. M., Kimura, E. A., and Katzin, A. M. (2011) Isoprenoid biosynthesis in the erythrocyticstages of Plasmodium falciparum,Memorias do Instituto Oswaldo Cruz 106 Suppl 1, 134 141.
26. Cassera, M. B., Hazleton, K. Z., Merino, E. F., Obaldia, N., 3rd, Ho, M. C., Murkin, A. S., DePinto,R., Gutierrez, J. A., Almo, S. C., Evans, G. B., Babu, Y. S., and Schramm, V. L. (2011) Plasmodiumfalciparum parasites are killed by a transition state analogue of purine nucleoside phosphorylasein a primate animal model, PloS one 6, e26916.
27. Sana, T. R., Gordon, D. B., Fischer, S. M., Tichy, S. E., Kitagawa, N., Lai, C., Gosnell, W. L., andChang, S. P. (2013) Global mass spectrometry based metabolomics profiling of erythrocytesinfected with Plasmodium falciparum, PloS one 8, e60840.
28. Cassera, M. B., Zhang, Y., Hazleton, K. Z., and Schramm, V. L. (2011) Purine and pyrimidinepathways as targets in Plasmodium falciparum, Curr Top Med Chem 11, 2103 2115.
29. Kato, H., Izumi, Y., Hasunuma, T., Matsuda, F., and Kondo, A. (2012) Widely targeted metabolicprofiling analysis of yeast central metabolites, Journal of bioscience and bioengineering 113,665 673.
30. Luo, B., Groenke, K., Takors, R., Wandrey, C., and Oldiges, M. (2007) Simultaneousdetermination of multiple intracellular metabolites in glycolysis, pentose phosphate pathwayand tricarboxylic acid cycle by liquid chromatography mass spectrometry, Journal ofchromatography. A 1147, 153 164.
31. Hennere, G., Becher, F., Pruvost, A., Goujard, C., Grassi, J., and Benech, H. (2003) Liquidchromatography tandem mass spectrometry assays for intracellular deoxyribonucleotidetriphosphate competitors of nucleoside antiretrovirals, Journal of chromatography. B, Analyticaltechnologies in the biomedical and life sciences 789, 273 281.

61
32. Yang, F. Q., Li, D. Q., Feng, K., Hu, D. J., and Li, S. P. (2010) Determination of nucleotides,nucleosides and their transformation products in Cordyceps by ion pairing reversed phase liquidchromatography mass spectrometry, Journal of chromatography. A 1217, 5501 5510.
33. Knee, J. M., Rzezniczak, T. Z., Barsch, A., Guo, K. Z., and Merritt, T. J. (2013) A novel ion pairingLC/MS metabolomics protocol for study of a variety of biologically relevant polar metabolites,Journal of chromatography. B, Analytical technologies in the biomedical and life sciences 936,63 73.
34. Cordell, R. L., Hill, S. J., Ortori, C. A., and Barrett, D. A. (2008) Quantitative profiling ofnucleotides and related phosphate containing metabolites in cultured mammalian cells by liquidchromatography tandem electrospray mass spectrometry, Journal of chromatography. B,Analytical technologies in the biomedical and life sciences 871, 115 124.
35. Witters, E., Van Dongen, W., Esmans, E. L., and Van Onckelen, H. A. (1997) Ion pair liquidchromatography electrospray mass spectrometry for the analysis of cyclic nucleotides, Journalof chromatography. B, Biomedical sciences and applications 694, 55 63.
36. Yamaoka, N., Kudo, Y., Inazawa, K., Inagawa, S., Yasuda, M., Mawatari, K., Nakagomi, K., andKaneko, K. (2010) Simultaneous determination of nucleosides and nucleotides in dietary foodsand beverages using ion pairing liquid chromatography electrospray ionization massspectrometry, Journal of chromatography. B, Analytical technologies in the biomedical and lifesciences 878, 2054 2060.
37. Fung, E. N., Cai, Z., Burnette, T. C., and Sinhababu, A. K. (2001) Simultaneous determination ofZiagen and its phosphorylated metabolites by ion pairing high performance liquidchromatography tandem mass spectrometry, Journal of chromatography. B, Biomedical sciencesand applications 754, 285 295.
38. Plumb, R. S., Mather, J., Little, D., Rainville, P. D., Twohig, M., Harland, G., Kenny, D. J.,Nicholson, J. K., Wilson, I. D., and Kass, I. J. (2010) A novel LC MS approach for the detection ofmetabolites in DMPK studies, Bioanalysis 2, 1767 1778.
39. Bowman, J. D., Merino, E. F., Brooks, C. F., Striepen, B., Carlier, P. R., and Cassera, M. B. (2014)Antiapicoplast and gametocytocidal screening to identify the mechanisms of action ofcompounds within the malaria box, Antimicrobial agents and chemotherapy 58, 811 819.
40. Cassera, M. B., Hazleton, K. Z., Riegelhaupt, P. M., Merino, E. F., Luo, M., Akabas, M. H., andSchramm, V. L. (2008) Erythrocytic adenosine monophosphate as an alternative purine source inPlasmodium falciparum, The Journal of biological chemistry 283, 32889 32899.
41. Trager, W., and Jensen, J. B. (1976) Human malaria parasites in continuous culture, Science 193,673 675.
42. Olszewski, K. L., Morrisey, J. M., Wilinski, D., Burns, J. M., Vaidya, A. B., Rabinowitz, J. D., andLlinas, M. (2009) Host parasite interactions revealed by Plasmodium falciparum metabolomics,Cell host & microbe 5, 191 199.
43. Dudzinska, W., Hlynczak, A. J., Skotnicka, E., and Suska, M. (2006) The purine metabolism ofhuman erythrocytes, Biochemistry (Mosc) 71, 467 475.
44. Spangenberg, T., Burrows, J. N., Kowalczyk, P., McDonald, S., Wells, T. N., and Willis, P. (2013)The open access malaria box: a drug discovery catalyst for neglected diseases, PloS one 8,e62906.
45. Sun, W., Tanaka, T. Q., Magle, C. T., Huang, W., Southall, N., Huang, R., Dehdashti, S. J., McKew,J. C., Williamson, K. C., and Zheng, W. (2014) Chemical signatures and new drug targets forgametocytocidal drug development, Scientific reports 4, 3743.
46. Ribaut, C., Berry, A., Chevalley, S., Reybier, K., Morlais, I., Parzy, D., Nepveu, F., Benoit Vical, F.,and Valentin, A. (2008) Concentration and purification by magnetic separation of theerythrocytic stages of all human Plasmodium species,Malaria journal 7, 45.

62
47. Jansson, A. M., Wieckowska, A., Bjorkelid, C., Yahiaoui, S., Sooriyaarachchi, S., Lindh, M.,Bergfors, T., Dharavath, S., Desroses, M., Suresh, S., Andaloussi, M., Nikhil, R., Sreevalli, S.,Srinivasa, B. R., Larhed, M., Jones, T. A., Karlen, A., and Mowbray, S. L. (2013) DXR inhibition bypotent mono and disubstituted fosmidomycin analogues, Journal of medicinal chemistry 56,6190 6199.
48. Proteau, P. J. (2004) 1 Deoxy D xylulose 5 phosphate reductoisomerase: an overview,Bioorganic chemistry 32, 483 493.
49. San Jose, G., Jackson, E. R., Uh, E., Johny, C., Haymond, A., Lundberg, L., Pinkham, C., Kehn Hall,K., Boshoff, H. I., Couch, R. D., and Dowd, C. S. (2013) Design of Potential Bisubstrate Inhibitorsagainst (Mtb) 1 Deoxy D Xylulose 5 Phosphate Reductoisomerase (Dxr) Evidence of a NovelBinding Mode,MedChemComm 4, 1099 1104.
50. Zhang, B., Watts, K. M., Hodge, D., Kemp, L. M., Hunstad, D. A., Hicks, L. M., and Odom, A. R.(2011) A second target of the antimalarial and antibacterial agent fosmidomycin revealed bycellular metabolic profiling, Biochemistry 50, 3570 3577.
51. Hunter, W. N., Bond, C. S., Gabrielsen, M., and Kemp, L. E. (2003) Structure and reactivity in thenon mevalonate pathway of isoprenoid biosynthesis, Biochemical Society transactions 31, 537542.
52. Waters, N. C., Kopydlowski, K. M., Guszczynski, T., Wei, L., Sellers, P., Ferlan, J. T., Lee, P. J., Li, Z.,Woodard, C. L., Shallom, S., Gardner, M. J., and Prigge, S. T. (2002) Functional characterization ofthe acyl carrier protein (PfACP) and beta ketoacyl ACP synthase III (PfKASIII) from Plasmodiumfalciparum,Molecular and biochemical parasitology 123, 85 94.
53. Huang, W., Jia, J., Edwards, P., Dehesh, K., Schneider, G., and Lindqvist, Y. (1998) Crystalstructure of beta ketoacyl acyl carrier protein synthase II from E.coli reveals the moleculararchitecture of condensing enzymes, The EMBO journal 17, 1183 1191.
54. http://www.uniprot.org/uniprot/C6EJ93. (2013).55. Kalanon, M., Tonkin, C. J., and McFadden, G. I. (2009) Characterization of two putative protein
translocation components in the apicoplast of Plasmodium falciparum, Eukaryotic cell 8, 11461154.
56. Richard, S. B., Lillo, A. M., Tetzlaff, C. N., Bowman, M. E., Noel, J. P., and Cane, D. E. (2004)Kinetic analysis of Escherichia coli 2 C methyl D erythritol 4 phosphate cytidyltransferase, wildtype and mutants, reveals roles of active site amino acids, Biochemistry 43, 12189 12197.
57. Tsang, A., Seidle, H., Jawaid, S., Zhou, W., Smith, C., and Couch, R. D. (2011) Francisella tularensis2 C methyl D erythritol 4 phosphate cytidylyltransferase: kinetic characterization andphosphoregulation, PloS one 6, e20884.
58. Cane, D. E., Chow, C., Lillo, A., and Kang, I. (2001) Molecular cloning, expression andcharacterization of the first three genes in the mevalonate independent isoprenoid pathway inStreptomyces coelicolor, Bioorganic & medicinal chemistry 9, 1467 1477.
59. Rohdich, F., Eisenreich, W., Wungsintaweekul, J., Hecht, S., Schuhr, C. A., and Bacher, A. (2001)Biosynthesis of terpenoids. 2C Methyl D erythritol 2,4 cyclodiphosphate synthase (IspF) fromPlasmodium falciparum, European journal of biochemistry / FEBS 268, 3190 3197.
60. Kemp, L. E., Bond, C. S., and Hunter, W. N. (2002) Structure of 2C methyl D erythritol 2,4cyclodiphosphate synthase: an essential enzyme for isoprenoid biosynthesis and target forantimicrobial drug development, Proceedings of the National Academy of Sciences of the UnitedStates of America 99, 6591 6596.
61. Geist, J. G., Lauw, S., Illarionova, V., Illarionov, B., Fischer, M., Grawert, T., Rohdich, F.,Eisenreich, W., Kaiser, J., Groll, M., Scheurer, C., Wittlin, S., Alonso Gomez, J. L., Schweizer, W.B., Bacher, A., and Diederich, F. (2010) Thiazolopyrimidine inhibitors of 2 methylerythritol 2,4

63
cyclodiphosphate synthase (IspF) from Mycobacterium tuberculosis and Plasmodiumfalciparum, ChemMedChem 5, 1092 1101.
62. Narayanasamy, P., Eoh, H., Brennan, P. J., and Crick, D. C. (2010) Synthesis of 4diphosphocytidyl 2 C methyl D erythritol 2 phosphate and kinetic studies of Mycobacteriumtuberculosis IspF, Chemistry & biology 17, 117 122.
63. Sgraja, T., Kemp, L. E., Ramsden, N., and Hunter, W. N. (2005) A double mutation of Escherichiacoli2C methyl D erythritol 2,4 cyclodiphosphate synthase disrupts six hydrogen bonds with, yetfails to prevent binding of, an isoprenoid diphosphate, Acta crystallographica. Section F,Structural biology and crystallization communications 61, 625 629.
64. Tang, M., Odejinmi, S. I., Allette, Y. M., Vankayalapati, H., and Lai, K. (2011) Identification ofnovel small molecule inhibitors of 4 diphosphocytidyl 2 C methyl D erythritol (CDP ME) kinaseof Gram negative bacteria, Bioorganic & medicinal chemistry 19, 5886 5895.
65. Shan, S., and Chen, X. (2011) Crystallization and preliminary X ray analysis of 4diphosphocytidyl 2 C methyl D erythritol kinase (IspE) from Mycobacterium tuberculosis, Actacrystallographica. Section F, Structural biology and crystallization communications 67, 821 823.
66. Eoh, H., Narayanasamy, P., Brown, A. C., Parish, T., Brennan, P. J., and Crick, D. C. (2009)Expression and characterization of soluble 4 diphosphocytidyl 2 C methyl D erythritol kinasefrom bacterial pathogens, Chemistry & biology 16, 1230 1239.