protein purification by polyelectrolyte …people.chem.umass.edu/dubinlab/refs/protein...
TRANSCRIPT
rXXXX American Chemical Society A dx.doi.org/10.1021/bm101465y | Biomacromolecules XXXX, XXX, 000–000
ARTICLE
pubs.acs.org/Biomac
Protein Purification by Polyelectrolyte Coacervation: Influence ofProtein Charge Anisotropy on SelectivityYisheng Xu,† Malek Mazzawi,† Kaimin Chen,§ Lianhong Sun,‡ and Paul L. Dubin*,†
†Department of Chemistry and ‡Department of Chemical Engineering, University of Massachusetts, Amherst, Massachusetts, 01003§State Key Laboratory of Chemical Engineering, School of Chemical Engineering, East China University of Science and Technology,Shanghai, 200237, P. R. China
’ INTRODUCTION
A major driving force behind current efforts to develop avariety of efficient methods for protein purification1�3 is thegrowing demand for recombinant proteins,4�6 for example,monoclonal antibodies, cytokines, and subunit vaccines. As anexample, the estimated value of recombinant protein factor VIIIneeded to satisfy the total market is on the order of≈ $1 billion.7
Despite this growing demand, downstream protein purificationhas lagged behind recombinant technologies and is usually anexpensive and slow process. This high cost and slow speedcreates a bottleneck in pharmaceutical process development thatmakes the need for efficient and high-yield protein separationtechnologies urgent.
Currently, commercial bioseparation techniques have notevolved far from familiar combinations of a relative limitedvariety of techniques, all of which have their virtues and draw-backs. For example, liquid chromatography and membraneseparation are two major techniques that have been widelyapplied in industrial protein separations. The many forms of
liquid chromatography offer high resolution and good selectivitybut are limited by low throughput and large solventconsumption.8 Membrane-selective permeation, offering higherthroughput and greater economy, is developing as an alternativelarge-scale separation technique based on selectivity of themembrane stationary phase, for example, ion exchange, affinity,and hydrophobicity.9 However, applications of selective mem-branes are limited to some extent by low binding capacity ofanalytes arising from low membrane surface area. The quality ofmembranes, for example, uniformity of pore size, stability ofcoatings, and evenness of thickness, also strongly influences theperformance of separation.9 Because of these limitations, there isa need for large scale, economic, and highly selective separationtechniques as alternatives to liquid chromatography and mem-brane separation.
Received: December 4, 2010Revised: February 9, 2011
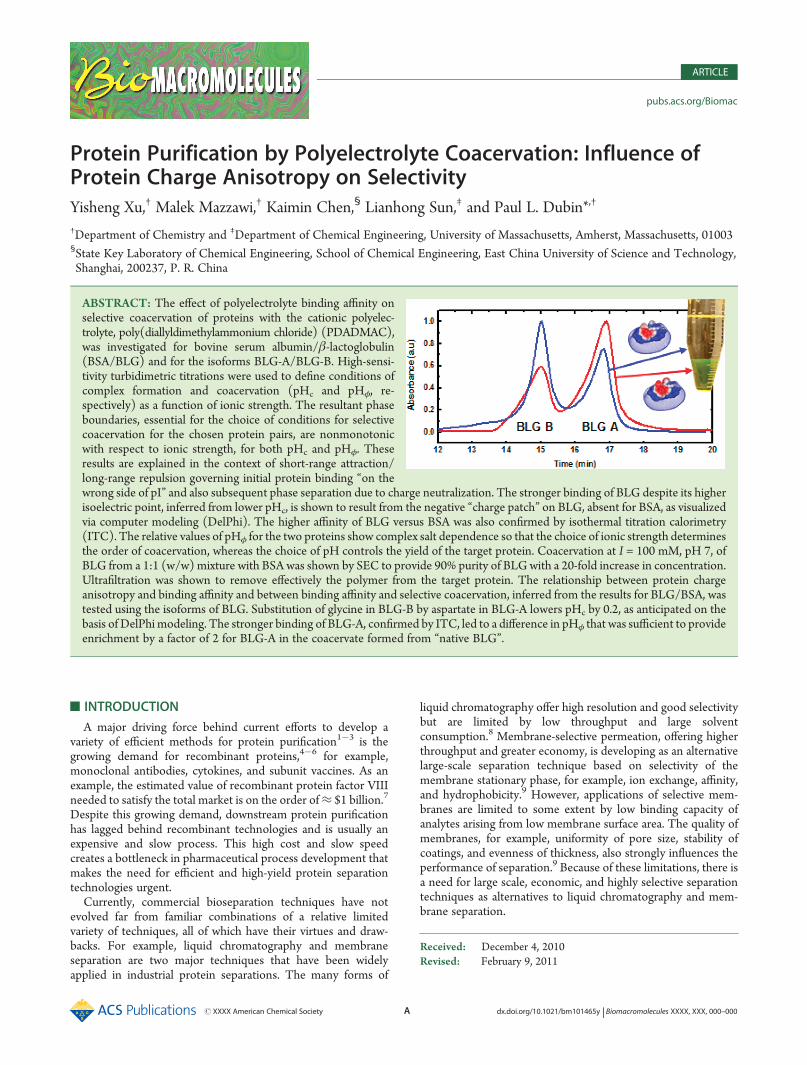
ABSTRACT: The effect of polyelectrolyte binding affinity onselective coacervation of proteins with the cationic polyelec-trolyte, poly(diallyldimethylammonium chloride) (PDADMAC),was investigated for bovine serum albumin/β-lactoglobulin(BSA/BLG) and for the isoforms BLG-A/BLG-B. High-sensi-tivity turbidimetric titrations were used to define conditions ofcomplex formation and coacervation (pHc and pHφ, re-spectively) as a function of ionic strength. The resultant phaseboundaries, essential for the choice of conditions for selectivecoacervation for the chosen protein pairs, are nonmonotonicwith respect to ionic strength, for both pHc and pHφ. Theseresults are explained in the context of short-range attraction/long-range repulsion governing initial protein binding “on thewrong side of pI” and also subsequent phase separation due to charge neutralization. The stronger binding of BLG despite its higherisoelectric point, inferred from lower pHc, is shown to result from the negative “charge patch” on BLG, absent for BSA, as visualizedvia computer modeling (DelPhi). The higher affinity of BLG versus BSA was also confirmed by isothermal titration calorimetry(ITC). The relative values of pHφ for the two proteins show complex salt dependence so that the choice of ionic strength determinesthe order of coacervation, whereas the choice of pH controls the yield of the target protein. Coacervation at I = 100 mM, pH 7, ofBLG from a 1:1 (w/w) mixture with BSA was shown by SEC to provide 90% purity of BLGwith a 20-fold increase in concentration.Ultrafiltration was shown to remove effectively the polymer from the target protein. The relationship between protein chargeanisotropy and binding affinity and between binding affinity and selective coacervation, inferred from the results for BLG/BSA, wastested using the isoforms of BLG. Substitution of glycine in BLG-B by aspartate in BLG-A lowers pHc by 0.2, as anticipated on thebasis of DelPhi modeling. The stronger binding of BLG-A, confirmed by ITC, led to a difference in pHφ that was sufficient to provideenrichment by a factor of 2 for BLG-A in the coacervate formed from “native BLG”.
B dx.doi.org/10.1021/bm101465y |Biomacromolecules XXXX, XXX, 000–000
Biomacromolecules ARTICLE
Phase separation based on protein precipitation by salts,10
organic solvents,11 or polyelectrolytes12�15 provides an alterna-tive to the above-mentioned techniques for protein purification.16
The important features of these separation techniques are: (1)large purification capacity, (2) solvent economy and low cost, (3)high speed, and (4) simplicity with respect to instrumentation.Among the several precipitation methods noted, polyelectrolyte�protein precipitation can offer selectivity, but recovery of pro-teins can be complicated with regard to preservation of proteinactivity17,18 and redissolution.19,20 In contrast, phase separationby polyelectrolyte coacervation is a “soft method” in whichprotein�polyelectrolyte complexation is fully reversible andprotein stability can be retained,21 as indicated by the lack ofchange in protein circular dichroism22 or, more sensitively, by theabsence of any reduction in enzyme activity.23
Complex coacervation is a liquid�liquid phase separation thatoccurs in solutions of oppositely charged macromolecules, includ-ing both polyelectrolytes and charged colloidal particles. Phaseseparation occurs subsequent to the formation of soluble com-plexes under critical conditions of ionic strength and colloidsurface charge density.24 For protein�polyelectrolyte systems,the colloid charge density is pH-dependent, and a critical pH forcomplexation known as “pHc” marks the binding of multipleproteins to a single polymer chain.25,26 This pHc depends only onionic strength and the protein of interest, not macromolecularconcentrations or polymer molecular weight.27 It appears likelythat the formation of multipolymer soluble aggregates of theseprimary complexes is an intermediate stage.28 Coacervationoccurs when these soluble complexes or aggregates approachcharge neutrality, that is, when the number and charge of thebound proteins compensate for the charge of thepolyelectrolyte.29 The corresponding condition “pHφ” requires aprotein net charge opposite to the polyelectrolyte, in contrast withpHc, which may occur even when protein charge and polyelec-trolyte are of the same sign.30 The driving force for coacervationappears to be the replacement of protein- and polyelectrolyte-bound counterions by protein�polyelectrolyte interactions andthe corresponding increase in entropy from counterion release.31
This loss of counterions goes hand-in-hand with desolvation,leading to a dense viscous fluid that contains 70�80% water withprotein concentrations of 15�25% (w/w).32,33
Selectivity in protein�polyelectrolyte coacervation might beconsidered a result of differences in pI at a given pH, a moreacidic protein would bind to a polycation more readily than doesa basic protein. However, proteins of nearly equal pI can showwide differences in pHc, a result of charge anisotropy.
30 Further-more, proteins with equal pHc, a rough indication of similarbinding constants, might form complexes that attain chargeneutrality and hence coacervation at different pH. Consequently,it would seem difficult to predict the feasibility of selectivecoacervation and to optimize the conditions for attaining it.Charge anisotropy affects protein�polyelectrolyte binding, andcoacervation is not ruled by simple consideration of pIs; butwhether subtle differences in surface charges can lead to selectivebinding has not been systematically explored.
There has long been an assumption that protein separationsbased on nonspecific interactions lack the selectivity of methodslike affinity chromatography and that the only way to introduceselective separation is via epitopes (protein recognition sites)governed by short-range, specific interactions.34,35 However, theability of ion exchange chromatography (IEC)36 to separateproteins with small charge differences provides an example of
high selectivity based on electrostatics.37,38 The fact that bothion-exchange resins39 and polyelectrolyes25,40,41 can bind protein“on the wrong side of pI” means they are both responsive toprotein domains of opposite charge. If polyelectrolyte binding issensitive to small differences in protein charge domains (“chargepatches”), then highly selective complexation can occur underappropriate pH conditions, as it does in IEC. Because coacerva-tion arises from soluble protein�polyelectrolyte complexes,selective complexation might be correlated with selective coa-cervation, meaning that macroscopic phase separation arisesfrom microscopic short-range electrostatic interactions. In thisway, detailed consideration of protein charge distribution couldbecome a predictive tool that circumvents the trial-and-errorapproach characteristic of many large scale protein purificationschemes.
Optimization of selective coacervation requires identificationof conditions of pH and ionic strength at which only the targetprotein forms coacervate. For polycations, for example, pH mustbe above pHφ for the target protein but below pHφ for“contaminant” protein(s). However, pHφ, corresponding tophase separation and charge neutrality reflects in complicatedways net protein charges and stoichiometries.27 A better measureof protein�polyelectrolyte binding affinity is pHc, which corre-sponds to the condition of incipient binding, at which bindingenergy proportional to logKobs (Kobs is binding constant) is closeto thermal energy (kT). Whereas the exact relationship betweenΔpH = |pH � pHc| and logKobs is not known, this indirectmeasure of binding energy makes it possible to qualitativelycorrelate affinity to protein structure. The ionic strength depen-dence of pHφ and pHc are therefore “phase boundaries”, whichboth provide practical guidelines21 and help relate differences inbinding affinities to selective phase behavior.42
Our purpose here is to examine the relationship betweenprotein charge patch density and pHc and establish how thecorresponding binding affinity can control coacervation at pHφ.We use binding to a strong polycation poly(diallyldimethyl-ammonium-chloride) (PDADMAC) in combination with twoproteins bovine serum albumin (BSA) (pI ∼4.9) and β-lacto-globulin (BLG) (pI∼5.2), which resemble each other only withrespect to pI, and two protein isoforms that differ only withrespect to two amino acids. We find that the lower value of pHc
for BLG as compared with that of BSA is correlated with its largerbinding constant, as measured by isothermal titration calorimetry(ITC). The relative values of pHφ for the two proteins showcomplex salt dependence so that the choice of ionic strengthdetermines the order of coacervation.43 Further enhancement ofthe BLG negative domain is provided by BLG-A, a genetic variantin which a neutral residue in the charge patch of the BLG-Bmonomer is replaced by a negative one. The subtle chargedifference between the two variants resulted in significantdifferences in both pHc and pHφ, demonstrating that apparentlysubtle differences in nonspecific electrostatic interactions lead toselective coacervation.
’EXPERIMENTAL SECTION
Materials. The PDADMAC sample (gift fromW. Jaeger, Fraunhofer,Golm) was prepared by free radical aqueous polymerization of dially-dimethylammonium chloride44 and characterized after dialysis andlyophilization by membrane osmometry (Mn = 141 kDa) and lightscattering (Mw = 219 kDa). Bovine serum albumin (68 kDa) with totalfree acid content e1.2 mg/g was purchased from Roche Diagnostics
C dx.doi.org/10.1021/bm101465y |Biomacromolecules XXXX, XXX, 000–000
Biomacromolecules ARTICLE
(Indianapolis, IN; CAS 9048-46-8). BLG (18 kDa, referred to below as“native BLG”) was a gift from C. Schmitt (Nestle, Lausanne). Weestablished by ion-exchange chromatography (see below) that thissample consisted (at neutral pH) of AA and BB dimers only. Iso-forms of BLG (BLG-A and BLG-B) were obtained as lyophilizedpowders (batch Nos. 2010001 and 06101001, respectively) fromNIZO (Wageningen, Netherlands). NaCl, sodium acetate, sodiumphosphate (monobasic), and standard NaOH, HCl, and acetic acidsolutions were purchased from Fisher Scientific. Milli-Q water was usedin all sample preparation.Turbidimetric Titrations. PDADMAC solutions (0.24 g/L) and
protein (BSA, BLG, BLG-A, and BLG-B) solutions (1.2 g/L) wereprepared separately at the desired concentration of NaCl (5�200 mM)and at pH 3 to 3.5, and filtered (0.22 μmMillipore). We mixed 5 mL ofeach solution to a final volume of 10 mL. Turbidimetric titration wascarried out by the addition of 0.01 NNaOH to a total solution volume of10.0 mL in increments of ∼0.1 pH unit, up to a final pH of 10, withstirring and simultaneous monitoring of pH and transmittance. Trans-mittance was measured using a Brinkmann PC 800 colorimeterequipped with a 2 cm path length fiber optics probe and a 450 nm filter,and pH was measured with a Corning 240 pH meter. The titration wascompleted in <15 min to minimize effects of protein aggregation. Aftersuitable warm-up, the instrument drift over this time period was verifiedas <0.05% (in %T).Preparation of Mixed Coacervates. To observe separation of
BSA and BLG by coacervation, we first codissoloved BSA, BLG, andPDADMAC for 2 h in pH 3.5, I = 100 mM (NaCl) Milli-Q water to givea solution 12 g/L in BSA, 12 g/L in BLG, and 2.4 g/L in PDADMAC.pH was adjusted to 7 by the addition of 1 N NaOH, to form the mixedcoacervate. To observe the separation of BLG-A from BLG-B, nativeBLG and PDADMACwere codissolved at 6 and 0.6 g/L, respectively, atpH 3.5, I = 100mMNaCl. The solution was adjusted from pH 3.5 to 6.3,to form the mixed coacervate. For both the BSA/BLG system and thenative BLG system, the turbid coacervates as described above werecentrifuged (Beckman Coulter Allegra 6R) 1 h at 3700 rpm, 20 �C toproduce an optically clear dilute (upper) and dense (lower) phase(coacervate). Coacervate was slowly removed by using a long needlesyringe.Size Exclusion Chromatography. To quantitate protein and
polymer in (1) coacervate, (2) supernatant, (3) retentate after ultra-filtration, and (4) in concentrated filtrate after ultrafiltration in (BSA/BLG system), we carried out SEC on a prepacked Superose 6 HR 10/30column using a Shimadzu Prominence LC system equipped with arefractive index detector (RID-10A), with 20 μL injections. The mobilephase was 150 mMNaClþ 30mM acetate buffer (pH 4) at 0.40 mL/min.Initial solutions were directly analyzed after filtration. For the analysisof coacervate, 0.1 mL was dissolved with 0.4 mL of water (pH 3.5)and analyzed by SEC. After ultrafiltration, the retentate and concen-trated filtrate were directly analyzed by SEC.Isothermal Titration Calorimetry. ITC was carried out using a
model VP-ITC (Microcal, Northampton, MA). For BSA/PDADMACor BLG/PDADMAC, proteins and PE solutions were made in pH 5.3buffer containing 10 mM phosphate and 90 mM NaCl. For BLG-A/PDADMAC and BLG-B/PDADMAC, proteins and PE were dissolvedin pH 7 buffer containing 10 mM phosphate and 140 mM NaCl. Allsolutions were filtered (0.22 μm Millipore). After instrument stabiliza-tion for at least 1 h at 25 �C, 1.445 mL of 1 g/L (6.2 mM basis monomerrepeat unit) PDADMAC solution was titrated with 40 successiveinjections of protein solutions (1 mM for BSA/BLG system and1.2 mM for BLG-A and -B systems). The interval between injectionswas 400 s. The solution was stirred at 315 rpm in the reaction cell duringthe experiments. Prior to data analysis, heats of dilutions were correctedby subtracting values for polymer-free blank solutions. ITC data analysistypically employs canned software (e.g., Microcal Origin) which (1)
converts raw calorimetric data (heat evolved or consumed for eachtitration step, δΔH�) to a binding isotherm, and (2) analyzes thebinding isotherm to yield binding site number (size), and bindingconstant(s) from which ΔG� and hence ΔS� are obtained. The firststep (1) is based on the assumption that any decrease in δΔH� relativeto its initial value is due to incomplete binding of the titrant molecules,this fundamental paradigm following the model of protein�ligandinteractions. In our system, thermograms were transformed into bindingisotherms by the methods described by Tomme45 and Girard.46 Thesecond step (2) is model-dependent, that is, based on a model of aprotein binding a single ligand to one or two binding sites, and thusapplied to binding isotherms that show either a single or two inflectionpoints. This model is inapplicable to protein�polyelectrolyte systems.The Scatchard plot used to fit the isotherm in ref 45 is less appropriatewhen the protein is the ligand, which is the case here as in ref 46.Therefore, the McGhee�Von Hippel model was used to fit the bindingisotherms.47
Anion Exchange Chromatography. Anion exchange chroma-tography (Biorad UNO Q-1) was used to analyze the BLG-A/-Bcomposition of native BLG before and after coacervation. We loaded50 μL of protein sample (initial native BLG and supernatant) in thecolumn equilibrated with pH 7, 20 mM Tris buffer and eluted at1 mL/min with UV detection at 280 nm. A linear gradient was appliedfrom 0 to 0.3 M NaCl from 2 to 32 min. Analysis of coacervate waspreceded by SEC of acidified coacervate to remove PDADMAC; 50 μLof the SEC BLG fraction was then directly analyzed.Computational Methods. Computer modeling was used to
visualize the electrostatic potential around the protein as a function ofpH and ionic strength. DelPhi V98.0 (Molecular Simulations) was usedto calculate electrostatic potential around the protein is calculated bynonlinear solution of the Poisson - Boltzmann equation.48 The proteincrystal structures with Protein Data Bank identifications 1AO6 (HSA),1BEB (BLG dimer) were taken from the RCSB Protein Data Bank(http://www.rcsb.org). Because the structure of 1BEB is the combina-tion of BLG-A and -B, the electrostatic calculations were modified byreplacing Gly64 with Asp64 to mimic a BLG-A dimer, and by replacingVal 118 with Ala118 to mimic a BLG-B dimer. The charges of aminoacids were generated using the spherical-smeared-charged model pro-posed by Tanford49 utilizing the protein titration curve of proteins,50,51
as described elsewhere.52
Removal of PDADMAC by Ultrafiltration. In the BSA/BLGsystem, 50 μL of coacervate made as above was redissolved in 0.55mL ofwater (pH ∼3.5) to reverse PE�protein complexation (this solutionwas analyzed by SEC to calculate the composition of coacervate); then,the redissolved coacervate was diluted to 20 mL with water at pH 3.5.Ultrafiltration was performed under 10 psi pressure using a polyether-sulfone (Amicon) membrane with nominal molecular weight limit(NMWL) of 100 kDa. After ultrafiltration, 0.3 mL of retentate (richof PDADMAC) was obtained, and the 20 mL filtrate was concentratedby freezing under vacuum overnight.
’RESULTS AND DISCUSSION
1. BSA and BLG. Turbidimetric titrations were performed bythe addition of NaOH to an acidic solution of protein andPDADMAC to determine the transition, first to soluble complexformation (pHc) and then to phase separation (pHφ). Theresults are shown in Figures 2 and 3. It is necessary to pointout that the determination of pHc can be complicated by proteinaggregation, as shown by the initial nonzero slope in Figure 1.Optimally, a zero slope at low pH indicates the absence ofcomplexation, but here this nonzero slope is due to BSAaggregation. Reduction of the titration time to 10�15 mineffectively eliminated this behavior at the ionic strengths studied.

D dx.doi.org/10.1021/bm101465y |Biomacromolecules XXXX, XXX, 000–000
Biomacromolecules ARTICLE
The parallel appearance of the “type 1 titrations” at all ionicstrengths (Figure 2) strengthens identification of pHc even in thepresence of a nonzero slope, for example, at I = 0.02 M inFigure 2A. In contrast with the analysis of pHc, the determinationof pHφ from Figure 3 is straightforward without expansion of anyregion. Some striking features of Figure 3 are the nonmonotonicsalt effect and the presence of maxima under some conditions.The nonmonotonic ionic strength dependence of both pHc
and pHφ is most effectively shown by the phase boundariesobtained in Figure 4, as pHφ and pHc versus I
1/2. The well-defined pHφminima for BSA and BLG are clearly displaced withrespect to each other and consequently cross at 50 mM. This isimportant for selective coacervation because BSA would prefer-entially be removed (by progressive increase in pH) at low saltand BLG at high salt. To understand this effect, we need toconsider the origin of these minima and their relationship to theshallow minima of pHc.Identification of the minima of pHc (∼50 mM for both BLG
and BSA), supported by the result for BSA/PDADMAC at∼30 mM already reported,42 is made possible by the reliabilityof the data points:( 0.2 (corresponding to symbol size) which issmall compared with curvature. Seyrek30 reported this behaviorfor several protein�polyanion systems that showed binding atpH > pI (“on the wrong side of pI”), indicating binding to apositive domain in the globally negative protein. The repulsiveinteraction with the negative domains must be long-rangerelative to the attractive interaction with the “positive patch”.Maximum binding should occur when long-range repulsions arescreened by small ions while short-range attraction is not. Thisshould occur when the screening length (the “Debye length” ≈0.3I�1/2, in nanometers) is on the order of the protein radius, andthis was consistent with 10 < Imax < 40mM.30 In the present case,“binding on the wrong side of pI” corresponds to binding at pH <pI, with the significance of protein charge anisotropy vanishing athigh pH where the globally negative protein binds to polycation.The ionic strength dependences of pHc and pHφ are con-
nected by the relationship between binding affinity and thenumber of proteins bound per polymer chain npr. At the pointof coacervation, we have near neutrality for complex net charge42
ZT ¼ ZP þ nprZPr ð1Þ
where ZP is the charge of the polyelectrolyte (constant), and Zpris the charge of each protein (dependent on pH). While npr
increases with binding affinity, we recognize that pHc is anindirect, qualitative measure of the binding affinity at any pH.Although pHc is presented as a phase boundary in Figure 4, thisline does not correspond to a true phase transition. Theappearance of a pHc in Figure 2 means that the binding constantKobs is negligibly small at pH < pHc but then increases rapidly,with a corresponding increase in the number of bound proteins.At pHc, the empirical onset of binding, the binding energy is closeto kT. Thus, at a fixed pH (e.g., pH 5), npr and Kobs for BSA arelargest at Imax = 50 mM where pH�pHc shows a maximum.While the curves for pHc and pHφ for BSA both show minima,
these minima are clearly displaced with respect to each other.The minimum in pHc arises from protein charge anisotropy, asdescribed above, but the corresponding negative charge patchwhich is evident at pH < pI, disappears at high pH. Therefore, thenonmonotonic behavior of pHφ, arising from an increase inprotein�PE affinity with added salt in the low I range, must comefrom an effect other than the repulsion between the polycationand global protein charge. In the case of pHφ, its increase withdecreasing I, for I < 20 mM, now comes from a drop in npr due torepulsion between nearby bound proteins at pH > 6. In the rangeof 5 < I < 20 mM, the addition of salt screens these interproteinforces, increasing npr and thereby providing charge neutrality atlow pH (less negative Zpr). At higher I, the short-range PE�-protein interaction is screened, so that npr decreases for adifferent reason, so requiring more negative Zpr, that is, higherpH. Therefore, even though minima in pHc and pHφ are bothobserved at I = 20�50mM and both correspond to local maximain npr, the drops with added salt for pHc and pHφ at low I arisefrom different causes. In the case of pHφ, the low I regionindicates that a small increase in ionic strength must be compen-sated by a large decrease in pH. In the high I region, a smallincrease in pH compensates for a large increase in salt. For thefirst case, pH controls interprotein repulsion through net proteincharge; in the second case, pH controls binding through proteincharges at the polyelectrolyte binding site. Because the polyca-tion binding site on the protein by definition will be enriched inacidic residues, an increase in their degree of ionization results ina significant change in local potential, whereas the same effect onglobal charge only modestly increases interprotein repulsion. Putdifferently, the Debye length, proportional to I�1/2, changesstrongly with I at low salt but more slowly at high salt.BLG preferentially coacervates at I > 50 mM, the same region
where the pHc curves of the two proteins diverge: the addition ofsalt diminishes the affinity of PDADMAC for BSA more than itsaffinity for BLG. The persistence of low pHc (high polycationaffinity) for BLG is a consequence of the retention of its negativecharge patch at higher I.TheDelPhi images in Figure 5 show thatthe small negative domains (red) for BSA at I = 5 mM shrink andbecome almost invisible to PDADMAC when the ionic strengthis raised to I = 150 mM. However, the negative patch of BLG islargely kept intact even though the positive charge patch shrinkssignificantly under high salt condition. Put differently, the poly-cation-binding domains for BSA are more diffuse than those forBLG and therefore require a globally negative net protein charge(higher pH) at higher I. The retention of stronger binding forBLG with increasing I appears to explain why BLG coacervatespreferentially.The shift in preferential coacervation from BSA to BLG with
increasing I is manifested in the crossing of the pHφ curves at I =50 mM, pH 6.3. This crossover point in Figure 4 corresponds tothe pH, I condition at which the coacervation preference changes
Figure 1. Turbidimetric titration of BSA-PDADMAC with addition ofNaOH. [BSA] = 0.6 g/L, [PDADMAC] = 0.12 g/L, I = 30 mM. Timeinterval between pH 3.5 and 6 is ca. 60 min.

E dx.doi.org/10.1021/bm101465y |Biomacromolecules XXXX, XXX, 000–000
Biomacromolecules ARTICLE
fromBSA to BLG; this happens at pH 6.3. To understand this, weplotted the ratio of the charges of the two proteins in Figure 6 andfound that this is the pH at which the net (negative) charge ofBSA begins to exceed the net negative charge of BLG. Under thiscondition, selective coacervation is impossible. From eq 1 andthe electroneutrality assumption, this condition corresponds toZpr
BSA/ZprBLG = nBLG/nBSA. The crossover point must arise
because a decrease in nBSA/nBLG compensates for an increase inZpr
BSA/ZprBLG. We obtained the latter ratio from data of
Tanford50,51 and plot it as a function of pH in Figure 6; at thecrossover point, Zpr
BSA/ZprBLG = 1.2, so that nBLG/nBSA must be
1.2. This slightly preferential binding for BLG is consistent withits slightly lower pHc at I = 50mM. At this ionic strength, we mayimagine an increase in pH allowing entrance into the coacerva-tion region at pH 6.3 for both proteins because the higher chargeof BSA compensates for its slightly lower affinity. Imagining anincrease in ionic strength at pH 6.3, the coacervation region forBLG is entered at I = 50 mM simultaneous with exiting from thecoacervation region for BSA. I = 50 mM might be the conditionat which the greater salt-resistance of the affinity of BLG, seenfrom the divergence of the pHc curves, begins to overcompensatefor its lower charge.We have discussed the features of the phase boundaries of BSA
and BLG because it is the difference between the respectivecoacervation points (ΔpHφ = pHφ
BSA � pHφBLG) that makes
separation possible.43 As noted above, ΔpHφ appears to becorrelated with ΔpHc (pHc
BSA � pHcBLG); this is because pHc
reflects the binding affinity of protein to polyelectrolyte. BecauseΔpHc is not a meaningful thermodynamic quantity, we did ITCto measure the difference in polycation binding constants for thetwo proteins (ΔKobs). For ITC conditions, we chose I = 100mMbecause, as shown in Figure 4, ΔpHc is large, and ΔpHφ is
Figure 2. Determination of transition for BSA/BLG-PDADMAC at various ionic strengths corresponding to soluble complex formation (pHc). (A)[BSA] = 0.6 g/L, (B) [BLG] = 0.6 g/L, [PDADMAC] = 0.12 g/L. For BSA, from bottom to top: 5, 10, 20, 100, and 200 mM. For BLG, from bottom totop: 5, 10, 30, 100, and 200 mM.
Figure 3. Turbidimetric titrations for BSA (left) and BLG (right) at different ionic strengths, protein, and polymer concentration are 0.6 and0.12 mg/mL, respectively.
Figure 4. Phase boundary of BSA and BLGwith PDADMAC from dataof Figures 2 and 3. pHc: BSA (0), BLG (2); pHφ: BSA (O), BLG (1).

F dx.doi.org/10.1021/bm101465y |Biomacromolecules XXXX, XXX, 000–000
Biomacromolecules ARTICLE
positive and close to its maximal value. We chose pH 5.3 toensure that the system is in the soluble complex region and alsobecause its proximity to pI will ensure the influence of chargeanisotropy.Figure 7 shows raw ITC data for PDADMAC with BSA and
with BLG. The vertical peaks correspond to the heat change inthe cell containing PDADMAC at each protein injection. ForBSA, the peaks gradually convert from downward to upwardbecause the complexation between BSA and PDADMAC isexothermic whereas the dilution of BSA is endothermic (blankBSA dilution experiment not shown). Whereas the measure-ment of the heat of binding by ITC is straightforward, thevalues of entropy or energy obtained are model-dependent.For the BLG�pectin system, Girard and coworkers46 analyzedthe binding isotherms using the overlapping binding site(McGhee�von Hippel) model. This model describes thebinding of interacting (cooperative) or noninteracting ligandsto a homogeneous 1D lattice (host), which seems moreappropriate to the present case, in which one polyelectrolytecan bind many proteins, than do models in which the protein isthe host. The fitting parameters are n, Kobs, and ligand�ligandcooperativity.47 For noninteracting ligands, the binding modeltakes on a form analogous to the Scatchard formulation52,53
vL¼ Kobsð1� nvÞ 1� nv
1� ðn� 1Þv� �n � 1
ð2Þ
In eq 2, ν represents the binding density expressing the number ofligands (proteins) bound per polymer repeat unit, closely relatedto the number bound per polymer chain (previously denoted asnpr). L is the free-ligand concentration and n is the number ofpolymer units per bound protein molecule. n identifies the size ofthe binding site and is related to Nb, the number of binding sitesper polymer molecule, by Nb = x/n, where x is the degree ofpolymerization. Nb = npr under saturation binding conditions.The application of eq 2 to the BLG�pectin system in ref 46led to a much higher number of binding sites (Nb)and consequently lower binding constants than those obtainedwith the “two-site” binding model. We proceeded to fit the rawdata in Figure 7 to the McGhee�von Hippel binding model toobtain the intrinsic binding constant (Kobs), the binding site size(n), and the number of polymer repeat units per bound proteinmolecule.All thermograms directly measured from ITC were trans-
formed to obtain the binding density “ν” and free proteinconcentration “L” values following the method of Girard et al.for the binding of BLG to pectin.46 The least-squares nonlinearcurve fitting of ν plotted against L is shown in Figure 8 and theresultant Kobs, and n values in Table 1. The binding constant forBLG is between two and three times greater than the value forBSA, which confirms the qualitative observation from pHc. Assuggested from Figure 5, we propose that BLG binds morestrongly to PDADMAC because of its concentrated negativecharge patch. Therefore, the ITC results establish the connectionbetween ΔpHc and Δ(ΔG).The binding site sizes for BLG and BSA are n = 50 and 80,
respectively. Expressed as contour lengths (based on the polymerrepeat unit length of ca. 0.6 nm), these are 30 and 48 nm,respectively, both five to six times larger than the respectiveprotein diameters of 5.5 and 8.0 nm. These contour length values(expressed as n) are similar to n = 22 reported for BLG�pectin46
because the length of the pectin repeat unit is twice that ofPDADMAC. The large protein-binding site size could arise fromthe repulsive interactions between charged neighboring proteins(anticooperative binding).Whereas both the turbidimetric titration andmicrocalorimetry
show stronger binding by BLG, the extent of separation possibleis not evident from these results. From the titration of BLG þPDADMAC at I = 100 mM from pH 3�9 and in the presenceand absence of BSA (Figure 9), it may be seen that BSA has noinfluence on the coacervation of BLG with PDADMAC. Thisindicates that proteins can interact independently with PDAD-MAC. After centrifugation of the BSA/BLG/PDADMAC mix-ture at pH 7 and I = 100 mM, three layers (from bottom to top)were identified as precipitate, coacervate, and supernatant. Afteracidification to pH 3.5 to effect redissolution, the coacervate wasdiluted and analyzed by SEC. The result for the coacervate iscompared with those for supernatant and initial solution inFigure 10. (Data for the precipitate, which accounted for<10%, are not shown.) 90% of the protein in the coacervate isBLG, whereas BSA accounts for 85% of the protein in thesupernatant. These results demonstrate a selective removal ofBSA from the target protein BLG and a 20-fold increase in targetprotein concentration relative to the initial mixture.
Figure 5. Electrostatic potential contours (�0.5 (red) andþ0.5 (blue)kT/e) around the BSA (upper, from ref 40) at pH 5.6 and BLG dimer(lower, from ref 56) at pH 5.
Figure 6. pH-dependent net charge of BSA (monomer) divided by thenet charge of BLG dimer obtained from refs 50 and 51.

G dx.doi.org/10.1021/bm101465y |Biomacromolecules XXXX, XXX, 000–000
Biomacromolecules ARTICLE
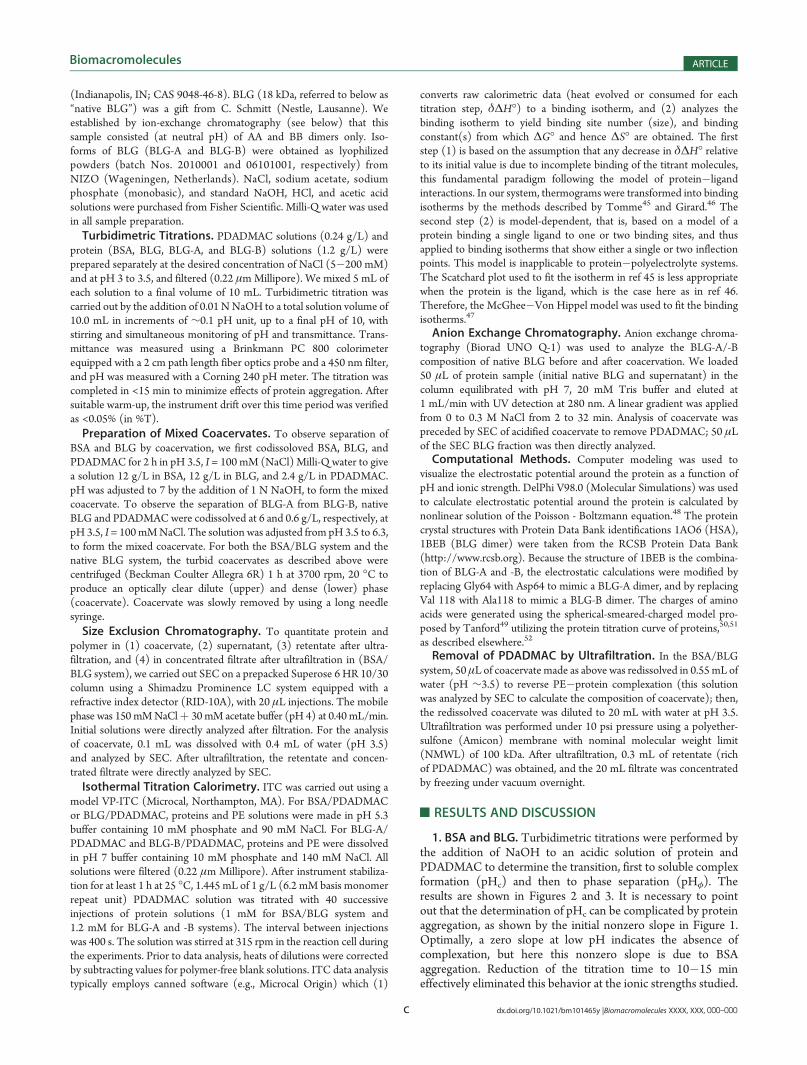
2. BLG-A and BLG-B. In the previous section, we showed thatthe selective coacervation of BLG relative to BSA previouslyobserved at high pH and ionic strength could be understood interms of the phase boundaries in Figure 4. This was based on acorrelation between conditions for the formation of solublecomplexes and conditions for coacervation involving two factors:protein affinity, and protein (that is, npr and Zpr in eq 1), withhigher affinity for BLG due to its negative “charge patch”. Tovalidate the influence of such charge anisotropy while minimizinghypothetical differences between proteins arising from hydro-phobicity and hydrogen bonding and without the need for sitemutation, we turned to the BLG genetic variants A and B, inwhich the replacement of glycine by aspartate at position 64appears to lead to a significant change in the negative chargepatch of the BLG-A dimer with two additional aspartates
(Figure 11). Whereas there have been a number of hypothesesabout structural differences between these two variants,54,55 thegreatly increased electrostatically induced native state aggrega-tion of the A form56 is consistent with this enhanced negativecharge domain. Here we choose to portray in Figure 11 thepotential contour at 0.5 kT/e (13.5 mV) based on the proposals
Figure 7. Isothermal calorimetry titration raw data for BSA-PDADMAC (left) and BLG-PDADMAC (right). Protein titrant, concentration 1 mM(18.7 g/L for BLG, and 66.8 g/L for BSA), was added to 6.2 mM (basis monomer repeat unit) (1 g/L) PDADMAC. Solvent (for both protein andpolymer) 10 mM, pH 5.3 phosphate þ 90 mM NaCl. incremental volume of titrant: 6 μL; injection in 14.4 s. Binding goes from exothermic toendothermic for BSA.
Figure 8. Binding isotherms of BSA-PDADMAC (left) and BLG-PDADMAC (right) transformed fromFigure 7. Dotted lines are experimental bindingisotherms; solid lines are nonlinear least-squares fitting to eq 2.
Table 1. Binding Parameters of BSA/BLG-PDADMAC atpH 5.3, I = 100 mMa
Kobs (M�1) n ΔG (kcal/mol)
BSA 740( 30 80( 1.9 �3.89 ( 0.02
BLG 1900( 340 50( 1.1 �4.45( 0.11aΔG was calculated from binding constant.
Figure 9. Turbidmetric titration of PDADMAC andBLG, with (9) andwithout (b) BSA. [BLG] = 0.6 g/L, [BSA] = 0.6 g/L, [PDADMAC] =0.12 g/L, I = 100 mM NaCl.
H dx.doi.org/10.1021/bm101465y |Biomacromolecules XXXX, XXX, 000–000
Biomacromolecules ARTICLE
that (1) the interaction energy at pHc (the onset of binding)should be close to kT and (2) the number of PDADMAC repeat(charge) units in this potential domain could be on the order oftwo (1.2 nm contour length); that is, two polyelectrolyte repeatunits bound at the 0.5 kT/e region involve an interactionclose to thermal energy. Enhancement of binding affinity and
coacervation from this subtle difference in charge anisotropybetween BLG-A and -B would suggest the general feasibility forselective coacervation based on electrostatics.Following the same procedures those as for Figures 2 and 3, we
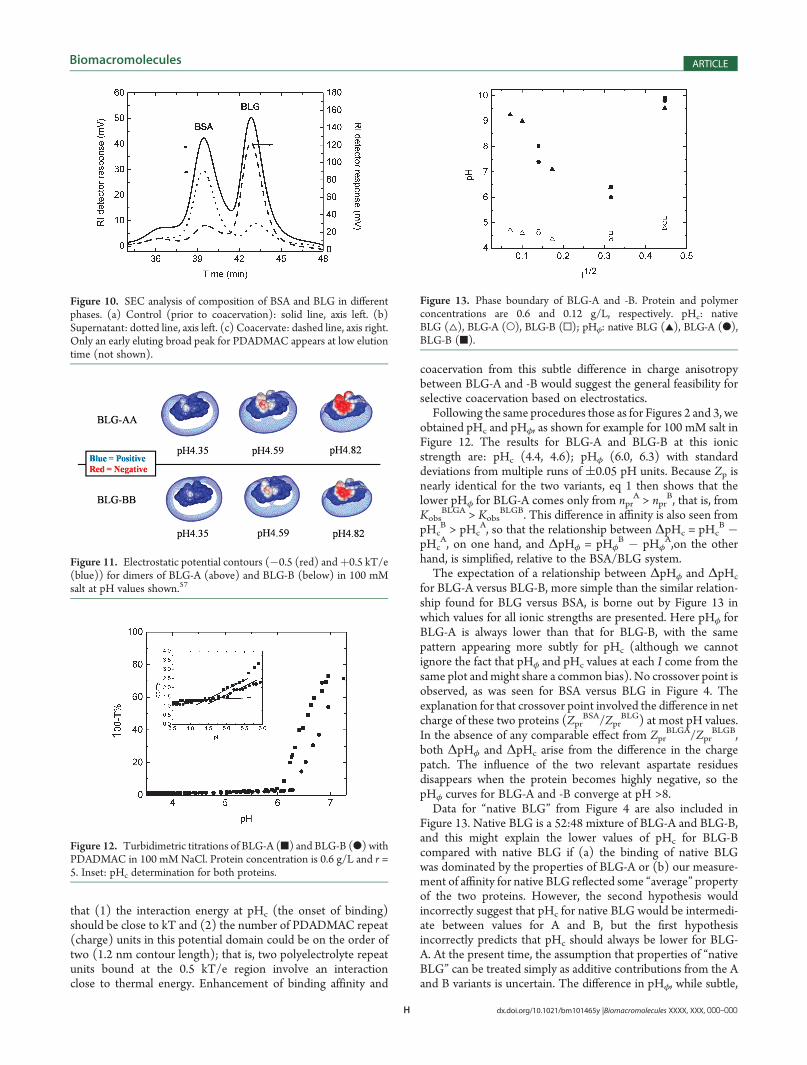
obtained pHc and pHφ, as shown for example for 100 mM salt inFigure 12. The results for BLG-A and BLG-B at this ionicstrength are: pHc (4.4, 4.6); pHφ (6.0, 6.3) with standarddeviations from multiple runs of (0.05 pH units. Because Zp isnearly identical for the two variants, eq 1 then shows that thelower pHφ for BLG-A comes only from npr
A > nprB, that is, from
KobsBLGA > Kobs
BLGB. This difference in affinity is also seen frompHc
B > pHcA, so that the relationship between ΔpHc = pHc
B �pHc
A, on one hand, and ΔpHφ = pHφB � pHφ
A,on the otherhand, is simplified, relative to the BSA/BLG system.The expectation of a relationship between ΔpHφ and ΔpHc
for BLG-A versus BLG-B, more simple than the similar relation-ship found for BLG versus BSA, is borne out by Figure 13 inwhich values for all ionic strengths are presented. Here pHφ forBLG-A is always lower than that for BLG-B, with the samepattern appearing more subtly for pHc (although we cannotignore the fact that pHφ and pHc values at each I come from thesame plot andmight share a common bias). No crossover point isobserved, as was seen for BSA versus BLG in Figure 4. Theexplanation for that crossover point involved the difference in netcharge of these two proteins (Zpr
BSA/ZprBLG) at most pH values.
In the absence of any comparable effect from ZprBLGA/Zpr
BLGB,both ΔpHφ and ΔpHc arise from the difference in the chargepatch. The influence of the two relevant aspartate residuesdisappears when the protein becomes highly negative, so thepHφ curves for BLG-A and -B converge at pH >8.Data for “native BLG” from Figure 4 are also included in
Figure 13. Native BLG is a 52:48 mixture of BLG-A and BLG-B,and this might explain the lower values of pHc for BLG-Bcompared with native BLG if (a) the binding of native BLGwas dominated by the properties of BLG-A or (b) our measure-ment of affinity for native BLG reflected some “average” propertyof the two proteins. However, the second hypothesis wouldincorrectly suggest that pHc for native BLG would be intermedi-ate between values for A and B, but the first hypothesisincorrectly predicts that pHc should always be lower for BLG-A. At the present time, the assumption that properties of “nativeBLG” can be treated simply as additive contributions from the Aand B variants is uncertain. The difference in pHφ, while subtle,
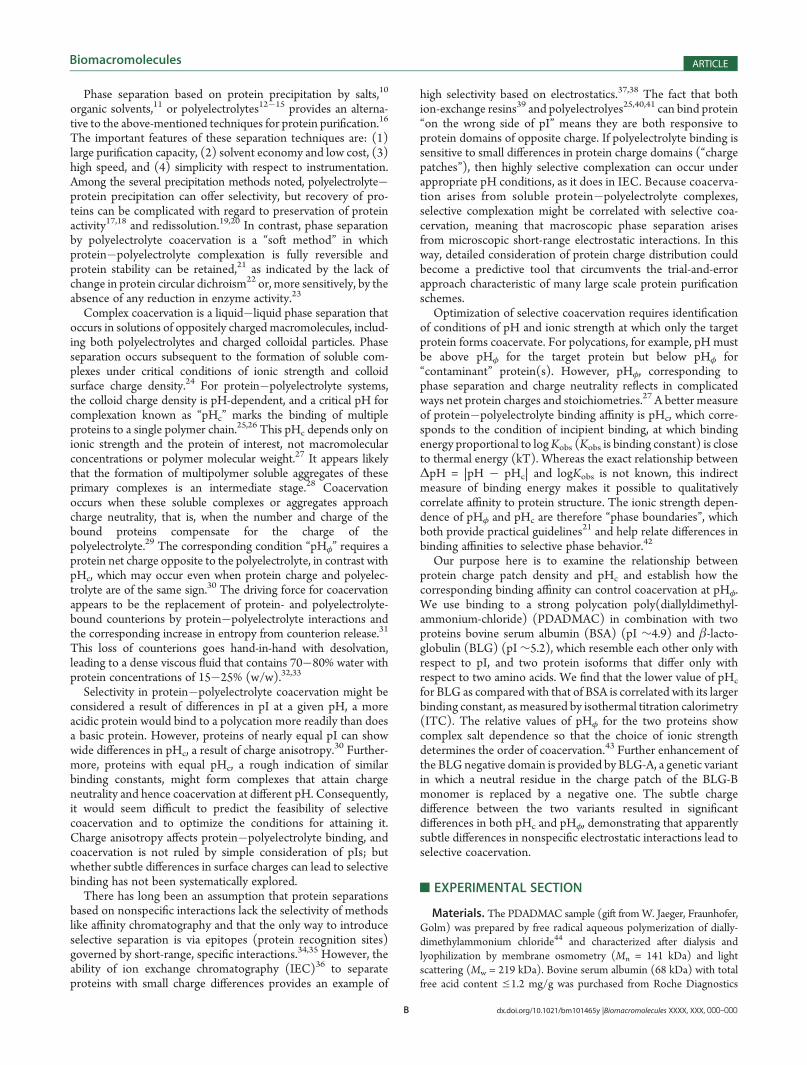
Figure 10. SEC analysis of composition of BSA and BLG in differentphases. (a) Control (prior to coacervation): solid line, axis left. (b)Supernatant: dotted line, axis left. (c) Coacervate: dashed line, axis right.Only an early eluting broad peak for PDADMAC appears at low elutiontime (not shown).
Figure 11. Electrostatic potential contours (�0.5 (red) andþ0.5 kT/e(blue)) for dimers of BLG-A (above) and BLG-B (below) in 100 mMsalt at pH values shown.57
Figure 12. Turbidimetric titrations of BLG-A (9) and BLG-B (b) withPDADMAC in 100 mM NaCl. Protein concentration is 0.6 g/L and r =5. Inset: pHc determination for both proteins.
Figure 13. Phase boundary of BLG-A and -B. Protein and polymerconcentrations are 0.6 and 0.12 g/L, respectively. pHc: nativeBLG (4), BLG-A (O), BLG-B (0); pHφ: native BLG (2), BLG-A (b),BLG-B (9).
I dx.doi.org/10.1021/bm101465y |Biomacromolecules XXXX, XXX, 000–000
Biomacromolecules ARTICLE
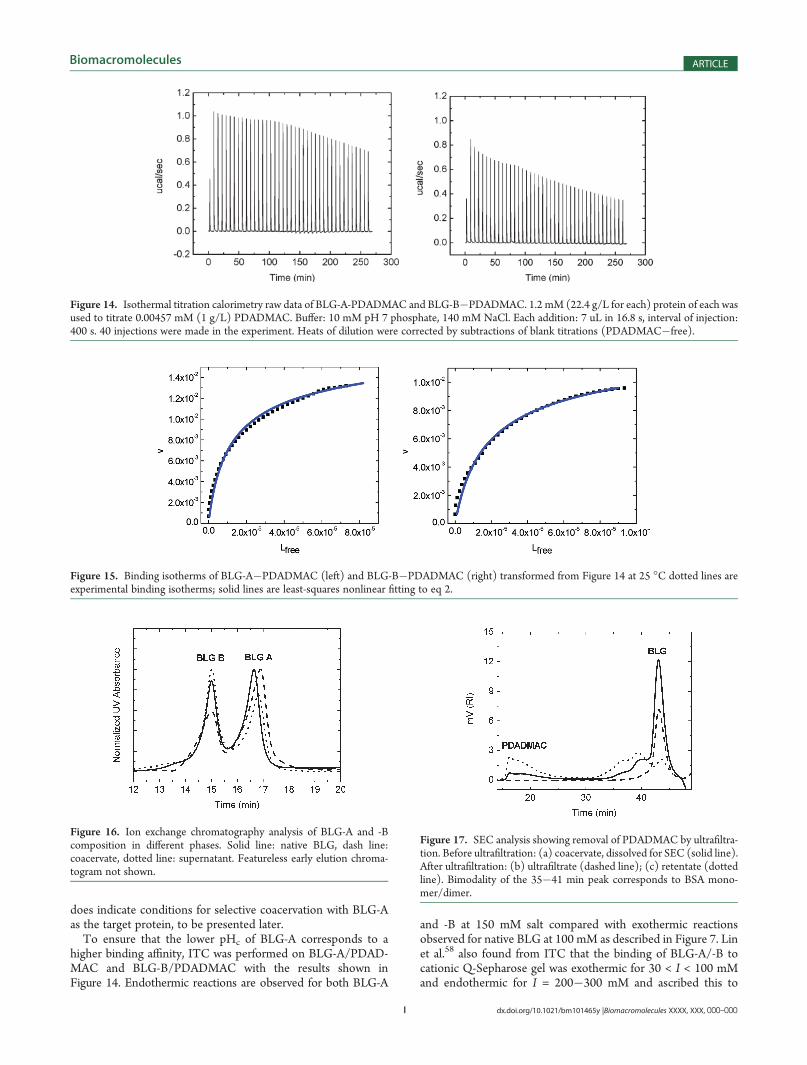
does indicate conditions for selective coacervation with BLG-Aas the target protein, to be presented later.To ensure that the lower pHc of BLG-A corresponds to a
higher binding affinity, ITC was performed on BLG-A/PDAD-MAC and BLG-B/PDADMAC with the results shown inFigure 14. Endothermic reactions are observed for both BLG-A
and -B at 150 mM salt compared with exothermic reactionsobserved for native BLG at 100 mM as described in Figure 7. Linet al.58 also found from ITC that the binding of BLG-A/-B tocationic Q-Sepharose gel was exothermic for 30 < I < 100 mMand endothermic for I = 200�300 mM and ascribed this to
Figure 14. Isothermal titration calorimetry raw data of BLG-A-PDADMAC and BLG-B�PDADMAC. 1.2 mM (22.4 g/L for each) protein of each wasused to titrate 0.00457 mM (1 g/L) PDADMAC. Buffer: 10 mM pH 7 phosphate, 140 mM NaCl. Each addition: 7 uL in 16.8 s, interval of injection:400 s. 40 injections were made in the experiment. Heats of dilution were corrected by subtractions of blank titrations (PDADMAC�free).
Figure 15. Binding isotherms of BLG-A�PDADMAC (left) and BLG-B�PDADMAC (right) transformed from Figure 14 at 25 �C dotted lines areexperimental binding isotherms; solid lines are least-squares nonlinear fitting to eq 2.
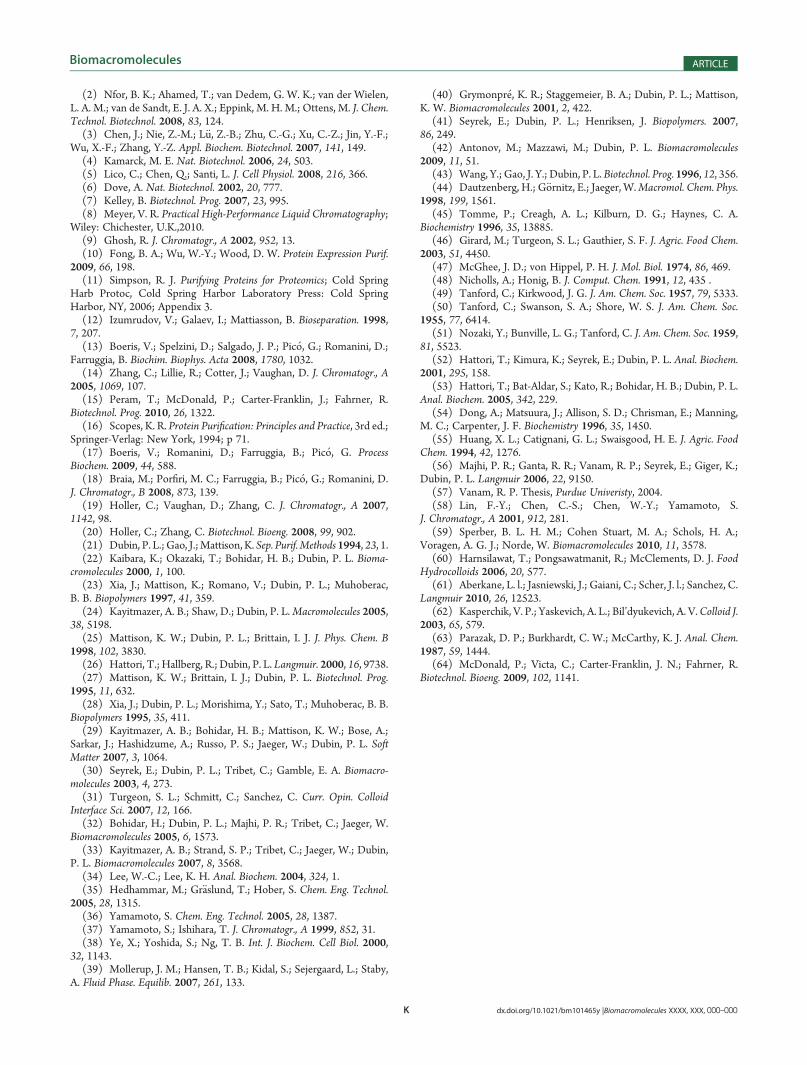
Figure 16. Ion exchange chromatography analysis of BLG-A and -Bcomposition in different phases. Solid line: native BLG, dash line:coacervate, dotted line: supernatant. Featureless early elution chroma-togram not shown.
Figure 17. SEC analysis showing removal of PDADMAC by ultrafiltra-tion. Before ultrafiltration: (a) coacervate, dissolved for SEC (solid line).After ultrafiltration: (b) ultrafiltrate (dashed line); (c) retentate (dottedline). Bimodality of the 35�41 min peak corresponds to BSA mono-mer/dimer.
J dx.doi.org/10.1021/bm101465y |Biomacromolecules XXXX, XXX, 000–000
Biomacromolecules ARTICLE
dominance of electrostatic interactions at low salt and hydro-phobic interactions at high salt. Whereas an enhancement ofhydrophobic interactions by a relatively small change in ionicstrength appears unlikely, a more predominant favorable en-thalpy from electrostatic interactions at low salt is reasonable, aspointed out recently by Sperber et al.59 A global explanation ofthe variations in sign of ΔH for protein�polyelectrolyte inter-actions can be complicated by possible additional contributionsfrom conformational changes, hydrophobic interactions, coun-terion binding/dissociation, and electrostatic interactions.60,61
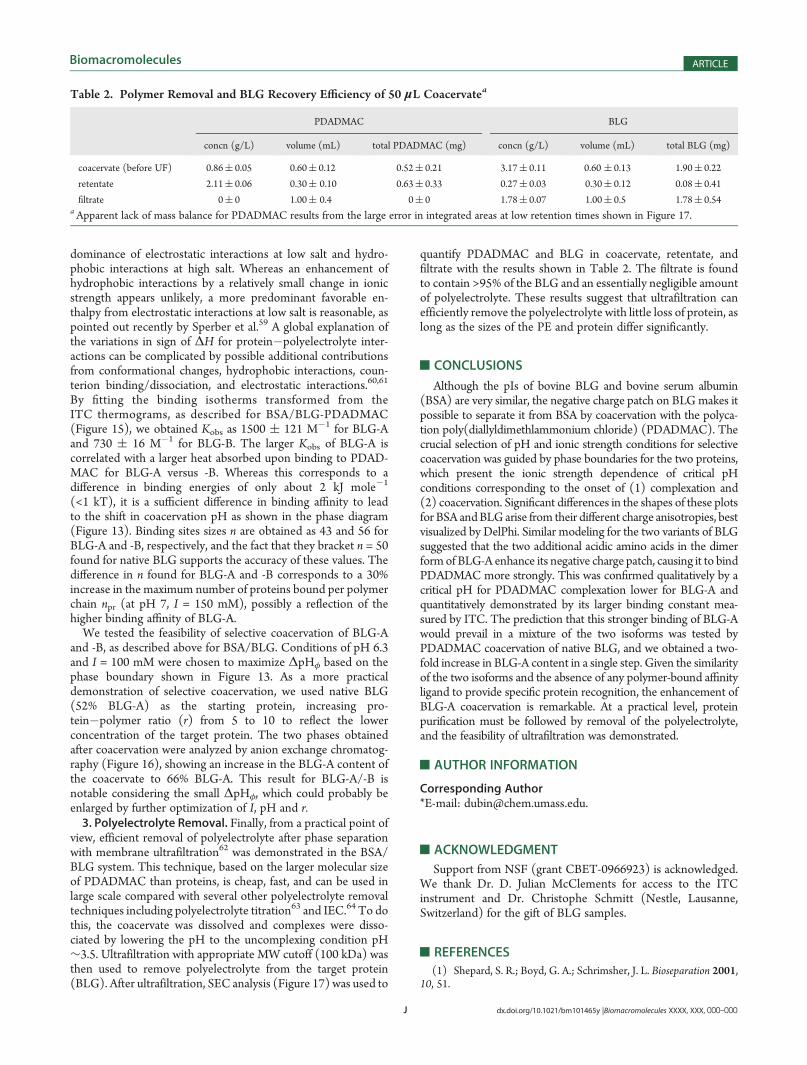
By fitting the binding isotherms transformed from theITC thermograms, as described for BSA/BLG-PDADMAC(Figure 15), we obtained Kobs as 1500 ( 121 M�1 for BLG-Aand 730 ( 16 M�1 for BLG-B. The larger Kobs of BLG-A iscorrelated with a larger heat absorbed upon binding to PDAD-MAC for BLG-A versus -B. Whereas this corresponds to adifference in binding energies of only about 2 kJ mole�1
(<1 kT), it is a sufficient difference in binding affinity to leadto the shift in coacervation pH as shown in the phase diagram(Figure 13). Binding sites sizes n are obtained as 43 and 56 forBLG-A and -B, respectively, and the fact that they bracket n = 50found for native BLG supports the accuracy of these values. Thedifference in n found for BLG-A and -B corresponds to a 30%increase in the maximum number of proteins bound per polymerchain npr (at pH 7, I = 150 mM), possibly a reflection of thehigher binding affinity of BLG-A.We tested the feasibility of selective coacervation of BLG-A
and -B, as described above for BSA/BLG. Conditions of pH 6.3and I = 100 mM were chosen to maximize ΔpHφ based on thephase boundary shown in Figure 13. As a more practicaldemonstration of selective coacervation, we used native BLG(52% BLG-A) as the starting protein, increasing pro-tein�polymer ratio (r) from 5 to 10 to reflect the lowerconcentration of the target protein. The two phases obtainedafter coacervation were analyzed by anion exchange chromatog-raphy (Figure 16), showing an increase in the BLG-A content ofthe coacervate to 66% BLG-A. This result for BLG-A/-B isnotable considering the small ΔpHφ, which could probably beenlarged by further optimization of I, pH and r.3. Polyelectrolyte Removal. Finally, from a practical point of
view, efficient removal of polyelectrolyte after phase separationwith membrane ultrafiltration62 was demonstrated in the BSA/BLG system. This technique, based on the larger molecular sizeof PDADMAC than proteins, is cheap, fast, and can be used inlarge scale compared with several other polyelectrolyte removaltechniques including polyelectrolyte titration63 and IEC.64 To dothis, the coacervate was dissolved and complexes were disso-ciated by lowering the pH to the uncomplexing condition pH∼3.5. Ultrafiltration with appropriate MW cutoff (100 kDa) wasthen used to remove polyelectrolyte from the target protein(BLG). After ultrafiltration, SEC analysis (Figure 17) was used to
quantify PDADMAC and BLG in coacervate, retentate, andfiltrate with the results shown in Table 2. The filtrate is foundto contain >95% of the BLG and an essentially negligible amountof polyelectrolyte. These results suggest that ultrafiltration canefficiently remove the polyelectrolyte with little loss of protein, aslong as the sizes of the PE and protein differ significantly.
’CONCLUSIONS
Although the pIs of bovine BLG and bovine serum albumin(BSA) are very similar, the negative charge patch on BLGmakes itpossible to separate it from BSA by coacervation with the polyca-tion poly(diallyldimethlammonium chloride) (PDADMAC). Thecrucial selection of pH and ionic strength conditions for selectivecoacervation was guided by phase boundaries for the two proteins,which present the ionic strength dependence of critical pHconditions corresponding to the onset of (1) complexation and(2) coacervation. Significant differences in the shapes of these plotsfor BSA andBLGarise from their different charge anisotropies, bestvisualized by DelPhi. Similar modeling for the two variants of BLGsuggested that the two additional acidic amino acids in the dimerformof BLG-A enhance its negative charge patch, causing it to bindPDADMAC more strongly. This was confirmed qualitatively by acritical pH for PDADMAC complexation lower for BLG-A andquantitatively demonstrated by its larger binding constant mea-sured by ITC. The prediction that this stronger binding of BLG-Awould prevail in a mixture of the two isoforms was tested byPDADMAC coacervation of native BLG, and we obtained a two-fold increase in BLG-A content in a single step. Given the similarityof the two isoforms and the absence of any polymer-bound affinityligand to provide specific protein recognition, the enhancement ofBLG-A coacervation is remarkable. At a practical level, proteinpurification must be followed by removal of the polyelectrolyte,and the feasibility of ultrafiltration was demonstrated.
’AUTHOR INFORMATION
Corresponding Author*E-mail: [email protected].
’ACKNOWLEDGMENT
Support from NSF (grant CBET-0966923) is acknowledged.We thank Dr. D. Julian McClements for access to the ITCinstrument and Dr. Christophe Schmitt (Nestle, Lausanne,Switzerland) for the gift of BLG samples.
’REFERENCES
(1) Shepard, S. R.; Boyd, G. A.; Schrimsher, J. L. Bioseparation 2001,10, 51.
Table 2. Polymer Removal and BLG Recovery Efficiency of 50 μL Coacervatea
PDADMAC BLG
concn (g/L) volume (mL) total PDADMAC (mg) concn (g/L) volume (mL) total BLG (mg)
coacervate (before UF) 0.86( 0.05 0.60( 0.12 0.52( 0.21 3.17( 0.11 0.60 ( 0.13 1.90( 0.22
retentate 2.11( 0.06 0.30( 0.10 0.63( 0.33 0.27( 0.03 0.30( 0.12 0.08( 0.41
filtrate 0( 0 1.00( 0.4 0( 0 1.78( 0.07 1.00( 0.5 1.78( 0.54aApparent lack of mass balance for PDADMAC results from the large error in integrated areas at low retention times shown in Figure 17.
K dx.doi.org/10.1021/bm101465y |Biomacromolecules XXXX, XXX, 000–000
Biomacromolecules ARTICLE
(2) Nfor, B. K.; Ahamed, T.; van Dedem, G. W. K.; van der Wielen,L. A. M.; van de Sandt, E. J. A. X.; Eppink, M. H. M.; Ottens, M. J. Chem.Technol. Biotechnol. 2008, 83, 124.(3) Chen, J.; Nie, Z.-M.; L€u, Z.-B.; Zhu, C.-G.; Xu, C.-Z.; Jin, Y.-F.;
Wu, X.-F.; Zhang, Y.-Z. Appl. Biochem. Biotechnol. 2007, 141, 149.(4) Kamarck, M. E. Nat. Biotechnol. 2006, 24, 503.(5) Lico, C.; Chen, Q.; Santi, L. J. Cell Physiol. 2008, 216, 366.(6) Dove, A. Nat. Biotechnol. 2002, 20, 777.(7) Kelley, B. Biotechnol. Prog. 2007, 23, 995.(8) Meyer, V. R. Practical High-Performance Liquid Chromatography;
Wiley: Chichester, U.K.,2010.(9) Ghosh, R. J. Chromatogr., A 2002, 952, 13.(10) Fong, B. A.; Wu, W.-Y.; Wood, D. W. Protein Expression Purif.
2009, 66, 198.(11) Simpson, R. J. Purifying Proteins for Proteomics; Cold Spring
Harb Protoc, Cold Spring Harbor Laboratory Press: Cold SpringHarbor, NY, 2006; Appendix 3.(12) Izumrudov, V.; Galaev, I.; Mattiasson, B. Bioseparation. 1998,
7, 207.(13) Boeris, V.; Spelzini, D.; Salgado, J. P.; Pic�o, G.; Romanini, D.;
Farruggia, B. Biochim. Biophys. Acta 2008, 1780, 1032.(14) Zhang, C.; Lillie, R.; Cotter, J.; Vaughan, D. J. Chromatogr., A
2005, 1069, 107.(15) Peram, T.; McDonald, P.; Carter-Franklin, J.; Fahrner, R.
Biotechnol. Prog. 2010, 26, 1322.(16) Scopes, K. R. Protein Purification: Principles and Practice, 3rd ed.;
Springer-Verlag: New York, 1994; p 71.(17) Boeris, V.; Romanini, D.; Farruggia, B.; Pic�o, G. Process
Biochem. 2009, 44, 588.(18) Braia, M.; Porfiri, M. C.; Farruggia, B.; Pic�o, G.; Romanini, D.
J. Chromatogr., B 2008, 873, 139.(19) Holler, C.; Vaughan, D.; Zhang, C. J. Chromatogr., A 2007,
1142, 98.(20) Holler, C.; Zhang, C. Biotechnol. Bioeng. 2008, 99, 902.(21) Dubin, P. L.; Gao, J.;Mattison, K. Sep. Purif.Methods 1994, 23, 1.(22) Kaibara, K.; Okazaki, T.; Bohidar, H. B.; Dubin, P. L. Bioma-
cromolecules 2000, 1, 100.(23) Xia, J.; Mattison, K.; Romano, V.; Dubin, P. L.; Muhoberac,
B. B. Biopolymers 1997, 41, 359.(24) Kayitmazer, A. B.; Shaw, D.; Dubin, P. L.Macromolecules 2005,
38, 5198.(25) Mattison, K. W.; Dubin, P. L.; Brittain, I. J. J. Phys. Chem. B
1998, 102, 3830.(26) Hattori, T.; Hallberg, R.; Dubin, P. L. Langmuir. 2000, 16, 9738.(27) Mattison, K. W.; Brittain, I. J.; Dubin, P. L. Biotechnol. Prog.
1995, 11, 632.(28) Xia, J.; Dubin, P. L.; Morishima, Y.; Sato, T.; Muhoberac, B. B.
Biopolymers 1995, 35, 411.(29) Kayitmazer, A. B.; Bohidar, H. B.; Mattison, K. W.; Bose, A.;
Sarkar, J.; Hashidzume, A.; Russo, P. S.; Jaeger, W.; Dubin, P. L. SoftMatter 2007, 3, 1064.(30) Seyrek, E.; Dubin, P. L.; Tribet, C.; Gamble, E. A. Biomacro-
molecules 2003, 4, 273.(31) Turgeon, S. L.; Schmitt, C.; Sanchez, C. Curr. Opin. Colloid
Interface Sci. 2007, 12, 166.(32) Bohidar, H.; Dubin, P. L.; Majhi, P. R.; Tribet, C.; Jaeger, W.
Biomacromolecules 2005, 6, 1573.(33) Kayitmazer, A. B.; Strand, S. P.; Tribet, C.; Jaeger, W.; Dubin,
P. L. Biomacromolecules 2007, 8, 3568.(34) Lee, W.-C.; Lee, K. H. Anal. Biochem. 2004, 324, 1.(35) Hedhammar, M.; Gr€aslund, T.; Hober, S. Chem. Eng. Technol.
2005, 28, 1315.(36) Yamamoto, S. Chem. Eng. Technol. 2005, 28, 1387.(37) Yamamoto, S.; Ishihara, T. J. Chromatogr., A 1999, 852, 31.(38) Ye, X.; Yoshida, S.; Ng, T. B. Int. J. Biochem. Cell Biol. 2000,
32, 1143.(39) Mollerup, J. M.; Hansen, T. B.; Kidal, S.; Sejergaard, L.; Staby,
A. Fluid Phase. Equilib. 2007, 261, 133.
(40) Grymonpr�e, K. R.; Staggemeier, B. A.; Dubin, P. L.; Mattison,K. W. Biomacromolecules 2001, 2, 422.
(41) Seyrek, E.; Dubin, P. L.; Henriksen, J. Biopolymers. 2007,86, 249.
(42) Antonov, M.; Mazzawi, M.; Dubin, P. L. Biomacromolecules2009, 11, 51.
(43) Wang, Y.; Gao, J. Y.; Dubin, P. L. Biotechnol. Prog. 1996, 12, 356.(44) Dautzenberg, H.; G€ornitz, E.; Jaeger, W.Macromol. Chem. Phys.
1998, 199, 1561.(45) Tomme, P.; Creagh, A. L.; Kilburn, D. G.; Haynes, C. A.
Biochemistry 1996, 35, 13885.(46) Girard, M.; Turgeon, S. L.; Gauthier, S. F. J. Agric. Food Chem.
2003, 51, 4450.(47) McGhee, J. D.; von Hippel, P. H. J. Mol. Biol. 1974, 86, 469.(48) Nicholls, A.; Honig, B. J. Comput. Chem. 1991, 12, 435 .(49) Tanford, C.; Kirkwood, J. G. J. Am. Chem. Soc. 1957, 79, 5333.(50) Tanford, C.; Swanson, S. A.; Shore, W. S. J. Am. Chem. Soc.
1955, 77, 6414.(51) Nozaki, Y.; Bunville, L. G.; Tanford, C. J. Am. Chem. Soc. 1959,
81, 5523.(52) Hattori, T.; Kimura, K.; Seyrek, E.; Dubin, P. L. Anal. Biochem.
2001, 295, 158.(53) Hattori, T.; Bat-Aldar, S.; Kato, R.; Bohidar, H. B.; Dubin, P. L.
Anal. Biochem. 2005, 342, 229.(54) Dong, A.; Matsuura, J.; Allison, S. D.; Chrisman, E.; Manning,
M. C.; Carpenter, J. F. Biochemistry 1996, 35, 1450.(55) Huang, X. L.; Catignani, G. L.; Swaisgood, H. E. J. Agric. Food
Chem. 1994, 42, 1276.(56) Majhi, P. R.; Ganta, R. R.; Vanam, R. P.; Seyrek, E.; Giger, K.;
Dubin, P. L. Langmuir 2006, 22, 9150.(57) Vanam, R. P. Thesis, Purdue Univeristy, 2004.(58) Lin, F.-Y.; Chen, C.-S.; Chen, W.-Y.; Yamamoto, S.
J. Chromatogr., A 2001, 912, 281.(59) Sperber, B. L. H. M.; Cohen Stuart, M. A.; Schols, H. A.;
Voragen, A. G. J.; Norde, W. Biomacromolecules 2010, 11, 3578.(60) Harnsilawat, T.; Pongsawatmanit, R.; McClements, D. J. Food
Hydrocolloids 2006, 20, 577.(61) Aberkane, L. l.; Jasniewski, J.; Gaiani, C.; Scher, J. l.; Sanchez, C.
Langmuir 2010, 26, 12523.(62) Kasperchik, V. P.; Yaskevich, A. L.; Bil’dyukevich, A. V.Colloid J.
2003, 65, 579.(63) Parazak, D. P.; Burkhardt, C. W.; McCarthy, K. J. Anal. Chem.
1987, 59, 1444.(64) McDonald, P.; Victa, C.; Carter-Franklin, J. N.; Fahrner, R.
Biotechnol. Bioeng. 2009, 102, 1141.