protein oxidation biomolecule capping on nanoparticle ... · s3 an emission wavelength of 340 nm at...
TRANSCRIPT
S1
Electronical Supporting Information
Protein Capped Nanosilver Free Radical Oxidation: Role of the
Biomolecule Capping on Nanoparticle Colloidal Stability and
Protein Oxidation
Manuel Ahumada,a,b* Cornelia Bohne,c Jessy Oake,c and Emilio I. Alarcona,d*
aDivision of Cardiac Surgery Research, University of Ottawa Heart Institute, 40 Ruskin Street, Ottawa,
Canada. bCentro de Nanotecnología Aplicada, Facultad de Ciencias, Universidad Mayor, Camino La
Piramide 5750, Huechuraba, Región Metropolitana, 8580745, Chile. cDepartment of Chemistry, University
of Victoria, Victoria, BC, Canada. dDepartment of Biochemistry, Microbiology, and Immunology, Faculty
of Medicine, University of Ottawa, Ottawa, Canada.
Corresponding Authors
*E-mail: [email protected]; [email protected]
Page S1. This page
Page S2. Experimental methods
Page S6. Figure S1
Page S7. Figure S2
Page S8. Figure S3
Page S9. Figure S4
Page S10. Table ANOVA 1
Page S11. Estimation of proteins bound to nanoparticles
Page S13. Figure S5
Page S14. Figure S6
Page S15. Figure S7
Page S16. References
Electronic Supplementary Material (ESI) for ChemComm.This journal is © The Royal Society of Chemistry 2018

S2
EXPERIMENTAL METHODS
Chemicals and reagents
Silver nitrate (AgNO3), trisodium citrate, 2-hydroxy-1-[4-(2-hydroxyethoxy)phenyl]- 2-
methyl-1-propanone (I-2959), human serum albumin (HSA), 2,2’-azobis(2-
methylpropionamidine) dihydrochloride (AAPH), sodium chloride (NaCl) were
purchased and used as received from Sigma-Aldrich. All solutions were prepared using
Milli-Q water.
Synthesis of citrate capped AgNPs, HSA and radical incorporation
Citrate capped AgNPs were prepared using a similar method as described in the
literature.1-3 Briefly, a deoxygenated (30 min N2) aqueous solution containing 0.2 mM
AgNO3, 0.2 mM I-2959, and 1.0 mM sodium citrate was irradiated with UVA light (8
lamps, in a Luzchem LZC-4 photoreactor at 25.0 ± 0.5°C) for 30 min. Yellow translucent
solutions were obtained in all cases and the solutions were kept at room temperature
protected from light. For the AgNPs-HSA solutions, a 1:1 v/v mix solution with final
concentrations of ≈ 40 nM AgNPs and 1 to 50 µM HSA were prepared. Once mixed, the
solutions were pre-incubated overnight at 4°C. Peroxyl radicals were generated in
solution by using a 10 mM final concentration of AAPH (0.6 M stock solution) at 37°C.
UV-Vis spectra and kinetics measurements
The plasmon absorption band was followed throughout the absorbance spectra at 37°C
in a Libra S50 UV-Vis spectrophotometer (Biochrom, Cambridge, UK). Kinetics were
performed following the maximum absorption wavelength of each sample (please refer to
Fig. 1A and Fig. 2B).
Tryptophan fluorescence and quenching by AgNP or AAPH addition
The evaluation of Tryptophan 214 (Trp-214; the only Trp residue in HSA) fluorescence
was performed in a Shimadzu RF-5301 PC spectrofluorometer (Kyoto, Japan).
Fluorescence spectra were obtained using an excitation wavelength of 295 nm, while
quenching of Trp fluorescence upon AgNPs (≈ 1 to 16 nM) incorporation was followed at

S3
an emission wavelength of 340 nm at room temperature. The same parameters were used
to measured Trp fluorescence quenching by AAPH addition (10 mM) in a Perkin Elmer
LS 55 spectrofluorometer (Massachusetts, USA), the fluorescence intensities were
followed by up to 2 h at 37°C. In both cases, experiments were carry out in triplicate.
Corrections for inner filter effect absorption from the nanoparticle surface plasmon band
were carried out by correcting the emission using the equation:
Fcorr=Fobsx10^[(A295+A340)/2]
where Fcorr and Fobs correspond to the corrected and uncorrected fluorescence,
respectively, and A295 and A340 are the compound absorbances at the corresponding
wavelengths.
Physical separation by ultracentrifugation
Ultracentrifugation separations were performed in a Beckman L8M Ultracentrifuge
(Beckman Coulter, Inc. USA). Samples solutions (≈12 mL) were centrifuged by 3 h at
40,000 rpm at room temperature. Presence of protein, AgNP, and AgNP-HSA complex in
the supernatant were determined by UV-vis and Trp fluorescence (excitation 295 nm,
emission 340 nm).
Stopped-flow measurements
An Applied Photophysics SX20 stopped-flow system was used to measure the change
in absorbance (l = 1.0 cm) of the nanoparticle when mixing with the AAPH. The kinetics
was measured at the wavelength maximum of the AgNp-HSA solution. The experimental
temperature was maintained at 37°C with a Lauda RC6 water bath. The solutions were
allowed to equilibrate to the temperature of the water bath for 10 min after loading the
syringes and before the solutions were mixed. The AgNp-HSA and AAPH solutions were
mixed in a 1:1 ratio (dead time = 1 ms). This mixing resulted in a dilution by half of the
initial concentrations, leading to a final concentration on AgNPs of ≈ 20 nM, 1 to 50 µM
of HSA and 10 mM of AAPH or NaCl (depending on the experiments).
Hydrodynamic sizes and zeta potential measurements
Changes in hydrodynamic sizes and zeta potential for citrate@AgNPs and AgNPs-HSA

S4
solutions before and after (2 h) addition of AAPH were carried out in a Malvern Zetasizer
Nano ZS at 20°C in 1.0 cm pathlength disposable plastic cuvettes. Reported values
correspond to the average of three independent batches, each measured in triplicate.
Transmission electron microscopy (TEM)
Samples for transmission electron microscopy were prepared by delivering ~5.0 μL of a
fresh 1/10th diluted samples on Formvar coated copper-carbon grids (400 mesh) and dried
in a vacuum system for 72h. Electron microscopy images were obtained using a FEI
Tecnai G2 F20 TEM operating with an acceleration voltage of 75 kV.
HSA oxidation profile evaluation
All the assays for the evaluation of the protein oxidation profile were carried out after
an overnight incubation of the reactants, where in the case of the oxidation reaction the
measurements were performed after 2 h of incubation time at 37°C with AAPH.
Electrophoresis was performed employing Mini-PROTEAN TGX precast gels from Bio-
rad. 30 μL of a HSA/AgNPs-HSA solution treated, and controls, with AAPH, were
mixed with 10 μL of sodium dodecyl sulphate (SDS, Thermo Scientific). Then, 10 μL of
the respective solution was loaded per well. Precision Plus Protein Dual Color was used
as standard (10 – 250 kD). The samples were run at 80 V for one hour and stained with
EZBlue gel staining reagent from Sigma. For concentrations of reagents please refer to
Fig. 4.
The concentration of reactants employed for oxygen uptake, carbonyl and peroxide
determinations, were 10 µM HSA, ≈ 40 nM AgNPs and 10 mM AAPH. The rate of
oxygen uptake was followed by registering the oxygen concentration as a function of
time by 10 min at 37°C on an Oxygraph System (Hansatech Instruments, UK). Protein
carbonyl concentrations were determined making use of a Protein Carbonyl Colorimetric
Assay Kit (Cayman Chemical, USA). Briefly, protein samples were derivatized using
2,4-dinitrophenylhydrazine. Formation of a Schiff base produces the corresponding
hydrazone that was analyzed spectrophotometrically at 360 nm.
Peroxide concentration determination on proteins was performed using a Pierce™
S5
quantitative peroxide assay kit (Thermo Scientific, USA). This consists of the oxidation
of ferrous to ferric ion in the presence of xylenol orange. Absorbance of the resulting
purple solutions were measured in a Synergy H4 Microplate reader (BioTek, USA) at 560
nm.

S6
Figure S1. Representative TEM image for 1.0 mM citrate protected nanoparticles. Image
obtained using 75 kV acceleration voltage, see experimental.

S7
Figure S2. Absorption spectra for a 10 mM AAPH solution (black line) and AgNP ≈ 40
nM red dashed line for solutions at 37°C.

S8
Figure S3. Surface plasmon band variation in the presence of NaCl (10 mM). [AgNP] ≈
40 nM. Measured at 37°C.

S9
Figure S4. Changes in the intensities of the Trp-214 fluorescence and surface plasmon
band of AgNP by HSA-AgNPs composite formation. Left: Representative change in the
Trp-fluorescence spectra at increasing AgNP concentrations ([HSA] = 10 µM). Inset:
Changes in the tryptophan fluorescence in the presence of AgNP (λex = 295 nm and λem =
340 nm) plotted as relative fluorescence intensity vs. AgNPs concentration (data
correspond to the average of 3 independent experiments). Fluorescence emission was
corrected for the inner filter effect, see SI. Right: Nanosilver SPB spectra for AgNPs-
protein system at different HSA concentrations ([AgNP] = 40 nM). All measurements
were carried out at 37°C in triplicate.

S10
Table ANOVA 1 Comparison of t50 values for changes in AgNPs SPB obtained at
different concentrations of human serum albumin incubated with 10 mM AAPH, between
tree different groups.
Source Degree
Freedom
Sum of
Squares
Mean
Square
F P
Model 2 0.44835 0.22418 2.40973 0.10135
Error 45 4.186 0.09303
Total 47 4.6346

S11
Estimation of proteins bound to nanoparticles
The concentration of AgNPs was estimated as previously described by Alarcon et
al.4 Using this method, at 200 µM of silver ion the concentration of AgNPs is ≈ 80 nM
(in the present work, [AgNP] was 40 nM). Thus, the ratio between the protein (assuming
all protein is bounded) and nanoparticle concentration give a final estimation of the
number of protein units per nanoparticle. As example, at 1 µM HSA:
[HSA]/[AgNP] = 1 x 10⁻⁶ / 0.04 x 10-6 = 23 protein/nanoparticle
while for 50 µM HSA:
[HSA]/[AgNP] = 50 x 10-6 / 0.04 x 10-6 = 1,250 protein/nanoparticle
Geometrical considerations
The estimation above only considers the total number of proteins and
nanoparticles, without considering the available surface and limitations due to steric
interactions. Thus, to provide an estimate of the number of proteins that can interact with
the nanoparticle available surface, we developed a simplified geometrical model, which
does not consider the interaction between proteins (see Scheme S1). In this model, we
assumed that the volume of a single nanoparticle is 1/3 of the volume of a single protein.
As the individual sizes of the nanosilver and protein are known trough dynamic light
scattering measurements (Table 1, main text), the values of the radius of the nanoparticle
(a) and the radius of the protein (b) can be established. Further, we assume the following
limitations to the system: the minimum distance between two proteins (c), corresponds to
2 times the radius of the protein (b, i.e. no overlapping of proteins occurs). The second
limitation is that the numbers of proteins are fixed for each system.
S12
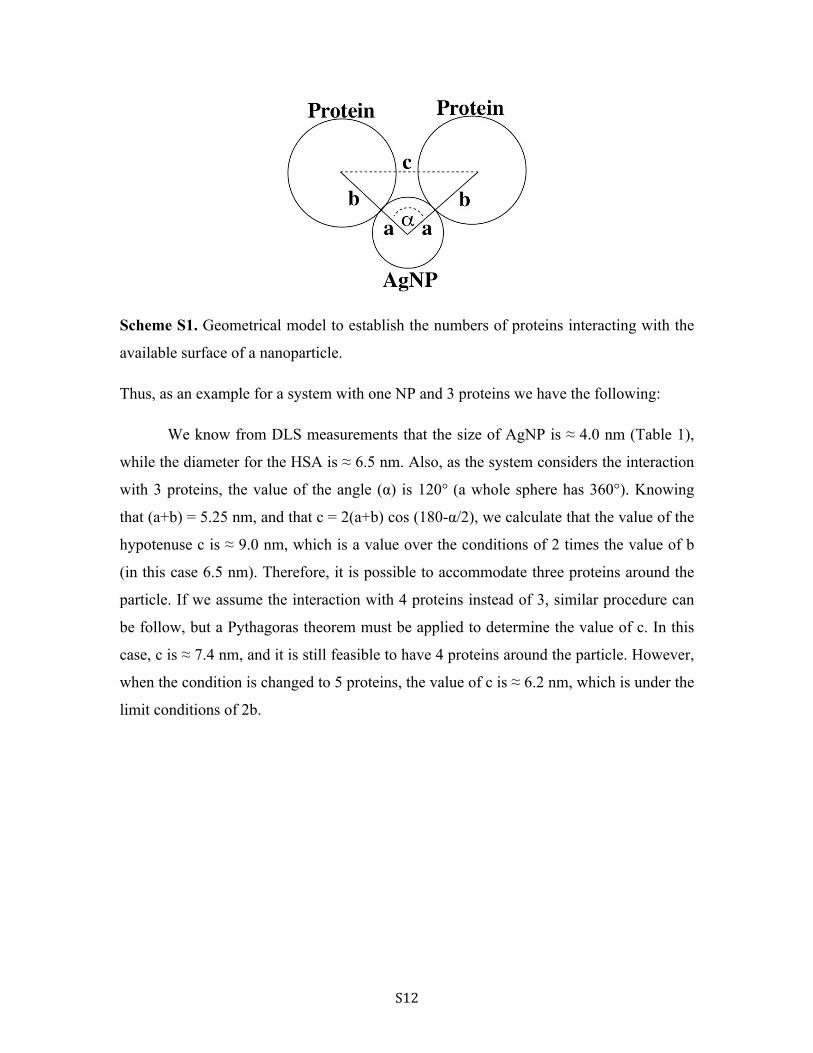
Scheme S1. Geometrical model to establish the numbers of proteins interacting with the
available surface of a nanoparticle.
Thus, as an example for a system with one NP and 3 proteins we have the following:
We know from DLS measurements that the size of AgNP is ≈ 4.0 nm (Table 1),
while the diameter for the HSA is ≈ 6.5 nm. Also, as the system considers the interaction
with 3 proteins, the value of the angle (α) is 120° (a whole sphere has 360°). Knowing
that (a+b) = 5.25 nm, and that c = 2(a+b) cos (180-α/2), we calculate that the value of the
hypotenuse c is ≈ 9.0 nm, which is a value over the conditions of 2 times the value of b
(in this case 6.5 nm). Therefore, it is possible to accommodate three proteins around the
particle. If we assume the interaction with 4 proteins instead of 3, similar procedure can
be follow, but a Pythagoras theorem must be applied to determine the value of c. In this
case, c is ≈ 7.4 nm, and it is still feasible to have 4 proteins around the particle. However,
when the condition is changed to 5 proteins, the value of c is ≈ 6.2 nm, which is under the
limit conditions of 2b.

S13
Figure S5. Oxidation profile for HSA in the presence/absence of AgNP. Left: Trp
fluorescence intensity change in the presence of peroxyl radicals (10 mM AAPH) with
and without AgNP (40 nM). Inset:Trp fluorescence deactivation measured under the
same experimental conditions. Experiments were carried out for 2 h, at 37°C; λex=295
nm and λem=340 nm (n=3). Right: Selected protein oxidation markers: Peroxides,
carbonyl, and oxygen consumption. [HSA] = 10 µM; [AgNP] ≈ 40 nM and [AAPH] = 10
mM. Oxidation reaction was carried out for 2 h at 37°C. Values reported corresponds to
three independent measurements. *Non-detected.

S14
Figure S6. Representative image for a SDS-electrophoresis experiment. Lanes from 2 to
5 correspond to samples containing human serum albumin. (1) Molecular weight standard
(10 - 250 kD); (2) HSA 1 µM; (3) HSA 1 µM + AAPH; (4) HSA 1 µM + AgNP; and (5)
HSA 1 µM + AgNP + AAPH. The concentrations in all cases were: 40 nM for [AgNP]
and 10 mM for[AAPH]. The gel was run for 1 h at 80 V, posterior staining was
performed with EZblue gel staining and pictures captured in a FluorChem IS-8900
(Alpha Innotech, USA).

S15
Figure S7. Oxygen consumption plots for the nanosilver-protein composite (black) and
its individual components (colored) by the reaction with peroxyl radicals, see Scheme 1
main text, in the presence of catalase. The orange arrow indicates the time of catalase
(100 U/mL) addition to the solutions. [AAPH] 10 mM; [HSA] 50 µM; and [AgNP] 40
nM. Note that the oxygen uptake “jump” in presence of catalase was only observed for
the composite nanosilver-protein. Measurements were carried out at 37°C in triplicate.
S16
References
1. E. I. Alarcon, K. Udekwu, M. Skog, N. L. Pacioni, K. G. Stamplecoskie, M.
Gonzalez-Bejar, N. Polisetti, A. Wickham, A. Richter-Dahlfors, M. Griffith, J. Scaiano,
Biomater. 2012, 33, 4947-56.
2. S. Jockusch, M. Landis, B. Freiermuth, N. J. Turro, Macromol. 2001, 34, 1619-
1626.
3. K. G. Stamplecoskie, J. Scaiano, J. Am. Chem. Soc. 2010, 132, 1825-1827.
4. E. I. Alarcon, K. I. Udekwu, C. W. Noel, L. B. P. Gagnon, P. K. Taylor, B.
Vulesevic, M. J. Simpson, S. Gkotzis, M. M. Islam, C. -J. Lee, A. Richter-Dahlfors, T.-F
Mah, E. J. Suuronen, J. Scaiano, M. Griffith, Nanoscale 2015, 18789-98.