protein for allivpi.in/uploads/2/0/4/3/20436843/protein_for_all.pdf · · 2017-10-26protein for...
TRANSCRIPT

Protein For All Dr. Pawan Kumar,
Consultant, USSEC
East & North India, Nepal,

USSEC INTRODUCTION
We Represent
U S farmers
U S Industry
U S Department of Agriculture
We work on finding new applications of soy & Implement in
market
We do marketing of Soy and establish trade linkage wherever
demand exist

USSEC MEMBERS
Knewtson Soy Products

•To See Every Indian Healthy
• To
•Our expense on treatment should reduce
•Life expectancy should be at par with
best
•Working life -70 years
Why
Protein For All

•To See Every Indian Healthy
• To
•Our expense on treatment should reduce
•Life expectancy should be at par with
best
•Working life -70 years
• Do you know your Protein requirement
• Do you know how much protein you are consuming

•To See Every Indian Healthy
• To
•Our expense on treatment should reduce
•Life expectancy should be at par with
best
•Working life -70 years
Be a part Of This Campaign
1. To See every Indian Healthy 2. To Increase Life expectancy to 85 Years 3. To extend Working life to 70 Years
1. We want to educate every Indian- what is healthy diet
2. How Protein is so Important to achieve a long healthy life

News &
Views

News &
Views

News &
Views

News &
Views

News &
Views

News &
Views

News &
Views

News &
Views

The times of India
27th July 2017
Mumbai edition
Very few people healthy
Those healthy –for very short period in life
Celebrity of family is protein
deficient
Very poor education on nutrition at school level

We know protein is important
We eat protein to resynthesize 100’s protein
Used to produce hormone, enzyme,
neurotransmitters, co enzyme, co factors
To carry out vital functions of body
Importance of protein

Our body requires protein
Tissue repair
Construction of new cells
Every cell need different type of protein to maintain
life/ cellular integrity
To replace worn out and dead cells Example:
WBC in 4-20 days
Cells in GIT and platelets in 4 hrs
Skin cells replaced on 24 days
To maintain beauty
Collagen keeps muscle binded and in strong integrity
Importance of protein

We need regular supply of Protein to our body
Our body has no specialized cells to store
protein/amino acid in body
Importance of protein

Digestible Protein requirement: 32.7 MMT Availability of digestible protein for human Consumption
for human consumption To
PROTEIN Demand
& Supply
Rice 2.8
Wheat 5.22
Pulses 3.38
Milk 6.28
Chicken 1.89
Egg 0.61
Fish 2.09
Others 0.5
Total 22.77MMT
India Availability 48gms
World average 77gms
Developed Countries
103gms

43gms/day-against 70gms
Poorest 30% Get only38%
Balance 16.23 MMT-against 26.16MMT
62% availability for 80% Population
Available 22.77 MT
20% Population 6.54 MMT
Protein
Distribution

Country Life
E
Rank
Monaco 89.5 1
Japan 85 2
Singapore 84.95 3
Hong Kong 82.44 8
Italy 82.2 10
Canada 81.85 13
France 81.68 14
USA 79 53
Sri Lanka 76,75 90
Bangladesh 71.23 154
India 68.45 167
Nepal 67.86 168
Pakistan 67.73 169
Best is Asia-Optimum Protein
& optimum fat consumption
Europe and USA are good
They consume high protein
& high fat
India Poor- High energy and
low protein
There are 39
Countries With life
expectancy of
above 80 years
Life Expectancy
And Protein Intake

Country Life
E
Rank
Monaco 89.5 1
Japan 85 2
Singapore 84.95 3
Hong Kong 82.44 8
Italy 82.2 10
Canada 81.85 13
France 81.68 14
USA 79 53
Sri Lanka 76,75 90
Bangladesh 71.23 154
India 68.45 167
Nepal 67.86 168
Pakistan 67.73 169
Country Life
E
Rank
Japan 91.58 1
Singapore 91.55 2
Monaco 87.8 3
Hong Kong 84.16 9
Italy 84.5 11
Canada 83.91 13
France 83.83 15
USA 83.09 40
Sri Lanka ? ?
Bangladesh ? ?
India ? ?
Nepal ? ?
Pakistan ? ?
Our will power
Will decide
where
We
go
2016 Vs
2050
Expected Life
Expectancy

Country Life
E
Rank
Monaco 89.5 1
Japan 85 2
Singapore 84.95 3
Hong Kong 82.44 8
Italy 82.2 10
Canada 81.85 13
France 81.68 14
USA 79 53
Sri Lanka 76,75 90
Bangladesh 71.23 154
India 68.45 167
Nepal 67.86 168
Pakistan 67.73 169
Country Life
E
Rank
Japan 91.58 1
Singapore 91.55 2
Monaco 87.8 3
Hong Kong 84.16 9
Italy 84.5 11
Canada 83.91 13
France 83.83 15
USA 83.09 40
Sri Lanka ? ?
Bangladesh ? ?
India ? ?
Nepal ? ?
Pakistan ? ?
Our will power
Will decide
where
We
go
2016 Vs
2050
Expected Life
Expectancy
85
years

In late 19th century Netherland people were short in height. Today their average height is 183cm (Reported by Yvonne et.al.)
In 19th century In England Height difference between youth from upper class and lower class was 22cms. (Reported by Komlos)
In India –Average height is more in area where milk consumption is high and the area where fish consumption is high
Height
And Protein Intake

India: We are on 12th Rank from bottom
Male—166.3cm Female—152.6cm
Vietnam, Sri Lanka, Bolivia, Bahrain, Iraq, Guatemala, North Korea, Malawi, Nepal, Philippines, Indonesia
22% babies are born with weight less than 2.5 kg (NIN)- we loose height right from mother womb.
Height Of
Indian

Protein Consumption
Vs Health of Society
Rank Country Protein
Intake
Gold Silver Bronze Total
1 U S A 42.01 46 37 38 121
2 China 22.24 26 18 26 70
3 Britain 33.06 27 23 17 67
4 Russia 27.3 19 18 19 56
5 Germany 33.04 17 10 15 42
6 France 37.38 10 18 14 42
7 Japan 26.85 12 8 21 41
8 Australia 41.5 8 11 10 29
9 Italy 36.34 8 12 8 28
10 South Korea 27.21 9 3 9 21
67 India 15.1 0 1 1 2
Medal tally Rio
Olympic 2016

Source Protein/
100gms
PDCAS
Egg 13 100
Chicken 27 96
Shrimp 24 96
Mutton 27 92
Fish 22 96
Milk 4 98
Curd 5 98
Paneer
(Cottage
Cheese)
23 96
Source Protein/
100gms
PDCAS
Dal 22 73
Chana 19 73
Rajma 23 73
Soy Badi 52 95
Soy flour 52 95
tofu 14 95
Rice 8 47
Wheat 11 48
Protein Sources
Animal Sources Plant Sources

Source Protein/100gms
Rate/kg
Rate/100gms
Cost of 100 gms of protein
PDCAS
Chicken 27 180 18 69 96
Fish 22 150 15 71 96
Shrimp 24 550 55 238 96
Mutton 27 450 45 180 92
Egg 13 100 10 76 100
Milk 4 44 4 100 98
Curd 5 80 8 160 98
Paneer 23 230 23 120 96
Cost of
Protein

Source Protein/100gms
Rate/kg
Rate/100gms
Cost of 100 gms of protein
PDCAS
Dal 22 100 10 62 73
Chana 19 80 8 57 73
Rajma 23 120 12 71 73
Soy Badi 52 150 11 29 95
Soy flour 52 70 7 14 95
tofu 14 120 12 89 95
Rice 8 35 3.5 93 47
Wheat 11 22 2.2 43 478
Cereal is expensive Least expensive
Cost of
Protein

• ONE EGG - 6 G
• GLASS MILK – 8 G
• 2 SLICE BREAD – 4 G
TOTAL – 18G/75G
Monitoring Protein Intake
A person
weigh 75

• 100G ROTI – 6 G
• 100G RICE – 3G
• 100GM CHICKEN –27G
• 75G VEG CURRY – 1G
TOTAL – 37G/75G
So Breakfast + Lunch =
57G/75G
So, Dinner should not
exceed 18g
Monitoring Protein Intake

• 3 ROTI – 6G
• 50G DAL – 8 G
• 100G LADIES FINGER – 1G
• CUP OF CURD – 5 G
TOTAL – 20G/84G So Breakfast + Lunch +
Dinner = 77G/75G
Monitoring Protein Intake
Calculate Protein requirement of entire Family
Cook With measurement
Serve With measurement
Monitoring Protein Intake

•A family of Six member- A couple+ two parents+ two kids
•Assume Husband-70 kg, Wife-58kg, Son-35kg, Doughter-
25kg, Father-70kg, mother-60kg
70+58+52+37+63+48= 328 gms
Wheat flour-30, Rice-40, Egg-5, Pulses-100, Chicken-160,
Vegetables-40, Milk-45, Soy-150
Protein Requirement
of a family

Breakfast- 400gms wheat+eggs 12+vegetable600gms
/28+72=100==12+60+25=97
Lunch-Rice 600gms+ dal 400gms+ Chicken500gms
/24+57+81=16==24+40+80=144
Dinner- 400gms wheat+ vegetable1000gms+ Milk 900ml/
28+36=64== 12+ 25+40=78
Total=326==RM319+cooking cost 50=369
Quantity management
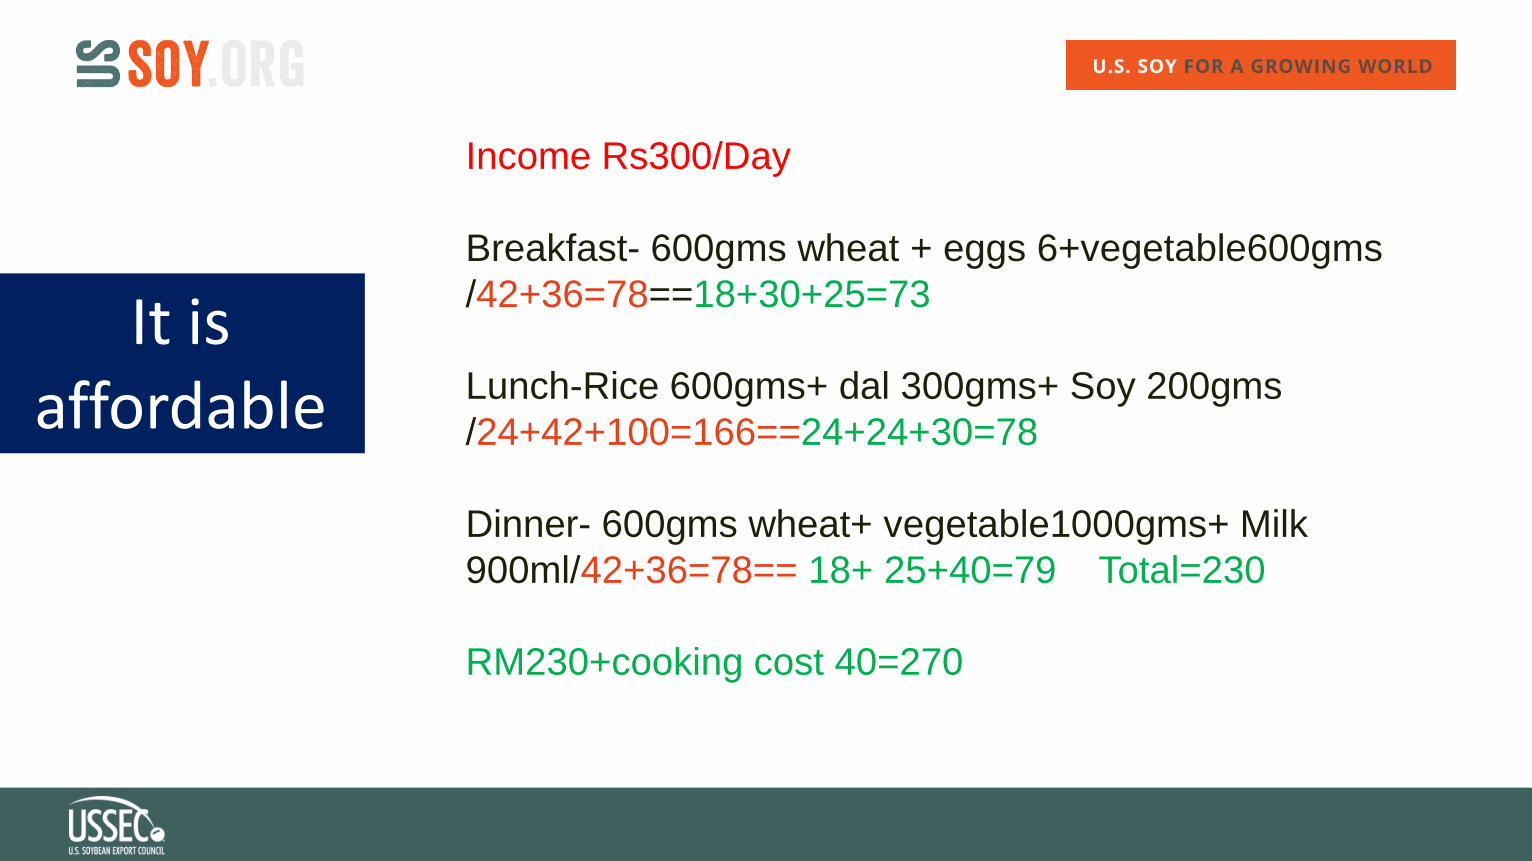
Income Rs300/Day
Breakfast- 600gms wheat + eggs 6+vegetable600gms
/42+36=78==18+30+25=73
Lunch-Rice 600gms+ dal 300gms+ Soy 200gms
/24+42+100=166==24+24+30=78
Dinner- 600gms wheat+ vegetable1000gms+ Milk
900ml/42+36=78== 18+ 25+40=79 Total=230
RM230+cooking cost 40=270
It is affordable

Source Protein/
100gms
PDCAS
Egg 13 100
Chicken 27 96
Shrimp 24 96
Mutton 27 92
Fish 22 96
Milk 4 98
Curd 5 98
Paneer
(Cottage
Cheese)
23 96
Source Protein/
100gms
PDCAS
Dal 22 73
Chana 19 73
Rajma 23 73
Soy Badi 52 95
Soy flour 52 95
tofu 14 95
Rice 8 47
Wheat 11 48
Diet Audit
Animal Sources Plant Sources

While the U.S. Soybean Export Council (USSEC) does not guarantee the forecasts or statements of USSEC Staff or Contractors, we have taken care in
selecting them to represent our organization. We believe they are knowledgeable and their presentations and opinions will provide listeners with detailed
information and valuable insights into the U.S. Soy and U.S. Ag Industry. We welcome further questions and always encourage listeners to seek a wide
array of opinions before making any financial decisions based on the information presented. Accordingly, USSEC will not accept any liability stemming from
the information contained in this presentation.
Thanks !!