protein-energy malnutrition during early gestation in ... · protein-energy malnutrition during...
TRANSCRIPT
J Physiol 590.2 (2012) pp 377–393 377
The
Jou
rnal
of
Phys
iolo
gy
Protein-energy malnutrition during early gestation insheep blunts fetal renal vascular and nephrondevelopment and compromises adult renal function
Louise J. Lloyd1, Thomas Foster1, Phillip Rhodes1, Stewart M. Rhind2 and David S. Gardner1
1School of Veterinary Medicine and Science, University of Nottingham, Sutton Bonington Campus, Loughborough LE12 5RD, UK2The James Hutton Institute, Craigiebuckler, Aberdeen AB15 8QH, UK
Non-technical summary A poor diet during pregnancy has been linked to long-term healthoutcomes for the baby, such as an increased risk of diseases of the heart and kidney. We show inan experimental model that recreates a poor diet during pregnancy, i.e. a diet low in protein withadequate energy, that kidney development in the baby is affected in such a way as to reduce thepotential for new blood vessels to form. This results in a greater number of important, functionalkidney cells spontaneously dying. Later in life, these effects in the kidney manifest as permanentlyreduced kidney function, especially if the baby subsequently becomes overweight as an adult. Theresearch reinforces advice to pregnant mothers about the importance of eating a nutritionallybalanced diet during pregnancy.
Abstract A nutritionally poor maternal diet can reduce nephron endowment and pre-emptpremature expression of markers for chronic renal disease in the offspring. A mechanisticpathway from variation in maternal diet through altered fetal renal development to compromisedadult kidney structure and function with adult-onset obesity has not been described. We showthat maternal protein-energy malnutrition in sheep blunts nephrogenic potential in the 0.44gestation (65 days gestation, term ∼147 days) fetus by increasing apoptosis and decreasingangiogenesis in the nephrogenic zone, effects that were more marked in male fetuses. As adults,the low-protein-exposed sheep had reduced glomerular number and microvascular rarefaction intheir kidneys compensated for, respectively, by glomerular hypertrophy and increased angiogenicsupport. In this study, the long-term mild anatomical deficits in the kidney would have remainedasymptomatic in the lean state, but when superimposed on the broad metabolic challengethat obesity represents then microalbuminuria and blunted bilateral renal function revealeda long-term physiological compromise, that is only predicted to worsen with age. In conclusion,maternal protein-energy malnutrition specifically impacts fetal kidney vascular development andprevents full functionality of the adult kidney being achieved; these residual deficits are pre-dicted to significantly increase the expected incidence of chronic kidney disease in prenatallyundernourished individuals especially when coupled with a Western obesogenic environment.
(Received 6 September 2011; accepted after revision 14 November 2011; first published online 21 November 2011)Corresponding author D. Gardner: School of Veterinary Medicine and Science, University of Nottingham, SuttonBonington Campus, Loughborough LE12 5RD, UK. Email: [email protected]
Abbreviations ACR, albumin:creatinine ratio; CKD, chronic kidney disease; PEM, protein-energy malnutrition;Tc99m-DTPA, technetium−99 diethylenetriaminepentaacetic acid; VEGF, vascular endothelial growth factor.
C© 2012 The Authors. The Journal of Physiology C© 2012 The Physiological Society DOI: 10.1113/jphysiol.2011.220186

378 L. J. Lloyd and others J Physiol 590.2
Introduction
Chronic kidney disease (CKD) is a prevalent, age-related,non-communicable disease in Western societies (Winearls& Glassock, 2009). Obesity (Ejerblad et al. 2006; Cignarelli& Lamacchia, 2007), hypertension (Bakris & Ritz, 2009)and type 2 diabetes (Crook, 2002) compromise renalfunctional reserve and increase the risk of developingCKD. In 2005, 396 million people were obese (Kelly et al.2008); in 2008, 28–35% of the US and UK population werehypertensive (Egan et al. 2010) and with each predictedto significantly increase with time then the global burdenof CKD is a major public health issue. Indeed, stage 5CKD (i.e. end-stage renal disease) is currently increasingat 5–8% per annum, globally costing $70–$75 billion USdollars per annum for dialysis (Lysaght, 2002).
Obesity, hypertension and CKD are conditions virtuallyabsent in hunter–gatherer communities whose diet islargely grain-based, alkaline, low in sodium and thus raw,natural and unrefined (i.e. a Palaeolithic diet) (Eaton &Eaton, 2000), unlike the diet commonly consumed inWesternised societies (Cordain et al. 2005). Dietary change(from a Western toward a Palaeolithic diet), therefore, isprobably the most achievable and potentially importantpreventative factor that could mitigate the inexorablerise in non-communicable disease (Daar et al. 2007;Narayan et al. 2010). Increased focus on diet duringa woman’s (or man’s; Carone et al. 2010; Ng et al.2010) reproductive years, particularly during pregnancyand lactation, has been stimulated by the DevelopmentalOrigins of Health and Disease hypothesis (Barker &Osmond, 1986; Gluckman et al. 2008) where individualvariability in fetal response to maternal malnutrition(reflected as disproportionate growth (Barker et al. 2005)and/or low birth weight (Barker & Osmond, 1988))increases risk of those individuals developing hyper-tension (Huang et al. 2010), coronary dysfunction (Crispiet al. 2010), type 2 diabetes (Whincup et al. 2008)and kidney disease (Woods et al. 2004; Amann et al.2006) later in life. Increased focus on the latter isparticularly pertinent as nephrogenesis is complete byterm in man and non-litter-bearing mammals (Wintour& Moritz, 1997) and is therefore particularly sensitiveand vulnerable to maternal malnutrition. For example,a maternal low-protein, high-glucose or high-fat dietmay reduce nephron endowment (Vehaskari et al. 2001;Nehiri et al. 2008; Tran et al. 2008). Low birth weightinfants have reduced nephron number (Manalich et al.2000), increased glomerular volume (Hoy et al. 2005),increased blood pressure (Brenner et al. 1988; Mackenzie &Brenner, 1995; Keller et al. 2003) and are prone to minimalchange nephrotic syndrome (Teeninga et al. 2008). Ina retrospective analysis of autopsies, individuals withchronic hypertension had significantly fewer nephronsthan the normotensive control group (Keller et al. 2003).
Furthermore, more direct evidence has been collectedfrom a cohort of Dutch individuals exposed to famine,as fetuses, during World War II when mean maternalenergy intake reduced from 6.3 to 3.2 MJ day−1. Asmiddle-aged adults, those individuals exposed to famineduring early gestation vs. those unexposed, had evidence ofprogrammed changes to blood pressure and an increasedincidence of coronary heart disease (Roseboom et al.1999), but also indices of early-stage renal disease suchas microalbuminuria (urinary albumin:creatinine ratio,ACR ≥ 2.5, 12% vs. 7% of sampled cohort; adjusted oddsratio = 3.2, 95% confidence interval 1.4 to 7.7). Thesedelayed developmental effects were not related to size atbirth per se but rather to factors marking the quality of fetalgrowth or maternal macronutrient balance (Roseboomet al. 1999).
Despite small deficits (10–20%) in nephron end-owment, the mammalian kidney has such functionalredundancy that azotaemia only becomes evident at CKDstages 3–5, i.e. a loss of 50–70% glomeruli with glomerularfiltration rate (GFR) declining to <30 ml min−1 (Reilly& Perazella, 2002). Thus, the subtle effect of maternalmalnutrition on nephron endowment (the ‘first-hit’ orBrenners’ hypothesis; Brenner et al. 1988) is unlikely to besolely responsible for compromised adult renal functionbut coupled with the totality of potentially adverseenvironmental effects experienced within an individual’slifetime that may affect renal function, for example higherthan average salt intake, increased dietary acid loadand obesity (i.e. a ‘double-hit’), then healthspan can besignificantly reduced in those prenatally compromisedindividuals (Griffin et al. 2008). A traditional early markerfor incident CKD (i.e. before overt clinical signs pre-sent) is microalbuminuria, which can robustly predictfuture CKD (Fox et al. 2010). A reduced filtration barrier,allowing small amounts of albumin into the urine, isprobably initially due to effacement of the podocyte footprocesses, the integrity of which is supported by a numberof factors, but primarily the key nexus for angiogenesis,vascular endothelial growth factor (VEGF) (Eremina et al.2008). Obesity leads to a tissue-specific increase in VEGF,to support the concomitant local hypoxia (Wood et al.2009) and, in obese sheep, has been shown to be positivelyassociated with increased intra-renal endoplasmic stress, apotential early prognostic marker for CKD (Sharkey et al.2009). The significance of developmental programming inthis context is that it is pleiotrophic; that is, malnutritionduring fetal development may have subtle, individualeffects on nephron complement (reduced), on bloodpressure (increased; Law & Shiell, 1996) and on peripheralinsulin sensitivity (reduced; McMillen & Robinson, 2005)but which in an obesogenic environment may all interactin a combinatorial fashion to markedly increase any under-lying susceptibility to CKD (Nehiri et al. 2008; Simonettiet al. 2008).
C© 2012 The Authors. The Journal of Physiology C© 2012 The Physiological Society

J Physiol 590.2 A low protein diet blunts fetal renal development 379
Epidemiological studies can highlight new andpotentially important aetiologies of a multi-factorialdisease like CKD, but confounding factors and theiroften-retrospective design can mean that the results maynot be as relevant for contemporary societies, in termsof current lifestyle and diet (Huxley et al. 2002). Thus,animal models are essential to demonstrate the biologicalplausibility and mechanistic detail of any potential linkbetween early life and later health. There is a considerablebody of evidence in laboratory rodents and in largeranimals, such as the sheep, that early maternal diet caninfluence renal structure of the adult offspring (McMillen& Robinson, 2005; Ojeda et al. 2008; Moritz et al. 2009;Puddu et al. 2009). Sheep are particularly relevant forsuch studies as the start and end periods of nephrogenesis(meso/metanephros) are virtually identical to man, endingat ∼0.90 gestation (Wintour & Moritz, 1997; Moritz& Wintour, 1999). Prenatal undernutrition of sheepincreases blood pressure and decreases nephron numberof the adolescent offspring (Gilbert et al. 2005), while adouble-hit i.e. juvenile-onset obesity superimposed upona background of fetal undernutrition has been shownby us to result in appreciable increases in systolic anddiastolic blood pressure (∼10 mmHg) with evidence ofrenal dysfunction (Williams et al. 2007).
As yet no study has elucidated a pathway from maternalprotein-energy malnutrition (PEM) through alterations tofetal kidney development (the first-hit) to deficits in renalstructure and function in the adult offspring, especiallyin the context of an adult obesogenic environment (thesecond-hit). This is important with regard to thoseindividuals that may have experienced a degree of PEMin utero but then later in life migrate internally to moreurban, industrialised and affluent areas or for thosethat migrate across international borders to Westernisedcultures. For example, in India, 58% of women ofchild-bearing age are anaemic (haemoglobin <2 SD,normal value 120 g l−1), with ∼20% children (∼110–130million individuals) suffering PEM (WHO, 2011), whilstin the Western world, obesity has increased markedly overthe last 40 years and is predicted to remain high or evenincrease further in the next 20 years (Wang et al. 2011).Hence, we have tested the hypothesis that restriction ofmaternal protein intake during early gestation negativelyimpacts fetal renal development resulting in a reducednephron endowment which, later in life when coupledwith an obesogenic environment, leaves the resultantadult with a structurally and functionally compromisedkidney. Furthermore, we suggest that the developingrenal vasculature is particularly susceptible to maternalprotein-energy malnutrition, especially in males, and mayprovide for the first time a potential mechanistic pathwayfrom variation in maternal diet through sex-specific fetalresponses to the programming of renal disease in theresultant adult.
Methods
Ethical approval
All procedures were performed in accordance with theUK Animals (Scientific Procedures) Act, 1986 and wereapproved by the relevant local ethical review committeesof the James Hutton Institute and the University ofNottingham. The authors have read, and the experimentscomply with, the policies and regulations of The Journalof Physiology given by Drummond (2009). The studywas designed to test the primary hypothesis that amaternal low protein diet would blunt fetal renaldevelopment and therefore compromise renal structureand function in the resulting adult individual. Renalfunctional outcomes are subject to the most measurementerror, and intra-renal transit-time represents an importantvariable that condenses many aspects of adult renalfunction. In our study we had 91% power to detect a20% effect size for renal transit-time in the adult, withat least three male and three female animals per group(3 treatment groups), significance (α) set at 0.05 and thewithin- and between-animal variance of 0.005 and 0.016min, respectively, in a split-plot design.
Animals and experimental design
Thirty-five pregnant Scottish Blackface ewes carryingsingleton fetuses were randomly allocated to one ofthree diet groups fed either a control diet (CP;n = 13) providing adequate protein (180 g kg−1 crudeprotein) and energy (10.6 MJ (kg dry mass (DM))−1;protein:energy ratio 16.9 g kg−1 crude protein per MJDM) from day 0 of gestation to term (term, ∼147 days),or a protein-restricted diet (80 g kg−1 crude protein,9.2 MJ (kg DM)−1, protein:energy ratio 8.7 g kg−1 crudeprotein per MJ DM) during either early (LPE, days 0–65gestation; n = 16) or late gestation (LPL, day 66 to term;n = 6). On an ‘as fed basis’, the diets were isocaloricwith the effective level of protein restriction being 8.7 vs.17 g crude protein MJ ME (metabolic energy). At day 65gestation, chosen to coincide with peak nephrogenesis inthe sheep (Wintour & Moritz, 1997), a proportion of CP(n = 8) and LPE (n = 10) ewes were killed and fetal kidneyssnap-frozen in liquid nitrogen and stored at −80◦C forfurther analysis. The remainder (CP, n = 6; LPE, n = 7;LPL, n = 6) carried to term and the singleton offspringwere delivered naturally. After weaning (10 weeks ofage) the offspring were set to pasture until 1.5 years,at which point they were transferred from The JamesHutton Institute to the University of Nottingham. Aftera brief period of acclimatisation the sheep were exposedto an obesogenic environment, specifically designed toencourage weight gain (i.e. restricted physical activity andfed to 150% ME requirements) as previously described(Rhodes et al. 2009). After 6–7 months (i.e. 2 years of
C© 2012 The Authors. The Journal of Physiology C© 2012 The Physiological Society

380 L. J. Lloyd and others J Physiol 590.2
age) in vivo renography was performed on all animals aspreviously described (Williams et al. 2007). Thereafter allsheep were subsequently killed (electrocortical stunningwith exsanguination) and kidneys either snap-frozen inliquid nitrogen and stored at –80◦C (right kidney) orfixed in neutral buffered formalin (NBF) for 24 h, rinsedin 0.02 M PBS for 24 h and subsequently stored in 70%ethanol at room temperature (left kidney). Urine wassampled from the bladder at post mortem for a spotassessment of the albumin:creatinine ratio.
Renography
In brief, 100 MBq technetium−99 diethylenetri-aminepentaacetic acid (Tc99m-DTPA) was injected(I.V. 0.5 ml−1 0.9% NaCl) in restrained sheep and from60 frames captured over a 20 min period a dynamicrenogram (adjusted for movement artefact, backgroundand bolus deconvolution) was produced for the left andright kidney. Specific measures of interest were time topeak (minutes), upslope (counts per minute) – indicativeof rate of uptake of tracer into the kidney, downslope(counts per minute) – indicative of the rate of tracerclearance and transit-time (minutes) – a composite ofall previous measures. In addition, at 3, 4 and 5 h afterinjection, 5 ml venous blood was drawn, centrifuged and1 ml plasma measured for gamma emission from whichGFR could be accurately determined (Gleadhill et al.1999).
Renal histology and nephron number
Random samples were taken from the NBF-fixed tissues,embedded in paraffin and sectioned at 5 μm (Micro-tome RM2255, Leica) onto polylysine slides. Slide cassetteswere coded to allow for blinded analyses. Sections werestained with haematoxylin and eosin (H&E), periodicacid Schiff’s reagent (PAS) or a trichrome stain asappropriate, using standard histological protocols andmounted onto coverslips with DPX mountant. Randomsections from each treatment group were first examinedby a consultant histopathologist to identify any obviouspathophysiological features such as monocyte infiltration,glomerular interstitial nephritus, glomerulosclerosis orbasement membrane or mesangial cell thickening.Nephron number was estimated by unbiased stereologyaccording to the random fractionator or ‘CavalieriPrinciple’ technique, as previously described (Keller et al.2003). The mean numerical density of glomeruli (N v) wascalculated as:
Nv(glomeruli) =∑
Q −(glomeruli)/A × d
where∑
Q − is the total number of glomeruli counted inthe reference section, d is the distance between the planesand A is the area of the unbiased counting frame. The
results were multiplied by the stereologically estimatedcortex volume, calculated as:
Volume fraction(cortex or medulla)
= number of points
(from grid containing 200 points[20 × 10])
hitting cortex or medulla divided by
number of points hitting the kidney.
Glomerular volume density (V v) was calculated as:
Vv(glomeruli) = no of points hitting glomeruli/
no of points hitting the cortex
Total glomerular volume = Vv(glomeruli)
×cortex volume
Mean glomerular volume = total
glomerular volume/Nv(glomeruli)
Renal immunohistochemistry
Renal sections were analysed for abundance of vascularendothelial growth factor A (VEGFA) (SC-152; Santa CruzBiotechnology, Santa Cruz, USA) and CD34 protein (anendothelial cell marker) (AB81289; Abcam, Cambridge,UK) using an automated BOND-MAX (Leica, UK)system and primary antibodies raised against rabbit. Abiotinylated ABC kit (Vector Labs, Peterborough, UK)was used to visualise VEGFA staining in fetal tissue.Appropriate negative controls were included for theprimary antibody (i.e. no primary included) and fornon-specific binding of the secondary antibody (i.e. usinga rabbit IgG; Vector Labs, Peterborough, UK).
Detection of apoptosis
The presence and extent of apoptotic nuclei wasdetermined using terminal deoxynucleotidyl trans-ferase dUTP nick-end labelling and staining (TUNEL;TdT FragEL Calbiochem, Nottingham, UK) of 5 μmsections according to the manufacturer’s protocol. Inbrief, dewaxed sections were rehydrated and samplespermeabilised with 2 mg ml−1 proteinase K in 10 mM
Tris pH 8 and endogenous peroxidises inactivated with3% H2O2. Samples were equilibrated with 1× TdTequilibration buffer, labelled (TdT Labelling ReactionMix) and incubated at 37◦C for 1.5 h. The reaction wasterminated, samples blocked with buffer and incubatedwith 1× conjugate for 30 min at room temperature.Apoptotic nuclei were detected after 10 min incubationwith Diaminobenzidine buffer. After rinsing (dH2O),the samples were counterstained with methyl green,rehydrated with ethanol, cleared with xylene and mountedwith DPX. Omission of primary antibody was used as anegative control.
C© 2012 The Authors. The Journal of Physiology C© 2012 The Physiological Society

J Physiol 590.2 A low protein diet blunts fetal renal development 381
Table 1. Primer details for quantitative PCR
Primer Sequence 5′–3′ Annealing temp (◦C)
Angiopoietin 1 F GGGTCACACTGGGACAGCAGG 58R TGGGCCACAGGCATCAAACCA
ATF41 F AGATGACCTGGAAACCATGC 52R AGGGGGAAGAGGTTGAAAGA
ATF61 F AACCAGTCCTTGCTGTTGCT 52R CTTCTTCTTGCGGGACTGAC
Bax1 F CAGGATGCATCCACCAAGAAGC 56R TTGAAGTTGCCGTCGGAAAACATT
Beta actin2 F TGTGCGTGACATCAAGGAGAA 55R CGCAGTGGCCATCTCCTG
BMP 7 F GCCACTTCCTCACCGACGCC 58R CAGCTGCAGTCACGGCCTCC
CD681 F GTCCTGCTACCACCACCAGT 52R GCTGGGAACCATTACTCCAA
Cyclophilin F CATACAGGTCCTGGCATCTTGTC 56R TGCCATCCAACCACTCAGTCT
DDIT31 F AGGACCACCAGAGGTCACAC 56R TGCCACTTTCCTTTCGTTTT
bFGF F CTTTCCCGCCCGGCCACTTT 58R GTCGCTCTTCTCGCGGACCC
GAPDH2 F TCCGTTGTGGATCTGACCTG 55R TGCTTCACCACCTTCTTGATCTC
GRP781 F TGAAACTGTGGGAGGTGTCA 52R TCGAAAGTTCCCAGAAGGTG
iNOS F TGATGCAGAAGGCCATGTCA 52R TCTCCCTGTCTCTGTTGCAAAG
MCP-1 F CAAGACCATCCTGGGCAAA 52R GTCCTGGACCCATTTCAGGTT
PDGF F CAAGACGCGCACGGAGGTGT 58R GCGGTTGTTGCAGCAGCCAG
SPARC F CGAGGTACCCGTGGGAGCCA 58R CAAACTCGCCGATGGGGGCA
TGFβ1 F GGAGTTGTGCGGCAGTGGCT 58R AAGGGCCGGTTCATGCCGTG
Thrombospondin F TGCTGTGCGGGCGGAGAAAG 58R TGCCCGCCTTGCCATTGGAG
Tie-2 F CAGCAGACCTCGGAGGCAGGA 58R TGCCCTCTTCAGCTGCAGCATG
VEGFA3 F GGATGTCTACCAGCGCAGC 56R TCTGGGTACTCCTGGAAGATGTC
VEGFR13 F TGGATTTCAGGTGAGCTTGGA 52R TCACCGTGCAAGACAGCTTC
VEGFR23 F CTTCCAGTGGGCTGATGACC 52R GCAACAAACGGCTTTTCATGT
All primers designed using NCBI Primer-BLAST; ATF, activating transcription factor; BMP 7,bone morphogenic protein 7; DDIT3, DNA damage inducible transcript 3; bFGF, basic fibroblastgrowth factor; GAPDH, glyceraldehyde 3-phosphate dehydrogenase; iNOS, inducible nitric oxidesynthase; GRP78, 78 kDa glucose-regulated protein; MCP-1, monocyte chemotactic protein 1;PDGF, platelet-derived growth factor; SPARC, secreted protein, acidic, cysteine-rich; TGFβ-1, trans-forming growth factor β-1; VEGF, vascular endothelial growth factor.
Quantitative PCR
Total RNA was extracted using RNeasy Mini Kit(Qiagen, Crawley, UK) and cDNA synthesised using an
Omniscript reverse transcriptase kit (Qiagen, Crawley,UK). Primers (Eurofins MWG, Ebersberg, Germany) weredesigned using NCBI Primer-BLAST or were as previouslypublished (Table 1). Two micrograms of cDNA were added
C© 2012 The Authors. The Journal of Physiology C© 2012 The Physiological Society
382 L. J. Lloyd and others J Physiol 590.2
to each reaction, and qPCR performed using QuantiTectSYBR Green RT-PCR Kit (Qiagen, Crawley, UK) on aRoche Lightcycler 480. Melt curves were used to confirmreaction specificity, and cyclophilin was confirmed asa suitable housekeeping gene. mRNA quantities werenormalised to cyclophilin using Roche Lightcycler 480advanced relative quantification software.
Statistical analysis
All data were analysed using a General Linear Model(GLM) or general linear mixed model approach whereappropriate (Genstat v13, VSNi, UK) after checkingfor normality (or otherwise) of the error distribution.Data with skewed errors were log transformed beforeanalysis. Estimated marginal means are presented withSEM, SED or 95% CI as indicated, to represent themeasurement error. P ≤ 0.050 was accepted as indicatingstatistical significance. A multivariate linear discriminantanalysis was used to display multiple related outcome
measures (e.g. renography derived values for renalfunction). The linear discriminant analysis generates twolinear vectors from all normalised data (i.e. z-scores forindividual data) that capture <95% variation for allinputted variables and plots these as values on a 2Dplot. The method is an objective means to effectivelydemonstrate statistically significant patterns in complex,non-independent datasets.
Results
Maternal and fetal body composition and growth
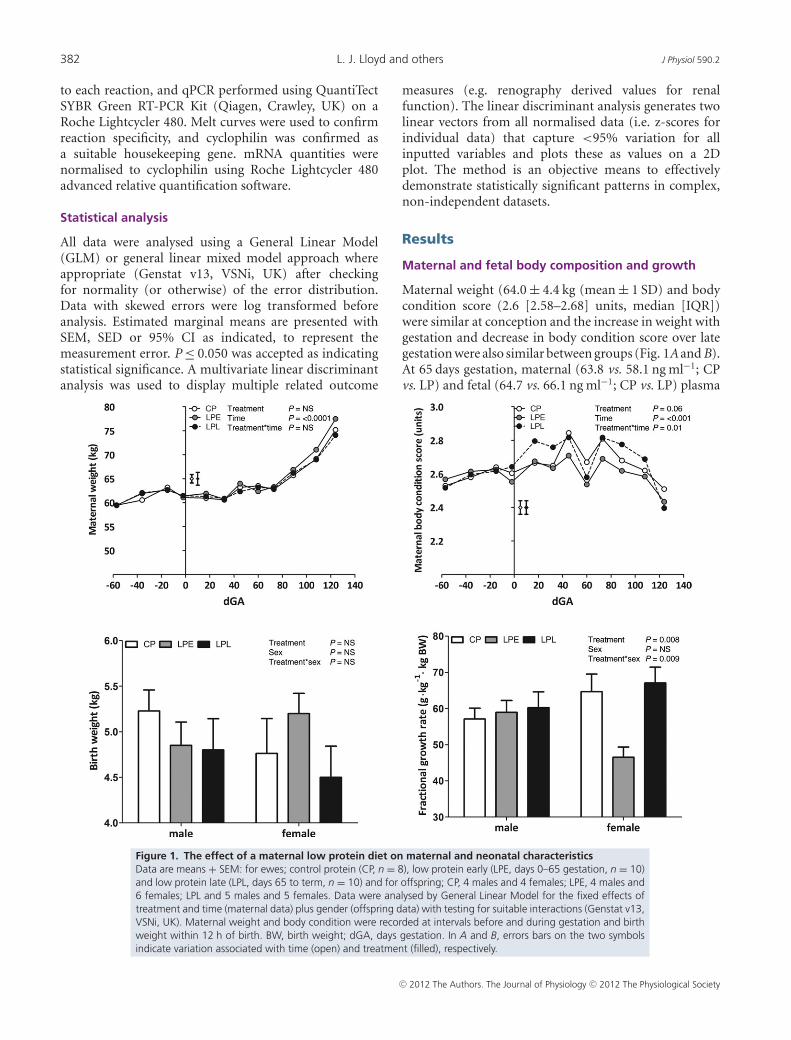
Maternal weight (64.0 ± 4.4 kg (mean ± 1 SD) and bodycondition score (2.6 [2.58–2.68] units, median [IQR])were similar at conception and the increase in weight withgestation and decrease in body condition score over lategestation were also similar between groups (Fig. 1A and B).At 65 days gestation, maternal (63.8 vs. 58.1 ng ml−1; CPvs. LP) and fetal (64.7 vs. 66.1 ng ml−1; CP vs. LP) plasma
Figure 1. The effect of a maternal low protein diet on maternal and neonatal characteristicsData are means + SEM: for ewes; control protein (CP, n = 8), low protein early (LPE, days 0–65 gestation, n = 10)and low protein late (LPL, days 65 to term, n = 10) and for offspring; CP, 4 males and 4 females; LPE, 4 males and6 females; LPL and 5 males and 5 females. Data were analysed by General Linear Model for the fixed effects oftreatment and time (maternal data) plus gender (offspring data) with testing for suitable interactions (Genstat v13,VSNi, UK). Maternal weight and body condition were recorded at intervals before and during gestation and birthweight within 12 h of birth. BW, birth weight; dGA, days gestation. In A and B, errors bars on the two symbolsindicate variation associated with time (open) and treatment (filled), respectively.
C© 2012 The Authors. The Journal of Physiology C© 2012 The Physiological Society
J Physiol 590.2 A low protein diet blunts fetal renal development 383
Table 2. Effect of maternal low protein diet on maternal and fetal weights at 65 days gestation
Sex P value
Treatment Male Female Treatment Sex Treat∗Sex
MaternalLiver (g) CP – 730 ± 25 NS NS NS
LP – 730 ± 35Fetal
Body weight (g) CP 111 ± 4 89 ± 5 NS 0.004 NSLP 110 ± 9 95 ± 3
Brain weight (g) CP 3.46 ± 0.08 3.32 ± 0.15 NS NS NSLP 3.55 ± 0.15 3.52 ± 0.04
Liver weight (g) CP 8.42 ± 0.39 6.92 ± 0.51 NS 0.007 NSLP 9.02 ± 0.37 7.30 ± 0.52
Heart weight (g) CP 0.97 ± 0.08 0.90 ± 0.09 NS 0.04 NSLP 1.17 ± 0.06 0.90 ± 0.07
Lung weight (g) CP 5.32 ± 0.45 4.79 ± 0.79 NS NS NSLP 5.88 ± 0.99 4.76 ± 0.42
Kidney weight (g) CP 1.77 ± 0.22 1.43 ± 0.11 NS 0.09 NSLP 1.66 ± 0.16 1.50 ± 0.07
Data are estimated marginal means ± SEM for ewes (CP, n = 8; LP, n = 10) fed a control protein diet (CPfetuses; male, n = 4; female, n = 4) or a low protein diet to day 65 gestation (LP fetuses; male, n = 4;female, n = 6). Data were analysed by one-way ANOVA for the fixed effects of treatment (controlvs. low protein), sex (male vs. female) or their interaction using Genstat v13 (VSNi, UK). Statisticalsignificance was accepted at P < 0.05, but P = 0.06–0.10 taken to indicate an effect falling close to thearbitrary significance boundary. NS, not significant. CP, control protein diet; LP, low protein diet.
cortisol were not different and after post mortem only sexof the fetus, not maternal diet, had an effect on fetal bodyand organ weights (male > female; Table 2). Birth weightsand neonatal fractional growth rate of singleton male andfemale lambs were not different between diet groups, withthe exception of female lambs exposed to maternal lowprotein during early gestation (LPE), who grew at a lowerdaily rate (Fig. 1C and D).
Fetal kidney angiogenesis and apoptosis at 0.44gestation
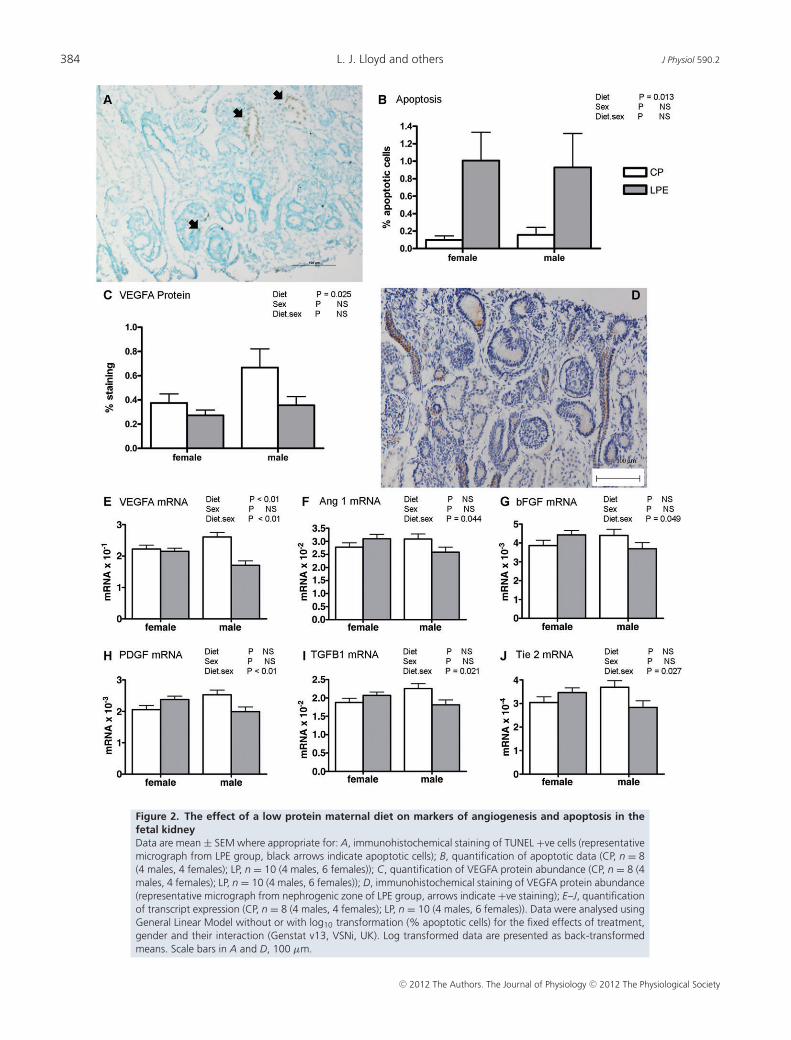
The quantity of immunopositive cells undergoingapoptosis was significantly higher (Fig. 2A and B)and positively stained for VEGFA protein significantly(P = 0.02) lower in the nephrogenic zone of the LPEfetal kidney vs. controls (Fig. 2C and D). In addition,at this time transcript expression for angiogenic markersincluding VEGFA, angiopoietin 1 (ANG1), basic fibroblastgrowth factor (bFGF), platelet-derived growth factor(PDGF), transforming growth factor beta 1 (TGFβ1) andthe Tie-2 receptor were all significantly decreased in maleLPE fetuses only (P < 0.01, treatment × sex interactionfor all cases; Fig. 2E–J). In addition, transcript expressionof VEGFR1 showed a strong trend (P = 0.052) towardsreduced expression in the LPE group in both sexes, relativeto controls (17.8 ± 1.2 vs. 22.3 ± 1.36 × 10⁻³ units).
Adult renal function
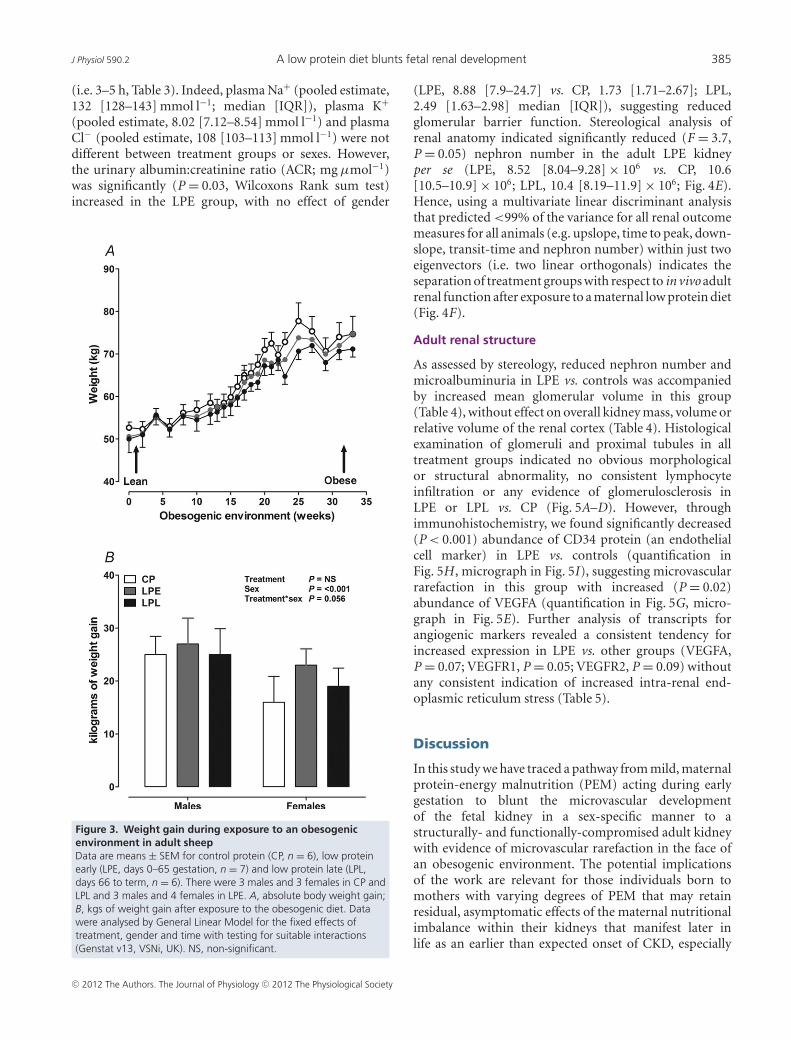
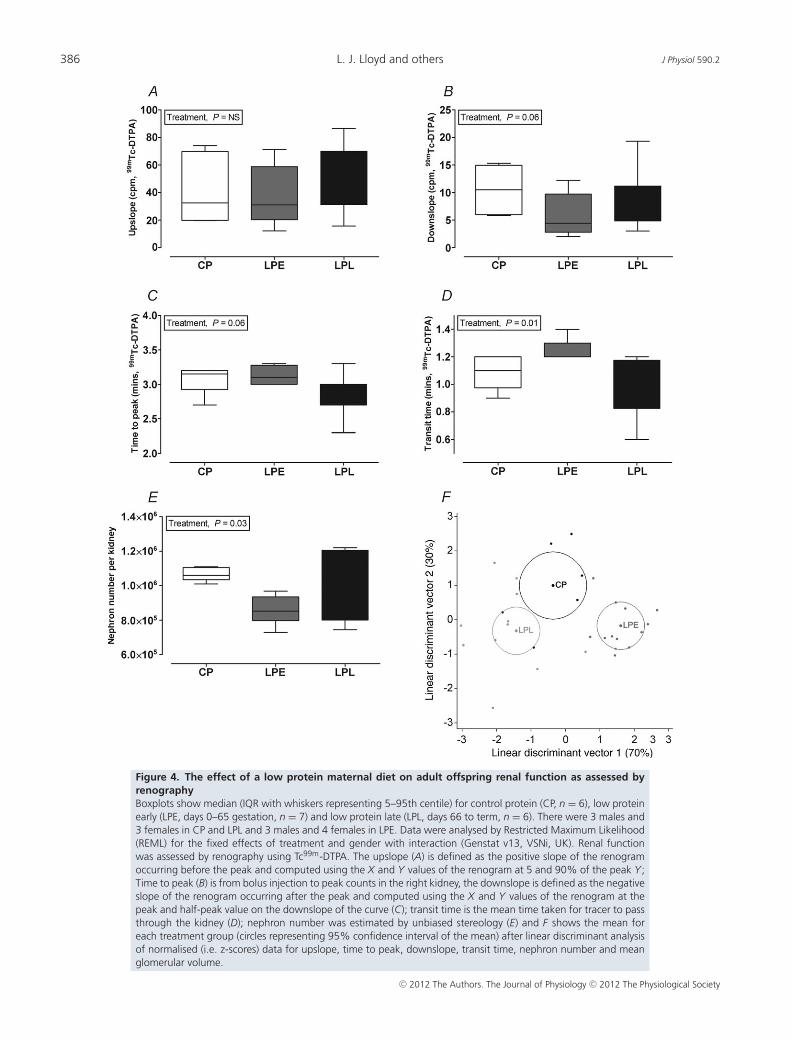
At 1.5 years of age and at a similar weight (47.1 ± 0.7 kg,all animals) the offspring were reared in an obesogenicenvironment to facilitate weight gain and fat depositionto a level considered obese i.e. an 8–10 unit increase intheoretical BMI (weight (kg)/height (m2)) from 22 to 32(Fig. 3A). Offspring gained similar amounts of weight ineach treatment group, but females gained less than males(Fig. 3B). Upon stabilisation of weight (weeks 25–33),all offspring underwent bilateral in vivo renography. Incontrast to fetal life, we observed few treatment × sexinteractions (i.e. an effect specifically in male LPEoffspring) in the adult offspring, but rather revealed withobesity a number of important effects specific to boththe male and female offspring exposed to a maternal lowprotein diet during early gestation (group LPE): relativeto controls, the upslope of the renogram in LPE wasunaffected (Fig. 4A) but all other indices suggested a sub-tle reduction in flow-based renal function; for example,the downslope (indicating clearance of tracer) tended tobe decreased in LPE (Fig. 4B), the time to peak (indicatingrenal uptake of tracer) tended to be increased (Fig. 4C)with renal transit-time, a composite parameter of wholeorgan function, being significantly increased (∼20%)in LPE offspring (Fig. 4D). Measurement of glomerularfiltration rate (GFR), however, indicated preservationof GFR in LPE vs. other groups in the longer term
C© 2012 The Authors. The Journal of Physiology C© 2012 The Physiological Society
384 L. J. Lloyd and others J Physiol 590.2
Figure 2. The effect of a low protein maternal diet on markers of angiogenesis and apoptosis in thefetal kidneyData are mean ± SEM where appropriate for: A, immunohistochemical staining of TUNEL +ve cells (representativemicrograph from LPE group, black arrows indicate apoptotic cells); B, quantification of apoptotic data (CP, n = 8(4 males, 4 females); LP, n = 10 (4 males, 6 females)); C, quantification of VEGFA protein abundance (CP, n = 8 (4males, 4 females); LP, n = 10 (4 males, 6 females)); D, immunohistochemical staining of VEGFA protein abundance(representative micrograph from nephrogenic zone of LPE group, arrows indicate +ve staining); E–J, quantificationof transcript expression (CP, n = 8 (4 males, 4 females); LP, n = 10 (4 males, 6 females)). Data were analysed usingGeneral Linear Model without or with log10 transformation (% apoptotic cells) for the fixed effects of treatment,gender and their interaction (Genstat v13, VSNi, UK). Log transformed data are presented as back-transformedmeans. Scale bars in A and D, 100 μm.
C© 2012 The Authors. The Journal of Physiology C© 2012 The Physiological Society
J Physiol 590.2 A low protein diet blunts fetal renal development 385
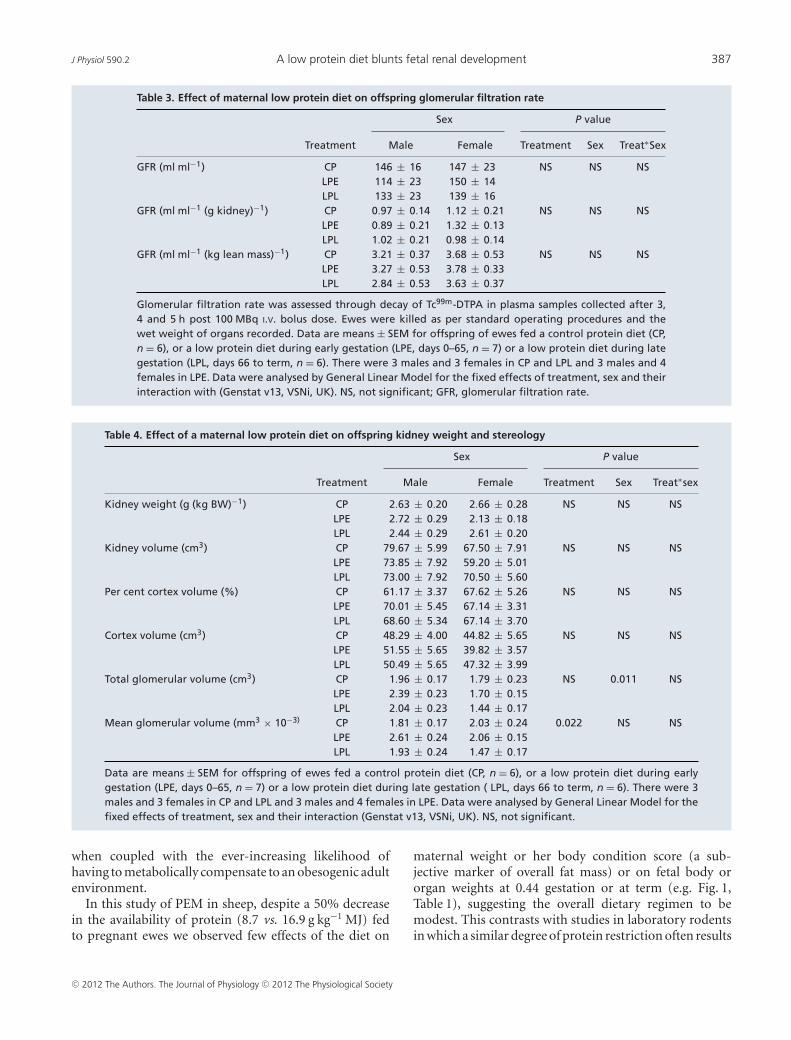
(i.e. 3–5 h, Table 3). Indeed, plasma Na+ (pooled estimate,132 [128–143] mmol l−1; median [IQR]), plasma K+
(pooled estimate, 8.02 [7.12–8.54] mmol l−1) and plasmaCl− (pooled estimate, 108 [103–113] mmol l−1) were notdifferent between treatment groups or sexes. However,the urinary albumin:creatinine ratio (ACR; mg μmol−1)was significantly (P = 0.03, Wilcoxons Rank sum test)increased in the LPE group, with no effect of gender
Figure 3. Weight gain during exposure to an obesogenicenvironment in adult sheepData are means ± SEM for control protein (CP, n = 6), low proteinearly (LPE, days 0–65 gestation, n = 7) and low protein late (LPL,days 66 to term, n = 6). There were 3 males and 3 females in CP andLPL and 3 males and 4 females in LPE. A, absolute body weight gain;B, kgs of weight gain after exposure to the obesogenic diet. Datawere analysed by General Linear Model for the fixed effects oftreatment, gender and time with testing for suitable interactions(Genstat v13, VSNi, UK). NS, non-significant.
(LPE, 8.88 [7.9–24.7] vs. CP, 1.73 [1.71–2.67]; LPL,2.49 [1.63–2.98] median [IQR]), suggesting reducedglomerular barrier function. Stereological analysis ofrenal anatomy indicated significantly reduced (F = 3.7,P = 0.05) nephron number in the adult LPE kidneyper se (LPE, 8.52 [8.04–9.28] × 106 vs. CP, 10.6[10.5–10.9] × 106; LPL, 10.4 [8.19–11.9] × 106; Fig. 4E).Hence, using a multivariate linear discriminant analysisthat predicted <99% of the variance for all renal outcomemeasures for all animals (e.g. upslope, time to peak, down-slope, transit-time and nephron number) within just twoeigenvectors (i.e. two linear orthogonals) indicates theseparation of treatment groups with respect to in vivo adultrenal function after exposure to a maternal low protein diet(Fig. 4F).
Adult renal structure
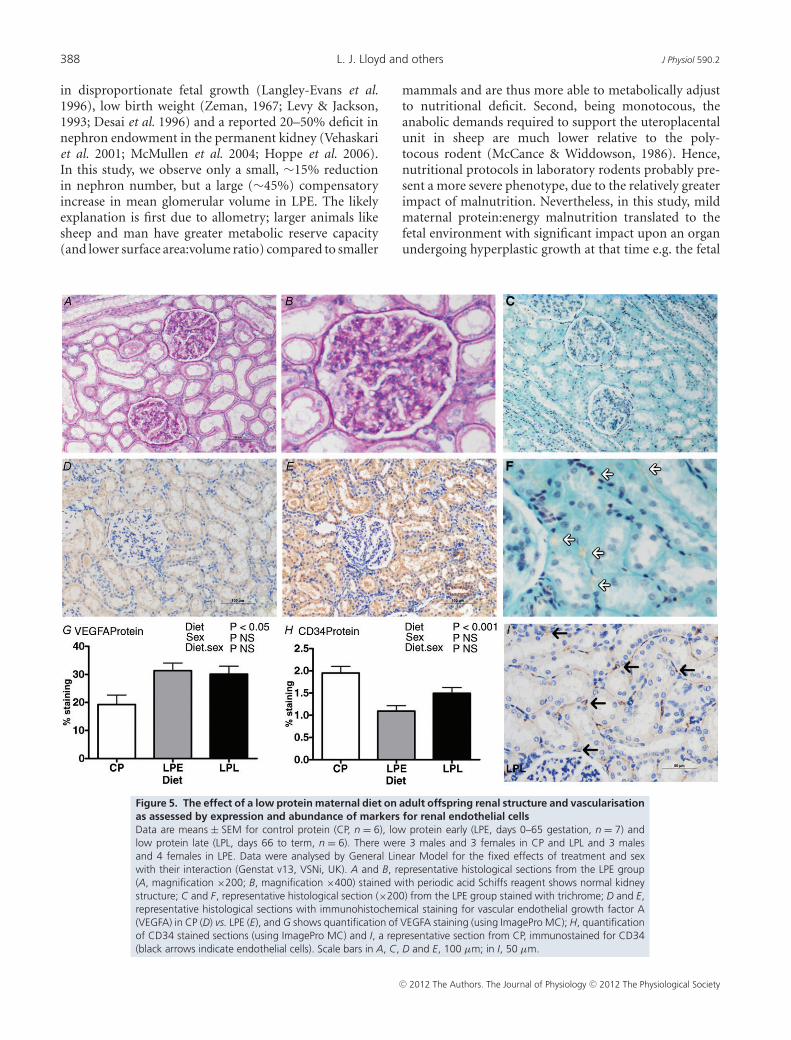
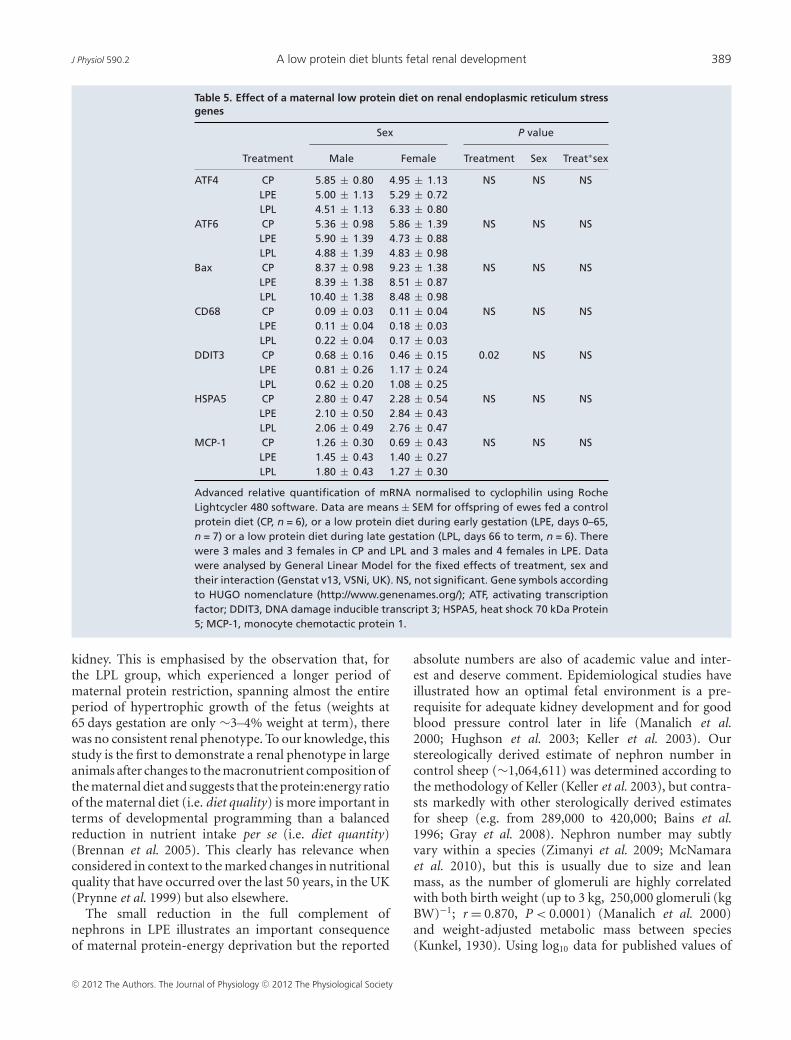
As assessed by stereology, reduced nephron number andmicroalbuminuria in LPE vs. controls was accompaniedby increased mean glomerular volume in this group(Table 4), without effect on overall kidney mass, volume orrelative volume of the renal cortex (Table 4). Histologicalexamination of glomeruli and proximal tubules in alltreatment groups indicated no obvious morphologicalor structural abnormality, no consistent lymphocyteinfiltration or any evidence of glomerulosclerosis inLPE or LPL vs. CP (Fig. 5A–D). However, throughimmunohistochemistry, we found significantly decreased(P < 0.001) abundance of CD34 protein (an endothelialcell marker) in LPE vs. controls (quantification inFig. 5H , micrograph in Fig. 5I), suggesting microvascularrarefaction in this group with increased (P = 0.02)abundance of VEGFA (quantification in Fig. 5G, micro-graph in Fig. 5E). Further analysis of transcripts forangiogenic markers revealed a consistent tendency forincreased expression in LPE vs. other groups (VEGFA,P = 0.07; VEGFR1, P = 0.05; VEGFR2, P = 0.09) withoutany consistent indication of increased intra-renal end-oplasmic reticulum stress (Table 5).
Discussion
In this study we have traced a pathway from mild, maternalprotein-energy malnutrition (PEM) acting during earlygestation to blunt the microvascular developmentof the fetal kidney in a sex-specific manner to astructurally- and functionally-compromised adult kidneywith evidence of microvascular rarefaction in the face ofan obesogenic environment. The potential implicationsof the work are relevant for those individuals born tomothers with varying degrees of PEM that may retainresidual, asymptomatic effects of the maternal nutritionalimbalance within their kidneys that manifest later inlife as an earlier than expected onset of CKD, especially
C© 2012 The Authors. The Journal of Physiology C© 2012 The Physiological Society
386 L. J. Lloyd and others J Physiol 590.2
Figure 4. The effect of a low protein maternal diet on adult offspring renal function as assessed byrenographyBoxplots show median (IQR with whiskers representing 5–95th centile) for control protein (CP, n = 6), low proteinearly (LPE, days 0–65 gestation, n = 7) and low protein late (LPL, days 66 to term, n = 6). There were 3 males and3 females in CP and LPL and 3 males and 4 females in LPE. Data were analysed by Restricted Maximum Likelihood(REML) for the fixed effects of treatment and gender with interaction (Genstat v13, VSNi, UK). Renal functionwas assessed by renography using Tc99m-DTPA. The upslope (A) is defined as the positive slope of the renogramoccurring before the peak and computed using the X and Y values of the renogram at 5 and 90% of the peak Y ;Time to peak (B) is from bolus injection to peak counts in the right kidney, the downslope is defined as the negativeslope of the renogram occurring after the peak and computed using the X and Y values of the renogram at thepeak and half-peak value on the downslope of the curve (C); transit time is the mean time taken for tracer to passthrough the kidney (D); nephron number was estimated by unbiased stereology (E) and F shows the mean foreach treatment group (circles representing 95% confidence interval of the mean) after linear discriminant analysisof normalised (i.e. z-scores) data for upslope, time to peak, downslope, transit time, nephron number and meanglomerular volume.
C© 2012 The Authors. The Journal of Physiology C© 2012 The Physiological Society
J Physiol 590.2 A low protein diet blunts fetal renal development 387
Table 3. Effect of maternal low protein diet on offspring glomerular filtration rate
Sex P value
Treatment Male Female Treatment Sex Treat∗Sex
GFR (ml ml−1) CP 146 ± 16 147 ± 23 NS NS NSLPE 114 ± 23 150 ± 14LPL 133 ± 23 139 ± 16
GFR (ml ml−1 (g kidney)−1) CP 0.97 ± 0.14 1.12 ± 0.21 NS NS NSLPE 0.89 ± 0.21 1.32 ± 0.13LPL 1.02 ± 0.21 0.98 ± 0.14
GFR (ml ml−1 (kg lean mass)−1) CP 3.21 ± 0.37 3.68 ± 0.53 NS NS NSLPE 3.27 ± 0.53 3.78 ± 0.33LPL 2.84 ± 0.53 3.63 ± 0.37
Glomerular filtration rate was assessed through decay of Tc99m-DTPA in plasma samples collected after 3,4 and 5 h post 100 MBq I.V. bolus dose. Ewes were killed as per standard operating procedures and thewet weight of organs recorded. Data are means ± SEM for offspring of ewes fed a control protein diet (CP,n = 6), or a low protein diet during early gestation (LPE, days 0–65, n = 7) or a low protein diet during lategestation (LPL, days 66 to term, n = 6). There were 3 males and 3 females in CP and LPL and 3 males and 4females in LPE. Data were analysed by General Linear Model for the fixed effects of treatment, sex and theirinteraction with (Genstat v13, VSNi, UK). NS, not significant; GFR, glomerular filtration rate.
Table 4. Effect of a maternal low protein diet on offspring kidney weight and stereology
Sex P value
Treatment Male Female Treatment Sex Treat∗sex
Kidney weight (g (kg BW)−1) CP 2.63 ± 0.20 2.66 ± 0.28 NS NS NSLPE 2.72 ± 0.29 2.13 ± 0.18LPL 2.44 ± 0.29 2.61 ± 0.20
Kidney volume (cm3) CP 79.67 ± 5.99 67.50 ± 7.91 NS NS NSLPE 73.85 ± 7.92 59.20 ± 5.01LPL 73.00 ± 7.92 70.50 ± 5.60
Per cent cortex volume (%) CP 61.17 ± 3.37 67.62 ± 5.26 NS NS NSLPE 70.01 ± 5.45 67.14 ± 3.31LPL 68.60 ± 5.34 67.14 ± 3.70
Cortex volume (cm3) CP 48.29 ± 4.00 44.82 ± 5.65 NS NS NSLPE 51.55 ± 5.65 39.82 ± 3.57LPL 50.49 ± 5.65 47.32 ± 3.99
Total glomerular volume (cm3) CP 1.96 ± 0.17 1.79 ± 0.23 NS 0.011 NSLPE 2.39 ± 0.23 1.70 ± 0.15LPL 2.04 ± 0.23 1.44 ± 0.17
Mean glomerular volume (mm3 × 10−3) CP 1.81 ± 0.17 2.03 ± 0.24 0.022 NS NSLPE 2.61 ± 0.24 2.06 ± 0.15LPL 1.93 ± 0.24 1.47 ± 0.17
Data are means ± SEM for offspring of ewes fed a control protein diet (CP, n = 6), or a low protein diet during earlygestation (LPE, days 0–65, n = 7) or a low protein diet during late gestation ( LPL, days 66 to term, n = 6). There were 3males and 3 females in CP and LPL and 3 males and 4 females in LPE. Data were analysed by General Linear Model for thefixed effects of treatment, sex and their interaction (Genstat v13, VSNi, UK). NS, not significant.
when coupled with the ever-increasing likelihood ofhaving to metabolically compensate to an obesogenic adultenvironment.
In this study of PEM in sheep, despite a 50% decreasein the availability of protein (8.7 vs. 16.9 g kg−1 MJ) fedto pregnant ewes we observed few effects of the diet on
maternal weight or her body condition score (a sub-jective marker of overall fat mass) or on fetal body ororgan weights at 0.44 gestation or at term (e.g. Fig. 1,Table 1), suggesting the overall dietary regimen to bemodest. This contrasts with studies in laboratory rodentsin which a similar degree of protein restriction often results
C© 2012 The Authors. The Journal of Physiology C© 2012 The Physiological Society
388 L. J. Lloyd and others J Physiol 590.2
in disproportionate fetal growth (Langley-Evans et al.1996), low birth weight (Zeman, 1967; Levy & Jackson,1993; Desai et al. 1996) and a reported 20–50% deficit innephron endowment in the permanent kidney (Vehaskariet al. 2001; McMullen et al. 2004; Hoppe et al. 2006).In this study, we observe only a small, ∼15% reductionin nephron number, but a large (∼45%) compensatoryincrease in mean glomerular volume in LPE. The likelyexplanation is first due to allometry; larger animals likesheep and man have greater metabolic reserve capacity(and lower surface area:volume ratio) compared to smaller
mammals and are thus more able to metabolically adjustto nutritional deficit. Second, being monotocous, theanabolic demands required to support the uteroplacentalunit in sheep are much lower relative to the poly-tocous rodent (McCance & Widdowson, 1986). Hence,nutritional protocols in laboratory rodents probably pre-sent a more severe phenotype, due to the relatively greaterimpact of malnutrition. Nevertheless, in this study, mildmaternal protein:energy malnutrition translated to thefetal environment with significant impact upon an organundergoing hyperplastic growth at that time e.g. the fetal
Figure 5. The effect of a low protein maternal diet on adult offspring renal structure and vascularisationas assessed by expression and abundance of markers for renal endothelial cellsData are means ± SEM for control protein (CP, n = 6), low protein early (LPE, days 0–65 gestation, n = 7) andlow protein late (LPL, days 66 to term, n = 6). There were 3 males and 3 females in CP and LPL and 3 malesand 4 females in LPE. Data were analysed by General Linear Model for the fixed effects of treatment and sexwith their interaction (Genstat v13, VSNi, UK). A and B, representative histological sections from the LPE group(A, magnification ×200; B, magnification ×400) stained with periodic acid Schiffs reagent shows normal kidneystructure; C and F, representative histological section (×200) from the LPE group stained with trichrome; D and E,representative histological sections with immunohistochemical staining for vascular endothelial growth factor A(VEGFA) in CP (D) vs. LPE (E), and G shows quantification of VEGFA staining (using ImagePro MC); H, quantificationof CD34 stained sections (using ImagePro MC) and I, a representative section from CP, immunostained for CD34(black arrows indicate endothelial cells). Scale bars in A, C, D and E, 100 μm; in I, 50 μm.
C© 2012 The Authors. The Journal of Physiology C© 2012 The Physiological Society
J Physiol 590.2 A low protein diet blunts fetal renal development 389
Table 5. Effect of a maternal low protein diet on renal endoplasmic reticulum stressgenes
Sex P value
Treatment Male Female Treatment Sex Treat∗sex
ATF4 CP 5.85 ± 0.80 4.95 ± 1.13 NS NS NSLPE 5.00 ± 1.13 5.29 ± 0.72LPL 4.51 ± 1.13 6.33 ± 0.80
ATF6 CP 5.36 ± 0.98 5.86 ± 1.39 NS NS NSLPE 5.90 ± 1.39 4.73 ± 0.88LPL 4.88 ± 1.39 4.83 ± 0.98
Bax CP 8.37 ± 0.98 9.23 ± 1.38 NS NS NSLPE 8.39 ± 1.38 8.51 ± 0.87LPL 10.40 ± 1.38 8.48 ± 0.98
CD68 CP 0.09 ± 0.03 0.11 ± 0.04 NS NS NSLPE 0.11 ± 0.04 0.18 ± 0.03LPL 0.22 ± 0.04 0.17 ± 0.03
DDIT3 CP 0.68 ± 0.16 0.46 ± 0.15 0.02 NS NSLPE 0.81 ± 0.26 1.17 ± 0.24LPL 0.62 ± 0.20 1.08 ± 0.25
HSPA5 CP 2.80 ± 0.47 2.28 ± 0.54 NS NS NSLPE 2.10 ± 0.50 2.84 ± 0.43LPL 2.06 ± 0.49 2.76 ± 0.47
MCP-1 CP 1.26 ± 0.30 0.69 ± 0.43 NS NS NSLPE 1.45 ± 0.43 1.40 ± 0.27LPL 1.80 ± 0.43 1.27 ± 0.30
Advanced relative quantification of mRNA normalised to cyclophilin using RocheLightcycler 480 software. Data are means ± SEM for offspring of ewes fed a controlprotein diet (CP, n = 6), or a low protein diet during early gestation (LPE, days 0–65,n = 7) or a low protein diet during late gestation (LPL, days 66 to term, n = 6). Therewere 3 males and 3 females in CP and LPL and 3 males and 4 females in LPE. Datawere analysed by General Linear Model for the fixed effects of treatment, sex andtheir interaction (Genstat v13, VSNi, UK). NS, not significant. Gene symbols accordingto HUGO nomenclature (http://www.genenames.org/); ATF, activating transcriptionfactor; DDIT3, DNA damage inducible transcript 3; HSPA5, heat shock 70 kDa Protein5; MCP-1, monocyte chemotactic protein 1.
kidney. This is emphasised by the observation that, forthe LPL group, which experienced a longer period ofmaternal protein restriction, spanning almost the entireperiod of hypertrophic growth of the fetus (weights at65 days gestation are only ∼3–4% weight at term), therewas no consistent renal phenotype. To our knowledge, thisstudy is the first to demonstrate a renal phenotype in largeanimals after changes to the macronutrient composition ofthe maternal diet and suggests that the protein:energy ratioof the maternal diet (i.e. diet quality) is more important interms of developmental programming than a balancedreduction in nutrient intake per se (i.e. diet quantity)(Brennan et al. 2005). This clearly has relevance whenconsidered in context to the marked changes in nutritionalquality that have occurred over the last 50 years, in the UK(Prynne et al. 1999) but also elsewhere.
The small reduction in the full complement ofnephrons in LPE illustrates an important consequenceof maternal protein-energy deprivation but the reported
absolute numbers are also of academic value and inter-est and deserve comment. Epidemiological studies haveillustrated how an optimal fetal environment is a pre-requisite for adequate kidney development and for goodblood pressure control later in life (Manalich et al.2000; Hughson et al. 2003; Keller et al. 2003). Ourstereologically derived estimate of nephron number incontrol sheep (∼1,064,611) was determined according tothe methodology of Keller (Keller et al. 2003), but contra-sts markedly with other sterologically derived estimatesfor sheep (e.g. from 289,000 to 420,000; Bains et al.1996; Gray et al. 2008). Nephron number may subtlyvary within a species (Zimanyi et al. 2009; McNamaraet al. 2010), but this is usually due to size and leanmass, as the number of glomeruli are highly correlatedwith both birth weight (up to 3 kg, 250,000 glomeruli (kgBW)−1; r = 0.870, P < 0.0001) (Manalich et al. 2000)and weight-adjusted metabolic mass between species(Kunkel, 1930). Using log10 data for published values of
C© 2012 The Authors. The Journal of Physiology C© 2012 The Physiological Society

390 L. J. Lloyd and others J Physiol 590.2
nephron number from a mouse (20 g) to an elephant(3700 kg) generates an equation of y = 0.613x + 3.116,therefore accurately predicting an adult sheep (50–70 kg)to have between 994,050 and 1,221,839 nephrons perkidney. This estimate encompasses the reported valuesin this manuscript, but not others (Bains et al. 1996;Gray et al. 2008) and emphasises, perhaps, that prenataleffects on nephron number are best considered relative toappropriate controls rather than to species-specific values.
In rodents, Welham et al. (2002) were the firstto suggest a potential mechanistic pathway to explainloss of nephrons. They just with maternal proteinrestriction – increased loss (apoptotic) of mesenchymal(either nephron progenitor or interstitial supportive) cells,but the determining factor remained elusive. Here, wereplicate these findings for the first time in a large animalmodel and demonstrate a potential mechanism: fetalhyperplastic kidneys exposed to maternal low proteinhad increased apoptosis and decreased angiogenesisin the nephrogenic zone. While previous work hasshown how one or other of these pathways may beinfluenced by maternal nutrition (Welham et al. 2002;Cox et al. 2006) we show a coherent effect on both. Takentogether, the data suggest that maternal protein-energymalnutrition specifically limits fetal intrarenal vascularity,resulting in blunted nephrogenesis and restricted nephronendowment of the permanent kidney, effects that areasymptomatic until superimposed on an adult obesogenicenvironment when renal dysfunction is revealed.
The extent of the renal dysfunction in LPE (micro-albuminuria and blunted intra-renal transit of radio-nuclide) is subtle, but considering the age of the animals(1.5–2 years of age of an expected ∼10–12 year lifespan)is significant. Microalbuminuria is a good early predictorof later renal disease (Painter et al. 2005) but withoutaged animals, one can only make the assumption thatthe programmed phenotype would deteriorate with age.From epidemiological studies, those human individualsexposed to famine during early (but not late) gestationwere at higher risk of developing obesity (Ravelli et al.1976) with concomitant microalbuminuria in middle age(Painter et al. 2005). In our study, microalbuminuria inLPE, marking reduced renal barrier function, is probablydue to single-nephron hyperfiltration as this occurs withobesity per se, as shown by us in a previous study(Williams et al. 2007) but also may be exacerbated in thisstudy by (1) reduced nephron number, (2) microvascularrarefaction (marked by reduced intra-renal endothelialCD34+ abundance) and (3) increased intra-renal pressure(indicated by reduced Tc-99m DTPA time to peak andintra-renal transit-time). With no clear difference in grossrenal morphology, inflammatory infiltration or indicesof intra-renal stress then the functional deficits in LPE(both males and females) suggests minimal change disease,perhaps due to podocyte effacement (Haraldsson et al.
2008; Veron et al. 2010). However, lack of appropriatelyfixed tissue for transmission electron microscopy pre-cludes this possibility being explored. Nevertheless, themolecular and immunohistochemical data (increasedVEGFA) suggest greater support for a compromised renalbarrier – VEGFA is highly expressed in podocytes, playsan important role in establishing and maintaining theglomerular barrier (Eremina et al. 2008) and when over-expressed, is associated with glomerular disease in mice(Veron et al. 2010).
Finally, in fetal life, many aspects of the adverse renalphenotype described were sex-specifically altered, that is,the effect was greater in males vs. females (witness thereduction in angiogenic factors in the male LPE fetalkidney as an example). A sex effect in the experimentalendpoints of studies examining relationships betweenmaternal diet and offspring phenotype (males adverselyaffected more often than females) is not uncommon(Grigore et al. 2008). These effects are unlikely due todifferences in the plasma concentration of sex hormones(very low in the fetus, male adult offspring were castrates)but could be related to growth since males (fetuses andoffspring) grow at a faster rate than females (reflected atday 65 gestation here, and in fractional growth rate post-natally). Faster growing animals may be more susceptibleto deficits and/or changes in the pattern of substratesupply (in particular of amino acids). Alternatively,the effect may be a product of nutritionally inducedsex-specific epigenetic programming – a phenomenonrecently described in bovine blastocysts (Bermejo-Alvarezet al. 2010) but also in adult sheep (Sinclair et al. 2007).However, in this study at 2 years of age, the sex-specificprogramming of the kidney was less evident. Our studywas powered to reveal sex-specific differences in renalfunction (e.g. transit time) as our primary outcome. Thus,we are confident that if any clear sex-specific differencesin renal function (and molecular end-points) were toexist we would have been able to reveal them withour study design. However, for alternative outcomes inwhich a treatment × sex interaction appears likely (e.g.for mean glomerular volume the effect size was +27%,male LPE vs. controls) but for which the measurementerror increases, then we acknowledge a potential TypeII error (in this example we have 85% power to detecta 27% difference at the treatment level, but only 56%at the treatment × sex level). Nevertheless, an adultrenal phenotype has been described that indicates aspecific effect of maternal low protein acting duringearly development of the fetal kidney. We have describeda potential mechanism, at this time, that is mediatedthrough the key nexus for control of angiogenesis, VEGF,and that the blunting of renal development appears moremarked in male fetuses. Further, mechanistic studiesaimed at determining the nature of the relationshipbetween maternal protein-energy malnutrition, the fetal
C© 2012 The Authors. The Journal of Physiology C© 2012 The Physiological Society

J Physiol 590.2 A low protein diet blunts fetal renal development 391
nutritional environment and renal growth (micro-vascular, nephrogenesis) in male and female fetuses iswarranted.
To conclude, protein-energy malnutrition (PEM) ishighly prevalent in developing countries with up to20%, 8% and 0.8% children in India, China and theUSA, respectively, being affected (equating to ∼130,18 and 1.1 million individuals; WHO, 2011). Whilstit is less prevalent in developed, Westernised societiesthe incidence of pregnancy-induced nausea (75–90%women) and, in extremis, hyperemesis gravidarum (1%women) during early pregnancy means that many women(and their fetuses) may experience some degree ofmacro/micronutrient deficiency at this time (Fejzo et al.2009). Here we show that PEM at this time may specificallyimpact the developing, hyperplastic fetal kidney to limitrenal vascularisation and nephrogenesis with functionalconsequences later in life that are predicted to exacerbatethe age-related decline in renal function. With the pre-valence of renal morbidity increasing by ∼5% per annumlargely through the increased prevalence of obesity andT2D then a clinical focus on a good, balanced andhigh-quality maternal diet as a potentially modifiable riskfactor may help to mitigate a proportion of the expectedcases of CKD in the future.
References
Amann K, Wanner C & Ritz E (2006). Cross-talk between thekidney and the cardiovascular system. J Am Soc Nephrol 17,2112–2119.
Bains RK, Sibbons PD, Murray RD, Howard CV & Van VelzenD (1996). Stereological estimation of the absolute numberof glomeruli in the kidneys of lambs. Res Vet Sci 60,122–125.
Bakris GL & Ritz E (2009). The message for World Kidney Day2009: hypertension and kidney disease: a marriage thatshould be prevented. Kidney Int 75, 449–452.
Barker DJ & Osmond C (1986). Infant mortality, childhoodnutrition, and ischaemic heart disease in England and Wales.Lancet 1, 1077–1081.
Barker DJ & Osmond C (1988). Low birth weight andhypertension. BMJ 297, 134–135.
Barker DJ, Osmond C, Forsen TJ, Kajantie E & Eriksson JG(2005). Trajectories of growth among children who havecoronary events as adults. N Engl J Med 353, 1802–1809.
Bermejo-Alvarez P, Rizos D, Rath D, Lonergan P &Gutierrez-Adan A (2010). Sex determines the expressionlevel of one third of the actively expressed genes in bovineblastocysts. Proc Natl Acad Sci U S A 107, 3394–3399.
Brennan KA, Gopalakrishnan GS, Kurlak L, Rhind SM, KyleCE, Brooks AN et al. (2005). Impact of maternalundernutrition and fetal number on glucocorticoid, growthhormone and insulin-like growth factor receptor mRNAabundance in the ovine fetal kidney. Reproduction 129,151–159.
Brenner BM, Garcia DL & Anderson S (1988). Glomeruli andblood pressure. Less of one, more the other? Am J Hypertens1, 335–347.
Carone BR, Fauquier L, Habib N, Shea JM, Hart CE, Li R et al.(2010). Paternally induced transgenerational environmentalreprogramming of metabolic gene expression in mammals.Cell 143, 1084–1096.
Cignarelli M & Lamacchia O (2007). Obesity and kidneydisease. Nutr Metab Cardiovasc Dis 17, 757–762.
Cordain L, Eaton SB, Sebastian A, Mann N, Lindeberg S,Watkins BA et al. (2005). Origins and evolution of theWestern diet: health implications for the 21st century. Am JClin Nutr 81, 341–354.
Cox LA, Nijland MJ, Gilbert JS, Schlabritz-Loutsevitch NE,Hubbard GB, McDonald TJ et al. (2006). Effect of 30 percent maternal nutrient restriction from 0.16 to 0.5 gestationon fetal baboon kidney gene expression. J Physiol 572, 67–85.
Crispi F, Bijnens B, Figueras F, Bartrons J, Eixarch E, Le NobleF et al. (2010). Fetal growth restriction results in remodelledand less efficient hearts in children. Circulation 121,2427–2436.
Crook ED (2002). Diabetic renal disease in African Americans.Am J Med Sci 323, 78–84.
Daar AS, Singer PA, Persad DL, Pramming SK, Matthews DR,Beaglehole R et al. (2007). Grand challenges in chronicnon-communicable diseases. Nature 450, 494–496.
Desai M, Crowther NJ, Lucas A & Hales CN (1996).Organ-selective growth in the offspring of protein-restrictedmothers. Br J Nutr 76, 591–603.
Drummond GB (2009). Reporting ethical matters in TheJournal of Physiology: standards and advice. J Physiol 587,713–719.
Eaton SB & Eaton SB, 3rd (2000). Paleolithic vs. modern diets –selected pathophysiological implications. Eur J Nutr 39,67–70.
Egan BM, Zhao Y & Axon RN (2010). US trends in prevalence,awareness, treatment, and control of hypertension,1988–2008. JAMA 303, 2043–2050.
Ejerblad E, Fored CM, Lindblad P, Fryzek J, McLaughlin JK &Nyren O (2006). Obesity and risk for chronic renal failure.J Am Soc Nephrol 17, 1695–1702.
Eremina V, Jefferson JA, Kowalewska J, Hochster H, Haas M,Weisstuch J et al. (2008). VEGF inhibition and renalthrombotic microangiopathy. N Engl J Med 358, 1129–1136.
Fejzo MS, Poursharif B, Korst LM, Munch S, MacGibbon KW,Romero R & Goodwin TM (2009). Symptoms andpregnancy outcomes associated with extreme weight lossamong women with hyperemesis gravidarum. J WomensHealth (Larchmt) 18, 1981–1987.
Fox CS, Gona P, Larson MG, Selhub J, Tofler G, Hwang S-Jet al. (2010). A multi-marker approach to predict incidentCKD and microalbuminuria. J Am Soc Nephrol 21,2143–2149.
Gilbert JS, Lang AL, Grant AR & Nijland MJ (2005). Maternalnutrient restriction in sheep: hypertension and decreasednephron number in offspring at 9 months of age. J Physiol565, 137–147.
Gleadhill A, Marlin D, Harris PA & Michell AR (1999). Use of athree-blood-sample plasma clearance technique to measureGFR in horses. Vet J 158, 204–209.
C© 2012 The Authors. The Journal of Physiology C© 2012 The Physiological Society

392 L. J. Lloyd and others J Physiol 590.2
Gluckman PD, Hanson MA, Cooper C & Thornburg KL(2008). Effect of in utero and early-life conditions on adulthealth and disease. N Engl J Med 359,61–73.
Gray SP, Kenna K, Bertram JF, Hoy WE, Yan EB, Bocking ADet al. (2008). Repeated ethanol exposure during lategestation decreases nephron endowment in fetal sheep. Am JPhysiol Regul Integr Comp Physiol 295, R568–R574.
Griffin KA, Kramer H & Bidani AK (2008). Adverse renalconsequences of obesity. Am J Physiol Renal Physiol 294,F685–F696.
Grigore D, Ojeda NB & Alexander BT (2008). Sex differences inthe fetal programming of hypertension. Gend Med 5,S121–S132.
Haraldsson B, Nystrom J & Deen WM (2008). Properties of theglomerular barrier and mechanisms of proteinuria. PhysiolRev 88, 451–487.
Hoppe CC, Evans RG, Moritz KM, Cullen-McEwen LA,Fitzgerald SM, Dowling J & Bertram JF (2006). Combinedprenatal and postnatal protein restriction influences adultkidney structure, function, and arterial pressure. Am JPhysiol Regul Integr Comp Physiol 292, R462–R469.
Hoy WE, Hughson MD, Bertram JF, Douglas-Denton R &Amann K (2005). Nephron number, hypertension, renaldisease, and renal failure. J Am Soc Nephrol 16,2557–2564.
Huang C, Li Z, Wang M & Martorell R (2010). Early lifeexposure to the 1959–1961 Chinese famine has long-termhealth consequences. J Nutr 140, 1874–1878.
Hughson M, Farris AB III, Douglas-Denton R, Hoy WE &Bertram JF (2003). Glomerular number and size in autopsykidneys: The relationship to birth weight. Kidney Int 63,2113–2122.
Huxley R, Neil A & Collins R (2002). Unravelling the fetalorigins hypothesis: is there really an inverse associationbetween birthweight and subsequent blood pressure? Lancet360, 659–665.
Keller G, Zimmer G, Mall G, Ritz E & Amann K (2003).Nephron number in patients with primary hypertension. NEngl J Med 348, 101–108.
Kelly T, Yang W, Chen CS, Reynolds K & He J (2008). Globalburden of obesity in 2005 and projections to 2030. Int J Obes32, 1431–1437.
Kunkel PA (1930). The number and size of the glomeruli in thekidney of several mammals. Bulletin of the Johns HopkinsHospital 47, 285–291.
Langley-Evans SC, Gardner DS & Jackson AA (1996).Association of disproportionate growth of fetal rats in lategestation with raised systolic blood pressure in later life. JReprod Fertil 106, 307–312.
Law CM & Shiell AW (1996). Is blood pressure inversely relatedto birth weight? The strength of evidence from a systematicreview of the literature. J Hypertens 14, 935–941.
Levy L & Jackson AA (1993). Modest restriction of dietaryprotein during pregnancy in the rat: fetal and placentalgrowth. J Dev Physiol 19, 113–118.
Lysaght MJ (2002). Maintenance dialysis population dynamics:Current trends and long-term implications. J Am SocNephrol 13, S37–S40.
McCance RA & Widdowson EM (1986). Glimpses ofcomparative growth and development. In DevelopmentalBiology and Prenatal Growth, ed. Falkner F & Tanner JM, pp.133–151. Plenum Press, London.
Mackenzie HS & Brenner BM (1995). Fewer nephrons at birth:a missing link in the etiology of essential hypertension? AmJKidney Dis 26, 91–98.
McMillen IC & Robinson JS (2005). Developmental origins ofthe metabolic syndrome: prediction, plasticity, andprogramming. Physiol Rev 85, 571–633.
McMullen S, Gardner DS & Langley-Evans SC (2004). Prenatalprogramming of angiotensin II type 2 receptor expression inthe rat. Br J Nutr 91, 133–140.
McNamara BJ, Diouf B, Douglas-Denton RN, Hughson MD,Hoy WE & Bertram JF (2010). A comparison of nephronnumber, glomerular volume and kidney weight in SenegaleseAfricans and African Americans. Nephrol Dial Transplant 25,1514–1520.
Manalich R, Reyes L, Herrera M, Melendi C & Fundora I(2000). Relationship between weight at birth and thenumber and size of renal glomeruli in humans: ahistomorphometric study. Kidney Int 58, 770–773.
Moritz KM, Singh RR, Probyn ME & Denton KM (2009).Developmental programming of a reduced nephronendowment: more than just a baby’s birth weight. Am JPhysiol Renal Physiol 296, F1–F9.
Moritz KM & Wintour EM (1999). Functional development ofthe meso- and metanephros. Pediatr Nephrol 13,171–178.
Narayan KMV, Ali MK & Koplan JP (2010). Globalnoncommunicable diseases – where worlds meet. N Engl JMed 363, 1196–1198.
Nehiri T, Duong Van Huyen J-P, Viltard M, Fassot C, HeudesD, Freund N et al. (2008). Exposure to maternal diabetesinduces salt-sensitive hypertension and impairs renalfunction in adult rat offspring. Diabetes 57,2167–2175.
Ng S-F, Lin RCY, Laybutt DR, Barres R, Owens JA &Morris MJ (2010). Chronic high-fat diet in fathers programsβ-cell dysfunction in female rat offspring. Nature 467,963–966.
Ojeda NB, Grigore D & Alexander BT (2008). Intrauterinegrowth restriction: fetal programming of hypertension andkidney disease. Adv Chronic Kidney Dis 15, 101–106.
Painter RC, Roseboom TJ, van Montfrans GA, Bossuyt PM,Krediet RT, Osmond C et al. (2005). Microalbuminuria inadults after prenatal exposure to the Dutch famine. J Am SocNephrol 16, 189–194.
Prynne CJ, Paul AA, Price GM, Day KC, Hilder WS &Wadsworth ME (1999). Food and nutrient intake of anational sample of 4-year-old children in 1950: comparisonwith the 1990s. Public Health Nutr 2, 537–547.
Puddu M, Fanos V, Podda F & Zaffanello M (2009). Thekidney from prenatal to adult life: perinatal programmingand reduction of number of nephrons during development.Am J Nephrol 30, 162–170.
Ravelli GP, Stein ZA & Susser MW (1976). Obesity in youngmen after famine exposure in utero and early infancy. N EnglJ Med 295, 349–353.
C© 2012 The Authors. The Journal of Physiology C© 2012 The Physiological Society

J Physiol 590.2 A low protein diet blunts fetal renal development 393
Reilly RF & Perazella MA (2002). Chronic kidney disease: a newapproach to an old problem. Conn Med 66, 579–583.
Rhodes P, Craigon J, Gray C, Rhind SM, Loughna PT &Gardner DS (2009). Adult-onset obesity reveals prenatalprogramming of glucose-insulin sensitivity in male sheepnutrient restricted during late gestation. PLoS One 4,e7393.
Roseboom TJ, van der Meulen JH, Ravelli AC, van MontfransGA, Osmond C, Barker DJ & Bleker OP (1999). Bloodpressure in adults after prenatal exposure to famine. JHypertens 17, 325–330.
Sharkey D, Fainberg HP, Wilson V, Harvey E, Gardner DS,Symonds ME & Budge H (2009). Impact of early onsetobesity and hypertension on the unfolded protein responsein renal tissues of juvenile sheep. Hypertension 53, 925–931.
Simonetti GD, Raio L, Surbek D, Nelle M, Frey FJ & MohauptMG (2008). Salt sensitivity of children with low birth weight.Hypertension 52, 625–630.
Sinclair KD, Allegrucci C, Singh R, Gardner DS, Sebastian S,Bispham J et al. (2007). DNA methylation, insulin resistance,and blood pressure in offspring determined by maternalpericonceptional B vitamin and methionine status. Proc NatlAcad Sci U S A 104, 19351–19356.
Teeninga N, Schreuder MF, Bokenkamp A, Delemarre-van deWaal HA & van Wijk JA (2008). Influence of low birthweight on minimal change nephrotic syndrome in children,including a meta-analysis. Nephrol Dial Transplant 23,1615–1620.
Tran S, Chen YW, Chenier I, Chan JSD, Quaggin S, Hebert MJet al. (2008). Maternal diabetes modulates renalmorphogenesis in offspring. J Am Soc Nephrol 19, 943–952.
Vehaskari VM, Aviles DH & Manning J (2001). Prenatalprogramming of adult hypertension in the rat. Kidney Int 59,238–245.
Veron D, Reidy KJ, Bertuccio C, Teichman J, Villegas G,Jimenez J et al. (2010). Overexpression of VEGF-A inpodocytes of adult mice causes glomerular disease. KidneyInt 77, 989–999.
Wang YC, McPherson K, Marsh T, Gortmaker SL & Brown M(2011). Health and economic burden of the projectedobesity trends in the USA and the UK. Lancet 378,815–825.
Welham SJ, Wade A & Woolf AS (2002). Protein restriction inpregnancy is associated with increased apoptosis ofmesenchymal cells at the start of rat metanephrogenesis.Kidney Int 61, 1231–1242.
Whincup PH, Kaye SJ, Owen CG, Huxley R, Cook DG,Anazawa S et al. (2008). Birth weight and risk of type 2diabetes: a systematic review. JAMA 300, 2886–2897.
WHO (2011). Nutrition Landscape Information System. WorldHealth Organisation.
Williams PJ, Kurlak LO, Perkins AC, Budge H, Stephenson T,Keisler D et al. (2007). Hypertension and impaired renalfunction accompany juvenile obesity: the effect of prenataldiet. Kidney Int 73, 279–289.
Winearls CG & Glassock RJ (2009). Dissecting and refining thestaging of chronic kidney disease. Kidney Int 75,1009–1014.
Wintour EM & Moritz KM (1997). Comparative aspects of fetalrenal development. Equine Vet J Suppl 24, 51–58.
Wood IS, de Heredia FP, Wang B & Trayhurn P (2009). Cellularhypoxia and adipose tissue dysfunction in obesity. Proc NutrSoc 68, 370–377.
Woods LL, Weeks DA & Rasch R (2004). Programming of adultblood pressure by maternal protein restriction: role ofnephrogenesis. Kidney Int 65, 1339–1348.
Zeman FJ (1967). Effect of the young rat of maternal proteinrestriction. J Nutr 93, 167–173.
Zimanyi MA, Hoy WE, Douglas-Denton RN, Hughson MD,Holden LM & Bertram JF (2009). Nephron number andindividual glomerular volumes in male Caucasian andAfrican American subjects. Nephrol Dial Transplant 24,2428–2433.
Author contributions
The experiments were conducted at the School of VeterinaryMedicine and Science, Sutton Bonington Campus, University ofNottingham. D.S.G., P.R. and S.M.R. conceived and designedthe experiments; L.J.L., D.S.G., P.R., T.F. and S.M.R. conductedresearch; L.J.L. and D.S.G. analysed and interpreted researchand L.J.L. and D.S.G wrote the paper. D.S.G. has primaryresponsibility for its final content and all authors have approvedthe final version of the manuscript.
Acknowledgements
The authors would like to acknowledge the contributions of:Dr Ali Mobasheri (University of Nottingham) and Dr CindyWong (Abcam) for the gift of the CD34 antibody, Dr TomMcCulloch (Consultant Pathologist, Nottingham UniversityHospitals Trust) for advice concerning renal histopathology andDr Jim Craigon for statistical advice on the manuscript. Mrs.Louise Lloyd was supported by a British Heart Foundation PhDstudentship (FS/09/011/26562).
C© 2012 The Authors. The Journal of Physiology C© 2012 The Physiological Society