protein crystallization screening using associative
TRANSCRIPT
Protein Crystallization Screening usingAssociative Experimental Design
Imren Dinc1, Marc L Pusey2, and Ramazan S. Aygun1
1 Computer Science Department, University of Alabama in Huntsville,Huntsville, Alabama 35899, United States
[email protected], [email protected], [email protected],2 iXpressGenes, Inc., 601 Genome Way, Huntsville, Alabama 35806, United States
Abstract. Protein crystallization remains a highly empirical process.The purpose of protein crystallization screening is the determination ofthe main factors of importance leading to protein crystallization. One ofthe major problems about determining these factors is that screening isoften expanded to many hundreds or thousands of conditions to maxi-mize combinatorial chemical space coverage for a successful (crystalline)outcome. In this paper, we propose a new experimental design methodcalled “Associative Experimental Design (AED)” that provides a list ofscreening factors that are likely to lead to higher scoring outcomes orcrystals by analyzing preliminary experimental results. We have testedAED on Nucleoside diphosphate kinase, HAD superfamily hydrolase,and nucleoside kinase proteins derived from the hyperthermophile Ther-mococcus thioreducens. After obtaining the candidate novel conditions,we have confirmed that AED method yielded high scoring crystals afterexperimenting in a wet lab.
Keywords: Associative Experimental Design, Protein Crystallization,Screening, Experimental Design
1 Introduction
Protein crystallization is the process of formation of 3-dimensional structure ofa protein. One of the significant difficulties in macromolecular crystallization issetting up the parameters that yield a single large crystal for X-ray data col-lection [2], [3]. The major difficulty in this process is the trial of abundance ofparameters with significant number of possible values. Physical, chemical andbiochemical factors such as type of precipitants, type of salts, ionic strengths,pH value of the buffer, temperature of the environment, and genetic modifica-tions of the protein affect the crystallization process significantly [4]. Becauseeach protein has a unique primary structure, it is quite challenging to predictthe parameters of the experiment that can yield crystal for a specific protein [4].Theoretically, it is possible to crystallize a protein in a specific solution undercertain conditions; however, it may not be possible to crystallize in practice [5].
II
This means that we can generate hundreds or thousands of conditions to max-imize combinatorial chemical space coverage hoping for a crystalline outcome.However, setting up huge number of experiments is not feasible in terms of costand time.
Basically, there are two main approaches to set parameters for protein crys-tallization experiments [6], [7]: 1) incomplete factorial design (IFD) [8], [9] orsparse matrix sampling (SMS) [3], [10], and 2) grid screening (GS) of crystal-lization conditions [4]. The first approach has been widely used by commercialcompanies such as Hampton Research, Emerald Biostructures, etc. [6]. Carteret al. proposed to set parameters of protein crystallization experiments usingincomplete factorial design in their study [8]. The main goal of incomplete fac-torial design experiments is to identify important factors of the experiments andto produce much less number of experiments compared to full factorial designexperiments. The IFD is a very effective method as experts may not afford toset up many experiments or they may not have enough resources to carry outthose many experiments [11]. The basic idea of IFD is that after identifying im-portant factors of the experiments; balanced experiments are generated in termsof factors. In the sparse matrix sampling [3], parameters of the experiments areset using fewer major reagents (i.e., pH values, type of precipitants, type of salts,etc.) as in IFD. It can be considered as an optimized version of IFD. In SMS,values of type of salts, pH, and type of precipitants are selected based on pastexperiences, and these variables are mostly favorable for protein crystallizationexperiments. The reagents occur based on their frequency in the sparse matrix[10]. This idea was commercialized by Hampton Research [12]. Grid screeningof crystallization conditions [4] is an early method that tries possible differentsolutions exhaustively until the experiments succeed. This takes more time andeffort compared to IFD and SMS. However, it could be the only solution forsome of the proteins that have never or rarely been crystallized.
In the literature, there are also other optimization methods based on IFDand GS [2], [11]. We do not intend to give detail about these methods in thispaper. These studies in macromolecular crystallization generally try to optimizeavailable conditions, which are supposed to yield crystals. Most of these con-ditions are commercially available. In Mimer [7], it may be possible to changethe pH value of the buffer and the weight of the precipitant rather than justchanging one value at a time by visualizing the result. The traditional optimiza-tion techniques do not consider new combinations of reagents. In this paper,we propose a new experimental design method called Associative Experimen-tal Design (AED) that generates candidate conditions by analyzing preliminaryexperimental data. This existing data is analyzed to determine which screeningfactors are most likely to lead to higher scoring outcomes, crystals. Unlike IFD,AED generates unbalanced experiments for protein crystallization that may in-clude novel conditions. This means AED is not a typical optimization methodfor crystallization conditions. In the literature, optimization steps usually in-clude changing the pH value, concentration, weight of precipitants and salts.The AED method finds small but effective number of conditions that may lead
III
to crystallization. The main idea of the AED method is to generate novel condi-tions for crystallization by keeping at least two reagents from promising condi-tions. Basically, the AED analyzes other possible interactions between reagentsto determine new crystallization conditions. In this study, we have generatedcandidate conditions for Nucleoside diphosphate kinase, HAD superfamily hy-drolase, and nucleoside kinase proteins using preliminary experimental results.After obtaining the candidate novel conditions, we have confirmed that AEDmethod yielded high scoring crystals after experimenting in a wet lab.
The rest of the paper is structured as follows. Background information isprovided in Section 2. The proposed method, “Associative Experimental Design(AED),” is explained in Section 3. Experimental results are provided in Section4. Finally, our paper is concluded with the last section.
2 Background
In this section, we provide some information about the phase diagram, which isa useful diagram for setting up protein crystallization experiments. We developAED based on the phase diagram, and we believe that a brief explanation ofit would help reader to understand the problem domain and our method. Inaddition, we are going to provide some brief explanation of Hampton scores inthis section, since we are going to refer those scores throughout the paper.
2.1 Phase Diagram
Normally, a protein is going to dissolve in a liquid up to a point such that thesolvent will not be able to solve any more protein. At that point, the solutionis said to be in equilibrium, and that concentration of the solution is calledsolubility limit [4]. If the concentration of a solution is below the solubility limit,then that solution is said to be undersaturated; if it is exactly on the solubilitylimit, then it is called saturated. When the solution reaches the solubility limit,it is possible to increase its solubility by changing some physical factors such aspH, temperature, etc. If the concentration of the solution is above the solubilitylimit, then the solution will be supersaturated. This is the only region that aprotein crystal can be grown [4]. However, supersaturated solution is not enoughfor crystallization process by itself. A specific amount of activation energy andsome rare sequence of chemical reactions require initiating nucleation of proteincrystallization that eventually yields a protein crystal [5], [4].
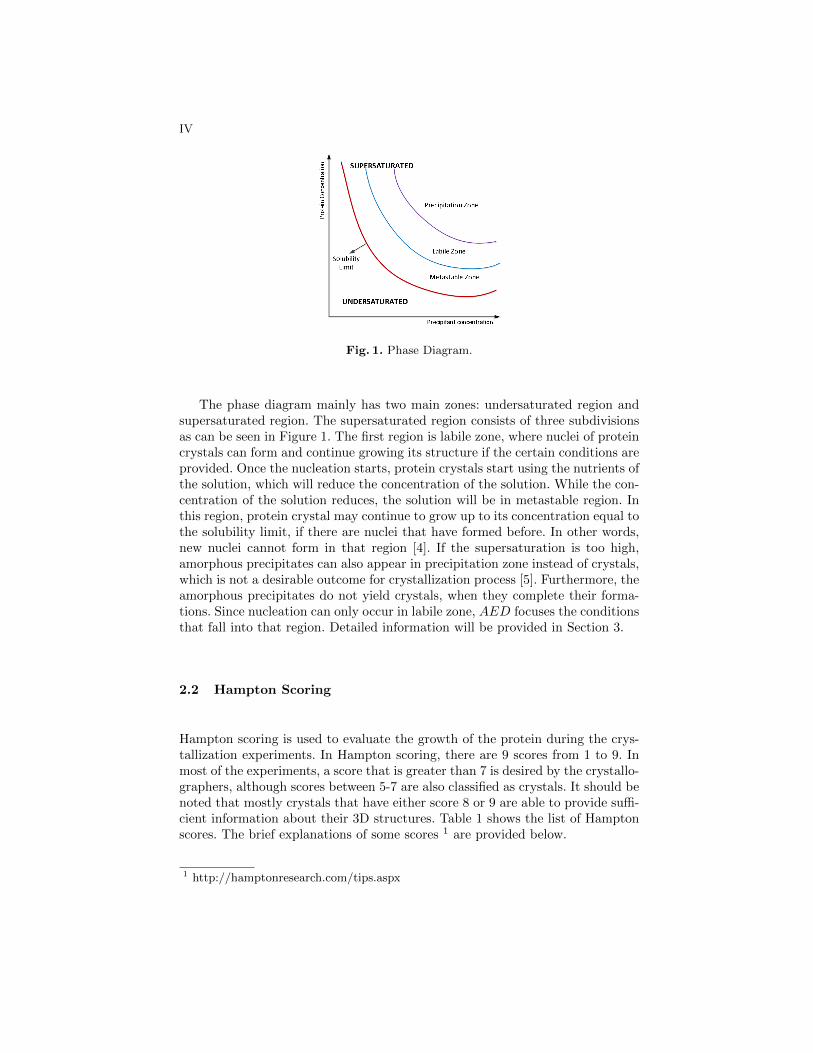
In chemistry, a phase diagram is a graphical representation of different phases(solid, liquid and gas) of a substance with respect to temperature and pressure.In structural biochemistry, a phase diagram mostly represents solubility curveof a protein with respect to some parameters such as precipitant, pH, etc. Sincethe proteins can grow only in supersaturated solutions, it is important to locatesolubility curve based on these parameters [5], [13]. Thus, the phase diagramis useful to set parameters for the experiments properly for X-ray diffractionstudies [14]. Figure 1 shows a visual representation of a phase diagram.
IV
Fig. 1. Phase Diagram.
The phase diagram mainly has two main zones: undersaturated region andsupersaturated region. The supersaturated region consists of three subdivisionsas can be seen in Figure 1. The first region is labile zone, where nuclei of proteincrystals can form and continue growing its structure if the certain conditions areprovided. Once the nucleation starts, protein crystals start using the nutrients ofthe solution, which will reduce the concentration of the solution. While the con-centration of the solution reduces, the solution will be in metastable region. Inthis region, protein crystal may continue to grow up to its concentration equal tothe solubility limit, if there are nuclei that have formed before. In other words,new nuclei cannot form in that region [4]. If the supersaturation is too high,amorphous precipitates can also appear in precipitation zone instead of crystals,which is not a desirable outcome for crystallization process [5]. Furthermore, theamorphous precipitates do not yield crystals, when they complete their forma-tions. Since nucleation can only occur in labile zone, AED focuses the conditionsthat fall into that region. Detailed information will be provided in Section 3.
2.2 Hampton Scoring
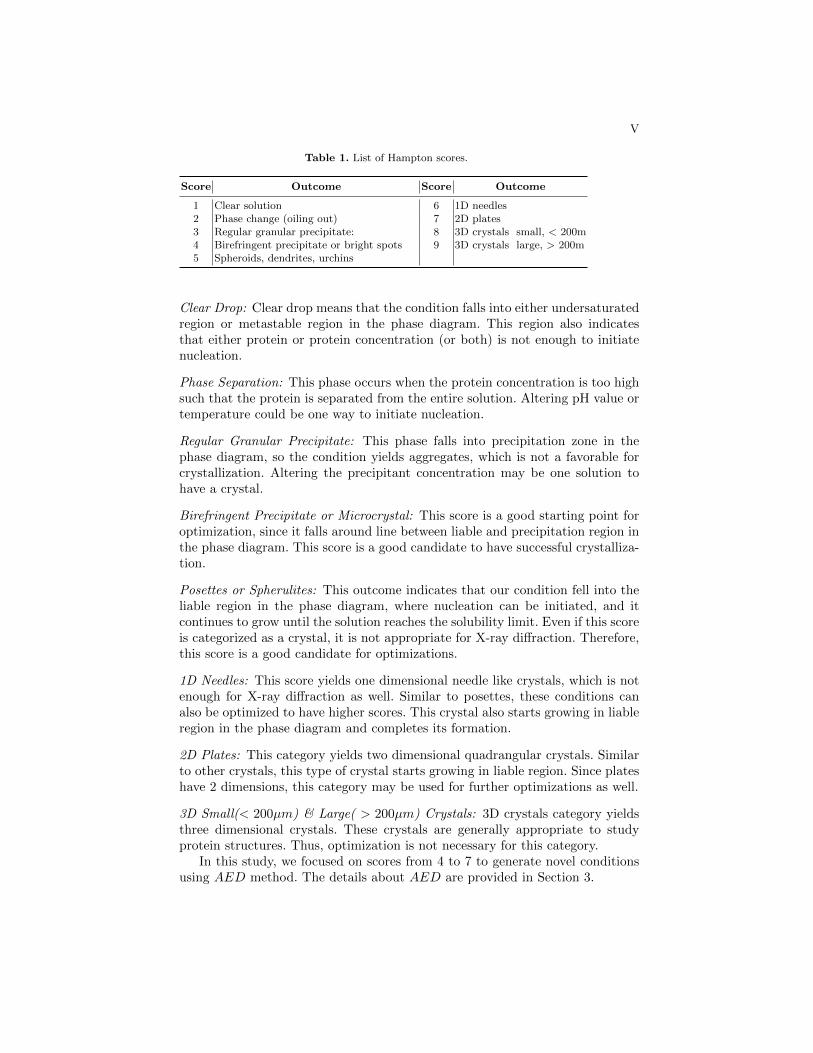
Hampton scoring is used to evaluate the growth of the protein during the crys-tallization experiments. In Hampton scoring, there are 9 scores from 1 to 9. Inmost of the experiments, a score that is greater than 7 is desired by the crystallo-graphers, although scores between 5-7 are also classified as crystals. It should benoted that mostly crystals that have either score 8 or 9 are able to provide suffi-cient information about their 3D structures. Table 1 shows the list of Hamptonscores. The brief explanations of some scores 1 are provided below.
1 http://hamptonresearch.com/tips.aspx
V
Table 1. List of Hampton scores.
Score Outcome Score Outcome
1 Clear solution 6 1D needles2 Phase change (oiling out) 7 2D plates3 Regular granular precipitate: 8 3D crystals small, < 200m4 Birefringent precipitate or bright spots 9 3D crystals large, > 200m5 Spheroids, dendrites, urchins
Clear Drop: Clear drop means that the condition falls into either undersaturatedregion or metastable region in the phase diagram. This region also indicatesthat either protein or protein concentration (or both) is not enough to initiatenucleation.
Phase Separation: This phase occurs when the protein concentration is too highsuch that the protein is separated from the entire solution. Altering pH value ortemperature could be one way to initiate nucleation.
Regular Granular Precipitate: This phase falls into precipitation zone in thephase diagram, so the condition yields aggregates, which is not a favorable forcrystallization. Altering the precipitant concentration may be one solution tohave a crystal.
Birefringent Precipitate or Microcrystal: This score is a good starting point foroptimization, since it falls around line between liable and precipitation region inthe phase diagram. This score is a good candidate to have successful crystalliza-tion.
Posettes or Spherulites: This outcome indicates that our condition fell into theliable region in the phase diagram, where nucleation can be initiated, and itcontinues to grow until the solution reaches the solubility limit. Even if this scoreis categorized as a crystal, it is not appropriate for X-ray diffraction. Therefore,this score is a good candidate for optimizations.
1D Needles: This score yields one dimensional needle like crystals, which is notenough for X-ray diffraction as well. Similar to posettes, these conditions canalso be optimized to have higher scores. This crystal also starts growing in liableregion in the phase diagram and completes its formation.
2D Plates: This category yields two dimensional quadrangular crystals. Similarto other crystals, this type of crystal starts growing in liable region. Since plateshave 2 dimensions, this category may be used for further optimizations as well.
3D Small(< 200µm) & Large( > 200µm) Crystals: 3D crystals category yieldsthree dimensional crystals. These crystals are generally appropriate to studyprotein structures. Thus, optimization is not necessary for this category.
In this study, we focused on scores from 4 to 7 to generate novel conditionsusing AED method. The details about AED are provided in Section 3.
VI
3 Proposed Method: Associative ExperimentalDesign(AED)
3.1 Motivation
In this research, we have generated some crystal screens for a few specific pro-teins using preliminary crystal screen data with their Hampton scores. We use4 different proteins to test our approach. There are 86 different crystal screensin our dataset for the protein Tt189 without considering the conditions havingmultiple types of salts or precipitants. This data set contains 9 different saltconcentration values, 23 different type of salts, 7 different pH values, 45 differentprecipitant concentration values, 85 different precipitants, 3 different proteinconcentration values, where the concentrations and pH values are continuousdata and the other features are categorical data. (Note that type of buffer isnot considered, since it is generally correlated with pH value.) If we considerfull factorial design, it means that we need to set up approximately 16,627,275different experiments for a single protein based on this dataset without consid-ering the continuity of some of the variables and this is not feasible. In thisresearch, our goal is to generate less number of conditions rather than 16.6Mthat is more likely to form a crystal. To achieve this goal, we proposed a methodcalled “Associative Experimental Design (AED).”
3.2 Method
Associative experimental design generates a new set of experiments by analyzingthe scores of experiments already evaluated in the lab. We use almost the samescores from 1 to 9 provided in Table 1. Since we are using trace fluorescentlabeling (TFL) [15], a score of 4 is assigned to outcomes giving “bright spot”lead conditions as an exceptional case.
We start with the notation for screening conditions and scores. Let
D = {(Ci, Hi) | (C1, H1) , (C2, H2), ..., (Cn, Hn)} (1)
be our dataset consisting of the pairs that include features of the conditions Ci
and their scores Hi for the ith solution in the dataset. For simplicity we discardedconditions that have more than one type of salt or precipitant. We only focusedon three main components of the remaining conditions: type of precipitant, typeof salt and pH value of the solution, while separating their concentrations. Let
Ci = {Si [sci] , pHi, Pi [pci]} (2)
be the set of all the features of ith crystal screen where i is 1 ≤ i ≤ n, n isthe number of samples in our dataset, Si [sci] represents type of salt with theconcentration of sci, pHi value represents the pH of ith solution, and Pi [pci]represents type of precipitant with the concentration of pci. Let R be a subset
VII
of D that contains the crystal screen pairs having a score greater than or equalto lowH and less than or equal to highH :
R = {(Ci, Hi) | (Ci, Hi) ∈ D, lowH ≤ Hi ≤ highH , 1 ≤ i ≤ n} (3)
In our preliminary experiments, we set lowH = 4 and highH = 7. Thus, thesamples that have a score of 8 or 9 are excluded to generate unbiased conditionsfor the proteins. Similarly, for simplicity the samples that have score from 1 to3 have not been included in the result set.
The AED analysis process consists of two major stages. In the first stage,we process the data to reduce its size as we stated before. Let
Rc = {Ci | (Ci, Hi) ∈ R} (4)
be the set of conditions of R, where SCi = {sc1, sc2, ..., sck} represents the allunique concentration values of the ith salt, and PCi = {pc1, pc2, ..., pck} repre-sents the all unique concentration values of ith precipitant. Then, we compareeach Ci and Cj condition pairs where i 6= j in RC . If there is a common com-ponent between Ci and Cj , then we generate the candidate conditions set Zbased on these two sets. For example, let Ci = {Si [SCi] , pHi, Pi [PCi]} andCj = {Sj [SCj ] , pHj , Pj [PCj ]} where Si = Sj (i.e., the type of salt is com-mon in Ci and Cj). We generate two new conditions Z by switching the othercomponents among each other. Thus,
Z = {{Si [SCi] ,pHj,Pi [PCi]} , {Si [SCi] ,pHi,Pj [PCj]}} (5)
is the set of candidate crystal screens for the pair Ci and Cj . Similarly, candidatescreens can be generated where pH value or precipitant is common between thepairs as well. After we generate candidate combinations using these components,we remove conditions that are replicated or are already in the training data. Inthe second stage of our method, we assign unique values of concentrations, gen-erate SCi and PCi, and unique type of buffers that were used in the preliminarydata to generate finalized crystal screens. At the end, we merge generated re-sults from two stages of the method. The identified significant factors are outputand used to generate condition screens with factor concentrations varied overthe indicated ranges from the analysis. These screens are then used to preparea new plate. Figure 2 shows the flow diagram of AED.
Fig. 2. Flow diagram of AED.
VIII
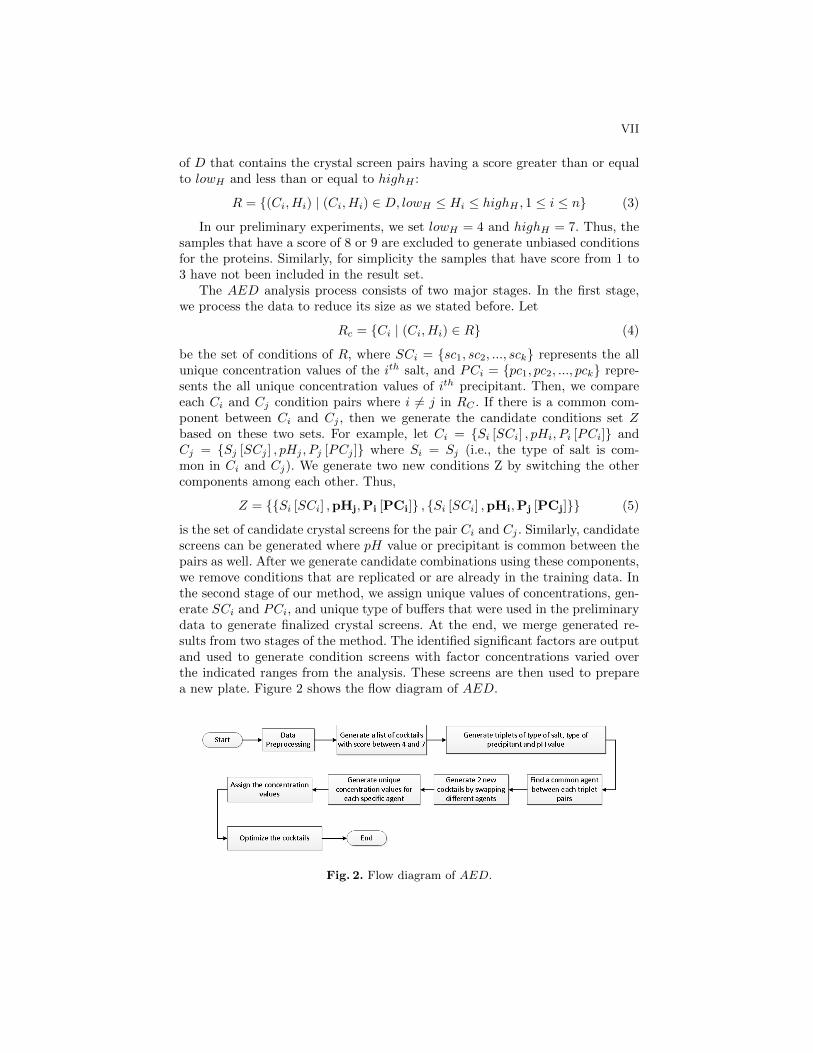
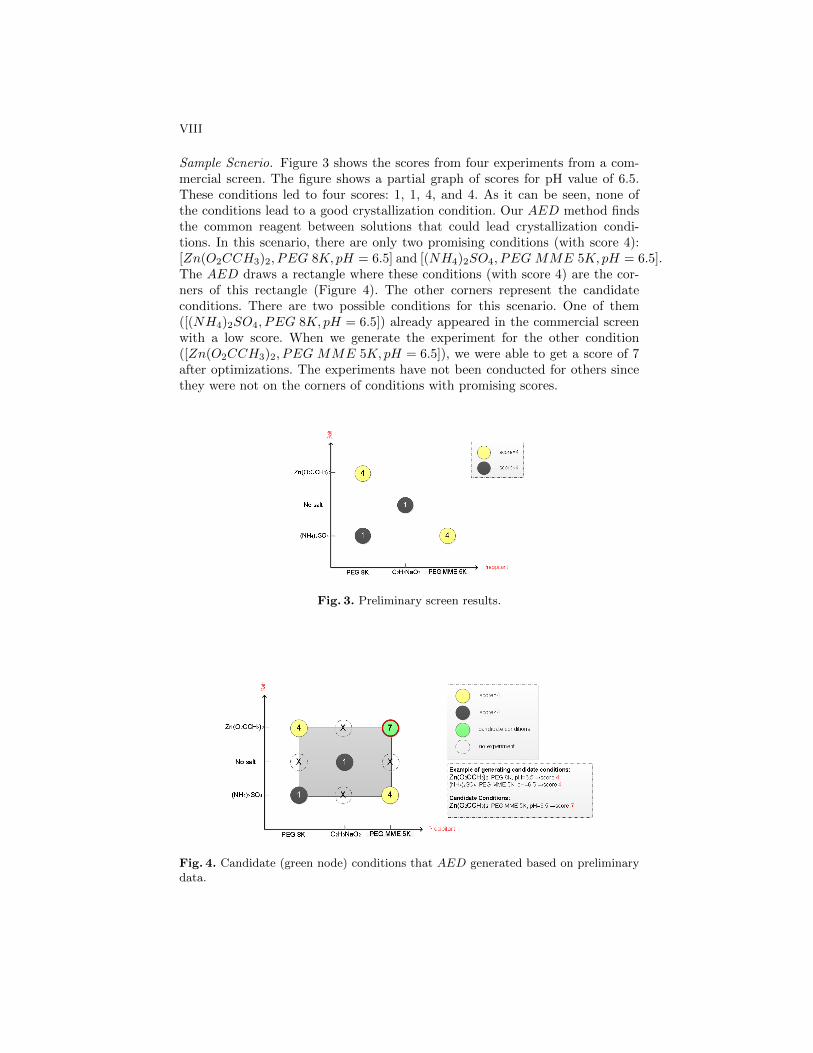
Sample Scnerio. Figure 3 shows the scores from four experiments from a com-mercial screen. The figure shows a partial graph of scores for pH value of 6.5.These conditions led to four scores: 1, 1, 4, and 4. As it can be seen, none ofthe conditions lead to a good crystallization condition. Our AED method findsthe common reagent between solutions that could lead crystallization condi-tions. In this scenario, there are only two promising conditions (with score 4):[Zn(O2CCH3)2, PEG 8K, pH = 6.5] and [(NH4)2SO4, PEG MME 5K, pH = 6.5].The AED draws a rectangle where these conditions (with score 4) are the cor-ners of this rectangle (Figure 4). The other corners represent the candidateconditions. There are two possible conditions for this scenario. One of them([(NH4)2SO4, PEG 8K, pH = 6.5]) already appeared in the commercial screenwith a low score. When we generate the experiment for the other condition([Zn(O2CCH3)2, PEG MME 5K, pH = 6.5]), we were able to get a score of 7after optimizations. The experiments have not been conducted for others sincethey were not on the corners of conditions with promising scores.
Fig. 3. Preliminary screen results.
Fig. 4. Candidate (green node) conditions that AED generated based on preliminarydata.
IX
We wanted to check that AED is able to generate novel conditions (leadingto crystallization) that do not appear in any commercial screen. A question waswhere to draw the distinction between identical, similar, or different screen condi-tions in comparison to those present in the original or all commercially availablescreens. Using the C6 webtool [16], an exact match to an existing commercialscreen condition gives a score of 0. Variations on that condition (change in oneor both precipitant concentrations, or the buffer and/or pH), give scores > 0,ranging to 1 for completely different conditions. The C6 web tool gives the top10 matches to the input conditions. Our usual first pass optimization approachto a lead condition, having precipitants A and B, is to use four solutions; one at100% A and B, one at 50% A and 100% B, one at 100% A and 50% B, and one at50% each A and B. The buffer is unchanged for all four conditions. Using the C6webtool the greatest difference between the starting and optimization conditionsis for the 50% A and B, with a score of 0.269, using a reference condition of 0.5Mammonium sulfate, 30% PEG 4K, 0.1M Tris-HCl pH 8.5. This is rounded to 0.3for our threshold score for a different screen condition. Scores > 0 but ≤ 0.3 aretaken to be similar to an existing screen condition, with a score of 0 indicatingidentity.
4 Experiments
4.1 Dataset
The Associated Experimental Design (AED) approach was evaluated using pro-teins derived from the hyperthermophile Thermococcus thioreducens [1]. Sixcrystallization screening plates, three using TFL’d and three unlabeled protein,all with the Hampton Research High Throughput screen (HR2-130) had been setup for each of these proteins as part of a separate experimental program. For thispreliminary test the scores of the results from the second (of the three) platesfor the TFL’d protein were used, as this also includes scores of potential crypticleads indicated by TFL. One was a difficult crystallizer (Tt106, annotated as anucleotide kinase) with no conditions giving needles, plates or 3D crystals; one amoderate crystallizer (Tt82, annotated as a HAD superfamily hydrolase), withone condition giving 2D plates but none giving needles or 3D crystals; one aneasy crystallizer (Tt189, annotated as a nucleotide diphosphate kinase) havingfive conditions that gave 3D crystals).
4.2 Results & Discussion
The crystallization screen components that were determined to have the great-est positive effect were determined by the AED software, and a 96 conditionoptimization screen generated using those components for each protein. Opti-mization was in 96 well sitting drop plates, with the protein being TFL’d tofacilitate results analysis. The successful conditions were identified and scored.Those conditions giving 2D and 3D crystals were then used to search the C6
X
database [16] for similar conditions across all commercially available screens asa determination of their uniqueness. As the optimization screens had differentconcentration ratios for the same precipitant pairs, each ratio where a hit wasobtained was searched and the lowest C6 score was used.
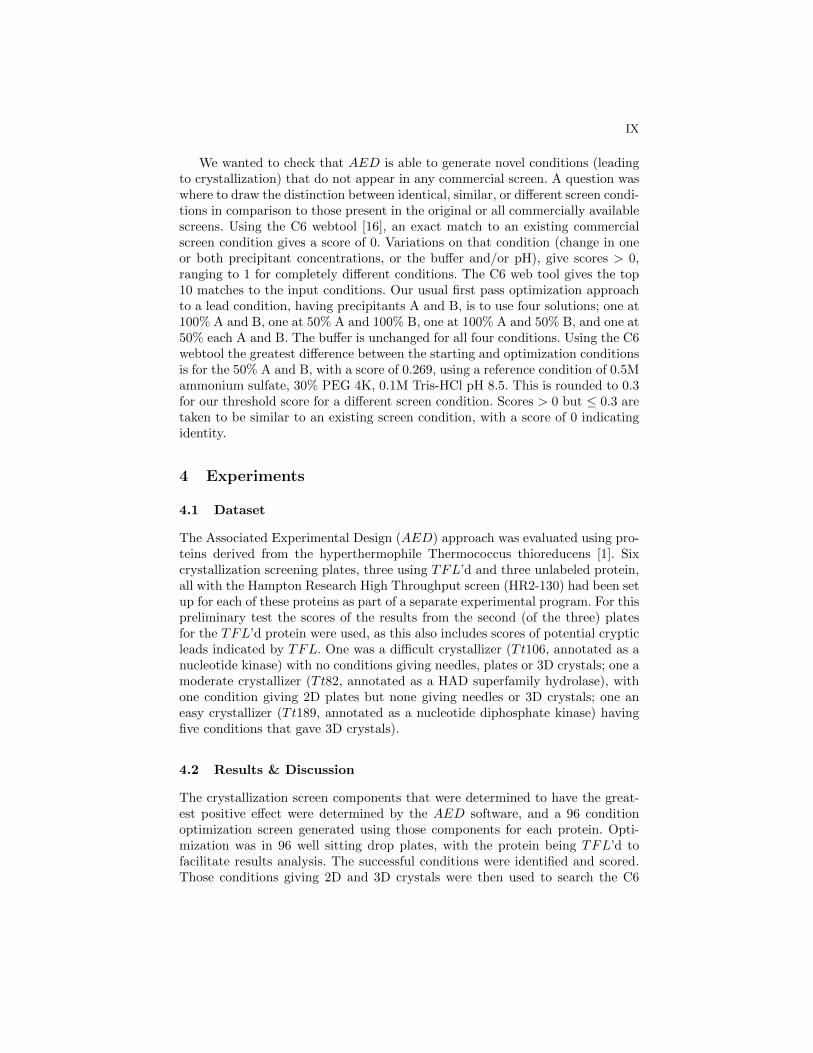
The moderate and difficult proteins, Tt82 and Tt106 respectively, were sub-jected to a second round of optimization based on the results from the first. Inthe case of Tt82 the second round was a grid screen around a condition thatgave an aggregated mass of plates. Many of the second round optimization wellsalso showed clusters of plates. However, in one case a single plate was observed.Although not pursued, the plate clusters could be excellent starting materialfor seeded crystallizations, both with the original and first stage optimizationscreening conditions. The second optimization round for protein Tt106 usedionic liquids as an additive [17], with the lead conditions selected from thoseoutcomes giving “bright spots” in the first round. Within one week one familyof conditions had 3D crystals, Figure 5. Novelty of the second round conditionswas determined from the grid screen condition for Tt82, while it was based onthe parent condition for Tt106. Additional lead conditions were apparent in theoptimization screens for Tt82 and Tt106.
Fig. 5. White light (A) and fluorescent images (B) of second round optimization crys-tals of Tt106. Crystallization conditions: 0.2M Na/K Tartrate, 0.75M Ammonium Sul-fate, 0.1 M NaCitrate, pH 5.6, 0.1M 1-hexyl, 3-methyl imidazolium chloride. Scale baris 300µm. All images are to the same scale.
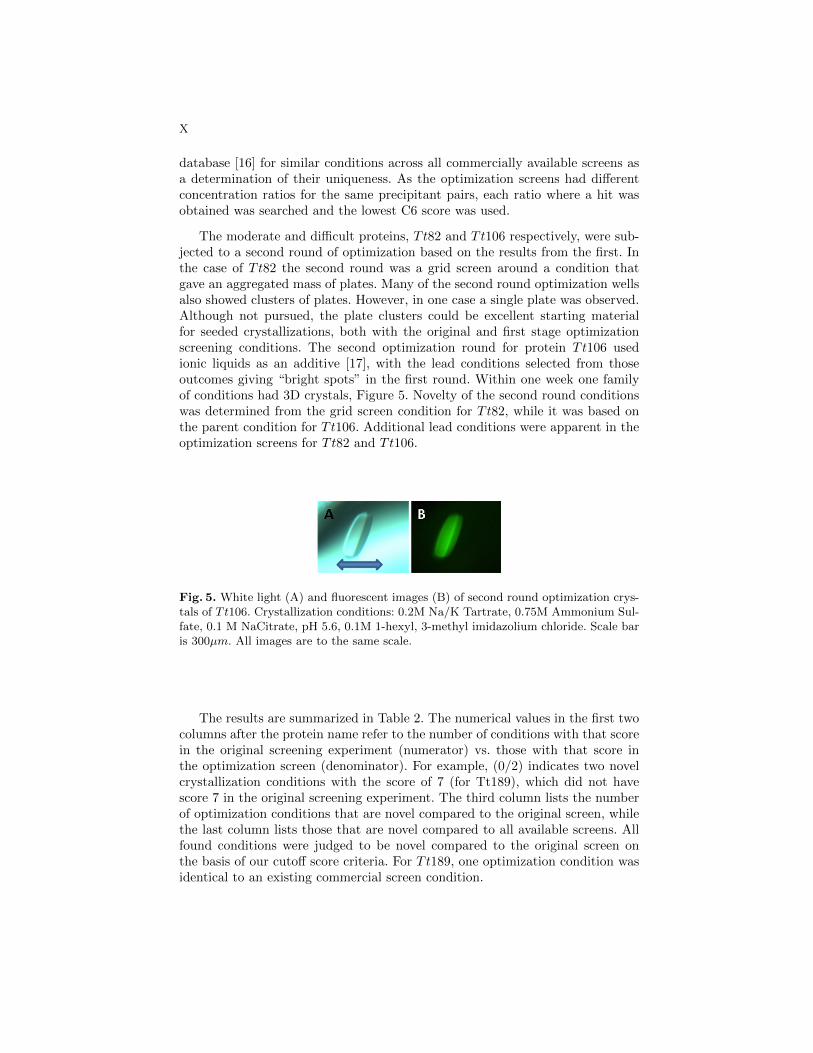
The results are summarized in Table 2. The numerical values in the first twocolumns after the protein name refer to the number of conditions with that scorein the original screening experiment (numerator) vs. those with that score inthe optimization screen (denominator). For example, (0/2) indicates two novelcrystallization conditions with the score of 7 (for Tt189), which did not havescore 7 in the original screening experiment. The third column lists the numberof optimization conditions that are novel compared to the original screen, whilethe last column lists those that are novel compared to all available screens. Allfound conditions were judged to be novel compared to the original screen onthe basis of our cutoff score criteria. For Tt189, one optimization condition wasidentical to an existing commercial screen condition.
XI
Table 2. Summary of Experiments
Protein AnnotatedFunction
HSHT Screen b Optimize Screen Novel Cond. vs Novel Cond. vsScore = 7 Score = 8, 9 HSHT Screen* All Screens*
Tt189 (Nucleosidediphosphate kinase)
0 / 2 5 / 3 5 4
Tt82 (HAD superfam-ily hydrolase)
1 / 1 0 / 1 2 2
Tt106 (Nucleoside ki-nase)
0 / 0 0 / 1 1 1
* Using C6 tool for scores of 7, 8, & 9 threshold value of 0.3
b HSHT :Hampton Screen High-Throughput
5 Conclusion & Future Work
According to Table 2, AED generated 7 novel conditions compared to com-mercially available conditions for 3 different proteins derived from the hyper-thermophile Thermococcus thioreducens [1]. The results obtained indicate thatscored results from commercially available screens can be analyzed, and thatcomponents that may contribute to the crystallization of the macromoleculecan be derived. Not surprisingly, a number of novel conditions were found forthe facile crystallizer (Tt189). However, conditions were also found for both themoderate and difficult crystallizers, one of which had not shown any results ofneedles or better in the original screens (Tt106). For all three proteins crystal-lization conditions were obtained that were novel combinations of the identifiedfactors.
These results show that AED is an efficient tool to generate novel conditionsbased on existing experimental results, which helps to save time and resources,as well as facilitating more rapid progress. In the future, we plan to includethe conditions that have scores from 1 to 3 into AED analysis. Thus, we maygenerate novel conditions that may yield a successful outcome. We are also goingto work on the correlation between original pair of conditions and candidateconditions by analyzing their scores. By using the scores of the original pairs, weplan to rank the candidate conditions to determine the conditions for a 96-wellplate.
References
1. E. V. Pikuta, D. Marsic, T. Itoh, A. K. Bej, J. Tang, W. B. Whitman, J. D.Ng, O. K. Garriott, R. B. Hoover, Thermococcus thioreducens sp. nov., a novelhyperthermophilic, obligately sulfur-reducing archaeon from a deep-sea hydrother-mal vent, International journal of systematic and evolutionary microbiology 57 (7)(2007) 1612–1618.
2. A. McPherson, B. Cudney, Optimization of crystallization conditions for biologicalmacromolecules, Structural Biology and Crystallization Communications 70 (11)(2014) 1445–1467.
XII
3. J. Jancarik, S.-H. Kim, Sparse matrix sampling: a screening method for crystal-lization of proteins, Journal of applied crystallography 24 (4) (1991) 409–411.
4. A. McPherson, Crystallization of Biological Macromolecules, Cold Spring HarborLaboratory Press, 1999.URL http://books.google.com/books?id=EDNRAAAAMAAJ
5. N. Asherie, Protein crystallization and phase diagrams, Methods 34 (3) (2004)266–272.
6. R. C. Stevens, High-throughput protein crystallization, Current opinion in struc-tural biology 10 (5) (2000) 558–563.
7. D. E. Brodersen, G. R. Andersen, C. B. F. Andersen, Mimer: an automatedspreadsheet-based crystallization screening system, Acta Crystallographica Sec-tion F 69 (7) (2013) 815–820. doi:10.1107/S1744309113014425.URL http://dx.doi.org/10.1107/S1744309113014425
8. C. W. Carter Jr, C. W. Carter, Protein crystallization using incomplete factorialexperiments, J. Biol. Chem 254 (23) (1979) 12219–12223.
9. C. Abergel, M. Moulard, H. Moreau, E. Loret, C. Cambillau, J. C. Fontecilla-Camps, Systematic use of the incomplete factorial approach in the design of pro-tein crystallization experiments., Journal of Biological Chemistry 266 (30) (1991)20131–20138.
10. J. A. Doudna, C. Grosshans, A. Gooding, C. E. Kundrot, Crystallization of ri-bozymes and small rna motifs by a sparse matrix approach, Proceedings of theNational Academy of Sciences 90 (16) (1993) 7829–7833.
11. J. R. Luft, J. Newman, E. H. Snell, Crystallization screening: the influence of his-tory on current practice, Structural Biology and Crystallization Communications70 (7) (2014) 835–853.
12. E. H. Snell, R. M. Nagel, A. Wojtaszcyk, H. O’Neill, J. L. Wolfley, J. R. Luft,The application and use of chemical space mapping to interpret crystallizationscreening results, Acta Crystallographica Section D: Biological Crystallography64 (12) (2008) 1240–1249.
13. H. Yang, A. C. Rasmuson, Phase equilibrium and mechanisms of crystallization inliquid–liquid phase separating system, Fluid Phase Equilibria 385 (2015) 120–128.
14. K. Baumgartner, L. Galm, J. Notzold, H. Sigloch, J. Morgenstern, K. Schleining,S. Suhm, S. A. Oelmeier, J. Hubbuch, Determination of protein phase diagramsby microbatch experiments: Exploring the influence of precipitants and ph, Inter-national journal of pharmaceutics 479 (1) (2015) 28–40.
15. E. Forsythe, A. Achari, M. L. Pusey, Trace fluorescent labeling for high-throughputcrystallography, Acta Crystallographica Section D: Biological Crystallography62 (3) (2006) 339–346.
16. J. Newman, V. J. Fazio, B. Lawson, T. S. Peat, The c6 web tool: a resource forthe rational selection of crystallization conditions, Crystal Growth & Design 10 (6)(2010) 2785–2792.
17. M. L. Pusey, M. S. Paley, M. B. Turner, R. D. Rogers, Protein crystallization usingroom temperature ionic liquids, Crystal growth & design 7 (4) (2007) 787–793.