protein aggregation and hardening of nutritional … - labuza - protein...protein aggregation and...
TRANSCRIPT
Protein aggregation and hardening of nutritional bars as f(moisture)
Ted Labuza Peng Zhou & Amy TranUniversity of Minnesota
This research was supported by USDA, DMI and the Davisco Co.
Slide # 2
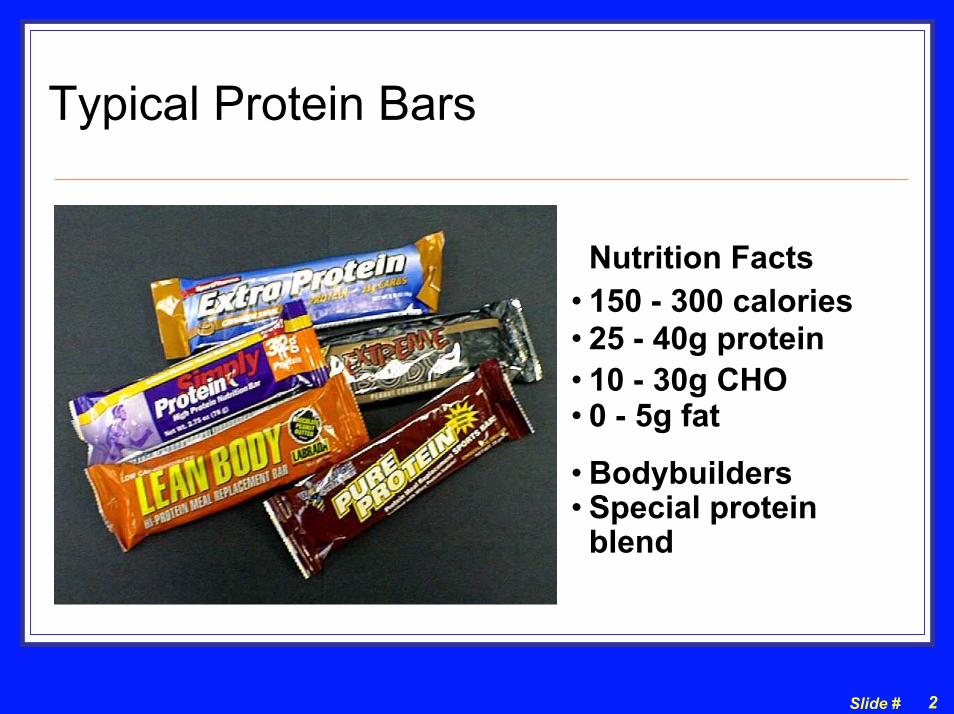
Typical Protein Bars
Nutrition Facts• 150 - 300 calories• 25 - 40g protein• 10 - 30g CHO• 0 - 5g fat
• Bodybuilders• Special protein
blend
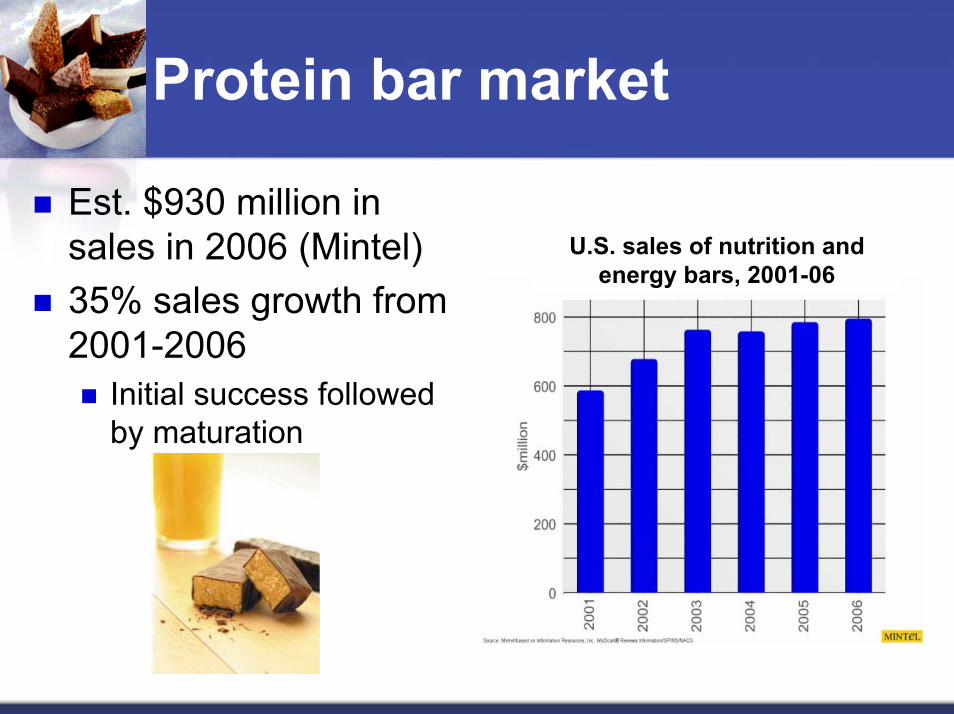
Protein bar market
Est. $930 million in sales in 2006 (Mintel)35% sales growth from 2001-2006
Initial success followed by maturation
U.S. sales of nutrition and energy bars, 2001-06
Slide # 4
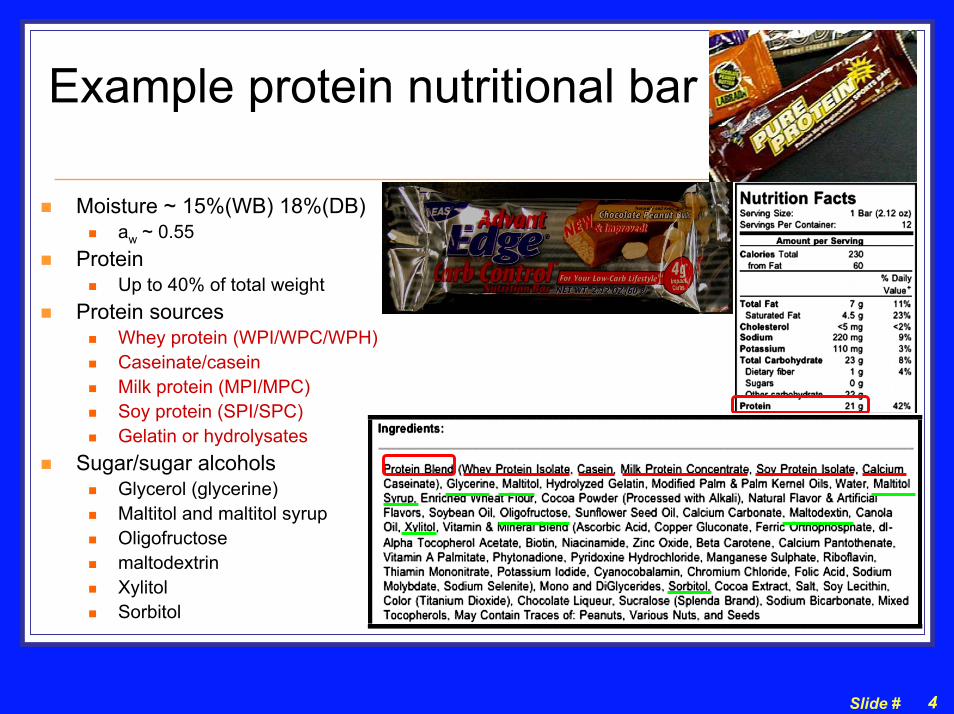
Example protein nutritional bar
Moisture ~ 15%(WB) 18%(DB)aw ~ 0.55
ProteinUp to 40% of total weight
Protein sourcesWhey protein (WPI/WPC/WPH)Caseinate/caseinMilk protein (MPI/MPC) Soy protein (SPI/SPC)Gelatin or hydrolysates
Sugar/sugar alcoholsGlycerol (glycerine)Maltitol and maltitol syrupOligofructosemaltodextrinXylitolSorbitol
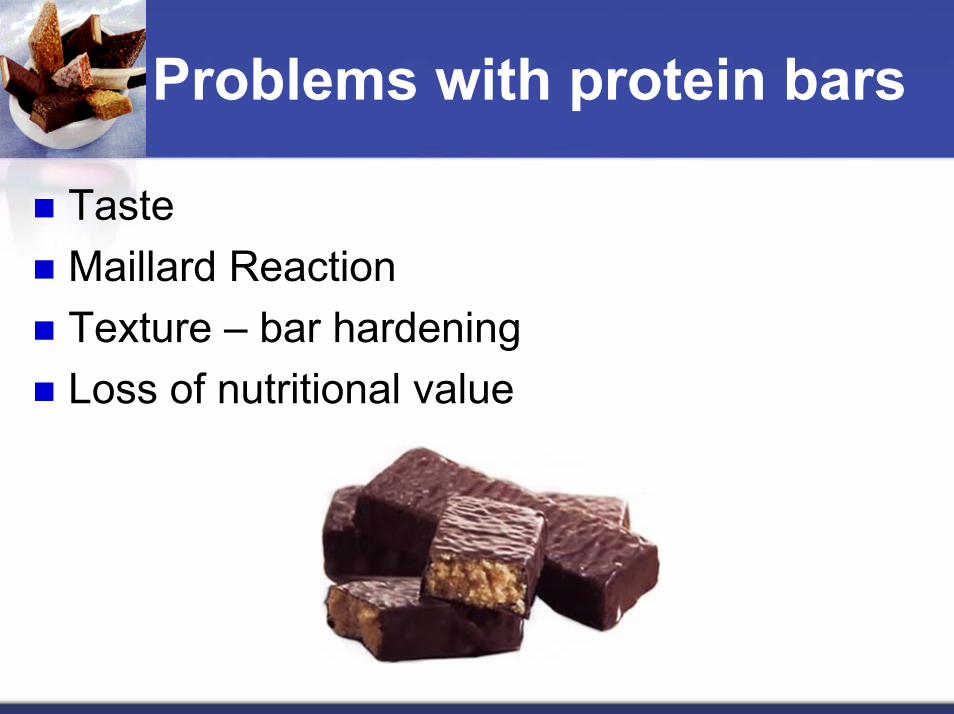
Problems with protein bars
TasteMaillard ReactionTexture – bar hardeningLoss of nutritional value
Slide # 6
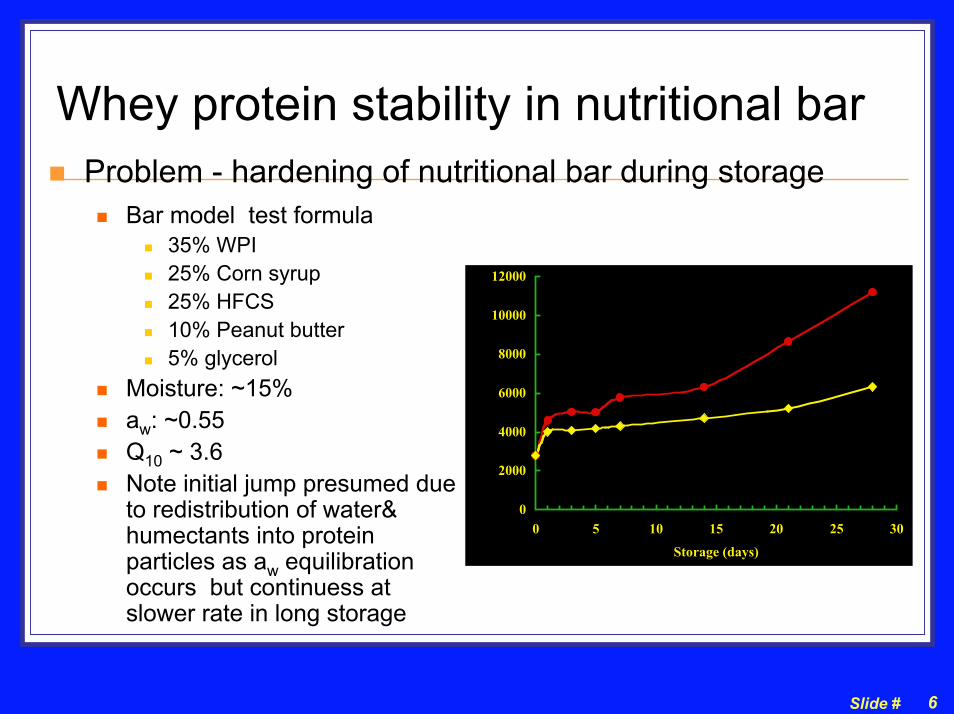
Whey protein stability in nutritional barProblem - hardening of nutritional bar during storage
Bar model test formula35% WPI25% Corn syrup25% HFCS10% Peanut butter5% glycerol
Moisture: ~15%aw: ~0.55Q10 ~ 3.6 Note initial jump presumed due to redistribution of water& humectants into protein particles as aw equilibration occurs but continuess at slower rate in long storage
0
2000
4000
6000
8000
10000
12000
0 5 10 15 20 25 30
Storage (days)
Slide # 7
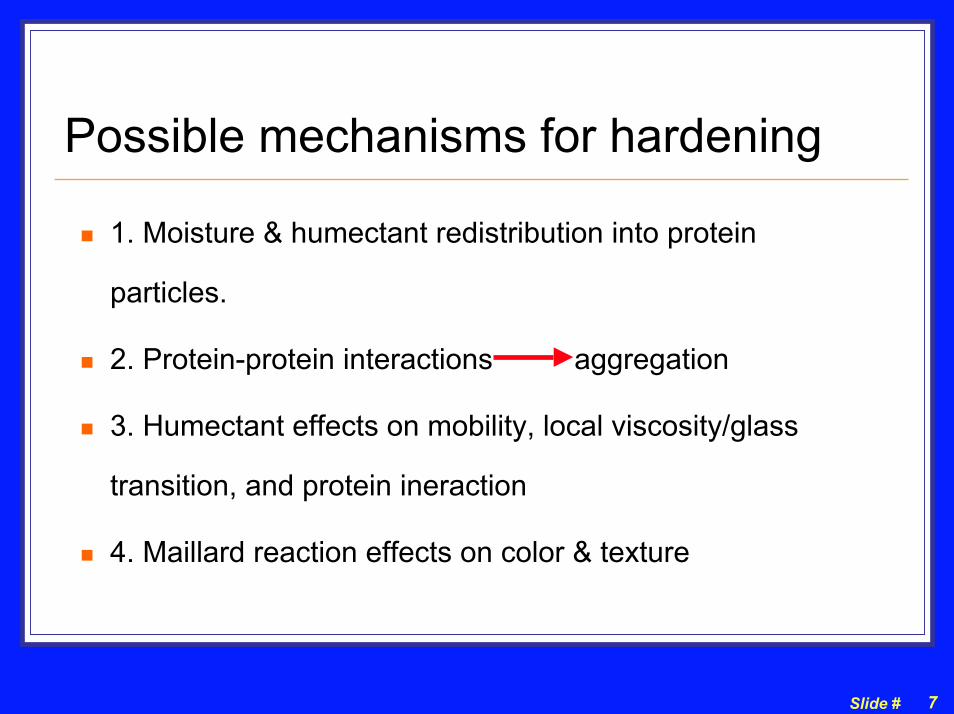
Possible mechanisms for hardening
1. Moisture & humectant redistribution into protein
particles.
2. Protein-protein interactions aggregation
3. Humectant effects on mobility, local viscosity/glass
transition, and protein ineraction
4. Maillard reaction effects on color & texture
Slide # 8
Why does hardening occur?1. Initial redistribution of water/humectants
Commercial bar model (2) stored at 35 degree C
QuickTime™ and aTIFF (LZW) decompressor
are needed to see this picture.
Stage A: Redistribution of water/humectants in matrix and particles after mixing
EVIDENCE : slight reduction in water activity over 1st 5 days
Slide # 9
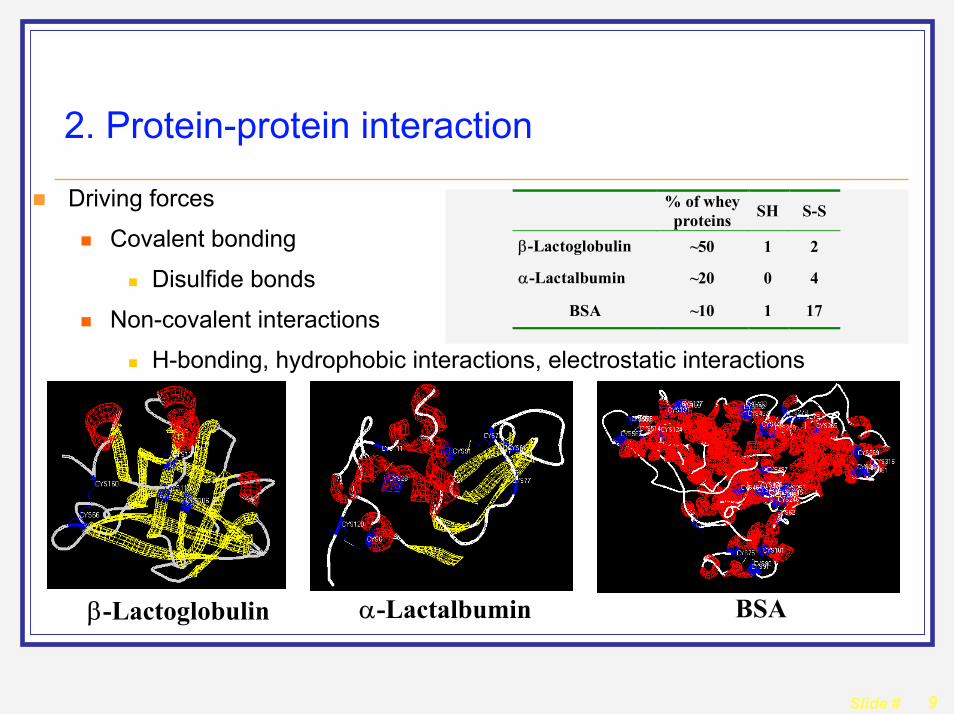
2. Protein-protein interaction
Driving forces
Covalent bonding
Disulfide bonds
Non-covalent interactions
H-bonding, hydrophobic interactions, electrostatic interactions
% of wheyproteins SH S-S
β-Lactoglobulin ~50 1 2
α-Lactalbumin ~20 0 4
BSA ~10 1 17
α-Lactalbumin BSAβ-Lactoglobulin
Slide # 10
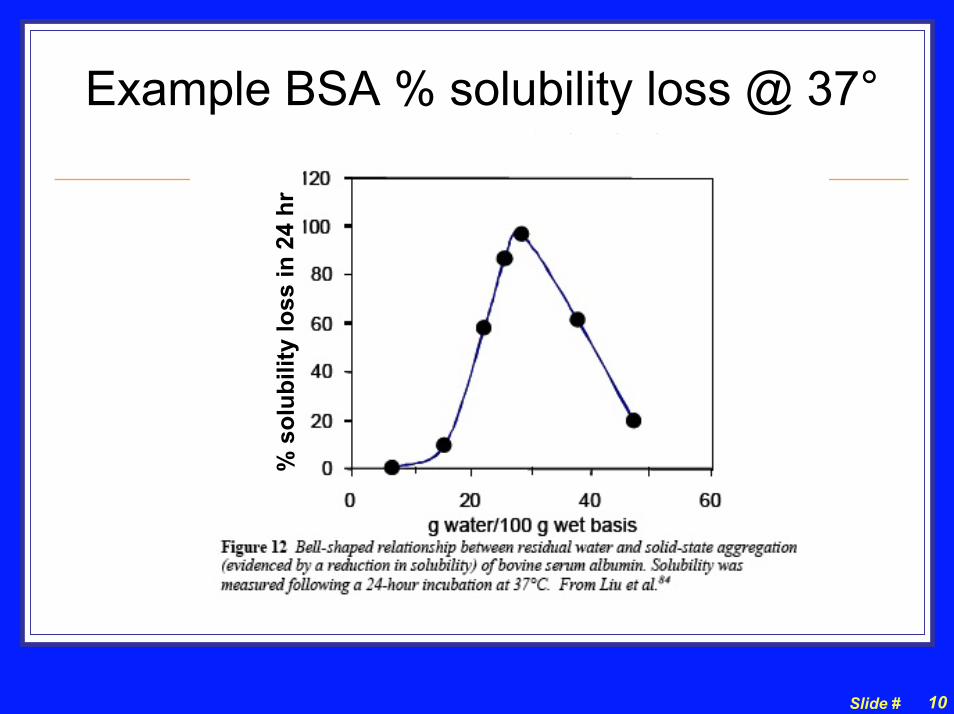
Example BSA % solubility loss @ 37°Liu et al Biotech Bioeng 37:177 1991
% s
olub
ility
loss
in 2
4 hr
Slide # 11
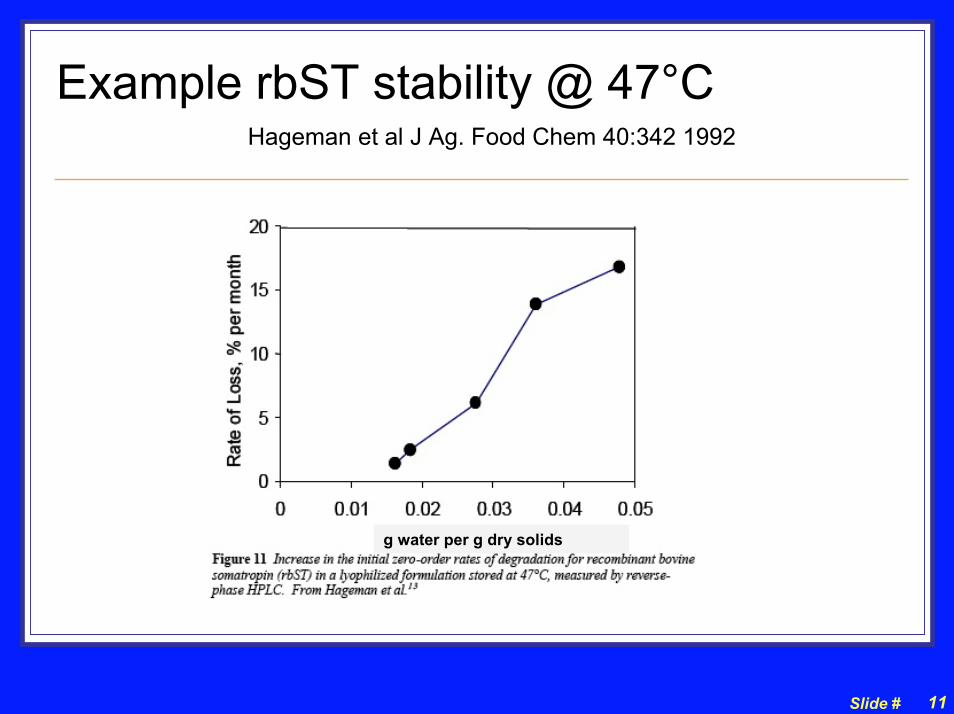
Example rbST stability @ 47°CHageman et al J Ag. Food Chem 40:342 1992
g water per g dry solids
Slide # 12
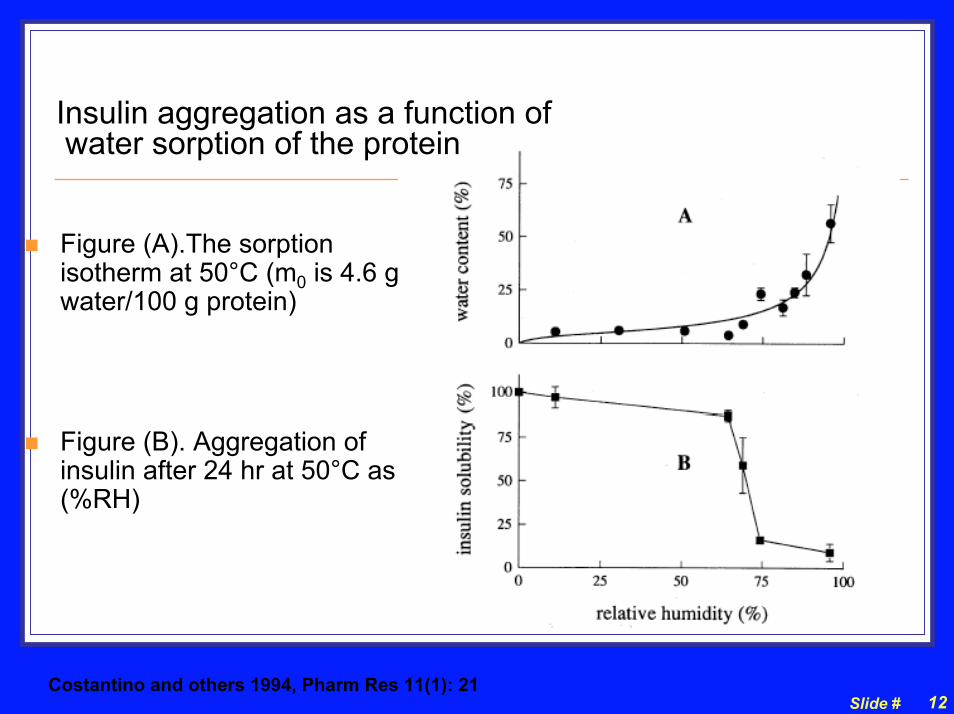
Figure (A).The sorption isotherm at 50°C (m0 is 4.6 g water/100 g protein)
Figure (B). Aggregation of insulin after 24 hr at 50°C as f (%RH)
Insulin aggregation as a function ofwater sorption of the protein
Costantino and others 1994, Pharm Res 11(1): 21
Slide # 13
Simplified bar model system
Bar simplified model system (WB): WPI and buffer system
BioPRO whey protein isolate from Davisco
Protein, 97.4% on dry basis
Lactose, < 1% of dry basis (minimal Maillard reaction)
Fat, 0.3% of dry basis ( lipid oxidation minimal)
Phosphate buffer (10 mM, pH 7)
WPI/buffer: 3/2 (WPI, 60% of the total weight)
0.67:1 water to protein ratio
Sodium Azide (0.05% of the total weight)
Slide # 14
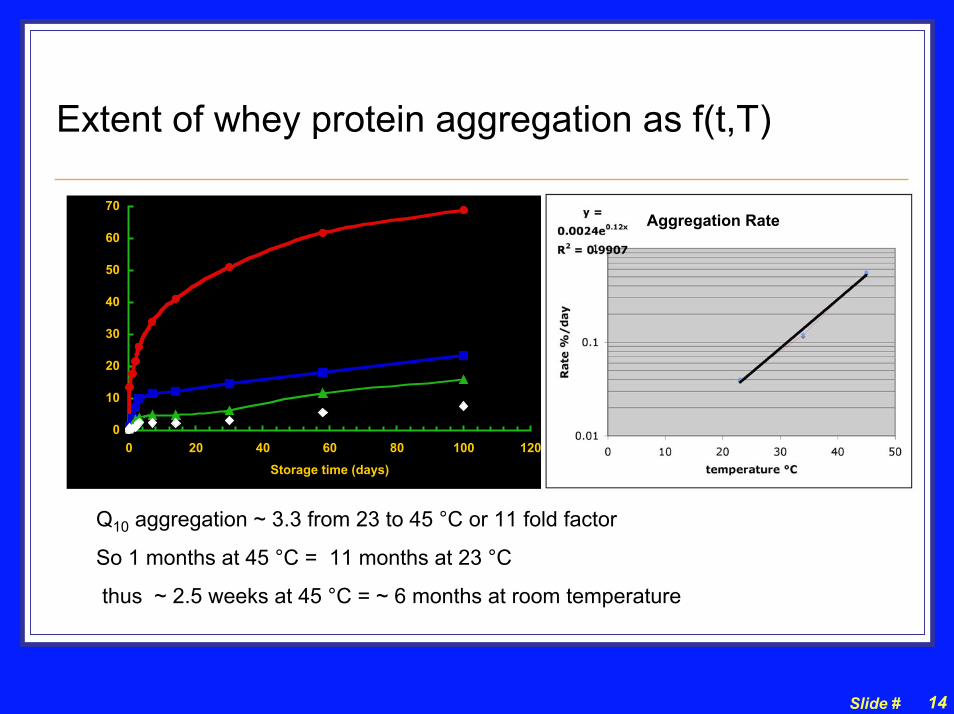
Extent of whey protein aggregation as f(t,T)
0
10
20
30
40
50
60
70
0 20 40 60 80 100 120Storage time (days)
Aggregation Rate
Q10 aggregation ~ 3.3 from 23 to 45 °C or 11 fold factor
So 1 months at 45 °C = 11 months at 23 °C
thus ~ 2.5 weeks at 45 °C = ~ 6 months at room temperature
Slide # 15
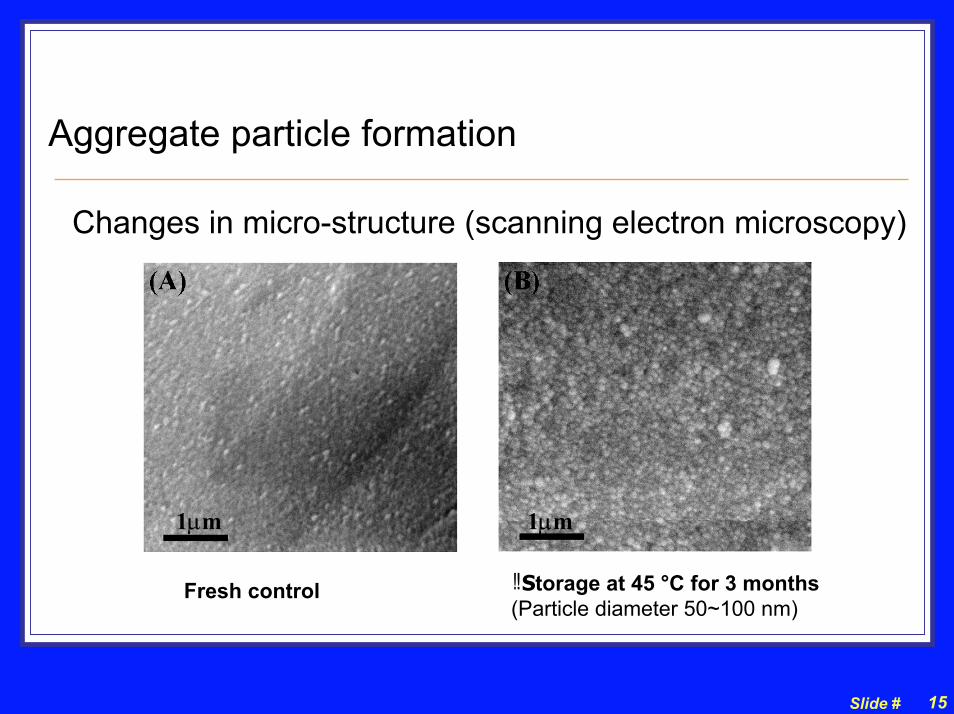
Aggregate particle formation
Changes in micro-structure (scanning electron microscopy)
1µm 1µm
�Storage at 45 °C for 3 months(Particle diameter 50~100 nm)
Fresh control
Slide # 16
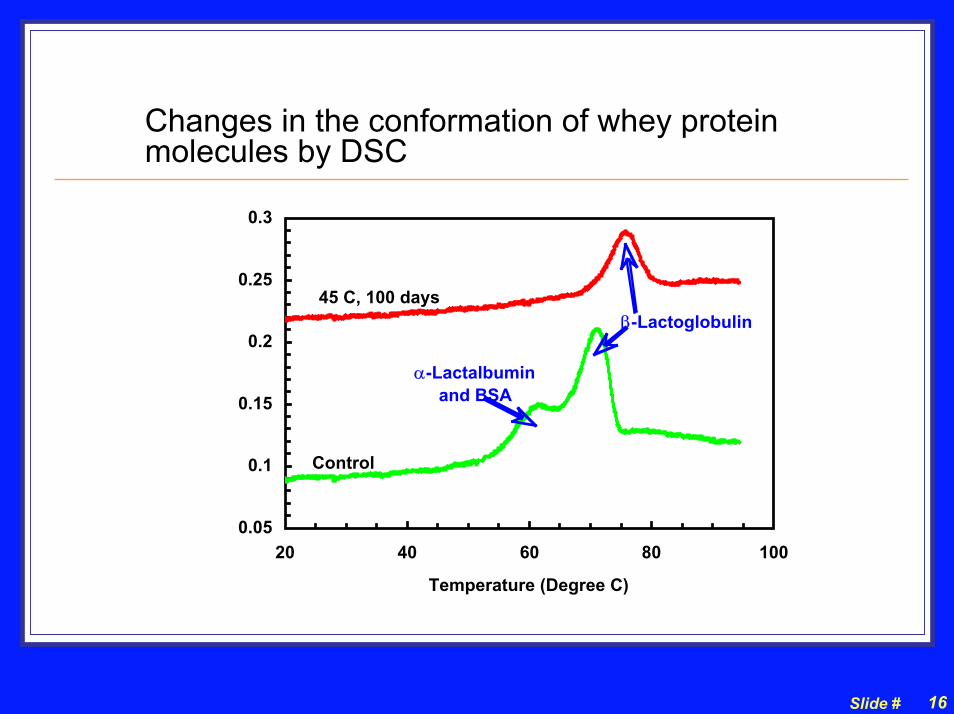
Changes in the conformation of whey protein molecules by DSC
0.05
0.1
0.15
0.2
0.25
0.3
20 40 60 80 100
Temperature (Degree C)
Control
45 C, 100 days
α-Lactalbumin and BSA
β-Lactoglobulin
Slide # 17
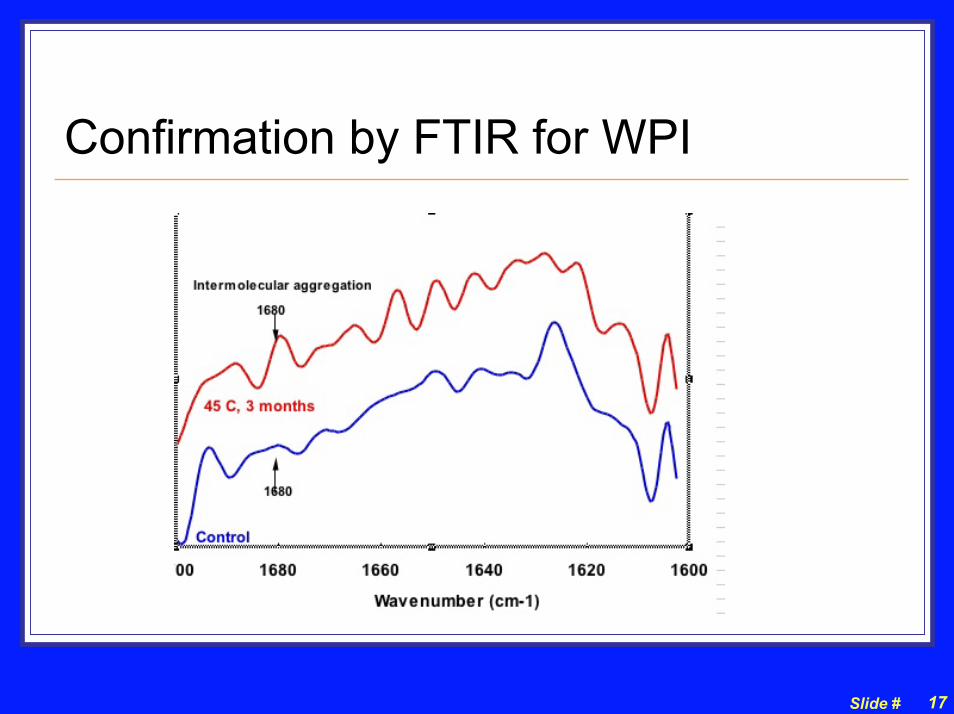
Confirmation by FTIR for WPI
Slide # 18
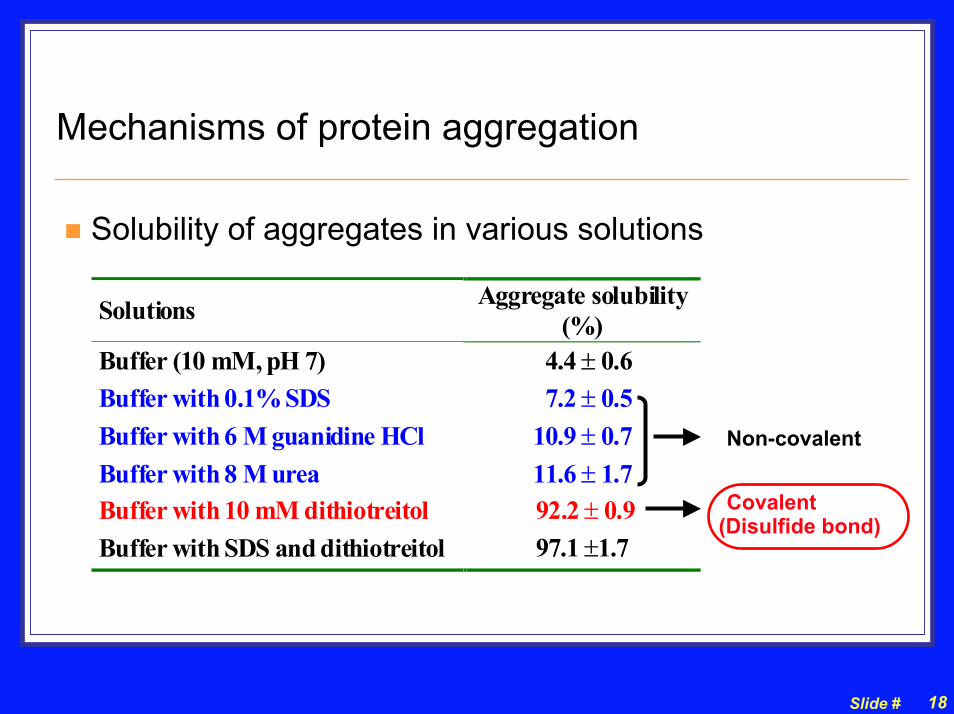
Mechanisms of protein aggregation
Solubility of aggregates in various solutions
Solutions Aggregate solubility(%)
Buffer (10 mM, pH 7) 4.4 ± 0.6Buffer with 0.1% SDS 7.2 ± 0.5Buffer with 6 M guanidine HCl 10.9 ± 0.7Buffer with 8 M urea 11.6 ± 1.7Buffer with 10 mM dithiotreitol 92.2 ± 0.9Buffer with SDS and dithiotreitol 97.1 ±1.7
Non-covalent
Covalent(Disulfide bond)
Slide # 19
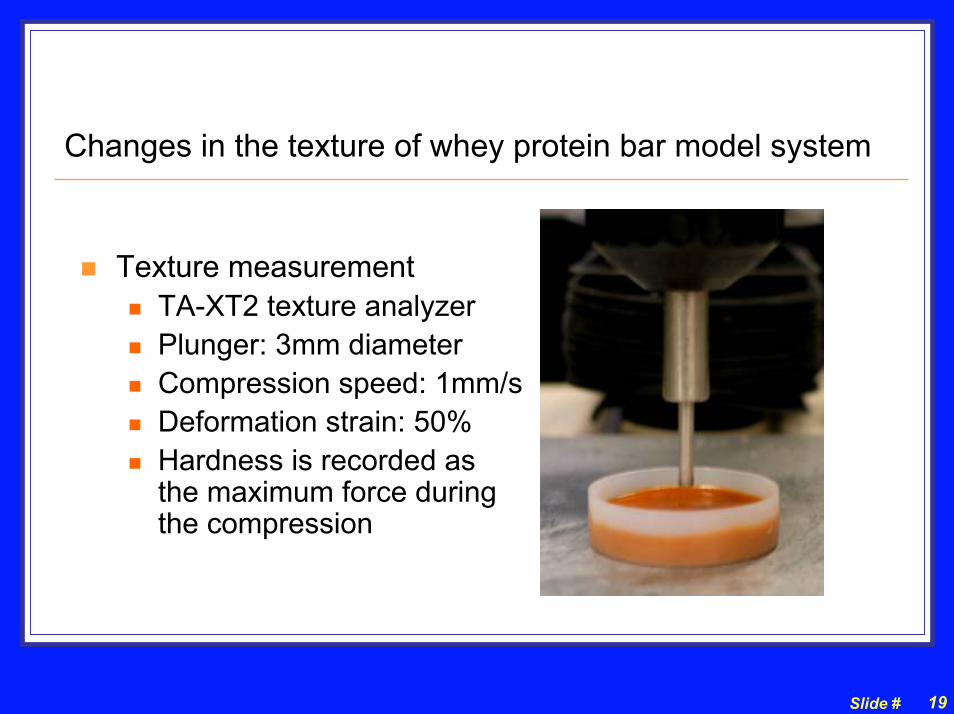
Changes in the texture of whey protein bar model system
Texture measurementTA-XT2 texture analyzerPlunger: 3mm diameterCompression speed: 1mm/sDeformation strain: 50%Hardness is recorded as the maximum force during the compression

Slide # 20
Aggregation and Hardness of whey system vs time
Formation of aggregates Hardening in texture
1
10
100
1 10 100Storage time (days)
Slide # 21
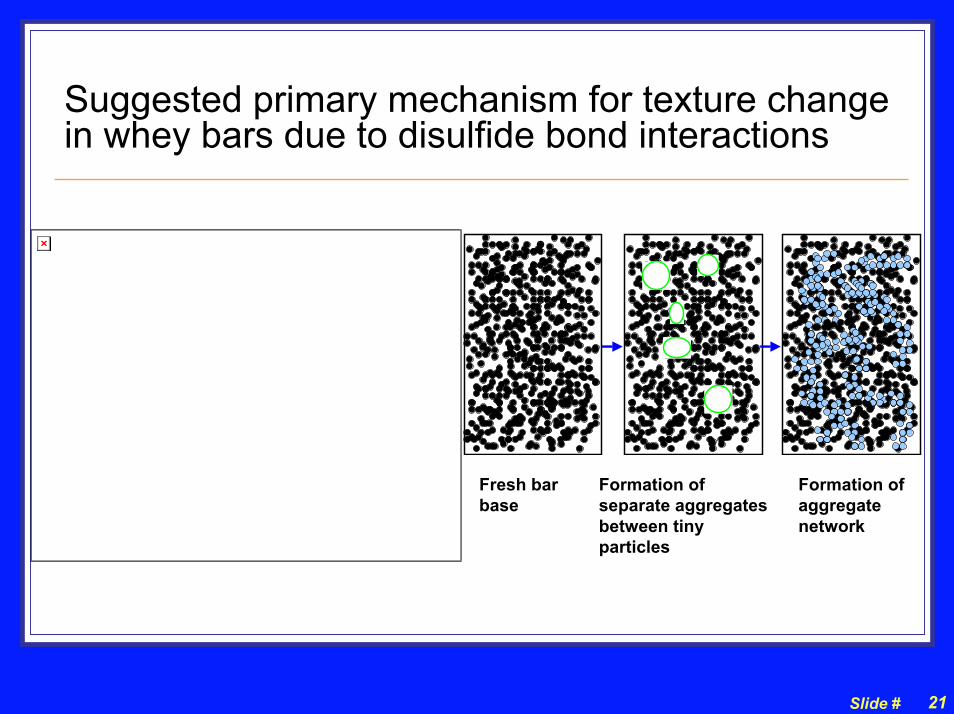
Suggested primary mechanism for texture change in whey bars due to disulfide bond interactions
Fresh bar base
Formation of separate aggregates between tiny particles
Formation of aggregate network
Slide # 22
3. Potential Influence of sugars/polyols (humectants) on hardening in whey bar systems
Bar systems need an aw of < 0.7 to prevent microbial growth otherwise antimicrobial agents required
Accomplished by replacing water with sugars or sugar alcohols (polyols) as plasticizers in whey system
Lowers aw and will influence:Local viscosity of liquid phase which controls mobility & thus reaction rates (find maxima in aw 0.6 to 0.8 range)
Tg of system which affects molecular mobility and texture
Protein conformation
Maillard reaction (browning) if humectant has reducing groups (HFCS)
Crystallization (graining) if use sucrose to control Maillard
Slide # 23
0 °C
Te
Tg
Glassy state
rubberystate
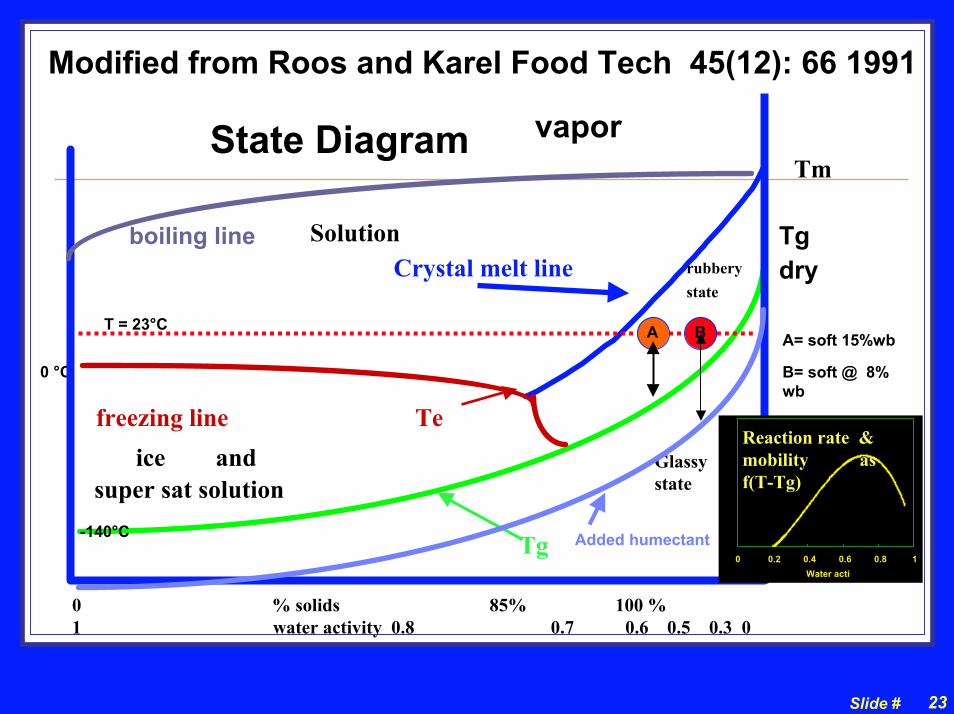
Crystal melt lineSolution
freezing lineice
super sat solution
State Diagram
-140°C
and
boiling line
vapor
BAT = 23°C
0 0.2 0.4 0.6 0.8 1Water acti
Reaction rate & mobility as f(T-Tg)
Added humectant
Modified from Roos and Karel Food Tech 45(12): 66 1991
Tm
Tg dry
A= soft 15%wb
B= soft @ 8% wb
0 % solids 85% 100 %1 water activity 0.8 0.7 0.6 0.5 0.3 0
Slide # 24
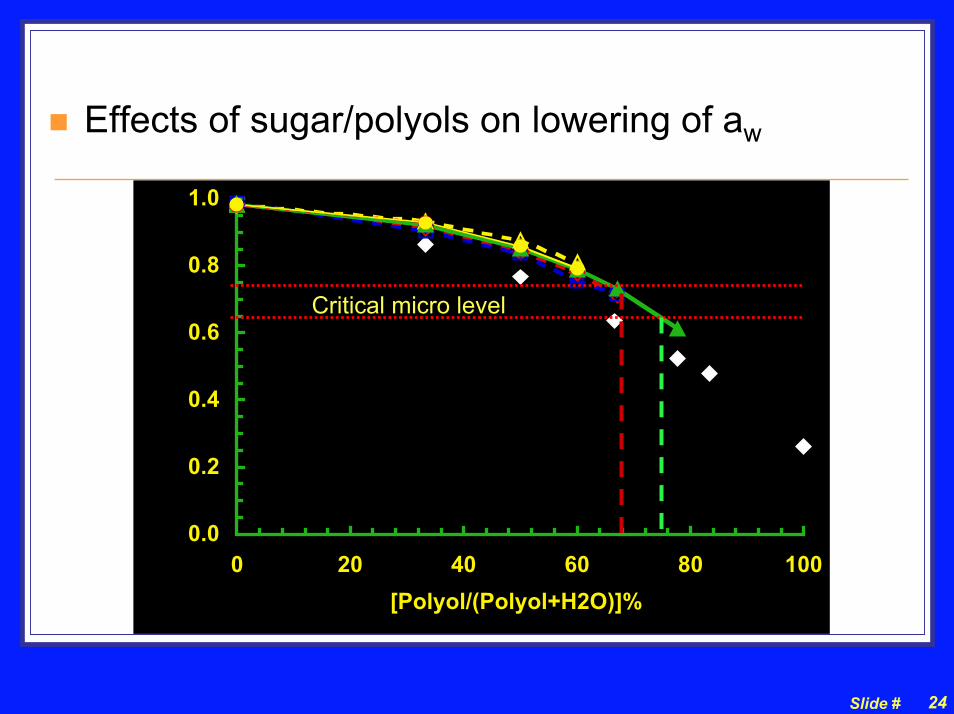
Effects of sugar/polyols on lowering of aw
0.0
0.2
0.4
0.6
0.8
1.0
0 20 40 60 80 100[Polyol/(Polyol+H2O)]%
Critical micro level
Slide # 25
Effects on texture after 1 week @ 45°C
Slide # 26
Effects of sugar/polyols on whey protein aggregation after 1 week @ 45°C
PG causes significant amounts of protein aggregationOther sugar/polyols delay the protein aggregation
Slide # 27
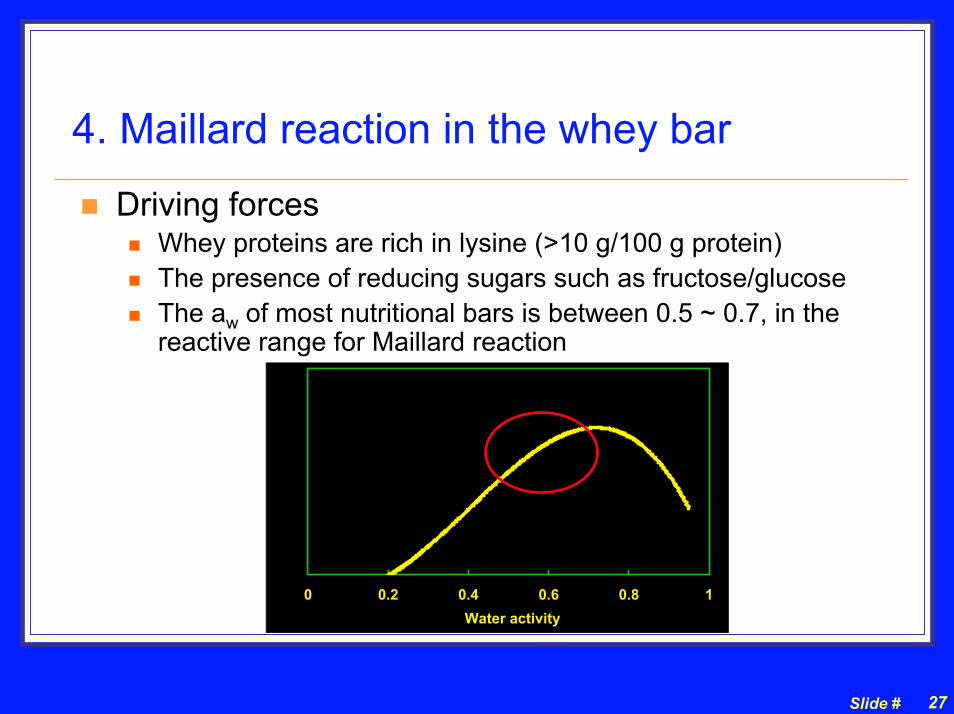
4. Maillard reaction in the whey bar
Driving forces Whey proteins are rich in lysine (>10 g/100 g protein) The presence of reducing sugars such as fructose/glucoseThe aw of most nutritional bars is between 0.5 ~ 0.7, in the reactive range for Maillard reaction
0 0.2 0.4 0.6 0.8 1Water activity
Slide # 28
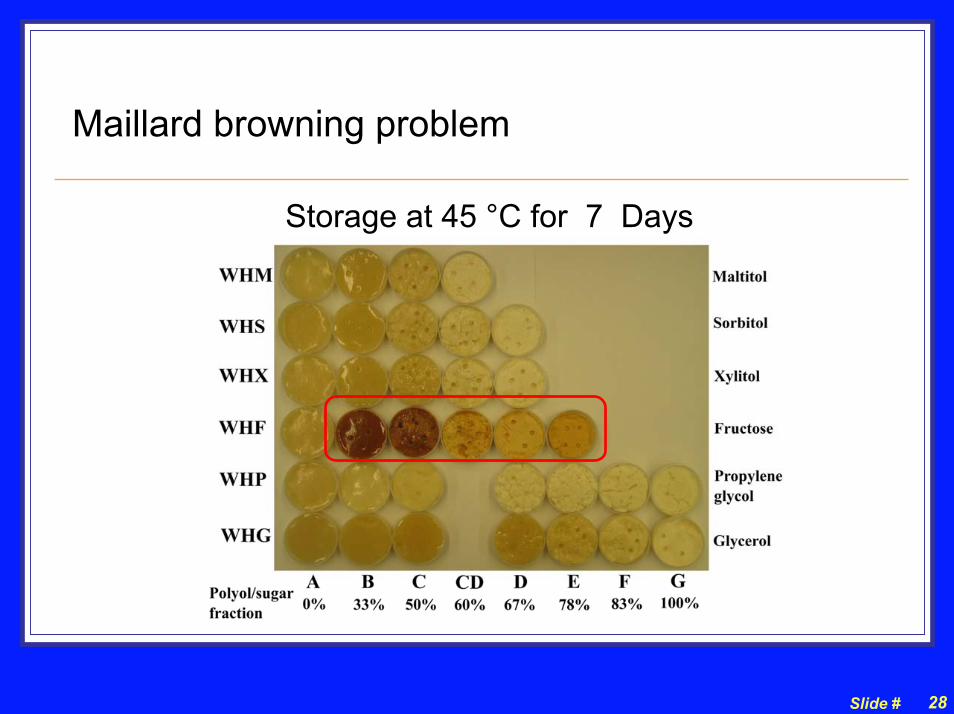
Maillard browning problem
Storage at 45 °C for 7 Days
Slide # 29
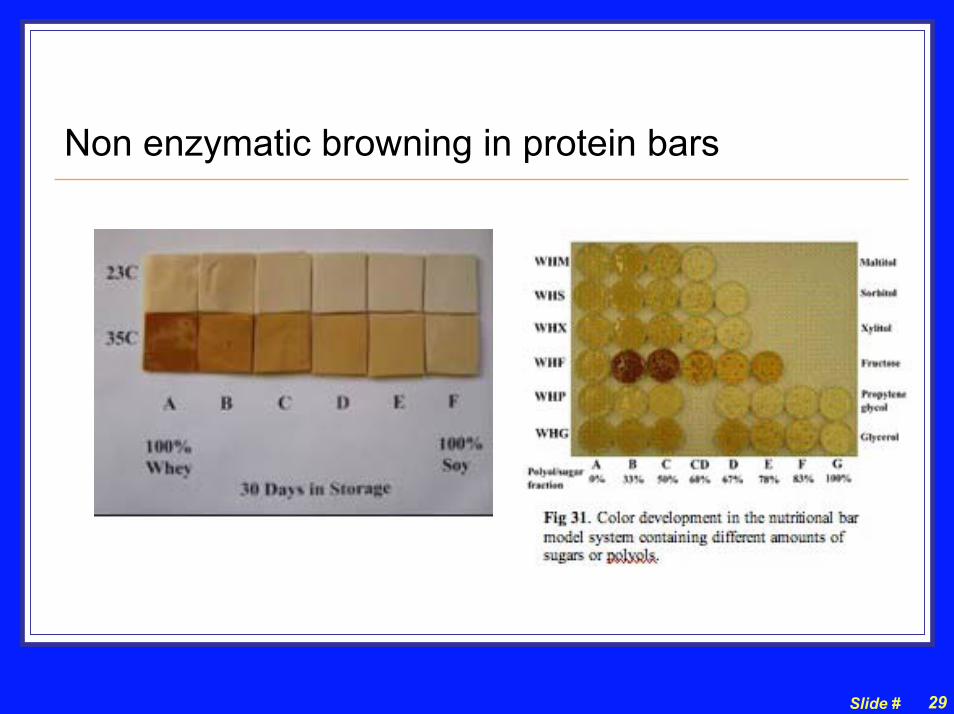
Non enzymatic browning in protein bars
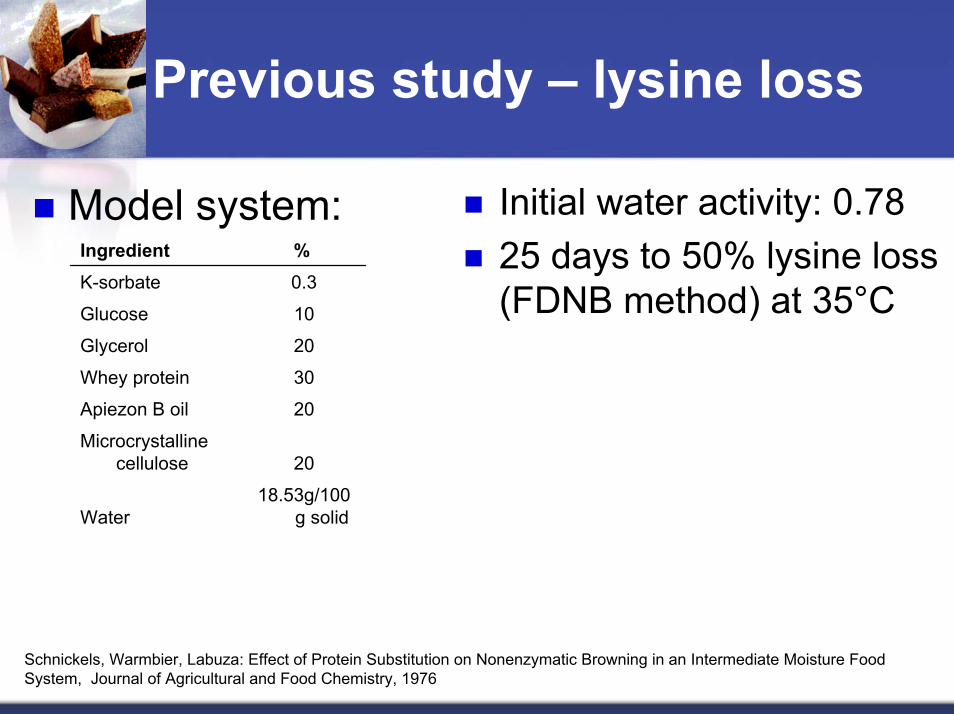
Model system: Initial water activity: 0.7825 days to 50% lysine loss (FDNB method) at 35°C
18.53g/100 g solidWater
20Microcrystalline
cellulose
20Apiezon B oil
30Whey protein
20Glycerol
10Glucose
0.3K-sorbate
%Ingredient
Schnickels, Warmbier, Labuza: Effect of Protein Substitution on Nonenzymatic Browning in an Intermediate Moisture Food System, Journal of Agricultural and Food Chemistry, 1976
Previous study – lysine loss
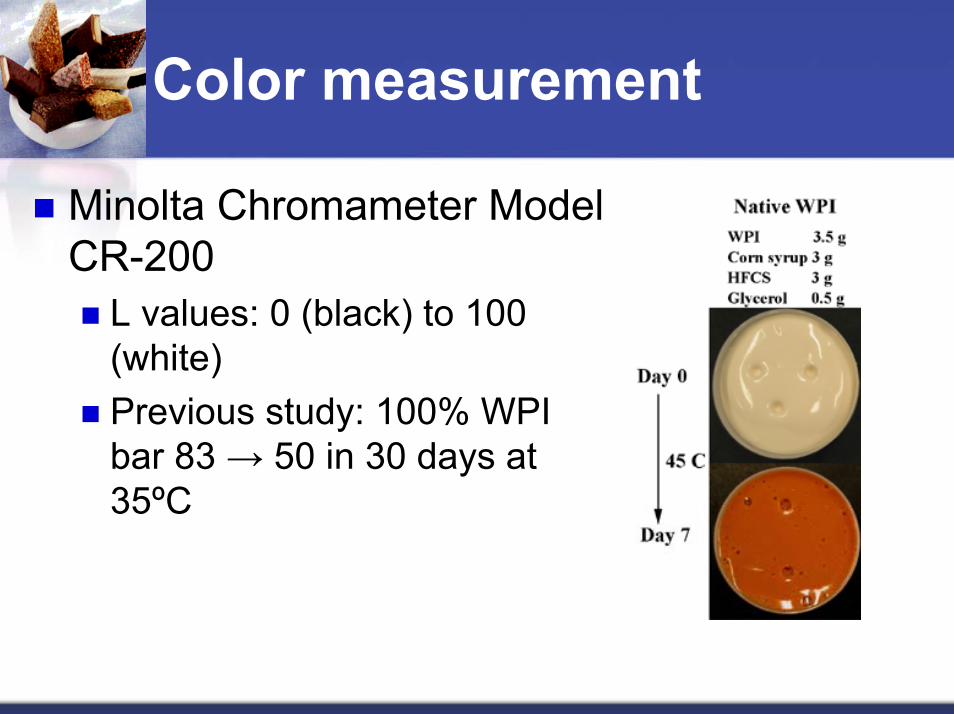
Color measurement
Minolta Chromameter Model CR-200
L values: 0 (black) to 100 (white)Previous study: 100% WPI bar 83 → 50 in 30 days at 35ºC
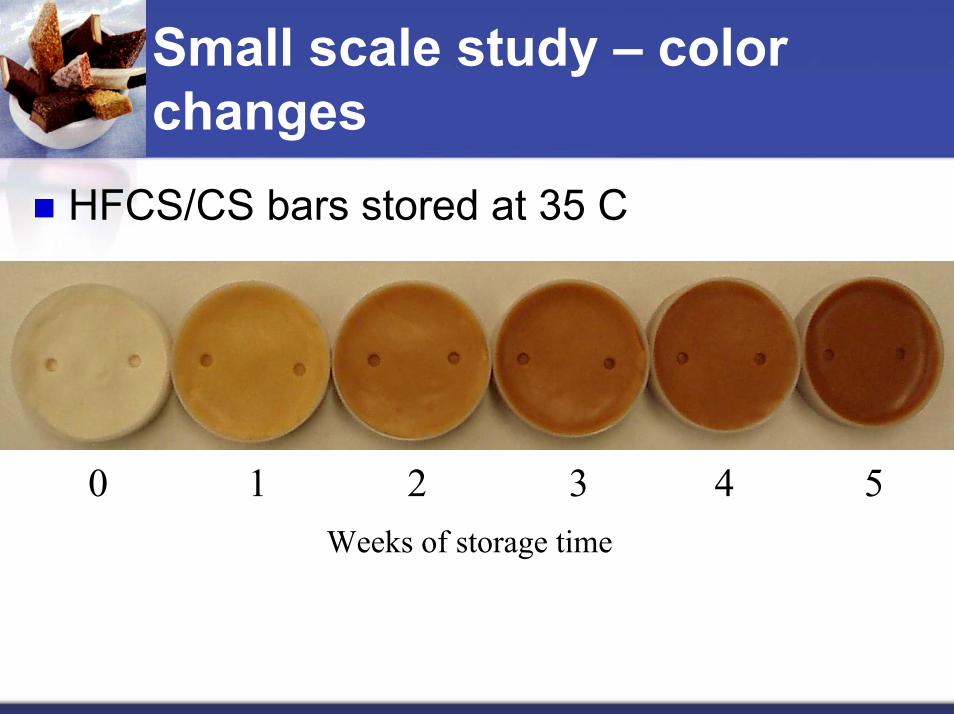
Small scale study – color changes
HFCS/CS bars stored at 35 C
0 1 2 3 4 5 Weeks of storage time
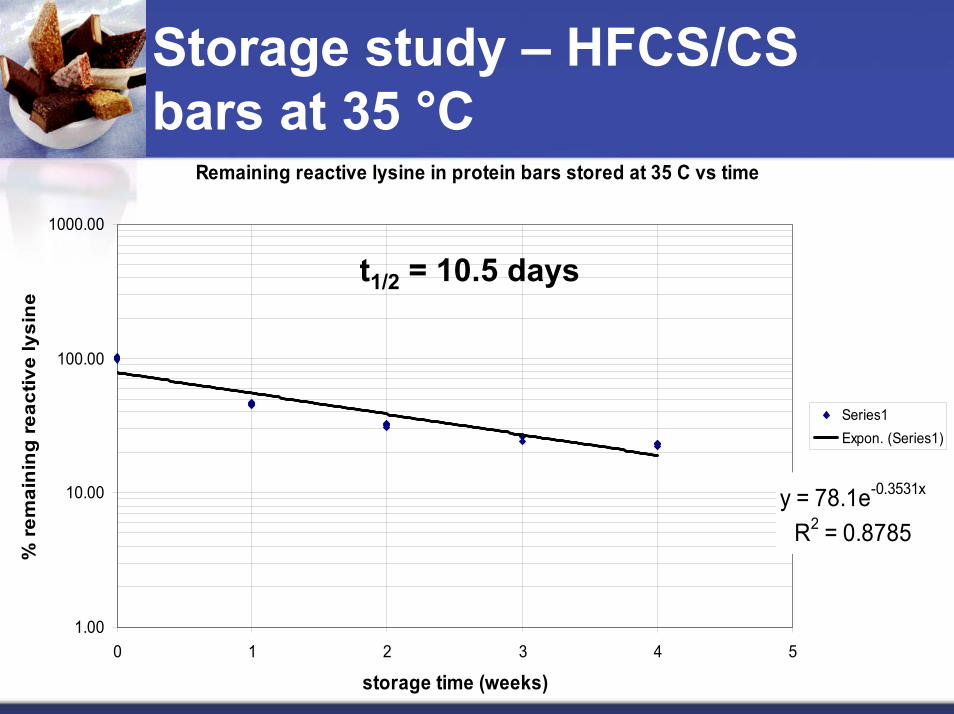
Storage study – HFCS/CS bars at 35 °C
Remaining reactive lysine in protein bars stored at 35 C vs time
y = 78.1e-0.3531x
R2 = 0.8785
1.00
10.00
100.00
1000.00
0 1 2 3 4 5
storage time (weeks)
% re
mai
ning
reac
tive
lysi
ne
Series1Expon. (Series1)
t1/2 = 10.5 days
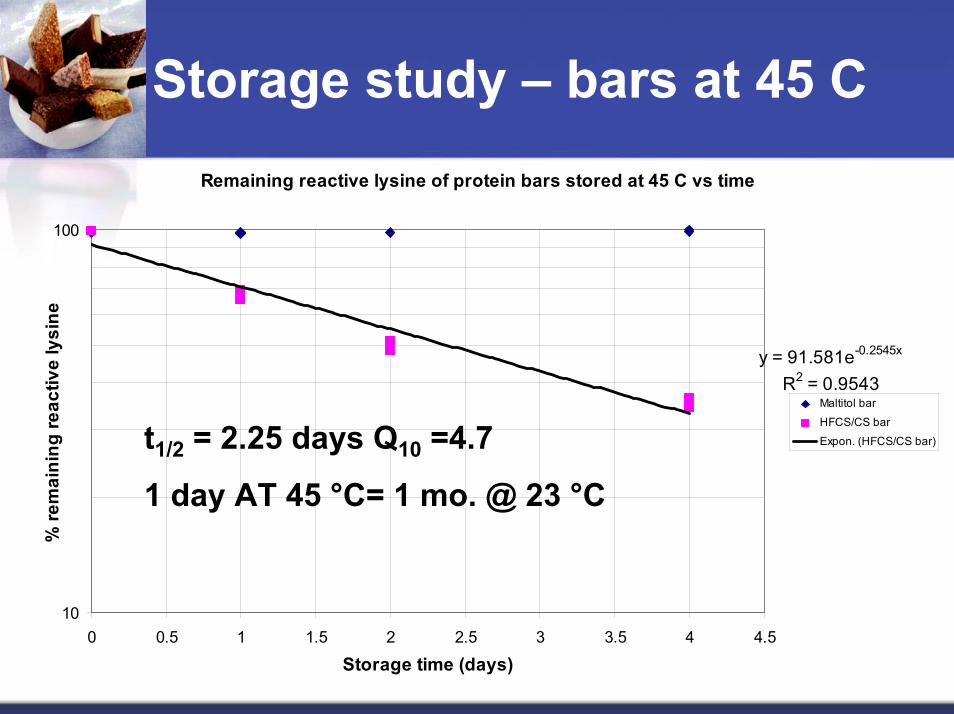
Remaining reactive lysine of protein bars stored at 45 C vs time
y = 91.581e-0.2545x
R2 = 0.9543
10
100
0 0.5 1 1.5 2 2.5 3 3.5 4 4.5
Storage time (days)
% re
mai
ning
reac
tive
lysi
ne
Maltitol bar
HFCS/CS bar
Expon. (HFCS/CS bar)t1/2 = 2.25 days Q10 =4.7
1 day AT 45 °C= 1 mo. @ 23 °C
Storage study – bars at 45 C
Slide # 35
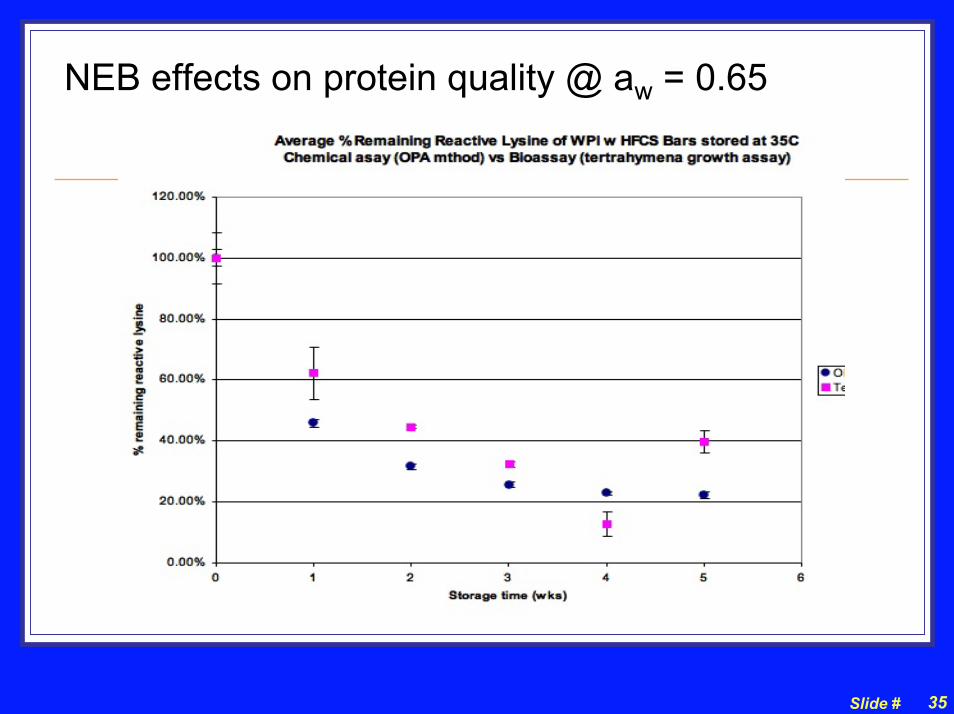
NEB effects on protein quality @ aw = 0.65
Slide # 36
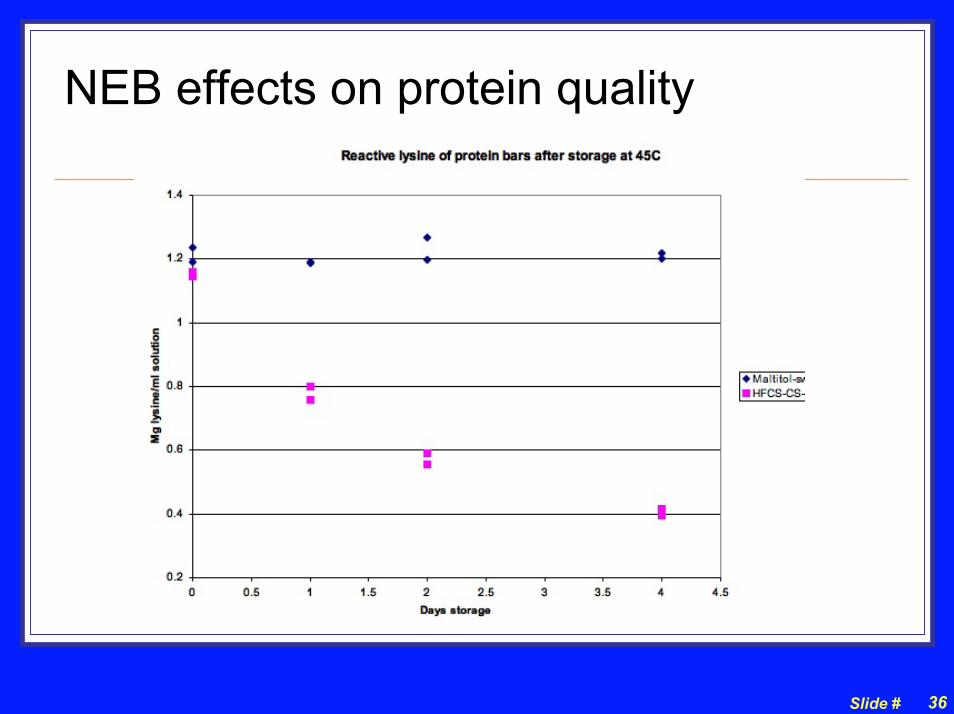
NEB effects on protein quality
Slide # 37
HOW to make and keep a soft bar and of high nutritional quality ?
Potential solutions:
1. Add reducing reagents and thiol-blocking reagents if allowed
2. Add whey protein hydrolysates (Lowering the Tg of bar system)
3. Control the types and ratio of humectants
Slide # 38
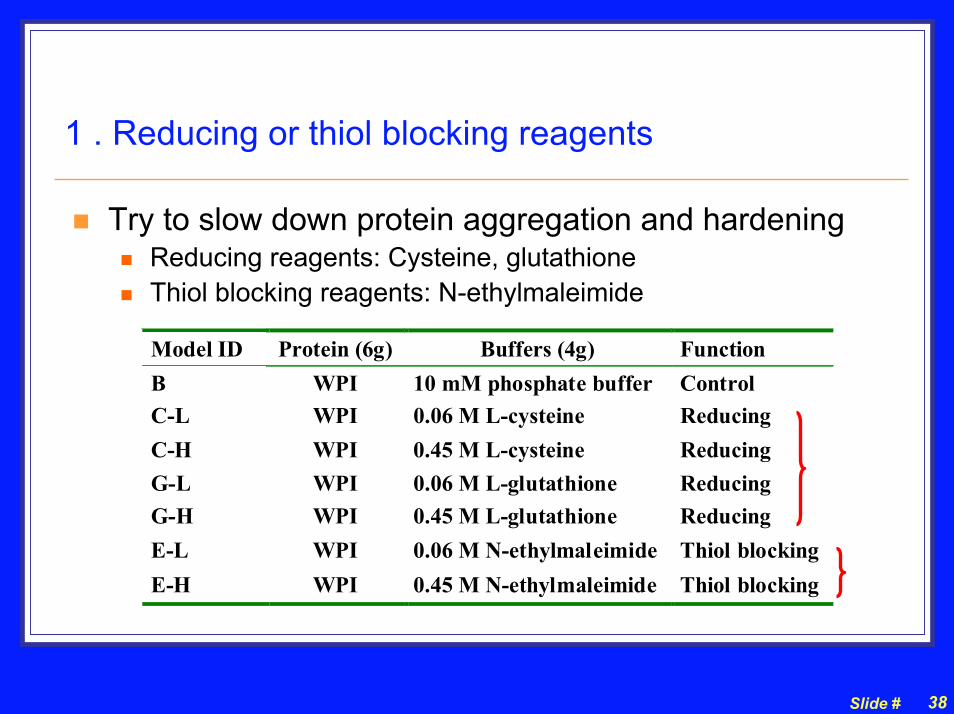
1 . Reducing or thiol blocking reagents
Try to slow down protein aggregation and hardeningReducing reagents: Cysteine, glutathioneThiol blocking reagents: N-ethylmaleimide
Model ID Protein (6g) Buffers (4g) FunctionB WPI 10 mM phosphate buffer ControlC-L WPI 0.06 M L-cysteine ReducingC-H WPI 0.45 M L-cysteine ReducingG-L WPI 0.06 M L-glutathione ReducingG-H WPI 0.45 M L-glutathione ReducingE-L WPI 0.06 M N-ethylmaleimide Thiol blockingE-H WPI 0.45 M N-ethylmaleimide Thiol blocking
Slide # 39
Storage of whey model WB at 45 °C
30 day equivalent to 1 year at 23 C
Slide # 40
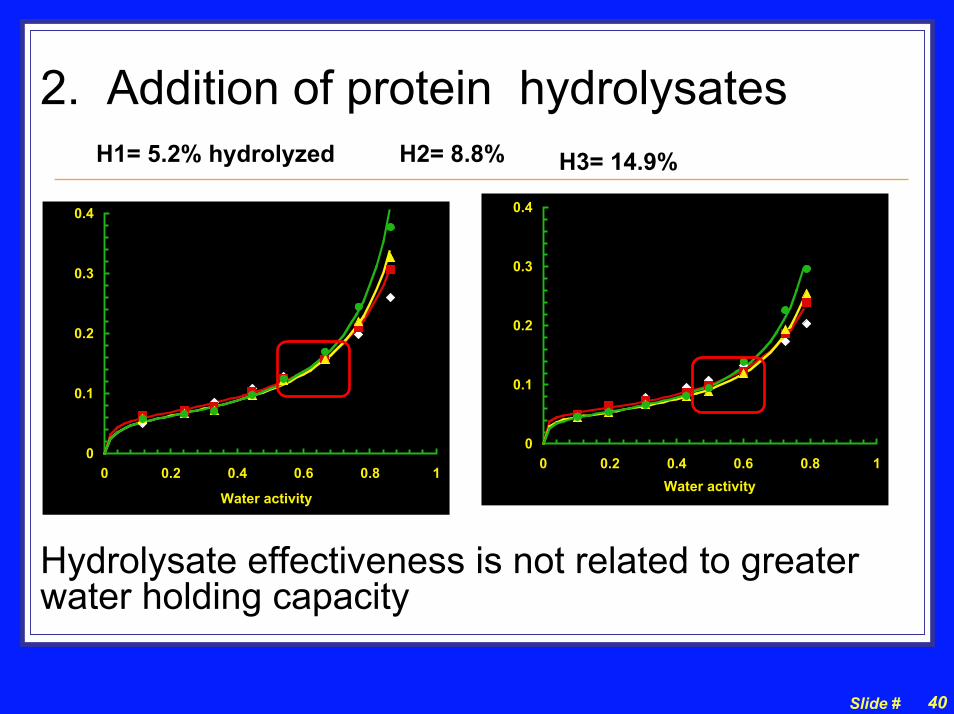
2. Addition of protein hydrolysatesH1= 5.2% hydrolyzed H2= 8.8% H3= 14.9%
0
0.1
0.2
0.3
0.4
0 0.2 0.4 0.6 0.8 1
Water activity
0
0.1
0.2
0.3
0.4
0 0.2 0.4 0.6 0.8 1Water activity
Hydrolysate effectiveness is not related to greater water holding capacity
Slide # 41
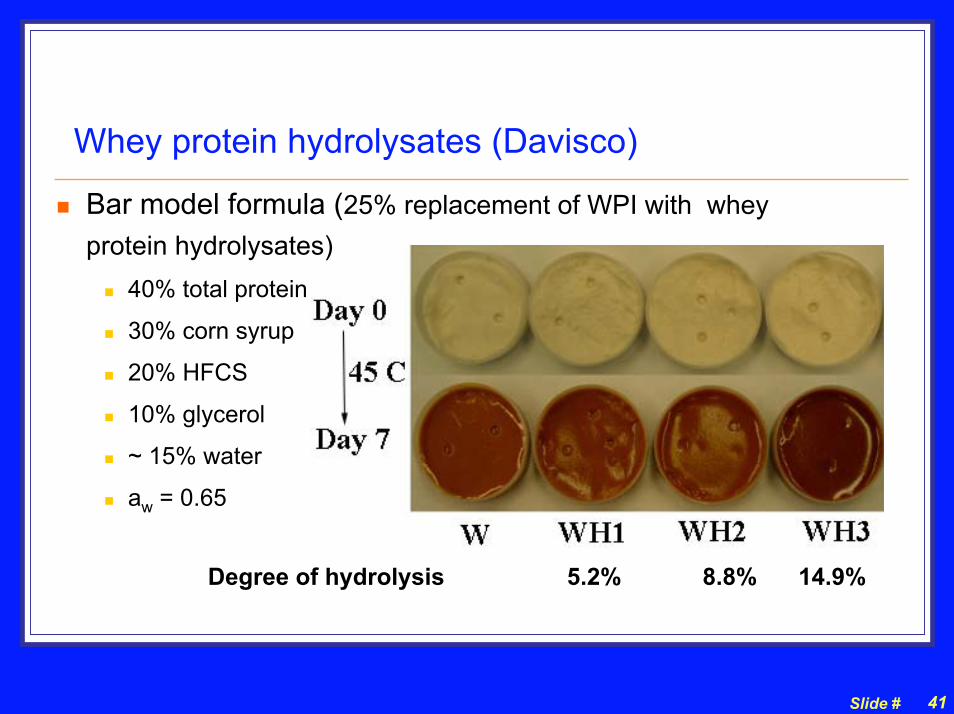
Whey protein hydrolysates (Davisco)
Bar model formula (25% replacement of WPI with whey protein hydrolysates)
40% total protein
30% corn syrup
20% HFCS
10% glycerol
~ 15% water
aw = 0.65
Degree of hydrolysis 5.2% 8.8% 14.9%
Slide # 42
Hardness development at 45 °C Day 7 vs Day 0
WCFG model system with 40% proteins ~7 day at 45C equivalent to 3 months at 23 °C
Slide # 43
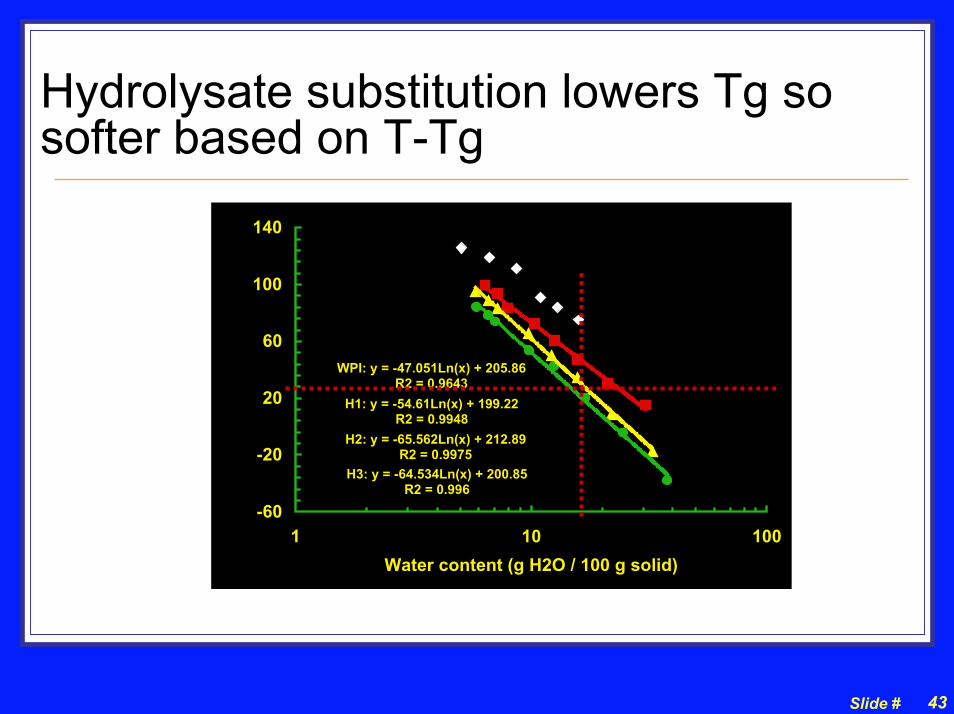
Hydrolysate substitution lowers Tg so softer based on T-Tg
WPI: y = -47.051Ln(x) + 205.86R2 = 0.9643
H1: y = -54.61Ln(x) + 199.22R2 = 0.9948
H2: y = -65.562Ln(x) + 212.89R2 = 0.9975
H3: y = -64.534Ln(x) + 200.85R2 = 0.996
-60
-20
20
60
100
140
1 10 100Water content (g H2O / 100 g solid)
Slide # 44
Solutions reviewed
Add either reducing agents or thiol blockersThe reducing agents do NOT work for the model systemCannot find a food grade thiol blocking agent yet
Partly replace WPI with 25% whey protein hydrolysateMakes a softer bar, partially slowing down the hardening
Control type and ratio of humectantsNo propylene glycolEliminate HFCS, use sucrose instead for sweetness or artificialUse glycerol in combo with sorbitol, maltitol, and xylitol

Slide # 45
Questions and/or comments?