protecting the public purse 2013 - humberside fire … · protecting the. public purse. 2013. ......
TRANSCRIPT

Protecting the public purse 2013
Fighting fraud against local government
November 2013
This document is EMBARGOED until 00:01am Thursday 14 November 2013
123
The Audit Commission’s role is to protect the public purse.
We do this by appointing auditors to a range of local public bodies in England. We set the standards we expect auditors to meet and oversee their work. Our aim is to secure high-quality audits at the best price possible.
We use information from auditors and published data to provide authoritative, evidence-based analysis. This helps local public services to learn from one another and manage the financial challenges they face.
We also compare data across the public sector to identify where services could be open to abuse and help organisations fight fraud.
124

125
Contents Summary and recommendations ..................................................................... 4
Summary ...................................................................................................... 4 Recommendations ........................................................................................ 6
Chapter 1: Introduction ..................................................................................... 8
Chapter 2: Detected fraud against councils and related bodies ................. 10 Non-benefit frauds ...................................................................................... 13
Chapter 3: Is fraud declining? ........................................................................ 17 Changes in investigative capacity............................................................... 18
Chapter 4: Housing tenancy and council tax discount fraud ...................... 21 Housing tenancy fraud ................................................................................ 21 Tenancy Audit............................................................................................. 25 Council tax discount.................................................................................... 26
Chapter 5: Trends and developments in other fraud risks .......................... 28 Business rates ............................................................................................ 28 Right to Buy ................................................................................................ 29 Social care (including direct payments) ...................................................... 29 False insurance claims ............................................................................... 31 Disabled parking concessions (blue badges) ............................................. 31 Procurement ............................................................................................... 33 Schools ....................................................................................................... 33 Internal fraud............................................................................................... 34 Economic and third sector .......................................................................... 34
Chapter 6: National and local developments in fraud detection and deterrence......................................................................................................... 37
Counter-fraud policy - awareness and implementation .............................. 37 Councillors’ role in the fight against fraud ................................................... 37 Deterrence .................................................................................................. 38 Fighting Fraud Locally ................................................................................ 40 Whistle-blowing........................................................................................... 41
126

Support to Audited Bodies .......................................................................... 42 National Fraud Initiative .............................................................................. 42 Fraud briefings............................................................................................ 43 Other sources of help ................................................................................. 44
Looking ahead.................................................................................................. 45
Appendix 1: Detected frauds and losses by region...................................... 46 Appendix 2: Checklist for councillors and others responsible for governance ....................................................................................................... 48
Appendix 3 - Questions for councillors to support 2013 individual fraud briefings ............................................................................................................ 54
References........................................................................................................ 56
127
Summary and recommendations Summary
This report shows those responsible for governance in local government bodies how they can fight fraud more effectively.
■ Fraud costs the UK public sector more than £20 billion a year and local government more than £2 billion.
■ In a time of austerity, preventing fraud is even more important to protect the public purse.
■ Every pound lost through fraud cannot be spent on providing public services.
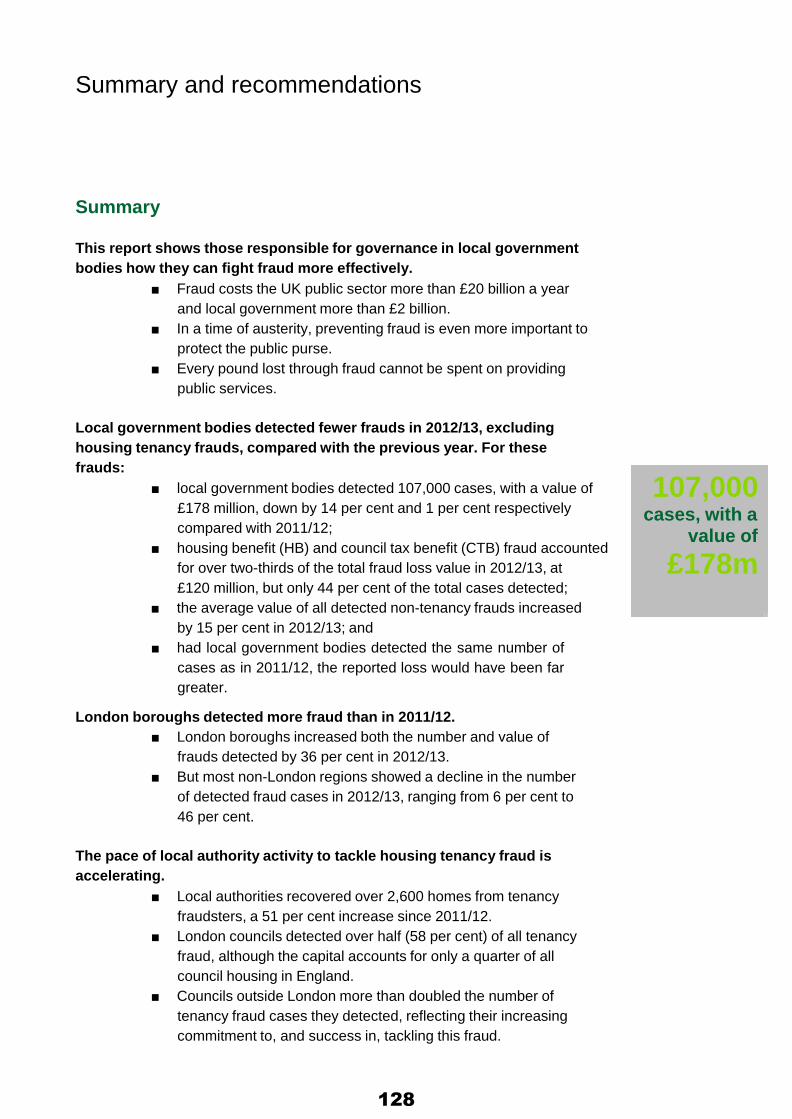
Local government bodies detected fewer frauds in 2012/13, excluding housing tenancy frauds, compared with the previous year. For these frauds:
■ local government bodies detected 107,000 cases, with a value of £178 million, down by 14 per cent and 1 per cent respectively compared with 2011/12;
■ housing benefit (HB) and council tax benefit (CTB) fraud accounted for over two-thirds of the total fraud loss value in 2012/13, at £120 million, but only 44 per cent of the total cases detected;
■ the average value of all detected non-tenancy frauds increased by 15 per cent in 2012/13; and
■ had local government bodies detected the same number of cases as in 2011/12, the reported loss would have been far greater.
London boroughs detected more fraud than in 2011/12. ■ London boroughs increased both the number and value of
frauds detected by 36 per cent in 2012/13. ■ But most non-London regions showed a decline in the number
of detected fraud cases in 2012/13, ranging from 6 per cent to 46 per cent.
The pace of local authority activity to tackle housing tenancy fraud is accelerating.
■ Local authorities recovered over 2,600 homes from tenancy fraudsters, a 51 per cent increase since 2011/12.
■ London councils detected over half (58 per cent) of all tenancy fraud, although the capital accounts for only a quarter of all council housing in England.
■ Councils outside London more than doubled the number of tenancy fraud cases they detected, reflecting their increasing commitment to, and success in, tackling this fraud.
107,000 cases, with a
value of £178m
128
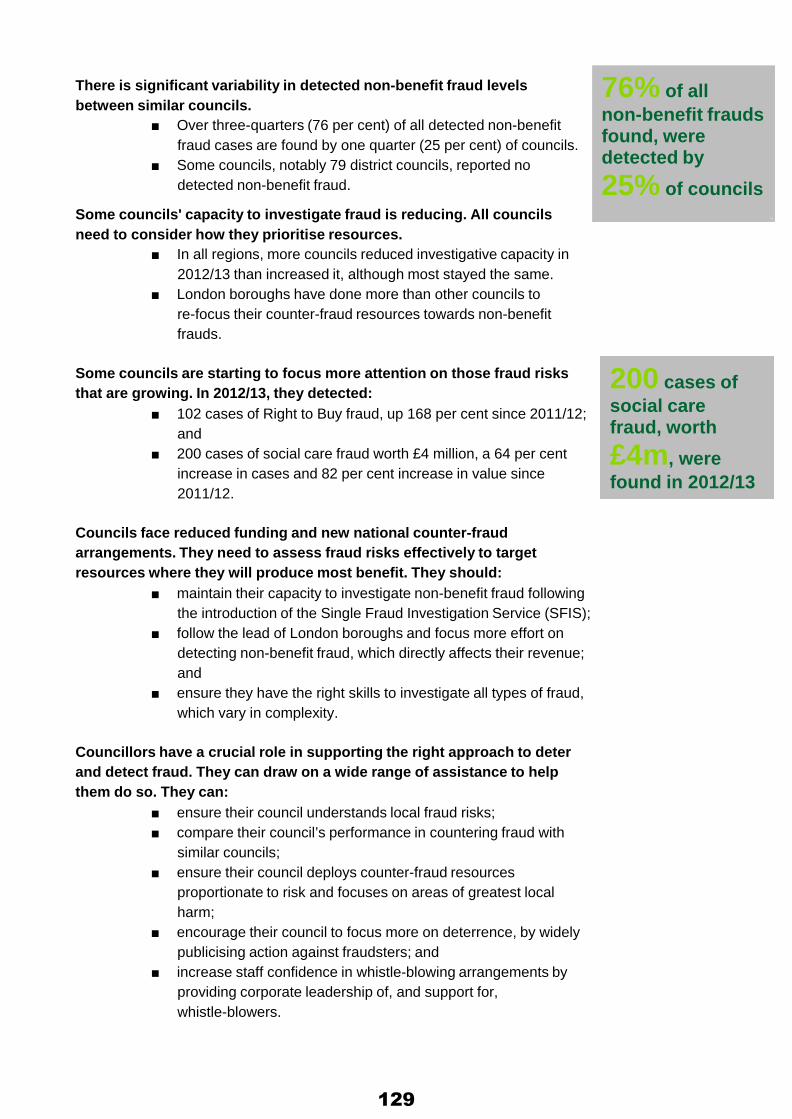
There is significant variability in detected non-benefit fraud levels between similar councils.
■ Over three-quarters (76 per cent) of all detected non-benefit fraud cases are found by one quarter (25 per cent) of councils.
■ Some councils, notably 79 district councils, reported no detected non-benefit fraud.
Some councils' capacity to investigate fraud is reducing. All councils need to consider how they prioritise resources.
■ In all regions, more councils reduced investigative capacity in 2012/13 than increased it, although most stayed the same.
■ London boroughs have done more than other councils to re-focus their counter-fraud resources towards non-benefit frauds.
Some councils are starting to focus more attention on those fraud risks that are growing. In 2012/13, they detected:
■ 102 cases of Right to Buy fraud, up 168 per cent since 2011/12; and
■ 200 cases of social care fraud worth £4 million, a 64 per cent increase in cases and 82 per cent increase in value since 2011/12.
Councils face reduced funding and new national counter-fraud arrangements. They need to assess fraud risks effectively to target resources where they will produce most benefit. They should:
■ maintain their capacity to investigate non-benefit fraud following the introduction of the Single Fraud Investigation Service (SFIS);
■ follow the lead of London boroughs and focus more effort on detecting non-benefit fraud, which directly affects their revenue; and
■ ensure they have the right skills to investigate all types of fraud, which vary in complexity.
Councillors have a crucial role in supporting the right approach to deter and detect fraud. They can draw on a wide range of assistance to help them do so. They can:
■ ensure their council understands local fraud risks; ■ compare their council’s performance in countering fraud with
similar councils; ■ ensure their council deploys counter-fraud resources
proportionate to risk and focuses on areas of greatest local harm;
■ encourage their council to focus more on deterrence, by widely publicising action against fraudsters; and
■ increase staff confidence in whistle-blowing arrangements by providing corporate leadership of, and support for, whistle-blowers.
76% of all non-benefit frauds found, were detected by
25% of councils
200 cases of social care fraud, worth
£4m, were found in 2012/13
129
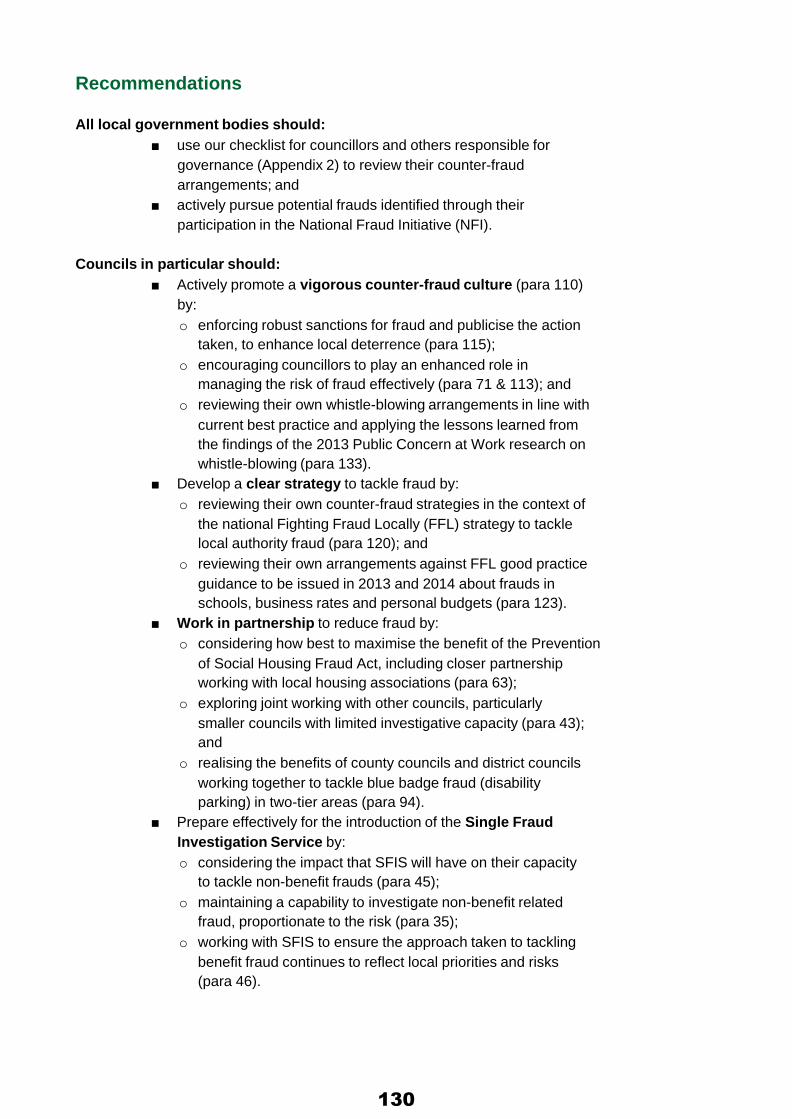
Recommendations All local government bodies should:
■ use our checklist for councillors and others responsible for governance (Appendix 2) to review their counter-fraud arrangements; and
■ actively pursue potential frauds identified through their participation in the National Fraud Initiative (NFI).
Councils in particular should:
■ Actively promote a vigorous counter-fraud culture (para 110) by: o enforcing robust sanctions for fraud and publicise the action
taken, to enhance local deterrence (para 115); o encouraging councillors to play an enhanced role in
managing the risk of fraud effectively (para 71 & 113); and o reviewing their own whistle-blowing arrangements in line with
current best practice and applying the lessons learned from the findings of the 2013 Public Concern at Work research on whistle-blowing (para 133).
■ Develop a clear strategy to tackle fraud by: o reviewing their own counter-fraud strategies in the context of
the national Fighting Fraud Locally (FFL) strategy to tackle local authority fraud (para 120); and
o reviewing their own arrangements against FFL good practice guidance to be issued in 2013 and 2014 about frauds in schools, business rates and personal budgets (para 123).
■ Work in partnership to reduce fraud by: o considering how best to maximise the benefit of the Prevention
of Social Housing Fraud Act, including closer partnership working with local housing associations (para 63);
o exploring joint working with other councils, particularly smaller councils with limited investigative capacity (para 43); and
o realising the benefits of county councils and district councils working together to tackle blue badge fraud (disability parking) in two-tier areas (para 94).
■ Prepare effectively for the introduction of the Single Fraud Investigation Service by: o considering the impact that SFIS will have on their capacity
to tackle non-benefit frauds (para 45); o maintaining a capability to investigate non-benefit related
fraud, proportionate to the risk (para 35); o working with SFIS to ensure the approach taken to tackling
benefit fraud continues to reflect local priorities and risks (para 46).
130

■ Allocate sufficient resources to tackling fraud by: o focusing more on detecting and recording non-benefit fraud,
particularly district councils (para 25); and o targeting their counter-fraud resources where they will
produce the most benefit, assessing the risk of harm against the measures needed to reduce it (para 18).
■ Improve their use of data to measure their performance in
tackling fraud by: o challenging their performance in tackling non-benefit frauds,
in particular against the results achieved by the top performing councils (para 25);
o considering whether to apply the National Fraud Authority’s (NFA’s) Annual Fraud Indicator methodology to assess the local impact of the most financially significant frauds (para 18);
o maximising the benefits of reporting frauds through the Action Fraud website (para 146); and
o requesting an individual fraud briefing from their external auditor (para 144).
The Department for Communities and Local Government should consider:
■ extending powers for councils to investigate all frauds, to protect the public purse (para 49); and
■ what arrangements need to be put in place to collect and publish data on detected fraud against local public bodies, after the closure of the Audit Commission (para 152).
Action Fraud should provide regular and timely feedback to all local government bodies that use the Action Fraud reporting arrangements (para 147).
131
Chapter 1: Introduction
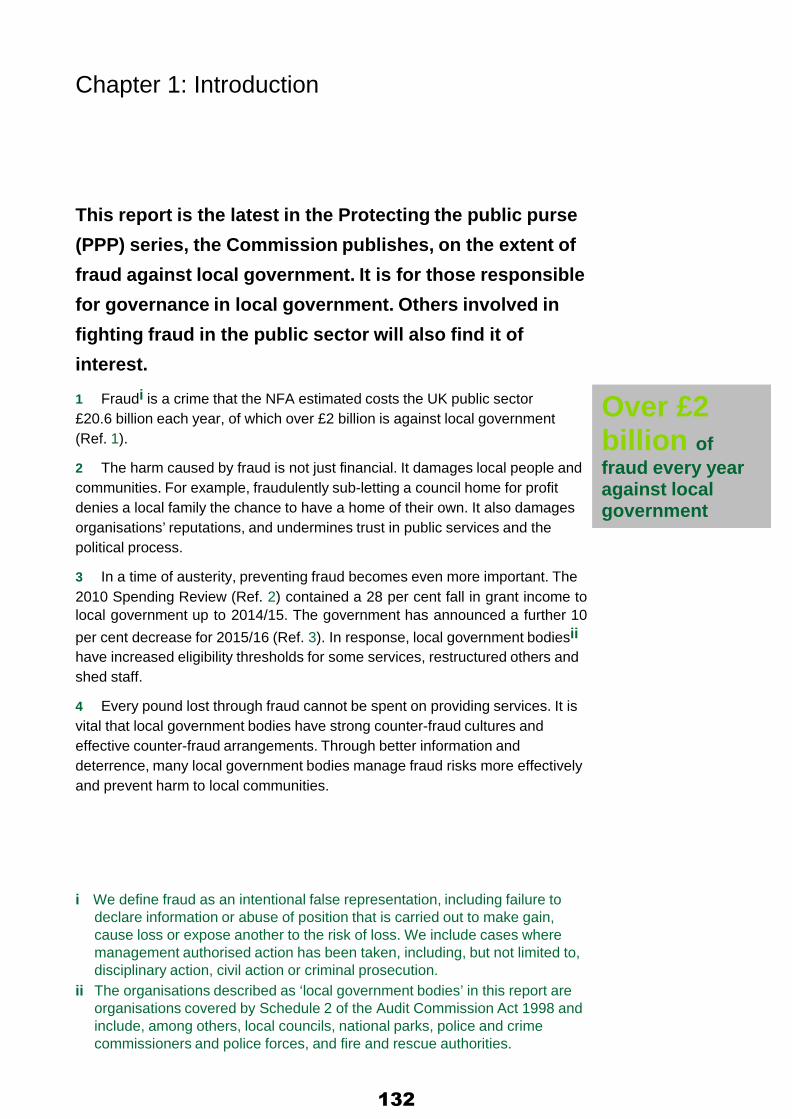
This report is the latest in the Protecting the public purse (PPP) series, the Commission publishes, on the extent of fraud against local government. It is for those responsible for governance in local government. Others involved in fighting fraud in the public sector will also find it of interest.
1 Fraudi is a crime that the NFA estimated costs the UK public sector £20.6 billion each year, of which over £2 billion is against local government (Ref. 1).
2 The harm caused by fraud is not just financial. It damages local people and communities. For example, fraudulently sub-letting a council home for profit denies a local family the chance to have a home of their own. It also damages organisations’ reputations, and undermines trust in public services and the political process.
3 In a time of austerity, preventing fraud becomes even more important. The 2010 Spending Review (Ref. 2) contained a 28 per cent fall in grant income to local government up to 2014/15. The government has announced a further 10 per cent decrease for 2015/16 (Ref. 3). In response, local government bodiesii have increased eligibility thresholds for some services, restructured others and shed staff.
4 Every pound lost through fraud cannot be spent on providing services. It is vital that local government bodies have strong counter-fraud cultures and effective counter-fraud arrangements. Through better information and deterrence, many local government bodies manage fraud risks more effectively and prevent harm to local communities.
i We define fraud as an intentional false representation, including failure to
declare information or abuse of position that is carried out to make gain, cause loss or expose another to the risk of loss. We include cases where management authorised action has been taken, including, but not limited to, disciplinary action, civil action or criminal prosecution.
ii The organisations described as ‘local government bodies’ in this report are organisations covered by Schedule 2 of the Audit Commission Act 1998 and include, among others, local councils, national parks, police and crime commissioners and police forces, and fire and rescue authorities.
Over £2 billion of fraud every year against local government
132

Report structure
5 This report is produced for those responsible for governance in local government, particularly councillors. It is intended to help them protect valuable and increasingly scarce public resources. It covers these important themes:
■ the scale and value of fraud detected by local government bodies in 2012/13 (Chapter 2);
■ whether fraud is in decline (Chapter 3); ■ trends in housing tenancy and council tax discount fraud
(Chapter 4); ■ trends and threats in other significant fraud types (Chapter 5);
and ■ national developments impacting on local government counter-
fraud (Chapter 6).
6 In addition , this report: ■ gives details of detected frauds and losses by region (Appendix 1); ■ updates our checklist for those responsible for governance (Appendix 2); and ■ highlights a series of questions to help councillors challenge and inform their own organisation’s approach to fighting fraud (Appendix 3), designed to be used in conjunction with our programme of individual fraud briefings.
133

Chapter 2: Detected fraud against councils and related bodies
Local government bodies detected fewer frauds overall in 2012/13 compared with the previous year. Similar councils detect varying amounts of fraud.
7 In our 2012/13 detected fraud and corruption survey, we received responses from 493 local government bodies: a 100 per cent response rate. These results:
■ map the volume and value of different types of fraud they detect;
■ provide information about emerging and changing fraud risks; and
■ help identify good practice in tackling fraud.
8 Table 1 shows that the total number of cases of detected fraud (excluding housing tenancy fraud) has fallen by 14 per cent in 2012/13 to 107,000, albeit by only nearly 1 per cent in value to £178 million. About two-thirds (67 per cent) of this amount comes from fraud related to HB and CTB; although such frauds represent only 44 per cent of all fraud cases detected.
9 The average value of all non-housing tenancy frauds has increased by 15 per cent compared with the previous year. Table 1 shows that HB and CTB fraud increased by 18 per cent and 6 per cent respectively. Other frauds combined increased by 41 per cent, but this varied by each type of fraud. Had local government bodies detected the same number of cases as in 2011/12, the value of total reported losses would have been far greater this year.
14% drop in the number of cases of fraud detected since last year
134
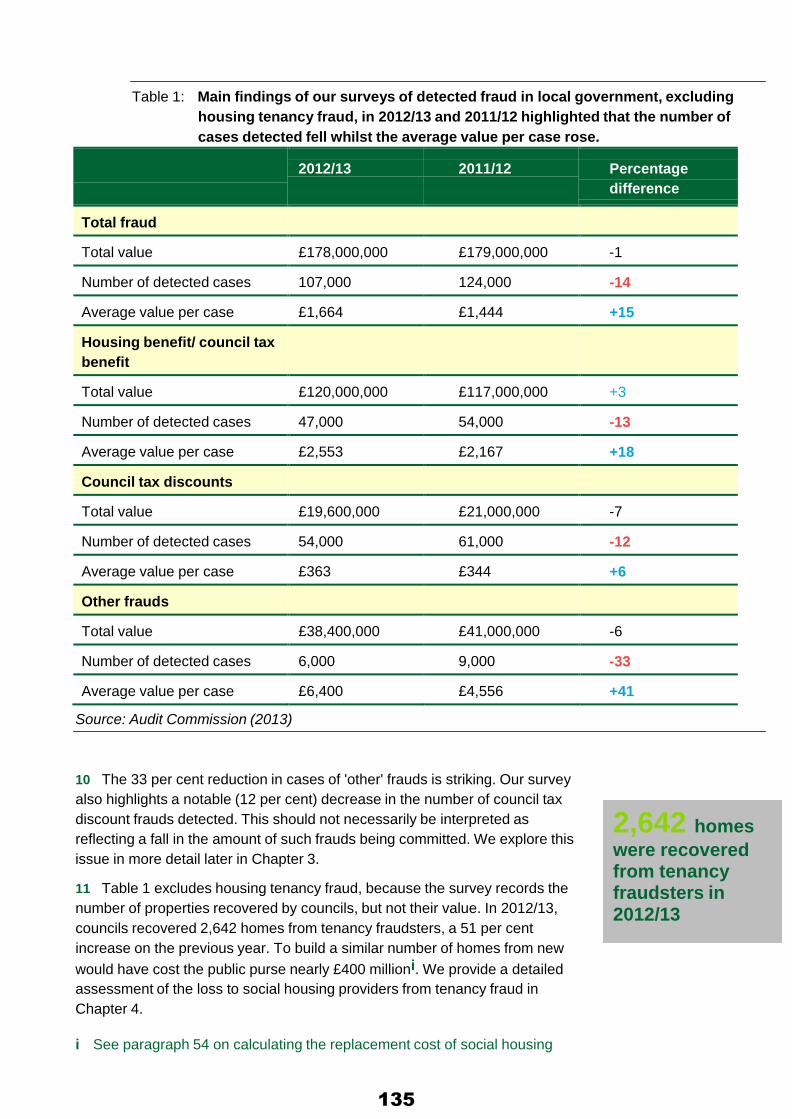
Table 1: Main findings of our surveys of detected fraud in local government, excluding housing tenancy fraud, in 2012/13 and 2011/12 highlighted that the number of cases detected fell whilst the average value per case rose.
2012/13
2011/12
Percentage difference
Total fraud
Total value
£178,000,000
£179,000,000
-1
Number of detected cases
107,000
124,000
-14
Average value per case
£1,664
£1,444
+15
Housing benefit/ council tax benefit
Total value
£120,000,000
£117,000,000
+3
Number of detected cases
47,000
54,000
-13
Average value per case
£2,553
£2,167
+18
Council tax discounts
Total value
£19,600,000
£21,000,000
-7
Number of detected cases
54,000
61,000
-12
Average value per case
£363
£344
+6
Other frauds
Total value
£38,400,000
£41,000,000
-6
Number of detected cases
6,000
9,000
-33
Average value per case
£6,400
£4,556
+41
Source: Audit Commission (2013)
10 The 33 per cent reduction in cases of 'other' frauds is striking. Our survey also highlights a notable (12 per cent) decrease in the number of council tax discount frauds detected. This should not necessarily be interpreted as reflecting a fall in the amount of such frauds being committed. We explore this issue in more detail later in Chapter 3.
11 Table 1 excludes housing tenancy fraud, because the survey records the number of properties recovered by councils, but not their value. In 2012/13, councils recovered 2,642 homes from tenancy fraudsters, a 51 per cent increase on the previous year. To build a similar number of homes from new would have cost the public purse nearly £400 millioni. We provide a detailed assessment of the loss to social housing providers from tenancy fraud in Chapter 4.
i See paragraph 54 on calculating the replacement cost of social housing
2,642 homes were recovered from tenancy fraudsters in 2012/13
135
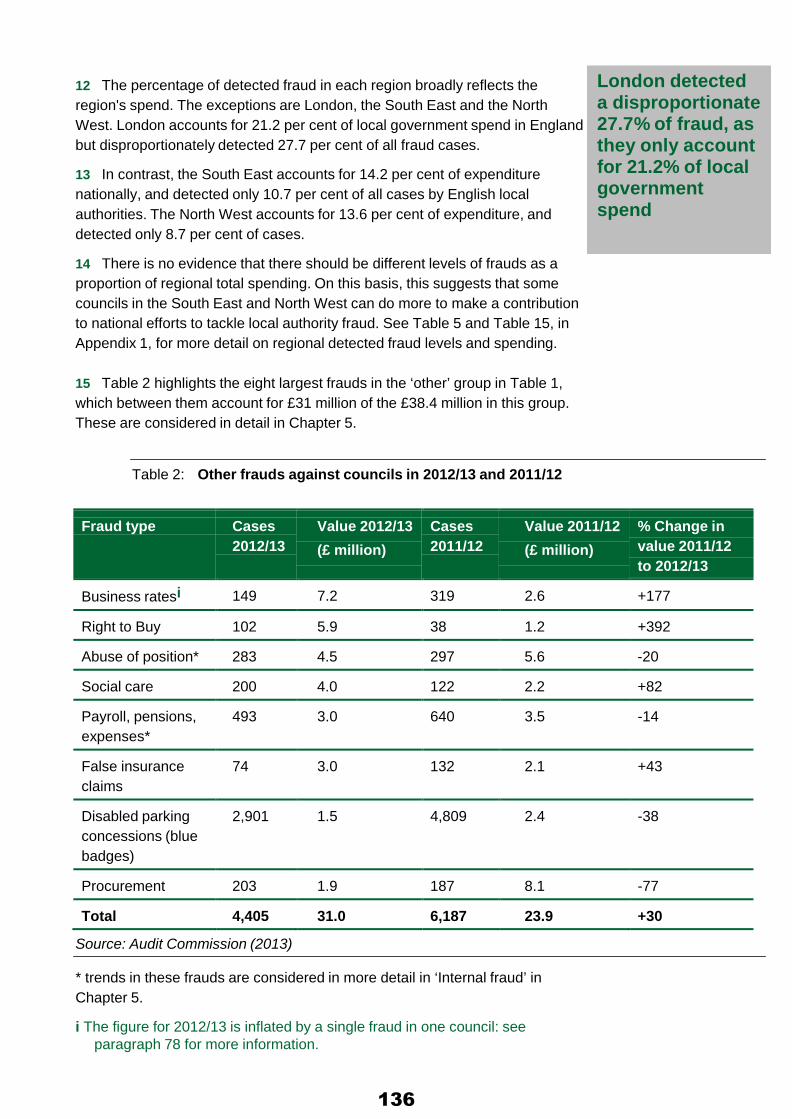
12 The percentage of detected fraud in each region broadly reflects the region's spend. The exceptions are London, the South East and the North West. London accounts for 21.2 per cent of local government spend in England but disproportionately detected 27.7 per cent of all fraud cases.
13 In contrast, the South East accounts for 14.2 per cent of expenditure nationally, and detected only 10.7 per cent of all cases by English local authorities. The North West accounts for 13.6 per cent of expenditure, and detected only 8.7 per cent of cases.
14 There is no evidence that there should be different levels of frauds as a proportion of regional total spending. On this basis, this suggests that some councils in the South East and North West can do more to make a contribution to national efforts to tackle local authority fraud. See Table 5 and Table 15, in Appendix 1, for more detail on regional detected fraud levels and spending.
15 Table 2 highlights the eight largest frauds in the ‘other’ group in Table 1, which between them account for £31 million of the £38.4 million in this group. These are considered in detail in Chapter 5.
Table 2: Other frauds against councils in 2012/13 and 2011/12
London detected a disproportionate 27.7% of fraud, as they only account for 21.2% of local government spend
Fraud type
Cases 2012/13
Value 2012/13 (£ million)
Cases 2011/12
Value 2011/12 (£ million)
% Change in value 2011/12 to 2012/13
Business ratesi
149
7.2
319
2.6
+177
Right to Buy
102
5.9
38
1.2
+392
Abuse of position*
283
4.5
297
5.6
-20
Social care
200
4.0
122
2.2
+82
Payroll, pensions, expenses*
493
3.0
640
3.5
-14
False insurance claims
74
3.0
132
2.1
+43
Disabled parking concessions (blue badges)
2,901
1.5
4,809
2.4
-38
Procurement
203
1.9
187
8.1
-77
Total
4,405
31.0
6,187
23.9
+30
Source: Audit Commission (2013)
* trends in these frauds are considered in more detail in ‘Internal fraud’ in Chapter 5.
i The figure for 2012/13 is inflated by a single fraud in one council: see
paragraph 78 for more information.
136

Non-benefit frauds
16 Non-benefit frauds – such as those in council tax discounts, housing tenancies and social care – directly cause a financial loss to councils. Benefit fraud, on the other hand, principally represents a loss to the national exchequer. Action to tackle benefit fraud is mainly funded by central government. Non- benefit frauds warrant particular attention by councils, since they bear the main loss.
17 We encourage local authorities to adopt a response to fraud that is proportionate to the level of financial loss. This may not currently be the case across all local government bodies. For example, according to the NFA (see Table 3) HB fraud accounts for just 15 per cent of the total annual loss to all fraud in local government. But our 2012/13 survey shows that detected benefit fraud accounts for 67 per cent of the value and 44 per cent by cases of all detected fraud reported by local government bodies.
Table 3: Estimated annual loss to fraud in local government
15% of annual loss is from housing benefit fraud, for 2012/13 it contributed to
67% of the total value detected
Category Annual loss
(million) Fraud level (%)
Procurement £876 1% of spend
Housing tenancy £845 4% of housing stock in London, 2% outside London, multiplied by £18,000 per property
Housing benefiti £350 0.7%
Payroll £154 Not disclosed by NFA
Council tax discount £133 4% on discounts and reliefs claimed
Blue badges £46 20% of badges misused
Grants £35 1% of spend
Pensions £7.1 N/A – based on NFI detection levels
Source: NFA Annual Fraud Indicator 2013
18 Councils could consider applying the percentage fraud levels adopted nationally by the NFA and shown in Table 3, to local activities. This will establish a baseline of potential loss that can be addressed locally.
19 In previous PPP reports we have highlighted overall national improvements in the efficiency and effectiveness of local authorities to tackle fraud. However, significant variations in the individual performance of similar types of councils remain, even between neighbouring councils of similar size, services and socio- economic composition.
i Housing benefit is recorded under loss to central government in the NFA's
Annual Fraud Indicator, 2013
137

Det
ecte
d no
n-be
nefit
cas
es
20 Figure 1 shows that the number of reported detected non-benefit frauds varies widely across and within council typesi. It excludes county councils, as they do not generally provide high-volume services such as council tax.
Figure 1: Number of detected non-benefit fraud cases arranged by council type (excluding county councils) 2012/13
3,000
2,500
2,000
79 district councils did not detect a single non-benefit fraud
1,500
1,000
500
- London boroughs
Metropolitan districts
Unitary authorities
District councils
Source: Audit Commission (2013)
21 Some variation in reported fraud between councils in the same group is inevitable. It results partly from differences in the scale of the services they provide, based on the needs of the populations they serve.
22 But we do not believe that all the variation within council types in Figure 1 reflects this difference. It must to some extent be due to the way they record fraud, but particularly the different priorities that councils in each group place on detecting fraud.
23 For example, it is striking that 79 district councils did not detect a single non-benefit fraud. In contrast, only nine councils among all London boroughs, metropolitan districts and unitary authorities combined did not detect any non- benefit fraud.
i One London Borough has been omitted from Figure 1. It reported over 6,200
non-benefit fraud cases. This is more than twice as many as the London Borough with the next highest return and distorts the overall presentation of the results graphically.
138
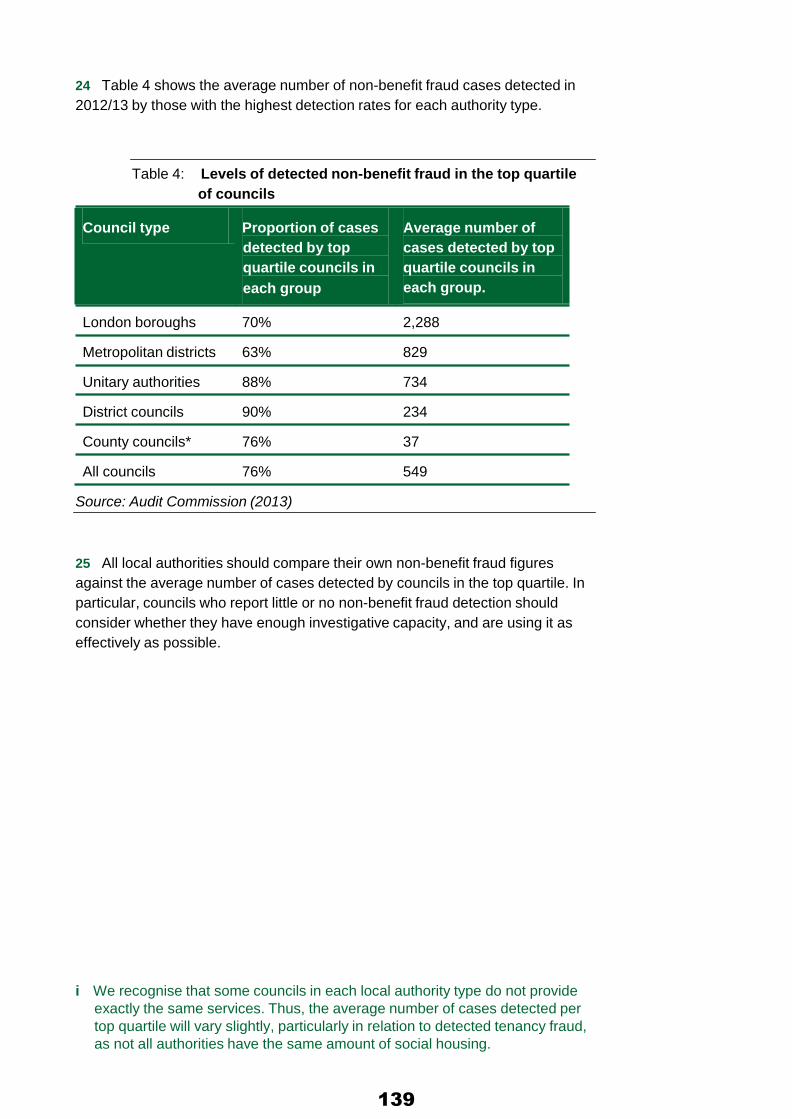
24 Table 4 shows the average number of non-benefit fraud cases detected in 2012/13 by those with the highest detection rates for each authority type.
Table 4: Levels of detected non-benefit fraud in the top quartile of councils
Council type Proportion of cases
detected by top quartile councils in each groupi
Average number of cases detected by top quartile councils in each group.
London boroughs 70% 2,288
Metropolitan districts 63% 829
Unitary authorities 88% 734
District councils 90% 234
County councils* 76% 37
All councils 76% 549
Source: Audit Commission (2013)
25 All local authorities should compare their own non-benefit fraud figures against the average number of cases detected by councils in the top quartile. In particular, councils who report little or no non-benefit fraud detection should consider whether they have enough investigative capacity, and are using it as effectively as possible.
i We recognise that some councils in each local authority type do not provide
exactly the same services. Thus, the average number of cases detected per top quartile will vary slightly, particularly in relation to detected tenancy fraud, as not all authorities have the same amount of social housing.
139

26 In Table 5 we highlight regional performance in fraud detection. With the exception of London and the North-East, all other regions report some decline in the number of cases detected in 2012/13 compared to last year. One region, the North West, reported a decline of 46 per cent year on year.
Table 5: Reported value and number of detected frauds by region in 2012/13 and 2011/12
Table header
2012/13 value
(£ million)
2011/12 value
(£ million)
Change 2011/12 to 2012/13 (%)
2012/13 cases
('000)
2011/12 cases
('000)
Change 2011/12 to 2012/13 (%)
East Midlands
9.3 16.9 -45 8.3 12.7 -35
East of England
16.6
17.8
-7
11.3
15.5
-27
London
61.8
45.4
+36
29.6
21.8
+36
North East
6.7
8.5
-21
7.5
7.5
0
North West
19.6
19.3
+2
9.3
17.2
-46
South East
23.5
26.9
-13
11.6
14.4
-19
South West
12.5
15.5
-19
8.8
10.7
-18
West Midlands
15.6
17.2
-9
10.9
13.9
-22
Yorkshire and the Humber
12.4
11.5
+8
9.7
10.3
-6
Total
178
179
-1
107
124
-14
Source: Audit Commission
27 London region has increased both the number and value of frauds detected by 36 per cent. Without this performance by London boroughs, the national fraud detection picture would be one of significant decline.
28 This is the first year since the PPP series restarted in 2009 that councils have reported fewer detected frauds compared to the previous year. The next chapter explores some possible reasons.
36% increase in number and value of frauds detected in London
140
Chapter 3: Is fraud declining? It is not possible to say whether the decline in detected fraud represents lower levels of fraud committed, or less detection by councils. In some councils, it may signal the effect of reduced investigatory resources. 29 There has been a 14 per cent decline in the number of detected fraud cases in 2012/13, compared with the previous yeari.
30 The amount of fraud an organisation detects will reflect the range of services it provides, the size of the population it serves, and how well it prevents and deters fraudsters. But we believe that fraud is endemic and that the level of detected fraud is significantly affected by:
■ the level of resources councils devote to identifying and investigating fraud;
■ how effectively they use those resources; and ■ how effectively they record fraud.
31 Organisations that do not look for fraud, or do not look in the correct way, will not detect it. Organisations and individuals are often embarrassed to admit they have been defrauded. This attitude continues to hinder effective action against fraud.
32 The different priority councils place on detecting fraud leads to substantial variation within and between council types. But variation may also be caused by changes in capacity, as councils restructure to make savings, or to prepare for national changes in counter-fraud arrangements.
33 One view held by many counter-fraud professionals is that "there is no such thing as a small fraud, just a fraud that has been caught early". In other words, older frauds will generally be of higher value than newer frauds because they have been running for longer.
34 Thus, where there has been effective action to tackle specific fraud types, their average value should reduce over time, other things being equal. For example, if the number of frauds detected remains broadly unchanged over time, but councils detect them earlier, councils will lose less money.
35 We have no evidence that councils have substantially improved their fraud prevention arrangements. Although most councils say they have maintained their levels of investigative capacity in 2012/13, others have reduced it. Councils should always seek to maintain a capacity to detect fraud, proportionate to risk.
i Detected fraud cases are a more reliable indicator of the changes in the
extent of fraud than changes in values, as single, high-value cases can distort trends.
141

Changes in investigative capacity
36 In our survey this year, nearly four times as many councils reported that their investigative capacity decreased than increased in 2012/13.
37 Our survey findings tally with research by the Local Authority Investigating Officers Group (LAIOG), which found that the total number of specialist fraud investigators across all English local authorities has reduced by a fifth since 2010 (Ref. 4).
38 Table 6 shows, by region, the proportions of councils that report a reduction in their investigative capacity in 2012/13 compared with the previous year.
Table 6 - Percentage of local authorities in each region reporting a change in investigative capacity 2012/13
Nearly 4x as many councils, reported a fall, rather than rise, in investigative capacity in 2012/13
Region Percentage of councils in region reporting an increase in investigative capacity
Percentage of councils in region reporting no change in investigative capacity
Percentage of councils in region reporting a decrease in investigative capacity
East Midlands 2 76 22
East of England 2 85 13
London 18 42 40
North East 8 50 42
North West 5 58 37
South East 7 75 18
South West 2 93 5
West Midlands 3 73 24
Yorkshire and the Humber
9 64 27
Total all councils in England
6 72 22
Source: Audit Commission (2013)
39 Across every region in the country more councils reported reducing (22 per cent) rather than increasing (6 per cent) investigative capacity, but most (72 per cent) stayed the same. This was the first year our survey collected information on changes in investigative capacity. It is possible that some councils had reduced it in previous years.
40 It is not possible to identify a statistical relationship between self-reported changes in investigative capacity and levels of detected fraud. But as this is the
142
% o
f cou
ncils
first year in which our survey measured changes in capacity, it may be that it is too early to point to any relationship. It is possible that there is a ‘time lag’ between cutting counter-fraud staff and the amount of fraud they detect. Counter-fraud professionals have expressed concern to us that their councils' cuts in investigative resources will mean they will detect less fraud.
41 These reductions, coupled with the major structural changes in counter- fraud responsibilities (para 45), mean that councils face a significant risk that they will be unable to detect fraud as effectively as in past years. The survey results for PPP 2014 may provide further insight.
42 The risk may be particularly acute in councils, notably district councils, that have small fraud investigation teams to start with. This may help to explain why 79 district councils did not report any detected non-benefit fraud in 2012/13. Any cuts in a small team could have a disproportionate and adverse effect on their ability to detect fraud.
43 Smaller councils, with limited investigative capacity, may want to explore how to work more effectively with other local authorities in their region to provide a more effective response to local fraud risks.
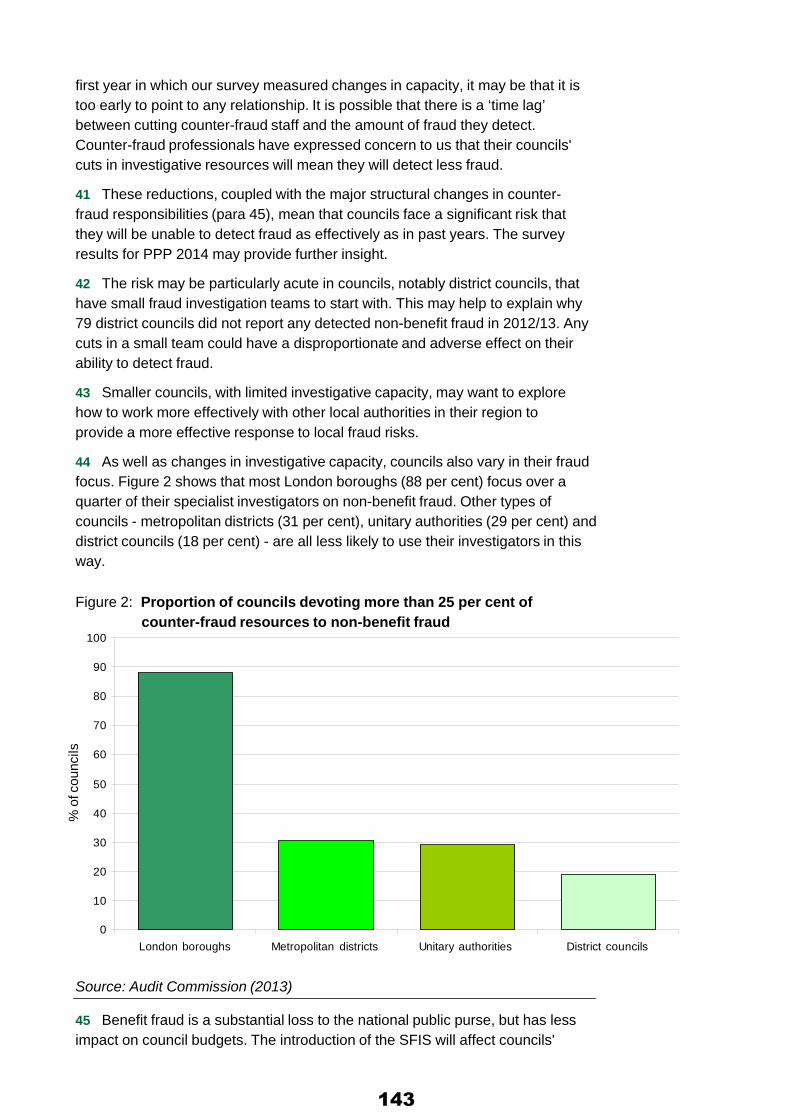
44 As well as changes in investigative capacity, councils also vary in their fraud focus. Figure 2 shows that most London boroughs (88 per cent) focus over a quarter of their specialist investigators on non-benefit fraud. Other types of councils - metropolitan districts (31 per cent), unitary authorities (29 per cent) and district councils (18 per cent) - are all less likely to use their investigators in this way.
Figure 2: Proportion of councils devoting more than 25 per cent of
counter-fraud resources to non-benefit fraud 100
90
80
70
60
50
40
30
20
10
0
London boroughs Metropolitan districts Unitary authorities District councils Source: Audit Commission (2013)
45 Benefit fraud is a substantial loss to the national public purse, but has less impact on council budgets. The introduction of the SFIS will affect councils'
143
priorities in tackling fraudi. Because SFIS will investigate benefit fraud, councils have an opportunity to focus more resources on other frauds, such as housing tenancy fraud, that have a local impact.
46 Councils that have prepared for the introduction of SFIS will be better placed to deal with non-benefit fraud risks. To a large extent, London boroughs have done this. Unless councils follow their example, they will lose much of their capability to investigate non-benefit fraud once the SFIS starts. This would be a mistake, as non-benefit frauds cause much greater financial loss and harm. Effective local engagement with SFIS will also be required to ensure action taken to tackle benefit fraud continues to reflect local priorities and risks.
47 Councils should consider whether they have the skills they need to investigate different frauds. For example, tackling procurement fraud can sometimes be more complex than investigating other types of fraud. It often requires knowledge of company accounts and contracts, as well as risks of possible corruption.
48 As well as the right skills, counter-fraud specialists in local government need sufficient powers to detect fraud. In April 2013, CTB was replaced by the council tax reduction (CTR) scheme. However, unlike CTB, CTR does not fall under benefit legislation.
49 In May 2013, the government provided councils with CTR-specific investigative powers, including requiring employers, banks and utilities to provide financial details to aid investigations. Councils will shortly have similar powers to tackle tenancy fraud. This leaves a gap in terms of other frauds. Councils need equivalent powers for all fraud types to protect the public purse effectively.
50 The need to make savings combined with national changes to counter-fraud arrangements make it even more important that councils have effective fraud risk management.
51 Housing tenancy and council tax discount represent two of the most significant areas of financial loss and harm from fraud to local government. In Chapter 4 we describe national and local issues and trends for both.
Housing tenancy and council tax discount fraud
are two significant contributors to
financial loss from fraud in local
government i The roll-out of SFIS will start in April 2014. SFIS will combine benefit fraud
investigators from councils, the Department of Work and Pensions and Her Majesty's Revenue and Customs into a single welfare benefits fraud investigation service.
144
Chapter 4: Housing tenancy and council tax discount fraud
Councils have substantially increased the number of properties they recovered from tenancy fraudsters in 2012/13 compared with the previous year. London boroughs continue to lead the way, but other councils are making good progress. Councils detected fewer council tax discount frauds.
Housing tenancy fraud
52 Housing tenancy fraud is committed when people occupy social housing unlawfully, and can include:
■ subletting a property for profit to people not allowed to live there under the conditions of the tenancy;
■ providing false information in a housing application to gain a tenancy;
■ wrongful tenancy assignment and succession where the property is no longer occupied by the original tenant; or
■ failing to use a property as the principal home, abandoning the property, or selling the key to a third party.
53 Quantifying housing tenancy fraud is not straightforward. In PPP 2012 (Ref. 5), we reported that:
■ at least 4 per cent of social housing stock in London is typically
subject to some form of tenancy fraud; ■ at least 2 per cent of social housing stock outside London is
typically subject to some form of tenancy fraud; ■ nationally at least 98,000 social homes in England are subject to
some form of tenancy fraud; ■ the NFA adopts a national average loss to the public purse of
£18,000 per property subject to tenancy fraud; and ■ the cost of building a social housing unit from new is £150,000.
54 The NFA estimates that housing tenancy fraud represents the second largest financial loss to fraud in local government, costing £845 million in 2013. When combined with the loss to tenancy fraud suffered by housing associations, the total value of such fraud in England is £1.8 billion. This is approximately five times the annual loss due to HB fraud.
98,000 social homes in England are subject to some form of tenancy fraud (PPP 2012)
145

Case study 1
Case Study: housing tenancy fraud − In 2002, an individual made a homeless application,
providing supporting documentation to confirm identity, address history and income. This included utility bills, medical records, bank statements, provisional driving licence and Home Office correspondence confirming legal status. Based on this information, the applicant was offered a secure tenancy for a council flat.
− As part of a Council-wide campaign to tackle social housing fraud, which began in 2012, the Council reviewed historic and current documentation provided in support of housing applications. This review revealed that the documentation provided was fraudulent in this case.
− The fraudster was convicted of providing false information to fraudulently obtain a council flat and was jailed for 6 months.
− This is one of a series of cases the council is investigating under an initiative to expose people who use deception and false documentation to obtain council homes. To date, 14 people have been successfully prosecuted under this initiative and 26 properties recovered.
Source: Audit Commission (2013)
55 In 2012/13, social housing providers recovered 2,642 homes (Table 7), an increase of 51 per cent compared with the previous year. The number of councils detecting at least one tenancy fraud has risen from 90 in 2011/12 to 107 in 2012/13. In addition every region of the country increased the number of properties recovered from tenancy fraudsters in 2012/13. This improvement demonstrates what can be achieved through commitment by councils, sharing of good practice, and refocusing investigative resources.
51% more homes recovered by social housing providers compared with last year
146

Table 7: Properties recovered from tenancy fraudsters in the last four years, by region
Region Number of
properties in housing stock (percentage of total)
2012/13
Number of properties recovered (percentage of total)
2011/12
Number of properties recovered
2010/11
Number of properties recovered
2009/10
Number of properties recovered
London 434,310 (25) 1,535 (58) 1,209 1,337 1,349
West Midlands
207,794 (12)
416 (16)
211
101
6
East of England
159,880 (9)
133 (5)
82
82
12
South East
171,037 (10)
132 (5)
74
56
30
North West
95,293 (6)
126 (5)
39
57
86
Yorkshire and the Humber
235,075 (14)
108 (4)
49
53
26
East Midlands
183,036 (11)
102 (4)
21
54
10
South West
101,431 (6)
56 (2)
31
35
5
North East
116,983 (7)
34 (1)
32
3
53
Total
1,704,839 (100)
2,642 (100)
1,748
1,778
1,577
Source: Audit Commission (2013)
56 This progress is encouraging. The number of properties recovered from fraudsters and the number of councils taking action is accelerating. However, when compared to the total social housing stock in each region, more can still be done to match the success of the better performing regions (see Appendix 1, Figure 4).
57 London councils continue to detect more tenancy frauds than councils in other parts of the country. London accounts for a quarter of all council homes in England, but detects 58 per cent of all tenancy frauds. In 2012/13, detected tenancy frauds in London were the equivalent of 0.35 per cent of total London council house stock. By comparison, councils in Yorkshire and the Humber detected the equivalent of 0.046 per cent of their housing stock.
58 In PPP 2012, our research indicated unlawful sub-letting for profit was the most common type of tenancy fraud in London, but other types of tenancy fraud were more prevalent outside the capital. This suggests different strategies may be required in different parts of the country.
25% of England’s council homes are in London, but its councils accounted for 58% of all the tenancy frauds detected
147

59 The analysis of detected tenancy fraud types in 2012/13 (Table 8) reinforces the findings of that initial research. Unlawful sub-letting for profit still remains a concern outside London. However councils in non-London regions could benefit by adjusting their detection approach to address the types of tenancy fraud more likely to be prevalent in their own geographic areas.
Table 8: Differences in tenancy fraud type between London and all other regions 2012/13 and 2011/12
Year London
Number of fraudulently sub-let properties recovered
London Number of other tenancy fraud properties recovered
All other regions
Number of fraudulently sub-let properties recovered
All other regions
Number of all other tenancy fraud properties recovered
2012/13 1147 338 310 847
2011/12 932 277 273 266
Source: Audit Commission (2013)
60 One reason why detection rates have risen across all regions in 2012/13 may be the increased support available to social housing providers to tackle tenancy fraud, in particular the:
■ expansion of the Tenancy Fraud Forum (TFF), a free-to-join membership organisation that coordinates 15 regional partnerships to tackle tenancy fraud;
■ freely available guidance and assistance from specialist advisors at the Chartered Institute of Housing (formerly known as the Making Best Use of Stock team); and
■ non-ring fenced government funding for some councils to tackle tenancy fraud.
61 In 2013, the government provided additional non-ring fenced funding of £9.5 million over two years, resulting in 49 councils receiving approximately £100,000 per year to tackle tenancy fraud. It is important that councils use this funding for its intended purpose.
62 More important than funding is the commitment of councils and partner housing associations to take effective action. One of the most notable examples is Huntingdonshire District Council (HDC). The Council has no social housing stock itself, but still took action.
148

Case study 2
Case Study: Huntingdonshire District Council (HDC)
− HDC had long standing concerns about tenancy fraud, linked to other frauds the council tackled. In particular benefit fraud and council tax discount fraud. Some social landlords in the area appeared unable to adequately tackle the tenancy fraud problem.
− HDC worked with the largest housing provider (Luminus Group) in the area to develop a data sharing agreement and joint working approach to identify tenancy and other frauds. The support of councillors and officers from both organisations was critical to the successful launch of the programme.
− Several initiatives were undertaken to identify tenancy frauds, including a database allowing data matching across both organisations, joint publicity, a shared website and a public ‘hotline’ to report suspicions of fraud. This last initiative was particularly successful.
− In 2013, the partnership was expanded to include other councils and housing providers in Cambridgeshire, and a shared webpage to report suspicions of fraud. Since summer 2010, there have been four successful criminal prosecutions for tenancy fraud and 25 properties recovered. Building an equivalent number of properties from new would cost the public purse around £3.75 million.
− HDC attributes the success of this approach in part to linking tenancy and non-tenancy frauds (such as council tax discount fraud). Money recovered from these frauds more than covered the cost of the partnership initiatives.
Source: Audit Commission (2013)
63 In 2013, the government passed legislation that criminalises sub-letting fraud (Ref. 6). On conviction, tenancy fraudsters face up to two years in prison or a fine of £50,000. The legislation also allows local authorities to prosecute tenancy fraudsters on behalf of housing associations. Councils should consider how best to maximise the benefit of this legislation, including closer partnership working with local housing associations.
Tenancy Audit
64 Social housing providers often use tenancy audits to identify tenancy frauds. They involve direct checks on properties. Some providers check over 20 per cent of their stock each year. If these do not detect frauds, providers may conclude they need take no further action.
149
65 But other research (Ref. 7) raises concerns about the effectiveness of many housing tenancy audits. In particular, this found that tenancy audits were responsible for detecting just 0.9 per cent of a purposive sample of proven tenancy frauds.
66 Who carries out tenancy audits is important. This research also found that counter-fraud specialists or housing officers with enhanced fraud awareness training are ten times more likely to identify a tenancy fraud than non- specialists. Further information on good practice in tenancy audits can be obtained from specialist advisors at the Chartered Institute of Housing.
Council tax discount
67 Councils in England raised over £22 billion from council tax in 2012/13 (Ref. 8). Fraudulently claimed discounts and exemptions directly increase local taxation for people in the fraudsters' own communities and neighbourhoods.
68 There are many different types of discounts and exemptions that can be claimed. The most common is single person discount (SPD), where a 25 per cent discount can be claimed for sole occupiers, which can rise to 100 per cent when the occupier is a full time studenti. Our research found that, typically, between four and six per cent of SPD claims are fraudulent.
69 Such fraud directly affects local taxation, but detected cases fell by nearly 12 per cent in 2012/13 (Table 1). This may be because some councils prefer to align their detection activities to the two-yearly NFI data matching timetable.
70 Most councils do not treat SPD fraud as a criminal offence. Some just cancel the discount in the year they detect a fraud. But councils can recover funds lost to SPD fraud, which individually can be worth thousand of pounds over several years. They can also apply a penalty for fraudulently claimed discounts, although not all routinely do so.
71 Councillors have a role to play in ensuring that local authorities manage this fraud risk effectively. They may want to consider the sanctions policy of their organisation and the impact it is has on deterrence (see Chapter 6 for more on deterrence).
72 Recent experience has shown that student discount fraud is a growing problem for some councils. Building on its success in identifying £1.9 million of student discount fraud (Ref. 9). Bristol City Council has effectively challenged the validity of 584 cases (32 per cent of high risk cases investigated) in 2012/13 to generate potential additional revenue of £900,000.
i To qualify for a single person discount, residents must be 18 or over and be
the only member of a household. However, they can also apply for this discount if anyone else living at this address falls into certain categories that allow them not to be counted as ‘other occupiers’.
4-6% of single person discount claims are fraudulent (PPP 2010) Most councils do not treat single person discount fraud as a criminal offence
150

73 The London Borough of Southwark (LBS) has approximately 2,400 properties occupied by students. In 2012/13, a data matching exercise found that 750 student discount claimants had a high fraud risk. Subsequent investigations established that 423 of these (56 per cent of the sample, 18 per cent of all claimants) had claimed the discount fraudulently. LBS were able to increase billing by over £500,000.
74 Local authorities should consider the size of their local student population and the potential financial loss to such fraud, when developing a proportionate response to this risk.
75 Tenancy fraud and council tax discount fraud are two of the biggest areas of financial loss to local government. But other frauds also present risks. Chapter 5 describes these in more detail.
Tenancy fraud and council tax discount fraud are two of the biggest areas of financial loss to local government
151
Chapter 5: Trends and developments in other fraud risks
Other fraud risks cause harm. Even though their overall value is lower than housing tenancy fraud and council tax discount fraud, they warrant attention from local government bodies.
Business rates
76 In 2012/13, councils in England contributed nearly £22 billion in non- domestic (business) rates to central government (Ref. 10). The government distributed this money across councils. Business rate fraud includes:
■ falsely claiming mandatory or discretionary rate relief or empty property exemptions;
■ failure to declare occupancy of a property; ■ falsely claiming insolvency status to evade payments; and ■ not disclosing relevant information, for example, about the size
of the company, to gain rate relief.
77 The total value of business rate fraud detected in 2012/13 is £7.2 million from 149 cases. This includes one case of over £5 million, which shows the financial risk such frauds can pose to the public purse.
78 Councils continue to report significant increases in applications for relief and incentive schemes for business rates; in particular charitable relief. Such arrangements may be legal, but fraudsters could potentially exploit them. The Charity Commission issued updated guidance in 2013 to help prevent abuse of charitable status (Ref. 11).
79 Until April 2013, councils passed on all the business rates they collected to the government, which then redistributed them across English councils. Accordingly, councils had little direct incentive to detect this fraud as they did not benefit financially. From April 2013, councils keep a proportion of the business rates income they collect. This creates a financial incentive for councils to be more pro-active in addressing this fraud risk, particularly in relation to charitable and empty property relief, which are the largest in value.
80 Charities can claim relief on business ratesi. Although the vast majority of charities occupying business and shop premises provide a genuine service, the potential for fraudsters to exploit this arrangement remains. Any losses now directly reduce the money available for council services.
i Most (80 per cent) charitable business rate relief is mandatory, with some
(20 per cent) within the discretion of a public body.
Keeping some income they generate, councils now have greater incentive to tackle business rate frauds
152

Right to Buy
81 Right to Buy (RTB) fraud occurs when someone occupying a property unlawfully applies for a discount, or when a legitimate tenant provides false information on application.
82 In April 2012, the government significantly increased the RTB discount in England up to a maximum of £100,000 in London and £75,000 elsewhere. In PPP 2012, we suggested that this may unintentionally increase the financial incentive to commit RTB fraud. In 2012/13, we report a 168 per cent rise in detected RTB cases, compared with 2011/12 (Table 9).
83 This year on year increase is likely to be as a result of two principal factors: generally increased activity against tenancy fraud combined with more attempted RTB frauds arising as a result of the increased discounts.
Table 9: Detected RTB fraud cases 2009/10 to 2012/13
The detection of Right to Buy fraud cases rose by
168% in 2012/13 compared to the previous year
Cases 2012/13
Cases 2011/12
Cases 2010/11
Cases 2009/10
102 38 49 34
Source: Audit Commission (2013)
Social care (including direct payments)
84 Social care fraud can occur at any point in the process. Open-ended responses in the annual detected fraud survey 2012/13 suggest that direct payments is one of the biggest emerging fraud risks for some councils. Frauds include diverting a client’s direct payments for a fraudster’s (sometimes the carer’s) use, or continuing to claim direct payments after a client dies.
85 The fraudulent redirection of monies intended for social care can have an immediate and harmful impact on the care of those most in need. Early identification and action is required to ensure that where such fraud does occur, it does not result in harm to those receiving the care.
153

Case study 3
Direct payments fraud − The mother of a child with severe learning difficulties received
direct payments to pay for a range of care services for her daughter. Payments totalling nearly £150,000 over six years were paid into a bank account set up specifically to pay for the daughter’s care.
− The mother was required to provide details of how the direct payments were being spent, but failed to do so until payments were suspended. In an attempt to get payments restarted, she submitted bank statements. These highlighted that funds were being spent on items unrelated to her daughter’s care, such as on-line bingo, computer games and in various retail outlets.
− An investigation discovered that, over the previous four years, only £20,000 had been spent on the daughter’s care. The mother had given false information about the level of care being provided.
− The Council has implemented changes to the way in which it administers direct payments as a result of this case.
− The mother was convicted for stealing nearly £125,000 and sentenced to a two-year community order and a two-year supervision order.
Source: Audit Commission (2013)
86 Direct payments have increased from 8 per cent of all community service expenditure in 2007/08 to 21 per cent in 2012/13 (Ref. 12). Over that period, the total value of spending on direct payments (adjusted to 2012/13 prices) rose from £523 million to £1.3 billion. Such a significant increase in activity increases the risk that monitoring arrangements designed to tackle such fraud could be stretched.
87 Table 10 shows the average value of a detected social care fraud has exhibited some volatility in the last four years, although the general trend is upwards. The number of cases has also increased by 64 per cent, the total value of detected losses by 82 per cent, compared with the previous year.
Table 10: Cases and values of social care fraud between 2009/10 and 2012/13
82% increase in the total value of detected social care fraud compared with the previous year
2012/13
2011/12
2010/11
2009/10
Cases (number)
200
122
102
131
Total value (£ million)
4.0
2.2
2.2
1.4
Average case value (£)
19,859
18,033
21,569
10,687
Source: Audit Commission (2013)
154

88 In previous PPP reports, we have acknowledged the need for councils to adopt a balanced approach to protecting public funds, and introduce proportionate measures that do not reduce the choice and control that direct payments (as part of personal budgets) aim to bring.
False insurance claims
89 Councils face insurance claims for many things, including personal injury arising from accidents on public footpaths. In 2012/13, the value of fraudulent insurance claims against local authorities increased by £1 million to £3 million compared to the previous year. However, the number of cases has continued to drop over the last three years (Table 11).
In 2012/13, fraudulent insurance claim costs to councils had risen, since the
previous year, by Table 11: Cases and values of insurance fraud between 2009/10 and 2012/13 £1million
2012/13
2011/12
2010/11
2009/10
Cases (number)
74
132
149
72
Total value
3.0
2.0
3.7
2.9 (£ million)
Average case value (£)
40,541
15,152
24,832
40,278
Source: Audit Commission
90 With an average value of £40,541 per detected case, insurance fraud is a risk that continues to warrant attention.
Disabled parking concessions (blue badges)
91 The NFA estimates that 20 per cent of all blue badges in circulation are abused (Ref. 1). But blue badge fraud does not represent a major financial loss to councils, which may explain why detection rates have fallen by 40 per cent in 2012/13 (Table 12).
Table 12: Detected disability parking concession (blue badge) fraud cases 2009/10 to 2012/13
Year
2012/13
2011/12
2010/11
2009/10
Number of cases
2,901
4,809
3,007
4,097
Source: Audit Commission (2013)
92 The average number of cases of blue badge fraud varies by council type, although they are relatively few in number overall (Figure 3). However, despite the relatively low financial value of such fraud, the individual harm caused should not be forgotten. Fraudulent use of blue badges causes inconvenience
155

Ave
rage
num
ber o
f det
ecte
d ca
ses
and sometimes direct harm by depriving an individual in genuine need and genuine entitlement to disabled parking facilities. In addition such frauds reduce public confidence in the blue badge system. As councils prioritise their counter- fraud activities, they should consider the social as well as financial harm of blue badge fraud.
Figure 3: Average number of cases of blue badge fraud detected by
council type 2012/13
45
40
35
30
25
20
15
10
5
0 London boroughs Metropolitan districts Unitary authorities County councils
Source: Audit Commission (2013)
93 In two-tier areas, county councils have administrative responsibility for issuing blue badges and, therefore, reporting such detected frauds. However, it is district councils in those county areas that face reduced car parking income as a result of the fraudulent abuse of blue badges.
94 The relatively low level of detected blue badge frauds reported by county councils suggests they have little incentive to detect it, to the detriment of district councils in their area. District councils may want to explore how best to work in partnership with their county council to tackle such fraud.
156
Procurement
95 In 2012/13, the NFA estimates procurement fraud cost local authorities £876 million, making it the single largest area of financial loss to fraud in local government (Ref: 1). In 2012/13, the total value of detected procurement fraud by local authorities was £1.9 million. This suggests that far greater attention should be given to tackling procurement fraud.
96 Fraud is possible at any stage in the procurement and contracting process. In procurement, it can occur because of:
■ collusion between staff and bidders to award contracts and specify favourable terms and conditions;
■ collusion between bidders to agree that they will not bid competitively for a particular contract; and
■ bidders failing to tender in accordance with contract specifications, and then submitting false claims for extra costs under the contract.
97 Once a contract is in place, fraud can occur where contractors: ■ provide goods and services of inferior quality than specified in the
contract to lower their costs; ■ intentionally ignore minimum statutory pay and health and safety
regulations for financial gain; ■ provide inflated performance information to attract greater
payments than are due; and ■ present false invoices.
98 The London Public Sector Counter-Fraud Partnership has published a good practice guide on combating invoicing fraud (Ref. 13). Local government bodies can use this tool to help prevent and detect invoicing fraud.
Schools
£2.3m of fraud committed against schools,
£1.9m involved internal
fraud
99 Schools can suffer a wide range of frauds. Staff can embezzle money from the school accounts, defraud their expenses, commit payroll fraud and alter cheques. Externally, schools may be victims of mandate fraud and procurement fraud.
100 This is the first year in which we have required local authorities to report detected frauds against schools in our annual detected fraud and corruption survey. It collects data only on maintained schools, as free schools, foundations and academies are outside the Commission's remit.
101 In 2012/13, councils reported 191 cases of fraud in schools, worth £2.3 million. Of these, 86 cases with a value of £1.9 million involved internal fraud. The results suggest that schools may not have the same level of supervisory checks and controls as large organisations such as councils and may, therefore, face a greater risk of internal fraud.
102 Once councils have had time to embed data collection arrangements for fraud committed against schools, the number of reported detected schools fraud may rise.
157
Internal fraud
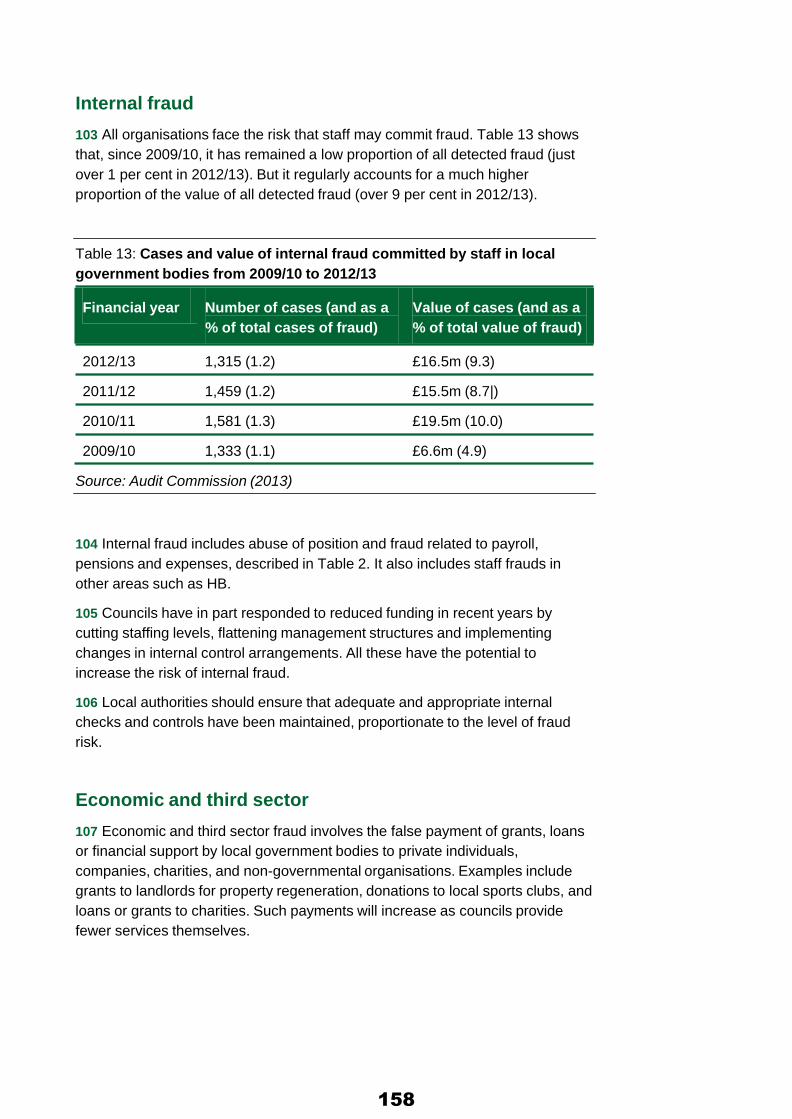
103 All organisations face the risk that staff may commit fraud. Table 13 shows that, since 2009/10, it has remained a low proportion of all detected fraud (just over 1 per cent in 2012/13). But it regularly accounts for a much higher proportion of the value of all detected fraud (over 9 per cent in 2012/13).
Table 13: Cases and value of internal fraud committed by staff in local government bodies from 2009/10 to 2012/13
Financial year Number of cases (and as a
% of total cases of fraud) Value of cases (and as a % of total value of fraud)
2012/13 1,315 (1.2) £16.5m (9.3)
2011/12 1,459 (1.2) £15.5m (8.7|)
2010/11 1,581 (1.3) £19.5m (10.0)
2009/10 1,333 (1.1) £6.6m (4.9)
Source: Audit Commission (2013)
104 Internal fraud includes abuse of position and fraud related to payroll, pensions and expenses, described in Table 2. It also includes staff frauds in other areas such as HB.
105 Councils have in part responded to reduced funding in recent years by cutting staffing levels, flattening management structures and implementing changes in internal control arrangements. All these have the potential to increase the risk of internal fraud.
106 Local authorities should ensure that adequate and appropriate internal checks and controls have been maintained, proportionate to the level of fraud risk.
Economic and third sector
107 Economic and third sector fraud involves the false payment of grants, loans or financial support by local government bodies to private individuals, companies, charities, and non-governmental organisations. Examples include grants to landlords for property regeneration, donations to local sports clubs, and loans or grants to charities. Such payments will increase as councils provide fewer services themselves.
158

Case study 4
Grants fraud − A council awarded an £80,000 grant to a charity, to
purchase and refurbish a double-decker bus as a mobile multimedia youth centre for young people in the local community.
− The charity worker, who made the application for this funding, provided invoices to substantiate the money had been spent for the purpose intended.
− However, a subsequent investigation by the council established the invoices were forgeries and that £40,000 had been transferred from the charity bank account to the fraudster's personal account. The fraudster was able to do this by exploiting her position as the sole signatory for the bank account of the charity.
− The fraudster pleaded guilty to the acquisition, use or possession of criminal property. She received an 18 month suspended sentence, 180 hours of unpaid community work and a 3 month curfew.
− The Council has introduced additional control measures to try to combat fraud in this area, including an approved supplier list for voluntary bodies requesting grants.
Source: Audit Commission (2013)
The Council introduced an approved supplier list for voluntary bodies requesting grants
159
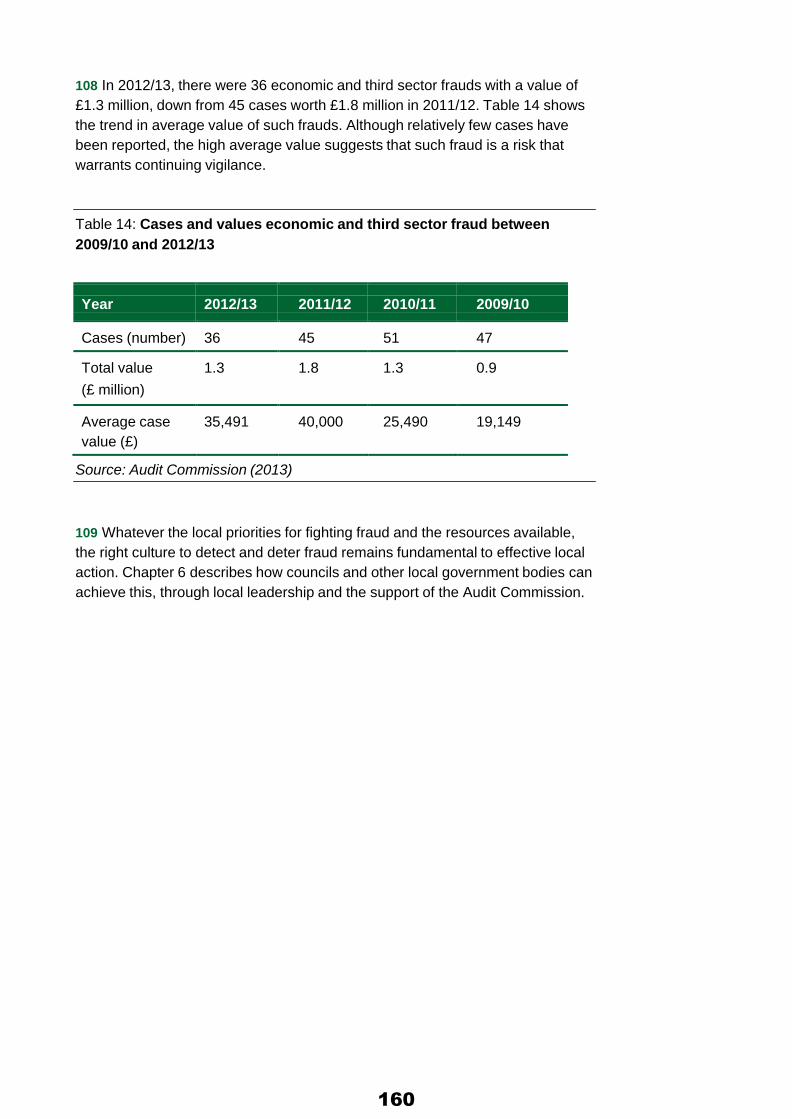
108 In 2012/13, there were 36 economic and third sector frauds with a value of £1.3 million, down from 45 cases worth £1.8 million in 2011/12. Table 14 shows the trend in average value of such frauds. Although relatively few cases have been reported, the high average value suggests that such fraud is a risk that warrants continuing vigilance.
Table 14: Cases and values economic and third sector fraud between 2009/10 and 2012/13
Year
2012/13
2011/12
2010/11
2009/10
Cases (number)
36
45
51
47
Total value
1.3
1.8
1.3
0.9 (£ million)
Average case value (£)
35,491
40,000
25,490
19,149
Source: Audit Commission (2013)
109 Whatever the local priorities for fighting fraud and the resources available, the right culture to detect and deter fraud remains fundamental to effective local action. Chapter 6 describes how councils and other local government bodies can achieve this, through local leadership and the support of the Audit Commission.
160

Chapter 6: National and local developments in fraud detection and deterrence.
Councillors have a crucial role in supporting the right culture to deter and detect fraud and encourage staff to raise concerns. They can draw on a wide range of support to help them, including from the Audit Commission.
Counter-fraud policy - awareness and implementation
110 A strong counter-fraud culture, with clear principles, ethical standards, and zero tolerance of transgression, is the foundation of an effective response to fraud. Each organisation should sum up its approach in a counter-fraud policy. But a policy on its own does not ensure the right culture.
111 The ‘tone from the top’ is fundamental to establishing a robust and accepted counter-fraud culture. This helps to ensure that all staff are aware of the counter-fraud policy, know, accept and abide by the standards the policy contains.
112 Our research over many years suggest that only 56 per cent of all public sector staff are aware that their organisation has a counter-fraud policy, and a similar proportion (51 per cent) say they know their counter-fraud responsibilities under the policyi.
Councillors’ role in the fight against fraud
113 Councillors have an important role in shaping a corporate and strategic response to fraud that balances local and national priorities to minimise the harm fraud causes within their local community. They can:
■ ensure their council understands the local fraud risks it faces; ■ compare their council’s performance in countering fraud with
similar councils; and ■ require their council to deploy counter-fraud resources
proportionate to risk and focused on areas of greatest local harm.
114 In our 2012/13 detected fraud survey, half of all councils reported they had a councillor with portfolio responsibility for fighting fraud. One example is Westminster City Council, where a councillor now fulfils the role of “Anti-fraud Tsar”.
i These figures come from unpublished research by the Audit Commission,
based on our Changing Organisational Culture toolkit. This covered approximately 100,000 individual respondents over more than10 years.
‘tone from the top’ is fundamental to establish a robust, accepted, counter-fraud culture
161

Case study 5
Westminster City Council (WCC): effective councillor involvement in fighting fraud
− The councillor with the role of “Anti-fraud Tsar” provides political leadership for an authority-wide, integrated and coordinated fraud response across cabinet portfolios. This provides a conduit for front-line services to decision makers as part of a joined-up approach to countering fraud (this is of particular importance when enhanced investigative capacities of other agencies may be required, or where the financial incentive to tackle different fraud types does not fall principally on local authorities).
− One of their first initiatives addressed local concerns about suspected tenancy and benefit fraud in a number of private housing blocks. Through the councillor’s involvement, WCC launched a coordinated and multi- agency investigation across a number of targeted private housing blocks.
− This found that between 61 and 95 per cent of the HB- funded tenancies in each block were unlawfully sub-let. In one block alone, the Council detected over £200,000 of fraudulently claimed HB.
Source: Audit Commission (2013)
Deterrence
115 Historically, councils have adopted a mainly reactive approach to fighting fraud, involving detection, investigation, sanction and redress. But with reducing resources, more focus on pro-active prevention and deterrence is needed.
116 Counter-fraud professionals have always viewed deterrence as one of most important and cost-effective means of tackling fraud. Effective deterrence depends on a number of factors, including:
■ a reasonable likelihood that the fraudster will be caught; ■ a likelihood that the fraudster will be appropriately punished; and ■ widely publicising results, to deter other potential fraudsters.
117 A good example of effective deterrence involves council tax SPD fraud. Nationally, one in three households claims SPD, but this varies from council to council. Part of this variation is due to fraudulent SPD claims. Five years ago, 23 councils in England reported that 40 per cent or over of the households in their authority claimed the discount. In one of those authorities, nearly half (48 per cent) of households claimed SPD.
162

118 Since then, greater national and local publicity about successful investigations has led to a fall in the number of councils with a substantially higher than average number of households claiming SPD. By 2012, nine councils in the country reported that of over 40 per cent of all households in their area claimed SPD. The highest is now 42.5 per cent. This represents a significant reduction in SPD claimants at a number of councils. Case studies 6 and 7 highlight what can be achieved at a local level.
Case study 6
23 to 9, the fall, in five years, of councils reporting 40% or more households in their authority claim single persons discount
Liverpool City Council: SPD fraud deterrence and detection
− In 2010, Liverpool City Council had an SPD claimant level of over 46 per cent of households. The Council had hitherto taken limited action to identify SPD fraudsters.
− The council's subsequent action to tackle SPD fraud included publicising in the local press, a range of measures that it was taking. By 2012, only just over 40 per cent of households in Liverpool claimed the discount.
Source: Audit Commission (2013)
Successful investigations has led to a fall in the number of councils with a substantially higher than average number of households claiming SPD
163
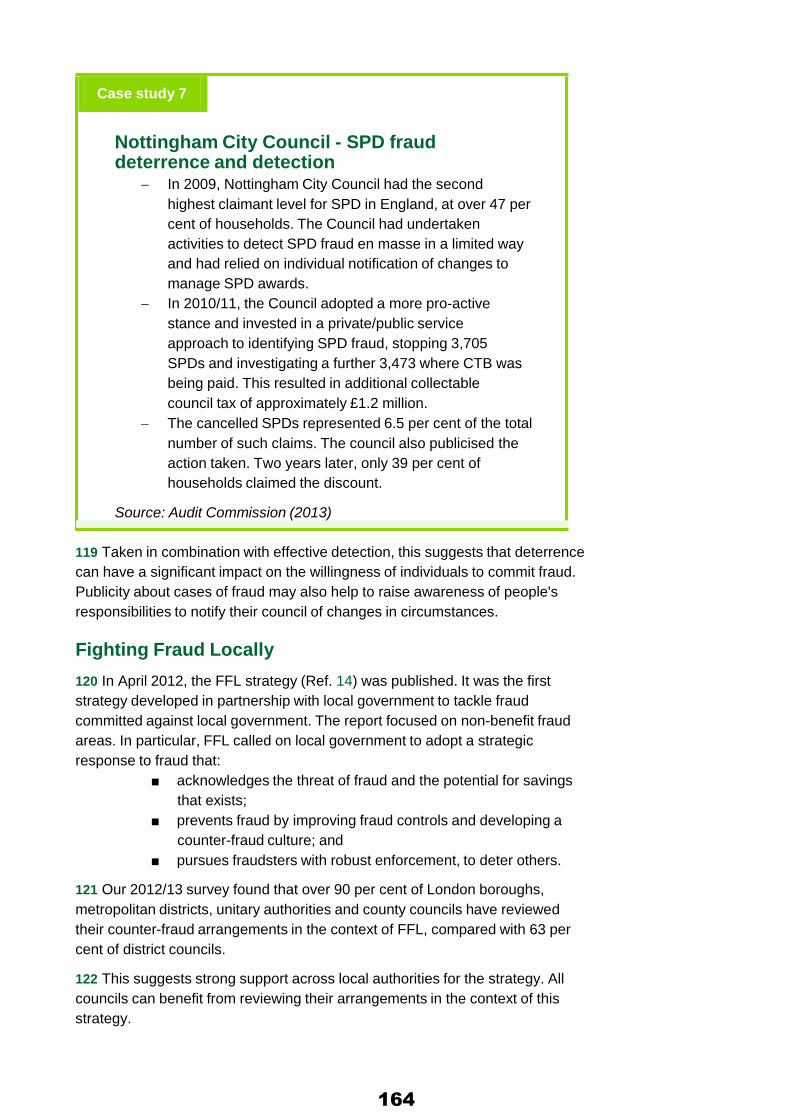
Case study 7
Nottingham City Council - SPD fraud deterrence and detection
− In 2009, Nottingham City Council had the second highest claimant level for SPD in England, at over 47 per cent of households. The Council had undertaken activities to detect SPD fraud en masse in a limited way and had relied on individual notification of changes to manage SPD awards.
− In 2010/11, the Council adopted a more pro-active stance and invested in a private/public service approach to identifying SPD fraud, stopping 3,705 SPDs and investigating a further 3,473 where CTB was being paid. This resulted in additional collectable council tax of approximately £1.2 million.
− The cancelled SPDs represented 6.5 per cent of the total number of such claims. The council also publicised the action taken. Two years later, only 39 per cent of households claimed the discount.
Source: Audit Commission (2013)
119 Taken in combination with effective detection, this suggests that deterrence can have a significant impact on the willingness of individuals to commit fraud. Publicity about cases of fraud may also help to raise awareness of people's responsibilities to notify their council of changes in circumstances.
Fighting Fraud Locally
120 In April 2012, the FFL strategy (Ref. 14) was published. It was the first strategy developed in partnership with local government to tackle fraud committed against local government. The report focused on non-benefit fraud areas. In particular, FFL called on local government to adopt a strategic response to fraud that:
■ acknowledges the threat of fraud and the potential for savings that exists;
■ prevents fraud by improving fraud controls and developing a counter-fraud culture; and
■ pursues fraudsters with robust enforcement, to deter others.
121 Our 2012/13 survey found that over 90 per cent of London boroughs, metropolitan districts, unitary authorities and county councils have reviewed their counter-fraud arrangements in the context of FFL, compared with 63 per cent of district councils.
122 This suggests strong support across local authorities for the strategy. All councils can benefit from reviewing their arrangements in the context of this strategy.
164

123 In 2013, the FFL partnership launched a number of initiatives to increase understanding of different fraud types and ways of managing risks of fraud in business rates, schools and personal budgets. Other initiatives focus on addressing key fraud enablers and effective whistle-blowing. The results of these initiatives will be available in late 2013 and early 2014.
Whistle-blowing
124 Whistle-blowing remains a key component in effectively managing the risk of fraud. In 2008, the British Standards Institute published a Code of Practice, which remains the accepted standard for whistle-blowing arrangements (Ref. 15). In 2012/13, the proportion of councils reporting that they reviewed their arrangements annually in line with the Code was 60 per cent, up from 51 per cent in 2010/11.
125 We also collect data on whistle-blowing disclosures recorded by local government bodies. In 2010/11 and 2011/12, these disclosures totalled around 2,000 each year. In 2012/13, they dropped by 29 per cent to 1,408.
126 Such a reduction in formal disclosures can be difficult to interpret. This fall may in part reflect the positive impact that increasing implementation of the BSI Code of Practice is having, with staff at some councils more confident in reporting concerns through line management rather than formal whistle-blowing arrangements.
127 However, councils should not be complacent. There is a possibility that, for some individual councils, any reduction in disclosures may instead reflect less trust and confidence in local arrangements.
128 Research published in May 2013 by Public Concern at Work (PCaW), the whistle-blowing charity, highlighted concerns about the treatment of whistleblowers and the potential impact this has on discouraging others to raise concerns (Ref. 16).
129 This research has important implications for councils. In particular, PCaW concluded that "those working in local government have the lowest expectations that the wrongdoing will be stopped and that the investigation will be satisfactory throughout the process of raising a concern" (Ref. 16, page 6). This suggests some local authorities can do more to strengthen their whistle-blowing arrangements.
130 It is also possible that a lack of staff confidence in whistle-blowing arrangements at some local authorities may have contributed to the 29 per cent fall in the number of formal disclosures made to councils in 2012/13.
131 Councils are reducing staff numbers, and de-layering staff structures. Combined with changes in service delivery and greater local autonomy for some services, whistle-blowing is increasingly recognised as one of the key means of identifying fraud. Increasingly,
whistle-blowing is recognised as an
important means of identifying fraud
165
132 Thus local authorities should obtain assurance that staff: ■ are aware of the whistle-blowing arrangements in their
organisation ■ have confidence in the confidentiality of those arrangements; and ■ have assurance that any concerns will be addressed
appropriately.
133 Councillors should seek assurance that their councils comply with good practice in whistle-blowing, and that they provide sufficient resources to investigate possible fraud and corruptioni.
Support to Audited Bodies
134 In 2013, the influential Fraud Advisory Panel (FAP)ii issued guidance encouraging senior management of all organisations to support investment in counter-fraud measures (Ref. 17) .
135 The Audit Commission agrees with the FAP's guidance and this report contains two sources of information that can help local government bodies direct their investment where it is most needed:
■ the counter-fraud checklist in Appendix 2 will help those responsible for governance focus on the main issues in their organisation; and
■ the questions for councillors in Appendix 3 will help them challenge how well their council addresses fraud risks in the main services their organisation provides. It is intended to be used in conjunction with individual fraud briefings.
136 \The Commission runs the NFI and provides fraud briefings to auditors. National Fraud Initiative
137 The Audit Commission has run the NFI for 17 years. The NFI compares data held by 1,300 public sector and 77 private sector organisations. These include other regulators in Scotland, Wales and Northern Ireland, as well as government departments and other national agencies. The NFI flags up inconsistencies in data that may indicate fraud, signalling the need for investigation.
138 The NFI helps participating organisations detect one-off individual frauds or error. It helps find patterns in fraud activity that might be missed at a local level, for example, where the fraudsters use the same false identities over a large geographical area. It helps provide a national picture of fraud and highlights some emerging fraud risks.
i Currently, the Audit Commission is a prescribed body under whistle-blowing
legislation. ii A national charity that works across the private, public and voluntary sectors
to raise awareness of fraud
166
139 Since it started in 1996, the NFI has helped to:
■ identify over £1 billion of potential loss to fraud, overpayment or error across the UK;
■ detect around 15,000 cases of pension overpayments worth £450 million;
■ identify 100,000 cases of incorrect council tax single person discounts totalling £160 million and over £250 million of housing benefit overpayments; and
■ find nearly 69,000 blue badges and almost 98,000 concessionary travel passes that have been cancelled as a result of NFI data matching.
140 In 2013, the NFI introduced real-time and flexible matching modules alongside the traditional two-yearly national matching exercise. These new modules align with the government’s policy of focusing on protecting the UK economy from fraud. The NFI now allows a participant to hunt for frauds more often and to tailor their search to best suit their needs, for example, by undertaking regular data matching to target tenancy fraud in a geographical area.
Fraud briefings
141 The Commission makes available individually tailored fraud briefings to support external auditors' communications with those responsible for governance in each council. The briefings contain comparative information on each council’s fraud detection results. External auditors may provide these briefings on request, and on a confidential basis to ensure that the information they contain is not available to fraudsters.
142 Fraud briefings will: ■ be available to the independent external auditor to present to
councillors and officers with governance responsibilities; ■ provide contextual and comparative benchmark data; ■ be available to London boroughs, metropolitan districts and
unitary authorities from December 2013; and ■ be available to county councils and district councils in early
2014.
143 Each individual fraud briefing has been developed by the Audit Commission. They are designed to be used together with the questions for councillors in Appendix 3.
144 Fraud briefings can only be obtained from the external auditor for each individual local authority. We encourage all councils to discuss their briefings with their external auditor.
£1billion of potential loss due to fraud, overpayment or error detected by the NFI since it started in 1996
167

Other sources of help
145 Action Fraudi is the national reporting centre for fraud and internet crime. As a central point of contact for information, Action Fraud is able to link seemingly unrelated crime from around the country and identify organised criminal networks. All information provided to Action Fraud may prove to be of value and contributes to the national fight against fraud.
146 Through the analysis of these fraud reports, information packages are produced for police forces and other agencies to investigate. From early 2013, local authorities have been able to report fraud directly to Action Fraud rather than local police forces. Councils should use Action Fraud reporting facilities.
147 In turn, Action Fraud should provide timely feedback to all local authorities who report frauds to them, to develop greater confidence in the reporting mechanism and encourage wider participation.
148 Another example is Operation Sterlingii (Ref. 18) the Metropolitan Police initiative to tackle economic crime. Public organisations can access the website for good practice guidance and fraud alerts that notify possible risks of types or patterns of fraud. Although focused on London fraud threats, the alerts and guidance also apply to non-London councils.
149 Councils can also access fraud intelligence through membership of the National Anti-Fraud Network (NAFN), which provides fraud warning bulletins and other counter-fraud focused services to member bodies.
i See website: http://www.actionfraud.police.uk/ ii See website: http://content.met.police.uk/Site/alerts
168

Looking ahead
150 The Local Audit and Accountability Bill contains provision for the closedown of the Audit Commission in March 2015.
151 The government has announced that the NFI data matching exercises will be transferred to the Cabinet Office on 1 April 2015. This will allow the NFI to continue to provide two-yearly data matching activities and the real-time and flexible matching modules. In advance of this transfer the national report for the NFI 2012/13 will be published in June 2014.
152 The Audit Commission has made a commitment to publish its final report in the Protecting the public purse series in 2014, based on the 2013/14 detected fraud and corruption survey. At the time of writing, no decision has been made as to whether, or if, any organisation will assume responsibility for carrying out this survey, producing the national PPP reports, or any of the other Commission counter-fraud activities after March 2015.
153 Local government bodies detected less fraud in 2012/13. PPP 2014 will consider whether this represents a trend, or a single exception to rising detected fraud levels in recent years. But faced with continuing financial pressure, and new roles and responsibilities associated with national counter- fraud arrangements, local government bodies must keep their focus on reducing losses from fraud.
154 Local government bodies will have more effective counter-fraud arrangements if they bear in mind that:
■ detected fraud provides indicative rather than definitive information on levels of fraud;
■ the more they look for fraud, and look in the right way, the more they are likely to find;
■ how much fraud they detect depends on how well they use their investigative resources; and
■ fraud prevention and deterrence are more cost-effective than fraud detection.
less fraud detected in 2012/13,
a new trend or an exception to the rise in detected fraud in recent years?
169
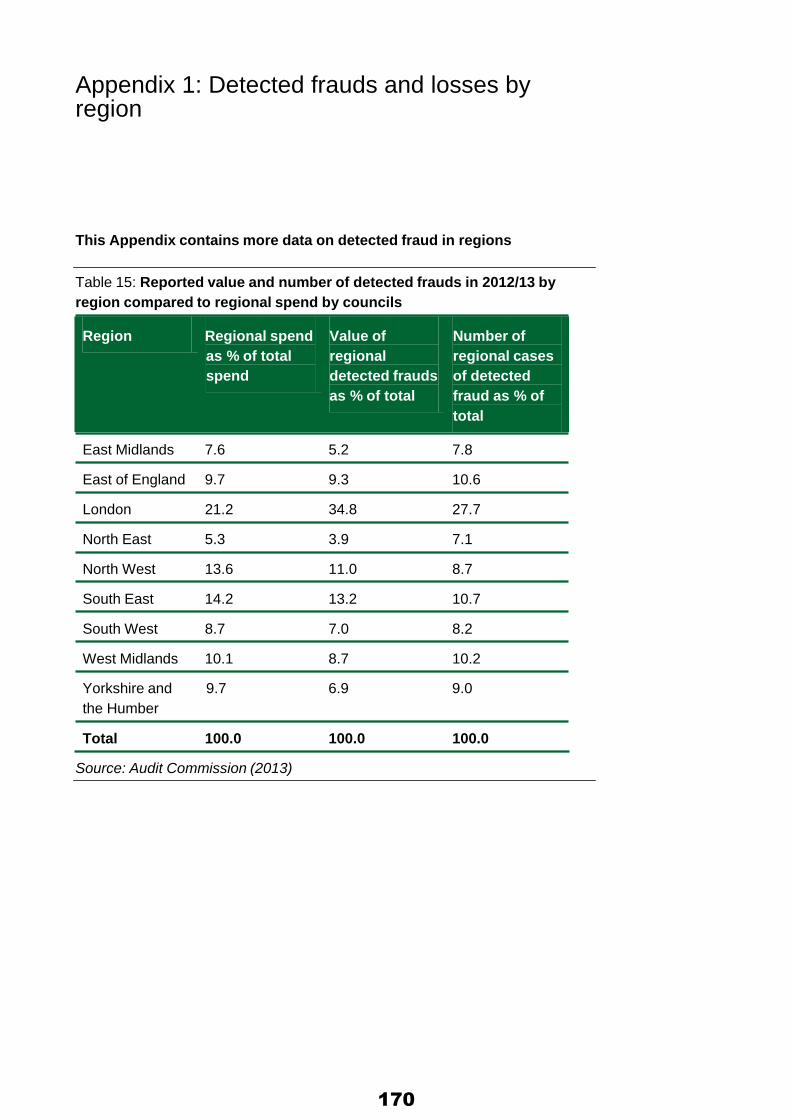
Appendix 1: Detected frauds and losses by region
This Appendix contains more data on detected fraud in regions
Table 15: Reported value and number of detected frauds in 2012/13 by region compared to regional spend by councils
Region Regional spend
as % of total spend
Value of regional detected frauds as % of total
Number of regional cases of detected fraud as % of total
East Midlands 7.6 5.2 7.8
East of England 9.7 9.3 10.6
London 21.2 34.8 27.7
North East 5.3 3.9 7.1
North West 13.6 11.0 8.7
South East 14.2 13.2 10.7
South West 8.7 7.0 8.2
West Midlands 10.1 8.7 10.2
Yorkshire and the Humber
9.7 6.9 9.0
Total 100.0 100.0 100.0
Source: Audit Commission (2013)
170

Rec
over
ed p
rope
rties
as
perc
enta
ge o
f cou
ncil
hous
ing
stoc
k
Figure 4: Properties recovered from tenancy fraudsters, as a percentage of regional housing stock
0.4 London
0.35 West Midlands
North West
0.3
East of England
0.25 South East
0.2 South West
East Midlands
0.15
Yorkshire and the Humber
0.1 North East
0.05
0
2009/10 2010/11 2011/12 2012/13 Source: Audit Commission (2013)
171
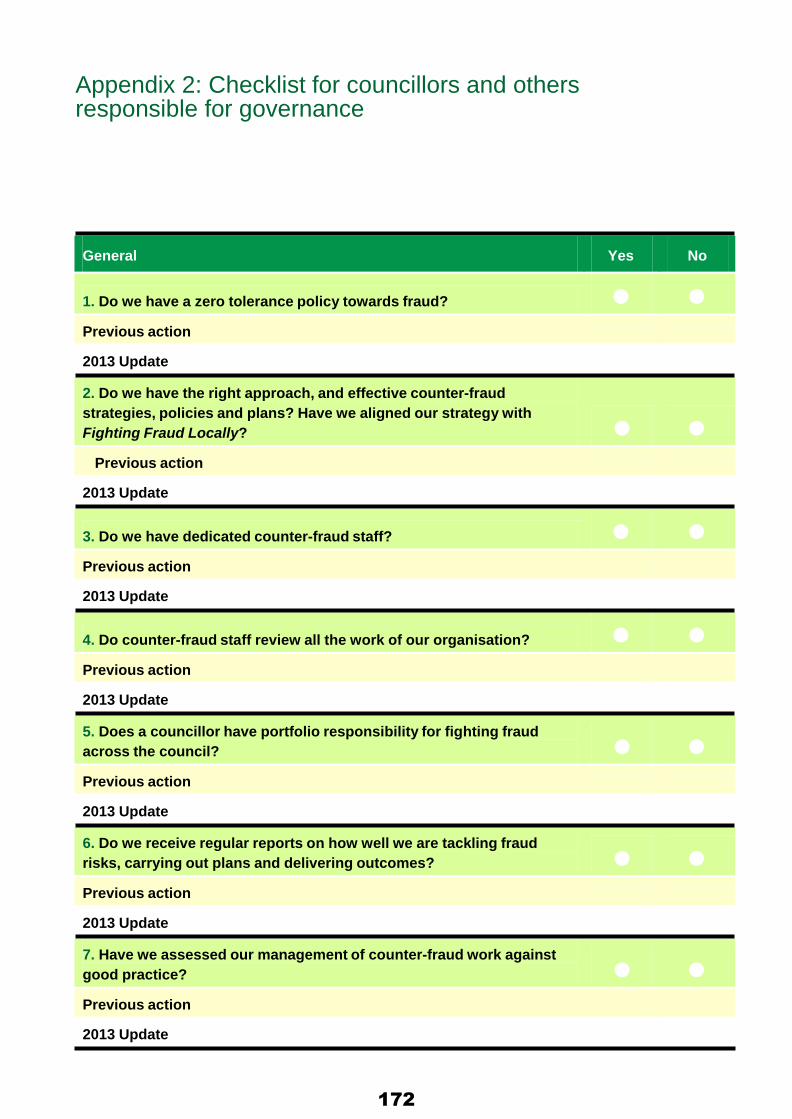
● ●
● ●
● ●
● ●
Appendix 2: Checklist for councillors and others responsible for governance
General Yes No
1. Do we have a zero tolerance policy towards fraud? ● ●
Previous action
2013 Update
2. Do we have the right approach, and effective counter-fraud strategies, policies and plans? Have we aligned our strategy with Fighting Fraud Locally?
Previous action
2013 Update
3. Do we have dedicated counter-fraud staff? ● ●
Previous action
2013 Update
4. Do counter-fraud staff review all the work of our organisation? ● ●
Previous action
2013 Update
5. Does a councillor have portfolio responsibility for fighting fraud across the council?
Previous action
2013 Update
6. Do we receive regular reports on how well we are tackling fraud risks, carrying out plans and delivering outcomes?
Previous action
2013 Update
7. Have we assessed our management of counter-fraud work against good practice?
Previous action
2013 Update
172

● ●
● ●
● ●
● ●
● ●
General Yes No
8. Do we raise awareness of fraud risks with:
■ new staff (including agency staff); ● ● ■ existing staff; ● ● ■ elected members; and ● ● ■ our contractors? ● ●
Previous action
2013 Update
9. Do we work well with national, regional and local networks and partnerships to ensure we know about current fraud risks and issues?
Previous action
2013 Update
10. Do we work well with other organisations to ensure we effectively share knowledge and data about fraud and fraudsters?
Previous action
2013 Update
11. Do we identify areas where our internal controls may not be performing as well as intended? How quickly do we then take action?
Previous action
2013 Update
12. Do we maximise the benefit of our participation in the Audit Commission National Fraud Initiative and receive reports on our outcomes?
Previous action
2013 Update
13. Do we have arrangements in place that encourage our staff to raise their concerns about money laundering?
Previous action
2013 Update
173
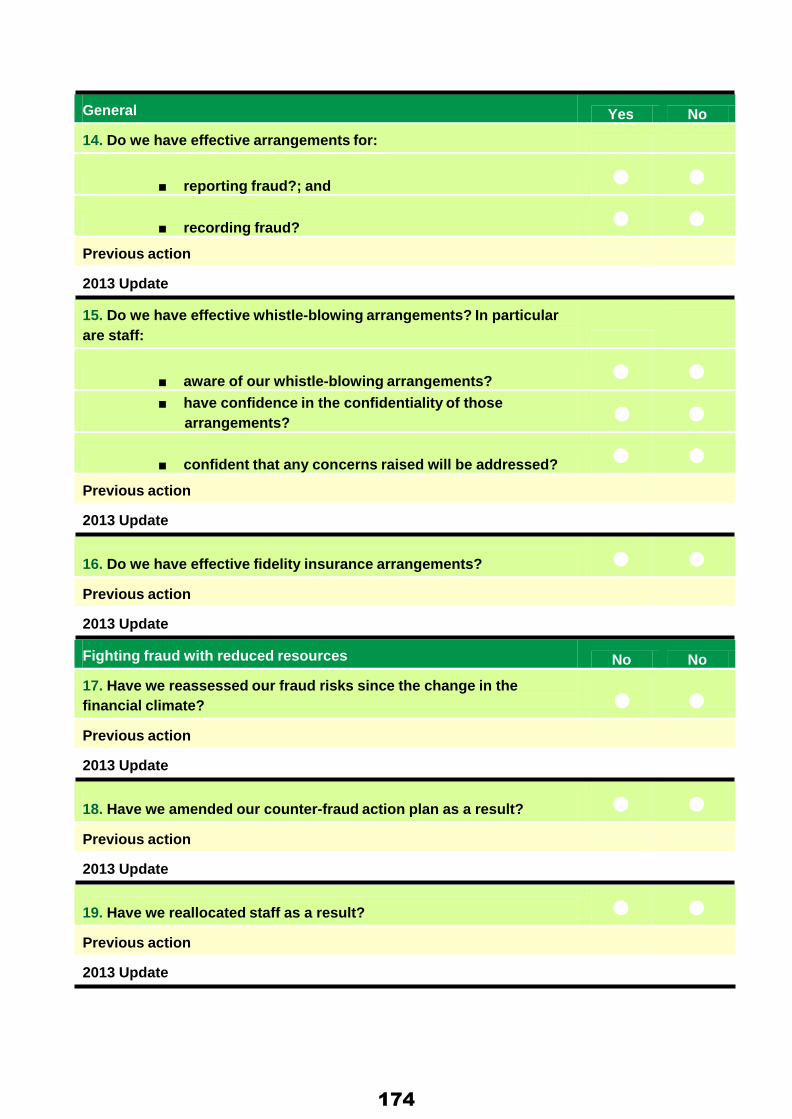
● ●
● ●
General Yes No
14. Do we have effective arrangements for:
■ reporting fraud?; and ● ● ■ recording fraud? ● ●
Previous action
2013 Update
15. Do we have effective whistle-blowing arrangements? In particular are staff:
■ aware of our whistle-blowing arrangements? ● ● ■ have confidence in the confidentiality of those
arrangements?
■ confident that any concerns raised will be addressed? ● ●
Previous action
2013 Update
16. Do we have effective fidelity insurance arrangements? ● ●
Previous action
2013 Update
Fighting fraud with reduced resources No No
17. Have we reassessed our fraud risks since the change in the financial climate?
Previous action
2013 Update
18. Have we amended our counter-fraud action plan as a result? ● ●
Previous action
2013 Update
19. Have we reallocated staff as a result? ● ●
Previous action
2013 Update
174
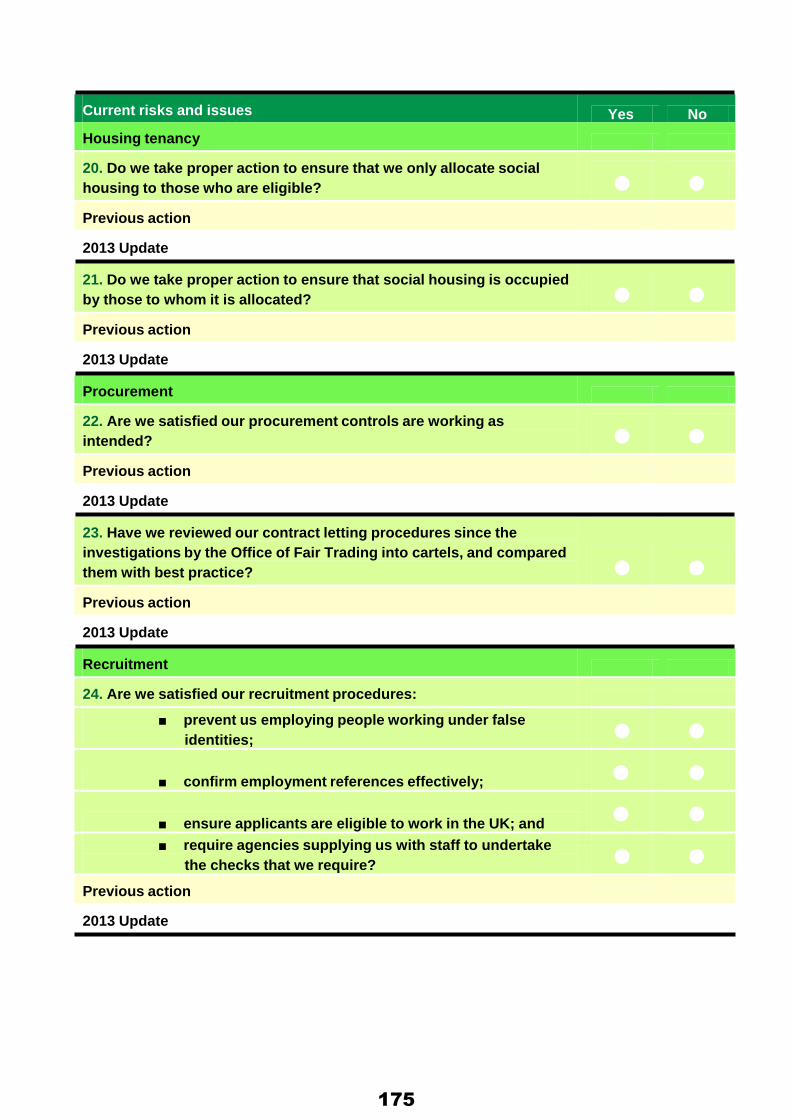
● ●
● ●
● ●
● ●
● ●
● ●
Current risks and issues Yes No
Housing tenancy
20. Do we take proper action to ensure that we only allocate social housing to those who are eligible?
Previous action
2013 Update
21. Do we take proper action to ensure that social housing is occupied by those to whom it is allocated?
Previous action
2013 Update
Procurement
22. Are we satisfied our procurement controls are working as intended?
Previous action
2013 Update
23. Have we reviewed our contract letting procedures since the investigations by the Office of Fair Trading into cartels, and compared them with best practice?
Previous action
2013 Update
Recruitment
24. Are we satisfied our recruitment procedures:
■ prevent us employing people working under false identities;
■ confirm employment references effectively; ● ● ■ ensure applicants are eligible to work in the UK; and ● ● ■ require agencies supplying us with staff to undertake
the checks that we require?
Previous action
2013 Update
175
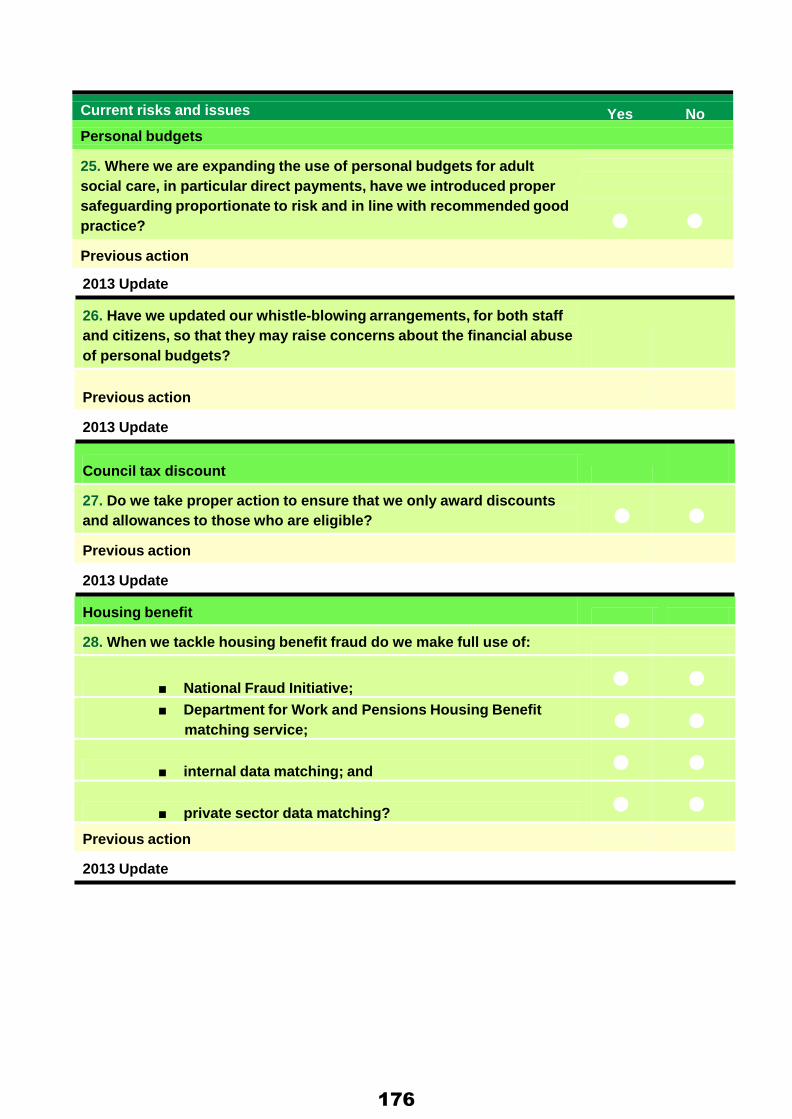
● ●
● ●
Current risks and issues Yes No
Personal budgets
25. Where we are expanding the use of personal budgets for adult social care, in particular direct payments, have we introduced proper safeguarding proportionate to risk and in line with recommended good practice?
● ●
Previous action
2013 Update
26. Have we updated our whistle-blowing arrangements, for both staff and citizens, so that they may raise concerns about the financial abuse of personal budgets?
Previous action
2013 Update
Council tax discount
27. Do we take proper action to ensure that we only award discounts and allowances to those who are eligible?
Previous action
2013 Update
Housing benefit
28. When we tackle housing benefit fraud do we make full use of:
■ National Fraud Initiative; ● ● ■ Department for Work and Pensions Housing Benefit
matching service;
■ internal data matching; and ● ● ■ private sector data matching? ● ●
Previous action
2013 Update
176
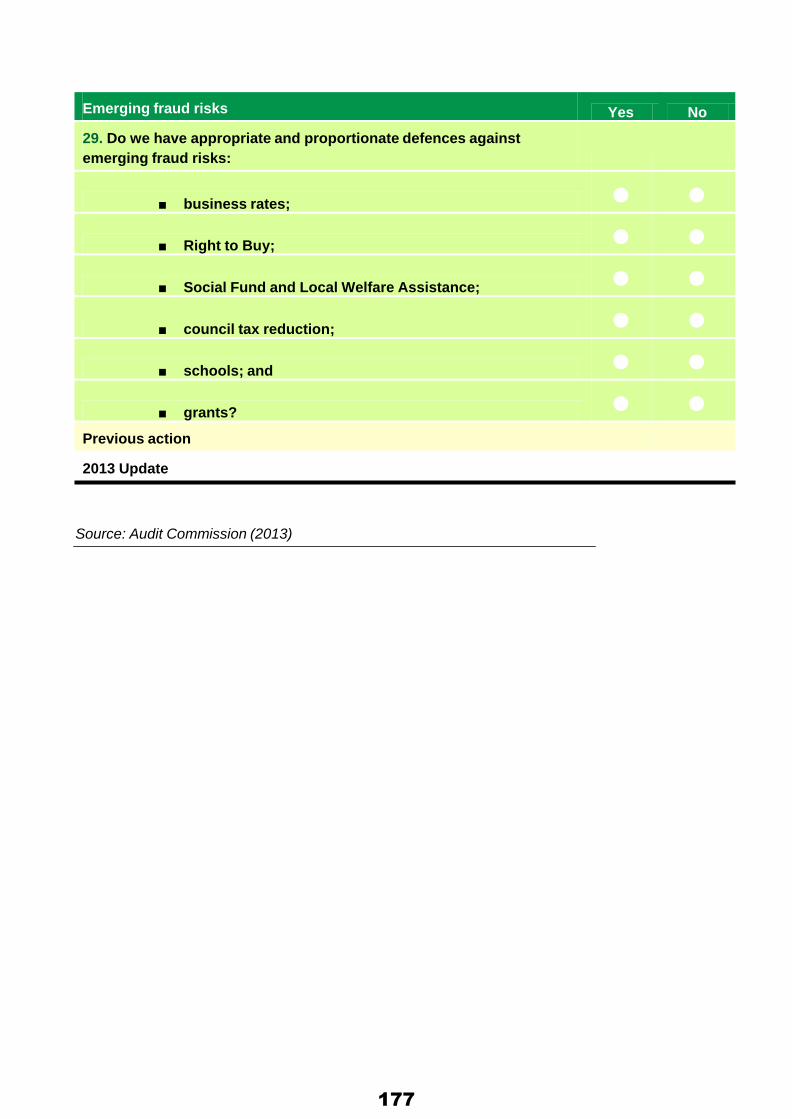
Emerging fraud risks Yes No
29. Do we have appropriate and proportionate defences against emerging fraud risks:
■ business rates; ● ● ■ Right to Buy; ● ● ■ Social Fund and Local Welfare Assistance; ● ● ■ council tax reduction; ● ● ■ schools; and ● ● ■ grants? ● ●
Previous action
2013 Update
Source: Audit Commission (2013)
177
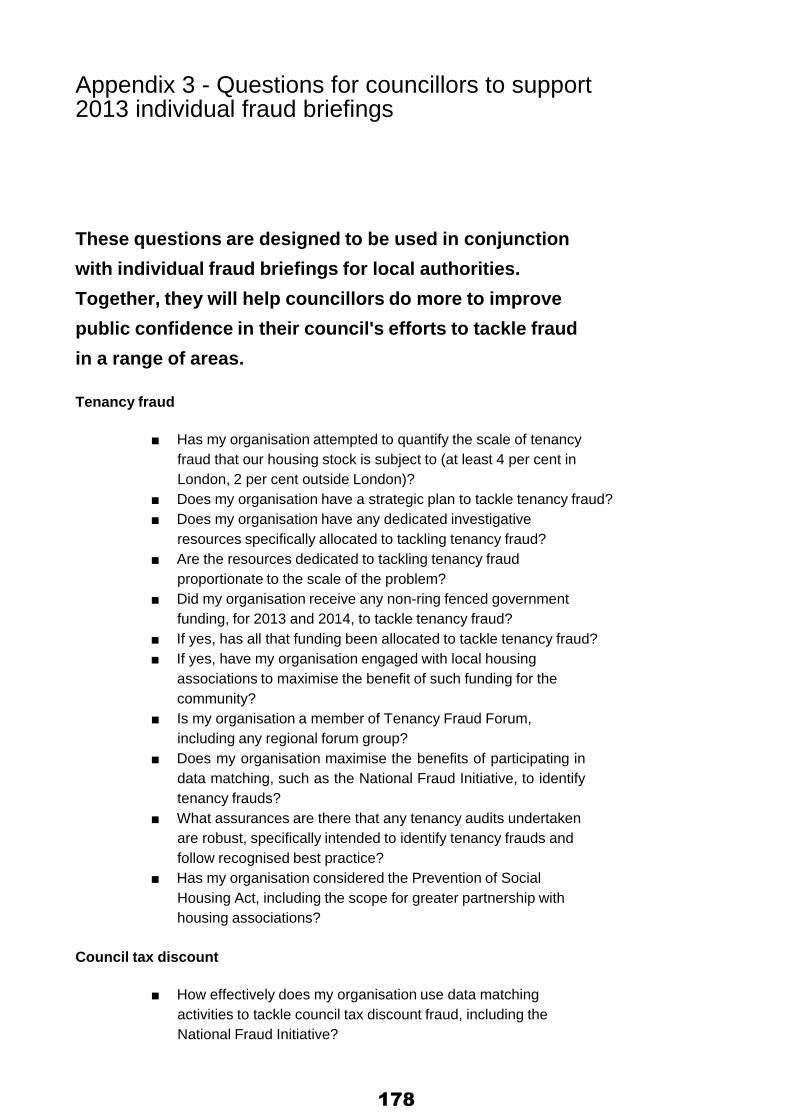
Appendix 3 - Questions for councillors to support 2013 individual fraud briefings
These questions are designed to be used in conjunction with individual fraud briefings for local authorities. Together, they will help councillors do more to improve public confidence in their council's efforts to tackle fraud in a range of areas.
Tenancy fraud
■ Has my organisation attempted to quantify the scale of tenancy
fraud that our housing stock is subject to (at least 4 per cent in London, 2 per cent outside London)?
■ Does my organisation have a strategic plan to tackle tenancy fraud? ■ Does my organisation have any dedicated investigative
resources specifically allocated to tackling tenancy fraud? ■ Are the resources dedicated to tackling tenancy fraud
proportionate to the scale of the problem? ■ Did my organisation receive any non-ring fenced government
funding, for 2013 and 2014, to tackle tenancy fraud? ■ If yes, has all that funding been allocated to tackle tenancy fraud? ■ If yes, have my organisation engaged with local housing
associations to maximise the benefit of such funding for the community?
■ Is my organisation a member of Tenancy Fraud Forum, including any regional forum group?
■ Does my organisation maximise the benefits of participating in data matching, such as the National Fraud Initiative, to identify tenancy frauds?
■ What assurances are there that any tenancy audits undertaken are robust, specifically intended to identify tenancy frauds and follow recognised best practice?
■ Has my organisation considered the Prevention of Social Housing Act, including the scope for greater partnership with housing associations?
Council tax discount
■ How effectively does my organisation use data matching
activities to tackle council tax discount fraud, including the National Fraud Initiative?
178

■ How well does my organisation use all forms of sanction and punishment, including penalties, criminal action and targeting previous years’ fraudulently obtained discounts?
■ Is my organisations policy on applying sanctions to deter council tax discount fraud effective?
Right to Buy
■ Does my organisation review all applications for Right to Buy discounts?
Housing benefit fraud
■ Has my organisation considered the impact of Single Fraud Investigation Service (SFIS) implementation from April 2014, on capacity to investigate non-benefit fraud?
■ Has my organisation considered how best to work with SFIS to ensure local priorities and risks continue to be reflected in local activities to tackle benefit fraud?
Council tax reduction
■ Does my council have a strategy to tackle Council tax reduction fraud?
■ How well does this strategy combine proactive and reactive approaches to tackling fraud?
Social care
■ How effective is my council’s fraud awareness training for all staff working in social care (including those working for contracted providers), to identify suspected social care fraud?
■ How good are my council’s whistle-blowing arrangements for all staff working in social care?
Business rates fraud
■ How effective is my council in maximising its income by tackling business rates fraud?
Blue badge fraud (disability parking concessions)
■ How effectively does my council take action to tackle abuse of blue badge and other parking concessions?
Preventing other frauds
■ How confident am I that staff in my council are aware of the risks of other high value, low frequency frauds and routinely apply all necessary controls to ensure that they do not occur?
Deterrence
■ How effectively does my council detect fraud? ■ How appropriate are the punishments we apply for fraud? ■ How well does my council publicise its success in detecting
fraud?
179

References 1 National Fraud Authority, Annual Fraud Indicator, June 2013, NFA
2 HM Treasury, Spending Review 2010, HM Treasury, 2010
3 HM Treasury, Spending Round 2013, HM Treasury, 2013
4 Local Authority Investigating Officers Group, Research Paper 2: The Reducing Counter-Fraud Capability in Local Government, LAIOG, 2013
5 Audit Commission, Protecting the public purse, 2012, Audit Commission
6 HM Government, Prevention of Social Housing Fraud Act, HM Government, 2013
7 Bryce. A, The nature and extent of social housing fraud, University of Portsmouth, 2012
8 Department for Communities and Local Government, Statistical Release: collection rates and receipts of council tax and non-domestic rates in England 2012-13, DCLG, 2013
9 Audit Commission, Protecting the public purse 2011, Audit Commission, 2011
10 DCLG Statistical Release, National Non-Domestic Rates Collected by Local Authorities in England 2012-12, DCLG, 14 August 2013
11 Charity Commission, Protecting charities from harm: compliance toolkit, Charity Commission, 2013
12 NHS Information Centre, Self Directed Support: Recording on the Referrals, Assessments and Packages of Care (RAP) collection – guidance and frequently asked questions, NHS Information Centre, 2009
13 London Public Sector Counter Fraud Partnership, Invoice and Mandate Fraud Control Measures, LPSCFP, 2013
14 National Fraud Authority, Fighting Fraud Locally: 2012 Review, National Fraud Authority, 2012
15 British Standards Institute, PAS1998/2008 Whistleblowing Arrangements Code of Practice, British Standards Institute, 2008
16 Public Concern at Work and the University of Greenwich, Whistleblowing: The Inside Story, Public Concern at Work, 2013
17 Fraud Advisory Panel, Securing senior management support for investment in anti-fraud measures, FAP, 2013.
18 Metropolitan Police Fraud Alert website:
http://content.met.police.uk/Site/fraudalert
180

We welcome your feedback.
If you have any comments on this report, are intending to implement any of the recommendations, or are planning to follow up any of the case studies, please email: [email protected]
181

Audit Commission 3rd Floor, Fry Building F Telephone: 0303 444 8300 www.audit-commission.gov.uk
182