protecting the confidentiality of tables by adding noise to the underlying microdata
DESCRIPTION
Protecting the Confidentiality of Tables by Adding Noise to the Underlying Microdata. Paul Massell and Jeremy Funk Statistical Research Division U.S. Census Bureau Washington, DC 20233 [email protected]. Talk Outline. Overview of EZS Noise - PowerPoint PPT PresentationTRANSCRIPT

Protecting the Confidentiality of Tables by Adding Noise to the Underlying
Microdata
Paul Massell and Jeremy Funk
Statistical Research Division
U.S. Census Bureau
Washington, DC 20233
2
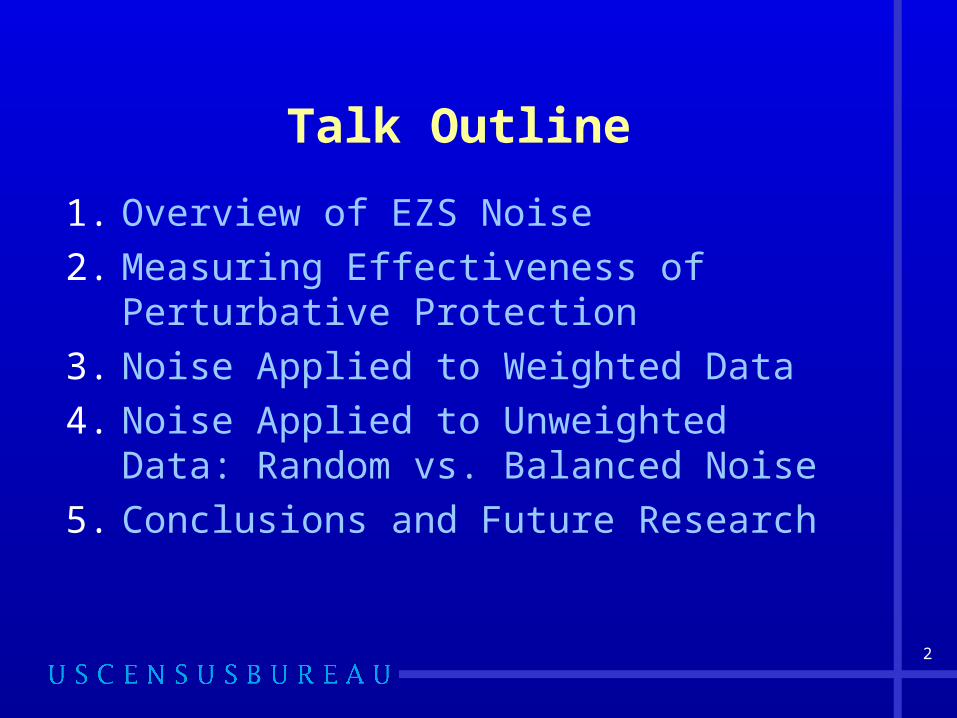
Talk Outline
1. Overview of EZS Noise
2. Measuring Effectiveness of Perturbative Protection
3. Noise Applied to Weighted Data
4. Noise Applied to Unweighted Data: Random vs. Balanced Noise
5. Conclusions and Future Research

3
The EZS Noise Method (Evans, Zayatz, Slanta)
Developed by Tim Evans, Laura Zayatz, and John Slanta in the 1990’s
Multiplicative noise is added to the underlying microdata, before table creation
A noise factor or multiplier is randomly generated for each record

4
The distribution of the multipliers should produce unbiased estimates, and ensure that no multipliers are too close to 1
Weights both known and unknown to users are combined with the noise factors to obtain ‘noisy’ values for all records
When tabulated, in general, sensitive cells are changed quite a bit and non-sensitive cells are changed only by a small amount
The EZS Noise Method (Evans, Zayatz, Slanta)

5
Tables with noisy data are created in the same way as the original tables:
simply: replace var X with var X-noisy
Tables are automatically additive
An approximate value could be released for every cell
(depends on agency policy)
No Complementary Suppressions
Attractive Features of EZS

6
Linked tables and special tabs are automatically protected consistently
EZS allows for protection at the company level (Census requirement)
Ease of implementation compared to methods such as cell suppression
Attractive Features of EZS

7
Measuring Effectiveness of the EZS Method
Step 1: Determine which cells in a table are sensitive – e.g., using p% Sensitivity Rule
Step 2: Measure level of protection to sensitive cells (using protection multipliers)
Step 3: Measure amount of perturbation to non-sensitive cells (via % change graph)

8
The p% Sensitivity RuleUnweighted Data:
Let T = cell total ; x1, x2 top 2 contributionsLet ‘rem’ denote remainderSet rem = T – (x1 + x2)Let ‘prot’ denote suggested protectionSet prot = (p/100) * x1 – rem
if prot > 0, when Contributor 2 tries to estimate x1, rem does NOT provide enough uncertainty ; additional protection is needed; noise may provide this uncertainty

9
p% Sensitivity Rule
Weighted Data:
TA = Fully Weighted Cell Estimate
X1 = Largest Cell Respondent Contribution
X2 = 2nd Largest Cell Contribution
wkn = Known Weights
wun = Unknown Weights
10
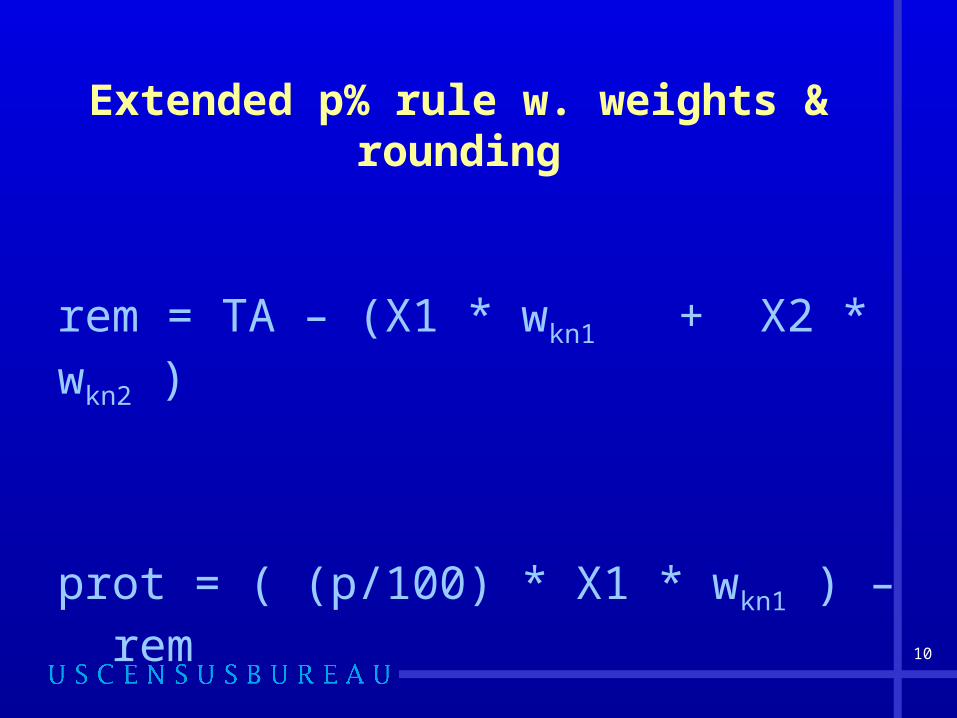
Extended p% rule w. weights & rounding
rem = TA – (X1 * wkn1 + X2 * wkn2 )
prot = ( (p/100) * X1 * wkn1 ) – rem

11
Measuring the Effectiveness of a Perturbative Protection Method
Protection of Sensitive Cells :Define Protection Multiplier (PM)
PM = abs (perturbation) / prot Find how many (or %) have PM < 1
Data Quality: Important: % change for non-sensitive cells Less important: % over-pertubation for
sensitive cells

12
EZS Noise Factors for Unweighted Data
Let X = original microdata valueLet Y = perturbed valueLet M = noise multiplier; i.e. a draw from a
specified noise distribution of EZS type
Y = X * M

13
Noise Distribution used for all examples:(a=1.05, b=1.15) 5% to 15% noise

14
Noise Applied to Weighted Data
Key idea: weights (e.g., sample weights)
provide protection to microdata since users typically “know” weights only roughly (except when close to 1)
Not necessary to apply full M factor to X unless w = 1
15
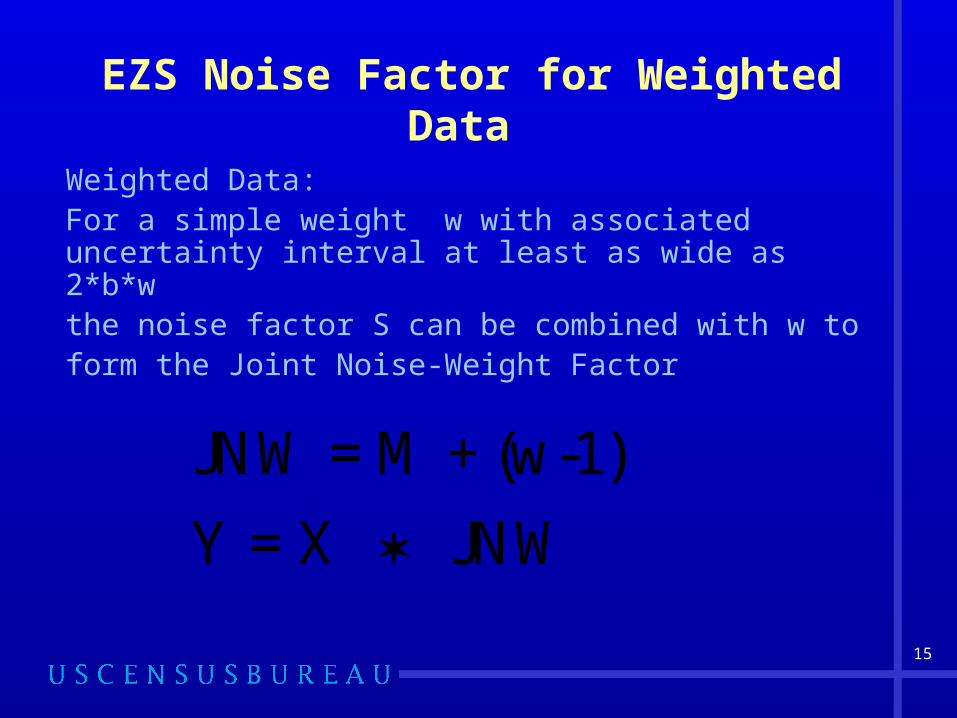
EZS Noise Factor for Weighted Data
Weighted Data:For a simple weight w with associated uncertainty interval at least as wide as 2*b*wthe noise factor S can be combined with w to form the Joint Noise-Weight Factor
JNW = M + (w-1)
Y = X JNW

16
Noise Formula for Known and Unknown Weights
Calculation of Perturbed Values:
wkn is the known weight
wun is the unknown weight.
kn unY X w M w 1
17
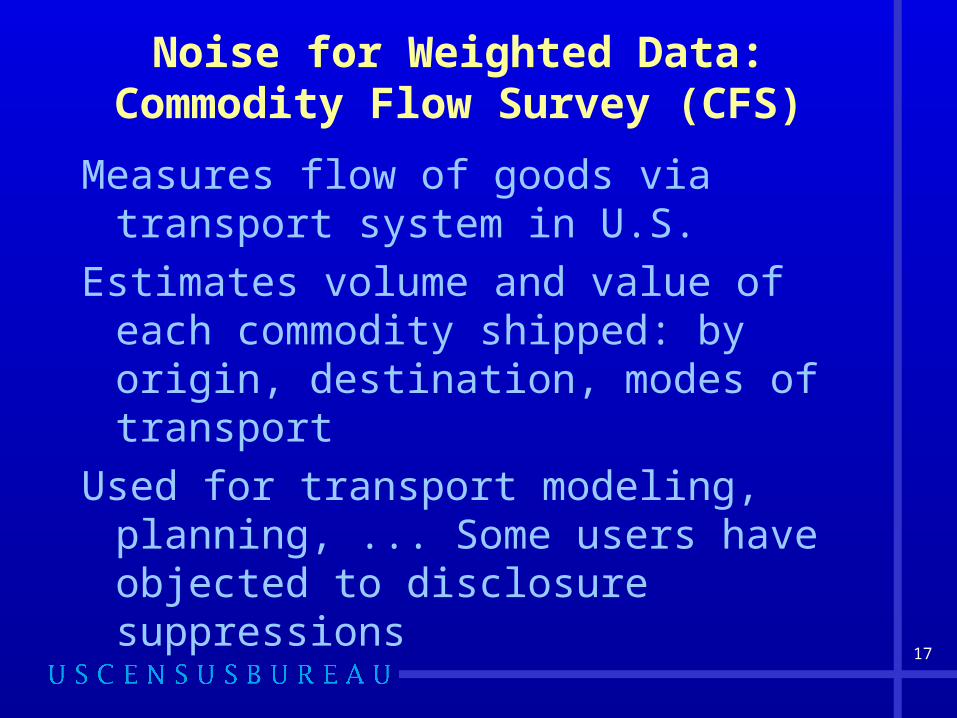
Noise for Weighted Data:Commodity Flow Survey (CFS)
Measures flow of goods via transport system in U.S.
Estimates volume and value of each commodity shipped: by origin, destination, modes of transport
Used for transport modeling, planning, ... Some users have objected to disclosure suppressions

18
Effect of Noise on High Level Aggregate Cells
CFS Table: National 2-DigitCommodity
Data Quality Measure:43 cells; 0 are sensitive
41 cells change by [0 - 1] %
2 cells change by [1 - 2] %

19
CFS Test Table
(Origin State by Destination State by 2 digit Commodity)
61,174 cells of which 230 are sensitive
Data Quality and Protection Assessments
(following slides)

20
CFS Noise ResultsData Quality Assessment
While some cells may receive large doses of noise, vast majority get less than 1% or 2%
NON-SENSITIVE CELLS
01020304050607080
[0-1
]
(1-2
]
(2-3
]
(3-4
]
(4-5
]
(5-6
]
(6-7
]
(7-8
]
(8-9
]
(9-1
0]
(10
-11
]
(11
-12
]
(12
-13
]
(13
-14
]
(14
-15
]
Percent Change Interval
Pe
rce
nt
of
Ce
lls

21
CFS Random NoiseProtection Assessment
Most sensitive cells receive significant noise, i.e. 5% to 11%
Only 2 out of 230 sensitive cells do not receive full protection from noise, as measured by Protection Multipliers (PM)
SENSITIVE CELLS
0
10
20
30[0
-1]
(1-2
]
(2-3
]
(3-4
]
(4-5
]
(5-6
]
(6-7
]
(7-8
]
(8-9
]
(9-1
0]
(10
-11
]
(11
-12
]
(12
-13
]
(13
-14
]
(14
-15
]
Percent Change Interval
Pe
rce
nt
of
Ce
lls

22
Noise for Unweighted DataNon-Employers Statistics
Special Features of Microdata Unweighted adminstrative data Only 1 variable to protect: receipts Many small integers (after rounding to $1000)
Special Features of Key Table Many cells have a small number of
contributors; these include many safe cells Many sensitive cells with only 1 or 2
contributors

23
NE Noise ResultsData Quality Assessment
Lack of weights results in much more distortion to non-sensitive cells than occurs for CFS
NON-SENSITIVE CELLS
0
10
20
30[0
-1]
(1-2
]
(2-3
]
(3-4
]
(4-5
]
(5-6
]
(6-7
]
(7-8
]
(8-9
]
(9-1
0]
(10-
11]
(11-
12]
(12-
13]
(13-
14]
(14-
15]
Percent Change Interval
Per
cen
t o
f C
ells

24
NE Noise ResultsProtection Assessment
Resembles noise factor distribution, due to prevalence of 1 respondent cells in NE test table and no weights
SENSITIVE CELLS
0
10
20
[0-1
]
(1-2
]
(2-3
]
(3-4
]
(4-5
]
(5-6
]
(6-7
]
(7-8
]
(8-9
]
(9-1
0]
(10-
11]
(11-
12]
(12-
13]
(13-
14]
(14-
15]
Percent Change Interval
Per
cen
t o
f C
ells

25
Noise Balancing
Is there a way to improve data quality in this situation?
Yes, if one can focus on one key table T
Idea: balance noise at each cell in ‘balancing sub-table B of T ’ (defn: every micro value is in at most one cell of B)
Choose noise directions to maximize noise cancellation for each cell of B

26
Noise BalancingSupportive NE Characteristics
Balancing works especially well for NE because a high % of microdata is single unit
After balancing interior cells, need to check noise effect on aggregate cells in same table
Also need to check noise effect in higher and lower tables; these we call “trickle up” and “trickle down” effects
For NE, there are few of these other tables;this makes balancing decision easier
27
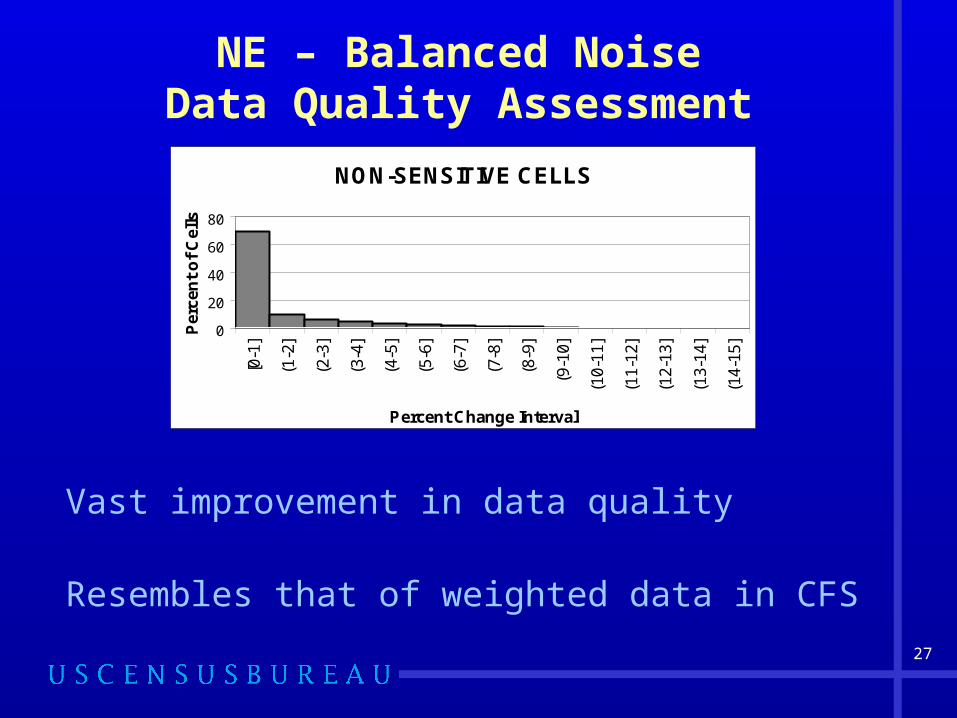
NE – Balanced NoiseData Quality Assessment
Vast improvement in data quality
Resembles that of weighted data in CFS
NON-SENSITIVE CELLS
0
20
40
60
80
[0-1
]
(1-2
]
(2-3
]
(3-4
]
(4-5
]
(5-6
]
(6-7
]
(7-8
]
(8-9
]
(9-1
0]
(10-
11]
(11-
12]
(12-
13]
(13-
14]
(14-
15]
Percent Change Interval
Per
cen
t o
f C
ells

28
NE – Balanced NoiseProtection Assessment
Very similar to Random Noise application
91.7% of sensitive cells fully protected
SENSITIVE CELLS
0
10
20
[0-1
]
(1-2
]
(2-3
]
(3-4
]
(4-5
]
(5-6
]
(6-7
]
(7-8
]
(8-9
]
(9-1
0]
(10-
11]
(11-
12]
(12-
13]
(13-
14]
(14-
15]
Percent Change Interval
Per
cen
t o
f C
ells
29
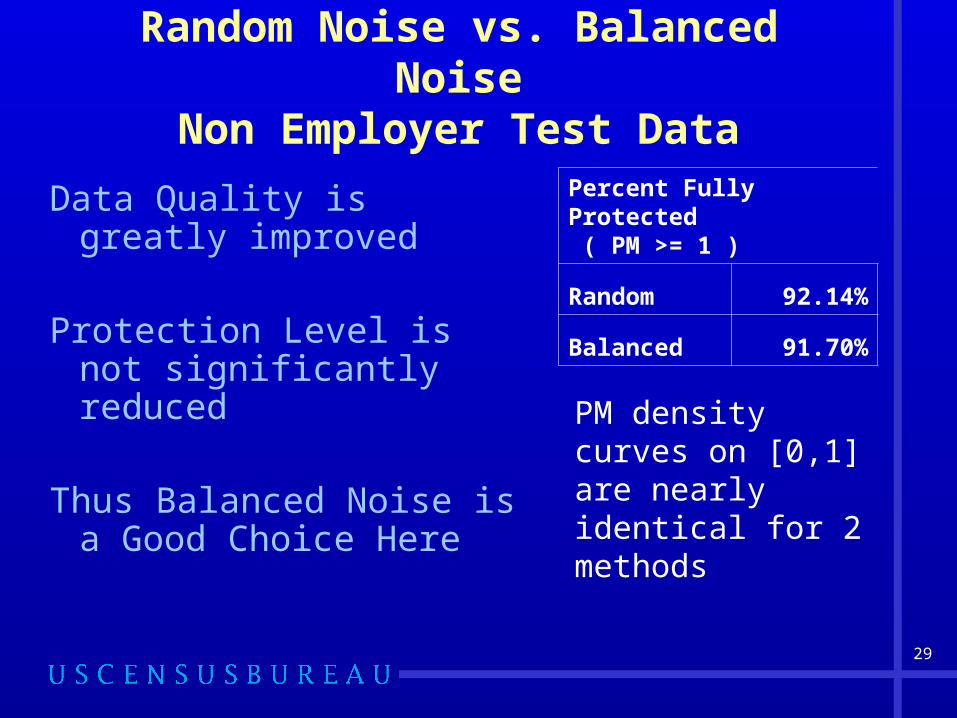
Random Noise vs. Balanced NoiseNon Employer Test Data
Data Quality is greatly improved
Protection Level is not significantly reduced
Thus Balanced Noise is a Good Choice Here
Percent Fully Protected ( PM >= 1 )
Random 92.14%
Balanced 91.70%
PM density curves on [0,1] are nearly identical for 2 methods

30
Conclusions
Conclusions:
1. EZS Noise is a useful method for protecting tables from a variety of economic programs
2. There are now several variations of the basic EZS method ; which is best for a survey depends on both microdata and table characteristics
31
Future Research1. Should some sensitive cells be
suppressed; high noise cells flagged ?2. How to handle multiple variables ?3. What is the most that users can be
told about noise process without compromising data protection ?
4. How to handle company dynamics (births, deaths, mergers, ….) ?
5. How to coordinate survey protection ?

32