protected urban planet: monitoring the evolution of ... · protected urban planet: monitoring the...
TRANSCRIPT
Protected Urban Planet: Monitoring the Evolution of
Protected Urban Areas Worldwide
Richard Verbruggen*, Ana Pereira Roders**, Natalia Stash**,
Derick Leony***, Paul de Bra**
Van Nut, Roermond, The Netherlands
** [email protected] , [email protected] , [email protected]
Eindhoven University of Technology, The Netherlands
University Carlos III of Madrid, Spain
Abstract
This paper aims to introduce Protected Urban Planet (PUP)1, the first tool developed for
visualizing, mapping and contributing to information exchange on the evolution of protected
urban areas worldwide. Besides locating them, Protected Urban Planet provides communities
with means to disseminate and raise awareness for their cultural significance, while
monitoring their threats and causes and sharing assessment methods and tools. Protected
Urban Planet brings together spatial data, descriptive information and images from various
sources, which together are today unrealistic for communities to reach.
1. Introduction
The number of documents and their scattered archives, but also the diversity in focus,
approach and methodologies in heritage studies has been disabling the assembly of results
from varied research projects and subsequent spatio-temporal analysis and extrapolation of
trends on World Heritage management. Cultural and natural heritage properties2 (e.g. Bolgar
Historical and Archaeological Complex, Russian Federation and the Stevns, Denmark) are
often analyzed separately3, except on mixed properties (e.g. Trang An Landscape complex,
Vietnam)4.
1 http://protectedurbanplanet.net2 Property is an official boundary to what World Heritage is. 3 UNESCO (2012) World Heritage Capacity Building Programme. Paris: UNESCO.4 Larsen (2012) , P.B. (2012) Advisory body evaluations of World Heritage nominations in relation to
community and rights concerns, an independent assessment, Gland: International Union for Conservation of Nature (IUCN).

The approaches in heritage studies are often either critical or technical. Critical heritage
studies primarily focus on the uses of heritage5. Instead, technical heritage studies focus on
heritage conservation6. Particularly, in cultural heritage, the methodologies employed are
either illustrative global interpretations7 or detailed case studies8. The application of
automated analysis is already being explored for heritage documents e.g. maps9 and letters10.
It is still under-explored for documentation referring to heritage properties, in support of their
management.
There is a growing number of tools targeting the support of heritage management practices.
Though, they still fail in bridging culture and nature sectors, and supporting spatio-temporal
analysis and extrapolation of trends, through the integration of Geographic Information
Systems (GIS)11, data mining12, personalization and semantic data enrichment13. Most of these
technologies have already been applied, but seldom on heritage management, crossing
heritage categories or in combination14.
Some remain skeptical about the use of generic tools for heritage management, especially in
developing countries15. Though, the growth of internet access16 and mobile-broadband
subscriptions are a worldwide trend17. GIS has proven beneficial to heritage management and
5 Harvey, D.C. (2001) Heritage Pasts and Heritage Presents: temporality, meaning and the scope of heritage studies, International Journal of Heritage Studies 7(4), pp. 319-338.
6 Riveiro, B. , Arias, P. , Armesto, J. and Ordóñez, C. (2011) A Methodology for the Inventory of Historical Infrastructures: Documentation, Current State, and Influencing Factors, International Journal of Architectural Heritage: Conservation, Analysis, and Restoration, 5(6), pp. 629-646.
7 Pendlebury, J., Short., M. and While, A. (2009) Urban World Heritage Sites and the problem of authenticity. Cities 26, pp. 349-358.
8 Sheng, N. and Tang, U.W. (2013) Risk assessment of traffic-related air pollution in a world heritage city, International Journal of Environmental Science and Technology 10(1), pp. 11-18.
9 Simeone, M., Guiliano, J., Kooper, R. and Bajcsy, P. (2011) Digging into data using new collaborative infrastructures supporting humanities–based computer science research, First Monday, 16(5), May 2.
10 Cohen, P. (2010) Digital Keys for Unlocking the Humanities’ Riches, New York Times, Nov. 16.11 Vileikis, O., Cesaro, G., Santana Quintero, M., Balen, K. van, Paolini, A. and Vafadari, A. (2012)
Documentation in World Heritage conservation - towards managing and mitigating change: The case studies of Petra and the Silk Roads, Journal of Cultural Heritage Management and Sustainable Development 2(2), pp. 130 – 152.
12 Pechenizkiy, M. and Wojciechowski, M. (2013) New Trends in Databases and Information Systems, Workshop Proceedings of the 16th East European Conference, ADBIS 2012, Pozna, Poland, September 17-21, In ADBIS Workshops. Vol. 185 Springer.
13 Wang, Y., Wang, S., Stash, N., Aroyo, L. and Schreiber, G. (2010) Enhancing content-based recommendation with the task model of classification, In Proc. of International Conference on Knowledge Engineering and Management by the Masses (EKAW), pp. 431-440
14 Rashid, A.N.M.B. and Hossain, M.A. (2012) Challenging Issues of Spatio-Temporal Data Mining, ComputerEngineering and Intelligent Systems 3(4), pp. 55-64.
15 Boccardi, G. (2002) Improving Monitoring for World Heritage Conservation. In World Heritage Papers 10. UNESCO WHC and ICCROM, pp. 39–41.
16 MMG, 2013 MMG (2012) World Internet Usage And Population Statistics, Miniwatts Marketing Group (MMG).
17 ITU (2013) Mobile Broadband Subscriptions, International Telecommunication Union (ITU).
site monitoring18. GIS facilitates data management and analysis, far more efficiently and
effectively than any other data management system19. It also facilitates communication and
knowledge-sharing20.
1.1. Protected Urban Planet (PUP)
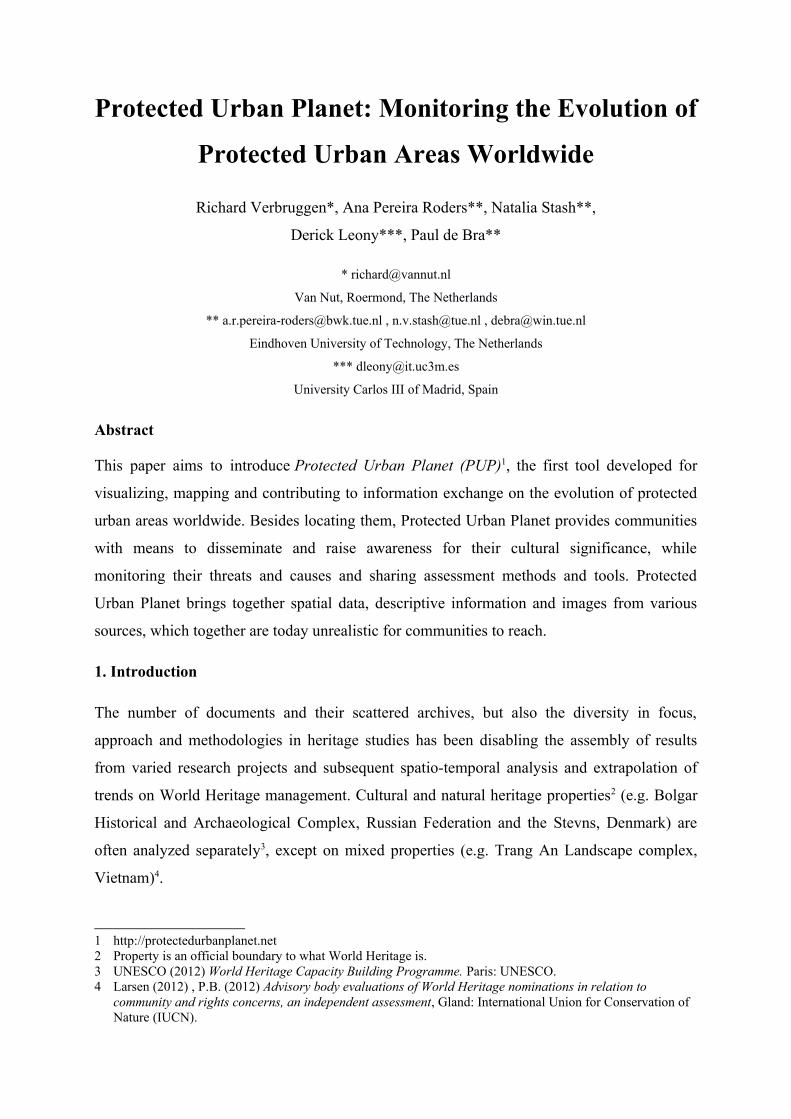
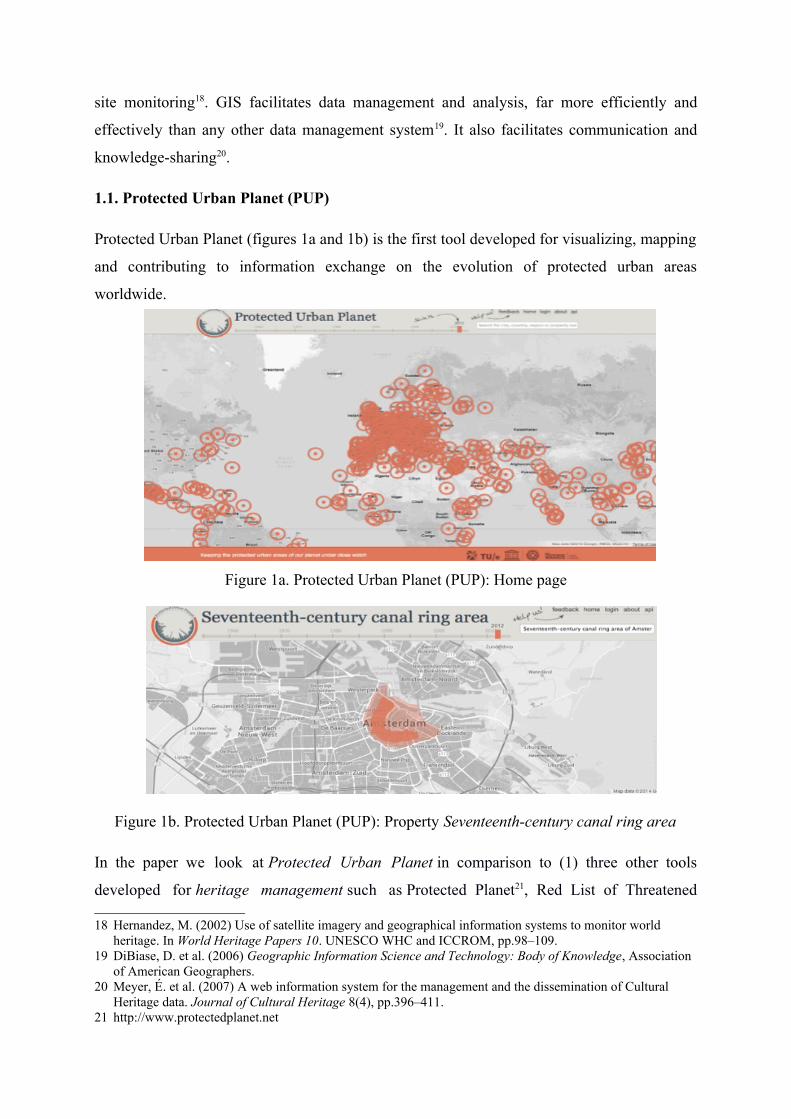
Protected Urban Planet (figures 1a and 1b) is the first tool developed for visualizing, mapping
and contributing to information exchange on the evolution of protected urban areas
worldwide.
Figure 1a. Protected Urban Planet (PUP): Home page
Figure 1b. Protected Urban Planet (PUP): Property Seventeenth-century canal ring area
In the paper we look at Protected Urban Planet in comparison to (1) three other tools
developed for heritage management such as Protected Planet21, Red List of Threatened
18 Hernandez, M. (2002) Use of satellite imagery and geographical information systems to monitor world heritage. In World Heritage Papers 10. UNESCO WHC and ICCROM, pp.98–109.
19 DiBiase, D. et al. (2006) Geographic Information Science and Technology: Body of Knowledge, Association of American Geographers.
20 Meyer, É. et al. (2007) A web information system for the management and the dissemination of Cultural Heritage data. Journal of Cultural Heritage 8(4), pp.396–411.
21 http://www.protectedplanet.net

Species22, Arches23; (2) demonstrators for providing personalized access to cultural/world
heritage information that are based on CHIP project results24; and (3) three tools outside the
heritage management field cartoDB25, CAPA26 and LearnGlass27 that could be used for
extending the features of PUP. We provide a comparative analysis that discusses the
differences and similarities between the tools. The comparison has three focal points: (a) how
data is analyzed and visualized, (b) what is analyzed, and (c) who contributes and benefits
from the tools. The results contribute to setting a research agenda around alike tools, as well
as, their contribution to the raise of reliability on research targeting a comparative analysis on
the evolution of protected urban areas worldwide.
PUP is contributing to a larger research project titled “Outstanding Universal Value, World
Heritage Cities and Sustainability”, initiated in 2009, developed jointly by Eindhoven
University of Technology (TU/e) and UNESCO World Heritage Centre. (Q.c. Who?) Besides
locating protected urban areas, PUP provides communities with means to disseminate and
raise awareness for their attributes28 and values of significance, while monitoring their threats
and causes and sharing assessment methods and tools. (Q.b. What?) It is an online platform to
share and disseminate information about protected urban areas, their cultural values and
attributes, as well as their protection challenges. PUP brings together spatial data, descriptive
information and images from various sources, which together are today unrealistic for
communities to reach. (Q.c. Who?) Sources range from National governments, Non-
government Organizations (NGOs), International conventions and regional Partners, to more
proactive members of these communities. (Q.a. How?) Combining all these heterogeneous
-in size, subject and format- and highly unstructured datasets to one comprehensive portal
provides stakeholders a broader overview of all the processes threatening protected urban
areas. All of which contributes to a better assessment per heritage property and provides a
comparison between properties with similar characteristics, or facing similar threats.
A relational survey between heritage (impact) assessment practices and the sustainable urban
development focused on World Heritage cities. The methodology bridged a more universal
22 http://maps.iucnredlist.org/23 http://archesproject.org/24 http://chip.win.tue.nl. CHIP stands for Cultural Heritage Information Personalization25 http://cartodb.com26 http://www.win.tue.nl/~mpechen/projects/capa/27 Leony, D., Pardo, A., de la Fuente Valentín, L., Sánchez de Castro, D., & Delgado Kloos, C., (2012)
GLASS: a learning analytics visualization tool. In Proceedings of the 2nd International Conference on Learning Analytics and Knowledge, Vancouver, Canada, April, pp. 162-163. ACM.
28 Attribute is the reasons why the property became heritage.

approach, surveying the collective documentation produced while nominating and managing
World Heritage properties, such as the decisions adopted at the Session of the World Heritage
Committee; to a more local approach taking a limited number of World Heritage cities as case
studies. The latter also included a documentation survey, but then, focusing on the existing
documentation set produced for the specific World Heritage property. The Netherlands
Funds-in-Trust nobly facilitated attendance at relevant meetings e.g. Sessions of the World
Heritage Committee and World Congresses of the Organization of World Heritage Cities, so
that contacts could be established with national and local governments for the case studies.
The Flemish Funds-in-Trust supported the fieldwork in Island of Mozambique and the
development of Protected Urban Planet. TU/e has co-financed all fieldwork.
In 4 years’ time, a young and committed research team was built up. More than 1000 urban
areas have been identified to include protected urban areas designated as World Heritage29,30.
(Q.a. How?) The information related to these properties and municipalities has been
assembled in GIS, with a considerable share located. It also includes information on their
affecting factors31,32, until now distinguished in threats (changes) and causes (change agents).
Thirteen World Heritage cities have been taken as case studies, illustrative for 4 out 5
UNESCO regions, except for the Arab States: Willemstad33, Oporto, Evora, Guimarães34,
29 Pereira Roders, A. (2010a) Revealing the World Heritage cities and their varied natures. In Heritage 2010: Heritage and Sustainable Development, Evora, Portugal, June, v.1 pp. 245-253. Barcelos: Green Lines Institute.
30 Pereira Roders, A. (2013) World Heritage cities: revealing the protected urban areas of outstanding universal value. Eindhoven: Eindhoven University of Technology (working document)
31 Pereira Roders, A. (2010b) Revealing the level of tension between cultural heritage and development in World Heritage cities - part 1. In Proceedings of IAPH 2010: 4th International Conference on Cultural Heritage and Development Cooperation, (pp. 343-351). Seville: Fundación de las Tres Culturas.
32 Turner, M., Pereira Roders, A. and Patry, M. (2012) Revealing the level of tension between cultural heritage and development in World Heritage cities. Problems of Sustainable Development - Problemy Ekorozwoju, 7(2):2.
33 Speckens, A., Pereira Roders, A. and Gonzalez-Manuel, C. (2010) Enhancing the Outstanding Universal Value assessment practices of Willemstad. In Heritage 2010, Heritage and Sustainable Development, Evora, Portugal, June, v.1 pp. 271-281. Barcelos: Green Lines Institute.
34 Tarrafa Pereira da Silva, A.M. and Pereira Roders, A. (2010) The cultural significance of World Heritage cities: Portugal as case study. In Heritage 2010, Heritage and Sustainable Development, Evora, Portugal, June, v.1, pp. 255-263. Barcelos: Green Lines Institute.

Salamanca35, Edinburgh36 and Amsterdam37 in Europe and North America; Galle38 and
Macao39 in Asia and the Pacific; Zanzibar40 and Island of Mozambique41 in Africa; and
Valparaiso and Queretaro in Latin America and the Caribbean.
2. Assessment Framework
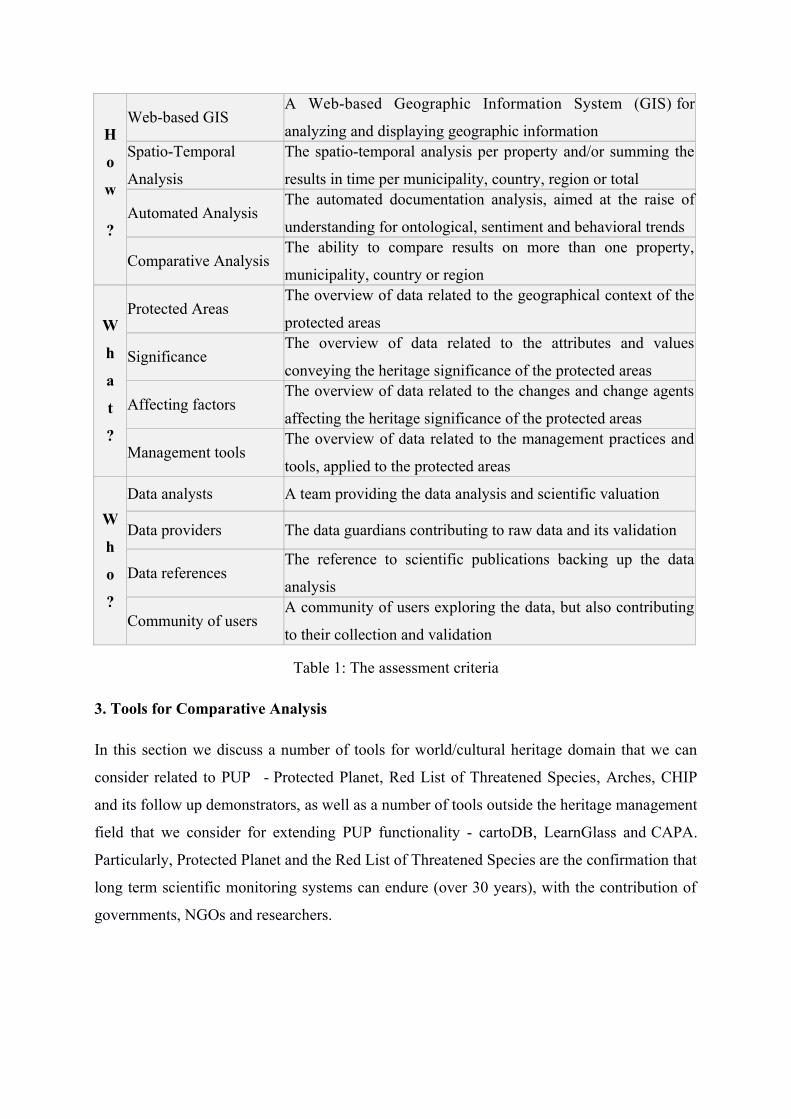
Table 1 lists the assessment criteria, divided in three categories:
(a) how data is analyzed and visualized, (b) what is analyzed, and (c) who contributes and
benefits from the tools. The results contribute to setting a research agenda around alike tools,
as well as, their contribution to the raise of reliability on research targeting a comparative
analysis on the evolution of protected urban areas worldwide. First category, how, includes
four criteria: Web-based GIS, Spatio-Temporal Analysis, Automated Analysis, and
Comparative Analysis. Second category, what, includes four criteria: Protected Areas,
Significance, Affecting factors, and Management tools. Third category, who, includes three
criteria: data analysts, providers and references.
35 Pons, A., Pereira Roders, A. and Turner, M. (2011) The sustainability of management practices in the Old City of Salamanca. Facilities, 29(7/8):5
36 Bennink, R.H.J., Bruin, J.A.C., Veldpaus, L. and Pereira Roders, A. (2013). Knowledge is power : policy analysis of the World Heritage property of Edinburgh. SPANDREL- Journal of SPA: New Dimensions in Research of Environments for Living, 4(7), pp. 27-35.
37 Veldpaus, L., Swart, J.J. & Pereira Roders, A. (2013). Amsterdam as World Heritage city : a sustainable historic urban landscape? Part I. Conference Paper : proceedings of the International Sustainable Development Research Conference (ISDRC19), 1-3 July 2013, Stellenbosch, South Africa, (pp. 974-984). Stellenbosch, South Africa.
38 Boxem, R., Fuhren, R., Pereira Roders, A., Veldpaus, L. and Colenbrander, B.J.F. (2012) Assessing the cultural significance of world heritage cities : the historic centre of Galle as case study. In Proceedings of the Measuring Heritage Conservation Performance, (pp. 75-81). Olinda and Rome: CECI and ICCROM.
39 Tarrafa Pereira da Silva, A.M., Imon, S.S. and Pereira Roders, A. (2009). Tackling tourism-driven development in World Heritage cities: A comparison between Macao, China and Evora, Portugal. In S.S. Imon (Ed.), Proceeding of the Urban Heritage and Tourism: Challenges and Opportunities, pp. 1-10. Institute for Tourism Studies: Macao.
40 Vroomen, Y.G.J., Hoope, L.D. ten, Moor, B., Pereira Roders, A., Veldpaus, L. and Colenbrander, B.J.F. (2012). Assessing the cultural significance of world heritage cities : Zanzibar as case study. In K. Similä & S.M. Zancheti (Eds.), Measuring Heritage Conservation Performance, (pp. 67-74). Olinda and Rome: CECI and ICCROM.
41 Damen, S.G., Derks, R., Metgod, T.L.M., Pereira Roders, A., Veldpaus, L. and Silva, A.T. (2012) Revealing relationships between the state of authenticity/integrity and the factors affecting Island of Mozambique. In HERITAGE 2012: Proceedings of the 3rd International Conference on Heritage and Sustainable Development, v.1 pp. 31-40. Barcelos: Green Lines Institute.
H
o
w
?
Web-based GISA Web-based Geographic Information System (GIS) for
analyzing and displaying geographic informationSpatio-Temporal
Analysis
The spatio-temporal analysis per property and/or summing the
results in time per municipality, country, region or total
Automated AnalysisThe automated documentation analysis, aimed at the raise of
understanding for ontological, sentiment and behavioral trends
Comparative AnalysisThe ability to compare results on more than one property,
municipality, country or region
W
h
a
t
?
Protected AreasThe overview of data related to the geographical context of the
protected areas
SignificanceThe overview of data related to the attributes and values
conveying the heritage significance of the protected areas
Affecting factorsThe overview of data related to the changes and change agents
affecting the heritage significance of the protected areas
Management toolsThe overview of data related to the management practices and
tools, applied to the protected areas
W
h
o
?
Data analysts A team providing the data analysis and scientific valuation
Data providers The data guardians contributing to raw data and its validation
Data referencesThe reference to scientific publications backing up the data
analysis
Community of usersA community of users exploring the data, but also contributing
to their collection and validation
Table 1: The assessment criteria
3. Tools for Comparative Analysis
In this section we discuss a number of tools for world/cultural heritage domain that we can
consider related to PUP - Protected Planet, Red List of Threatened Species, Arches, CHIP
and its follow up demonstrators, as well as a number of tools outside the heritage management
field that we consider for extending PUP functionality - cartoDB, LearnGlass and CAPA.
Particularly, Protected Planet and the Red List of Threatened Species are the confirmation that
long term scientific monitoring systems can endure (over 30 years), with the contribution of
governments, NGOs and researchers.

3.1. Protected Planet (PP)
(Q.a. How? Q.b. What?) The Protected Planet (figures 2a and 2b) is the new face of the
World Database on Protected Areas (WDPA), a joint initiative between IUCN42 (Union for
Conservation of Nature) and UNEP-WCMC43 (United Nations Environment Programme
World Conservation Monitoring Centre).
Figure 2a. Protected Planet (PP): Home page
Figure 2b. Protected Planet (PP): Property Amazônia National Park
Its humble beginnings started 30 years ago as a basic global list of national parks and has
evolved into the only global, spatially referenced information source on parks and protected
areas. (Q.c. Who?) Protected Planet was not only created to showcase this wealth of
information but also gives tools to willing ‘citizen scientists’ who can feed their knowledge
about protected areas into the WDPA. The World Database on Protected Areas is managed at
UNEP-WCMC in Cambridge, UK supported by IUCN staff and World Commission on
42 http://www.iucn.org/43 http://www.unep-wcmc.org/

Protected Areas members all over the world. It relies on the magnitude of work carried out by
staff in institutions covering every country on the planet. Without this work from
governments and NGOs alike, there would be no World Database on Protected Areas.
3.2. Red List of Threatened Species (RL)
(Q.a. How? Q.b. What?) The IUCN Red List of Threatened Species™ (figure 3a and 3b) is
widely recognized as the most comprehensive, objective and global approach for evaluating
the conservation status of plant and animal species. From its small beginning, the IUCN Red
List has grown in size and complexity and now plays an increasingly prominent role in
guiding conservation activities of governments, NGOs and scientific institutions. The
introduction in 1994 of a scientifically rigorous approach to determine risks of extinction that
is applicable to all species, has become a world standard. (Q.c. Who?) In order to produce the
IUCN Red List of Threatened Species™, the IUCN Species Programme working with the
IUCN Survival Commission (SSC) and with members of IUCN draws on and mobilizes a
network of scientists and partner organizations working in almost every country in the world,
who collectively hold what is likely the most complete scientific knowledge base on the
biology and conservation status of species.
Figure 3a. Red List of Threatened Species (RL): Home page

Figure 3b. Red List of Threatened Species (RL): Attribute (species)
3.3. Heritage Inventory & Management System (Arches)
(Q.a. How? Q.b. What?) Arches (figures 4a and 4b) is a new open-source geospatial software
system for cultural heritage inventory and management, developed jointly by the Getty
Conservation Institute and World Monuments Fund. Arches grew out of the collaborative
effort to create the Middle Eastern Geodatabase for Antiquities, and the widespread need
within the heritage field for low-cost electronic inventories that are easy to use and access.
Arches combines state-of-the-art software development with (Q.c. Who?) the insights and
perspective of heritage professionals from around the world. The need for functional heritage
inventories has grown over the last decades, together with the rise of a global awareness of
the importance of heritage management. Nevertheless, inventories remain complicated to
establish and maintain, and frequently rely on costly proprietary software that does not always
fit the needs of the heritage field.
Figure 4a. Arches: Home page
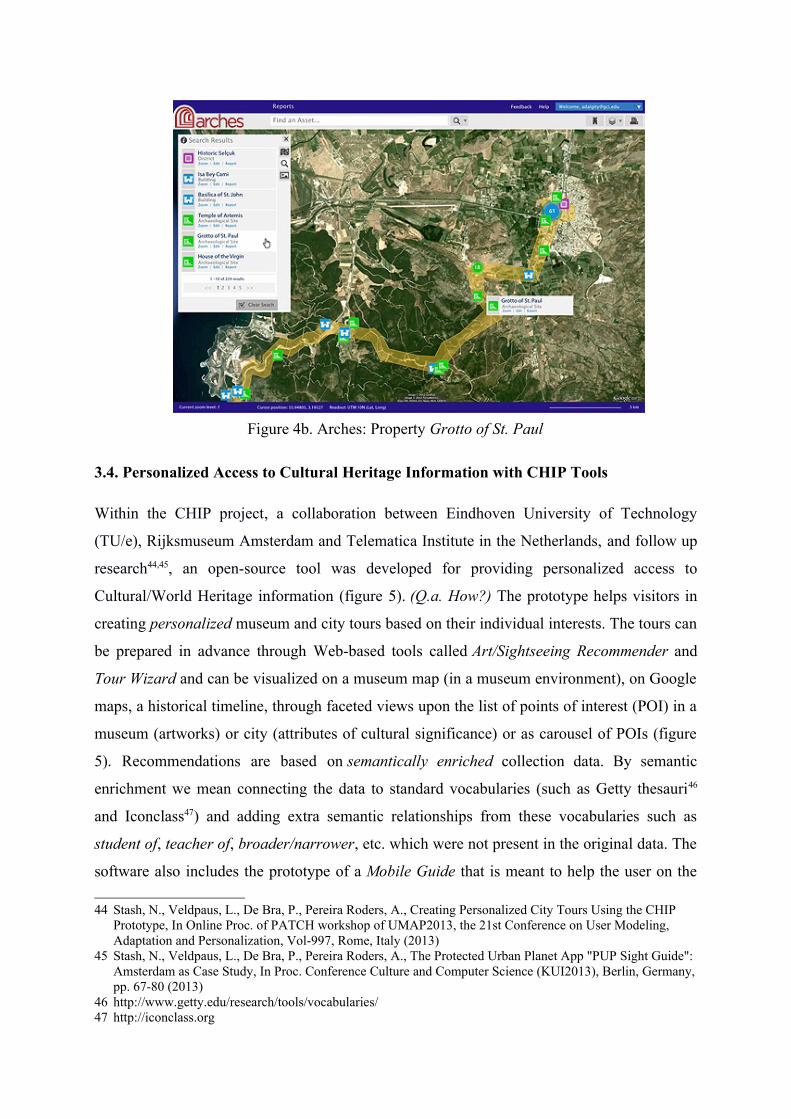
Figure 4b. Arches: Property Grotto of St. Paul
3.4. Personalized Access to Cultural Heritage Information with CHIP Tools
Within the CHIP project, a collaboration between Eindhoven University of Technology
(TU/e), Rijksmuseum Amsterdam and Telematica Institute in the Netherlands, and follow up
research44,45, an open-source tool was developed for providing personalized access to
Cultural/World Heritage information (figure 5). (Q.a. How?) The prototype helps visitors in
creating personalized museum and city tours based on their individual interests. The tours can
be prepared in advance through Web-based tools called Art/Sightseeing Recommender and
Tour Wizard and can be visualized on a museum map (in a museum environment), on Google
maps, a historical timeline, through faceted views upon the list of points of interest (POI) in a
museum (artworks) or city (attributes of cultural significance) or as carousel of POIs (figure
5). Recommendations are based on semantically enriched collection data. By semantic
enrichment we mean connecting the data to standard vocabularies (such as Getty thesauri46
and Iconclass47) and adding extra semantic relationships from these vocabularies such as
student of, teacher of, broader/narrower, etc. which were not present in the original data. The
software also includes the prototype of a Mobile Guide that is meant to help the user on the
44 Stash, N., Veldpaus, L., De Bra, P., Pereira Roders, A., Creating Personalized City Tours Using the CHIP Prototype, In Online Proc. of PATCH workshop of UMAP2013, the 21st Conference on User Modeling, Adaptation and Personalization, Vol-997, Rome, Italy (2013)
45 Stash, N., Veldpaus, L., De Bra, P., Pereira Roders, A., The Protected Urban Planet App "PUP Sight Guide": Amsterdam as Case Study, In Proc. Conference Culture and Computer Science (KUI2013), Berlin, Germany,pp. 67-80 (2013)
46 http://www.getty.edu/research/tools/vocabularies/47 http://iconclass.org

spot – navigating in the physical museum or in the city. This Web-based tool is presented by
means of case study of the Rijksmuseum as museum location48 and Amsterdam, specifically
its World Heritage property Seventeenth-century canal ring area of Amsterdam inside the
Singelgracht49 as urban location.
Through data visualization50 we can provide the visitor not only with different perspectives upon the
POIs in the tour – historical, geographical, etc. but also help discovering interests that were not so
apparent. The tool does not apply any complicated 3D visualizing techniques as few other
city/museum guides do. The main focus is on personalization. The strong point of the tool is its
generic character which means that it can be used with the data of other museum or city as well.
Appreciation of certain POIs, artists, styles and art topics in the museum can generate
recommendations for an urban tour and vice versa.
(Q. b. What?) The prototype currently works on previously collected and categorized data on
cultural/world heritage. Recommendations as to what visitors might find interesting are based on
previous ratings are only content-based, they do not take into account information about what other
visitors liked/disliked.
(Q.c. Who?) At the moment the tool is meant for art curators (data providers) willing to share the
available information with the city/museum visitors (community of users) . By using a city guide
application to not only share, but also collect information from the users, it can become a tool to
promote heritage properties as well as better understand how heritage is valued and perceived, and
even to map and monitor the WH properties with the help of the public.
48 http://chip.win.tue.nl/demo/mobileguide/49 http://chip.win.tue.nl/cityguide/sightguide/50 CHIP software applies open-source visualization tool SimileExhibit (http://www.simile-widgets.org/exhibit/)

Figure 5. CHIP-based tools: Sightseeing Recommender, Tour Wizard and Mobile Guide
3.5 CartoDB
(Q.b. What?) CartoDB is a cloud-based system to store, analyze and visualize geospatial data. (Q.c.
Who?) The main objective of the software is to provide an easy way to create visualizations based on
maps. (Q.c. How?) This is achieved by the provision of two elements: CartoDB Editor and CartoDB
Platform.
CartoDB Editor has two main sections: tables and visualizations. A table, as in relational database
systems, is the element in which a user will store geospatial data. In this abstraction, the columns of
the table represent the fields and each row represents a record stored. A table in CartoDB has four
mandatory fields: the record ID, the date and time of creation and last update, and the location. Being
a geospatial database, the location field is mandatory and can be either a single point on the map or a
set of them to form an area, each point represented by the pair latitude-longitude.
The data stored in a table can be visualized on a map in addition to the grid layout, an example of this
view is presented in figure 6. This visualization is only available for the user that has logged into
CartoDB, and there are many situations where the visualization are meant to be shared with a larger
audience or made completely public. This is the role of visualizations, which can include the data of
several tables within the same map. They can also be customized with a specific design and enhanced
with legends and descriptive texts.
The other element in the system is CartoDB Platform which offers access to both data and maps in
scenarios that need a higher level of customization. (Q.c. Who?) The platforms is a set of development
tools that allow programmers to interact directly with the data and the maps created within CartoDB.
The elements that compose the platform are a JavaScript library called CartoDB.js and two application
programming interfaces: SQL API and Maps API.

Figure 6. Map view of a table in CartoDB Editor, showing two areas: Madrid and Rome
3.6. Learning/Web Analytic Tools
In this section we discuss the Learning and Web analytics tools LearnGlass and CAPA which
we consider for extending PUP. The field of web analytics aims at understanding the behavior
of users in web-based applications through the analysis of server logs. A final goal of
understanding users is usually to improve the usability and user retention of the system,
although this depends on the domain in which the web application is working. Web analytics
uses several tools to obtain defined metrics of interest, such as amount of visits, number of
unique visitors, and top sources of incoming users.
Learning analytics intends to understand and optimize learning experiences and the
environment where they occur. This includes the tools, resources and activities that learners
are interact with when they participate in an educational activity. In order to achieve this goal,
learning analytics not only involves the analysis and reporting of data about learners and their
surroundings but also the processes for measuring and collecting these data. Learning
analytics can apply web analytics to infer information of the activity of learners in a web-
based learning system but it will often require other tools such as surveys, specialized
software and sensors for data gathering; statistics, machine learning and artificial intelligence
algorithms for data analysis; and visualizations for data reporting.
3.6.1. LearnGlass

(Q.b. What?) LearnGlass is a platform that enables the development of visualizations based
on a common dataset of events occurring in a learning activity. The objective of this platform
is to provide a way to create and publish of visualizations on the web without having to
develop features of a web system such as user management, a database to store actions done
by learners, and a dashboard interface.
(Q.b. How?) The visualizations are added to the platform through the installation of modules.
A module is composed of a set of scripts and resources used to display one or more
visualizations. The visualizations can be accessed through the system menu and the platform
provides a set of filters that can be applied on the data displayed. Examples of these filters are
date ranges, user groups (classes or project teams) and specific users. In order to interact with
these parameters, the visualization can include elements to modify the selected value of each
filter. In addition, visualizations can have a simplified version meant to be embedded into the
user's dashboard. In this situation, the simplified visualization will keep the selected values
for each filter, making it possible to present many insights with the same visualization. For
instance, figure 7 presents a dashboard with four simplified visualizations generated by one
single module. Visualizations at top-left and bottom-right have been generated with the same
interactive visualization but with different parameters. The same occurs with examples at top-
right and bottom-left.
Figure 7. Dashboard of a user in LearnGlass, showing four visualizations of events in a learning
activity

3.6.2. Context Aware Predictive Analysis (CAPA)
(Q.a. How?) CAPA project involves Web analytics for understanding behavioral patterns of
users of various Web-based applications or information services to predict user intensions on
the Web, such as accessing information resources, in order to achieve better personalization
to diverse user needs and interests. User behavior may vary depending on the context, such as
user activity, location, time, weather, etc.. (Q.b. What?) CAPA develops mechanisms to
identify what the (current) context is and to integrate it into predictions.
One of the scenarios to use CAPA to extend PUP includes suggesting protected urban areas in
the proximity of user's current location. Another scenario is to discover interesting patterns
from user search queries and to use this information for recommending “closest/nearby”
places to look for. For example, if the user searches for Amsterdam, based on historical data
and some preferences, (s)he could get recommendation for Paris. In fact there maybe be no
link between Amsterdam and Paris in the data description but the analysis of user behavior
could show that.
(Q.c. Who?) The tool can help users in finding interesting information related to the previous
search queries, it can also help solving the cold start problem for the first time PUP Web site
users by providing recommendations based on available context information.
4. Comparative analysis
The results of the comparative analysis are presented in table 2. The assessment values are as
follows: Available; Getting there; Not available.
Concerning applications (Q.a. How?), most key projects already make use of GIS and are
Web-based. To see Arches and CAPA in action you have to download the code. PUP is the
only tool that provides for a spatio-temporal analysis on the protected urban areas listed as
World Heritage, even if only at global level. It provides a list of respective properties and also
provides for a cumulative overview per municipality, country, region and total on protected
areas. The presented projects do not provide for comparative analysis of content data e.g. do
not compare two properties to each other although it is possible to some extend in CHIP
(plus) prototypes. The presented Web/learning analytic tools are more focused on comparing
users of applications rather than content.
The focus (Q.b. What?) of key projects is on (World) heritage properties – PP and RL on the
nature sector, and PUP, Arches, CHIP on the cultural sector. CHIP prototype originally
developed for the cultural heritage domain can be applied on World Heritage properties as

well. CAPA researchers are particularly interested in e-commerce applications. For the
experimental study they used web-portal MastersPortal.eu that provides information about
various study programmes in Europe51. All key projects provide the most recent analysis,
disabling the spatio-temporal analysis. They also relate analysis to the protected areas, rather
than to specific entities e.g. significance, affecting factors. The overview in management tools
is a common lack, already lightly tackled by RL and Arches.
Last, the stakeholders involved (Q.c. Who?) always include scientific data analysts. They also
try to enroll the data providers, being PP, RL and Arches the most successful in integrating
them among the community of users. They all somehow involve the broader public and
research community in the exploration of information and data analysis, thus the community
of users benefits from all tools. Only PP and CHIP are providing the services to personalize
their use and revise the data analysis.
PP RL PUP ARCHESCarto
DB
CHIP
(plus)CAPA
Learn
Glass
H
o
w
?
Web-based GIS
Spatio-temporal analysis
Automated analysis
Comparative analysis
W
h
a
t
?
Protected areas
Significance
Affecting factors
Management tools
W
h
o
?
Data analysts
Data providers
Data references
Community of users
Table 2: The assessment results, per criterion and tool
5. Conclusions/Future Work
51 Kiseleva, J., Hoang Thanh, L., Pechenizkiy M., Calders, T.: Discovering temporal hidden contexts in web sessions for user trail prediction. In: Proceedings of TempWeb@WWW'2013, pp. 1067-1074 (WWW Companion Volume)

Protected Urban Planet is crucial both to the integration of research results, and to the
dissemination of the research outcomes. Yet, the first prototype was far beyond our targets.
More resources are needed to develop it properly. Moreover, while surveying the
documentation produced while nominating and managing World Heritage properties, in both
global and local approaches, it became clear that more efficient methods, targeting
automation, would be needed to reach a larger sample of World Heritage properties, as well
as, a higher number of documents per case study.
In the paper we presented the comparative analysis that discusses the differences and
similarities between Protected Urban Planet a number of related tools within and outside
heritage management. The comparison had three focal points: how data is analyzed and
visualized, what is analyzed, and who contributes and benefits from the tools. Even though,
each has its own advantages and disadvantages, there is still no tool to perform semi-
automated analysis and extrapolation of spatio-temporal trends on World Heritage ontologies
from the ever growing documentation produced while nominating and managing World
Heritage properties. The authors, therefore, recommend the following research agenda for the
future work:
5.1. Research challenges
• E-research: The application of e-research to support the semi-automated analysis and
extrapolation of spatio-temporal trends from documentation, which otherwise would not be
possible to develop, taken the ever growing nature of the documentation, the required
amount of resources (time, facilities and analysts) and worldwide coordination.
• World Heritage Ontology: The elaboration on a dynamic domain-ontology for the World
Heritage field and researchers, derived from data mining analysis of the documentation,
and incorporating varied international heritage documentation standards, from both culture
and nature sectors.
• Mapping World Heritage: The elaboration on the variety of locations and definition of
boundaries, including buffer zones, as well as the context of World Heritage properties and
their proximity.
• Analysis and Trends: The establishment of a long term scientific monitoring practice
which allows spatio-temporal analysis and extrapolation of trends on World Heritage
ontologies, bridging the gap between both culture and nature sectors.
5.2. Technical challenges

• GIS: The application of spatio-temporal analysis enabled by geographic information
systems, to support the location and definition of boundaries deduced from ever growing,
heterogeneous (in content and format) and highly unstructured information sources.
• Data mining: The application of automated analysis enabled by spatio-temporal data
mining technologies, including opinion mining, to support ontological knowledge
construction of ever growing, heterogeneous (in content and format) and highly
unstructured information sources.
• Personalization and semantic data enrichment: The application of software developed for
spatio-temporal personalized access to semantically enriched art collection, evolving from
a collection of movable tangible objects to a variety of predominantly immovable objects,
including intangible attributes.