protected areas visitation in mega countries with ... · protected areas visitation in mega...
TRANSCRIPT

PROTECTED AREAS VISITATION IN MEGA COUNTRIES WITH MEGADIVERSITY
Daan Vreugdenhil1, Jan de Leeuw2, Camila Rodrigues3, Yan Shenghu4,, Rocio Esquivel5, Leide Yasuc-co6, Bai Weilan7, Mireya Méndez8, and Liu Xuehua9
ExtractThis presentation makes part of several issues dealt with during the presentation of Daan Vreugdenhil at the Vth Brazilian Conservation Congress, with the title “Innovative financial mechanisms to protect-ed areas”.
Protected areas visitation in developing countries has been negligible all but a few countries renowned as ecotourism destinations. Over the past decade or so, protected areas visitation has started to change in a few countries. This article reviews the developments of visitation of protected areas in 3 mega countries with mega biodiversity: China, Brazil and Mexico. As a reference, some comparisons are also made to the National Parks system of the United states of America.
The Chinese economy is growing rapidly. The combination of growing purchasing power and improv-ing road infrastructure results in increased mobility of its population and growth rates of interior tourism tracking those of GDP. Traditional Chinese landscapes preserved in its National Parks rank among the prime destinations for domestic tourism.
Brazil has shown the lowest economic growth rate of the three countries, being than 3% during the current decade. During the same period, the country has shown an encouraging increase in foreign tourism, while the development of protected areas visitation has been rather irregular.
Mexico's GDP has fluctuated between 0% and 6% during the last 1o years. After a brief period of neg-ative growth, the economy is now recovering and growth appears to be creeping up to the 5% mark. Over the same period, tourism in Mexico has been stagnant at about 20 million persons per year. (IN-EGI website 2007)
1World Institute for Conservation and Environment (WICE), Washington. E-mail: [email protected] Institute for Geo-Information Science and Earth Observation (ITC), P.O. Box 6, 7500 AA Enschede, The Netherlands. E-mail: [email protected] de Meio Ambiente, Esplenada dos Ministérios Bloco B, 70.068-900, Brasilia, DF, Brasil, E-mail: [email protected] Park Office, (NPO), Ministry of Construction, 9 Sanlihe Road, Beijing 100835, China. E-mail: [email protected] Nacional de Areas Naturales Protegidas (CONANP), Camino Al Jusco 200 3° piso Ala Sur Colonia Jardines de la Montaña , Mexico DF, Mex-ico. E-mail: 6Fundação o Boticario de Preteção à Natureza, Rua Gonçales Dias, 225 Batel, Curitiba, PR, cep 80240-340, Brasil. E-mail: 7Research Institute of China Urban Construction, No.2 Huixinnanli Chaoyang District,Beijing10029, China E-mail: [email protected] Mexicano para la Conservación de la Naturaleza, Dept. Áreas Protegidas, Miguel Hidalgo #94, Colonia Centro, Xalapa, Veracruz, 91000, Mexico. E-mail: [email protected] of Environmental Science and Engineering, Tsinghua University, Beijing 100084, China. E-mail: [email protected]

The US National Parks Service has a strongly consolidated system of different categories of protected areas, that over the decades have shown a strong increase in visitation until it leveled off around about 270 million visits per year. Total international tourism in the USA has fluctuated between 40 and 50 million over the last decade.
Lessons to be learned include:Visitation growth is not so much driven by foreign as by domestic demand;Protected areas can contribute to protected areas financing;Visitation is not a threat to protected areas but a necessity to gain broad popular support;Protected areas visitation needs marketing both domestically and abroad;Attractive presentation geared to sophisticated consumer markets is essential for protected areas visitation; house style design may promote recognition and positive experience association;Protected areas generate more than half the tourism attractions for the tourism sector and there-by are quintessential for a nation's economy;As major tourism attractions, protected areas are very low-cost generators for employment and income as the entire tourism sector depends on them and therefore some of the strongest forces in poverty alleviation;Once visitation starts accelerating, growth can be very fast and overwhelm protected areas agen-cies and therefore timely strategic investments are needed in visitation infrastructure and services;Loans can be good instruments for financing visitation infrastructure;Concessions in protected areas must not overshadow the presence and visibility of the protected areas administration.
General trends in ChinaAccording to the UNEP-WCMC database 2003 data, China has more than 450 protected areas, protect-ing about 60 million ha, or 6 % of the national territory. In 2005, there were 177 National Parks, which protect natural landscapes with fabulous scenery, dramatic geological formations and unique biological values (pers. com. NPO 2005). The variety of landscapes offered in these national parks ranges from deserts to some of the highest mountains on earth in Tibet and from glacial to moist tropical climates. Most National Parks were established in the second half of last century. A decade or two ago, hardly any of these parks were within reach of the average Chinese and they attracted very few visitors.
This changed as the Chinese economy started growing by 8% annually bringing GDP per capita at US $1750 in 2006 (Worldbank 2005), or corrected for purchasing power parity (PPP10) at $5,600 per capi-ta. (CIA Factbook 2007).
Increasingly, China's growing middle class can afford leisure and travel. Between 1994 and 2004, inte-rior tourism grew 7.4% per year (Fig 1), a rate similar to the growth of GDP. International tourism, in-cluding people from Hong Kong, Macau and Taiwan, increased with 9 % per year.
10The PPP corrects the amount of a certain money amount for what it can purchase in a certain country, thereby making it possible to compare the wealth of citizens of different countries.

Photo 1: National parks and World Heritage Sites in China include both nature and historical monu-ments.
UNESCO World heritage sites and national parks
Tourist numbers (10,000) Tourist overseas (10,000)
Year 2000 2001 2002 2003 2004 2000 2001 2002 2003 2004Badaling and Ming tomb 1083 1139 1150 691 1123 190 218 209 100 206Chengde Mountain Village and eight temples WHS
334 350 341 302 351 11 15 20 6.5 10.5
Huang mountain WHS 117 134 136 104 160 7 7.33 9.2 4 11.4Wuyi Shan WHS 52 70 71 59.2 73.6 6 8 8 5.1 13.7Lushan National Park 87 102 92 92 159 1 2 1.2 0.7Tai Shan WHS 449 165 207 125 166 7 5 5.5 3.8 4Emei Shan National park 130 166 337 334 465 1 2 8 4.6 16.5Qingcheng Shan and Dujiangyan Irriga-tion System WHS
137 153 195 150 212 12 13 14 3.7 7
Wulingyuan Scenic Area 366 434 574 526 920 11 13 14.5 25.5 71.9Longmen Grottoes in Luoyang city 71 3 3.5 2 1.8 6Lijiang yulong Mountain National Scenic Area
85 290 139 179 8 10 14.5
Huanglong temple and jiuzhai River 112 170 188 175 325 8 9 11.5 9.5 31.7Total 3023 3177 3432 2559 4135 268 302 315 163 373Annual growth 5.1% 8.1% -25.4% 61.6% 12.8 4.3 -48.2 128.1Average annual growth 12.3% 24.3
Table 1: Visitation numbers of some top World Heritages Sites and National Parks in ChinaSource: NPO.

As can be seen from Figure 1 and Table 1 the overall growth of visitation of some of the World Her-itage sites and National Parks of China has been higher than the growth of international tourism.Some parks underwent an even much faster growth, such as is the case of Sanquing Shan National Park. The number of visitors to Sanqing Shan National Park (Fig. 1) increased from 40,000 in 1995 tot over 500,000 in 2004. The growth rate between 1994 and 1998 was about 13% per year and then jumped to 37% for the period 1998 to 2004. This increase is in part related to the introduction of annual public holidays 1998, during the weeks with the 1st of May and the 1st of October.
General trends in MexicoIn Mexico, the lands protected under federal law rose from 8.8 million ha, protected in 81 protected areas in 1991 to 18,7 million ha protected in 154 areas in 2005 (Vreugden-hil & Graf 2005). Most of the land in the protected areas in Mexico belongs to local communities (ejidos) and the ma-jority among them would welcome visitation. The variety of landscapes varies from dry deserts in Baja California to moist tropical forests in Chiapas, on the border with Guatemala, while marine and coastal protected areas are located in both the Pacific and the Atlantic Oceans. The latter warrants greatly differentiated marine faunas, such as coral reefs in the Gulf of Mexico and whale concentrations along the coasts of Baja California. Some areas have colo-nial or archaeological monuments within their boundaries. Currently about 5,5 million people are visiting the protect-ed areas system, but no breakdown was available at the time of publication.
Over the past two decades, the increase of the network of paved roads in Mexico has been rather gradu-al, as can be seen from Table 3.
In his sixth annual report, the former president of Mexico showed that his government particularly has been working on improving the state of maintenance of existing roads while gradually expanding the system (Presidencia 2006). Table 2 shows how the number of light vehicles has in Mexico has been growing steadily over the last 3 decades, bringing the option of visiting protected areas within reach of increasing numbers of Mexican families. Nowadays, ost protected areas can be conveniently reached by paved roads, and access does not account for the limited visitation of the majority of the areas.
0.01
0.10
1.00
10.00
100.00
1000.00
10000.00
1990 1995 2000 2005
Year
Visit
or n
umbe
r
Figure 1: Development of the annual number of domestic visitors and foreign tourists in China and the number of visi-tors to Sanqing Shan National Park

1980 1985 1990 1995 2000 2005Number of light vehicles 3.8 5.1 6.5 7.8 10.6 14.5
Table 2: Number of registered light vehicles in millions in MexicoSource: INEGI
Photo 2: Protected areas in Mexico have an enormous variety such as coastal marine protected areas on the Atlantic and Pacific coasts as well as deserts with endemic fish inhabited alkaline springs.
General trends in BrazilIn June 2006, the Protected Areas System of Brazil, the Sistema Nacional de Unidades de Conservação, SNUC, protected 55 million ha in about 245 federal protected areas, 62 of which are national parks. In addition, most states have also declared different categories of conservation land. These areas protect a
Year Paved roads in km1990 239 235
2000 323 065
2001 330 005
2002 337 168
2003 349 037
2004 352 072
2005 355 796Table 3: Increase of paved roads in km in Mexico. Source: Presidencia

wide variety of landscapes and ecosystems, varying from dry deciduous dwarf forests in the North East to the amazon tropical rainforests in the West and remnants of the Mata Atlantica in the South East, while the Amazon river system is one of the most significant freshwater ecosystem on earth.

National Parks Priori-tized for Visitation
2000 2001 2002 2003 2004 2005
Amazônia 89 94 51 44 78 208
Aparados da Serra 30,600 32,085 37,844 56,478 48,503 49,970
Brasilia 182,744 218,124 256,634 203,150 195,265 281,016
Caparaó 25,744 29,642 25,566 30,459 30,036 27,391
Emas 0 0 0 0 0 1,658
Iguaçu 767,157 735,875 645,832 764,709 980,937 1,084,241
Chapada dos Guimarães 0 0 0 0 0 40,869
Chapada dos Veadeiros 8,027 16,480 22,158 24,598 19,506 14,589
Itatiaia 97,001 127,713 119,735 125,633 126,940 78,002
Jaú 83 239 438 0 372 196
Marinho de Fernando de Noronha
47,450 57,568 62,551 51,463 51,080 24,609
Marinho de Abrolhos 12,685 12,788 8,879 8,626 8,747 7,594
Monte Pascoal 3,460 2,156 1,139 1,422 1,048 1,252
Serra da Bocaina 8,454 8,672 6,232 6,728 5,838 3,876
Serra da Canastra 20,030 26,502 30,262 35,412 27,460 27,670
Serra da Capivara 0 5,274 3,014 3,908 7,107 6,978
Serra das Confusões 0 0 0 0 0 1,104
Serra do Cipó 432 0 11,918 14,342 13,132 12,900
Serra dos Órgãos 28,674 49,912 53,845 59,994 46,689 75,076
Serra Geral 14,989 16,629 17,832 32,551 31,112 12,628
Sete Cidades 17,641 16,930 21,566 21,212 17,951 17,062
Tijuca 622,038 635,498 497,808 584,192 1,013,631 1,069,066
Ubajara 44,787 43,046 41,867 48,297 47,852 42,831
Totals 1,932,085 2,035,227 1,865,171 2,073,218 2,673,284 2,880,786
Growth per year 5.3% -8.4% 11.2% 28.9% 7.8%
Average annual growth 9.0%
Table 4: Visitation data for prioritized national parks in Brazil
Source, MMA
From 2000 to 2005, overall visitation to the protected areas in Brazil grew by 9% per year, although the last 3 years in the series, by 16% (See Table 4). This was particularly due to a considerable increase in the visitation of Iguaçu National Park, that grew by 19% to almost a million visitors in 2005.

Photo 3: Brazil has 62 national parks that highlight the variety of ecosystems of the most biodiverse country on the planet.
General trends in the USAThe United states has seen a great surge in visitation numbers between 1906 and 1986. With as few as 32,000 visitors in 1906, visitation peaked in the mid nineteen eighties at more than 280 million recre-ation visits and has fluctuated around 270 million visitors ever since. Table 5 shows the progression of visitation developments in the USA during the period 1906 – 2006, as well as the percentile growth rates per decade. It is important to note that visitation accelerated dramatically in the first decades of the last century when the road network in the USA was still very basic (History Channel 2007) while over time growth slowed down to more manageable figures, to eventually stabilize in a period that the road system had reached full maturity.
Year 1906 1916 1926 1936 1946 1956 1966 1976 1986 1996 2006
2000 2001 2002 2003 2004 20050
250000
500000
750000
1000000
1250000
1500000
1750000
2000000
2250000
2500000
2750000
3000000
Figure 2: Total number of registered visitors in the 23 most visited national parks in Brazil.
Source: MMA
Number of visitors 32.475 359.922 2.316.921 11.989.793 21.754.261 61.604.256 133.083.066 216.556.776 281.094.850 265796000 272624000Percentile growth 1008% 544% 417% 81% 183% 116% 63% 30% -5% 3%
Table 5: Number of recreation11 visits of USA National Parks Service Units per decadeSource: US NPS
Photo 4: National parks in the USA: places where every year hundreds of millions of people gather to enjoy nature and meet animals in the wild
Comparing some trendsBoth in China and Brazil, we have been seeing a substantial increase in visitation in a number of pro-tected areas, particularly over the last 5 years or so. What could have caused these surges in visitation? Are there similarities and differences and are there lessons to be learned?
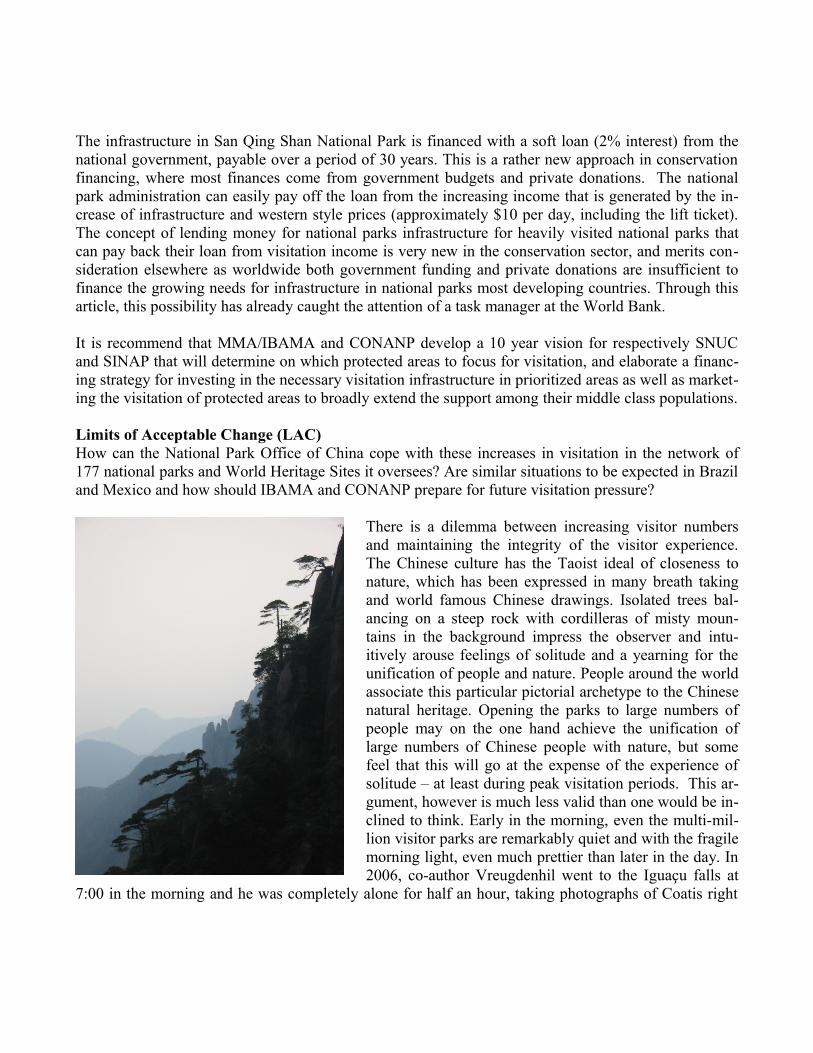
China started developing its road infrastructure after the economic reform in 1988 (Fig 3). The length of express ways increased 44% annually to 25,000 km in 2002. The figure further demonstrates that road infrastructure in-creased not only in terms of length but also in terms of road quality.
The distribution of roads differs regionally. Southeastern and Southern China have a high density of good quality roads, while the north east and south west have a network of medium density consisting of lower class roads and the arid zones in western and northern China have a low densi-ty network of poor quality roads (Int. Inst. for Food Pro-duction 2004).
While the road system outside the parks has improved over the past decade, access has remained con-strained because of the generally poor quality of the last kilometers of park access roads. Ongoing im-11Several national parks in the USA have roads leading through them. Through-going traffic is not considered in these data, neither is the access of staff and other non-recreation oriented entries.
100
1000
10000
100000
1000000
1980 1985 1990 1995 2000
Year
Roa
d le
ngth
(km
) ExpressClass 1Class 2Class 3Class 4Sub
Figure 3: Increase of the length (km) of road infrastructure for six road quality classes between 1988 and 2004Source: China Statistical Yearbook

provements of road infrastructure and park access roads (China National Bureau of Statistics 2005) eliminating these last physical constraints outside the parks, thus bringing visitation within reach to many who can afford to travel.
In Brazil and Mexico, the situation has been very different. Many of most intensely visited protected areas in Brazil and Mexico have been accessible by paved roads for many years, while the car per capi-ta is still much higher than in China. In an effort to understand the dynamics of protected areas visita-tion in Brazil and Mexico, analysts agreed that accessibility by road has not been the main constraint to visitation.
It is obvious that roads and car density are extremely important factors in visitation of protected areas, but they are not the only elements of importance.
It is to be expected that with less than 5 million tourists in all of Brazil in 2004, the potential participa-tion of foreign tourists in protected areas would be somewhat limited, but data show that in fact, they are even much lower than one would reasonably expect. Even in world famous Iguaçu National Park, non-Mercasul foreigners were at just 10% of the total number of visitors and our estimate is that over-all foreign visitation of protected areas is probably lower than 250,000 per year, or about 5%.Although the number of foreign arrivals has not grown over the last decade, with about 20 million tourists entering Mexico every year, one would expect a considerable percentage of those people being interested in visiting protected areas. This has hardly been the case.
Table 6: Trends in the arrivals of international tourists in the World, South America and Brazil

In China, tourism has been growing steadily and increased from 20 million in 1995 to 42 million in 2004 (WTO 2006). Their foreign visitation of protected areas has been growing, but still, as we can see in Table 1 foreigner visitors contributed no more than 6% – 10% to the total visitation numbers in the national parks and World Heritage Sites.
It is interesting to see that in neither of the 3 countries protected areas visitation has been driven by for-eign markets. For years, the conservation sector has been expecting economic benefits for the protected areas to be particularly generated from foreign visitors. The visitation figures in all three megacountries indicate however, that the increase of visitation primarily comes from within the countries themselves, while the contribution of foreign tourists, thus far has been lagging behind. An important lessen learned is that the conservation sector, both public and private, as well as the tourism sector, need to focus much more on their domestic markets.
In China, many of the most intensely visited areas combine high profile architectonic monuments with natural landscapes, in which the cultural monuments are often the primary destination for the visitors, even though they may be located in protected areas of considerable size, such as is the case for the Chi-nese wall, which in different locations is surrounded by extended natural habitat. This is also the case in several locations in Mexico, such as Palenque. In Brazil however, only Tijuca National Park, which includes the famous statue of Christ the Redeemer in Rio de Janeiro, combines a major cultural monu-ment with natural landscapes. It is probable that the fame of cultural monuments and in some cases of spectacular geological phenomena like the Iguaçu Water Falls and the hoodoo formations of Shanquin Shan National park are the key factors driving the suddenly rising interest in visiting protected areas.
There may be a cultural difference that could be driving park visitation much more rapidly in China than in Brazil and Mexico. We were being informed that many Chinese people travel in groups. More-over, the Chinese middle and upper classes are more likely to spend significantly on national travel, then their counterparts from Brazil and Mexico. Unlike the nationals of the latter countries, Chinese cit-
1995 1996 1997 1998 1999 2000 2001 2002 2003 2004
17
17,5
18
18,5
19
19,5
20
20,5
21
21,5
D evelopment Foreign A rrivals in Mexico
Year
Fore
ign
Arri
vals
in m
illio
ns
Figure 4: Development of tourism by foreign arrivals in México.Source INEGI

izens must request an official permission to travel abroad, and those permissions are granted on the bases of certain – usually business and profession related - criteria. This mechanism tends to restrict foreign travel so that it is likely that the Chinese people make better use of the touristic destinations granted within their own country.
In China visitation of the more densely visited areas has started reaching a point where the capacity of trails and - in the more remote areas - hotels, have started to constrain the growth of visitor numbers. Moreover, China heavily invests in the attraction resource as well, by restoring historical monuments as well as by remediating visitation impacts. While in China, we can relate this strong surge to the growth of the middle class, such is not the case for either Brazil and Mexico, where significant middle classes have existed for many decades. For some reason or the other, middle class Brazilian and Mexican fami-lies showed very little interest in the protected areas of their countries.
In Mexico, the reason can probably be related to a rather late start in a consorted nationwide effort to protect the national natural heritage, dating back to the first half of the nineteen nineties. But, once it took off, the federal programme led by what now is CONANP, has been one of the most successful conservation efforts in the world. However, in was not until the beginning of this century that more and more protected areas were getting the basic infrastructure to become attractive to visitors, such as trails and still only occasionally, visitor centers and rangers to receive visitors. Moreover, the middle class Mexican public did not know that protected areas existed and that actually could be visited. The majority of the public probably still is unaware of the marvelous visitation options their own country has to offer.
Brazil is somewhat different in the sense that it had a few protected areas with good road access, visitor buildings and trails dating back to the first half of last century, such as Tijuca National Park, and yet, these areas show surprisingly low visitation numbers provided their closeness to a megacity. In some cases, like Iguaçu National Park, visitation was poorly structured as recently as a decade ago, while the majority of the national parks still have hardly any visitation infrastructure, and where it exists, some-times heavily outdated and unappealing to the modern middle class. The majority of the national parks of Brazil are little known, and like in Mexico, few middle class Brazilians are aware of the wealth of beautiful areas awaiting their visitation. Moreover, of any of the protected areas systems considered, Brazil probably has the fewest historical and high-profile archaeological sites, that have a potential for enhancing the fame of its areas.
So far, we discussed what happened until the present. What future developments may we expect? In Brazil and China, both domestic and foreign tourism are expected to continue growing rapidly (IMF 2005 and Butler and Boid 2000), while in Mexico particularly domestic tourism is expected to grow given the stagnant market for foreign tourism.
As mentioned previously, thus far, most visitors in China reach the more distant parks through orga-nized tours. We expect that this will gradually change; as growing numbers of families start owning private cars, more and more people are going to explore their country on their own. The well known re-

lation between GDP PPP and motor vehicles per 1000 people has been used to forecast that China will have more than 100 million cars or 80 per 1000 persons in the year 2020 (Fig. 5).
Photo 5:Iguaçu NP is accessible over good roads while serviced by busses whose cost is included in te price.
Photo 6: Every weekend thousands of visitors arrive by car in Brasilia National Park
Photo 7: All units of the USA national parks service are accessible by car and have ample parking space.
In Brazil and Mexico the growth of the middle class is clearly less significant, while some argue it has actually decreased. Nevertheless, car ownership is increasing in both countries, and currently, they re-spectively have 170 and 135 vehicles per 1,000 inhabitants with considerable growths in their respec-tive numbers of light vehicles. As a result, we expect that in all three countries visitors arriving in pri-vate vehicles will eventually dominate the visitation market of the protected areas like in the USA and Europe. Protected areas administrations of the more densely visited protected areas will have to antici-pate such growth and significant investments are needed to facilitate the arrival of cars, such as roads within the protected areas as well as sufficient parking space.
With proliferating private car ownership and in-creasingly easy access to the protected areas there is a risk that National Parks and World Heritage Sites of China will be overrun by visitors. Nega-tive tourism impacts have been described for many National Parks (IUCN 2002). Such impacts appear to occur in China as well. Glacy (2001) reported degradation in a number of protected ar-eas in China, where the author concludes that the interests of economic development appear to pre-vail over conservation concerns. In two Chinese national parks, soil compaction, erosion, over-consumption of water, littering and vandalism have been reported (Leung 2001). In Sanquin Shan National park, erosion, sewage and shortage of water had cause such problems that the man-Figure 5: Relationship between GDP and the
number of motor vehicles per 1000 inhabitants for 5 countries. Source: IMF

agement administration is currently retrieving half of the hotel capacity from the heart of the park to the periphery, while constructing an elaborate “skywalk” trail system.
In Brazil and Mexico, the situation seems very different now, but indications suggest that important changes are about to take place. In Mexico, a number of areas experiences tremendous visitation pres-sure during “Semana Santa”. In Chichinautsin and Cuatrocienegas the local infrastructure, the natural resources of some sites and the staff are insufficient to handle the visitation satisfactorily. In Brazil the National Parks Caparaó, Chapada dos Veadeiros, Serra dos Òrgãos have been receiving considerable visitation during Semana Santa as well as during the vacation period in July. During these vacation pe-riods they need additional staff to attend to the public. In part this need is addressed with volunteers. Still, in Brazil and Mexico, only very few areas have reached the one million visitors mark, while the majority of even the prioritized protected areas suffer from an almost total lack of interest from the side of the public at large, if one is to judge from the visitation numbers. But even in China, high-density visitation is only limited to a relatively small number of protected areas, while the majority of the more than 450 areas have very little to no visitation at all.
Neither in Brazil nor in Mexico, a well developed visions exists on how to involve their citizens active-ly in their respective protected areas systems as the natural heritage of all citizens. Communication with the public at large is only nascent and thus far has been inadequate in establishing a liaison with the public at large, for which a prioritisation is needed of the areas most suitable for establishing a relation-ship with the public. Areas that lie within 2,5 hours from major cities are the best candidates for pro-moting a relation between the protected areas system and the public at large, as they can be visited by large numbers of people on day-trips. Both countries should evaluate which protected areas qualify for this criterion and strongly focus on preparing those areas for intensive visitation and actually actively market their visitation in the nearby cities among the public at large.
The public function of the respective national heritages of nature and green spaces for the benefit of all citizens could have more attention at the level of the administrations of a number of PAs, where the pri-mary focus is on creating benefits for local population. In many PAs, visitors are considered “tourists” that bring money instead of fellow countrymen that are entitled to the access to the PAs and that need to be involved in their conservation.
Experiences in Costa Rica , China and the USA show that once the visitation to PAs starts to rise, visi-tation growth rates may accelerate very rapidly. In Costa Rica, the visitation to their SINAP was dupli-cated between 1992 and 1994 (Vreugdenhil & Graf 2005). China has started to invest seriously in the visitation infrastructure of a number of its national parks. Brazil and Mexico have been getting the sig-nals of an impending high visitation growth in areas like Iguaçu and the Monarca nature reserve. What Brazil and Mexico can learn from aforementioned countries, is that at first tourism / visitation develops seemingly slowly, but all of a sudden it can start to pick up rapidly, risking the destroying anything that is not prepared for the unexpected numbers as well as undesirable for profit responses from the private sectors that later will be difficult to be turned back. The cable car system to the Jesus Christ the Re-deemer in Tijuca National Park and the extreme heave domination of commercial operations in Iguaçu National Park are examples of financing methods that are in the need of serious revision.
The infrastructure in San Qing Shan National Park is financed with a soft loan (2% interest) from the national government, payable over a period of 30 years. This is a rather new approach in conservation financing, where most finances come from government budgets and private donations. The national park administration can easily pay off the loan from the increasing income that is generated by the in-crease of infrastructure and western style prices (approximately $10 per day, including the lift ticket). The concept of lending money for national parks infrastructure for heavily visited national parks that can pay back their loan from visitation income is very new in the conservation sector, and merits con-sideration elsewhere as worldwide both government funding and private donations are insufficient to finance the growing needs for infrastructure in national parks most developing countries. Through this article, this possibility has already caught the attention of a task manager at the World Bank.
It is recommend that MMA/IBAMA and CONANP develop a 10 year vision for respectively SNUC and SINAP that will determine on which protected areas to focus for visitation, and elaborate a financ-ing strategy for investing in the necessary visitation infrastructure in prioritized areas as well as market-ing the visitation of protected areas to broadly extend the support among their middle class populations.
Limits of Acceptable Change (LAC)How can the National Park Office of China cope with these increases in visitation in the network of 177 national parks and World Heritage Sites it oversees? Are similar situations to be expected in Brazil and Mexico and how should IBAMA and CONANP prepare for future visitation pressure?
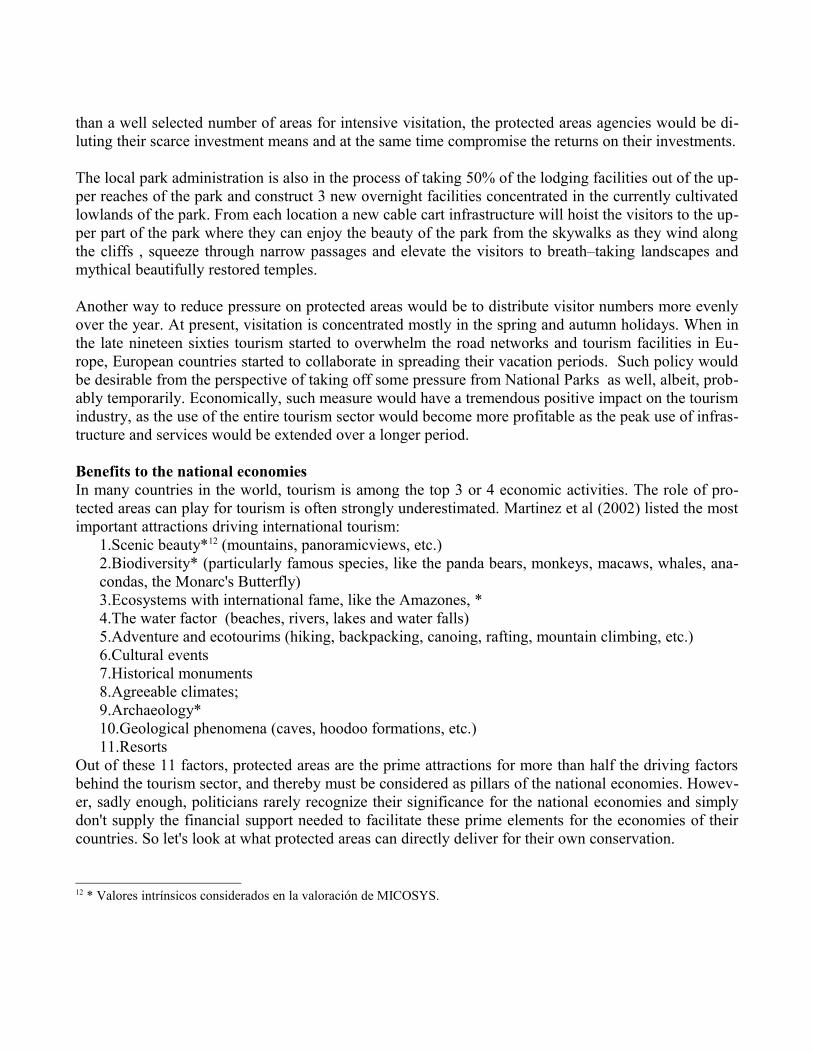
There is a dilemma between increasing visitor numbers and maintaining the integrity of the visitor experience. The Chinese culture has the Taoist ideal of closeness to nature, which has been expressed in many breath taking and world famous Chinese drawings. Isolated trees bal-ancing on a steep rock with cordilleras of misty moun-tains in the background impress the observer and intu-itively arouse feelings of solitude and a yearning for the unification of people and nature. People around the world associate this particular pictorial archetype to the Chinese natural heritage. Opening the parks to large numbers of people may on the one hand achieve the unification of large numbers of Chinese people with nature, but some feel that this will go at the expense of the experience of solitude – at least during peak visitation periods. This ar-gument, however is much less valid than one would be in-clined to think. Early in the morning, even the multi-mil-lion visitor parks are remarkably quiet and with the fragile morning light, even much prettier than later in the day. In 2006, co-author Vreugdenhil went to the Iguaçu falls at
7:00 in the morning and he was completely alone for half an hour, taking photographs of Coatis right

on the trail along the falls. During the next hour he met 2 other visitors. Only by 10 o'clock was it get-ting busy. So, anybody that values solitude can get it merely by getting up early!
To address pressure on the resource itself, some are inclined to restrict visitor numbers. The idea of the need to restrict the number of visitors based on the concept of carrying capacity applied to tourism. Over last decade this concept has been criticized while it presumes fixed and predetermined conditions of an area. Critics argue that visitation numbers are not fixed but flexible when focusing at the impacts of visitation and search for ways to mitigate these.
The concept (Vreugdenhil & Smith 1998b) of limits of ac-ceptable change (LAC) has shifted attention from a calcu-lated use level to defining the minimum desired condition in which nature should be kept. The LAC approach con-centrates on establishing measurable limits to human in-duced changes in the natural setting of a location, and tar-gets to mitigate changes with appropriate infrastructure, tools and management applications to maintain and/or re-store desired conditions.
The most innovative example of this are the skywalks of Sanquin Shan National Park, where people walk along ele-vated trails clad against the vertical walls of the hoodoo formations. No visitor can leave the trail into the forest, while undergoing a mountaineer's experience under rela-
tively comfortable and safe conditions. The United States has worked with similar solutions for decades on locations where the numbers of visitors may be thousands, and Iguaçu National Park too is an example of top-quality infrastructure.
To encourage visitors to stay on the trails, they have, well-maintained trails, pleasant-looking interpre-tative signs and well-visible informed rangers in uniform that attend to the needs and interests of the visiting public.
Photo 8: Trails hanging on the cliffs of Sanqing Shan N.P. designed to reduce visitor impact and improve the visitor experience.

Photo 9: InItataia National park a low footbridge prevents people from wandering off in the fragile vegetation.
Photo 10: In NP Iguaçu gives the visitors an unforgettable view of the waterfalls
Photo 11: In Yellowstone NP an elevated trail gives safe and comfortable access to the geyzers, while preventing trampling
Photo 12:In Sanquin Shan NP, visitors can walk 40 km of “skywalks” that keeps them away from the fragile steep slopes, while they can safely enjoy the hoodoos like mounteneers.
Photo 13:High-density overlooks must be spacious and safe and easily accessible for visitors, so that they will be little tempted to go anywhere else. Photo 14: Why climb the
mountains and wander off the trails if you can walkt them up on endless stairways: Sanquin Shan NP's anwer to LAC!
De facto, the Chinese NPO and the park administrations have chosen for such flexible approach. In stead of establishing total maximum visitation levels, increasingly Chinese national park administra-tions are building visitor resistant infrastructure and implementing management practices that severely reduce negative impacts on nature, while at the same time enhancing the visitor experience for the ma-jority of the visitors. In the United states, the number of areas under the National Parks Service has in-creased steadily over the the past century, which has given visitors the option to chose from an increas-ing list of areas to visit. All three megadiverse countries have a diverse selection of protected areas to chose from, but only few have the infrastructure to receive large numbers of visitors. While China now needs to diversify its visitation options, neither Brazil nor Mexico have reached the point that they need to have more than a dozen or two areas each to focus their visitation on. In fact, by investing in more
than a well selected number of areas for intensive visitation, the protected areas agencies would be di-luting their scarce investment means and at the same time compromise the returns on their investments.
The local park administration is also in the process of taking 50% of the lodging facilities out of the up-per reaches of the park and construct 3 new overnight facilities concentrated in the currently cultivated lowlands of the park. From each location a new cable cart infrastructure will hoist the visitors to the up-per part of the park where they can enjoy the beauty of the park from the skywalks as they wind along the cliffs , squeeze through narrow passages and elevate the visitors to breath–taking landscapes and mythical beautifully restored temples.
Another way to reduce pressure on protected areas would be to distribute visitor numbers more evenly over the year. At present, visitation is concentrated mostly in the spring and autumn holidays. When in the late nineteen sixties tourism started to overwhelm the road networks and tourism facilities in Eu-rope, European countries started to collaborate in spreading their vacation periods. Such policy would be desirable from the perspective of taking off some pressure from National Parks as well, albeit, prob-ably temporarily. Economically, such measure would have a tremendous positive impact on the tourism industry, as the use of the entire tourism sector would become more profitable as the peak use of infras-tructure and services would be extended over a longer period.
Benefits to the national economiesIn many countries in the world, tourism is among the top 3 or 4 economic activities. The role of pro-tected areas can play for tourism is often strongly underestimated. Martinez et al (2002) listed the most important attractions driving international tourism:
1.Scenic beauty*12 (mountains, panoramicviews, etc.)2.Biodiversity* (particularly famous species, like the panda bears, monkeys, macaws, whales, ana-condas, the Monarc's Butterfly)3.Ecosystems with international fame, like the Amazones, *4.The water factor (beaches, rivers, lakes and water falls)5.Adventure and ecotourims (hiking, backpacking, canoing, rafting, mountain climbing, etc.)6.Cultural events7.Historical monuments 8.Agreeable climates;9.Archaeology*10.Geological phenomena (caves, hoodoo formations, etc.)11.Resorts
Out of these 11 factors, protected areas are the prime attractions for more than half the driving factors behind the tourism sector, and thereby must be considered as pillars of the national economies. Howev-er, sadly enough, politicians rarely recognize their significance for the national economies and simply don't supply the financial support needed to facilitate these prime elements for the economies of their countries. So let's look at what protected areas can directly deliver for their own conservation.
12 * Valores intrínsicos considerados en la valoración de MICOSYS.

Direct revenues from protected areasProtected areas in Brazil have been providing the following revenues from 2000 to 2004:
Year 2000 2001 2002 2003 2004
Income in Millons of Rs 8,3 9,0 8,0 11.4 14.3
Table 7: 2000 - 2004 Revenues from visitation to SNUC in BrazilAs can be seen, this income is rather limited, but considerable improvements can be made merely by more consistent collection of entry fees. Table 7 shows a growth rate prognoses for visitation and in-come from entry fees of the national parks for the period 2007-2016.
2008 2009 2010 2011 2012 2013 2014 2015 2016
Totals visitors 2,662,000 2,928,200 3,221,020 3,543,122 3,897,434 4,287,178 4,715,895 5,187,485 5,706,233
Totals SNUC in Rs 29,148,900 32,063,790 35,270,169 38,797,186 42,676,904 46,944,595 51,639,054 56,802,960 62,483,256
Totals SNUC en US$ 13,507,368 14,858,105 16,343,915 17,978,307 19,776,137 21,753,751 23,929,126 26,322,039 28,954,243
Table 8: Prognoses Income from entry fees in Rs for the period 2008 – 2016 assuming a 10% growth in visitation and slightly adapted pricing for entry fees.
What complicated a sound analysis is the fact that in each UC, data are collected differently. Some areas (e.g. PN Brasilia) only receive data on income, but none on actual visitors. Other UCs collect in-formation of visitors by nationality category (PN Iguaçu): nationals, foreigners from Mercasul nations and other foreigners, as well as (non-paying) student visitors arriving in visits organized by schools. In again others areas (e.g. PN Serra dos Orgões), only data on absolute numbers of visitors are collected. The total number of paying visitors was registered at almost 2,3 million visits in 2005, and almost 2.9 million visitors including non-paying visitors like students, etc. What is important for our study is the visitation of the UCs and the income they generate, as only the latter can be used for the management of SNUC. In order to carry out a 10-years prognosis for income potentially generated from visitation to the UCs, we set the growth rate at an average of 10% per year. This does not seem to be overambitious, since several areas have mentioned continuous growth, while additional growth can be expected from investments in visitation infrastructure and marketing.
Taking in consideration that more and more countries are beginning to charge US$10 per foreign visi-tor, the calculations assume such fee for foreigners, while for Iguaçú NP US$20 has been calculated for foreign visitors, which is at par with the worldwide uniqueness of the waterfalls.
The basic calculations from these numbers show an approximate direct income generation from visita-tion to SNUC of R$60,000,000 in 2016. This would require that investments in the best visited areas

and areas near major cities be made soon, to substantially improve visitation infrastructure and ser-vices. Prices would need to be adapted slightly and be corrected for inflation. Yet, as visitation of the protected areas by citizens of the country is of great importance, the pricing of the areas should be kept at levels that make them accessible for middle class families. This means that special fees are needed for children and students. The figures in Table 8 only consider the entry fees and additional income may be expected from concessions for visitor services, such as hotels, restaurants, souvenir shops and other activities to attend to the needs of the public. Experience teaches however, that concessions gen-erate less income than entry fees, while they may provide considerable privileges to private enterprise that may undermine visitor experience as well as the authority over the protected areas agencies if not negotiated carefully. Together, entry fees and concessions may become a source of increasingly impor-tance in an overall package towards financing SNUC. In Iguaçu National Park, the entire visitor man-agement appears to be privatized and parks staff merely function as “contract supervisors” and there is hardly any to no contact at all between parks staff and the visitors. That is a lost opportunity for the Government of Brazil to communicate with its citizens in a positive way.
Another issue that needs to be addressed is where the revenues from visitation go. It is obvious that ar-eas with large numbers of visitors need more financing and staff than areas with fewer visitors. Howev-er, it should always be born in mind, that only fee areas in the system will be able to generate signifi-cant revenues, and the situation should be avoided that the conservation of biodiversity would primarily take place in popular high profile areas. It is a common phenomenon that employees of heavily visited areas strongly oppose sharing what they consider as “their” revenues with areas with different charac-teristics. The revenues don't should not be considered however as belonging to one particular area but to the national system of protected areas in which the plants and animals in protected areas with little visitation should be just as well protected as those in areas that are blessed with the attention of many visitors. At least a significant part of the use of the revenues should thus be determined by the financing officers of the protected areas agency as a whole.
Marketing and promotionVisitation of protected areas needs marketing abroad and promotion domestically, each with different approaches. The Boticario Foundation, the Mexican Conservation Fund and other NGOs could help their respective governments with such promotion with propaganda displays on public locations like airports, stations and shopping malls in which the displays would focus on the promotion of visitation of the areas, and maybe advertising on radio and television. In the late nineteen eighties, Costa Rica had become tremendously successful at marketing its nature in nature conservation magazines and con-tinues to do so.
Several countries have found it beneficial to create a “house style” for the entire protected areas sys-tem, such as Mexico and the United States. The advantage of a house style is that the level of presenta-tion will always meet the criteria set by the protected areas agency.
CONANP in Mexico has chosen for a colorful house style that may be somewhat more attractive to a young public. The United States National Park has for many years worked with a house style that blends in with the natural settings of the areas. Thus far, neither the NPO in China nor IBAMA in

Brazil have worked with a house style. In absence of a house style, both presentation and the quality of presentation may vary greatly. In marketing, it is generally believed that a recognizable house style is important for “product recognition” and positive sensation.
Foto 15: The federal protected areas administration of Mexico has recently developed a very tasteful house style: Promostion posters in the Mexican house style try to appeal a young public.
]
Photo 16: for its entire protected areas system of almost 155 areas.

Photo 17: A diversity in style of interpretative signs may not always result in a quality that appeals to a modern public.
Photo 18: In all of its almost 400 areas the US National Parks Service has implemented a subdued house style that blends in with the surroundings
Poverty alleviationThe measures required to achieve the promotion of the relatively well-to-do from the cities seem to be at odds with those policies that focus on generating benefits for the local communities, which usually are poor. Building and maintaining visitation facilities for urban visitors seems rather in contrast with the needs of poor local communities. The reality is though that the “consumer” market of protected ar-eas is the middle and upper class. In order to generate economic benefits, one must cater to the needs and wishes of the clientèle, and modern middle class citizens anywhere in the world are demanding quality service and well-cared environments. To satisfy such demand requires modern infrastructure, facilities and quality service. This includes the construction of visitor centers with high quality, tasteful and informative/educative expositions of the highlights of the protected areas. The majority of the needs of the visitors consists of facilities and transportation that is being provided by the private sector

out side of the protected areas. The protected areas merely contribute with quality infrastructure that al-lows the visitors to enjoy the area.. That is a very small investment to support such an important pillar of the national economy, that creates thousands of jobs and help so many people both close to the parks and far away to gradually work themselves out of poverty.
ReferencesButler, R. W. and Boyd, S.W., 2000, Tourism and National Parks: Issues and Implications. Wiley,
352 p. China Statistical Year Book, 2004, National Bureau of Statistics of China. CIA 2007, CIA Factbook, CIA Factbook website.Glacy, L., 2001. China’s nature reserves: Protecting species or generating profits? China Environment
Series 5: 69-74.IMF, 2005, Vehicle Ownership and per Capita Income.Int. Inst. for Food Production Research, 2005, Poverty Alleviation and Roads, Washington.Integrating Biodiversity into the Tourism Sector: Ceballos-Lascurain, H., 2001, Best Practice Guide-
lines, UNEP/UNDP/GEF/BPSP, Mexico, Leung, Y.F. 2001, Environmental impacts of tourism at China's World Heritage sites. Tourism Recrea-
tion Research 26: 117-122.National Bureau of Statistics and the China National Tourism Administration, 2005, Press release.Martínez, R.A., Weitnauer, E., Vreugdenhil, D. House, P.R., RACIONALIZACION DEL SISTEMA NA-
CIONAL DE LAS AREAS PROTEGIDAS DE HONDURAS, SINAPH, VOLUMEN III: ECOTURIS-MO, World Bank/GEF.
Vreugdenhil, D & Smith R., 1998, Observations On Financing And Organization, World Bank / GEF Supervision Mission, GEF/SINAP 1, Mexico,, Internal report WB, Washington.
Vreugdenhil, D & Smith, R. 1998, Fondo Mexicano para la Conservación de la Naturaleza, A. C., World Bank / GEF Supervision Mision, Observations on Financing and Organization.
Vreugdenhil, D., 2004, Worldwide financing needs of protected areas systems of developing and tran-sition countries, English and Portuguese versions, Conservação e Natureza, Volume 1, No. 2, Cu-ritiba, Brasil.
Vreugdenhil, D., Terborgh, J., Cleef, A.M., Sinitsyn, M., Boere, G.C., Archaga, V.L., Prins, H.H.T., 2003, Comprehensive Protected Areas System Composition and Monitoring, IUCN Vth World Parks Congress edition
World Bank, 2005, GDP per capita in 2003: World Bank website.