prostate cancer detection
TRANSCRIPT

Prostate cancer detection : Au-tomated classifier using perfu-
sion parameters versus T2-weighted image
Prostate cancer detection : Au-tomated classifier using perfu-
sion parameters versus T2-weighted image

Two-compartment model
• Intravascular space
• Extravascular ex-tracellular space
• Transfer of con-trast– Simple diffusion– ∆ concentration
Vein
Artery
Intravascular space (plasma)
Extravascular ex-tracellular space
Intracellular space

Brix two-compartment model• Equation for Fitting: Brix model
– Linearity assumption between signal en-hancement and concentration
• Parameters– kel (sec-1): elimination of contrast
media from central compartment.– kep(sec-1): exchange rate constant
from EES to plasma– AH : constant corresponds to the size
of EES
Central Compartment*
*Blood plasma** Extravascular extracellular space(EES)
Peripheral Compartment**
KinKel
K21 = KepK12

Purpose
• To evaluate the diagnostic accu-racy of automated classifier using various perfusion parameters by comparing with T2-weighted im-age.
• To validate the tumor volumetric result of classifier using pathology map
Patients
• 40 patients with radical prostatectomy– DCE MR images with T2WI, prior to prosta-
tectomy– Pathology maps were available– No medical or radiation treatment prior to
prostatectomy

Machine learning
• Classifier– Support Vector Machine– Parameters were optimized
• Cross-validation– Leave-one-out method
• Features– Kep, Kel, AH, time of arrival, time to peak,
plateau signal, base signal, RMSE, wash-in rate, wash-out rate, relative enhancement, degree of enhancement
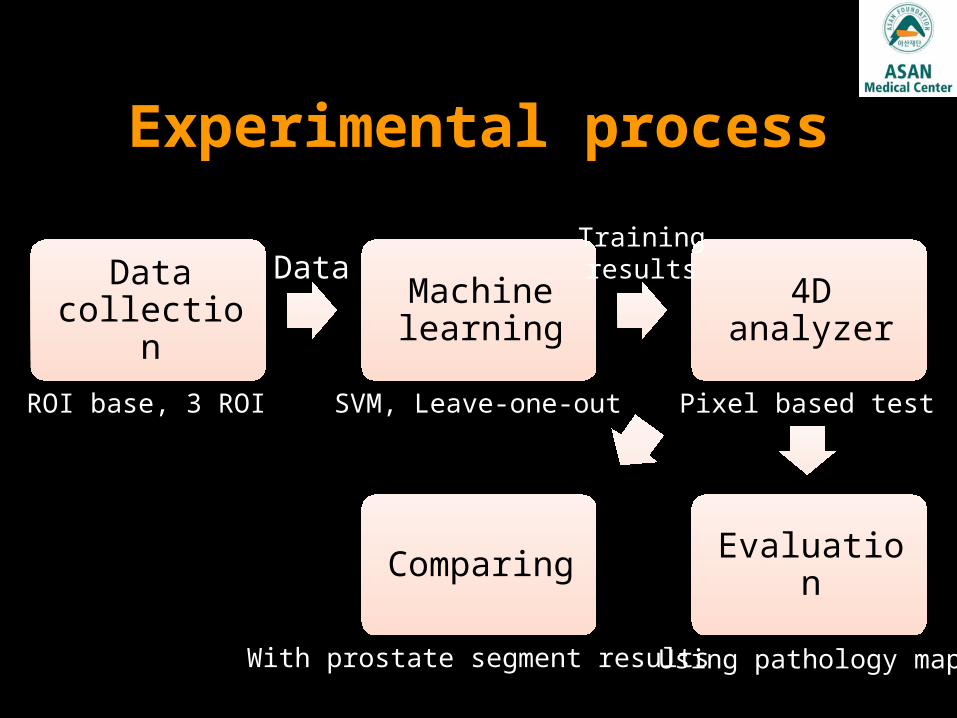
Experimental process
Data col-lection
Machine learning
4D ana-lyzer
EvaluationComparing
DataTrainingresults
ROI base, 3 ROI SVM, Leave-one-out Pixel based test
Using pathology mapWith prostate segment results

Measurement of pa-rameters
• 4D analyzer (matlab based)

Measurement of pa-rameters
• Normal peripheral zone
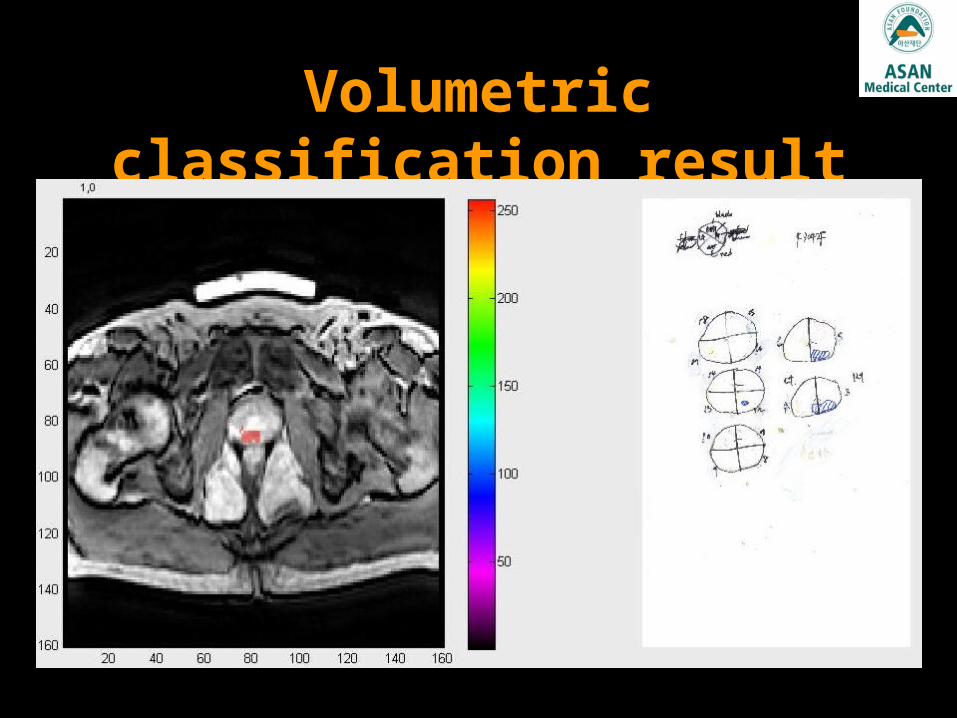
Volumetric classifica-tion result
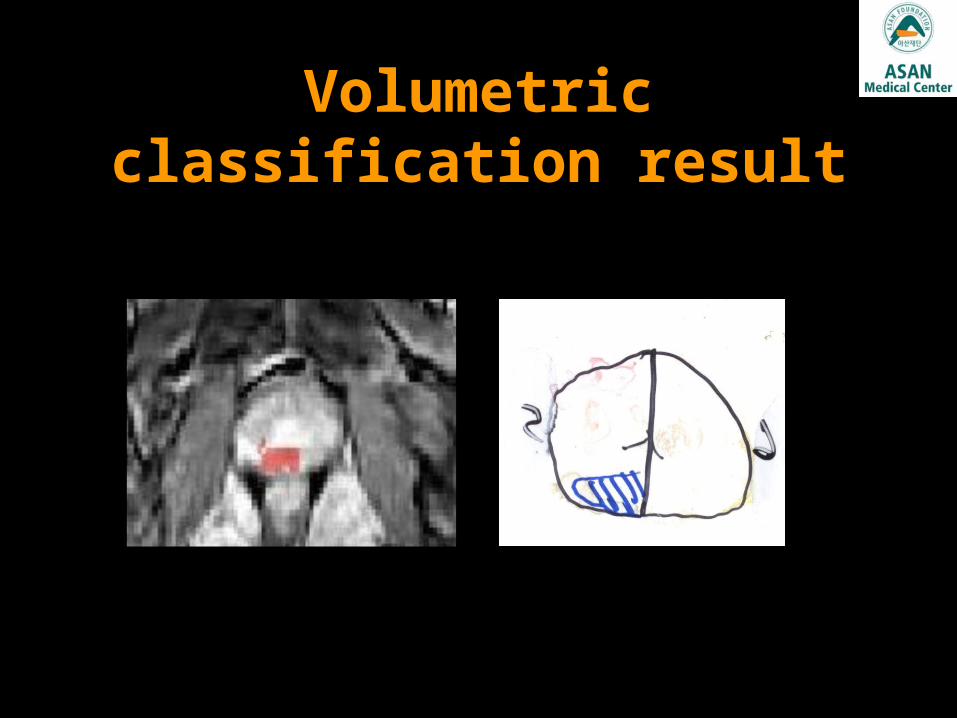
Volumetric classifica-tion result
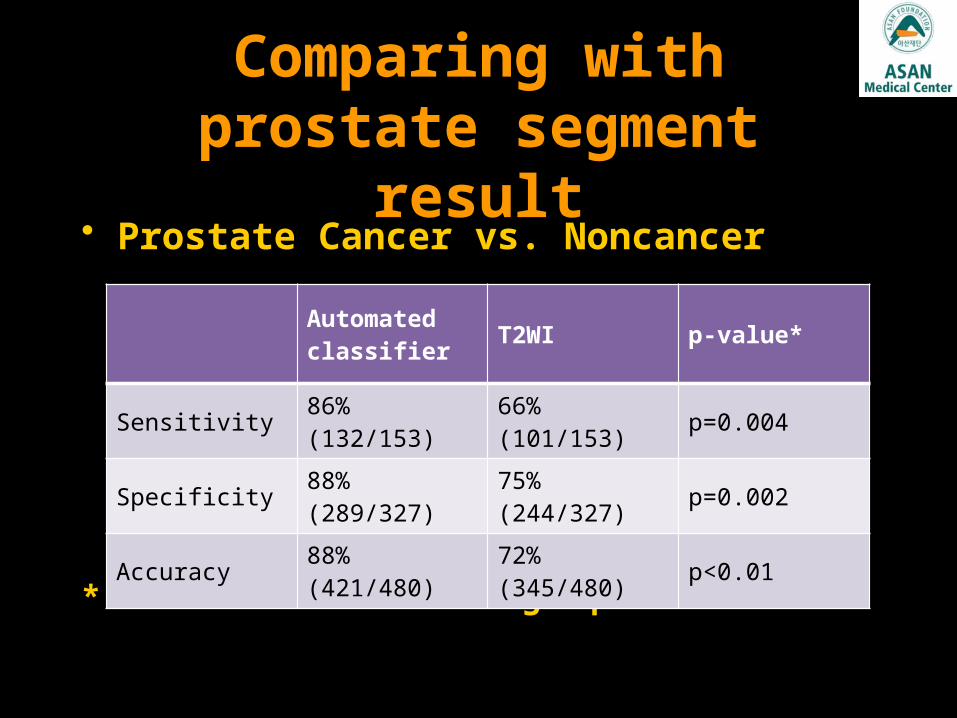
Comparing with prostate segment re-
sult• Prostate Cancer vs. Noncancer
* Generalized Estimating Equations
Automated classifier T2WI p-value*
Sensitivity 86% (132/153)
66% (101/153) p=0.004
Specificity 88% (289/327)
75% (244/327) p=0.002
Accuracy 88% (421/480)
72% (345/480) p<0.01
