prospects in oil- and gas-exporting sub … · 358 world energy outlook 2008 - oil and gas...
TRANSCRIPT

Chapter 15
355Chapter 15 - Prospects in oil- and gas-exporting sub-Saharan African countries
PROSPECTS IN OIL- AND GAS-EXPORTING SUB-SAHARAN AFRICAN COUNTRIES
Could their resources alleviate energy poverty?
Conventional oil production in the ten largest hydrocarbon-producing countries in sub-Saharan Africa reached 5.6 mb/d in 2007, of which 5.1 mb/d was exported. In the Reference Scenario, output grows to 6.9 mb/d in 2015 and then rises more gradually to 7.4 mb/d in 2030. Oil exports climb to 6.4 mb/d in 2030. Gas production in these countries increases from 36 bcm in 2006 to 163 bcm in 2030. Most of the increase is exported. These projections hinge on a reduction in gas flaring, adequate investment and avoidance of disruption to supplies through civil unrest.
The cumulative government take from oil and gas revenues in the ten countries analysed here is projected, in aggregate, at $4.1 trillion over 2006-2030. Nigeria and Angola remain the largest exporters, with combined cumulative revenues of about $3.5 trillion. Oil accounts for the bulk of these revenues. Taxes on oil and gas production account for more than 50% of total government revenues in most of the oil- and gas-rich sub-Saharan African countries.
Despite the vast hydrocarbon wealth of these countries, most of their citizens remain poor. As a result, household access to modern energy services is very limited. Two-thirds of households do not have access to electricity and three-quarters do not have access to clean fuels for cooking, relying instead on fuelwood and charcoal. Unless there are major government initiatives to address this problem, the number of electricity-deprived people is projected to increase over the projection period. More than half of the total population of these countries still relies on fuelwood and charcoal for cooking in 2030.
Tackling energy poverty is well within these countries’ means. We estimate the capital cost of providing minimal energy services (electricity and liquefied petroleum gas stoves and cylinders) to these households over the Outlook period to be about $18 billion. This is roughly equivalent to only 0.4% of the governments’ take from oil and gas exports over the Outlook period.
An improvement in the efficiency of revenue allocation and the accountability of governments in the use of public funds would improve the likelihood of oil and gas revenues actually being used to alleviate poverty generally and energy poverty specifically. Energy is key to sustainable development, bringing major benefits to public health, social welfare and economic productivity. Since affordability is the main barrier to access, efforts to tackle energy poverty need to go hand in hand with broader policies aimed at raising incomes and promoting economic development.
H I G H L I G H T S
© O
ECD
/IEA
, 200
8
Overview1
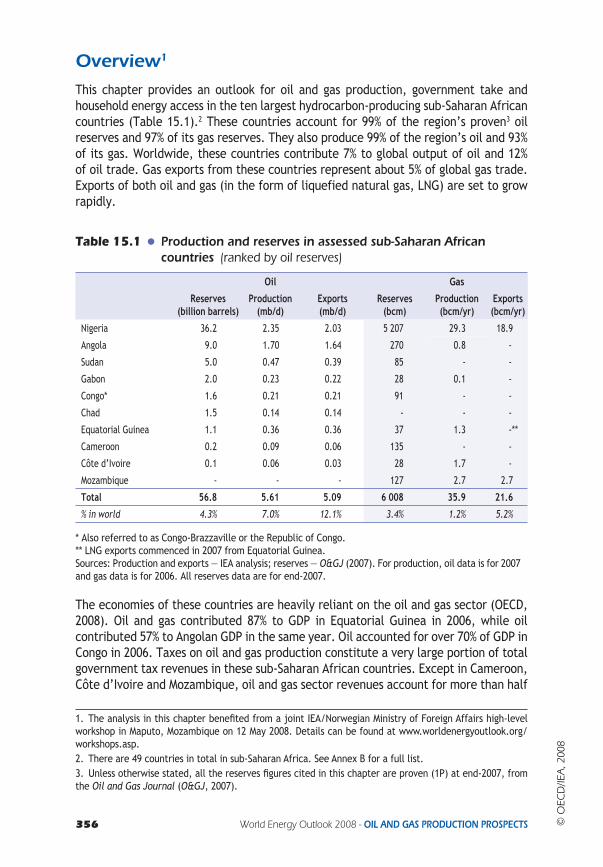
This chapter provides an outlook for oil and gas production, government take and household energy access in the ten largest hydrocarbon-producing sub-Saharan African countries (Table 15.1).2 These countries account for 99% of the region’s proven3 oil reserves and 97% of its gas reserves. They also produce 99% of the region’s oil and 93% of its gas. Worldwide, these countries contribute 7% to global output of oil and 12% of oil trade. Gas exports from these countries represent about 5% of global gas trade. Exports of both oil and gas (in the form of liquefied natural gas, LNG) are set to grow rapidly.
Table 15.1 Production and reserves in assessed sub-Saharan African countries (ranked by oil reserves)
Oil Gas
Reserves (billion barrels)
Production (mb/d)
Exports (mb/d)
Reserves (bcm)
Production(bcm/yr)
Exports (bcm/yr)
Nigeria 36.2 2.35 2.03 5 207 29.3 18.9
Angola 9.0 1.70 1.64 270 0.8 -
Sudan 5.0 0.47 0.39 85 - -
Gabon 2.0 0.23 0.22 28 0.1 -
Congo* 1.6 0.21 0.21 91 - -
Chad 1.5 0.14 0.14 - - -
Equatorial Guinea 1.1 0.36 0.36 37 1.3 -**
Cameroon 0.2 0.09 0.06 135 - -
Côte d’Ivoire 0.1 0.06 0.03 28 1.7 -
Mozambique - - - 127 2.7 2.7
Total 56.8 5.61 5.09 6 008 35.9 21.6
% in world 4.3% 7.0% 12.1% 3.4% 1.2% 5.2%
* Also referred to as Congo-Brazzaville or the Republic of Congo.** LNG exports commenced in 2007 from Equatorial Guinea.Sources: Production and exports — IEA analysis; reserves — O&GJ (2007). For production, oil data is for 2007 and gas data is for 2006. All reserves data are for end-2007.
The economies of these countries are heavily reliant on the oil and gas sector (OECD, 2008). Oil and gas contributed 87% to GDP in Equatorial Guinea in 2006, while oil contributed 57% to Angolan GDP in the same year. Oil accounted for over 70% of GDP in Congo in 2006. Taxes on oil and gas production constitute a very large portion of total government tax revenues in these sub-Saharan African countries. Except in Cameroon, Côte d’Ivoire and Mozambique, oil and gas sector revenues account for more than half
1. The analysis in this chapter benefi ted from a joint IEA/Norwegian Ministry of Foreign Affairs high-level workshop in Maputo, Mozambique on 12 May 2008. Details can be found at www.worldenergyoutlook.org/workshops.asp.2. There are 49 countries in total in sub-Saharan Africa. See Annex B for a full list.3. Unless otherwise stated, all the reserves fi gures cited in this chapter are proven (1P) at end-2007, from the Oil and Gas Journal (O&GJ, 2007).
356 World Energy Outlook 2008 - OIL AND GAS PRODUCTION PROSPECTS © O
ECD
/IEA
, 200
8
15
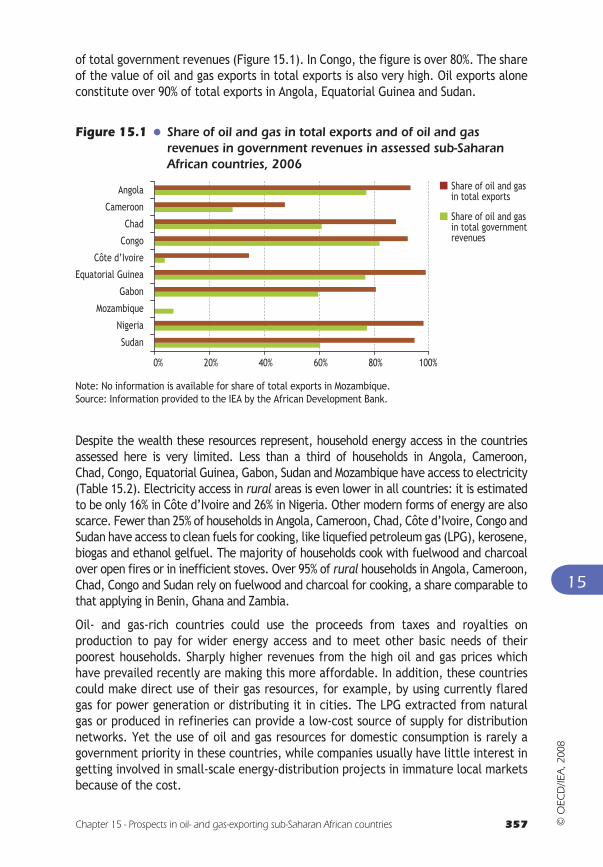
of total government revenues (Figure 15.1). In Congo, the figure is over 80%. The share of the value of oil and gas exports in total exports is also very high. Oil exports alone constitute over 90% of total exports in Angola, Equatorial Guinea and Sudan.
Figure 15.1 Share of oil and gas in total exports and of oil and gas revenues in government revenues in assessed sub-Saharan African countries, 2006
0% 20% 40% 60% 80% 100%
Sudan
Nigeria
Mozambique
Gabon
Equatorial Guinea
Côte d’Ivoire
Congo
Chad
Cameroon
Angola Share of oil and gasin total exports
Share of oil and gasin total governmentrevenues
Note: No information is available for share of total exports in Mozambique.Source: Information provided to the IEA by the African Development Bank.
Despite the wealth these resources represent, household energy access in the countries assessed here is very limited. Less than a third of households in Angola, Cameroon,Chad, Congo, Equatorial Guinea, Gabon, Sudan and Mozambique have access to electricity (Table 15.2). Electricity access in rural areas is even lower in all countries: it is estimated to be only 16% in Côte d’Ivoire and 26% in Nigeria. Other modern forms of energy are also scarce. Fewer than 25% of households in Angola, Cameroon, Chad, Côte d’Ivoire, Congo and Sudan have access to clean fuels for cooking, like liquefied petroleum gas (LPG), kerosene, biogas and ethanol gelfuel. The majority of households cook with fuelwood and charcoal over open fires or in inefficient stoves. Over 95% of rural households in Angola, Cameroon, Chad, Congo and Sudan rely on fuelwood and charcoal for cooking, a share comparable to that applying in Benin, Ghana and Zambia.
Oil- and gas-rich countries could use the proceeds from taxes and royalties on production to pay for wider energy access and to meet other basic needs of their poorest households. Sharply higher revenues from the high oil and gas prices which have prevailed recently are making this more affordable. In addition, these countries could make direct use of their gas resources, for example, by using currently flared gas for power generation or distributing it in cities. The LPG extracted from natural gas or produced in refineries can provide a low-cost source of supply for distribution networks. Yet the use of oil and gas resources for domestic consumption is rarely a government priority in these countries, while companies usually have little interest in getting involved in small-scale energy-distribution projects in immature local markets because of the cost.
357Chapter 15 - Prospects in oil- and gas-exporting sub-Saharan African countries © O
ECD
/IEA
, 200
8

358 World Energy Outlook 2008 - OIL AND GAS PRODUCTION PROSPECTS
Table 15.2 Number of people without access to electricity and relying onfuelwood and charcoal for cooking in assessed sub-Saharan African countries
Total population,
2006(million)
Number of people without
electricity access* (million)
(%) Number of people relying on fuelwood and charcoal for cooking*
(million)
(%)
Angola 16.6 14.6 88 15.7 95
Cameroon 18.2 14.2 78 14.2 78
Chad 10.5 10.1 97 10.2 97
Congo 3.7 2.9 78 2.9 80
Côte d’Ivoire 18.9 11.6 61 14.7 78
Equatorial Guinea 0.5 0.4 73 0.3 59
Gabon 1.3 0.9 70 0.4 33
Mozambique 21 18.6 89 16.9 80
Nigeria 144.7 76.6 53 93.8 65
Sudan 37.7 26.9 71 35.2 93
Total 273.1 176.9 65 204 75
* Most recent estimates.Sources: Population statistics are from UNPD (2007). The number of people without electricity access and relying on fuelwood and charcoal is from IEA analysis, based on national surveys and information provided from the World Bank, United Nations Development Programme and World Health Organisation.
In brief, energy poverty is stark in the ten countries analysed here, as stark as in other countries in sub-Saharan Africa. In the absence of new policy initiatives, the number of people living without electricity and exposed to the health risks associated with the burning of fuelwood and charcoal for cooking will actually rise over the Outlook period, as the population grows. Tackling this problem will require comprehensive and co-ordinated economic and social development plans and policies, with a much greater focus on effective management of the wealth generated by hydrocarbon resources. A first requirement is to make oil and gas revenues transparent to the public. They will ultimately hold governments accountable for the allocation of these revenues.
Outlook for oil and gas production, exports and government revenues
Resources and reserves
Proven oil reserves in the ten sub-Saharan African countries assessed here are estimated at 57 billion barrels, some 4% of world reserves. At a current production level of 5.6 million barrels per day (mb/d), these reserves would sustain production for
© O
ECD
/IEA
, 200
8

Chapter 15 - Prospects in oil- and gas-exporting sub-Saharan African countries 359
15
another 28 years. Significant offshore undiscovered oil resources lie in water between 2 000 metres and 4 000 metres deep in some areas, especially offshore Angola (USGS, 2000). Proven gas reserves amount to 6 trillion cubic metres (tcm) or about 3% of world reserves. Undiscovered resources are particularly abundant in the Niger and Congo deltas.
Nigeria has the largest proven hydrocarbon reserves of any African country, which stood at 68 billion barrels oil equivalent at end-2007. They amount to 73% of all the oil and gas reserves of the ten sub-Saharan African countries assessed here (Figure 15.2). The Nigerian government plans to expand its proven oil reserves, which currently amount to 36 billion barrels, to 40 billion barrels by 2010. Most of the reserves are found along the country’s Niger River Delta, in southern Nigeria and offshore in the Bight of Benin, Gulf of Guinea and Bight of Bonny. Virtually all of the large discoveries in recent years on the west coast of Africa have been made in deepwater offshore fields.
Figure 15.2 Proven oil and gas reserves in assessed sub-Saharan African countries, end-2007
11%
6%
0.3%1.4%
2.3%
1.6%
1.1%
2.3%
0.8%73%
10%
Angola
Cameroon
Chad
Congo
Côte d'Ivoire
Equatorial Guinea
Gabon
Mozambique
Nigeria
SudanTotal = 93 billion barrels of oil equivalent
Sources: O&GJ (2007); IEA analysis.
Oil and gas production and exports
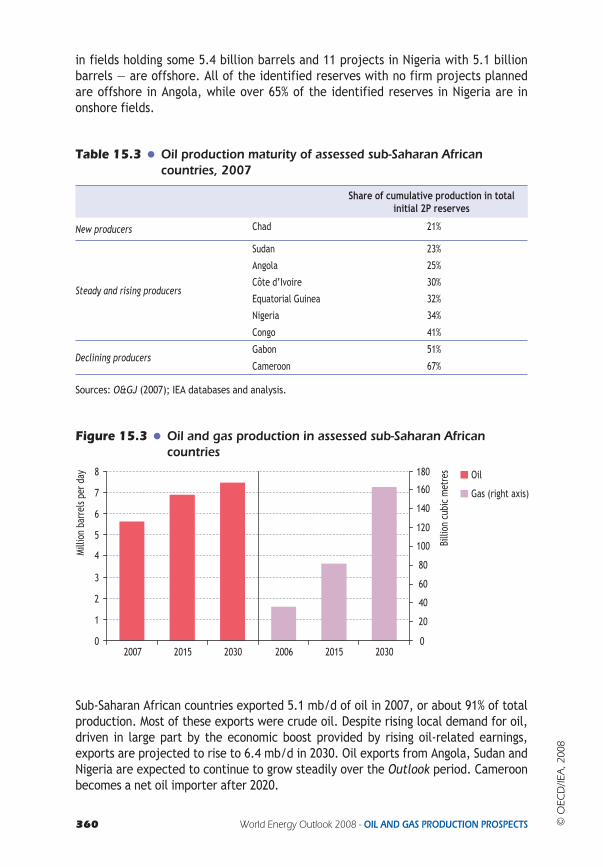
There is considerable difference in production maturity among the oil-rich sub-Saharan African countries. In Table 15.3, we classify the countries into three categories, according to the percentage of initial 2P reserves already produced: new producers; steady and rising producers; and declining producers. The largest oil producers — Nigeria, Angola and Sudan — are expected to increase their production capacity significantly, while Chad is only now beginning its production cycle.
Aggregate oil production in these sub-Saharan Africa countries was 5.6 mb/d in 2007. Conventional oil production is projected to increase to 6.9 mb/d in 2015 and to 7.4 mb/d in 2030 (Figure 15.3). Production in Nigeria and Angola combined represents 84% of total production in 2030, compared with about three-quarters today. All of the sanctioned and planned projects in these two countries — 15 projects in Angola
© O
ECD
/IEA
, 200
8
360 World Energy Outlook 2008 - OIL AND GAS PRODUCTION PROSPECTS
in fields holding some 5.4 billion barrels and 11 projects in Nigeria with 5.1 billion barrels — are offshore. All of the identified reserves with no firm projects planned are offshore in Angola, while over 65% of the identified reserves in Nigeria are in onshore fields.
Table 15.3 Oil production maturity of assessed sub-Saharan African countries, 2007
Share of cumulative production in total initial 2P reserves
New producers Chad 21%
Steady and rising producers
Sudan 23%
Angola 25%
Côte d’Ivoire 30%
Equatorial Guinea 32%
Nigeria 34%
Congo 41%
Declining producersGabon 51%
Cameroon 67%
Sources: O&GJ (2007); IEA databases and analysis.
Figure 15.3 Oil and gas production in assessed sub-Saharan African countries
Gas (right axis)
Milli
on b
arre
ls pe
r day
Billi
on c
ubic
met
res
0
1
2
3
4
5
6
7
8
2007 2015 2030 2006 2015 2030
Oil
0
20
40
60
80
100
120
140
160
180
Sub-Saharan African countries exported 5.1 mb/d of oil in 2007, or about 91% of total production. Most of these exports were crude oil. Despite rising local demand for oil, driven in large part by the economic boost provided by rising oil-related earnings, exports are projected to rise to 6.4 mb/d in 2030. Oil exports from Angola, Sudan and Nigeria are expected to continue to grow steadily over the Outlook period. Cameroon becomes a net oil importer after 2020.
© O
ECD
/IEA
, 200
8
15
361Chapter 15 - Prospects in oil- and gas-exporting sub-Saharan African countries
Gas production and exports, largely as LNG, are also expected to grow strongly. In the Reference Scenario, the marketable gas production of the complete group of countries increases from 36 bcm in 2006 to 82 bcm in 2015 and 163 bcm in 2030. The largest gas producers in 2030 are Nigeria, Angola, Equatorial Guinea and Mozambique. Most of the increase in gas output is exported. Exports rise from 21.6 bcm in 2006 to 63 bcm in 2015 and 130 bcm in 2030. Nigeria’s gas exports are expected to reach 101 bcm by 2030, while Angola’s reach 7 bcm in 2012. A reduction in gas flaring is expected to make a major contribution to marketable gas supply (Box 15.1). Primary oil and gas demand in these countries is projected to grow on average by 3.5% per year over the Outlook period.
Box 15.1 Gas flaring: what are the costs?
Worldwide, 150 bcm of associated gas was flared in 2005, emitting 400 million tonnes of carbon dioxide into the atmosphere (World Bank, 2007). The sub-Saharan African countries assessed here flared 40 bcm — a level unchanged since 2000 (Figure 15.4). This is almost three times the region’s gas consumption. Nigeria is among the world’s biggest flarers, with some 25 bcm flared in 2005, nearly half of its total gas production.4 Nigeria’s ratio of gas flared to oil produced is 18 times higher than that in the North Sea. So much gas is flared because there is no infrastructure to bring the gas to market, a consequence of the poor potential returns and high risks associated with building such infrastructure.
Gas flaring wastes a valuable resource. Capturing and using the gas could bring large economic, social and environmental benefits. In the case of Nigeria, the monetary value of the gas lost in 2005, at a price of $5 per MBtu, was about $5 billion. Nigeria is committed to reducing flaring. It signed the Kyoto Protocol in December 2004 and its gas-flaring reduction projects qualify under the Clean Development Mechanism (CDM), under which the flared gas has a potential value of $800 million, based on current Certified Emission Reduction prices, as an addition to its market value. Options for reducing flaring include gas reinjection in oil and gas fields, distribution to local markets by pipeline, and gas processing into LNG, LPG or GTL. But several gas-export projects have been delayed and Nigeria’s domestic market has been very slow to develop due to domestic gas-pricing policies, which set prices too low to make investments in distribution networks profitable, and poor payment discipline on the part of industrial and power consumers. Consequently, the initial target set by Nigeria to stop flaring in 2008 will not be met.
In practice, reducing gas flaring will require the imposition and enforcement of strict environmental standards, penalties on flaring and financial incentives to accelerate the development of domestic infrastructure and markets for associated gas. Emerging-country producers need fully to consider the long-term economic value of associated gas when negotiating and executing contracts with operators.
4. Flaring is believed to have been reduced to 22 bcm in 2006 (IEA, 2008).
© O
ECD
/IEA
, 200
8

362 World Energy Outlook 2008 - OIL AND GAS PRODUCTION PROSPECTS
Figure 15.4 Gas flaring in assessed sub-Saharan African countries
1995 2000 2005
Billi
on c
ubic
met
res Angola
Cameroon
Chad
Congo
Côte d’Ivoire
Equatorial Guinea
Gabon
Nigeria
Sudan
45
40
35
30
25
20
15
10
5
0
Source: World Bank (2007).
A significant portion of Nigeria’s natural gas is already processed into LNG. Nigeria completed the first phase of the Nigeria LNG Limited (NLNG) facility on Bonny Island in 1999. In 2006, NLNG completed its fifth train, increasing annual production capacity to 24 bcm per year. A sixth train was completed in late 2007, raising production capacity to 31 bcm per year, but this has not yet been brought into operation, for lack of feedstock. Three other projects are under development — Brass LNG, Olokola LNG and a seventh train at NLNG — but a final investment decision has not been taken on any of them, making it unlikely that any will be commissioned before 2012. In Angola, Chevron and Sonangol, together with other shareholders including Total, BP and Eni, are planning to build a 7-bcm LNG plant, which is expected to be operational in 2012.
The West Africa Gas Pipeline project was commissioned in December 2007, with commercial operation expected to begin in 2008. Initial capacity is 2.1 bcm per year and it is expected to ramp up to a full capacity of 4.6 bcm per year within 15 years. The 678-km pipeline carries natural gas from Nigeria to Ghana, Togo and Benin. It is intended to supply gas to power stations in all three countries in order to reduce dependence on diesel. Nigeria and Equatorial Guinea are in discussion about a pipeline connecting the two countries to feed a second train at Equatorial Guinea’s LNG plant on Bioko Island.
Nigeria and Algeria are studying the possibility of constructing a trans-Saharan gas pipeline. The 4 023-km pipeline would carry 20 bcm to 30 bcm per year of associated natural gas from oilfields in Nigeria’s Delta region to Algeria’s Beni Saf LNG export terminal on the Mediterranean. It is estimated that construction of the $7-billion line would take six years. Current and planned oil and gas infrastructure in sub-Saharan Africa is shown in Figure 15.5.
Civil unrest has bedevilled some of these countries at various times in past years, substantially increasing the risk associated with exploiting their reserves and holding back investment. Civil conflicts at the Niger Delta have resulted in serious supply disruptions, as attacks on oil facilities have forced companies to halt or slow production
© O
ECD
/IEA
, 200
8

Chapter 15 - Prospects in oil- and gas-exporting sub-Saharan African countries 363
15
and delay loadings. Around 550 kb/d of Nigeria’s oil-production capacity has been unavailable since 2006 as a result. The cost of deepwater exploration could rise further in the wake of general cost inflation (See Chapter 13).
Figure 15.5 Oil and gas supply and infrastructure in sub-Saharan Africa
MALI NIGER
NIGERIA
CAMEROON
CENTRAL
AFRICAN
REPUBLIC
MAURITANIA
SENEGAL
GUINEA
COTED’IVOIRE G
HA
NA
TO
GO
EQUA. GUINEA
DEMOCRATIC
REP. OF CONGORWANDA
MALAWI
LESOTHO
SWAZILAND
ZAMBIA
NAMIBIA MOZAMBIQUEBOTSWANA
SOUTH
AFRICA
Angola LNG
BURUNDI
CABINDA (Ang.)
BEN
IN
GUINEA-BISSAU
BURKINA
FASO
SIERRA LEONE
DJIBOUTI
YEMEN
SAUDI
ARABIA
LIBERIA
THE GAMBIA
CHAD
SUDAN
ETHIOPIA
SOMALIA
UGANDA
CONGO
ANGOLA
GABON
KENYA
ERITREA
Sahara Desert
NLNG (Bonny Isl.)
Brass LNG
OK LNG
Byoko Isl.
ZIMBAWE
TANZANIA
5
Muanda
Kinshasa Mombasa
Djibouti
Abidjan
Dakar
Nouadhibou
Kaduna
Tema
Karthoum
Pointe Noire
Port Gentil
Malongo
Quinfuquena
Namibe
Walvis Bay
Oranjemund
Saldanha Bay East London
Port ElizabethMossel Bay
Alexander BayRichard’s Bay
Beira
Moçambique
Nacala
Dar es Salaam
Ndola
Luanda
Zanzibar
Eldoret
Port Sudan
Sasolburg
Secunda
Cape Town
Johannesburg
Durban
Maputo
Nelspruit
ElObeid
Mutare
Harare
Douala
Warii P. Harcourt
Kampala
Kigali
0 1 000
0 1 000
Miles
Km
Existing gas pipeline
Under const. or plannedLNG export plant
Planned or underconstruction gas pipeline
Oil/gas field/production area
LNG export plant
Existing oil pipeline
Tanker terminal
Planned or underconstruction oil pipeline
The boundaries and names shown and the designations used on maps included in this publication do not imply official endorsement or acceptance by the IEA.
Refinery (crude, GTL, CTL)
Sources: IEA analysis based on information provided by PFC Energy and Petroleum Economist.
Oil refining
There are 11 refineries in the assessed countries and another 10 in the rest of sub-Saharan Africa. Total crude distillation capacity at the 11 refineries is just over 800 kb/d. Nigeria has four refineries, but all of them operate well below their official capacity, leaving some 77% of product demand to be met by imports in 2007. In the past, the government has opted to export crude oil and collect taxes on imported refined products rather than invest in improving refining capacity. The Nigerian government has not been able to attract any significant private investment in the refining sector.
© O
ECD
/IEA
, 200
8

364 World Energy Outlook 2008 - OIL AND GAS PRODUCTION PROSPECTS
The Angolan government is keen to attract investment in a second, greenfield refinery in Lobito. Refineries in Africa face difficulties in competing with producers from the Middle East and Asia. They often do not enjoy the benefit of economies of scale, and their product slate can be unsuited to local demand. India is emerging as a key exporter of refined products to Africa.
The lack of refining capacity is an important political issue in Africa. Most oil-producing countries would like to extract more of the value of their crude oil by refining it locally, rather than exporting it and importing products. Increased local availability should also help to lower the cost of supplying local markets.
Oil and gas export revenues
Based on projected exports and our assumptions for oil prices (see Chapter 1), the government take5 from oil and gas exports from the assessed countries is estimated to rise from some $80 billion in 2006 to about $250 billion in 2030. Revenues in Nigeria and Angola dwarf those in all the other countries. Nigeria’s revenues in 2030 reach nearly $150 billion and Angola’s some $80 billion. These two countries account for 86% of the $4.1 trillion cumulative revenues of all ten countries over 2006-2030 (Figure 15.6).
Per-capita oil and gas revenues vary widely among the assessed countries. Revenue per capita over the Outlook period averages some $515 in Nigeria but is close to $2 000 in Angola. In Gabon, average annual revenue per capita is some $2 700. It is over $5 000 in Equatorial Guinea.
Figure 15.6 Cumulative government oil and gas revenues in assessed sub-Saharan African countries, 2006-2030
0 50 100 150 200
SudanGabon
Equatorial GuineaCongoChad
MozambiqueCameroon
Côte d'Ivoire
Billion dollars (year-2007)Total = $4 113 billion dollars (year-2007)
Angola$1 107 billion
27%
Nigeria$2 441 billion
59%
Other keyexporters
$564 billion14%
Household energy access in sub-Saharan African countries
Sub-Saharan Africa desperately needs sustained and sustainable economic development, and clean cooking fuels and access to electricity are two prerequisites. Yet, the share of households without electricity access across all countries in sub-Saharan Africa
5. We have assumed the average government take equates to 67%.
© O
ECD
/IEA
, 200
8

Chapter 15 - Prospects in oil- and gas-exporting sub-Saharan African countries 365
15
is 73% on average, compared with 27% in non-OECD Asia and 10% in Latin America (IEA, 2006b). Moreover, there appears to be virtually no correlation between oil and gas resource endowments and access to modern energy in sub-Saharan Africa. In the countries with limited or no oil and gas reserves, the percentage of the population without access to electricity ranges from 6% in Mauritius to 94% in the Democratic Republic of Congo (IEA, 2006b).6 Six of the ten sub-Saharan African countries assessed here have the same or a higher share of people without electricity access than the average for sub-Saharan Africa as a whole. Likewise, the share of the population relying on fuelwood and charcoal for cooking is similar in these hydrocarbon-rich countries to that in the sub-Saharan African countries not analysed here, where it ranges from about 95% in Ethiopia to some 20% in South Africa.
Cooking practices
The current use of fuelwood and charcoal for cooking in sub-Saharan Africa has serious implications for the environment, for economic development and for health. Charcoal is widely used for cooking and is usually produced from forest resources. Because of the low conversion efficiency of the kilns used to produce charcoal, there has been localised deforestation and land degradation around urban centres. In Angola, the major influx of people to peri-urban areas, or shanty towns, at the end of the civil war has put tremendous pressure on biomass resources. Severe local deforestation has occurred around most large cities. For example, all forest has been cleared within a radius of 200 to 300 kilometres of Luanda, Angola (IEA, 2006a).
In households that rely on fuelwood, women and children are responsible for fuel collection, a time-consuming and exhausting task. Collection time has a significant opportunity cost, limiting time to improve education and engage in income-generating activities. Modern energy services for cooking promote economic development by freeing-up household time for more productive purposes.
Lack of access to clean fuels for cooking can have a serious impact on health. Exposure to indoor air pollution from burning fuelwood, charcoal and other biomass in poorly ventilated areas has been linked to many different diseases, including acute and chronic respiratory diseases, tuberculosis, asthma, cardiovascular disease and negative peri-natal health outcomes. Indoor air pollution disproportionately affects women and children, who spend the most time near the cookstove. An estimated 79 000 people die prematurely in Nigeria alone each year because of the use of fuelwood and charcoal for cooking (Table 15.4). The percentage of the national burden of disease attributable to the use of fuelwood and charcoal for cooking is nearly 7% in Angola and more than 5% in Cameroon and Chad (WHO, 2007). In every country in Table 15.4, more people die prematurely each year from illnesses caused by indoor air pollution than from malaria.
Due to affordability and access barriers to the uptake of LPG and other cleaner-burning fuels for cooking, many households will continue to use fuelwood and charcoal for cooking. Improving the way these resources are used is an important way of reducing their harmful effects. The first requirements are improved stoves and better
6. See Annex B in the 2006 edition of the World Energy Outlook for estimated electrifi cation rates in Africa, non-OECD Asia, Latin America and the Middle East.
© O
ECD
/IEA
, 200
8

366 World Energy Outlook 2008 - OIL AND GAS PRODUCTION PROSPECTS
ventilation: adding chimneys to stoves is the most effective improvement to be made from the point of view of health, while kitchen design and ventilation also play a key role in reducing emissions. Particulate levels in houses using wood, but with good ventilation, can be lower than those in houses using liquid fuels in poorly designed stoves. Governments can enhance the sustainability of biomass resources by increasing the area of the country dedicated to plantations, and through monitoring and control of charcoal production.
Table 15.4 Annual premature death and disability associated with indoor air pollution in assessed sub-Saharan African countries
Premature deaths attributable to use of
fuelwood and charcoal for cooking
Disability-adjusted life years attributable to use
of fuelwood and charcoal
Share of total national burden of disease
attributable to use of fuelwood and charcoal
Angola 22 000 747 000 6.9%
Cameroon 12 900 417 000 5.5%
Chad 8 700 285 900 5.6%
Congo 700 18 300 1.2%
Côte d’Ivoire 9 300 290 000 3.4%
Gabon 200 4 000 0.9%
Mozambique 9 700 300 200 2.4%
Nigeria 79 000 2 591 500 3.8%
Sudan 4 400 79 900 0.7%
Total 146 900 5 957 400 -
Note: No data available for Equatorial Guinea. The disability-adjusted life year (DALY) is a health gap measure that extends the concept of potential years of life lost due to premature death to include equivalent years of “healthy” life lost by virtue of being in poor health or disabled. The DALY combines, in one measure, the time lived with disability and the time lost due to premature mortality. One DALY can be thought of as one lost year of healthy life. The burden of disease quantifies mortality and morbidity due to a given disease or risk factor.
Source: WHO (2007).
Electricity access
Access to reliable electricity is important for many services, such as lighting and communications, but crucial for refrigeration, which avoids food waste and allows local clinics to keep medicines on hand. Clinics lacking electricity cannot perform such routine functions as sterilising instruments or safely storing vaccines.
Yet, as we have seen (Table 15.2), in eight out of the ten sub-Saharan African countries assessed here, less than a third of the population has access to electricity. Even where access to electricity is available, it does not necessarily mean that electricity is available on demand. Even those Africans who do have access frequently have to cope with unreliable supply. Power disruptions are a fundamental obstacle to economic activity, including at the household level. In war-torn countries, such as Angola, Congo, Côte d’Ivoire, Chad and Sudan, the infrastructure for electricity transmission and distribution has often been destroyed. Service restoration is more costly than the average cost of
© O
ECD
/IEA
, 200
8
Chapter 15 - Prospects in oil- and gas-exporting sub-Saharan African countries 367
15
serving new customers in a stable environment. Inadequacies in the supply infrastructure are one reason why many people make illegal connections, sometimes resulting in injuries, electrocution, fire, explosions and death — often involving children.7 In addition to the health risks, illegal connections also mean loss of revenue to the electricity distribution companies and, consequently, greater difficulty in financing infrastructure improvements. In order to take advantage of economies of scale as a step towards easing regional power shortages, regional power pools are being developed (Box 15.2).
Box 15.2 Regional power pools and the Grand Inga project
Regional power pools have been formed in Central (CAPP), East (EAPP), Southern (SAPP), and West (WAPP) Africa (Figure 15.7). The pools are at very different stages of development, both technically and institutionally. The political process is well advanced in the WAPP, supported by political agreements at the head of state level through the Economic Community of West African States. The SAPP was the first operational power pool in Africa, sponsored under the authority of the Southern African Development Community (SADC). The pools, particularly the WAPP and SAPP, have facilitated significant cross-border exchanges of power.
Regional power pools are able to reduce costs and improve conditions on the supply side. Operational costs are lower, due to investment in least-cost power generation plants on a regional basis. Benefits on the supply side, all contributing to increased reliability, include reduced coincident peak loads on the regional power pool, compared with the sum of the individual peak loads for each national power grid, shared power generation reserves for the interconnected power grids, and increased robustness to deal with local droughts or other unexpected events.
One of the key projects that will support the regional pools is the Grand Inga dam project in the Democratic Republic of Congo (DRC). The project is estimated to cost $80 billion and expected to be able to provide 40 GW of power. Difficulties associated with the project include an absence of political consensus and legal harmonisation. Nigeria is expected to be the largest consumer. It is hoped that the carbon-emission reduction potential will help attract necessary investment.
Most of the power will be used for industry or for export. Inga 1 and Inga 2 were commissioned in 1972 and 1982, as part of an industrial development scheme in the DRC. The two dams currently operate at only 40% capacity because they have never received maintenance. The World Bank is partially financing a project to rehabilitate these dams.8 When Inga 2 was built, a 1 800-km transmission line was also built to transport the power to state-owned copper mines in the Katanga province, bypassing nearly every city and village underneath. A component of the Grand Inga project could be expanded household electricity access, particularly in the DRC, where access is estimated to be 13% in urban areas and only 3% in rural areas.
7. To date, there have been no comprehensive studies on the number of deaths and injuries from illegal connections. There is a need to better quantify the number in order to raise awareness of the consequences arising from the inability to obtain legal electricity connections. 8. See www.worldbank.org/drc.
© O
ECD
/IEA
, 200
8

368 World Energy Outlook 2008 - OIL AND GAS PRODUCTION PROSPECTS
Nigeria is experiencing a severe electricity shortage. Three new gas-fuelled power stations are unable to generate electricity because the country has over-sold gas for export and because the domestic electricity-supply infrastructure is inadequate. Nigeria’s power generation capacity plunged to less than 1 000 MW in July 2008.9 As a step towards improving the situation, in February 2008 Nigeria announced a new gas policy, which will prioritise the domestic use of gas over export. Under the policy, all gas developers are expected to allocate a specified amount of gas from their reserves and annual production to the domestic market. Gas for domestic use will be supplied at the lowest commercially sustainable prices to strategic sectors, such as electricity. The Nigerian government plans to build 15 new gas-fired power plants to increase generating capacity to 10 GW by 2010.
Figure 15.7 Regional power pools in Africa
East African PowerPool (EAPP)
Southern AfricanPower Pool (SAPP)
Central AfricanPower Pool (CAPP)
West AfricanPower Pool (WAPP)
Existing power lines
Proposed power pool projects
Proposed NEPAD projects
The boundaries and names shown and the designations used on maps included in this publication do not imply official endorsement or acceptance by the IEA.
Note: The Maghreb power pool is not shown.Source: NEPAD (2008).
9. A committee was set up in June 2008 by the Nigerian government to review the electricity sector. It concluded that $85 billion is needed to meet power demand, estimated to be some 20 GW (“As oil money fl oods in, most Nigerians wouldn’t know it”, Global edition of the New York Times, 22 July 2008).
© O
ECD
/IEA
, 200
8

Chapter 15 - Prospects in oil- and gas-exporting sub-Saharan African countries 369
15
Box 15.3 Government programmes to promote the use of clean cooking fuels and rural electrification in Africa: success stories
Strong government support is essential to expand energy access, because low incomes prevent a large number of people from accessing even basic services. Gas and electricity are now widely available in Cape Verde and electrification rates are much higher than a decade ago in Botswana, in both cases due to well-chosen government reforms and effective implementation.
The governments of Kenya and Tunisia have also addressed the lack of energy access through innovative policy frameworks and financing mechanisms. In Kenya, the household energy mix is dominated by the use of fuelwood and charcoal for cooking. To reduce high dependence on these fuels, the government introduced a number of measures to improve access to and the affordability of LPG. Households’ access to credit was improved, largely through the Kenyan Union of Savings and Credit Co-operatives (KUSCCO), an umbrella organisation for nearly 4 900 agricultural co-operatives in Kenya. Rapid growth of LPG followed the decision to remove the VAT and import duty on LPG, and to set standards for LPG stoves, cylinders and accessories. Lack of standardised LPG cylinders, with inter-changeable valves and regulators, had previously been a major obstacle to the development of efficient and competitive LPG retail markets in Kenya. The acceleration in the penetration of LPG in Kenya demonstrates the facilitating role governments can play, providing a policy and regulatory framework attractive to prospective energy and financial investors, and to users (Kabutha et al., 2007).
The Tunisian government expanded electricity access from 37% in the early 1970s to an impressive 99% in 2006 (IEA, 2006b). The government laid out its targets in five-year plans aimed at overall rural development. Renewable-energy projects were selected at the regional level as part of rural development plans, which covered health, education, water and other infrastructure. Success was attributed to efficient central direction, decentralised implementation, transparent norms and guidelines, and innovative technical decisions, such as the use of single-wire earth systems.10 Private sector participation in construction and the participation of the local supply industry were also important. But national political commitment is widely regarded as the key factor in the success of the programme.
Projected trends in access to modern energy services
In the Reference Scenario, which assumes the continuation of existing policies, the number of people without access to electricity in the ten sub-Saharan African countries assessed here rises from some 177 million today to 191 million in 2030 (Table 15.5), as the population grows. This is despite the fact that 56% of the people in these countries have access to electricity in 2030, up from 35% today. The number of people relying on
10. These systems use single-wire transmission lines from the central grid to supply power, at low cost, to remote areas.
© O
ECD
/IEA
, 200
8

370 World Energy Outlook 2008 - OIL AND GAS PRODUCTION PROSPECTS
fuelwood and charcoal for cooking similarly rises, from 204 million to 244 million, again despite a rise in the share of the population with access to clean fuels for cooking, from 25% to 43%. The disparity between rural and urban areas remains pronounced. The majority of the people who gain access to both electricity and cleaner fuels for cooking over the projection period live in urban areas.
Table 15.5 Access to electricity and reliance on fuelwood and charcoal in assessed sub-Saharan African countries
Number of people without electricity access
Number of people relying on fuelwood and charcoal for cooking
2006 2030 2006 2030
Million % Million % Million % Million %
Angola 14.6 88 18 59 15.7 95 18 60
Cameroon 14.2 78 17 64 14.2 78 17 65
Chad 10.1 97 18 92 10.2 97 16 79
Congo 2.9 78 4 68 2.9 80 4 69
Côte d’Ivoire 11.6 61 14 50 14.7 78 21 73
Equatorial Guinea 0.4 73 0.4 50 0.3 59 0.4 42
Gabon 0.9 70 1.2 66 0.4 33 0.5 28
Mozambique 18.6 89 22 72 16.9 80 18 58
Nigeria 76.6 53 66 29 93.8 65 109 48
Sudan 26.9 71 30 51 35.2 93 40 69
Total 176.9 65 191 44 204 75 244 57
Note: Assumptions for GDP growth rates are based on information provided to the IEA from the World Bank, the African Development Bank and the OECD. Population growth rates from the UN Population Division. Source: IEA databases and analysis.
Economic growth is the main factor driving the improvements in energy access. In part because of higher oil prices, economic growth in the countries assessed here is expected to be faster than in the rest of sub-Saharan Africa. Urbanisation rates are also an important factor driving energy demand, as households in cities are more likely to be connected to the grid and to have access to cleaner cooking fuels. Nigeria is making progress in reducing the number of people who lack access to electricity, a trend that is projected to continue through the Outlook period. But the very large number of people who lack access to clean cooking fuels is projected to rise considerably. Mozambique and Angola are expected to make progress in expanding the supply of cleaner cooking fuels.
Quantifying the costs involved in expanding access
Expanding access to electricity and modern cooking stoves will require substantial additional investment in power generation and networks and appliances beyond that projected in our Reference Scenario. In order to illustrate the challenge, we have estimated the cost over the Outlook period to achieve universal access to
© O
ECD
/IEA
, 200
8
Chapter 15 - Prospects in oil- and gas-exporting sub-Saharan African countries 371
15
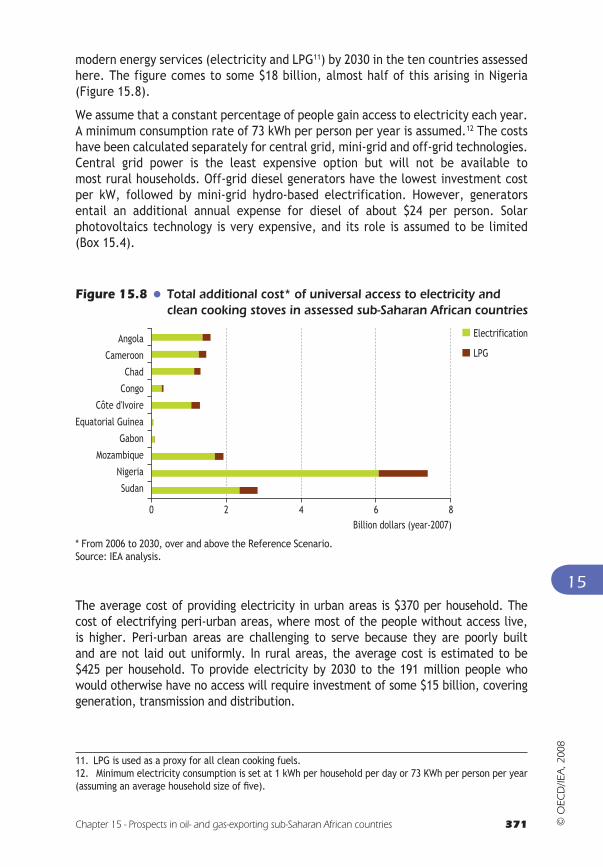
modern energy services (electricity and LPG11) by 2030 in the ten countries assessed here. The figure comes to some $18 billion, almost half of this arising in Nigeria (Figure 15.8).
We assume that a constant percentage of people gain access to electricity each year. A minimum consumption rate of 73 kWh per person per year is assumed.12 The costs have been calculated separately for central grid, mini-grid and off-grid technologies. Central grid power is the least expensive option but will not be available tomost rural households. Off-grid diesel generators have the lowest investment costper kW, followed by mini-grid hydro-based electrification. However, generators entail an additional annual expense for diesel of about $24 per person. Solar photovoltaics technology is very expensive, and its role is assumed to be limited (Box 15.4).
Figure 15.8 Total additional cost* of universal access to electricity and clean cooking stoves in assessed sub-Saharan African countries
0 2 4 6 8
Angola
Cameroon
Chad
Congo
Côte d'Ivoire
Equatorial Guinea
Gabon
Mozambique
Nigeria
Sudan
Electrification
LPG
Billion dollars (year-2007)
* From 2006 to 2030, over and above the Reference Scenario.Source: IEA analysis.
The average cost of providing electricity in urban areas is $370 per household. The cost of electrifying peri-urban areas, where most of the people without access live, is higher. Peri-urban areas are challenging to serve because they are poorly built and are not laid out uniformly. In rural areas, the average cost is estimated to be $425 per household. To provide electricity by 2030 to the 191 million people who would otherwise have no access will require investment of some $15 billion, covering generation, transmission and distribution.
11. LPG is used as a proxy for all clean cooking fuels.12. Minimum electricity consumption is set at 1 kWh per household per day or 73 KWh per person per year (assuming an average household size of fi ve).
© O
ECD
/IEA
, 200
8

372 World Energy Outlook 2008 - OIL AND GAS PRODUCTION PROSPECTS
The costs of switching to LPG for households that rely predominately on fuelwood and charcoal for cooking include capital expenditure for the stove and cylinder, and recurring expenditure for the fuel itself. In this analysis, we look only at the capital expenditure for the LPG stove and cylinder, which is assumed to be $65 per household. This upfront capital cost is a very significant barrier to change. The total cost of providing stoves and cylinders to all households otherwise relying on fuelwood and charcoal for cooking is some $2.9 billion.
Box 15.4 The prospects for renewables to meet rural household energy needs
Renewable energy supply — mostly hydropower — is expected to grow rapidly in the coming decades in Africa. Yet, introduction of these technologies will require strong government support. Hydropower potential in sub-Saharan Africa is estimated to amount to more than 1 800 TWh of technically exploitable resources (Karekezi and Kithyoma, 2008). Small hydropower is an important source of energy in rural areas. The Hidraluapasso mini-hydro project in northern Angola, for example, will provide 26 MW at a cost of $120 million (UNEP, 2008).
Solar energy is perhaps the most widespread renewable energy resource. A very large number of African countries have daily solar radiation ranging between 4 and 6 kWh per square metre. Nonetheless, the cost of an off-grid installation can be prohibitive, ranging from $550 to $1 200 per household (Moner-Girona et al., 2006). Wind energy is gaining popularity, but many sub-Saharan African countries have low wind speeds, particularly those near the equator. Chad, however, has good wind potential in some parts of the country.
The use of renewable energy in sub-Saharan Africa could help mitigate the impact of high oil prices, especially if renewable energy systems replace diesel generators. But the institutional frameworks and infrastructure needed vigorously to expand renewable energy systems has been lacking. Government policies and programmes to promote renewable energy are needed.
Of course, owning stoves and cylinders does not ensure that people will use them if they cannot afford the fuel. Fuel costs are very expensive for African households, many of whom live on less than $1 per day.13 LPG prices have soared over the past few years and, assuming an average cost of LPG of $1.50 per kilogram — based on 2008 consumer prices in a sample of African countries — the total fuel bill for a household of five would be over $200 per year. Bulk transport costs are higher in landlocked countries and poor transport can increase the cost of fuel delivery. In Chad, LPG
13. The World Bank estimates that, on average, some 47% of households in sub-Saharan Africa live on less than $1 per day.
© O
ECD
/IEA
, 200
8
Chapter 15 - Prospects in oil- and gas-exporting sub-Saharan African countries 373
15
costs about $2.30 per kilogram. Price subsidies on LPG have had a poor record ofsuccess in many countries, because they often fail to benefit the poorest households (Box 15.5).14
Box 15.5 Subsidies: how best to safeguard energy-poor households?
As in all developing countries, there is pressure on African governments to shield their consumers, through universal subsidies, from sharply rising oil and gas prices. But the downside of such energy subsidies is widely acknowledged: unintended inequitable distribution, inefficiencies, over-consumption, smuggling and a drain on government resources that could be more efficiently used. The result is, often, increased social inequality and, usually, economic inefficiency. Wealthy households are much more likely to benefit from subsidies than the poorest ones.
Financial assistance is most effective when it is successfully targeted at the poorest households and offered as income support rather than universal fuel subsidies. After eliminating LPG price subsidies in 2002, Brazil introduced a gas assistance programme that provides bi-monthly subsidy payments for the poorest households. The new approach provides an annual per-capita subsidy to qualifying households that amounts to more than 60% of the retail LPG price — more than 20 times the previous general price subsidy — even though the net government subsidy expenditures are only about half as large (Goldemberg et al., 2004). Another alternative to universal fuel subsidies is to provide pre-paid cards that could be used only for LPG purchases by qualifying households.
When it is specifically energy-related, financial assistance should be linked to high up-front charges, such as connection charges, which impede access and be carefully directed to the households that need it most. To be coherent with demand-side management programmes, financial assistance should not, generally, be related to consumption.
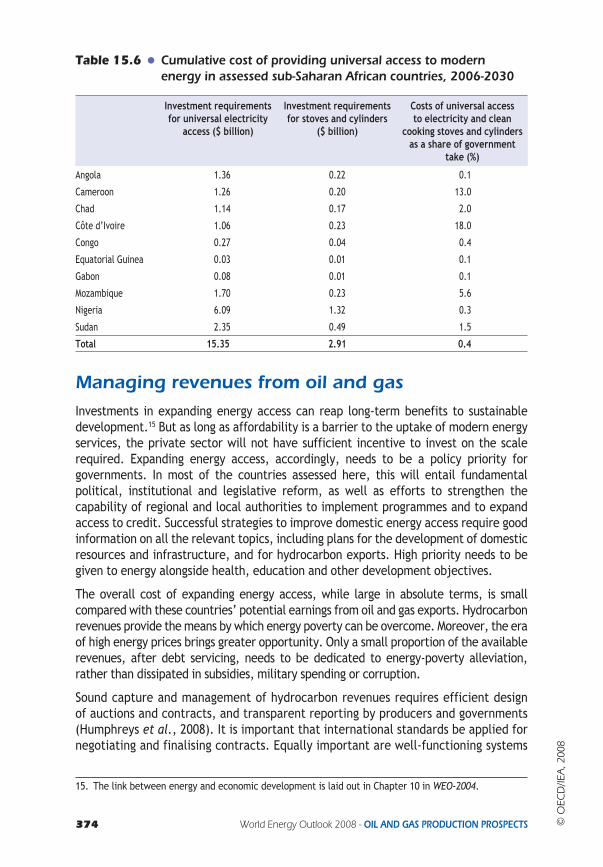
The total cost of some $18 billion needed to achieve access to electricity and to clean cooking stoves and cylinders in the ten countries analysed here is a mere 0.4% of the projected government take from oil and gas export revenues in 2006-2030. Table 15.6 shows the variation by country. For example, Nigeria has a large number of people without access to modern energy services, but also has very large prospective oil and gas revenues. Cameroon will see its oil revenues decline over the projection period so that the share needed to expand access would be 13%, compared with 0.3% for Nigeria. Angola, with its small population and massive oil and gas revenues, would need to spend only 0.1% of oil and gas revenues to 2030 to see all of its citizens enjoy a minimal electricity service and cleaner cooking stoves. The cost as a share of government take is only 0.1% in Equatorial Guinea.
14. See Chapter 20 in WEO-2007 for a discussion of the implications of LPG subsidies in India (IEA, 2007).
© O
ECD
/IEA
, 200
8
374 World Energy Outlook 2008 - OIL AND GAS PRODUCTION PROSPECTS
Table 15.6 Cumulative cost of providing universal access to modern energy in assessed sub-Saharan African countries, 2006-2030
Investment requirements for universal electricity
access ($ billion)
Investment requirements for stoves and cylinders
($ billion)
Costs of universal access to electricity and clean
cooking stoves and cylinders as a share of government
take (%)
Angola 1.36 0.22 0.1
Cameroon 1.26 0.20 13.0
Chad 1.14 0.17 2.0
Côte d’Ivoire 1.06 0.23 18.0
Congo 0.27 0.04 0.4
Equatorial Guinea 0.03 0.01 0.1
Gabon 0.08 0.01 0.1
Mozambique 1.70 0.23 5.6
Nigeria 6.09 1.32 0.3
Sudan 2.35 0.49 1.5
Total 15.35 2.91 0.4
Managing revenues from oil and gas
Investments in expanding energy access can reap long-term benefits to sustainable development.15 But as long as affordability is a barrier to the uptake of modern energy services, the private sector will not have sufficient incentive to invest on the scale required. Expanding energy access, accordingly, needs to be a policy priority for governments. In most of the countries assessed here, this will entail fundamental political, institutional and legislative reform, as well as efforts to strengthen the capability of regional and local authorities to implement programmes and to expand access to credit. Successful strategies to improve domestic energy access require good information on all the relevant topics, including plans for the development of domestic resources and infrastructure, and for hydrocarbon exports. High priority needs to be given to energy alongside health, education and other development objectives.
The overall cost of expanding energy access, while large in absolute terms, is small compared with these countries’ potential earnings from oil and gas exports. Hydrocarbon revenues provide the means by which energy poverty can be overcome. Moreover, the era of high energy prices brings greater opportunity. Only a small proportion of the available revenues, after debt servicing, needs to be dedicated to energy-poverty alleviation, rather than dissipated in subsidies, military spending or corruption.
Sound capture and management of hydrocarbon revenues requires efficient design of auctions and contracts, and transparent reporting by producers and governments (Humphreys et al., 2008). It is important that international standards be applied for negotiating and finalising contracts. Equally important are well-functioning systems
15. The link between energy and economic development is laid out in Chapter 10 in WEO-2004.
© O
ECD
/IEA
, 200
8

Chapter 15 - Prospects in oil- and gas-exporting sub-Saharan African countries 375
15
for ensuring ethical conduct in the public service. Only one African country, South Africa, features among the 37 countries that have ratified the OECD Anti-Bribery Convention — a major benchmark in the international battle against bribery and corruption. These countries have introduced legislative amendments to strengthen their anti-bribery laws.16
Several hydrocarbon-rich countries across the world have created sovereign wealth funds (SWFs) — state-owned investment funds composed of financial assets such as stocks, bonds, property or other financial instruments — as a means of improving the standard of living of every household in the longer term. The funding often comes from revenue generated from the export of natural resources. SWFs, however, may not be the right solution for low-income countries, especially those with rigidities in labour and capital markets. In countries without strong institutions, they may present undesirable opportunities for corruption and mismanagement. Given the scale of the challenge of poverty and development, countries could be better off investing their oil wealth in infrastructure, education and health. After initial mistakes in revenue management following the discovery of natural gas in the Netherlands (termed the “Dutch Disease”), the government there spent gas revenues on physical infrastructure projects, such as bridges, roads and communication, paving the way for higher economic growth (termed the “Dutch Cure”). An abundance of resource wealth offers an opportunity for economic development if governments manage effectively the wealth and the economic impacts of its application (Box 15.6).
Box 15.6 Revenue management in Botswana: a success story
One of the world’s poorest countries at independence in 1966, Botswana has done remarkably well in using its mineral wealth, mainly from diamond resources, to transform the economy. Recognising that the revenues from diamonds represented sales of a declining asset, the government of Botswana saw clearly the need for reinvestment of these revenues in order to sustain development.
Botswana adopted a policy which requires that all mineral revenues be re-invested and devised its own rule-of-thumb for tracking this re-investment, the Sustainable Budget Index (SBI) (Lange and Wright, 2002). The amount of rent generated by mining and the share recovered by the government are reported, and the way government has used mineral rents is assessed in terms of the SBI.
Botswana has used these revenues to effect remarkable improvements in infrastructure, human capital and the basic services supplied to its population. GDP per capita in Botswana rose by 5.9% per year on average from 1996 to 2006, compared with an average decline of 7% per year for sub-Saharan African countries. Some 95% of the population in Botswana has access to an improved water source. Electricity access is estimated to be around 40%. Reliance on charcoal and fuelwood for cooking is some 65%, less than the share in seven of the countries assessed here.
16. See the OECD Working Group on Bribery: Annual Report 2007 for more information.
© O
ECD
/IEA
, 200
8

376 World Energy Outlook 2008 - OIL AND GAS PRODUCTION PROSPECTS
The share of the population relying on fuelwood and charcoal for cooking in urban areas is less than 20%. Botswana joined the World Bank’s category of upper-middle-income countries in the 1990s.
Botswana is widely considered to be an excellent example of effective resource management with future generations in mind. As a result of prudent management, not only has the domestic economy been developed but the country has also accumulated a substantial portfolio of international financial assets.
Much valuable experience is available in the management of income-generated natural resources. Norway’s experience is being used to help advance its Oil for Development programme. Another relevant initiative is the Extractive Industry Transparency Initiative (EITI), supporting improved governance in resource-rich countries through the verification and publication of company payments and government revenues from oil, gas and mining. Among the countries analysed here, Cameroon, Congo, Côte d’Ivoire, Equatorial Guinea, Gabon and Nigeria have met the conditions to become candidate countries in the EITI. Public access to reliable, verified information is a basic condition of improved accountability by governments for funds derived from resource exploitation; permitting public verification that revenues from this source are actually used for the purposes of the fight against poverty and the implementation of the Millennium Development Goals.
© O
ECD
/IEA
, 200
8